
the Creative Commons Attribution 4.0 License.
the Creative Commons Attribution 4.0 License.
 | 28 May 2026
Shoreline exposure controls teal carbon accumulation in boreal lakes
Ana Lúcia Lindroth Dauner
Max O. A. Kankainen
Sakari Väkevä
Eero Asmala
Marko Järvinen
Karoliina Koho
Tom Jilbert
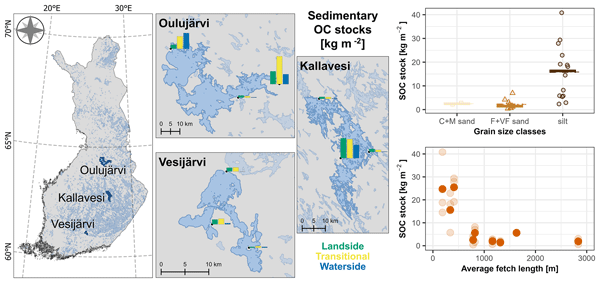
Aquatic vegetated ecosystems play an important role in global carbon sequestration. While research on coastal marine environments has expanded in recent decades, freshwater vegetated shorelines remain understudied despite their potential for significant carbon burial. This is especially relevant in boreal landscapes with high numbers of small, shallow lakes. In this study, we quantify organic carbon stocks (mass of carbon per area) in boreal lacustrine vegetated shorelines, so-called teal carbon environments. Moreover, we identified the main environmental drivers of carbon storage in these areas. We took 27 sediment cores from three large lakes in Finland with available satellite data of macrophyte coverage. At each site, sediment cores were sampled along a depth transect through macrophyte zones, from the landside towards the waterside. Sedimentary organic carbon (SOC) stocks ranged from 0 to 40.8 kg m−2, and showed a large spatial variability among lakes, zones and type of vegetation. We identified grain size as the most significant parameter explaining variability in the size of SOC stocks. Sites dominated by silts and with large SOC stocks were found in sheltered embayments, independent of proximity to rivers, density of vegetation or slope of the shoreline, implying a strong control of exposure on SOC accumulation. In more exposed areas, vegetation density might play an additional controlling role in SOC accumulation. Accounting for shoreline exposure is crucial for improving regional carbon budget estimates. This study highlights the central role of teal carbon ecosystems in carbon cycling in the boreal zone, often characterized by very high densities of lakes.
- Article
(4926 KB) - Full-text XML
-
Supplement
(4766 KB) - BibTeX
- EndNote


In the past decades, the importance of inland freshwater ecosystems in biogeochemical cycles and organic carbon (OC) budget calculations has been increasingly recognized (Cole et al., 2007; Tranvik et al., 2018). Lake and reservoir ecosystems receive a large amount of organic matter from catchment areas and autochthonous production, of which only a portion is transported to adjacent coastal and marine environments. Therefore, despite the relatively small area that they cover, lake ecosystems can sequester large amounts of OC. Recent estimates suggest their OC removal to be in the same order of magnitude as in the open ocean (around 0.15 PgC yr−1; Regnier et al., 2022). OC sequestration may be particularly important in the boreal biome, with a very high density of lakes (Mohamed Anas et al., 2015).
In freshwater ecosystems, the importance of open water sediments for long-term OC burial and storage is well documented (Kortelainen et al., 2004; Cole et al., 2007; Mendonça et al., 2017; Tranvik et al., 2018), but the role of vegetated (flooded) shoreline areas in C storage is less well understood. In coastal marine environments, so-called blue carbon areas contribute up to 50 % to the global marine OC burial (Duarte et al., 2005). Similarly, shallow vegetated areas in lacustrine environments, so-called teal carbon environments (Nahlik and Fennessy, 2016), may potentially play an important role in cycling and burial of organic matter. The ability of such vegetated ecosystems to store and remove OC remains poorly determined, even though the importance of freshwater wetlands has started to gain attention in the last decade (Taran et al., 2023). The recent increased awareness of freshwater vegetated areas has been partly boosted by the Ramsar conventions (Convention on Wetlands, 2021), which recognized their ecosystem services and benefits to humans. Despite this, OC stocks and fluxes in these environments have not yet been incorporated into the most recent conceptualizations of the continental OC cycle (Grasset et al., 2025; Regnier et al., 2022), due to lack of data and mechanistic understanding of the processes controlling OC cycling.
In this paper, we focus on aquatic macrovegetation (macrophytes) whose life-form is helophytic, i.e., that are anchored in bottom mud and have emergent stems and overwintering root systems (Bornette and Puijalon, 2009). OC stocks and sequestration rates in wetlands are expected to be highly variable because of the broad suite of natural and anthropogenic factors controlling the accumulation and storage of organic material (Tangen and Bansal, 2020). However, some general trends have been identified. For example, in marine saltmarshes formed by common reed Phragmites australis, the waterside zone of the macrophyte belt tends to accumulate less OC than the landside (Buczko et al., 2022). A similar pattern has also been observed in freshwater wetlands (Bernal and Mitsch, 2012; Tangen and Bansal, 2020; Taran et al., 2023; Silan et al., 2024), implying a role for exposure in determining the eventual accumulation of organic matter in sediments, whereby growth of dense macrophyte vegetation promotes physical trapping of fine-grained organic-rich material from the water column. Species composition and density of the macrophyte patches may also play a role in determining the magnitude of OC storage (Bernal and Mitsch, 2012). However, few systematic studies have been carried out to understand the relative role of the numerous parameters that control the amount of OC stored in the sediments of teal carbon environments. Quantifying variability in OC storage and sequestration among the wetland types, within and between geographical regions, has been identified as a high priority (Carnell et al., 2018). The closest blue carbon analogue for Finnish lakes would be found on the Baltic Sea coast, because of climatic similarity, overlap in dominant macrophyte species, and the low overall salinity of the Baltic Sea. Vast Phragmites areas are found especially in undisturbed lagoons and wetlands of southern Baltic Sea countries (Buczko et al., 2022), but there the milder climate and lack of seasonal ice cover supports longer growth seasons, less physical disturbance, and, potentially, higher carbon accumulation than in Finnish lakes.
In order to better understand the OC sink potential of teal carbon environments of boreal lakes, we studied the factors controlling OC stocks in shoreline areas of three large lakes in Finland. The studied ecosystems are dominated by common reed (Phragmites australis) with additional contributions of horsetails (Equisetum spp.) and sedges (Carex spp.). Through comprehensive analysis of sediment samples and environmental variables, we (i) quantify the magnitude of sediment OC stocks in shallow vegetated areas of the study lakes, (ii) identify the main parameters governing these, and (iii) compare our new OC stock estimates with those of other freshwater and marine environments to assess the relative magnitude of boreal teal carbon accumulation. Based on these objectives, we hypothesized that (i) the presence and abundance of macrophytes are likely to promote the accumulation of OC in teal carbon environments, and that (ii) teal carbon environments can have OC stocks comparable to coastal blue carbon environments in similar latitudes, but shorter growing seasons and seasonal ice cover might make the lake environments less efficient accumulators in practice.
2.1 Study Area
The studied lakes span across a 400 km latitudinal gradient in Finland, all within the boreal zone (Fig. 1). The lakes and sampling sites were chosen based on their water quality, using aerial and satellite images showing the evidence of extensive areas of macrophyte vegetation on Finnish lakes, and accessibility of the sampling sites (Figs. S1 to S9b).
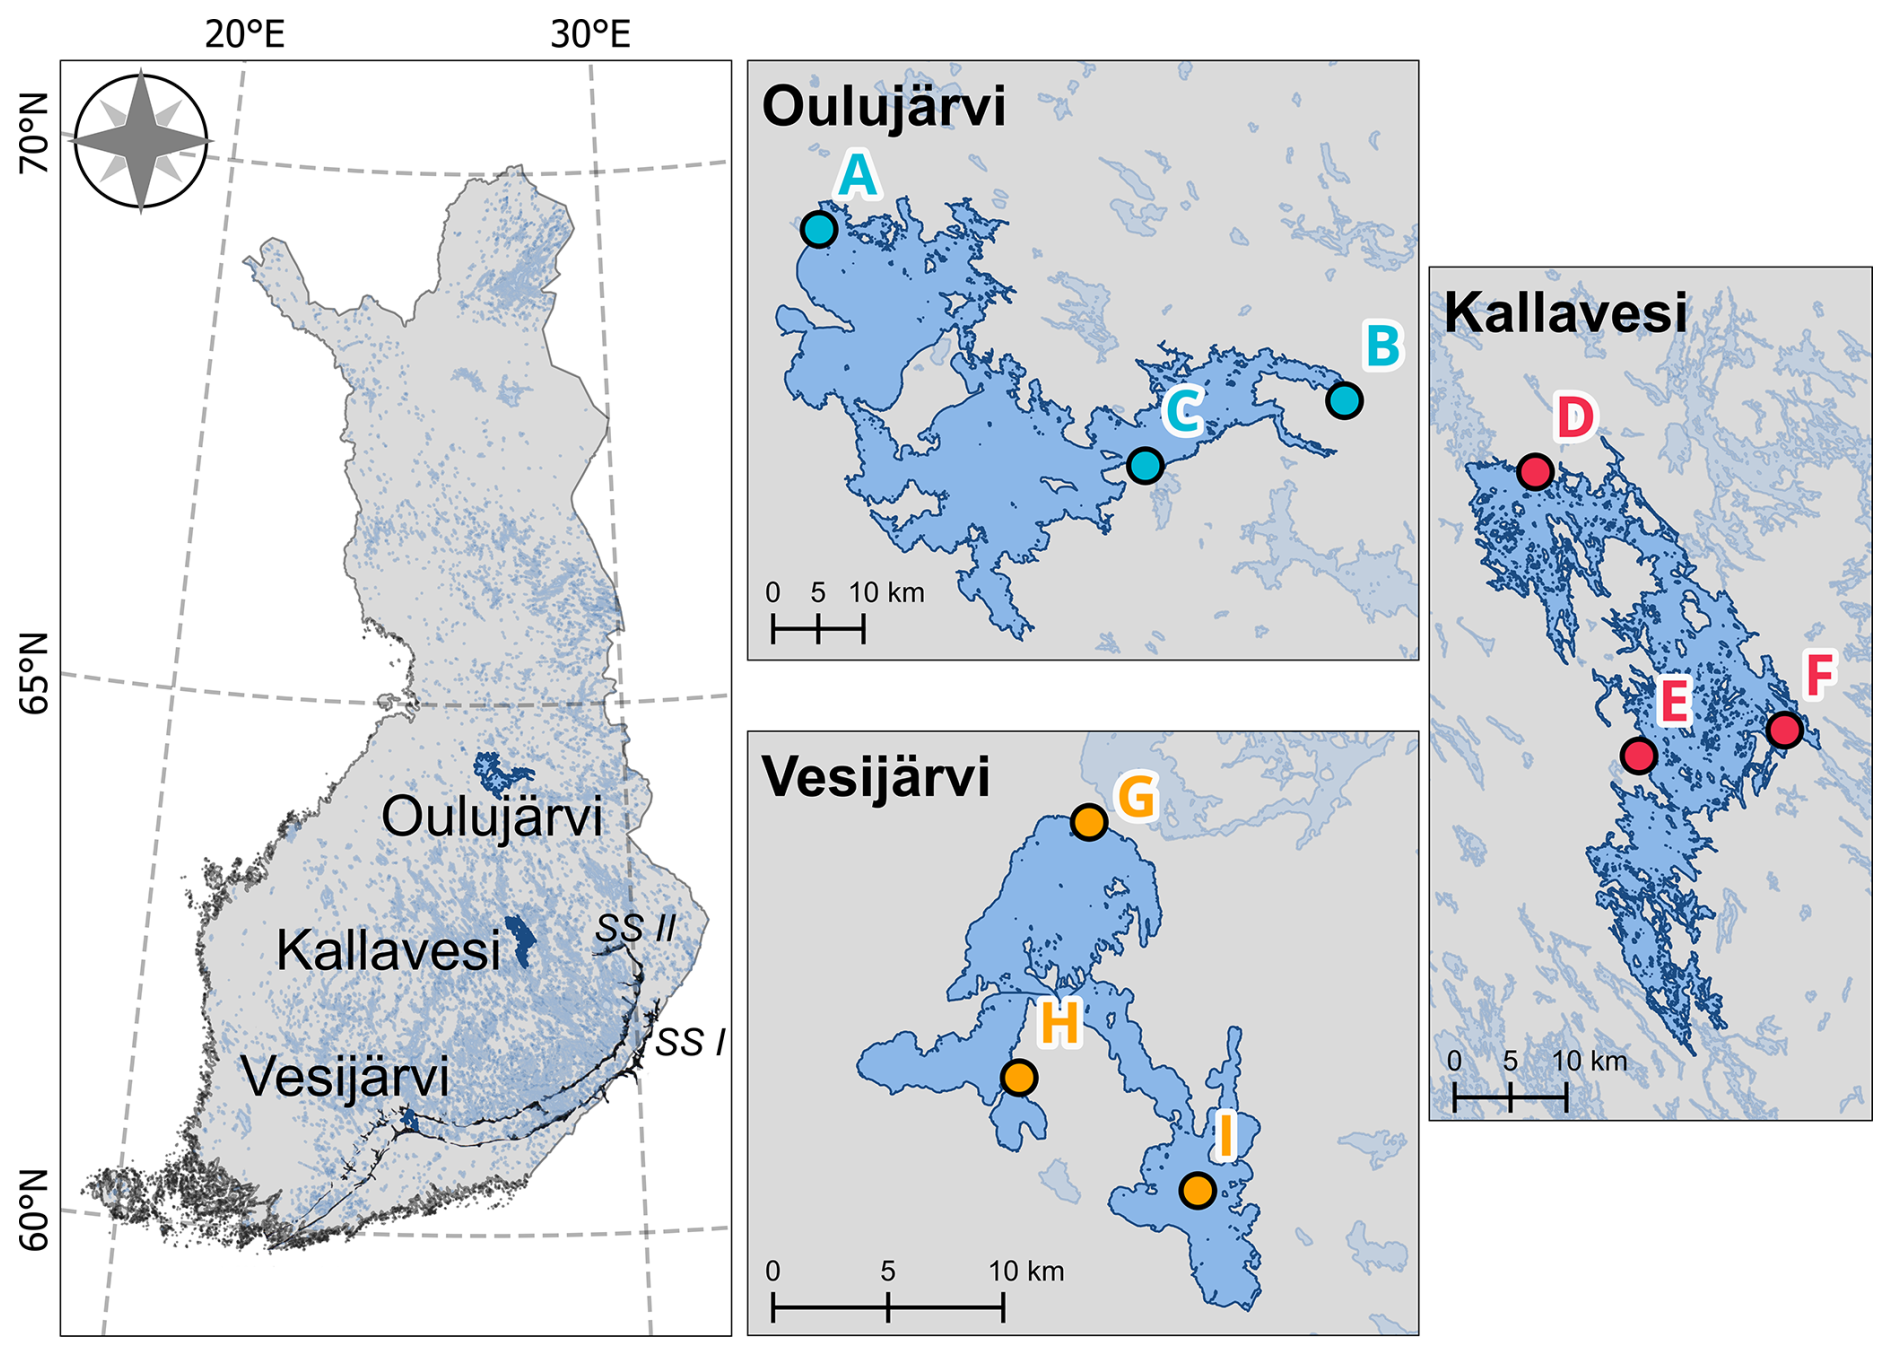
Figure 1Sampling sites (A to I). At each site, a depth transect was sampled, yielding 9 sediment cores per lake. The Finland shapefile was obtained from DVV (2023). SS I and SS II indicate the positions of ice marginal sand ridges Salpausselkä I and II, respectively (Repo and Tynni, 1971).
The clearwater and mesotrophic Lake Vesijärvi is the smallest and southernmost lake sampled in the study, while the humic and oligotrophic Lake Kallavesi is located in central Finland, and the humic and dysoligotrophic Lake Oulujärvi with large (2.7 m) water level regulation is the largest and northernmost lake (Tables 1 and S1). All three lakes are located north of the youngest of the Salpausselkä ice marginal sand ridges that are among the most conspicuous glacial formations in Finland (Rainio et al., 1995). The Salpausselkä I and II formations were laid down during the Younger Dryas cold climatic period, and constitute a zone approximately 20–50 km wide and 600 km long across southern Finland, which is composed mainly of glaciofluvial gravel and sand (Tikkanen, 2006; Rainio et al., 1995). In the regions north of the ice marginal formations, large deposits of gravel and sand are also found in eskers, representing the locations of subglacial streams and oriented approximately in the direction of glacial movement (Tikkanen, 2006; Hyvärinen, 1973). Other widespread landforms dating from the deglaciation and subsequent land uplift are large clay plain and mires (Tikkanen, 2002). This mosaic of surficial materials contributes to the soils and thus also the freshwater sediments in the regions of the three study lakes.
Lake Vesijärvi is located between Salpausselkä I and II formations and, thus, the region is mainly covered by surficial deposits of glaciofluvial sands (GTK, 2024) (Fig. S10). Lake Kallavesi is located in a region with a notable presence of eskers (Glückert, 1974) and its surroundings are mainly covered by bedrock outcrops, sandy eskers and mixed soil (GTK, 2024) (Fig. S10). Because of its northern location, lake Oulujärvi's surroundings also present some sandy eskers in the surficial deposits, but are mainly characterized by mixed soils and a thick peat layer (GTK, 2024) (Fig. S10).
Table 1Description of sampled lakes.
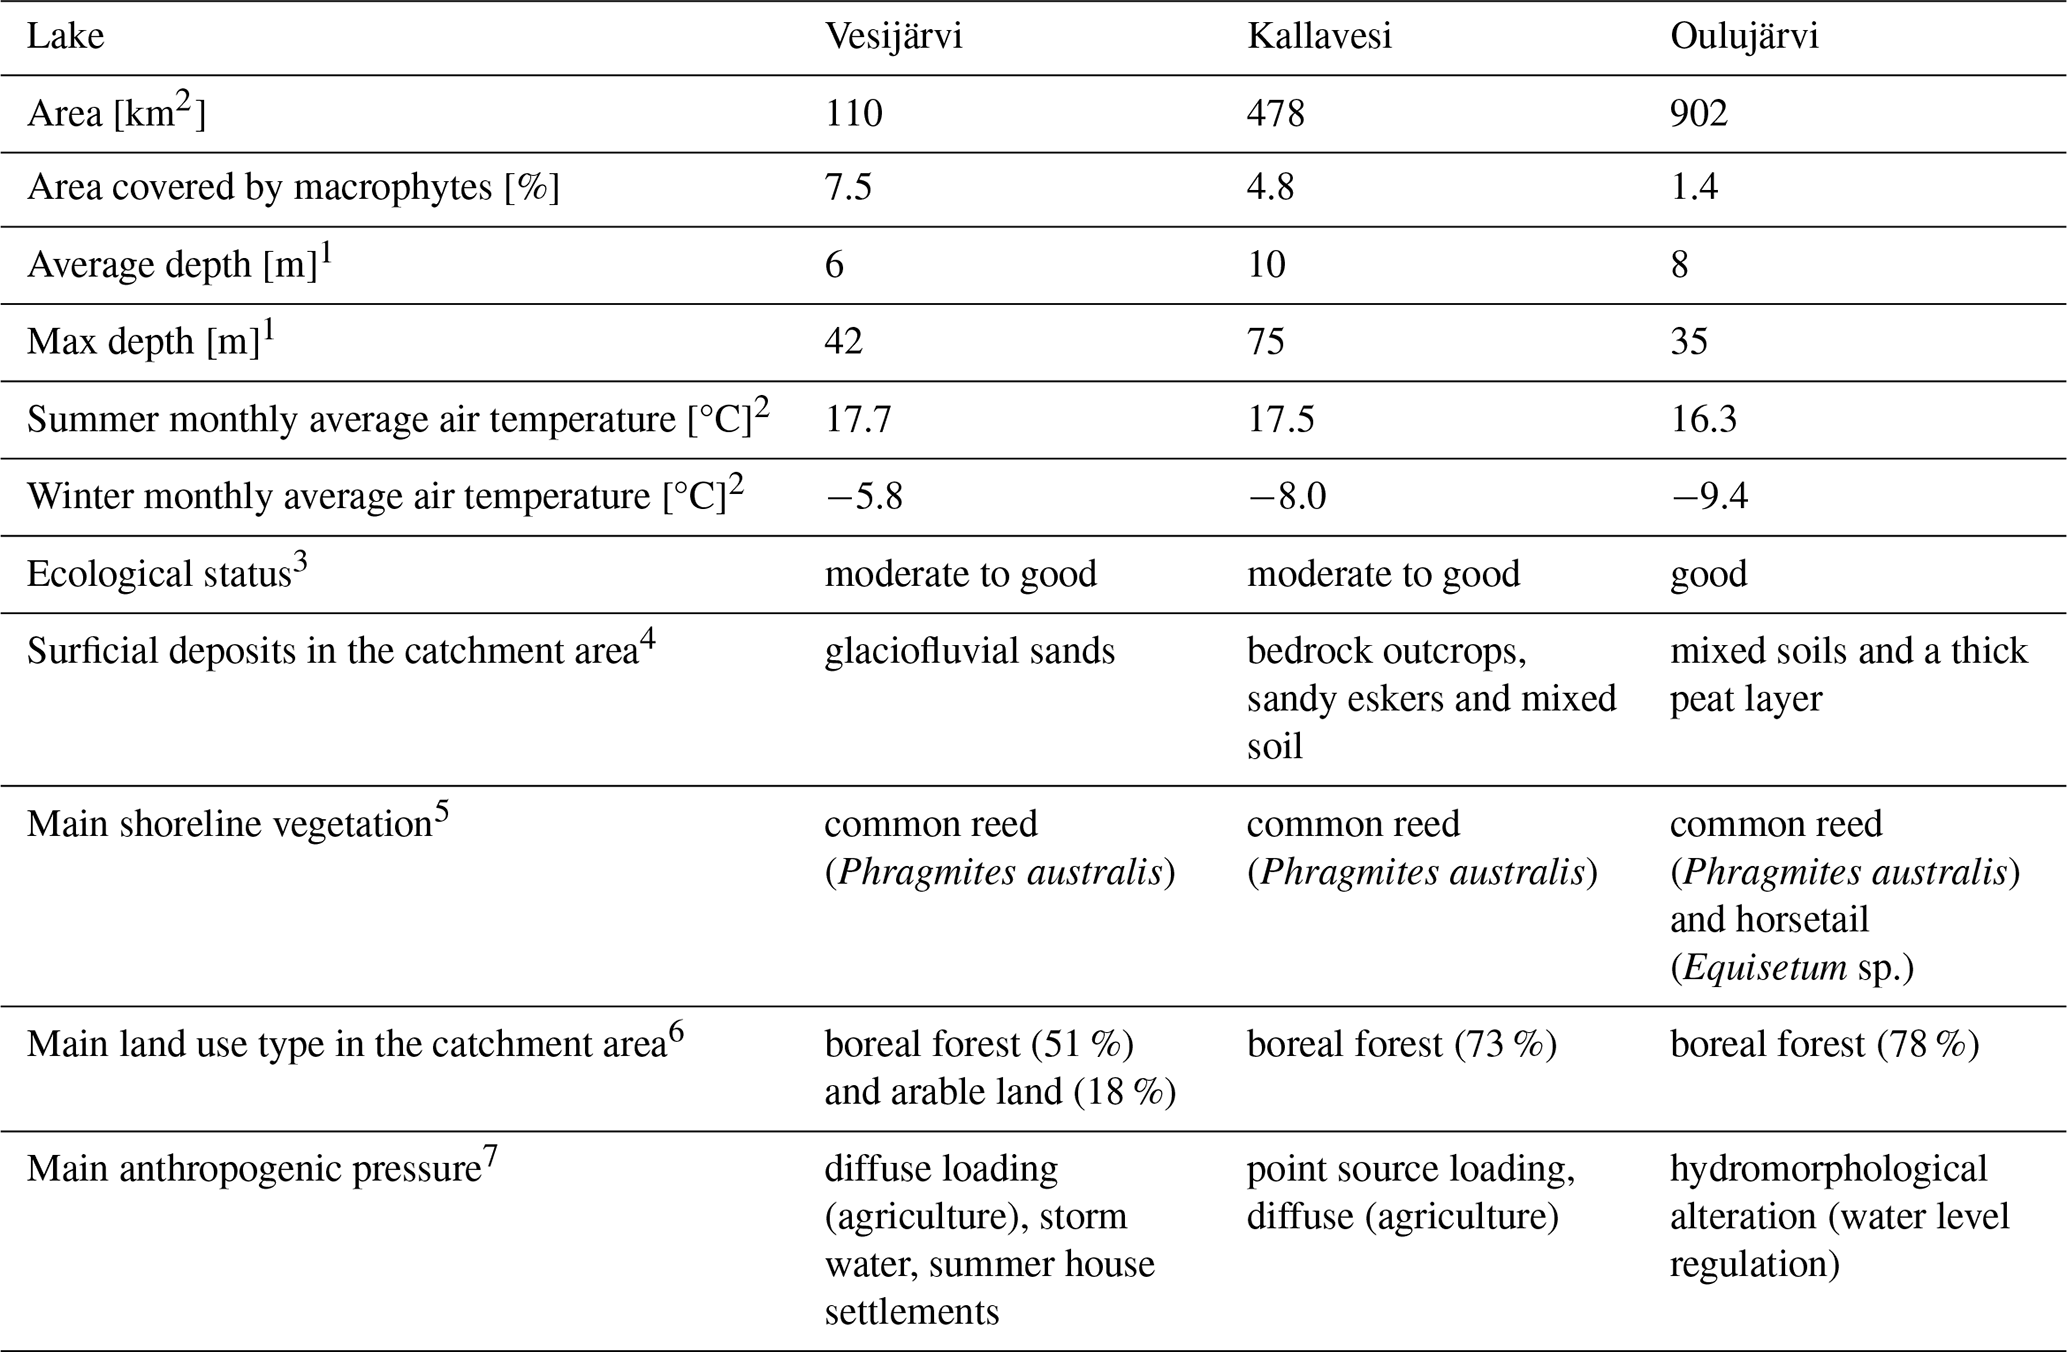
Notes: 1 Vesijärvi – Kairesalo and Vakkilainen (2004), Kallavesi – Noori et al. (2022), Oulujärvi – Turunen et al. (2022); 2 considering the last 30 years (FMI database, 2024); 3 Syke (2019); 4 GTK (2024); 5 Vesijärvi – Kankaala et al. (2004), Kallavesi – Partanen et al. (2006), Oulujärvi – Keränen et al. (1992); 6 Syke (2024); 7 Vesijärvi and Kallavesi – Syke (2025), Oulujärvi – Järvi-meriwiki (2025).
2.2 Sampling procedure
The sampling campaign was conducted in August 2023 in the vegetated shoreline areas of Vesijärvi, Kallavesi and Oulujärvi. From each lake, three sites, each including a depth transect of 3 zones, were sampled yielding a total of nine sediment cores per lake (Fig. 2). At each site, sampling was performed along a depth transect across the vegetation patch (one core from each of the following zones: landside, transitional, waterside; Table S2; Figs. 2 and S1 to S9d). Each site was selected based on existing evidence of macrophyte patches from satellite (Koponen et al., 2022) and aerial (Finnish National Geoportal (Orthophotos), 2023) images (Figs. S1 to S9b), and aligned with sites where previous macrophyte campaigns had also been carried out. Regular grids (10×10 m or 5×5 m, depending on the size of the vegetation patch) were created for each macrophyte patch. Based on satellite images (Koponen et al., 2022), the closest grid points to the lake shoreline were selected as potential starting points (i.e., the “landside” sampling point) of each transversal transect. For each sampling site (vegetation patch), the starting point was randomly selected using the “Random selection” tool of QGis (QGIS Development Team, 2024) (Figs. S1 to S9c). The starting points were always within the vegetation patch but could be either submerged or waterlogged (standing water depths ranging between 0.05 and 0.60 m). “Transitional” and “waterside” sampling points followed a transect perpendicular to the shoreline across the vegetation patch (Figs. S1 to S9d). “Waterside” sampling points were the furthest grid points from the starting points (“landside”) within the vegetation patch based on satellite images (standing water depths ranging between 0.37 and 1.23 m). “Transitional” sampling points were selected as the middle grid points between “landside” and “waterside” sampling points (standing water depths ranging between 0.05 and 1.13 m).
Sediment sampling was performed using a combination of two hand-held coring systems: a short piston corer (0.5 m length, 4 cm internal diameter) and a long box corer (100 cm length, 8×8 cm cross-section area). The corers were inserted into the sediments and pushed down until 1 m was reached, or until no further penetration was possible. Final depths obtained varied by site and zone (20–100 cm), and were mostly determined by the transition from organic-rich surface material to more compacted organic-poor material deeper in the core. Each of the 27 cores was sliced at 2 cm resolution in the first upper 20 cm, and 10 cm resolution until the bottom of the core. Sediment cores that had a clear compositional transition (e.g. from fine grained organic rich sediments to organic poor clay) below the top 20 cm were sliced at 5 cm resolution until reaching that transition, and then at 10 cm resolution downwards.
Samples (n = 359) were bagged and kept refrigerated until weighed in the laboratory. They were then frozen, freeze-dried and weighed again to determine dry mass [g] and water content [%]. Because some of the samples contained large rhizomes and pebbles, each sample was broken up with mortar and pestle and sieved through a 2 mm mesh for further analysis. The fraction retained in the sieve (> 2 mm) was weighed, and visually categorized as mainly “biogenic”, “lithogenic” or a “mixture” of both (Figs. S11 to S13). For the purposes of visualization, we classified the sieved samples (< 2 mm) into three categories based on grain size (d50, Sect. 2.3) and total organic carbon (TOC) content: “sands” (d50 ≥ 62.5 µm), “OM-poor (grey) silts” (d50 < 62.5 µm and TOC ≤ 5 % dry weight (dw)) and “OM-rich silts” (d50 < 62.5 µm and TOC > 5 % dw).
In each zone, in addition to the sediment core, vegetation stems for all macrophyte species were counted and identified in a quadrat of 1 m2.
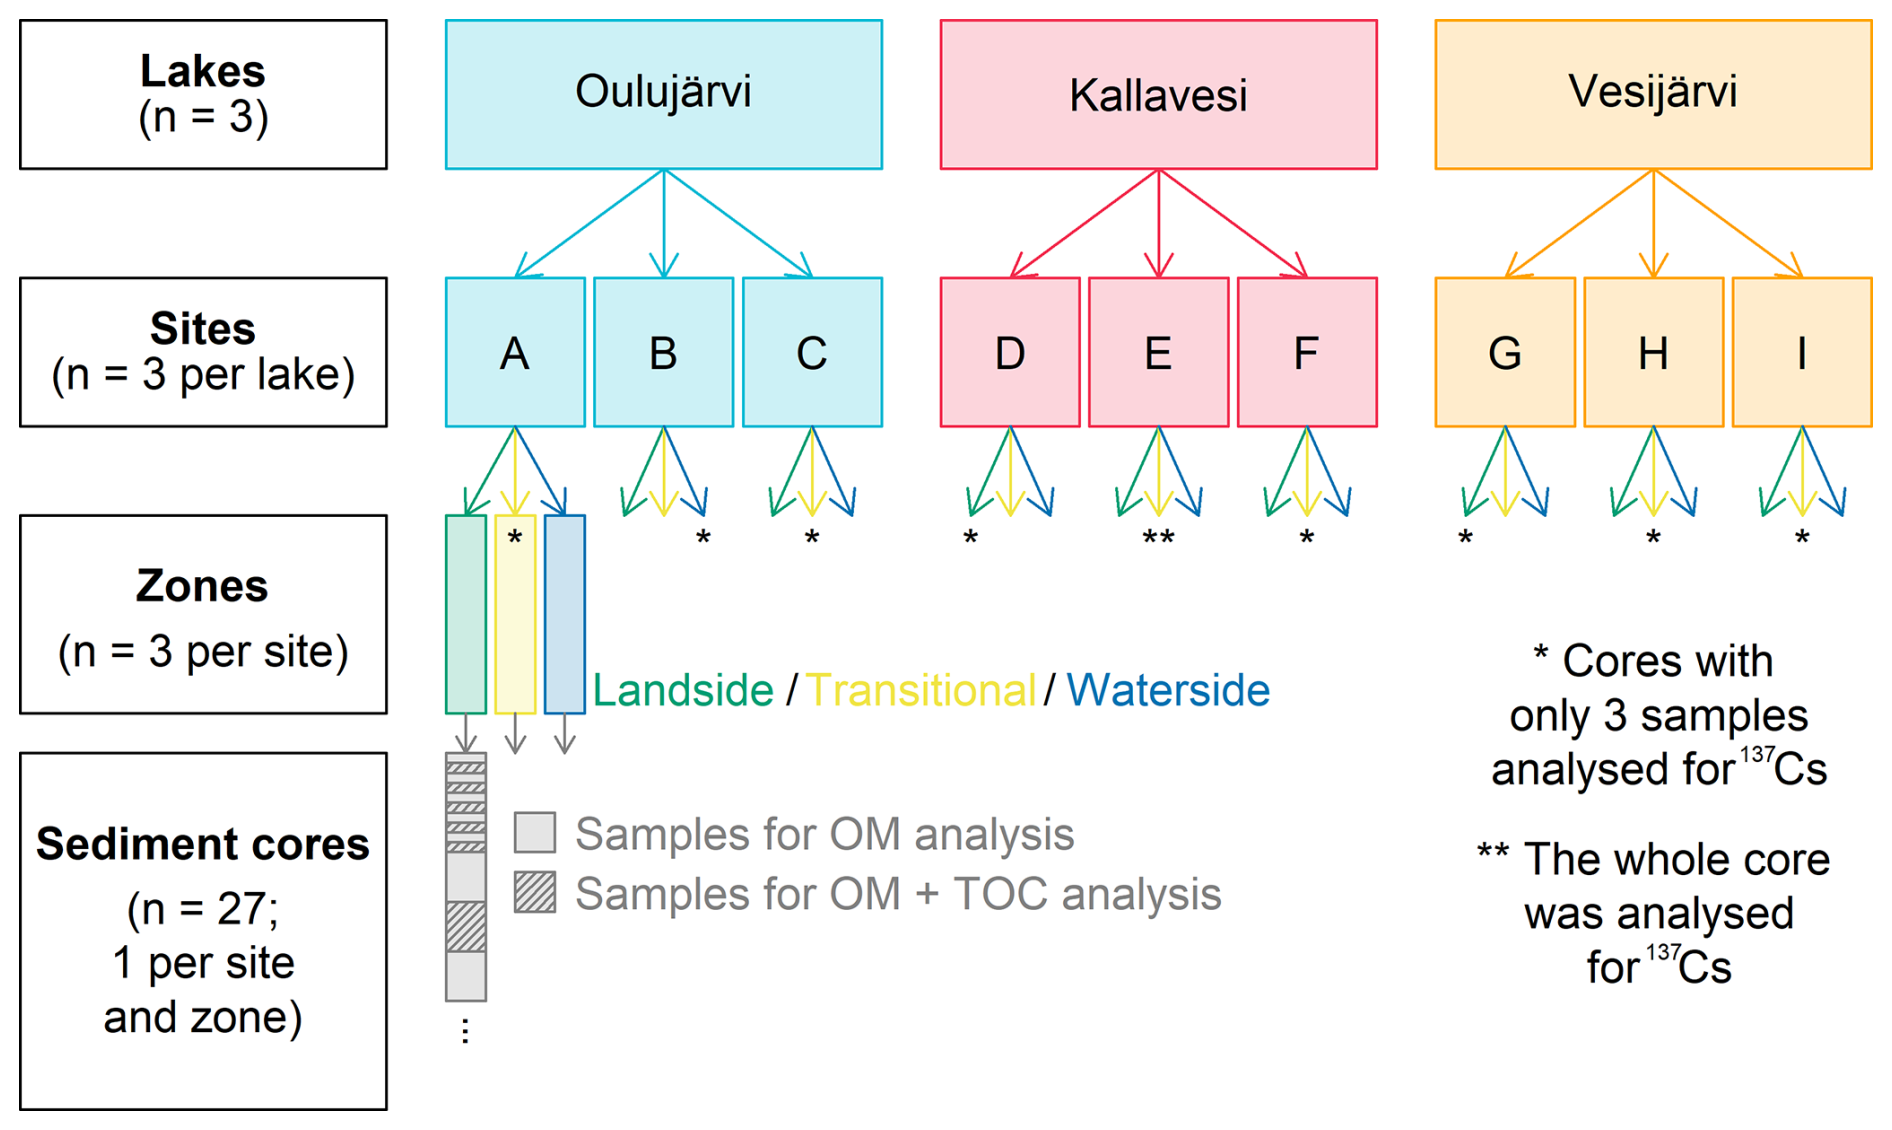
Figure 2Schematic diagram of the sampling design and the scales of the studied spatial variability.
2.3 Laboratory analyses
Organic matter (OM) content was measured by dry combustion at 550 °C (loss on ignition, LOI) using a LECO TGA701 analyser (LECO Corp., St Joseph, MI, USA; precision of 0.02 % RSD – relative standard deviation), while TOC was determined by dry combustion using a LECO CN828 analyser (LECO Corp., St Joseph, MI, USA). TOC limit of detection was 0.000017 %. OM was measured in all samples, whereas TOC was determined in 173 out of 359 samples taken alternately in each of the sediment cores, i.e. at every other sample (Fig. 2). These data were used to estimate TOC content in the remaining 186 samples by linear regression (a conversion factor of 0.44; r2=0.98) (Fig. S14).
Grain size was measured on the sieved and inorganic fraction of the sediments using a Microtrac FlowSync particle size analyser and is reported as % of fine-grained sediments. The precision of measurement based on replicates from an in-house sediment reference sample was 3 %.
The longest (0.9 m) sediment core (lake Kallavesi, Site E, zone transitional) was selected to be used as a reference core for sediment dating. Additionally, three samples within single sediment cores from the remaining eight sites were also selected (Fig. 2). All selected samples were analysed for 137Cs activity using BrightSpec gamma spectrometer (3600 s counting time, Geological Survey of Finland). We prospected for a single major peak in the profile assumed to correspond to the 1986 Chernobyl nuclear accident (Ojala et al., 2017), as evidence for continuous sediment accumulation in the reference core.
2.4 Data conversions and analyses
Dry bulk density (DBD) was determined from the sediment density corrected by organic matter content (Eq. 1), the water content and the sample volume. Wet and dry sample weights were used to calculate the sediment content [% relative to sample weight] (Eqs. S1 and S2), which was in turn converted into sediment volume [% relative to sample volume] and porosity Φ [fraction of 1] (Eqs. S3 to S5). Finally, porosity [fraction of 1], sediment density [g cm−3] and sediment content [%] were used to calculate wet bulk density (WBD) (Eq. 2) and dry bulk density (DBD) (Eq. 3).
where 1.4 g cm−3 is the assumed density for sediments rich in OM and 2.65 g cm−3 is the grain density of quartz (Pajunen, 2000; Burdige, 2006).
where Φ= volumetric porosity. TOC inventory for a given sample [g] was calculated multiplying the TOC content [%] by the DBD [g cm−3] and the sample volume [cm3]. For the C stock calculations, only samples with > 1 % OM were considered (Kortelainen et al., 2004). The TOC inventories were summed for all sampled depths to obtain a cumulative inventory [g] per core. Lastly, the cumulative TOC inventories [g] were divided first by 1000 (to obtain data in kg) and then by the coring device cross-section areas [m2] to obtain sedimentary organic carbon (SOC) stocks [kg m−2] (Eq. 4a).
where SOC stock is sedimentary organic carbon stock [kg m−2], TOC is total organic carbon concentration [%] in the samples (where OM > 1 %), DBD is the dry bulk density of each sample [g cm−3], depth is the thickness of sampled material [cm] and area is the cross-section areas of the coring devices [m2].
To remove the effect of different core lengths in the SOC stock calculation, SOC stocks were also calculated for the top 20 cm of each core (Eq. 4b). This depth (20 cm) was selected as it is the length of the shortest core (landside zone of site D in Kallavesi). Additionally, SOC accumulation values were calculated normalizing SOC stocks by the depth of the organic-rich layer in each sediment core (Eq. 5).
where SOC stocks [kg m−2] were calculated in Eq. (4a) and the depth of the organic-rich layer [cm] is defined by samples containing more than 1 % OM (Kortelainen et al., 2004).
Maps were produced using QGIS version 3.28.4 (QGIS Development Team, 2024), plots and statistical analyses were performed using R version 4.3.3 (R Core Team, 2024), and package ggplot2 was used for graphics (Wickham, 2016). TOC content and SOC stock estimates were log-transformed prior to statistical analysis to meet assumptions of normality and homogeneity of variance. Analyses of variances (ANOVA) were computed to compare grain size distribution (% of fine-grained sediments), TOC contents and SOC stock estimates across ecosystems, considering categorical parameters. For the grain size distribution, lakes and zones were used as categorical parameters. For the TOC content analysis, lakes, zones and grain-size classes were used as categorical parameters. For the SOC stock analysis, the used categorical parameters were lakes, zones, grain-size classes and macrophyte types. A post hoc Tukey Pairwise Comparison was performed to identify groups that differ significantly from each other.
Additionally, SOC stock estimates were also compared to environmental numerical parameters, i.e., density of macrophyte stems [stems m−2], water depth [m], slope of each site (calculated as the distance between the landside and waterside sampling locations divided by the difference in their depth), and the average fetch length. For each sampling site (A–I), the distance to the nearest shoreline (either lake shoreline or islands) was calculated considering 48 angles (from 0 to 345°, by 15° increments) (Murtojärvi et al., 2007; Hayes, 1996). The average of these 48 distances was considered as the “average fetch length”. R packages terra (Hijmans et al., 2024) and waver (Marchand and Gill, 2023) were used to import shapefiles into R and calculate the fetch lengths, respectively. Lastly, a generalized linear model (GLM; using multiple regression and family gamma) was employed to examine if there were significant relationships between our SOC stock estimates and the environmental numerical parameters (density of macrophyte stems, water depth, slope of each site, and the average fetch length using R package glm2 (Marschner and Donoghoe, 2022). The data was tested for multicollinearity using the variance inflation factor (VIF) analysis and they did not present multicollinearity.
3.1 Evidence for sediment accumulation
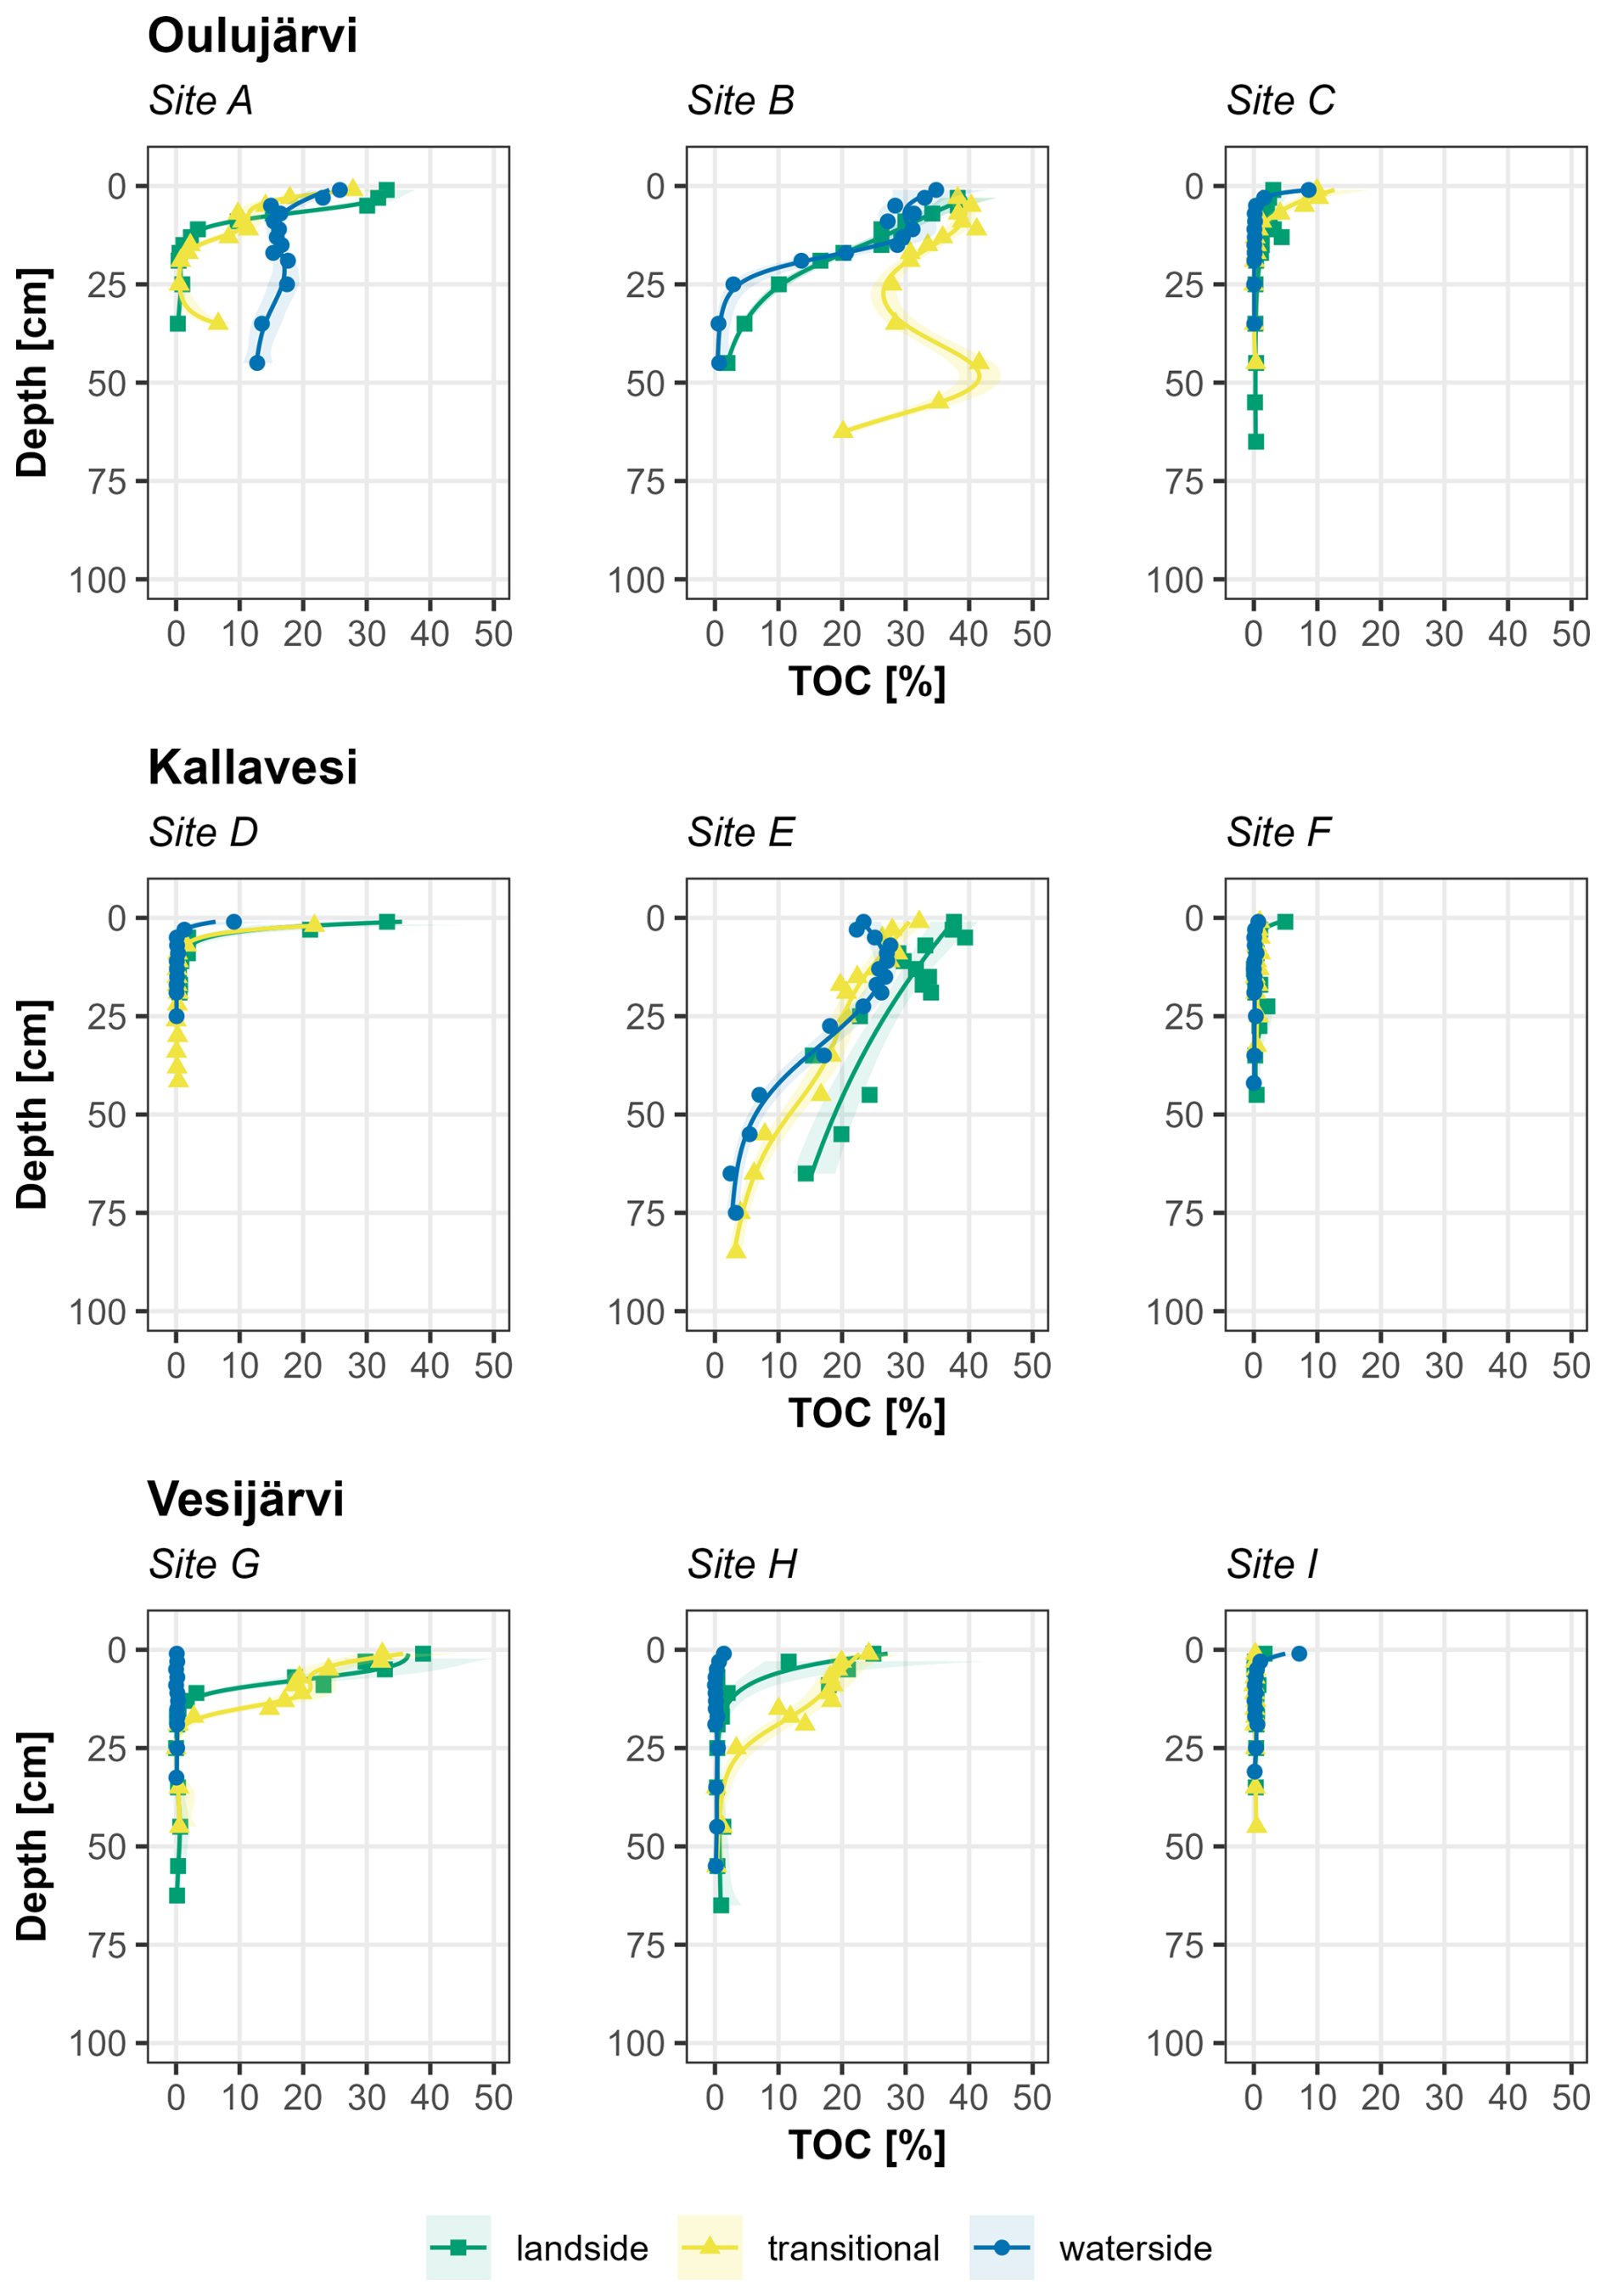
The signal of the 1986 Chernobyl nuclear accident was not clearly visible in the 137Cs profiles of our samples (Fig. S15). The maximum activity observed in the longest core was around 160 Bq kg−1, while peak values can reach up to 4 800 Bq kg−1 dry wt in deeper areas of the studied lakes (Junna et al., 2025). The low 137Cs signal values observed in the teal carbon areas imply mixing and removal of material, either by in-situ bioturbation (e.g. from roots or sediment dwelling invertebrates) or from physical action. The lack of clear 137Cs profile with a peak value suggests that there is no net sediment accumulation at our study sites, and we do not report data of long-term sequestration. Therefore, the shoreline areas do not act as permanent deposition locations for carbon, but rather zones of temporary carbon storage. This interpretation is supported by clear unconformities in most cores between a distinct surface layer rich in organic material and basal organic-poor material (Figs. S11 to S13, and S16). As such, the calculation of the sediment and carbon mass accumulation rates were not possible and instead we based our interpretation and discussion on stock estimates (mass per unit area) of carbon.
A similar behaviour might be seen in deltaic environments and alluvial floodplains, where sediments are subject to a repeated series of depositional, burial, and erosional events (Stanley and Hait, 2000; Sutfin et al., 2016). In the latter study, the authors suggest that the potential for long-term storage of SOC depends on the source and form of the OC and the residence time of sediment. However, Gurwick et al. (2008) studied the effect of microbial activity on OC burial in riparian soils and they emphasized that the abundance and quality of organic matter at the time of burial may be more important to SOC than the duration since burial.
3.2 Grain size and organic matter content
The sediments from all cores can be classified as organic-poor sands, organic-rich silts, or as organic-poor silts. The grain size (d50) varied between 7 and 819 µm while the percentage of fine-grained sediments (silt + clay) varied between 0 % and 95 % (Fig. S17; Table 2). Lakes Kallavesi and Oulujärvi had a larger fraction of fine-grained sediments (means and median between 50 % and 65 %) than lake Vesijärvi (30 % and 24 %, respectively) (Fig. 3a). There was a clear difference also between shoreline zones (Fig. 3b). Larger fractions of fine-grained sediments were observed in the landside and transitional zones (means and median between 47 % and 62 %), while samples from the waterside presented a coarser grain size distribution, with fine-grained sediments presenting a mean of 37 % and a median of 28 %.
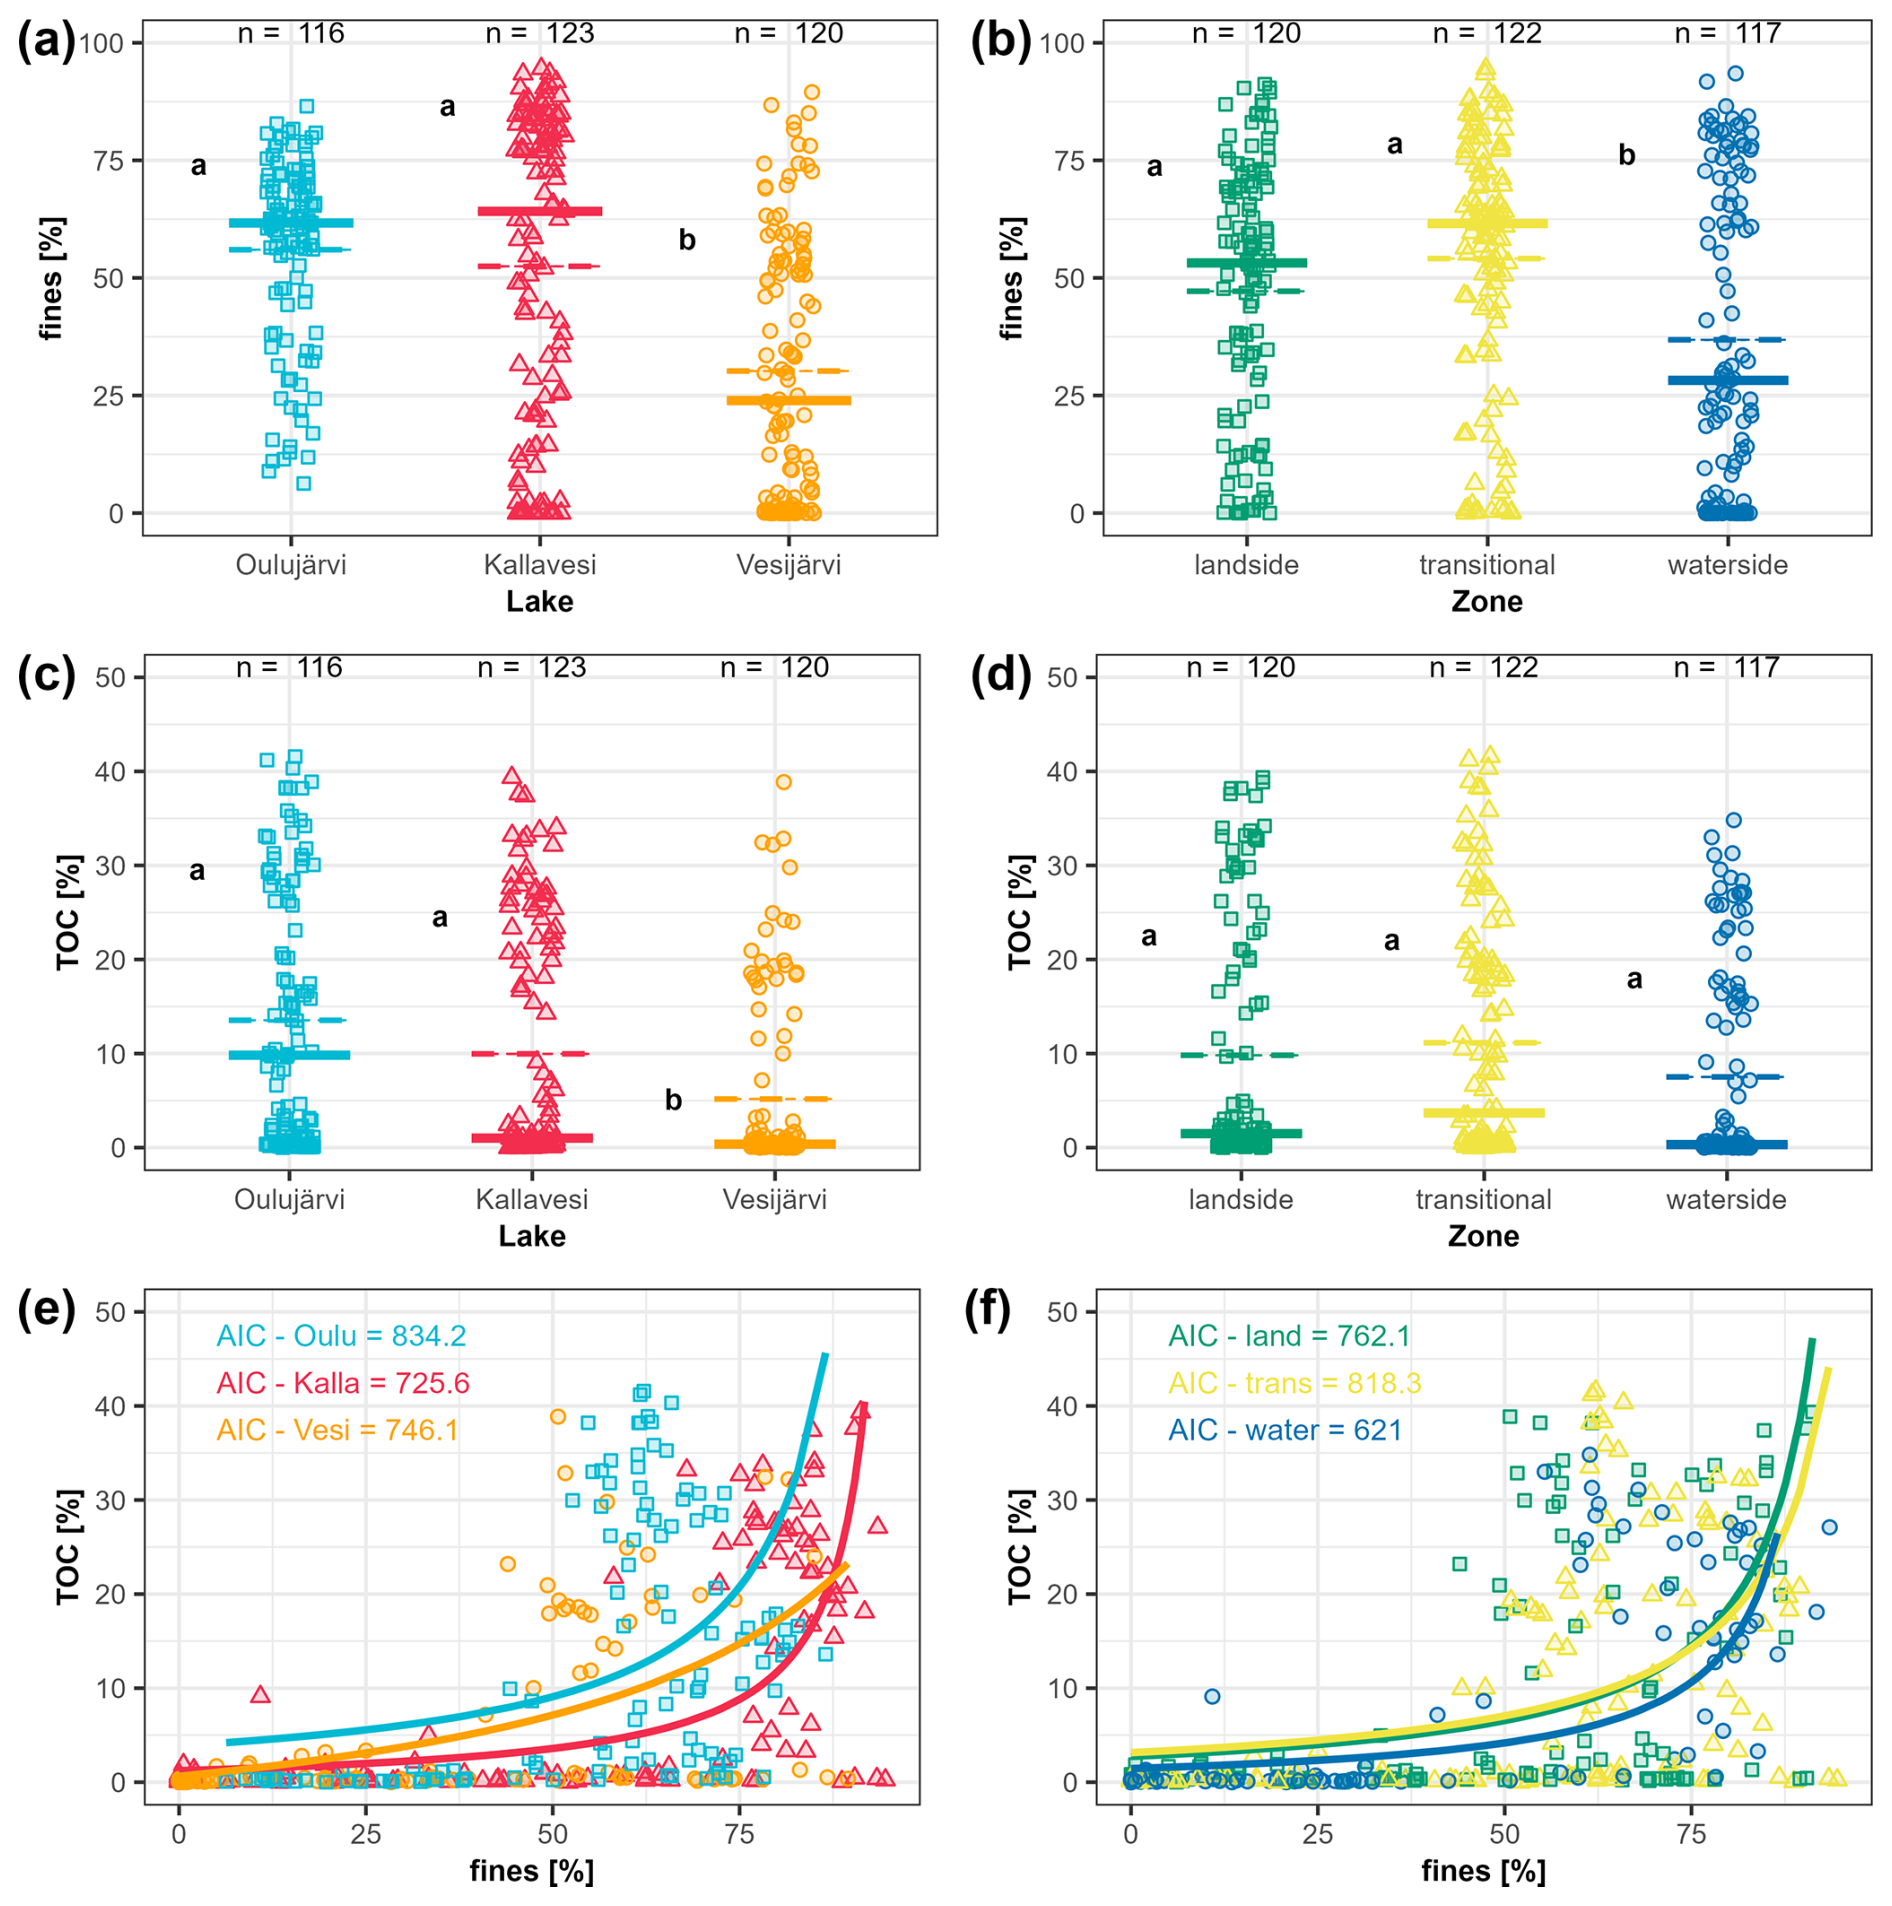
Figure 3Grain size distribution (% of fine-grained (silt + clay) sediments) grouped by (a) lakes and (b) zones; total organic carbon (TOC %) distribution grouped by (c) lakes and (d) zones; and % TOC vs. % fines coloured by (e) lakes and (f) zones. In plots (a) to (d), the dashed horizontal lines indicate the mean, and the continuous bold horizontal lines indicate the median. Significant differences were observed among the lakes for both % fines and %TOC, and the shoreline zones for % fines, with the samples from lake Vesijärvi and the waterside zone containing overall less fine-grained sediments and less TOC (ANOVA results in Table S3 and Tukey test results in Tables S5 and S6). The position of the “a” and “b” letters in plots (a) to (d) indicates the third quartiles and represent distinct variances among groups. The continuous bold lines in plots (e) and (f) represent the gamma regression model. Lower Akaike Information Criteria (AIC) values indicate a better fit of the model.
Table 2Fraction of fine-grained sediments, mean grain-size class, total organic carbon (TOC), SOC stocks by sediment core, using two different approaches (whole sediment core vs top 20 cm), core length, depth of organic-rich layer (samples with organic matter content > 1 %) and SOC accumulations in the organic-rich layer. Fraction of fine-grained sediments [%] and TOC [% dw] are presented as “minimum – maximum (median value)”. Abbreviations: C + M sand = coarse and medium sands; F + VF sand = fine and very fine sands.
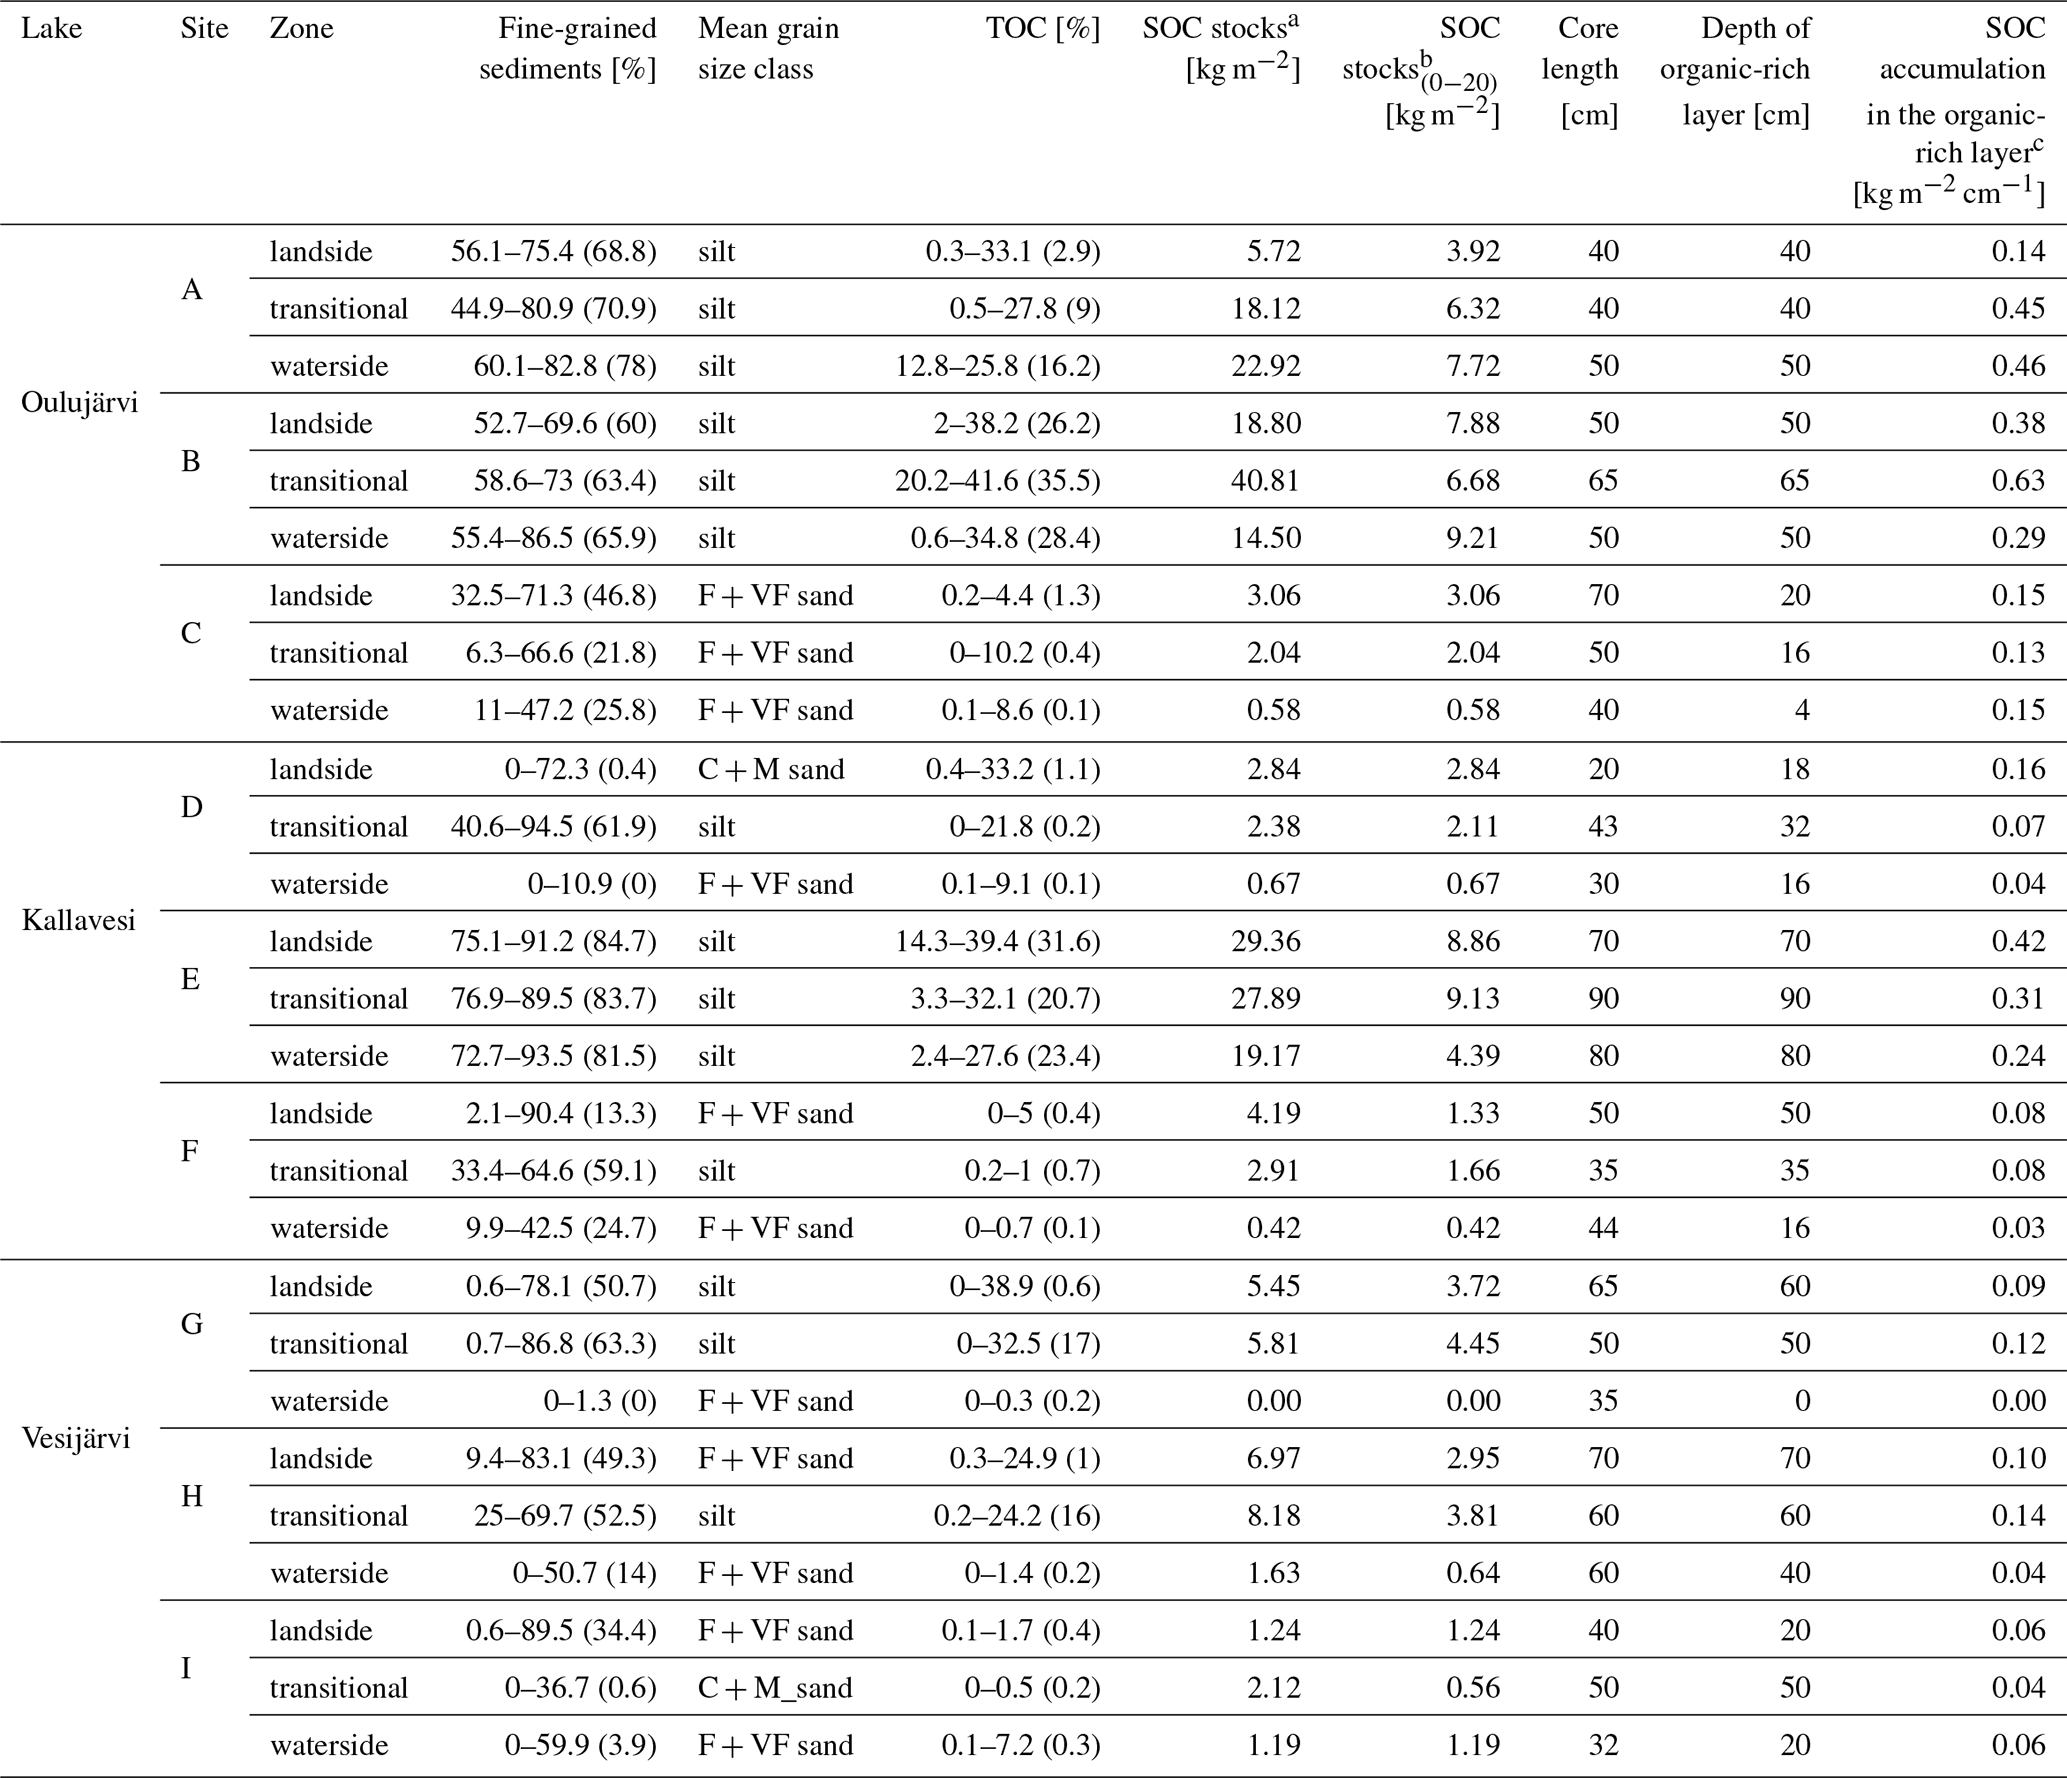
a: SOC stocks [kg m−2] considering whole sediment cores. b: SOC stocks(0−20) [kg m−2] considering samples from only the top 20 cm of each core. c: SOC accumulation [kg m−2 cm−1] considering whole sediment cores. SOC stock values [kg m−2] were divided by the depth [cm] of the organic layer in each core.
Most of the sediment cores presented a top layer typically rich in organic matter content [% dw] that was overlying sandier sediments and/or organic-poor silts (Figs. S11 to S13, and S16), both poor in organic matter (Fig. 4). The top 30 cm encompasses the entire OM-rich layer in many cases, and only at sites A, B (lake Oulujärvi) and E (lake Kallavesi) was the whole sediment core filled with organic-rich material (Figs. S11 and S12). The percentage of TOC across all samples varied between 0 and around 40 % dw in each of the three lakes, and the medians were 1.0 % dw, 0.4 % dw, and 9.8 % dw, respectively (Figs. 3c and 3d, Table 2). Significant differences were observed among the three lakes (ANOVA F-value = 18.62; p-value < 0.05), shoreline zones (ANOVA F-value = 6.441; p-value < 0.05), and grain-size classes (ANOVA F-value = 83.73; p-value < 0.05), with the samples containing silts presenting overall larger TOC content (ANOVA results in Table S3 and Tukey test results in Table S6). Overall, TOC content was higher than 10 % only when the amount of fine-grained sediments was higher than 50 % (Fig. 3e and f).
3.3 Organic carbon stocks
The whole core SOC stocks varied between 0 kg m−2 (lake Vesijärvi, waterside zone, fine and very fine sands, dominated by Phragmites) and 40.8 kg m−2 (lake Oulujärvi, transitional zone, silts, dominated by non-Phragmites), with a large variability being observed between lakes and sites (Fig. 5a). Larger stocks were generally observed in Oulujärvi, and smaller stocks in Vesijärvi (Fig. 5b). For the shoreline zones, smaller SOC stocks were observed on the waterside (Fig. 5c). Significant differences were observed among different types of vegetation (ANOVA F-value = 5.102; p-value < 0.05; Table S3), with the sites dominated by “non-Phragmites” vegetation presenting generally larger SOC stocks (Fig. 5e). As the ANOVA results for TOC content [% dw], the most significant differences between SOC stocks were observed among cores of different grain size classes (ANOVA F-value = 14.650; p-value < 0.05), with larger amounts of SOC stock observed only in the presence of silts (Fig. 5d) (multiple factor ANOVA results in Table S4 and Tukey test results in Table S7).
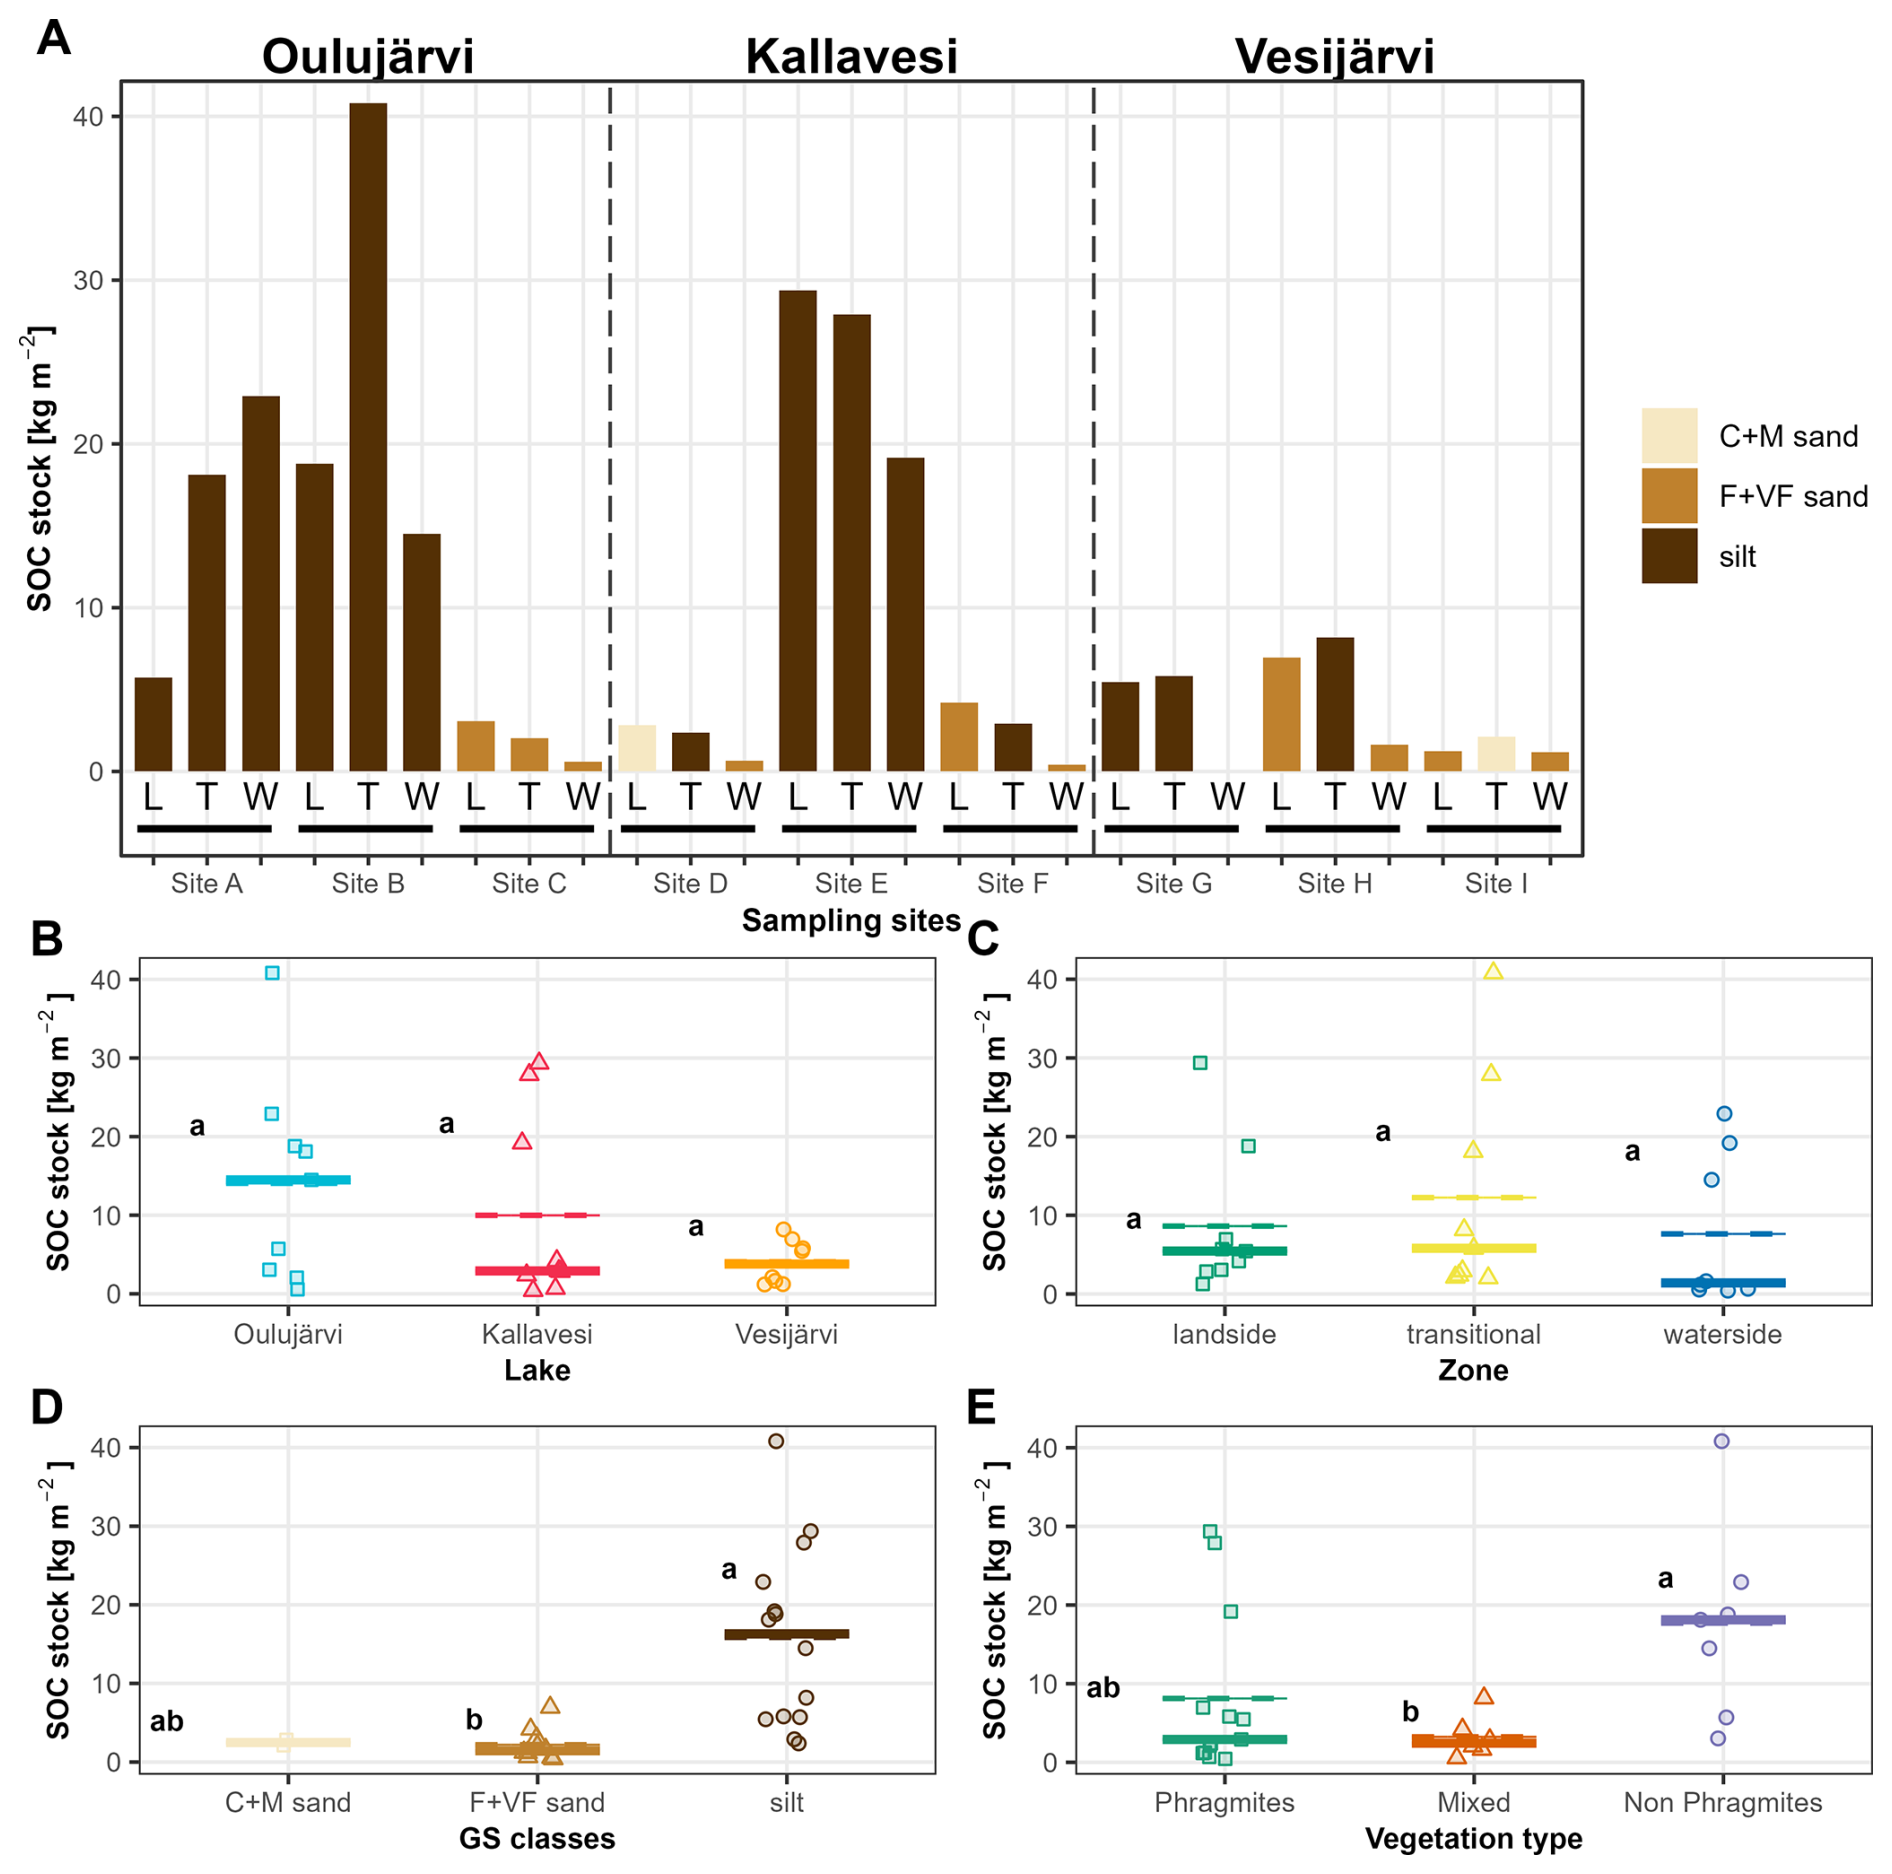
Figure 5Sedimentary organic carbon (SOC) stocks [kg m−2] of the sediment cores (a) and grouped by lakes (b), shoreline zones (c), grain size classes (d) and vegetation type (e). Stock estimates consider only samples with > 1 % of organic matter. In panels (b) to (e), the dashed horizontal lines indicate the mean, and the continuous bold horizontal lines indicate the median. Abbreviations: L = landside zone; T = transitional zone; W = waterside zone; C + M sand = coarse and medium sands; F + VF sand = fine and very fine sands. In (a), the bars are coloured according to the grain size averaged through the whole sediment core. The position of the “a”, “b” and “ab” letters in plots (b) to (e) indicates the third quartiles and represent distinct variances among groups.
Similar patterns were observed when only the top 20 cm were considered for the SOC stock calculation (Fig. S18) and for SOC accumulation (Fig. S19), with larger amounts of SOC stock(0−20) and SOC accumulation estimates being observed only in the presence of silts and most commonly in sites dominated by “non-Phragmites”. Their geospatial patterns were also very similar, with slightly larger mean and median values being observed in Oulujärvi and lower values in the waterside.
3.4 Environmental predictors of carbon stocks
To assess the relationship between environmental predictors and SOC stocks, we compared our cumulative SOC stocks with the density of macrophyte/helophyte vegetation, water depth, slope of each site, and average fetch length (Fig. 6). When all sites were considered together, the stem density does not seem to be a key parameter explaining carbon accumulation on lakes shorelines (Fig. 6a). However, when lakes and zones are considered separately (Fig. S20), the vegetation density becomes somewhat important on the waterside zone, and in lakes Kallavesi and Vesijärvi (r2>0.5), with higher stem densities corresponding to higher SOC stocks.
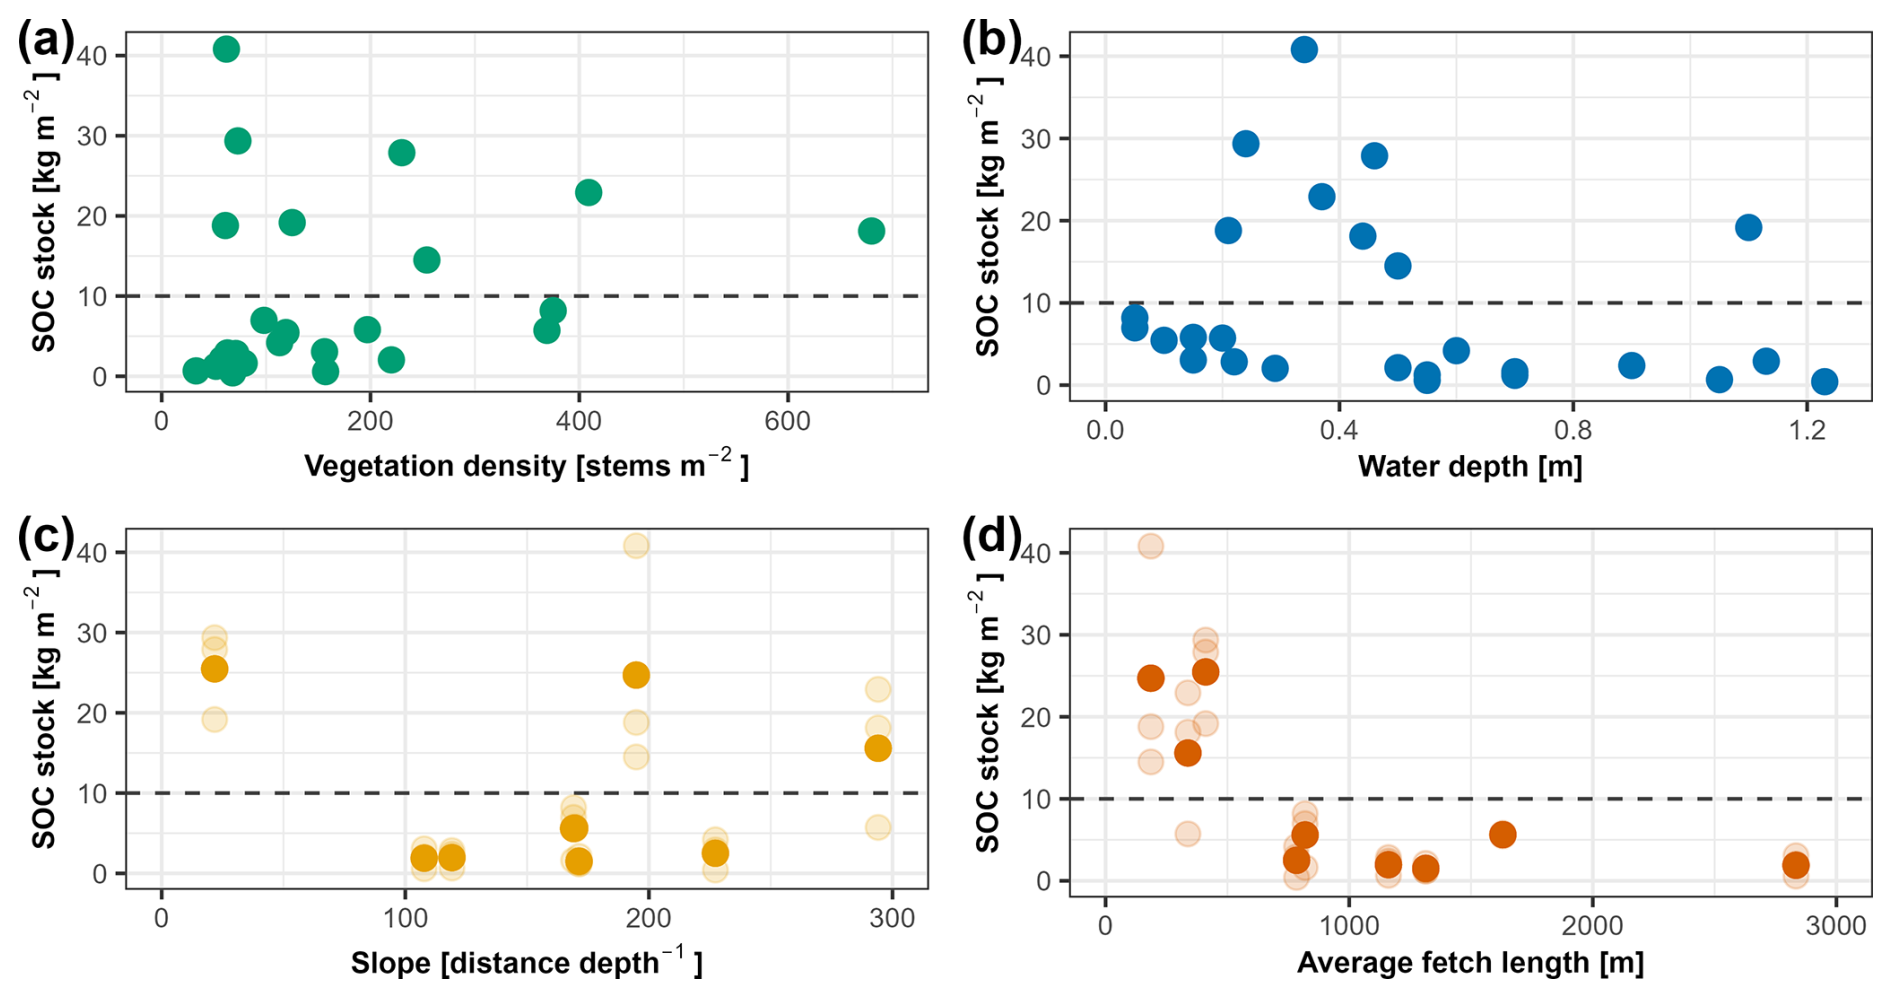
Figure 6Relationship between sedimentary organic carbon (SOC) stocks [kg m−2] and environmental parameters: (a) vegetation density [number of helophyte stems, in stems m−2], (b) water depth [m], (c) slope (calculated as the distance between the landside and waterside sampling locations divided by the difference in their depth), (d) and the average fetch length [m]. In plots (c) and (d), the translucent points indicate the SOC stocks per zone (landside, transitional, waterside) in each site (A to I), while the opaque points indicate the average SOC stock estimates in each site.
For water depth and slope, large SOC stocks (> 10 kg m−2) were observed across the entire sampled range, from shallow (< 0.4 m) to deep (< 1.0 m) sites (Fig. 6b), and from gradual (slope index > 250) to steep (slope index < 50) areas (Fig. 6c). The average fetch length, on the other hand, presented the clearest pattern with SOC stocks, with estimates larger than 10 kg m−2 being observed only when fetch lengths were smaller than 500 m (Fig. 6d). It was also the most significant (t-value = 4.788; p-value < 0.05) component in our generalized linear model (Table 3).
Table 3Significance of the four environmental numerical parameters used to explain variations in sedimentary organic carbon (SOC) stocks using a generalized linear model (GLM; pseudo-R2: 0.69; n = 27).

Significance codes based on p-value: < 0.001; < 0.01; * < 0.05; • < 0.1.
When considering only the top 20 cm for the SOC stock calculations or SOC accumulation, the same relationships were observed, with larger values being observed only when the average fetch length was smaller than 500 m (Figs. S21 and S22). The similarity between the results reinforces the robustness of using the whole core for the SOC stock calculation.
4.1 Grain size controls TOC content and SOC stocks
All three SOC calculations (SOC stocks [kg m−2], SOC stocks(0−20) [kg m−2] and SOC accumulation [kg m−2 cm−1]) presented the same spatial distribution (Table 2), with the highest values being observed in sites A, B (Oulujärvi) and E (Kallavesi), and the lowest in site I (Vesijärvi).
When compared with the sedimentological parameters, both TOC content [% dw] and SOC stocks [kg m−2] showed a strong dependency on the grain size (Figs. 3e and f, and 5d, respectively). Overall, higher TOC contents (> 10 % dw) were observed only when the proportion of fine-grained sediments exceeded 50 %. This association is well known, due to the higher specific surface area of lower-grain size materials allowing more OM to be sorbed on the particle surfaces (Keil et al., 1994; Keil and Cowie, 1999). Additionally, OM is more likely to be transported and sedimented with fine inorganic materials due to the hydrodynamics of the environment, i.e., a relatively quiescent setting will have more fine-grained sediments and more OM sedimentation (Milliman, 1994). Lastly, fine-grained sediments tend to have smaller pore spaces, which might hinder microbial degradation (Bianchi, 2007).
Interestingly, the relationship between TOC content and grain size varied between the studied lakes (Fig. 3e and f). Because Vesijärvi is located between the two ice-marginal ridges Salpausselkä I and II, most of its surficial deposits are sands and thus, there is less fine-grained material that can be discharges to the lake. Kallavesi and Oulujärvi, on the other hand, are located further north and more influenced by the input of reworked glaciolacustrine clays (Lunkka et al., 2024). This likely causes the two latter lakes to receive more fine-grained sediments. Additionally, the water level of Oulujärvi has been altered in the last decades, which might have impacted the sediment input to the lake. Specially, between 1940 and 1960, several dams and power plants were constructed around Oulujärvi (Järvi-meriwiki: Oulujärvi, 2025). Dams built on rivers flowing towards the lake tend to retain larger sediment sizes, allowing a higher proportion of fine-grained sediments to arrive to the lake.
4.2 Environmental controllers of fine-grained sediments and SOC stocks
As pointed out by Tangen and Bansal (2020) in inland freshwater wetlands, SOC stocks are highly variable in space because of the suite of natural and anthropogenic controlling factors. Our SOC stock estimates presented a large spatial variability, ranging from 0 to 40.8 kg m−2 (Fig. 5a), and were mainly controlled by the sediment grain size (Fig. 5d). Several environmental parameters could influence the entrapment of organic-rich fine-grained sediments, such as the presence of vegetation acting as barriers for the water flow and mixing, promoting deposition of particulate matter (Leonard and Luther, 1995), and the exposure of the shoreline to waves and currents, which can erode the deposited material (van Rijn, 1993).
Macrophyte presence can promote sediment deposition either through sediment adhesion to vegetation or by attenuating vegetation-induced hydrodynamics (Li and Yang, 2009). However, the role of specific species promoting sediment deposition is not clear (Nikora et al., 2008; Leonard et al., 2002). In our study, we did not observe any clear pattern between SOC stocks and type of vegetation. Even though sites without any Phragmites and dominated by Equisetum spp. and Carex spp. presented overall higher SOC stocks, high SOC stocks were observed also in sites covered only by Phragmites (Fig. 5e and Table S7). Therefore, the type of vegetation is not the main factor affecting SOC stocks, but it might play a secondary role.
Fine-grained sediments usually are dominant in low-energy conditions with gentle slopes, such as tidal flats and protected and sheltered basins (van Rijn, 1993). Among the tested properties (Fig. 6), the exposure degree of the shoreline presented the clearest relationship with SOC stocks. Significant SOC accumulation (mean of 21.9 ± 9.4 kg m−2 for the whole core, and 7.1 ± 1.9 kg m−2 for the top 20 cm) was observed only when the average fetch length was smaller than approximately 500 m (Fig. 6d). In these sites (Figs. S1, S2 and S5), the sheltered shorelines prevent the sediments (OM and fine-grained mineral material) from being washed away, promoting their deposition and allowing a deeper storage of OC. The remaining sites, with smaller SOC stock estimates (mean of 2.9 ± 2.3 kg m−2 for the whole core, and 1.8 ± 1.3 kg m−2 for the top 20 cm), were all located in more exposed shorelines (Figs. 5d, S3, S4, S6 to S9), where the fine-grained sediments and OM are more easily carried away, for example by waves. Our results suggest that in these exposed sites, only a small amount of SOC is stored in the more surficial portion of the sediments, especially in the root zone (Figs. S11 to S13). The presence of vegetation might buffer external disturbances and, therefore, promote the accumulation of fine-grained sediments and organic matter. Thus, vegetation density might play an additional role in controlling SOC accumulation in more exposed areas (Fig. S24).
In shallow estuaries dominated by wetland vegetation, the wave activity contributes to processes such as sediment re-suspension and transport (Karimpour et al., 2017; Green and Coco, 2014). Similarly in freshwater teal carbon environments, waves may play an important role in sediment re-suspension and erosion from shallow vegetated shorelines. The wave height, and hence the energy of the waves, increases with the wind speed and the fetch (the unobstructed distance over which the wind can blow) (Fagherazzi and Wiberg, 2009; Lamont-Smith and Waseda, 2007). Assuming our studied lakes are subjected to rather similar meteorological conditions, e.g. the number of days with constant wind are similar in the whole lake (Fig. S23), the length of the fetch in certain direction will be the main factor controlling wave heights, with longer fetch generating waves with larger heights (Lamont-Smith and Waseda, 2007).
When taller waves (i.e., of longer fetch) reach the shoreline, their orbital motion extends to the bottom and their shear stress can exceed the critical shear stress against which the sediment resists motion. On the other hand, taller waves are more prone to breaking as they shoal, and the dissipation of wave energy in the breaker zone can erode the bottom and generate a net offshore transport (van Rijn, 1993). During this interaction, wind-induced waves tend to remove sediments from the shoreline, and fine-grained sediments tend to be washed out faster than sands. On the contrary, sheltered areas (smaller fetch) are exposed mainly to waves with smaller heights, that tend not to affect deep into the water column or break when reaching flat areas, even promoting a net onshore transport of sediments (van Rijn, 1993). The lower energy environment promotes the deposition and preservation of fine-grained sediments. Because of their high surface/volume rate and chemical charges (Keil et al., 1994; Keil and Cowie, 1999), fine-grained sediments tend to adsorb more OM and, therefore, to accumulate more organic carbon.
In addition to the shoreline exposure, we tested the effect of bathymetry on SOC accumulation. Most of the sites with SOC > 10 kg SOC m−2 were found around 0.5 m of water column, but one sampling site located deeper than 1.0 m water column also presented SOC stocks larger than 10 kg m−2 (Fig. 6b). We also studied the relationship of the shorelines' slope on average SOC stock estimates. While sites A (average of 15.6 kg m−2) and B (average of 24.7 kg m−2) are located in a region with a gentle and subtle slope (slope indices of 294 and 195, respectively), which promotes fine-grained sediments and OM accumulation, site E (average of 25.5 kg m−2) was located in the steepest site (slope index of 22) (Fig. 6c). Therefore, neither bathymetry nor the shoreline's slope seem to have a consistent role on SOC stocks.
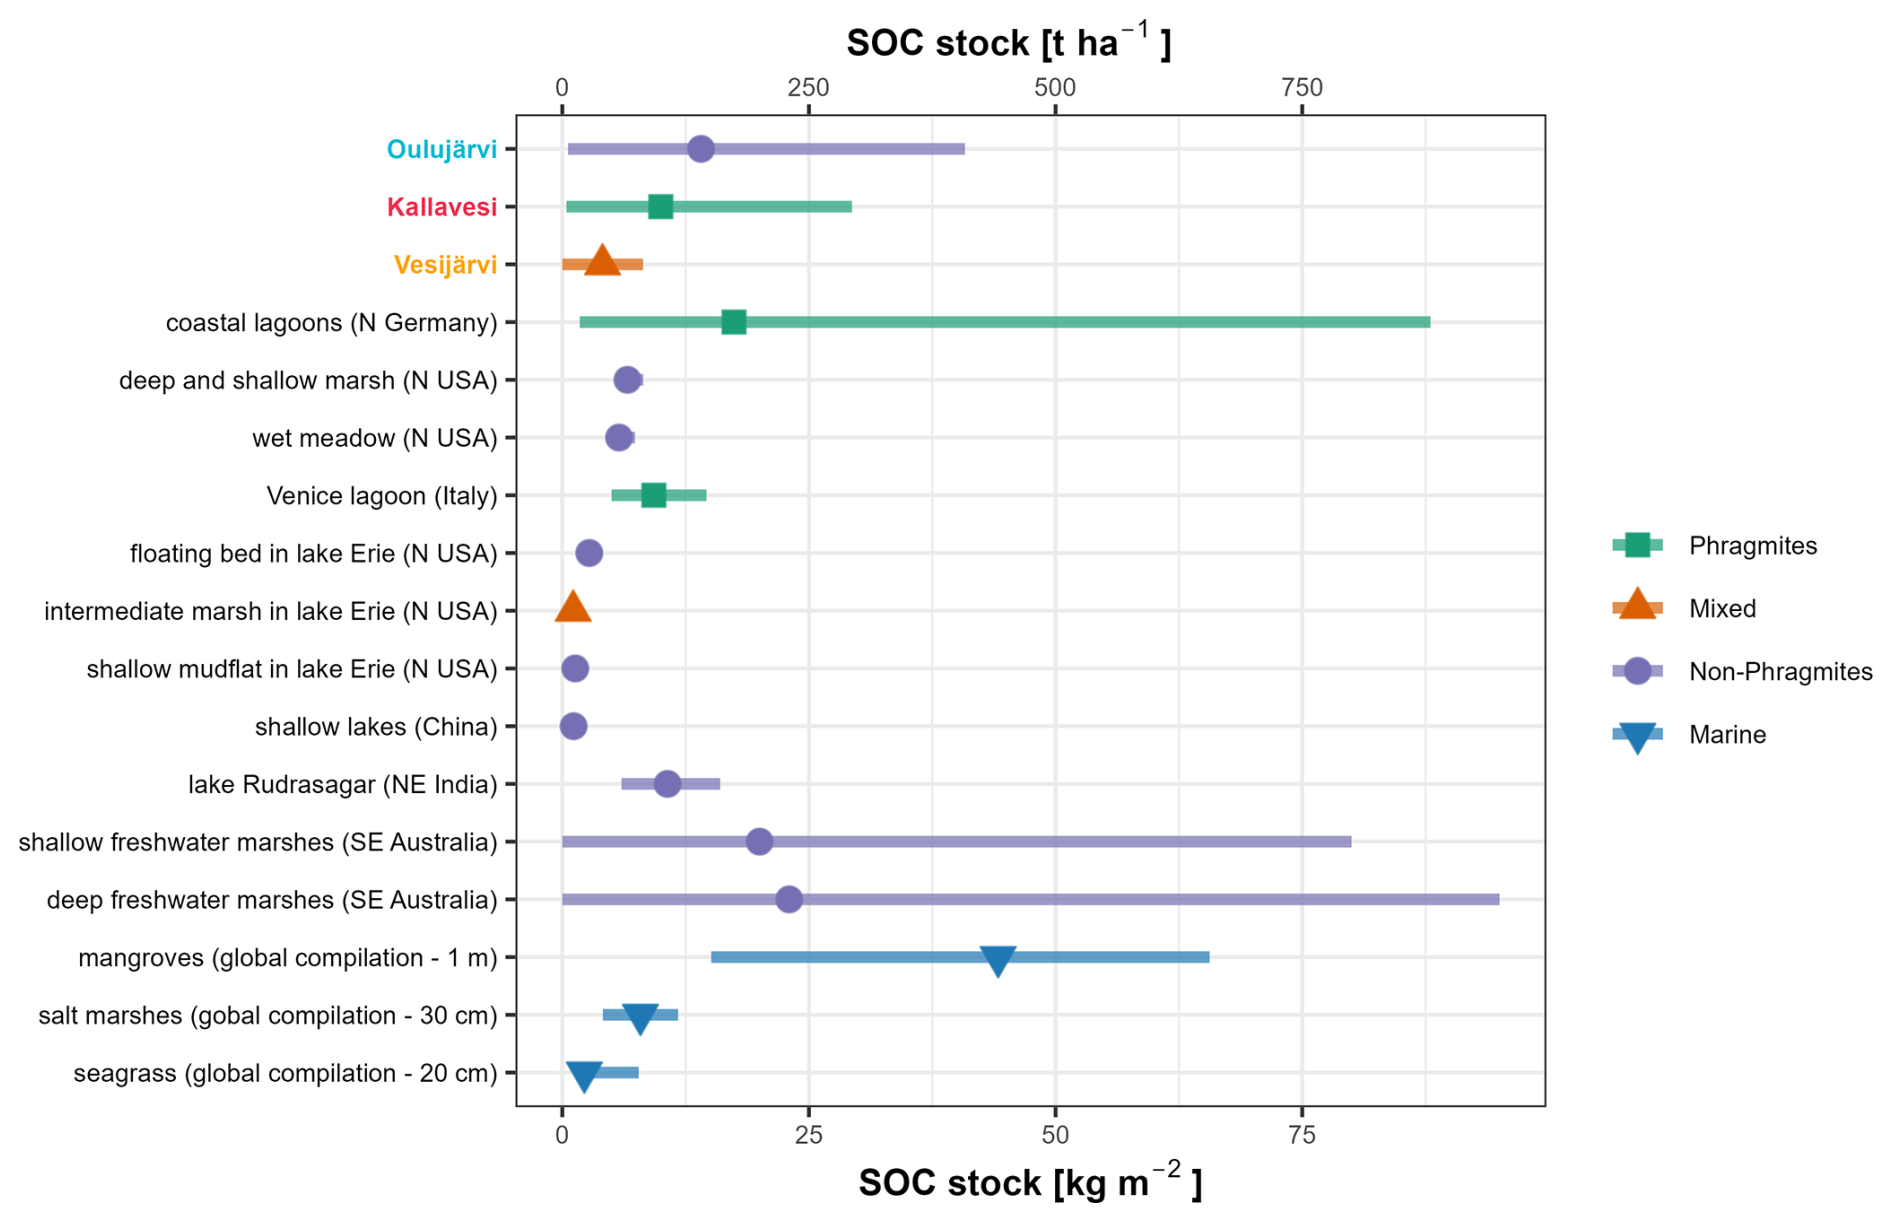
Figure 7Sedimentary organic carbon (SOC) stocks [kg m−2 and t ha−1] from vegetated wetlands and shorelines (range and mean), including the Finnish study lakes. Freshwater sites are sorted by latitude. References: Buczko et al. (2022), Tangen and Bansal (2020), Silan et al. (2024), Bernal and Mitsch (2012), Wang et al. (2016), Taran et al. (2023), Carnell et al. (2018), Alongi (2022), Maxwell et al. (2023) and Kennedy et al. (2022).
4.3 Small-scale spatial variability of SOC stocks
The spatial variability of the macrophyte belts zonation in freshwater wetlands that generally changes from more terrestrial and drier zones towards more aquatic and flooded zones has previously been described to control OC accumulation in shallow freshwater teal carbon ecosystems. Bernal and Mitsch (2012), Tangen and Bansal (2020) and Taran et al. (2023) found higher concentrations and stocks of OC in the inner, more aquatic portion, of the wetlands. They attribute this to the combined effect of the permanent anaerobic conditions and the high macrophyte productivity of the inner zone. Further, they observed a change in the species composition from their more landward/upper zone towards the water, which is different to what we observed in our boreal lake sites, where most macrophyte belts were monospecific. However, in a study focusing in monospecific reed belts, Buczko et al. (2022) observed larger SOC stocks in the terrestrial zone when compared to the littoral, more aquatic zone. They attributed this pattern to generally larger biomass being produced by Phragmites at the terrestrial edges of wetlands.
In our study, however, we did not observe any clear and general spatial pattern between SOC stocks and zones or macrophyte biomass (Figs. 4c and S20). In Kallavesi, for example, the largest SOC stocks were indeed observed in the landside zone in all three sites, but the landside zone was not always the most densely vegetated. In site E, for example, the largest SOC stock was observed in the landside zone, despite it having the lowest vegetation density (less than 100 stems per m−2) (Table S2, Figs. 4a and S20). In Vesijärvi, the largest SOC stocks were observed in the transitional zone, with monospecific (only Phragmites) or mixed macrophyte belts (Figs. 4a and S20). In this lake, a denser vegetation was associated with more OC accumulation, but even in the most densely vegetated study area (with almost 400 stems per m−2), the SOC stock did not exceed 10 kg TOC m−2 (Tables 2 and 3, Fig. S20). Lake Oulujärvi had the largest SOC stocks but the weakest relationship between the stocks, zones and macrophytes density (Table S2, Figs. 4a and S20). In Oulujärvi, the highest stock was found in a different zone in each site. Also, the largest stock estimate we observed was found in Oulujärvi, in an area with only 62 stems per m−2. This suggests that the zonation and the vegetation structure (species composition and stem density) have a secondary role in the amount of SOC stock in these teal carbon areas of boreal lakes. As mentioned before, when only the more exposed areas are considered, the vegetation density had a larger role in controlling role in SOC accumulation (Fig. S24), possibly due to the effect of vegetation in buffering external disturbances and, subsequently, promoting the accumulation of fine-grained sediments and organic matter. Thus, although macrophyte belts, especially Phragmites, can thrive in a wide range of environmental conditions (Murphy, 2002), only sheltered areas of teal carbon environments seem to accumulate larger amounts of OC into deeper sedimentary layers.
4.4 Comparison with similar vegetated environments
To put the teal carbon stocks from boreal zones in a global perspective, we compare them with the reported SOC stocks estimated for brackish and freshwater vegetated wetlands. Overall, our SOC stock estimates are well within the existing published values (Fig. 7). The SOC stock estimates from Oulujärvi and Kallavesi are comparable to those observed in a monospecific Phragmites reed belt from coastal lagoons in northern Germany (Buczko et al., 2022) and in several freshwater marshes from southeastern Australia (Carnell et al., 2018).
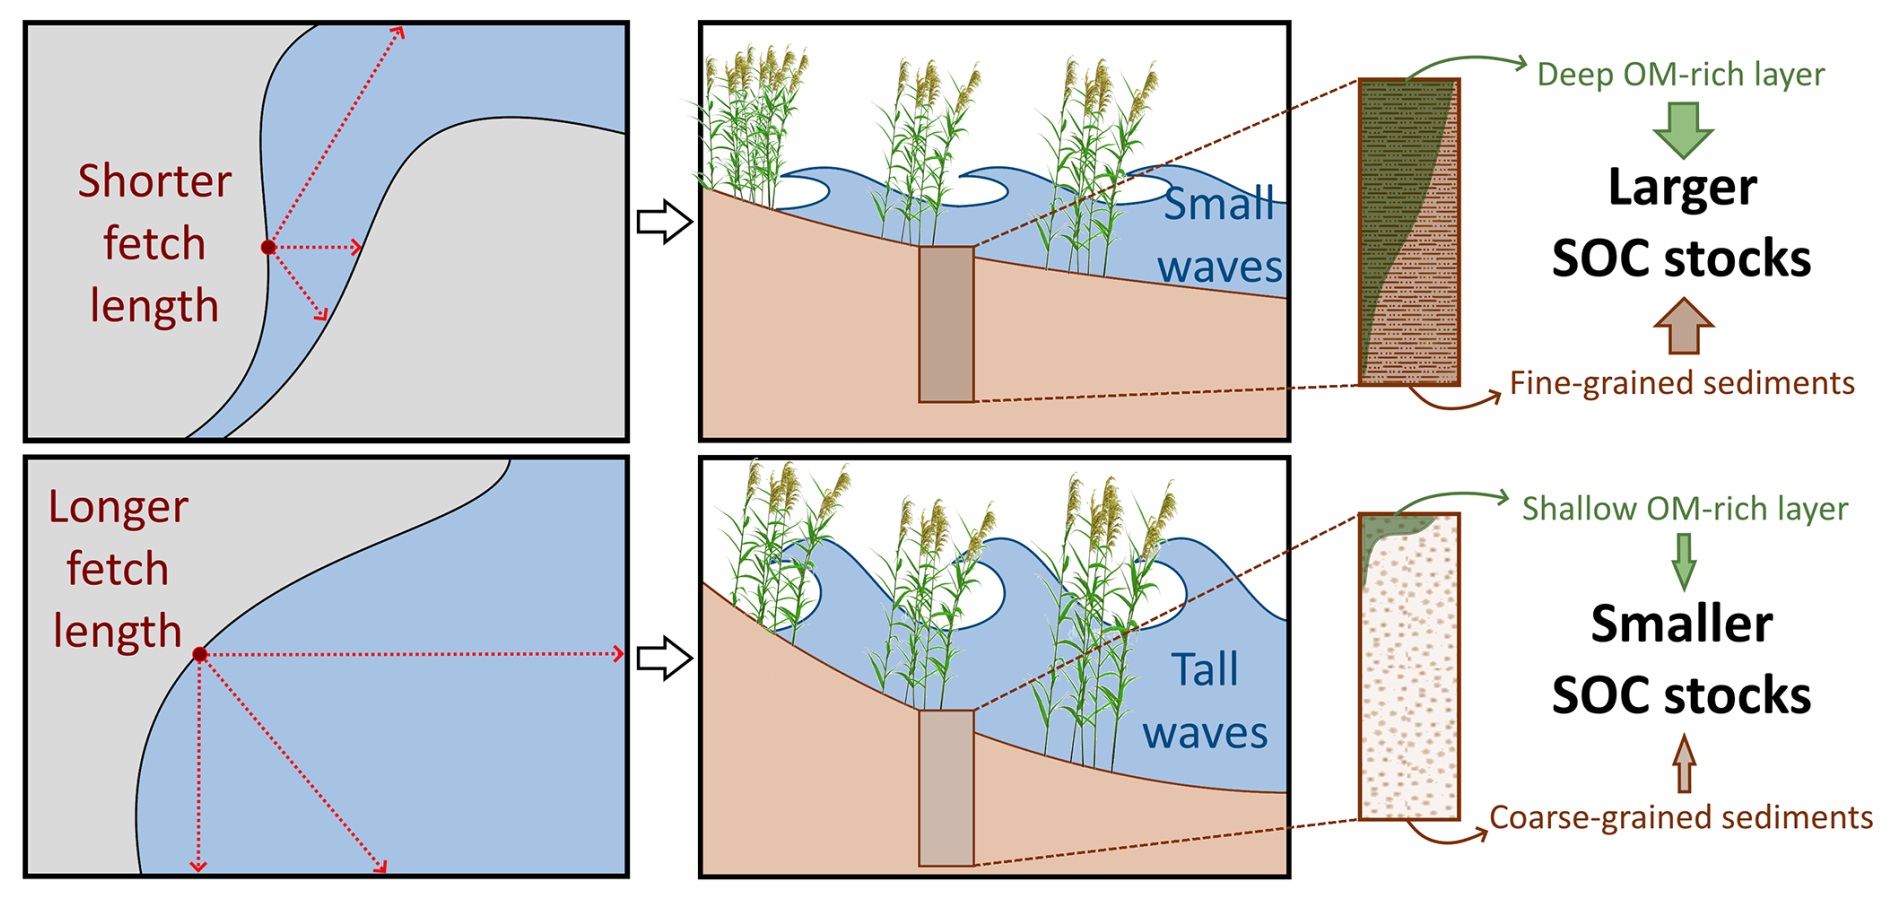
Figure 8Conceptual diagram summarizing the pathway between shoreline exposure, wave energy, sediment grain size and sedimentary organic carbon (SOC) stocks.
In the German coastal lagoons studied by Buczko et al. (2022), only one site (Michaelsdorf) presented organic-rich material throughout the whole sediment core (1 m length), reaching SOC stock estimates of 75 kg m−2. For the remaining sites the SOC stock estimates ranged between 1.76 and 35 kg m−2, and presented a clear decline in TOC content [% dw] with core depth. The Michaelsdorf sampling site is located in a relatively narrow channel connecting Saaler and Bodstedter water bodies, and is surrounded mainly by pastures. Even though the sampling site itself is not as sheltered as the sampling sites in Kallavesi (site E) and Oulujärvi (sites A and B), the geomorphology of the channel might prevent strong water currents and waves, allowing the settlement of fine-grained sediments, which in turn promotes the accumulation of TOC. Therefore, while Michaelsdorf sampling site probably stores more OC via the same mechanism as sites A, B and E in our study, the other sites in the studied German coastal lagoons probably resemble our more exposed sampling sites.
In the study by Carnell et al. (2018), data of 57 sediment cores from shallow freshwater marshes and 100 cores from deep freshwater marshes were combined. Therefore, the information about the geomorphology of each site is not available. Carnell et al. (2018) mention, however, the influence of the proximity to major rivers. Wetlands located closer to fluvial inputs were associated with higher sediment accretion and potentially carbon sequestration. The authors point out that this might be caused by anthropogenically clearing of terrestrial vegetation in the catchment area and changes in river hydrology, leading to larger inputs of autochthonous organic matter to the adjacent wetlands and macrophyte belts.
Compared to coastal marine blue carbon environments (mangrove forests, salt marshes and seagrass meadows), the mean of SOC stock estimates from Oulujärvi and Kallavesi are around one third of the SOC stocks observed in mangrove forests (Alongi, 2022). When compared to salt marshes (Maxwell et al., 2023) and seagrass meadows (Kennedy et al., 2022), however, the SOC stocks from boreal teal carbon environments are notably larger.
The overall magnitude of OC stocks observed in our study highlights the potential importance of shallow vegetated areas to OC accumulation in inland waters. As pointed out by Grasset et al. (2025), vegetated shoreline areas can act globally as net atmospheric C sinks, as opposed to pelagic zones that generally act as net C sources and thus decrease whole-lake atmospheric C emissions when included in lake budgets. Boreal latitudes contain the largest abundance of lakes in the world, especially considering lakes smaller than 0.1 km2 (Verpoorter et al., 2014). Due to the high perimeter/surface area ratio of inland waters in the boreal zone, shoreline areas and associated teal carbon environments in boreal lakes may be important components of global C cycling and therefore should be considered when budgeting SOC of lake sediments. In order to upscale our SOC estimates to obtain a boreal SOC budget, subsequent studies might consider calculating the fetch distances of lacustrine shorelines to classify them as exposed or protected. Once the shorelines are classified, our SOC stock estimates can be multiplied by the area covered by macrophytes, which will produce SOC pool data (in mass of SOC).
This study contributes to understanding of OC burial within vegetated teal carbon areas from boreal lacustrine environments. A large spatial variability was observed among SOC stock estimates from the three studied lakes, and larger OC accumulation was only observed in the presence of fine-grained sediments. Most of the sampling sites presented a relatively thin layer of organic-rich material on the surface, followed by organic-poor material deeper in the sediment cores. The sites where the organic-rich material extended through the whole core were all located in sheltered basins. In those areas, the sheltered shoreline prevents sediments, and consequently OM, from being washed away, promoting OC accumulation. Thus, although macrophyte belts, especially Phragmites, can thrive in a wide range of environmental conditions, only sheltered areas seem to accumulate larger amounts of OC into deeper sedimentary layers (summarized in Fig. 8). In more exposed areas, however, the vegetation density might play an additional controlling role in SOC accumulation, partly corroborating our first hypothesis. The presence of vegetation is likely to buffer external disturbances and, subsequently, promote the accumulation of fine-grained sediments and organic matter in these more exposed shorelines.
Identifying the major controlling factors of OC cycling and accurately determining the importance of vegetated shallow areas from inland waters to OC (accumulation) stocks is essential for constraining regional OC budgets. Boreal zones contain a high abundance of lakes, and despite their relatively small areas, these teal carbon ecosystems can contribute significantly to the OC cycling, possibly as much as some blue carbon ecosystems, thus corroborating the second hypothesis of this study.
All new data presented in the paper are accessible as Supplement, via Pangaea (https://doi.org/10.1594/PANGAEA.986726, Dauner, 2025a and https://doi.org/10.1594/PANGAEA.986727, Dauner, 2025b) or directly from the corresponding author without undue reservation.
The supplement related to this article is available online at https://doi.org/10.5194/bg-23-3637-2026-supplement.
TJ, KK and MJ designed the concept of the study. SV provided the images showing evidence of extensive areas of macrophyte vegetation on Finnish lakes used in the sampling delineation. AD and MK processed the laboratory analysis. EA participated in the data analysis. AD performed the statistical analysis and wrote the first draft of the manuscript. All authors contributed to manuscript writing and commenting, and approved the submitted version.
The contact author has declared that none of the authors has any competing interests.
Publisher's note: Copernicus Publications remains neutral with regard to jurisdictional claims made in the text, published maps, institutional affiliations, or any other geographical representation in this paper. The authors bear the ultimate responsibility for providing appropriate place names. Views expressed in the text are those of the authors and do not necessarily reflect the views of the publisher.
The authors would like to thank everyone that helped in the field campaign, especially Matti Laatikainen and Tuomas Junna. The authors also acknowledge Marie Korpoo for the constructive discussions.
This work was supported by a 3-year consortium project funded by EU Resilience and Recovery Facility (RRF) via Academy of Finland / Research Council of Finland (“BlueLakes: digitizing the carbon sink potential of boreal lakes”, grant 353317). The data in this study are a contribution from the Tvärminne Zoological Station (grain size analysis) and from the geophysical, environmental and mineralogical laboratories (HelLabs) of the Department of Geology and Geophysics (organic matter analysis), both from the University of Helsinki. Open access was funded by Helsinki University Library.
Open-access funding was provided by the Helsinki University Library.
This paper was edited by Robert Rhew and reviewed by two anonymous referees.
Alongi, D. M.: Impacts of climate change on Blue Carbon stocks and fluxes in mangrove forests, Forests, 13, 149, https://doi.org/10.3390/f13020149, 2022.
Bernal, B. and Mitsch, W. J.: Comparing carbon sequestration in temperate freshwater wetland communities, Glob. Change Biol., 18, 1636–1647, https://doi.org/10.1111/j.1365-2486.2011.02619.x, 2012.
Bianchi, T. S.: Biogeochemistry of estuaries, 1st Edn., Oxford University Press, New York, USA, 721 pp., ISBN: 9780195160826, 2007.
Bornette, G. and Puijalon, S.: Macrophytes: Ecology of aquatic plants, Encycl. Life Sci., https://doi.org/10.1002/9780470015902.a0020475, 2009.
Buczko, U., Jurasinski, G., Glatzel, S., and Karstens, S.: Blue carbon in coastal Phragmites wetlands along the southern Baltic Sea, Estuar. Coast., 45, 2274–2282, https://doi.org/10.1007/s12237-022-01085-7, 2022.
Burdige, D. J. (Ed.): Physical properties of sediments, in: Geochemistry of Marine Sediments, Princeton University Press, New Jersey, 624, ISBN: 978-0691095066, 2006.
Carnell, P. E., Windecker, S. M., Brenker, M., Baldock, J., Masque, P., Brunt, K., and Macreadie, P. I.: Carbon stocks, sequestration, and emissions of wetlands in south eastern Australia, Glob. Change Biol., 24, 4173–4184, https://doi.org/10.1111/gcb.14319, 2018.
Cole, J. J., Prairie, Y. T., Caraco, N. F., McDowell, W. H., Tranvik, L. J., Striegl, R. G., Duarte, C. M., Kortelainen, P., Downing, J. A., Middelburg, J. J., and Melack, J.: Plumbing the global carbon cycle: Integrating inland waters into the terrestrial carbon budget, Ecosystems, 10, 171–184, https://doi.org/10.1007/s10021-006-9013-8, 2007.
Convention on Wetlands: Global Wetland Outlook: Special Edition 2021, edited by: Dudley, N., Secretariat of the Convention on Wetlands, Gland, Switzerland, 98–100, https://doi.org/10.2307/jj.9561408.32, 2021.
Dauner, A. L. L, Kankainen, M. O. A., Väkevä, S., Asmala, E., Järvinen, M., Koho, K., and Jilbert, T.: Grain size, dry bulk density and organic carbon from samples of sediment cores retrieved in Finnish lakes, PANGAEA [data set], https://doi.org/10.1594/PANGAEA.986726, 2025a.
Dauner, A. L. L., Kankainen, M. O. A., Väkevä, S., Asmala, E., Järvinen, M., Koho, K., and Jilbert, T.: Sedimentary organic carbon and environmental characteristics of vegetated shoreline from Finnish lakes, PANGAEA [data set], https://doi.org/10.1594/PANGAEA.986727, 2025b.
Duarte, C. M., Middelburg, J. J., and Caraco, N. F.: Major role of marine vegetation on the oceanic carbon cycle C, Biogeosciences, 2, 1–8, https://doi.org/10.5194/bg-2-1-2005, 2005.
DVV: Digija väestötietovirasto (Digital and Population Information Agency of Finland), Finland shapefile, https://www.avoindata.fi/data/fi/dataset/, 2021, last access: 25 May 2023.
Fagherazzi, S. and Wiberg, P. L.: Importance of wind conditions, fetch, and water levels on wave-generated shear stresses in shallow intertidal basins, J. Geophys. Res.-Earth Surf., 114, F03022, https://doi.org/10.1029/2008JF001139, 2009.
FMI database: Finnish Meteorological Institute: FMI database: https://en.ilmatieteenlaitos.fi/download-observations (last access: 9 August 2024), 2024.
Glückert, G.: On deglaciation between Pieksämäki and Pielavesi in central Finland, Bull. Geol. Soc. Finl., 46, 43–51, https://doi.org/10.17741/bgsf/46.1.007, 1974.
Grasset, C., Mesman, J. P., Tranvik, L. J., Maranger, R., and Sobek, S.: Contribution of lake littoral zones to the continental carbon budget, Nat. Geosci., 18, 747–752, https://doi.org/10.1038/s41561-025-01739-8, 2025.
Green, M. O. and Coco, G.: Review of wave-driven sediment resuspension and transport in estuaries Reviews of Geophysics, Eos, Trans. Am. Geophys., 52, 77–117, https://doi.org/10.1002/2013RG000437, 2014.
GTK: Geological Survey of Finland, Maankamara, https://gtkdata.gtk.fi/maankamara/ (last access: 3 April 2024), 2024.
Gurwick, N. P., Groffman, P. M., Yavitt, J. B., Gold, A. J., Blazejewski, G., and Stolt, M.: Microbially available carbon in buried riparian soils in a glaciated landscape, Soil Biol. Biochem., 40, 85–96, https://doi.org/10.1016/j.soilbio.2007.07.007, 2008.
Hayes, M. O.: An exposure index for oiled shorelines, Spill Sci. Technol. Bull., 3, 139–147, https://doi.org/10.1016/S1353-2561(96)00014-X, 1996.
Hijmans, R. J., Bivand, R., Cordano, E., Dyba, K., Pebesma, E., and Sumner, M. D.: terra: Spatial Data Analysis. R package version 1.7-83, https://cran.r-project.org/web/packages/terra/index.html (last access: 27 January 2025), 2024.
Hyvärinen, H.: The deglaciation history of eastern Fennoscandia - recent data from Finland, Boreas, 2, 85–102, https://doi.org/10.1111/j.1502-3885.1973.tb00975.x, 1973.
Järvi-meriwiki: Oulujärvi: https://www.jarviwiki.fi/wiki/Oulujärvi_(yhd.), last access: 29 September 2025.
Junna, T., Asmala, E., Mäkinen, J., Kortelainen, P., Jilbert, T., and Koho, K.: Land use as a key driver of increased organic carbon burial in boreal lakes, Biogeochemistry, 168, 1–16, 2025.
Kairesalo, T. and Vakkilainen, K.: Lake Vesijärvi and the City of Lahti (southern Finland) comprehensive interactions between the lake and the coupled human community, SIL news, 41, 1–12, 2004.
Kankaala, P., Ojala, A., and Käki, T.: Temporal and spatial variation in methane emissions from a flooded transgression shore of a boreal lake, Biogeochemistry, 68, 297–311, https://doi.org/10.1023/B:BIOG.0000031030.77498.1f, 2004.
Karimpour, A., Chen, Q., and Twilley, R. R.: Wind wave behavior in fetch and depth limited estuaries, Sci. Rep., 7, 40654, https://doi.org/10.1038/srep40654, 2017.
Keil, R. G. and Cowie, G. L.: Organic matter preservation through the oxygen-deficient zone of the NE Arabian Sea as discerned by organic carbon:mineral surface area ratios, Mar. Geol., 161, 13–22, https://doi.org/10.1016/S0025-3227(99)00052-3, 1999.
Keil, R. G., Montluçon, D. B., Prahl, F. G., and Hedges, J. I.: Sorptive preservation of labile organic matter in marine sediments, Lett. Nat., 370, 549–551, 1994.
Kennedy, H., Pagès, J. F., Lagomasino, D., Arias-Ortiz, A., Colarusso, P., Fourqurean, J. W., Githaiga, M. N., Howard, J. L., Krause-Jensen, D., Kuwae, T., Lavery, P. S., Macreadie, P. I., Marbà, N., Masqué, P., Mazarrasa, I., Miyajima, T., Serrano, O., and Duarte, C. M.: Species traits and geomorphic setting as drivers of global soil carbon stocks in seagrass meadows, Global Biogeochem. Cy., 36, 1–18, https://doi.org/10.1029/2022GB007481, 2022.
Keränen, R., Riihimäki, J., Asunmaa, A., Madekivi, O., Hellsten, S., Alasaarela, E., and Seppänen, E.: Oulujärven rantojen kasvillisuuden kehittyminen ja käyttöedellytysten parantaminen, Vesija ympäristöhallituksen monistesarja, Helsinki, 104 pp., ISBN: 951-47-5585-5, 1992.
Koponen, S., Väkevä, S., Jokinen, A.-P., Virtanen, E., Viitasalo, M., Blenckner, T., and Cervo, A. de: Blue Carbon Habitats – a comprehensive mapping of Nordic salt marshes for estimating Blue Carbon storage potential, Nordic Council of Ministers, 33 pp., https://doi.org/10.6027/temanord2022-506, 2022.
Kortelainen, P., Pajunen, H., Rantakari, M., and Saarnisto, M.: A large carbon pool and small sink in boreal Holocene lake sediments, Glob. Change Biol., 10, 1648–1653, https://doi.org/10.1111/j.1365-2486.2004.00848.x, 2004.
Lamont-Smith, T. and Waseda, T.: Wind wave growth at short fetch, J. Phys. Oceanogr., 38, 1597–1606, https://doi.org/10.1175/2007JPO3712.1, 2007.
Leonard, L. A. and Luther, M. E.: Flow hydrodynamics in tidal marsh canopies, Limnol. Oceanogr., 40, 1474–1484, https://doi.org/10.4319/lo.1995.40.8.1474, 1995.
Leonard, L. A., Wren, P. A., and Beavers, R. L.: Flow dynamics and sedimentation in Spartina alterniflora and Phragmites australis marshes of the Chesapeake Bay, Wetlands, 22, 415–424, https://doi.org/10.1672/0277-5212(2002)022[0415:FDASIS]2.0.CO;2, 2002.
Li, H. and Yang, S. L.: Trapping effect of tidal marsh vegetation on suspended sediment, Yangtze Delta, J. Coast. Res., 25, 915–924, https://doi.org/10.2112/08-1010.1, 2009.
Lunkka, J. P., Ojala, A. E. K., Kaakinen, A., Hovikoski, J., Kultti, S., Kuosmanen, N., Palmu, J. P., Putkinen, N., Sarala, P., and Virtasalo, J.: Stratigraphic framework for the classification of Quaternary deosits in Finland, Geol. Surv. Finl. Bull., 418, 77–143, 2024.
Marchand, P. and Gill, D.: waver: Calculate Fetch and Wave Energy, R package version 0.3.0, https://cran.r-project.org/web/packages/waver/index.html (last access: 27 January 2025), 2023.
Marschner, I. and Donoghoe, M. W.: glm2: Fitting Generalized Linear Models, R package version 1.2.1, https://cran.r-project.org/web/packages/glm2/index.html (last access: 24 October 2024), 2022.
Maxwell, T. L., Rovai, A. S., Adame, M. F., Adams, J. B., Álvarez-Rogel, J., Austin, W. E. N., Beasy, K., Boscutti, F., Böttcher, M. E., Bouma, T. J., Bulmer, R. H., Burden, A., Burke, S. A., Camacho, S., Chaudhary, D. R., Chmura, G. L., Copertino, M., Cott, G. M., Craft, C., Day, J., de los Santos, C. B., Denis, L., Ding, W., Ellison, J. C., Ewers Lewis, C. J., Giani, L., Gispert, M., Gontharet, S., González-Pérez, J. A., González-Alcaraz, M. N., Gorham, C., Graversen, A. E. L., Grey, A., Guerra, R., He, Q., Holmquist, J. R., Jones, A. R., Juanes, J. A., Kelleher, B. P., Kohfeld, K. E., Krause-Jensen, D., Lafratta, A., Lavery, P. S., Laws, E. A., Leiva-Dueñas, C., Loh, P. S., Lovelock, C. E., Lundquist, C. J., Macreadie, P. I., Mazarrasa, I., Megonigal, J. P., Neto, J. M., Nogueira, J., Osland, M. J., Pagès, J. F., Perera, N., Pfeiffer, E. M., Pollmann, T., Raw, J. L., Recio, M., Ruiz-Fernández, A. C., Russell, S. K., Rybczyk, J. M., Sammul, M., Sanders, C., Santos, R., Serrano, O., Siewert, M., Smeaton, C., Song, Z., Trasar-Cepeda, C., Twilley, R. R., Van de Broek, M., Vitti, S., Antisari, L. V., Voltz, B., Wails, C. N., Ward, R. D., Ward, M., Wolfe, J., Yang, R., Zubrzycki, S., Landis, E., Smart, L., Spalding, M., and Worthington, T. A.: Global dataset of soil organic carbon in tidal marshes, Sci. Data, 10, 797, https://doi.org/10.1038/s41597-023-02633-x, 2023.
Mendonça, R., Müller, R. A., Clow, D., Verpoorter, C., Raymond, P., Tranvik, L. J., and Sobek, S.: Organic carbon burial in global lakes and reservoirs, Nat. Commun., 8, 1–6, https://doi.org/10.1038/s41467-017-01789-6, 2017.
Milliman, J. D.: Organic matter content in U.S. Atlantic continental slope sediments: Decoupling the grain-size factor, Deep-Sea Res. Pt. II, 41, 797–808, https://doi.org/10.1016/0967-0645(94)90049-3, 1994.
Mohamed Anas, M. U., Scott, K. A., and Wissel, B.: Carbon budgets of boreal lakes: state of knowledge, challenges, and implications, Environ. Rev., 23, 275–287, 2015.
Murphy, K. J.: Plant communities and plant diversity in softwater lakes of northern Europe, Aquat. Bot., 73, 287–324, https://doi.org/10.1016/S0304-3770(02)00028-1, 2002.
Murtojärvi, M., Suominen, T., Tolvanen, H., Leppänen, V., and Nevalainen, O. S.: Quantifying distances from points to polygons-applications in determining fetch in coastal environments, Comput. Geosci., 33, 843–852, https://doi.org/10.1016/j.cageo.2006.10.006, 2007.
Nahlik, A. M. and Fennessy, M. S.: Carbon storage in US wetlands, Nat. Commun., 7, 1–9, https://doi.org/10.1038/ncomms13835, 2016.
Nikora, V., Larned, S., Debnath, K., Cooper, G., and Reid, M.: Hydraulic resistance due to aquatic vegetation in small streams: Field study, J. Hydraul. Eng., 134, 1326–1332, 2008.
Noori, R., Bateni, S. M., Saari, M., Almazroui, M., and Torabi Haghighi, A.: Strong warming rates in the surface and bottom layers of a boreal lake: Results from approximately six decades of measurements (1964–2020), Earth Sp. Sci., 9, https://doi.org/10.1029/2021EA001973, 2022.
Ojala, A. E. K., Luoto, T. P., and Virtasalo, J. J.: Establishing a high-resolution surface sediment chronology with multiple dating methods – Testing 137Cs determination with Nurmijärvi clastic-biogenic varves, Quat. Geochronol., 37, 32–41, https://doi.org/10.1016/j.quageo.2016.10.005, 2017.
Finnish National Geoportal (Orthophotos): https://kartta.paikkatietoikkuna.fi/?lang=en, last access: 17 July 2023.
Pajunen, H.: Carbon in Finnish lake sediments, Vammalan Kirjapaino Oy, Espoo, ISBN: 951-690-781-4, 2000.
Partanen, S., Keto, A., Visuri, M., Tarvainen, A., Riihimäki, J., and Hellsten, S.: The relationship between water level fluctuation and distribution of emergent aquatic macrophytes in large, mildly regulated lakes in the Finnish Lake District, SIL Proceedings, 1922–2010, 29, 1160–1166, https://doi.org/10.1080/03680770.2005.11902867, 2006.
QGIS Development Team: QGIS Geographic Information System: Open Source Geospatial Foundation Project, Version 3.28.4-Firenze, http://qgis.org (last access: 20 February 2025), 2024.
R Core Team: R: A language and environment for statistical computing (version 4.3.3), https://www.r-project.org/ (last access: 4 May 2026), 2024.
Rainio, H., Saarnisto, M., and Ekman, I.: Younger Dryas end moraines in Finland and NW Russia, Quaternary Int., 28, 179–192, https://doi.org/10.1016/1040-6182(95)00051-J, 1995.
Regnier, P., Resplandy, L., Najjar, R. G., and Ciais, P.: The land-to-ocean loops of the global carbon cycle, Nature, 603, 401–410, https://doi.org/10.1038/s41586-021-04339-9, 2022.
Repo, R. and Tynni, R.: Observations on the Quaternary geology of an area between the 2nd Salpausselkä and the ice-marginal formation of central Finland, Bull. Geol. Soc. Finl., 43, 185–202, https://doi.org/10.17741/bgsf/43.2.005, 1971.
van Rijn, L. C.: Principles of sediment transport in rivers, estuaries and coastal seas, Aqua Publications, Amsterdam, 690 pp., ISBN: 90-800356-2-9, 1993.
Silan, G., Buosi, A., Bertolini, C., and Sfriso, A.: Dynamics and drivers of carbon sequestration and storage capacity in Phragmites australis-dominated wetlands, Estuar. Coast. Shelf Sci., 298, 108640, https://doi.org/10.1016/j.ecss.2024.108640, 2024.
Stanley, D. J. and Hait, A. K.: Deltas, radiocarbon dating, and measurements of sediment storage and subsidence, Geology, 28, 295–298, 2000.
Sutfin, N. A., Wohl, E. E., and Dwire, K. A.: Banking carbon: A review of organic carbon storage and physical factors influencing retention in floodplains and riparian ecosystems, Earth Surf. Process. Landf., 41, 38–60, https://doi.org/10.1002/esp.3857, 2016.
Syke: Finnish Environmental Institute, Ecological status of surface waters 2019 – Finland, https://www.vesi.fi/en/karttapalvelu/ (last access: 17 January 2025), 2019.
Syke: Finnish Environmental Institute: VALUE – valuma-alueen rajaustyökalu (watershed delineation tool), https://paikkatieto.ymparisto.fi/value/ (last access: 21 January 2025), 2024.
Syke: Finnish Environmental Institute, Hertta database of Syke, 3rd River Basin Management Plan, data from 2012–2017, https://www.syke.fi/fi-fi/avoin_/ymparistotietojarjestelmat (last access: 21 January 2025), 2025.
Tangen, B. A. and Bansal, S.: Soil organic carbon stocks and sequestration rates of inland, freshwater wetlands: Sources of variability and uncertainty, Sci. Total Environ., 749, 141444, https://doi.org/10.1016/j.scitotenv.2020.141444, 2020.
Taran, M., Ahirwal, J., Deb, S., and Sahoo, U. K.: Variability of carbon stored in inland freshwater wetland in Northeast India, Sci. Total Environ., 859, 160384, https://doi.org/10.1016/j.scitotenv.2022.160384, 2023.
Tikkanen, M.: The changing landforms of Finland, Fennia, 180, 21–30, 2002.
Tikkanen, M.: The landforms of Finland, in: Finland – land of mires, edited by: Lindholm, T. and Heikkilä, R., Finnish Environment Institute, 27–38, 2006.
Tranvik, L. J., Cole, J. J., and Prairie, Y. T.: The study of carbon in inland waters – from isolated ecosystems to players in the global carbon cycle, Limnol. Oceanogr. Lett., 3, 41–48, https://doi.org/10.1002/lol2.10068, 2018.
Turunen, J., Hellsten, S., and Marttunen, M.: Oulujoen vesistöalueen säännös-teltyjen järvien säännöstely-suositusten toteutuminen, ARVOVESI-hankkeen raportti, 5, 1–63, 2022.
Verpoorter, C., Kutser, T., Seekell, D. A., and Tranvik, L. J.: A global inventory of lakes based on high-resolution satellite imagery, Geophys. Res. Lett., 41, 6396–6402, https://doi.org/10.1002/2014GL060641, 2014.
Wang, H. J., Wang, H. Z., Liang, X. M., Pan, B. Z., and Kosten, S.: Macrophyte species strongly affects changes in C, N, and P stocks in shallow lakes after a regime shift from macrophyte to phytoplankton dominance, Inl. Waters, 6, 449–460, https://doi.org/10.1080/IW-6.3.837, 2016.
Wickham, H.: ggplot2: Elegant Graphics for Data Analysis. R package version 3.5.0, Springer-Verlag New York, https://ggplot2.tidyverse.org/ ( last access: 4 May 2026), 2016.