
the Creative Commons Attribution 4.0 License.
the Creative Commons Attribution 4.0 License.
 | 06 Jul 2026
Livestock grazing, plant community and abiotic factors shape blue carbon stocks in Nordic coastal marshes
Anaïs Richard
Carmen Leiva-Dueñas
Christoffer Boström
Beke K. Eichert
Annie Garnell
Nadja H. Nijm
Line Holm Andersen
Kai Jensen
Heli Jutila
Dorte Krause-Jensen
Nathalie Labourdette
Marianna Lanari
Ella L. Logemann
Katrin Moeller
Mikael von Numers
Gry Frederiksberg
Sofia A. Wikström
Cintia Organo Quintana
Gary Thomas Banta
Johan S. Eklöf
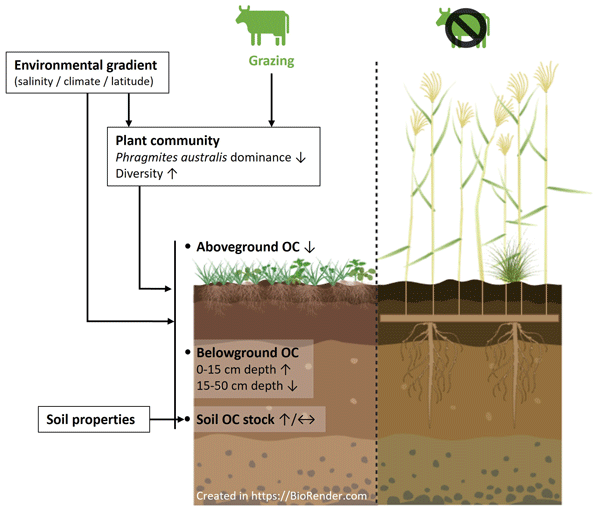
Coastal marshes are key habitats contributing to organic carbon (OC) storage but remain understudied in Nordic regions regarding Blue Carbon processes. This study quantified OC stocks in above- and below-ground plant biomass and in the top 50 cm-soil across 12 grazed and ungrazed marshes, spanning a major environmental gradient, and assessed how biotic (plant communities, livestock grazing) and abiotic (soil properties, environmental conditions) drivers shape OC storage. Soil OC stocks accounted for ∼ 73 % of total OC in grazed sites and ∼ 63 % in ungrazed ones and was higher in grazed sites (99.7 ± 57.9 Mg ha−1) than in ungrazed sites (78.2 ± 44.2 Mg ha−1). Grazing and the large-scale environmental gradient strongly structured plant communities, partly by regulating reed (Phragmites australis), prevalent in ungrazed sites. Abiotic soil properties were major large-scale drivers of soil OC storage, while grazing affected soil OC storage indirectly through plant composition. Soil OC increased with finer textures, whereas vegetation and grazing effects were variable and locally expressed. Aboveground OC stocks were reduced by grazing, both directly through biomass removal and indirectly by reducing reed dominance. Belowground OC stocks were driven by plant community composition and indirectly by grazing effects on vegetation. Root biomass was concentrated in the top 15 cm in grazed sites and deeper (15–50 cm) in ungrazed sites, reflecting contrasting plant strategies. Overall, soil OC stocks in Nordic coastal marshes fall within the lower range of global estimates. These findings highlight the need to consider soil processes, grazing and environmental gradients in the sustainable management of Nordic coastal marshes and their carbon storage potential.
- Article
(3353 KB) - Full-text XML
-
Supplement
(725 KB) - BibTeX
- EndNote


Salt marshes, or coastal marshes, are key vegetated habitats in the land-sea continuum that, along with seagrass meadows and mangroves, represent so-called “Blue Carbon” (BC) ecosystems (Mcleod et al., 2011; Nellemann et al., 2009). Their high primary production converts atmospheric carbon dioxide (CO2) into plant biomass. Both their anoxic soil conditions, slowing down microbial degradation, and their capacity to trap allochthonous organic matter during flooding contribute to their high carbon sequestration potential and long-term storage of organic carbon (hereafter, OC) (Duarte et al., 2013; Kristensen and Holmer, 2001; Mcleod et al., 2011). Overall, coastal marshes can store 0.4–6.5 Gt of OC, with a global average sequestration rate of 245 g C m−2 yr−1 (Duarte et al., 2013; Ouyang and Lee, 2014; Wang et al., 2021). Coastal marshes also provide other important ecosystem services, such as coastal protection, improved water quality, and provisioning of food and shelter for diverse associated faunal communities (Friess et al., 2020). Simultaneously, their position at the land-sea interface makes them one of the most vulnerable habitats, due to anthropogenic pressures. Particularly concerning are local pressures such as eutrophication and construction, and their largely unknown interactive effects with global change induced stressors such as accelerated rates of sea-level rise, heat waves, and storms (Canal-Vergés et al., 2025; Deegan et al., 2012; Kirwan and Megonigal, 2013; Valiela et al., 2018; Spivak et al., 2019). Coastal marshes global annual loss rate averaged 0.28 % between 2000 and 2019 (Campbell et al., 2022) and in Europe they are assessed as threatened in the Red List of European Habitats (Janssen et al., 2016). The degradation and conversion of these areas can reduce the capacity of coastal marshes to sequester OC and may even increase the decomposition of OC stored in their soils, leading to CO2 emissions into the atmosphere (Macreadie et al., 2021). Given the major global losses of these carbon- and biodiversity-rich habitats, the preservation and restoration of coastal marshes is promoted as nature-based solutions to support climate change mitigation and biodiversity (Calvin et al., 2023; Hiraishi et al., 2014).
Despite the high number of studies conducted worldwide on coastal marshes in a BC context, coastal marshes of the Nordic region (northern Europe) have been almost neglected in terms of soil processes, with limited quantification of OC stocks, constrained knowledge of temporal trends, and only local restoration efforts (Duarte De Paula Costa and Macreadie, 2022; Krause-Jensen et al., 2022; Zhong et al., 2023). Coastal marshes across the Baltic Sea region represent wide gradients in salinity, climate, exposure and tidal fluctuations creating diverse and regionally unique plant communities from the shores of the North Sea to the inner Baltic Sea (Dijkema, 1990; Lehmann et al., 2002; Vehmaa et al., 2024). Although vegetation of coastal ecosystems in northern Europe has been studied (mainly from a plant ecology perspective), coastal marshes have not been consistently classified as salt marshes, mainly due to different uses of terminology, which may have contributed to the limited attention on these ecosystems in global blue carbon context (Pätsch et al., 2019; Vehmaa et al., 2024). Coastal marshes in this region have a long history of grazing by livestock, which has also been used as a management tool for nature conservation (Davidson et al., 2017). This management practice is a key factor influencing the structure and function of plant communities (Burnside et al., 2007; Davidson et al., 2017). In general, grazing may enhance small-scale salt marsh plant diversity (Wanner et al., 2014) and limit reed growth, especially the competitive species common reed Phragmites australis (Burnside et al., 2007; Jutila, 1999). This type of management has gradually decreased in some areas, mainly due to change in land use, although it remains a common practice in Nordic countries especially in nature conservation areas (Bakker et al., 2003; Dijkema, 1990).
Previous studies on the carbon storage potential of coastal marshes have mainly focused on abiotic factors such as geomorphology, salinity, water level fluctuation, or the amount of suspended sediment (Kelleway et al., 2016; Macreadie et al., 2017; Ouyang and Lee, 2014). In contrast, the effect of biotic drivers, including plant community composition, diversity and grazing, on BC processes and OC stocks has only more recently been considered and remains less well understood (Ford et al., 2019; Graversen et al., 2022; Leiva-Dueñas et al., 2024; Martinetto et al., 2023). Existing studies suggest that effects of plant diversity on carbon storage in coastal marshes are largely indirect and context dependent. While higher plant diversity may enhance productivity or sediment trapping in some systems, soil OC stocks are more consistently explained by plant functional composition, with different dominant species traits such as root strategies, and by environmental constraints (De Deyn et al., 2008; Ford et al., 2019; Graversen et al., 2022; Yapp et al., 2010). Similarly, grazing has been shown to exert both positive and negative effects on OC storage potential of coastal marshes, leading to highly site-specific outcomes that reflect interacting effects on vegetation structure and soil processes (Davidson et al., 2017; Elschot et al., 2015; Ford et al., 2019; Graversen et al., 2022; Leiva-Dueñas et al., 2024; Logemann et al., 2025; Mueller et al., 2019).
Given that coastal marshes are exposed to marked environmental gradients and two dominant management strategies (grazed vs. ungrazed) across Nordic coasts, these systems provide a unique opportunity to disentangle the combined effects of biotic and abiotic factors on BC stocks. This study aims to (1) quantify above- and belowground biomass and soil OC stocks across Nordic countries in grazed and ungrazed coastal marshes, and (2) assess how soil characteristics, grazing and plant community richness and composition influence carbon storage along the strong gradient in salinity, climate and tidal regime from the North Sea to the inner Baltic Sea. We hypothesized that (i) the large-scale environmental gradient and cattle grazing shape plant community structure across sites and modify plant OC stocks, and (ii) soil properties and the environmental gradient are the main predictors of overall soil OC stock levels, while the effects of grazing are more complex, involving multiple direct and indirect pathways, particularly through changes in plant community composition.
2.1 Study sites
Twelve coastal marshes were selected (each represented by one grazed and one ungrazed site) along the coasts of Norway, Finland, Sweden and Denmark (Fig. 1). The habitats in these marshes belong to A2.5 Salt marshes and coastal reed beds in EUNIS classification (European Environment Agency, 2022) or to the categories with the code 1310 (Salicornia and other annuals colonizing mud and sand), 1320 (Spartina swards), 1330 (Atlantic salt meadows) or 1630 (Boreal Baltic coastal meadows) in the Habitats Directive Annex I classification (European Commission, 2013). The sampled sites covered a wide range of environmental conditions, including differences in salinity, temperature, and land uplift (Leiva-Dueñas et al., 2026). Along the Baltic Sea, salinity and temperature are decreasing towards the north (up to oligohaline sites), whereas land uplift is increasing (Table 1). Being located at the Atlantic coast, Trondheim in Norway deviates from the gradient, with the highest salinity (euhaline) but low temperature and high land uplift compared to the polyhaline stations in the southern Baltic Sea. Trondheim is the area with the highest tidal amplitude, contrasting with the microtidal regime in most parts of the Baltic Sea, where sea level fluctuations are irregular and primarily driven by air pressure and wind. At each area, one ungrazed and grazed coastal marsh was sampled. We defined grazed as a site that had been continuously grazed for at least 30 years by cattle, sheep or horses (Fig. 2). The grazed and ungrazed sites were selected in close proximity and were chosen to be as similar as possible in terms of geomorphological setting and landscape position. None of the studied sites were diked or artificially drained.
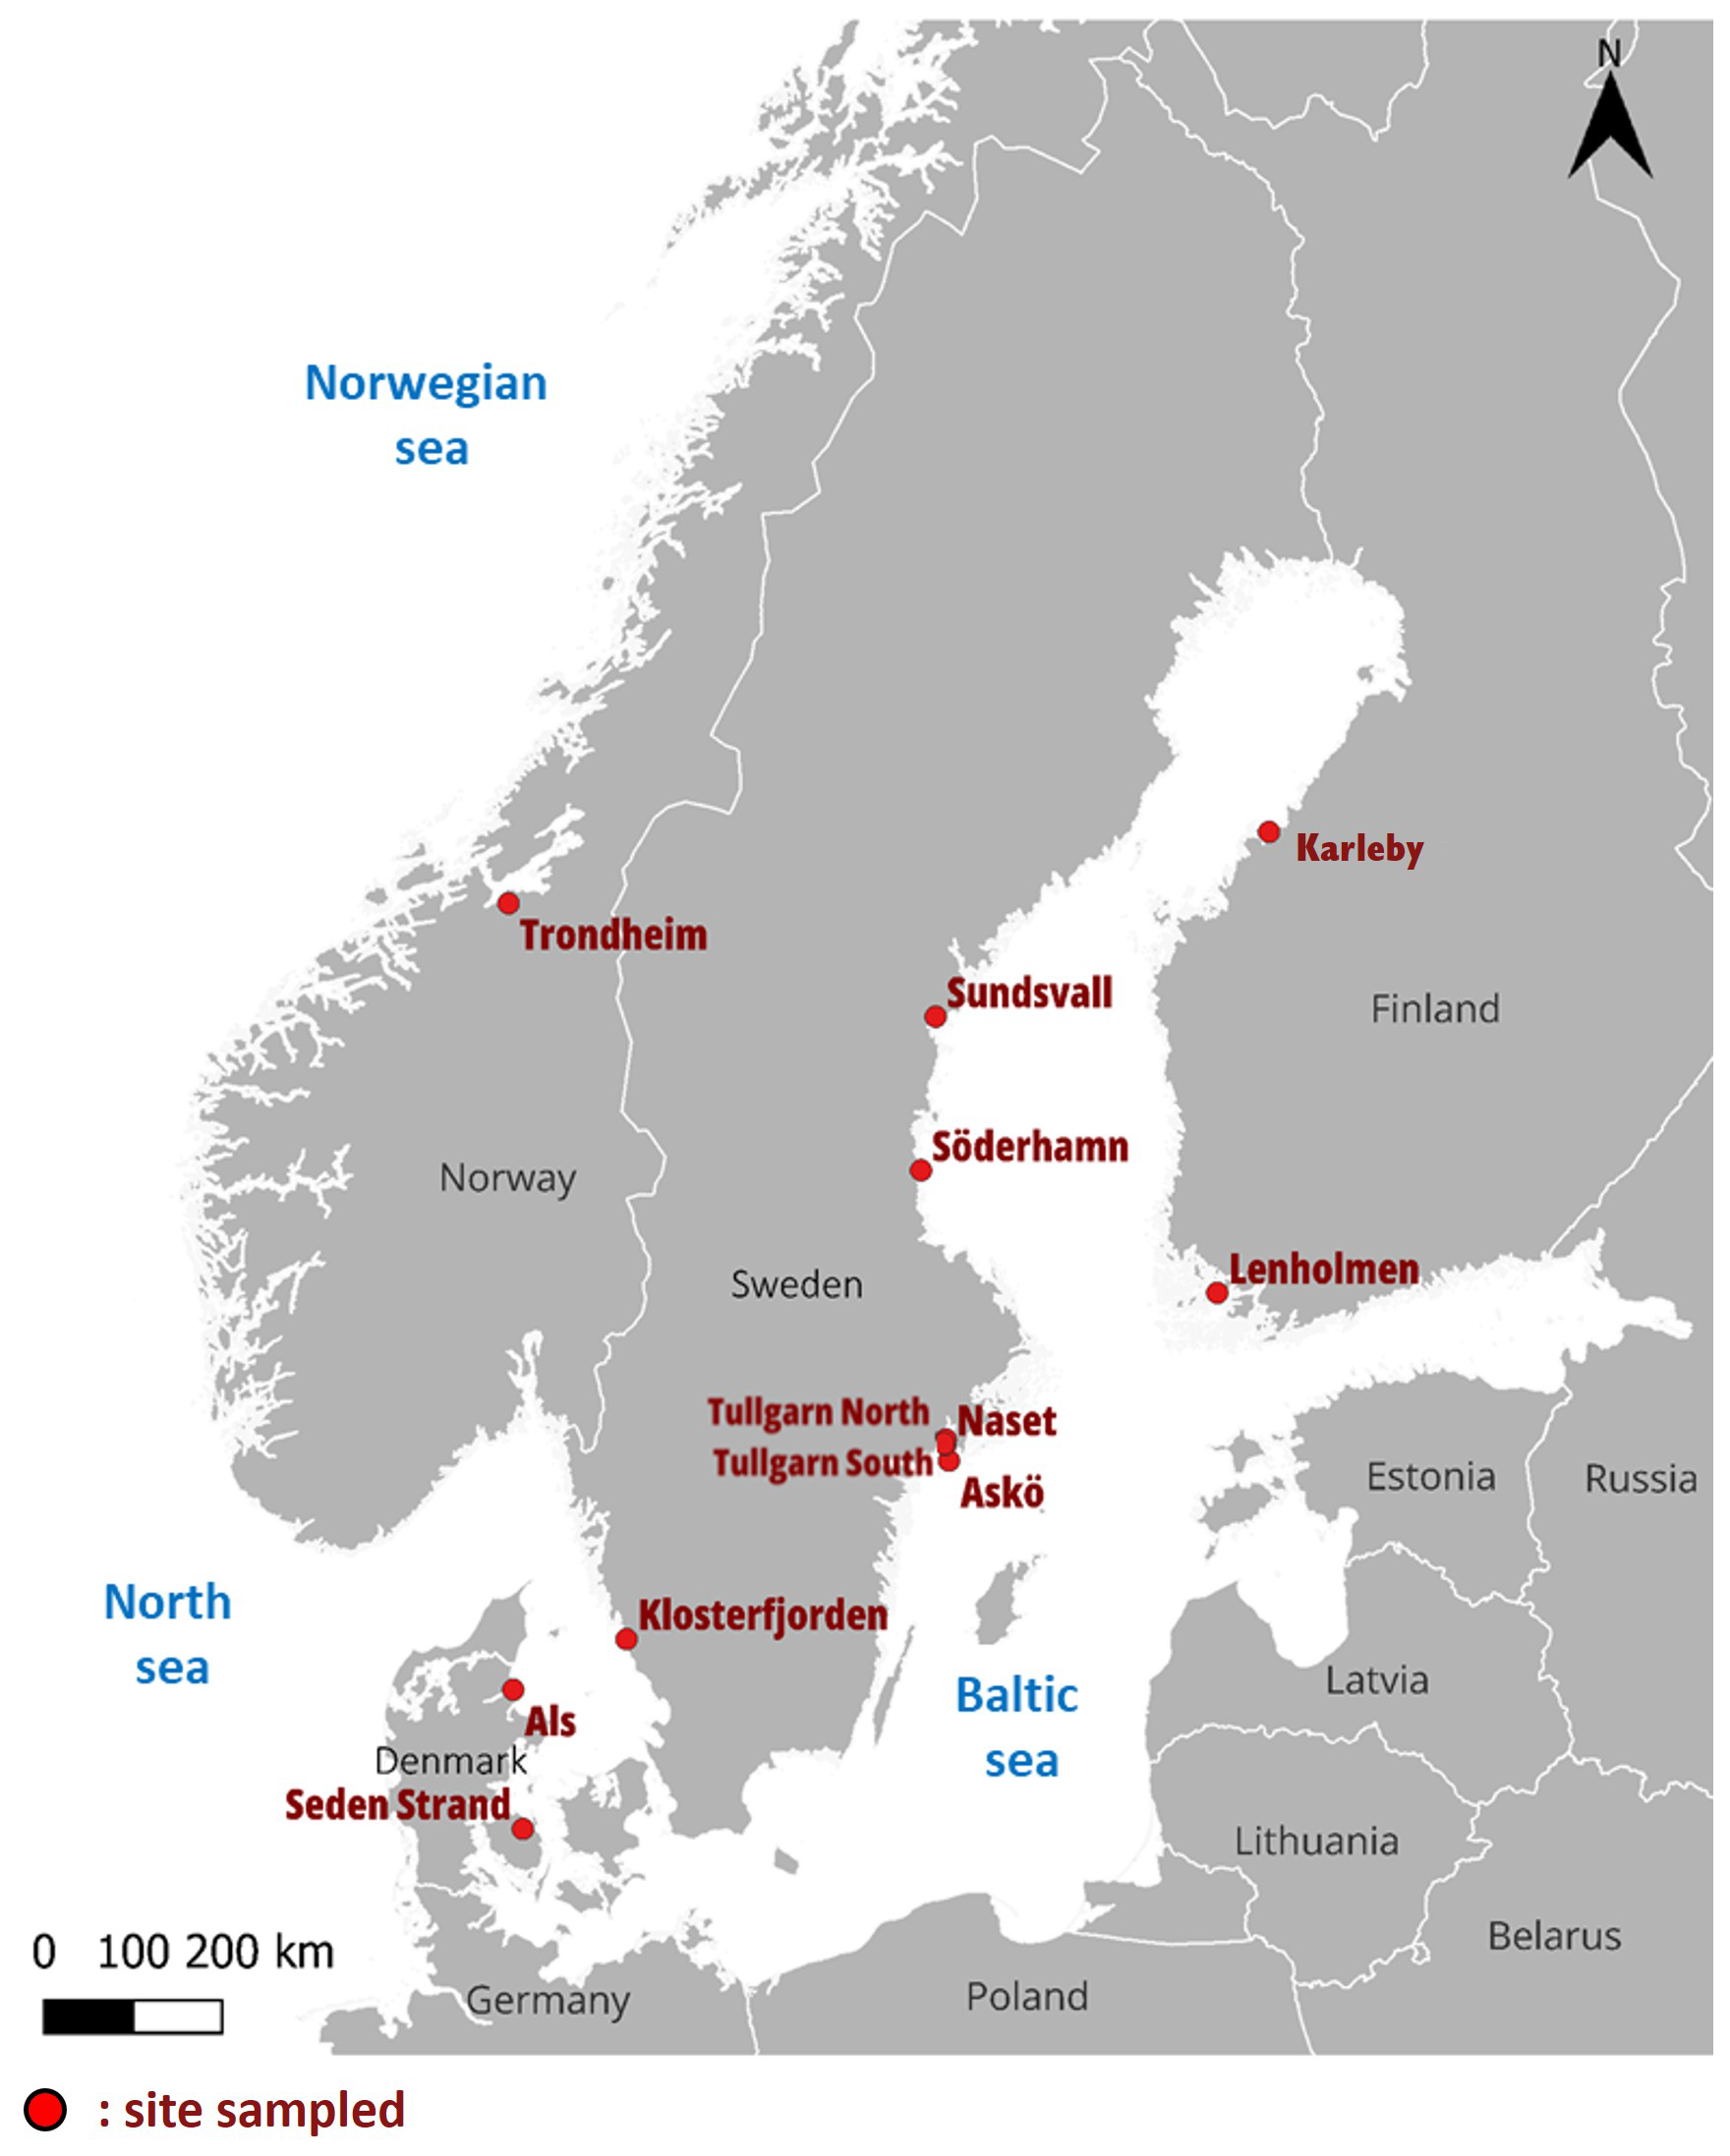
Figure 1Map showing the locations of sampled coastal marshes in the Nordic region (red dots).
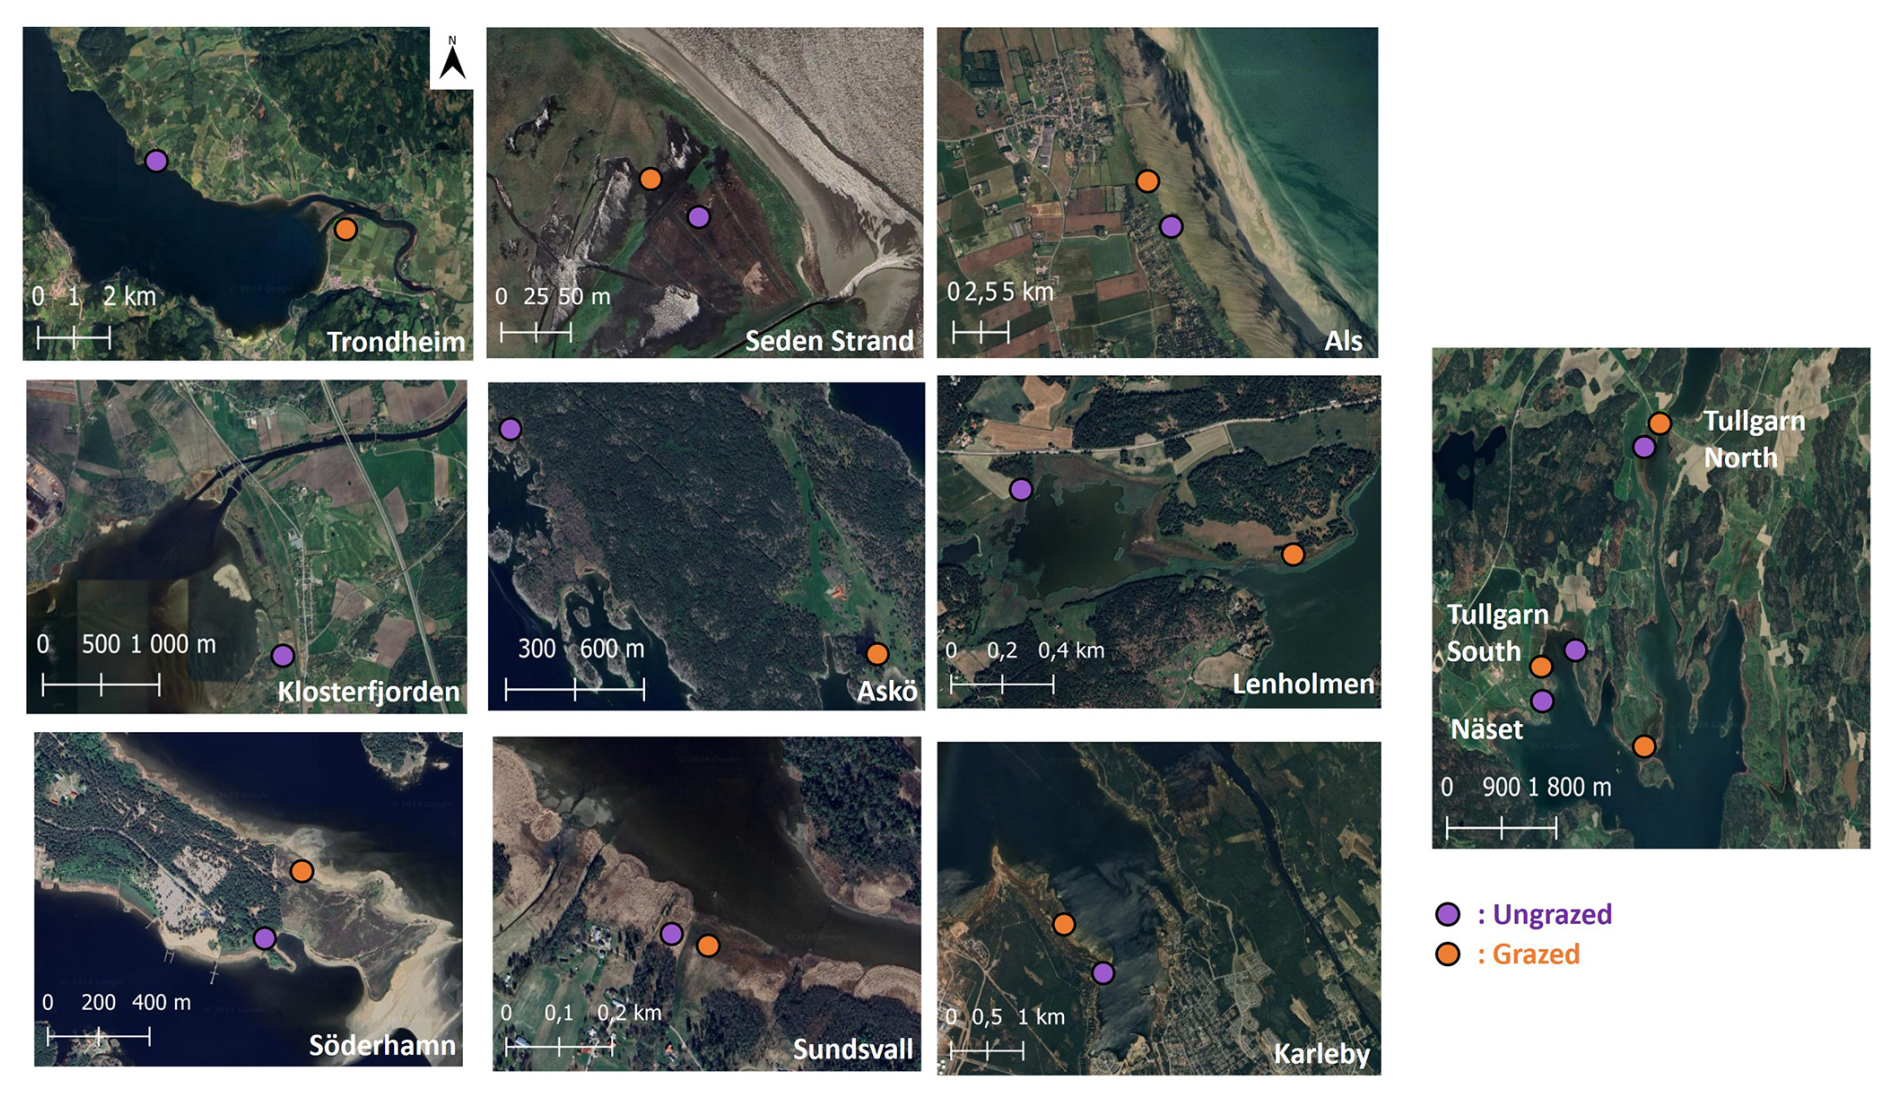
Figure 2Satellite images showing the locations of the 11 grazed (orange dots) and 12 ungrazed (purple dots) coastal marshes investigated. Imagery © 2024 Airbus, CNES/Airbus, Landsat/Copernicus, Maxar Technologies. Map data © 2024 Google. Figure created by the authors using QGIS.
Table 1Information and characteristics of the 12 sampling sites in coastal marshes in the Nordic region. n/a: not applicable.
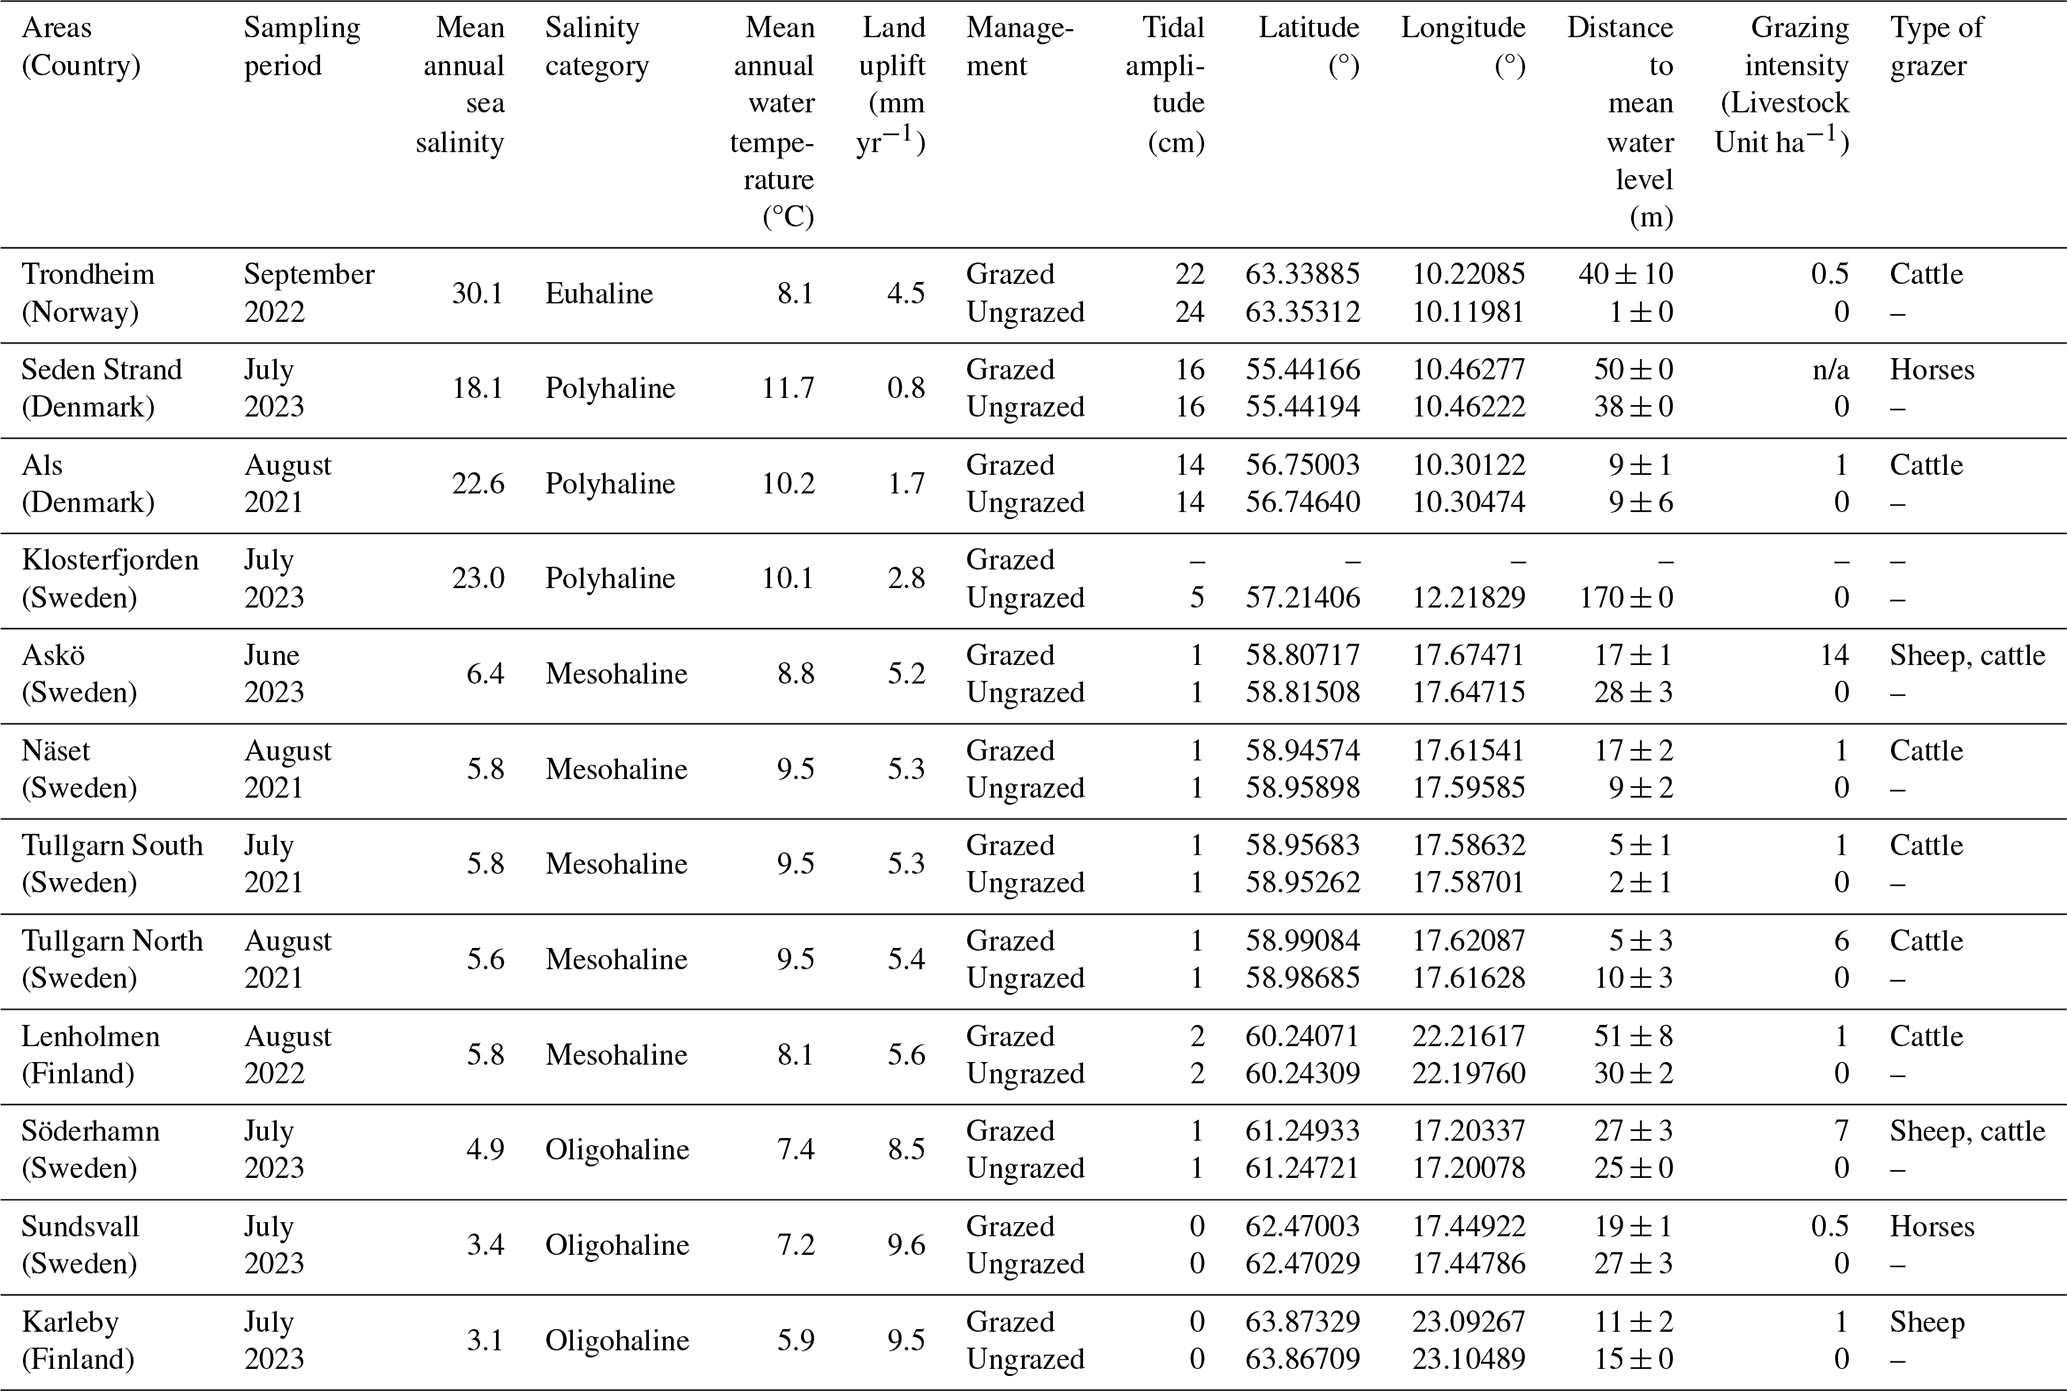
The water temperature and salinity of the sea surface (−0.5 m) correspond to the annual average recorded at the nearest station every three months, from July 2022 to April 2024, according to E.U Copernicus Marine Service Information (https://doi.org/10.48670/moi-00016, https://doi.org/10.48670/moi-00015). Salinity categories according to Cowardin et al. (1979). Land uplift values are relative to geoid from NKG2016LU model (Vestøl et al., 2019). Tide amplitude was extracted from FES2014 Tide Model. The measured distance from sampling point to the shoreline at mean sea level values corresponds to the mean ± standard deviation (n= 3). Grazing intensity is expressed in livestock unit per hectare, where one cattle is equivalent to one horse, two calves and ten medium-sized sheep (Leiva-Dueñas et al., 2026; Burnside et al., 2007; Countryside Stewardship: Mid Tier and Wildlife Offers manual for agreements starting on 1 January 2023, Annex 6C, UK payments agency).
2.2 Field sampling
Sampling took place in summer 2021, 2022 and 2023, in the low marsh zone, defined as ca. 20 cm above mean sea level (Pennings and Callaway, 1992; Silvestri et al., 2005). Field work followed the recommendations of the Blue Carbon manual (Howard et al., 2014) and are detailed below.
Sampling was carried out in three 1 × 1 m plots per study site, placed randomly parallel to the shoreline in the low marsh zone of each ungrazed and grazed site, and spaced > 5 m apart. The position of each quadrat relative to mean water level was checked in the field to ensure that sampling occurred within the same elevation range in the paired grazed and ungrazed sites. In total 36 plots were deployed in ungrazed sites (3 plots in the 12 sites), and 33 in grazed sites (3 plots in the 11 sites). The grazed site of Klosterfjorden (Sweden) could not be sampled for logistical reasons. In each quadrat, plants were identified (mostly to species level) and the percentage cover of each taxon was estimated visually. As plant communities can grow in multiple layers and overlap each other, the sum of the cover can exceed 100 %. The maximum vegetation height was measured using a ruler (1 cm accuracy) and the mean vegetation height was estimated visually. Aboveground (AG) biomass was sampled by cutting plant material at the soil surface in the 25 × 25 cm top right corner within each quadrat. In this cut area, soil cores were collected to quantify belowground (BG) biomass and soil variables. For soil sampling, an Eijkelkamp Gouge auger (3 cm in diameter, 1 m long) or plexiglass tubes (5 cm in diameter, 1 m long) were used depending on soil type. To sample an equivalent soil volume, four cores per quadrat were sampled when using the Gouge auger, and two cores when using plexiglass tubes. All cores were then vertically sliced in the field into 5 cm slices above 10 cm depth, and into 10 cm slices below 10 cm depth. For the cores sampled with the Gouge auger, that causes limited soil compaction (Smeaton et al., 2020), layers from the same depth were pooled per quadrat. Slices from the plexiglass tubes were analyzed separately to account for different soil compaction between cores. AG- and BG- biomass and soil samples were stored in a dark cold room (10 °C) for a few days before processing.
2.3 Sample processing and analysis
2.3.1 Above- and below-ground biomass
The harvested AG biomass was rinsed to remove soil and dried at 60 °C for 48 h to estimate AG biomass. The volume of each slice (containing soil and BG biomass) from sampled cores was measured by water displacement (volume measurement). Then, for each slice, the BG biomass was separated from the soil by dry sieving through a 2 mm mesh. The BG biomass was rinsed with water, their volume was measured by water displacement, then dried at 60 °C for 48 h, and weighed to measure the BG biomass per slice. The total BG biomass was calculated by adding the biomass from all slices per core.
2.3.2 Soil characteristics
After removing the BG biomass, gravel and stones > 2 mm, the soil of each slice was weighed before and after drying at 60 °C for 48 h. Dry bulk density (g DW cm−3), dry matter content (%) and water content (%) were calculated using Eqs. (1), (2), and (3):
where DW is the dry weight of soil (g), WW the wet weight of soil (g) and V the decompressed volume of the soil, after correction with compression factor (equation below).
The decompressed depth of each slice was calculated by dividing the compressed depth measured during core slicing from the Plexiglass tubes by the compression factor (no unit), calculated using Eqs. (4) and (5):
where I is the length between the top of the tube and soil surface into the tube (cm), O the length between the top of the tube to sediment surface in field (cm), tube length used during coring (cm), and Lm is the soil depth measured after slicing (cm).
The organic matter (OM) content (%) of each soil slice was determined by loss on ignition (Heiri et al., 2001). A subsample of ∼ 3 g of homogeneous dry soil from each slice was placed in a pre-weighed crucible, and weighed before and after 4 h combustion at 550 °C. The OM content was then determined by the following Eq. (6):
where DWi is the dry weight of soil before combustion (g) and DWf is the dry weight after combustion (g).
Soil grain size composition was measured from one core per grazed and ungrazed site (representing 11 grazed and 12 ungrazed cores) from a subsample of each slice (negligible within-site variation). Subsamples were first dry sieved through 1 mm mesh and weighed. The grain size was then measured using a laser diffraction particle size analyzer (Mastersizer 3000, Malvern Panalytical Ltd., Malvern, UK), with the addition of 3 mL of 10 % sodium metaphosphate (NaO3P) to de-aggregate the grains. To characterize soil grain size composition, the percentage of silt and clay (< 63 µm) and D50 (µm), representing the grain size where 50 % of the volume sample is below that value, were used to characterize the soil.
2.3.3 Organic carbon and nitrogen stocks
Total organic carbon (TOC) and total nitrogen (TN) content (%) of all AG and BG biomass samples, as well as soil samples from at least one core per site and management type were measured using elemental analyzers (Flash 2000 CN Elemental analyzer for soil samples, and Elemental Analyzer Flash Smart™, for AG and BG biomass; Thermo Scientific™, Waltham, MA, USA). Prior to analysis, the dried samples were homogenized and ground into a fine powder. A subsample was weighed in a tin capsule and sealed to measure TOC (%) for AG and BG biomass, and TN (%) for AG and BG biomass and soil. Simultaneously, soil samples were acidified using 3 mol L−1 HCl (10 %) to remove inorganic carbon. Approximately 50 µL of acid was added to each sample and put in dry oven at 60 °C during 2 h. Thereafter, 50 µL of acid was added again, and samples were then dried at 60 °C over night prior to analysis. This concentration was selected to ensure complete carbonate removal in sediments with potentially variable carbonate content. The acidified subsamples enable the quantification of TOC (%). For the soil samples where TOC and TN content were not measured, they were estimated from OM content, determined by loss of ignition, following the approach of Craft et al. (1991). The correlation between OM content (%) and TOC or TN (%) was based on 514 samples for TOC and 487 samples for TN. The conversion equations are in Figs. S1 and S2 in the Supplement.
AG and BG OC stocks (Mg ha−1) were calculated by multiplying biomass (Mg ha−1) by their respective OC content (%). Total soil organic carbon stocks (Mg ha−1) of each slice were calculated as:
where TOC is soil total organic carbon (%), with the dry bulk density (g DW cm−3) and slice thickness decompressed (cm) of each slice. TOC stocks were computed by summing the stock of each slice over the upper ∼ 50 cm. Although organic-rich marsh soils in Nordic systems are often shallow (Leiva-Dueñas et al., 2026), stocks were integrated over the upper 50 cm to capture the biologically active rooting zone of dominant marsh vegetation, including deep-rooting species such as Phragmites australis.
2.3.4 Plant community analyses
Results are presented as means ± standard deviation (SD) of the number n of replicate measurements.
Species richness corresponds to the number of plant species identified in each 1 × 1 m plot. In the aim of assessing how coastal marshes plants influence carbon storage, the plant community richness and composition need to be characterized. Plant diversity was assessed at the quadrat scale to match biomass and soil sampling. This approach was further supported by exploratory comparisons showing that diversity patterns were consistent when calculated at the site scale (i.e. pooled across quadrats), indicating that quadrat-scale diversity adequately represents site-level diversity in this dataset. To determine the plant species diversity per plot, complementary indexes such as the Shannon-Wiener index, Simpson's index and evenness, Pielou evenness and Hill index were calculated, based on the cover percentage of each plant species (Gotelli et al., 2024; Magurran, 2004). Almost all the biodiversity indexes (Shannon-Wiener index, Simpson index and evenness, Pielou evenness, and Hill index) were significantly correlated, as were P. australis cover and mean and maximum vegetation height (Fig. S3). Therefore, the Shannon-Wiener index and mean vegetation height were used as the quantitative variables describing the plant communities, along with plant species richness.
To describe coastal marshes plant community composition in Nordic region across grazed and ungrazed sites, areas, and salinity category, a Non-metric Multidimensional Scaling (NMDS) was applied to plant species cover (%) data. Analyses were based on a Bray-Curtis dissimilarity matrix of log (x+ 1)-transformed data, using the metaMDS function from the vegan package. To characterize NMDS axes and investigate environmental gradients and soil parameters, explanatory variables (mean annual water salinity and temperature, longitude, latitude, land uplift, soil water content, dry bulk density and median grain size) were correlated with NMDS axes by permutation using the envfit function, and only significant variables (p< 0.05) were retained for interpretation. These variables were selected as they represent the main large-scale environmental gradients and local soil conditions known to structure plant communities in coastal marshes.
Indicator values (IndVal) quantify how strongly a species is associated with a specific group of sites. IndVal scores (Dufrêne and Legendre, 1997) were tested using random permutation tests to characterize plant community composition in grazed and ungrazed sites, as well as across salinity categories (oligo-, meso-, poly- and euhaline conditions). These salinity categories represent gradients also in climate, land uplift rate, and tidal amplitude, since these gradients are largely correlated in our dataset (Table 1). IndVal combines species relative coverage and relative frequency of occurrence within each group. An IndVal of 100 % for a given group (e.g. grazed or ungrazed) indicates that the species occurs exclusively in that group and is present in all sites belonging to it. Following Dufrêne and Legendre (1997), species with IndVal ≥ 25 % were considered indicative of a given group, corresponding to a presence in at least 50 % of plots within the group and a relative coverage ≥ 50 %. All indices were calculated using the vegan and labdsv packages in R.
The effects of management type (grazed vs. ungrazed), salinity category, and their interaction on plant community composition (based on Bray-Curtis dissimilarity), plant species richness, Shannon-Wiener index and mean vegetation height (log-transformed) were assessed using two-way PERmutational Multivariate ANalyses Of VAriances (PERMANOVAs) (Anderson, 2001). Each PERMANOVA was performed with management type and water salinity category as fixed factors, and area (12 levels) as a strata, using 9999 permutations and the adonis function in the vegan package in R. Variability among replicates was evaluated with permutest (Anderson, 2006). Because one salinity category (euhaline) was represented by a single site, analyses were repeated excluding the euhaline site (data not shown), indicating that this site did not drive the observed effects. Given potential differences in multivariate dispersion among groups, PERMANOVA results were interpreted together with tests of homogeneity of dispersion (permutest), and supported by NMDS ordination patterns.
2.3.5 Organic carbon and statistical analyses
To determine the main biotic and abiotic predictors of organic carbon (OC) stocks across compartments (AG and BG biomass, and soil), groups of inter-correlated predictor variables were first identified. Non-parametric Spearman rank correlations were calculated separately for plant community descriptors, environmental variables, soil characteristics, and OC stocks, using the corr function. Only significant correlations (p< 0.05) were considered. Spearman correlation showed that the mean salinity was correlated with other environmental variables (Fig. S3) and this abiotic factor was chosen to represent the large-scale gradient in environmental conditions in the analyses of drivers of OC stocks. The median grain size was significantly and negatively correlated to water content and the percentage of soil silt and clay and OM content, and positively to dry matter content and dry bulk density (Fig. S4). Then, three global linear mixed-effects models (one for plant AG OC, one for BG OC, and one for soil OC stocks) were first built using the lmer function in lme4 (Bates et al., 2015; Zuur et al., 2009). Each model used log-transformed OC stocks (log (x+1)) as response variable, with area as a random factor (1| Area). Fixed factors were selected based on Spearman rank correlations and plant community data to minimize multicollinearity, and included: management type, plant species richness, salinity (treated as a continuous variable here to better reflect the environmental gradient and improve model performance), median soil grain size (0–50 cm), and OC stocks from other compartments (e.g., BG and soil OC stocks as predictors when AG OC stock was the response). These variables were chosen to represent key, non-redundant drivers of carbon stocks based on ecological relevance and to avoid multicollinearity among predictors. Model assumptions (residual normality, homoscedasticity, and absence of multicollinearity) were visually assessed using check_model function from the performance package (Lüdecke et al., 2021). The most parsimonious models were selected using the dredge function from MuMIn, based on the lowest second-order Akaike Information Criterion (AICc; Bartoń, 2025). To examine the multivariate causal relationships among variables, a piecewise Structural Equation Model (SEM) using the psem function from the piecewiseSEM package (Lefcheck, 2016) was constructed. This enabled us to disentangle direct and indirect effects of management, plant community, environmental gradients, and soil characteristics on OC stocks across compartments. The SEM was based on the best-supported fixed effects identified via model selection (see above) and refined according to ecological theory and literature. Non-significant paths were iteratively removed to optimize model fit, evaluated with Fisher's C statistic, AICc, and associated p-values. Standardized path coefficients were calculated to assess the relative strength and direction of relationships.
Finally, to investigate whether management type influences OC stocks and soil parameters along soil depth, BG biomass (g DW m2) and corresponding OC stock (Mg ha −1), as well as soil OC stock (Mg ha −1) were summed for surface (0–15 cm) and subsurface (15–50 cm) layers of decompressed soil. Mean dry bulk density (g cm−3), water content (%), and median grain size (D50; µm) were calculated also for surface and subsurface soil layers. Several linear mixed-effects models were constructed with these variables as responses (log-transformed), with site as random factor (1| Area), and soil depth (surface vs. subsurface), management type (grazed vs. ungrazed) and their interaction as fixed effects. Model assumptions were verified using the check_model function, and the significance of fixed effects was assessed with Type III ANOVA.
All statistical analyses were performed using R (version 4.4.1; R Core Team, 2024).
3.1 Plant species communities in relation to grazing and environmental gradients
Across the 12 Nordic coastal marsh areas, 104 plant species were identified at species level and 4 at family/genus level (Table S1). Management type (grazed vs. ungrazed) broadly separated the communities along the second axis of the NMDS, with an overlap, meaning that some grazed and ungrazed sites had similar plant community composition (Fig. 3a). The grazed communities separated along the large-scale environmental gradient (first axis of the NMDS), from oligohaline to mesohaline and polyhaline sites (Fig. 3b, c and d), while the ungrazed communities were more similar across the gradient. Thus, a larger between-site variability in species composition caused by the large-scale environmental gradient was observed in grazed than in ungrazed communities. Land uplift rate (r2= 0.29, p= 0.001), temperature (r2= 0.12, p= 0.0006), salinity (r2= 0.18, p= 0.001), longitude (r2= 0.16, p= 0.0025) and latitude (r2= 0.12, p= 0.0121) were all significantly correlated to the first axis of NMDS. The second NMDS axis (separating grazed and ungrazed sites) was significantly correlated with soil water content (r2= 0.20, p= 0.0006) and soil dry bulk density (r2= 0.18, p= 0.0012). PERMANOVA analysis explained 44 % of plant community composition, which was significantly affected by management type (grazed vs. ungrazed), salinity category (representing also gradients in climate, tidal amplitude and land uplift rate), and their interaction (Table 2). The significant interaction reflected a higher variability in species composition along the environmental gradient in grazed sites compared to ungrazed ones.
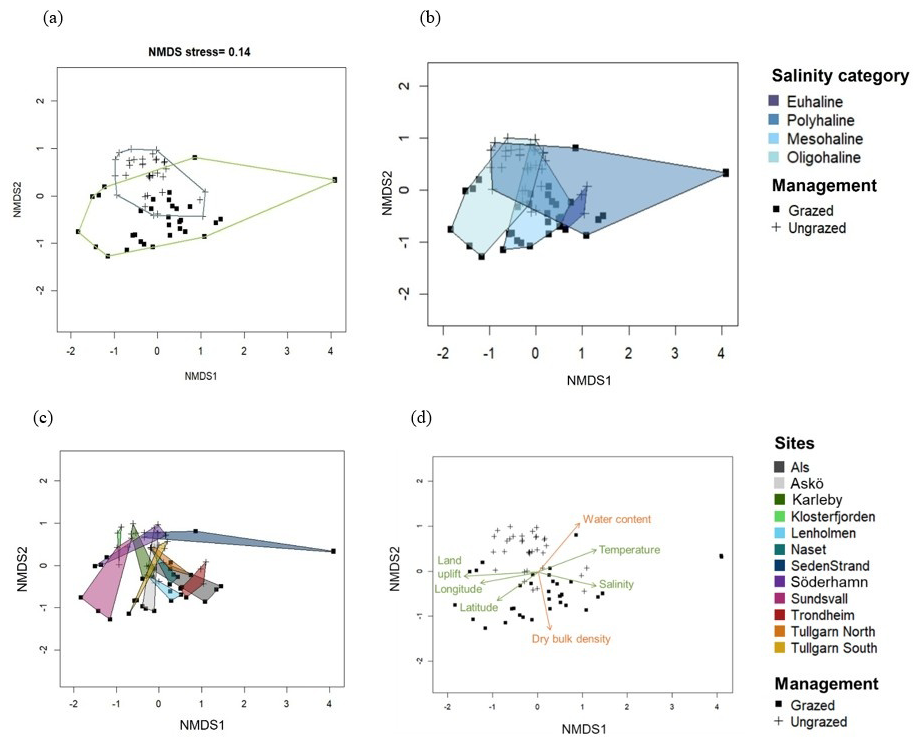
Figure 3Non-metric multidimensional scaling (NMDS) plot of plant community cover (%), performed on a Bray-Curtis dissimilarity matrix of log + 1 data, with points grouped by management type (a), salinity category (b) and site (c). Points correspond to a 1 × 1 m quadrat where plant species were identified in the 11 grazed (squared points, n= 33) and 12 ungrazed sites (cross points, n= 36). Arrows represent variables significantly (p< 0.05) correlated by permutation (9999 permutations) with the NMDS axes and their length reflects the strength of the correlation (r2) (d). Environmental parameters are represented in green (mean annual water salinity and temperature, longitude (°), latitude (°), and land uplift (mm yr−1)), and soil parameters in orange (water content (%) and dry bulk density (g cm−3) of the soil sampled).
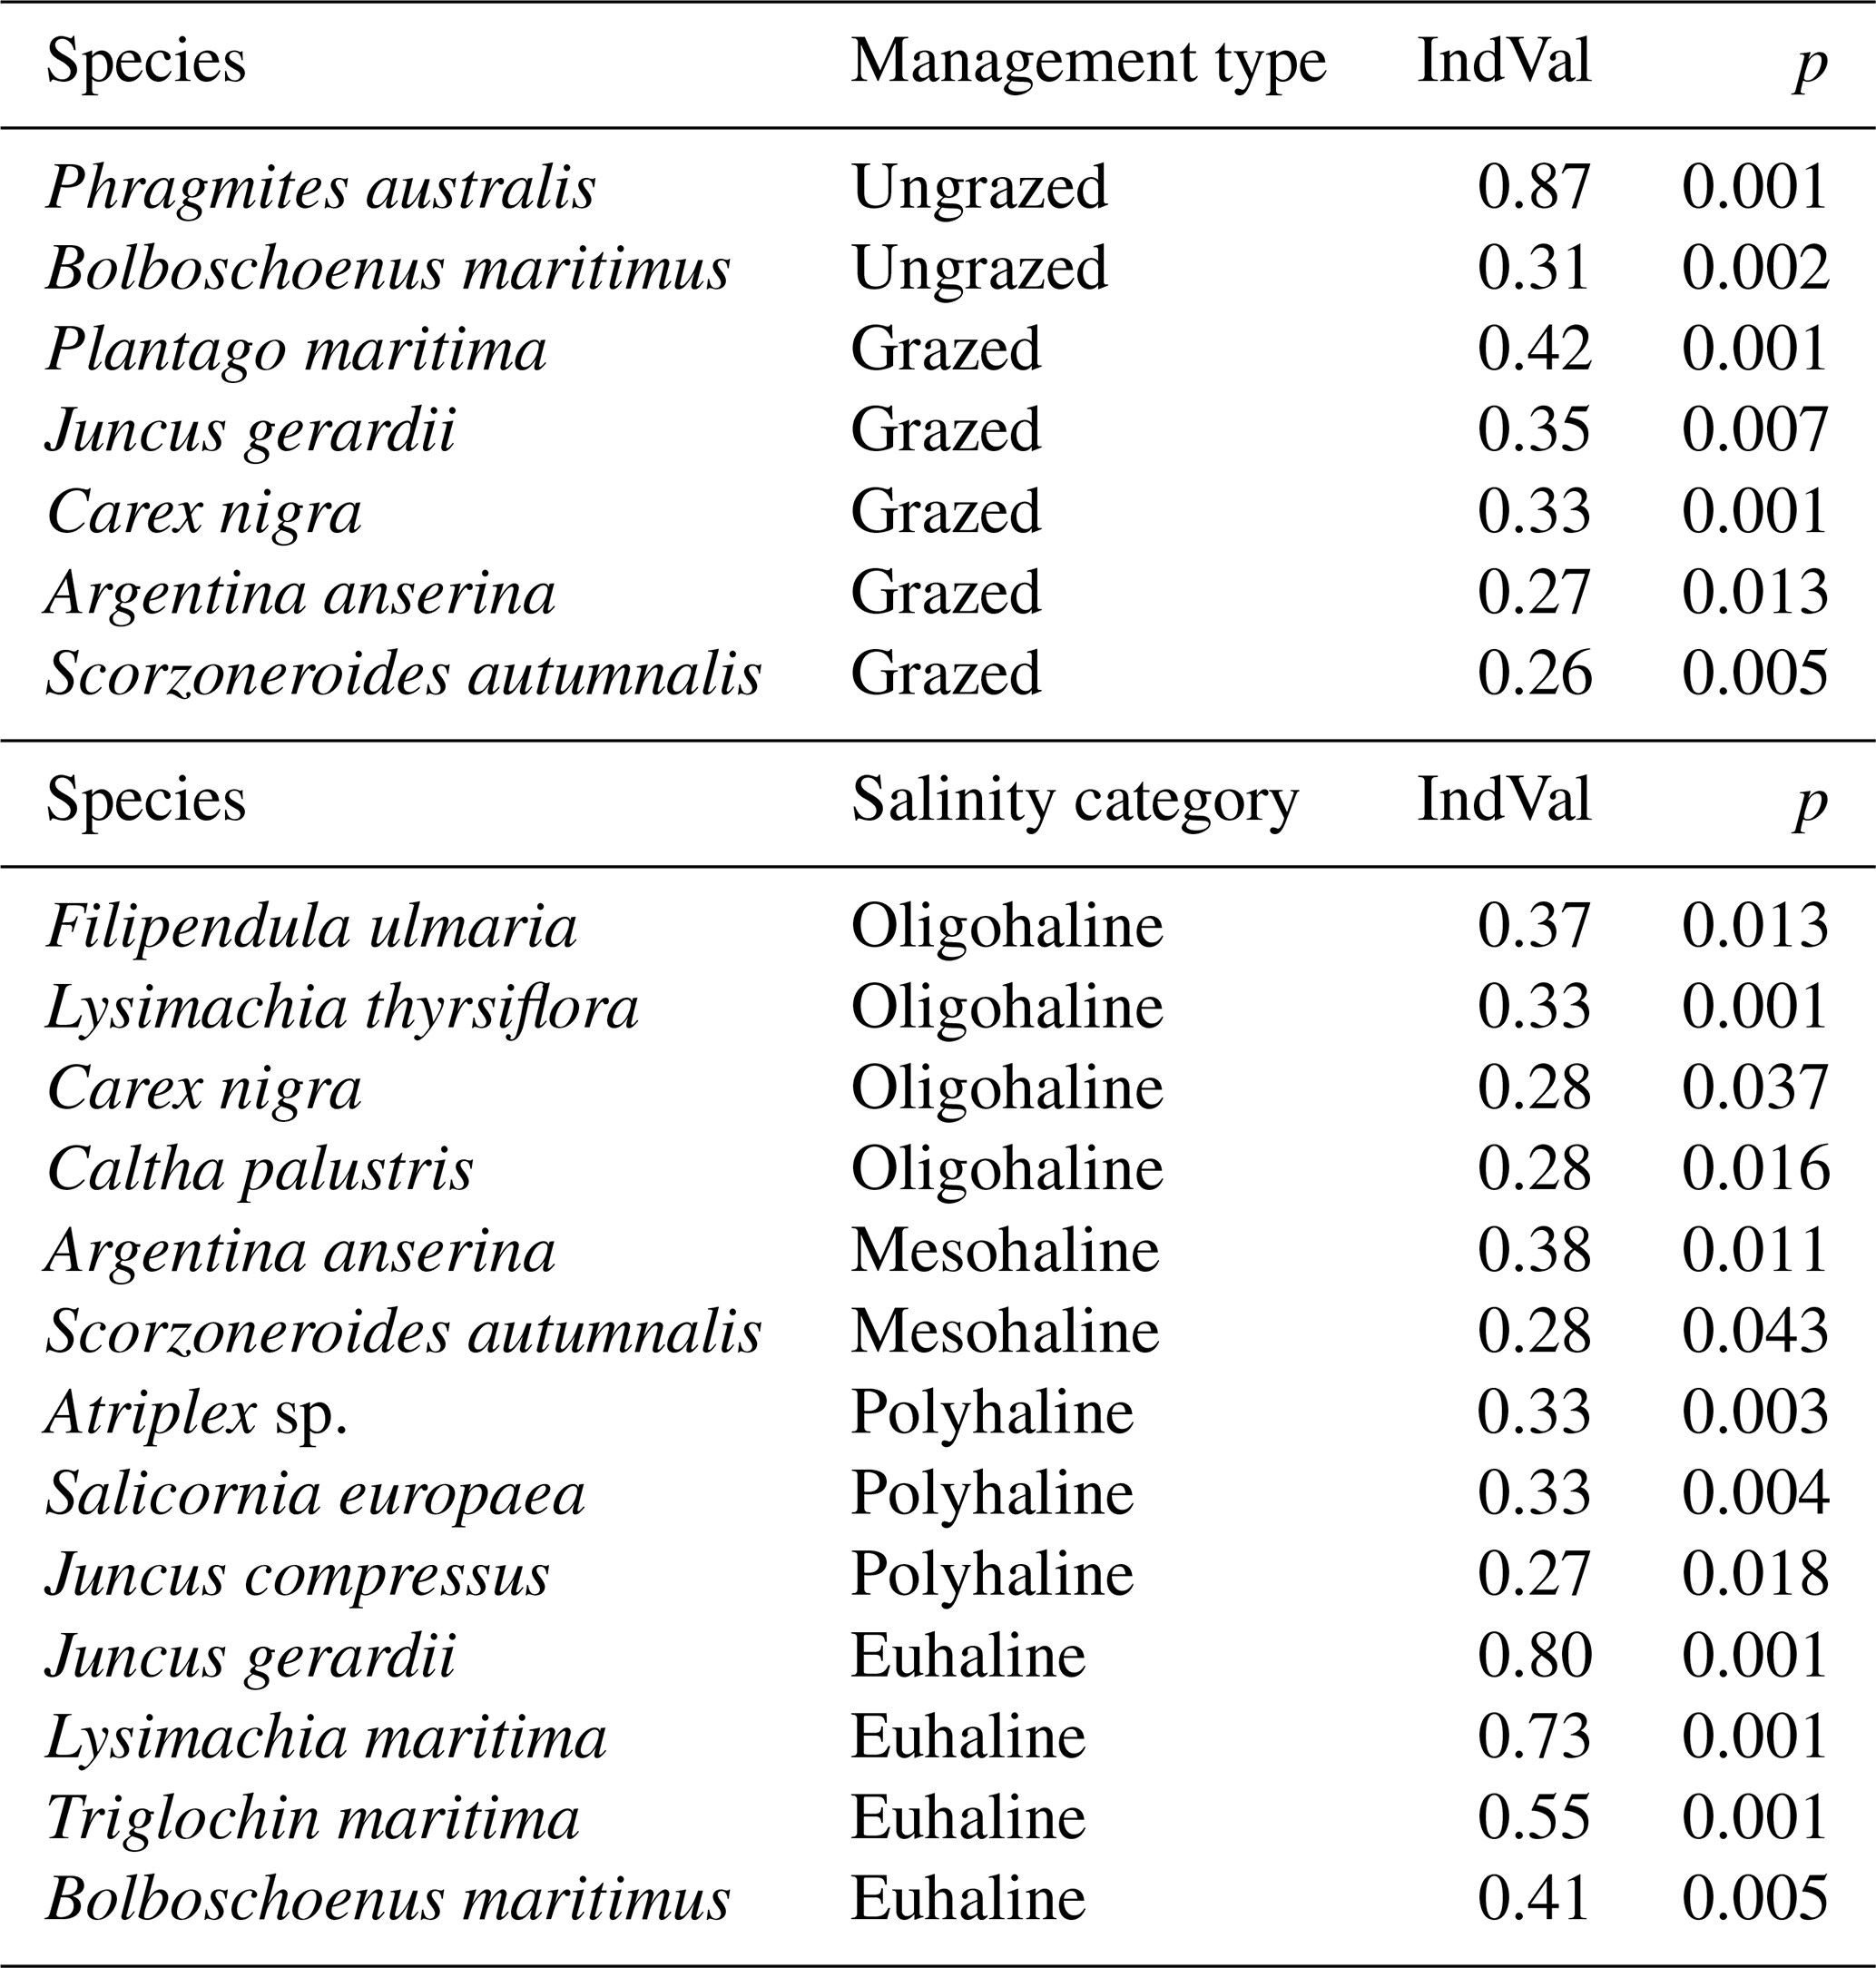
Species significantly representative of grazed coastal marshes were Plantago maritima, Juncus gerardii, Carex nigra, Argentina anserina, and Scorzoneroides autumnalis (Table 3). For ungrazed coastal marshes, the significantly representative species were Phragmites australis, with the highest IndVal, and Bolboschoenus maritimus. P. australis covered 70 ± 32 % of ungrazed plots and much less (4 ± 6 % cover) of grazed plots. The species significantly characterizing the oligohaline zone was Filipendula ulmaria, for the mesohaline zone it was Argentina anserina, for the polyhaline zone Atriplex sp. and Salicornia europaea, and for the euhaline zone Juncus gerardii (Table 3).
In grazed sites, a total of 71 species were identified, compared to 64 species in ungrazed sites, with 27 species shared between both management types (Table S1). The PERMANOVA analysis of plant species richness per quadrat explained 28 % of its variance and showed significant effects of both management and salinity category, with significant interaction (Table 2), indicating that grazing effects on diversity depended on environmental conditions. Overall, plant species richness was often significantly higher in grazed than in ungrazed sites, in particular in oligo- and mesohaline areas (Table 2, Fig. 4a). For the Shannon-Wiener index, the PERMANOVA analysis explained 28 % of its variance with a significant effect of both management and salinity category, along with significant interaction, which explained most of the variability (Table 2). In grazed sites, the Shannon-Wiener index tended to gradually decrease with increasing salinity, whereas no consistent pattern was observed along the salinity gradient in ungrazed sites (Fig. 4b). Mean vegetation height was mainly explained by management type and was higher and more variable in ungrazed sites (112.2 ± 68.9 cm) compared to grazed sites (16.8 ± 10.8 cm; Table 2, Fig. 4c). The within-site variation (dispersion) was significant for plant community and mean vegetation hight, suggesting that PERMANOVA results should be interpreted with caution, as they may partly reflect differences in dispersion among groups.
Table 2Two-way PERMANOVA results testing the main and interactive effect of management type and salinity category on plant community (Bray-Curtis distance matrix based on plant coverage), species richness, Shannon index, and mean vegetation height (log transformed), with sites as strata. The number of permutations was 9999, and variability among replicates were tested using permutest. There were 11 sites for grazed and 12 sites for ungrazed costal marshes, with n= 3 per site. P-values in bold indicate significant effects (p< 0.05).
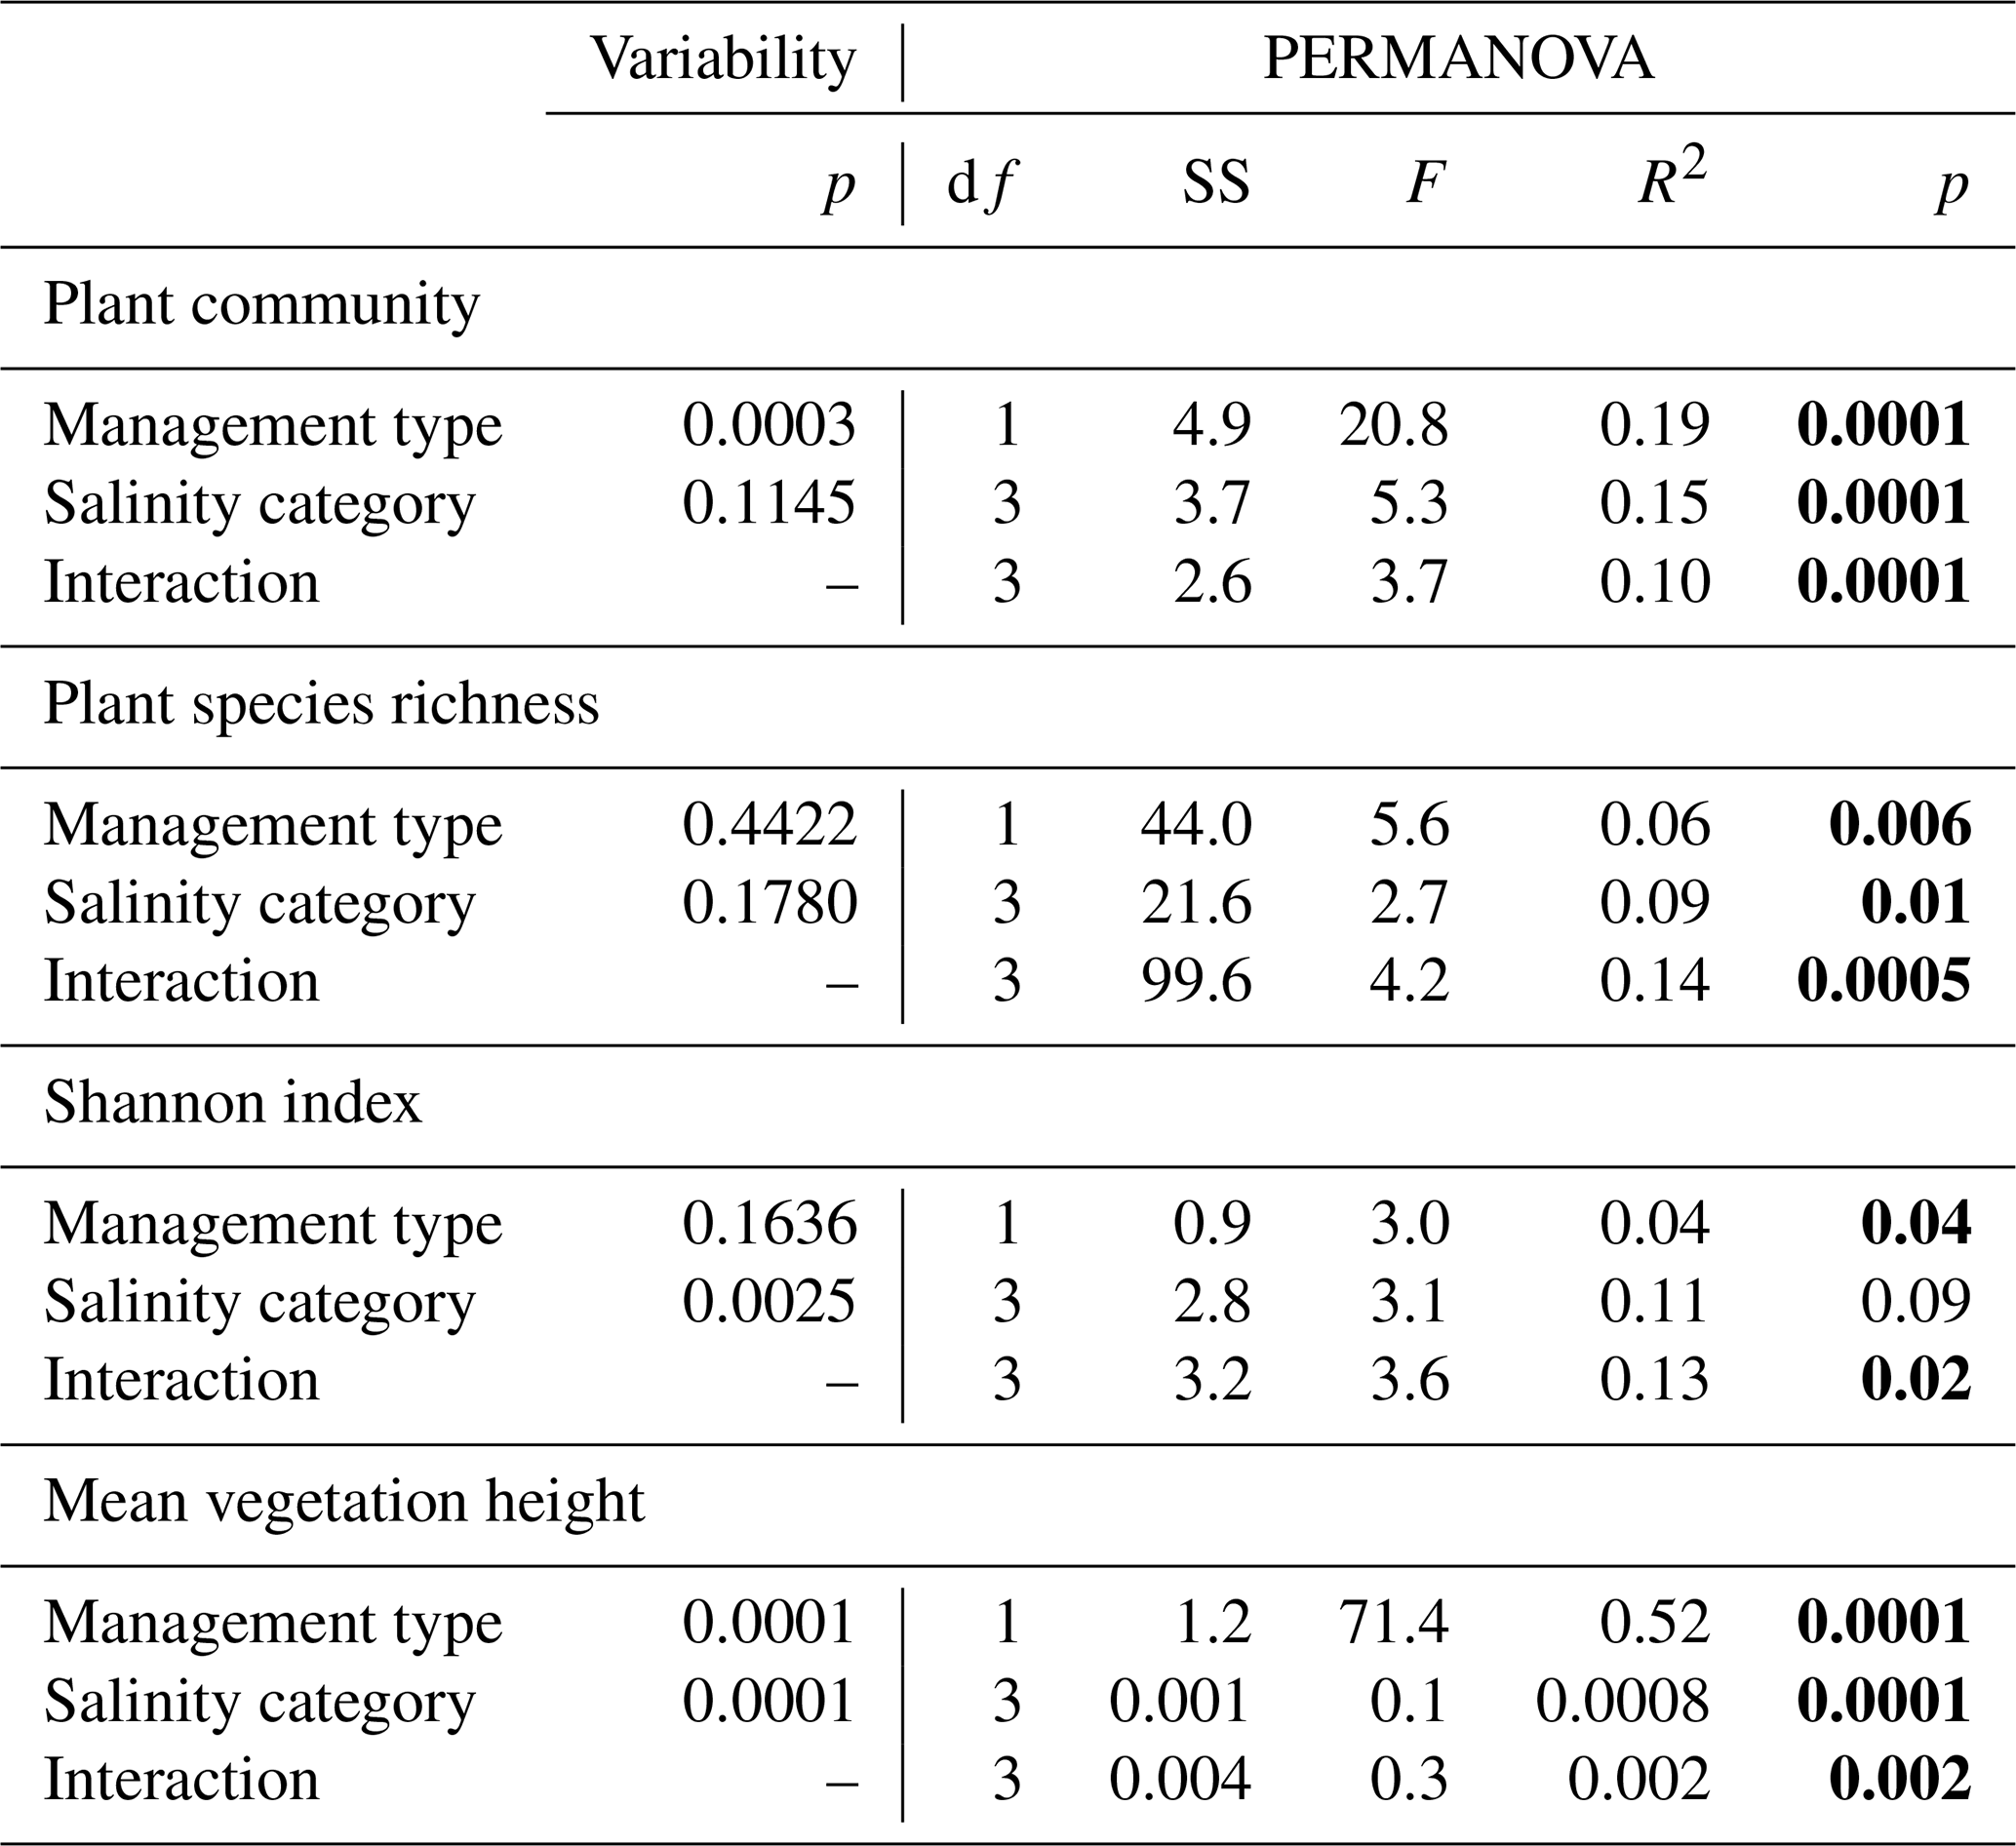
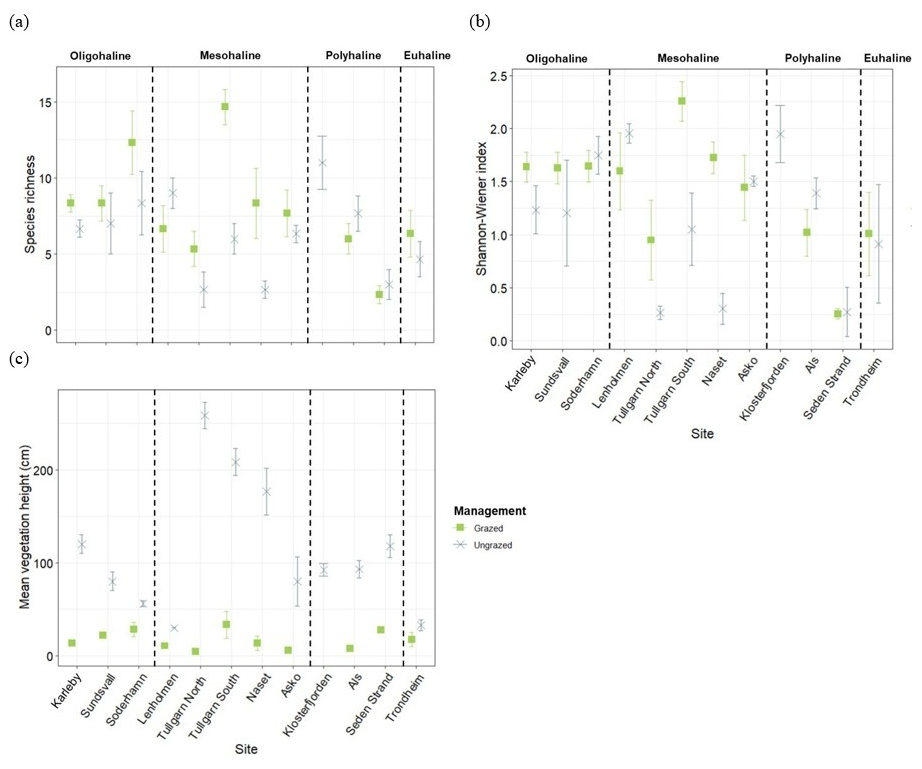
Figure 4Mean plant species richness (a), Shannon-Wiener index (b), and mean vegetation height (c) at the grazed (11 sites, n= 3 per site; in green) and ungrazed (12 sites, n= 3 per site; in blue) areas, grouped by salinity category (oligohaline, mesohaline, polyhaline, and euhaline). Bars represent the standard deviation.
Table 3Indicator values (IndVal) for plant species, per management type (grazed vs ungrazed) and sea water salinity category (Cowardin et al., 1979).
3.2 OC stocks in biomass and soils and their main predictors
Plant aboveground biomass (AG) was 363 ± 176 g DW m−2 in grazed sites and 1476 ± 1130 g DW m−2 in ungrazed sites, while belowground biomass (BG; sum across the top 50 cm soil) was 7664 ± 4187 and 8836 ± 464 g DW m−2 in grazed and ungrazed sites respectively. The associated OC stocks were as follows (Fig. 5): AG OC stocks were 1.5 ± 0.7 and 6.4 ± 5.1 Mg ha−1 for grazed and ungrazed sites respectively, and BG OC stocks were 28.0 ± 16.8 and 33.8 ± 18.7 Mg ha−1 for grazed and ungrazed sites respectively (Fig. 5a). For soil OC, the stocks were 99.7 ± 57.9 Mg ha−1 in grazed sites and 78.2 ± 44.2 Mg ha−1 in ungrazed sites (Fig. 5a). Variability in AG, BG and soil OC stocks was observed among individual sites (Fig. 5b), reflecting site-specific differences across the coastal marshes in Nordic region. This variability was accounted for in subsequent analyses using mixed-effects models and structural equation modelling.
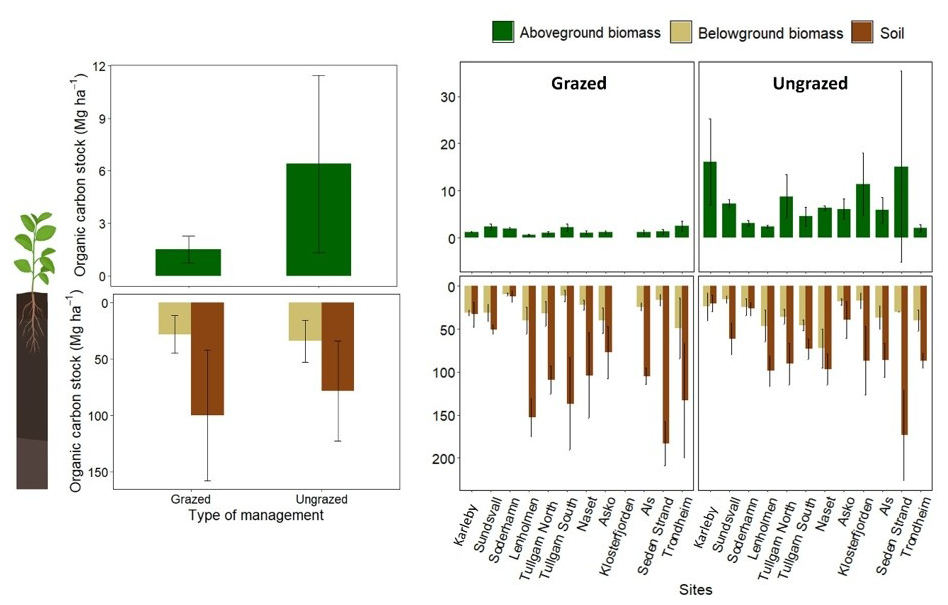
Figure 5Organic carbon in aboveground biomass (green) and the top 50 cm of belowground biomass (beige) and soil (brown) of decompressed soil cores in coastal marshes (Mg ha−1) of the Nordic region. Values are shown as the overall mean across all sites (a) and as mean values per site (b). Sampling sites included grazed (11 sites, n= 3 per site) and ungrazed (12 sites, n= 3 per site) areas. Bars represent the mean values ± standard deviation.
The final structural equation model (SEM) assessing the direct and indirect influences of plant species richness, management type, water salinity and median grain size on OC stocks (above- and below-ground biomass, and soil) showed a good fit to the data (Fisher's C = 9.086, df= 12, p= 0.696; Fig. 6). The SEM revealed that a combination of biotic and abiotic factors explained a large proportion of the variance in OC stocks, with a non-negligible site effect: conditional (variance explained by both fixed and random effects) and marginal (variance explained by fixed effects) R2 were respectively 0.62 0.50 for AG, 0.69 0.40 for soil, 0.36 0.23 for BG, and 0.68 0.09 for plant species richness. Aboveground OC stocks were significantly lower in grazed than ungrazed sites (direct effect), primarily due to the large grazing effect on biomass. Belowground OC stocks were indirectly and significantly affected by grazing through changes in plant species richness and were negatively related to grain size (implying largest stocks in fine-textured sediments; p= 0.1). Although plant species richness increased significantly under grazing, the communities stored less BG OC stocks than ungrazed ones. Plant species richness also tended to non-significantly increase with grain size apparently due to a single site (Söderhamn) with a well-developed sandy community, while salinity showed a weak, non-significant negative effect. Soil OC stocks were instead mainly controlled by abiotic drivers, with a significant negative influence of soil properties (notably median grain size), and a positive, marginally significant (p= 0.05) effect of salinity, representing the large-scale gradient in a number of environmental factors. Thus, low saline, northern areas exhibited lower soil stocks. Species richness and grazing had no significant direct effects on soil OC stocks.
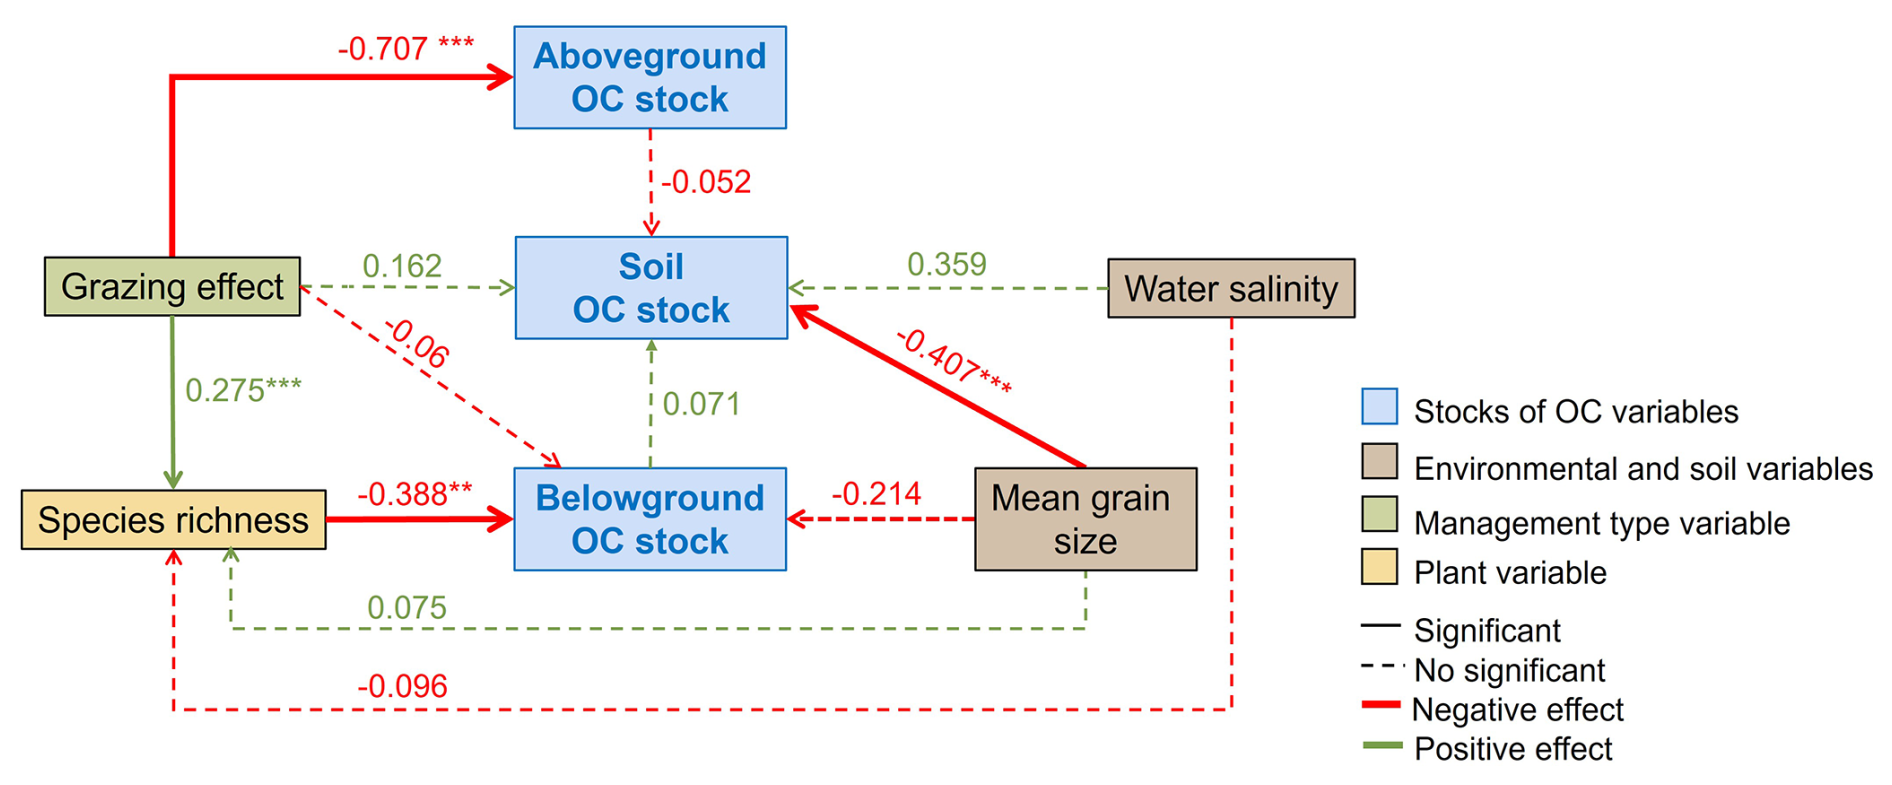
Figure 6Final structural equation model (SEM) of investigated paths to identify biotic and abiotic drivers of Organic Carbon (OC) stocks (aboveground and belowground biomass, and soil) in coastal marshes of the Nordic region. The numbers represent standardized coefficients, and the stars refer to p-values < 0.05 (*), < 0.01 (), and < 0.001 ().
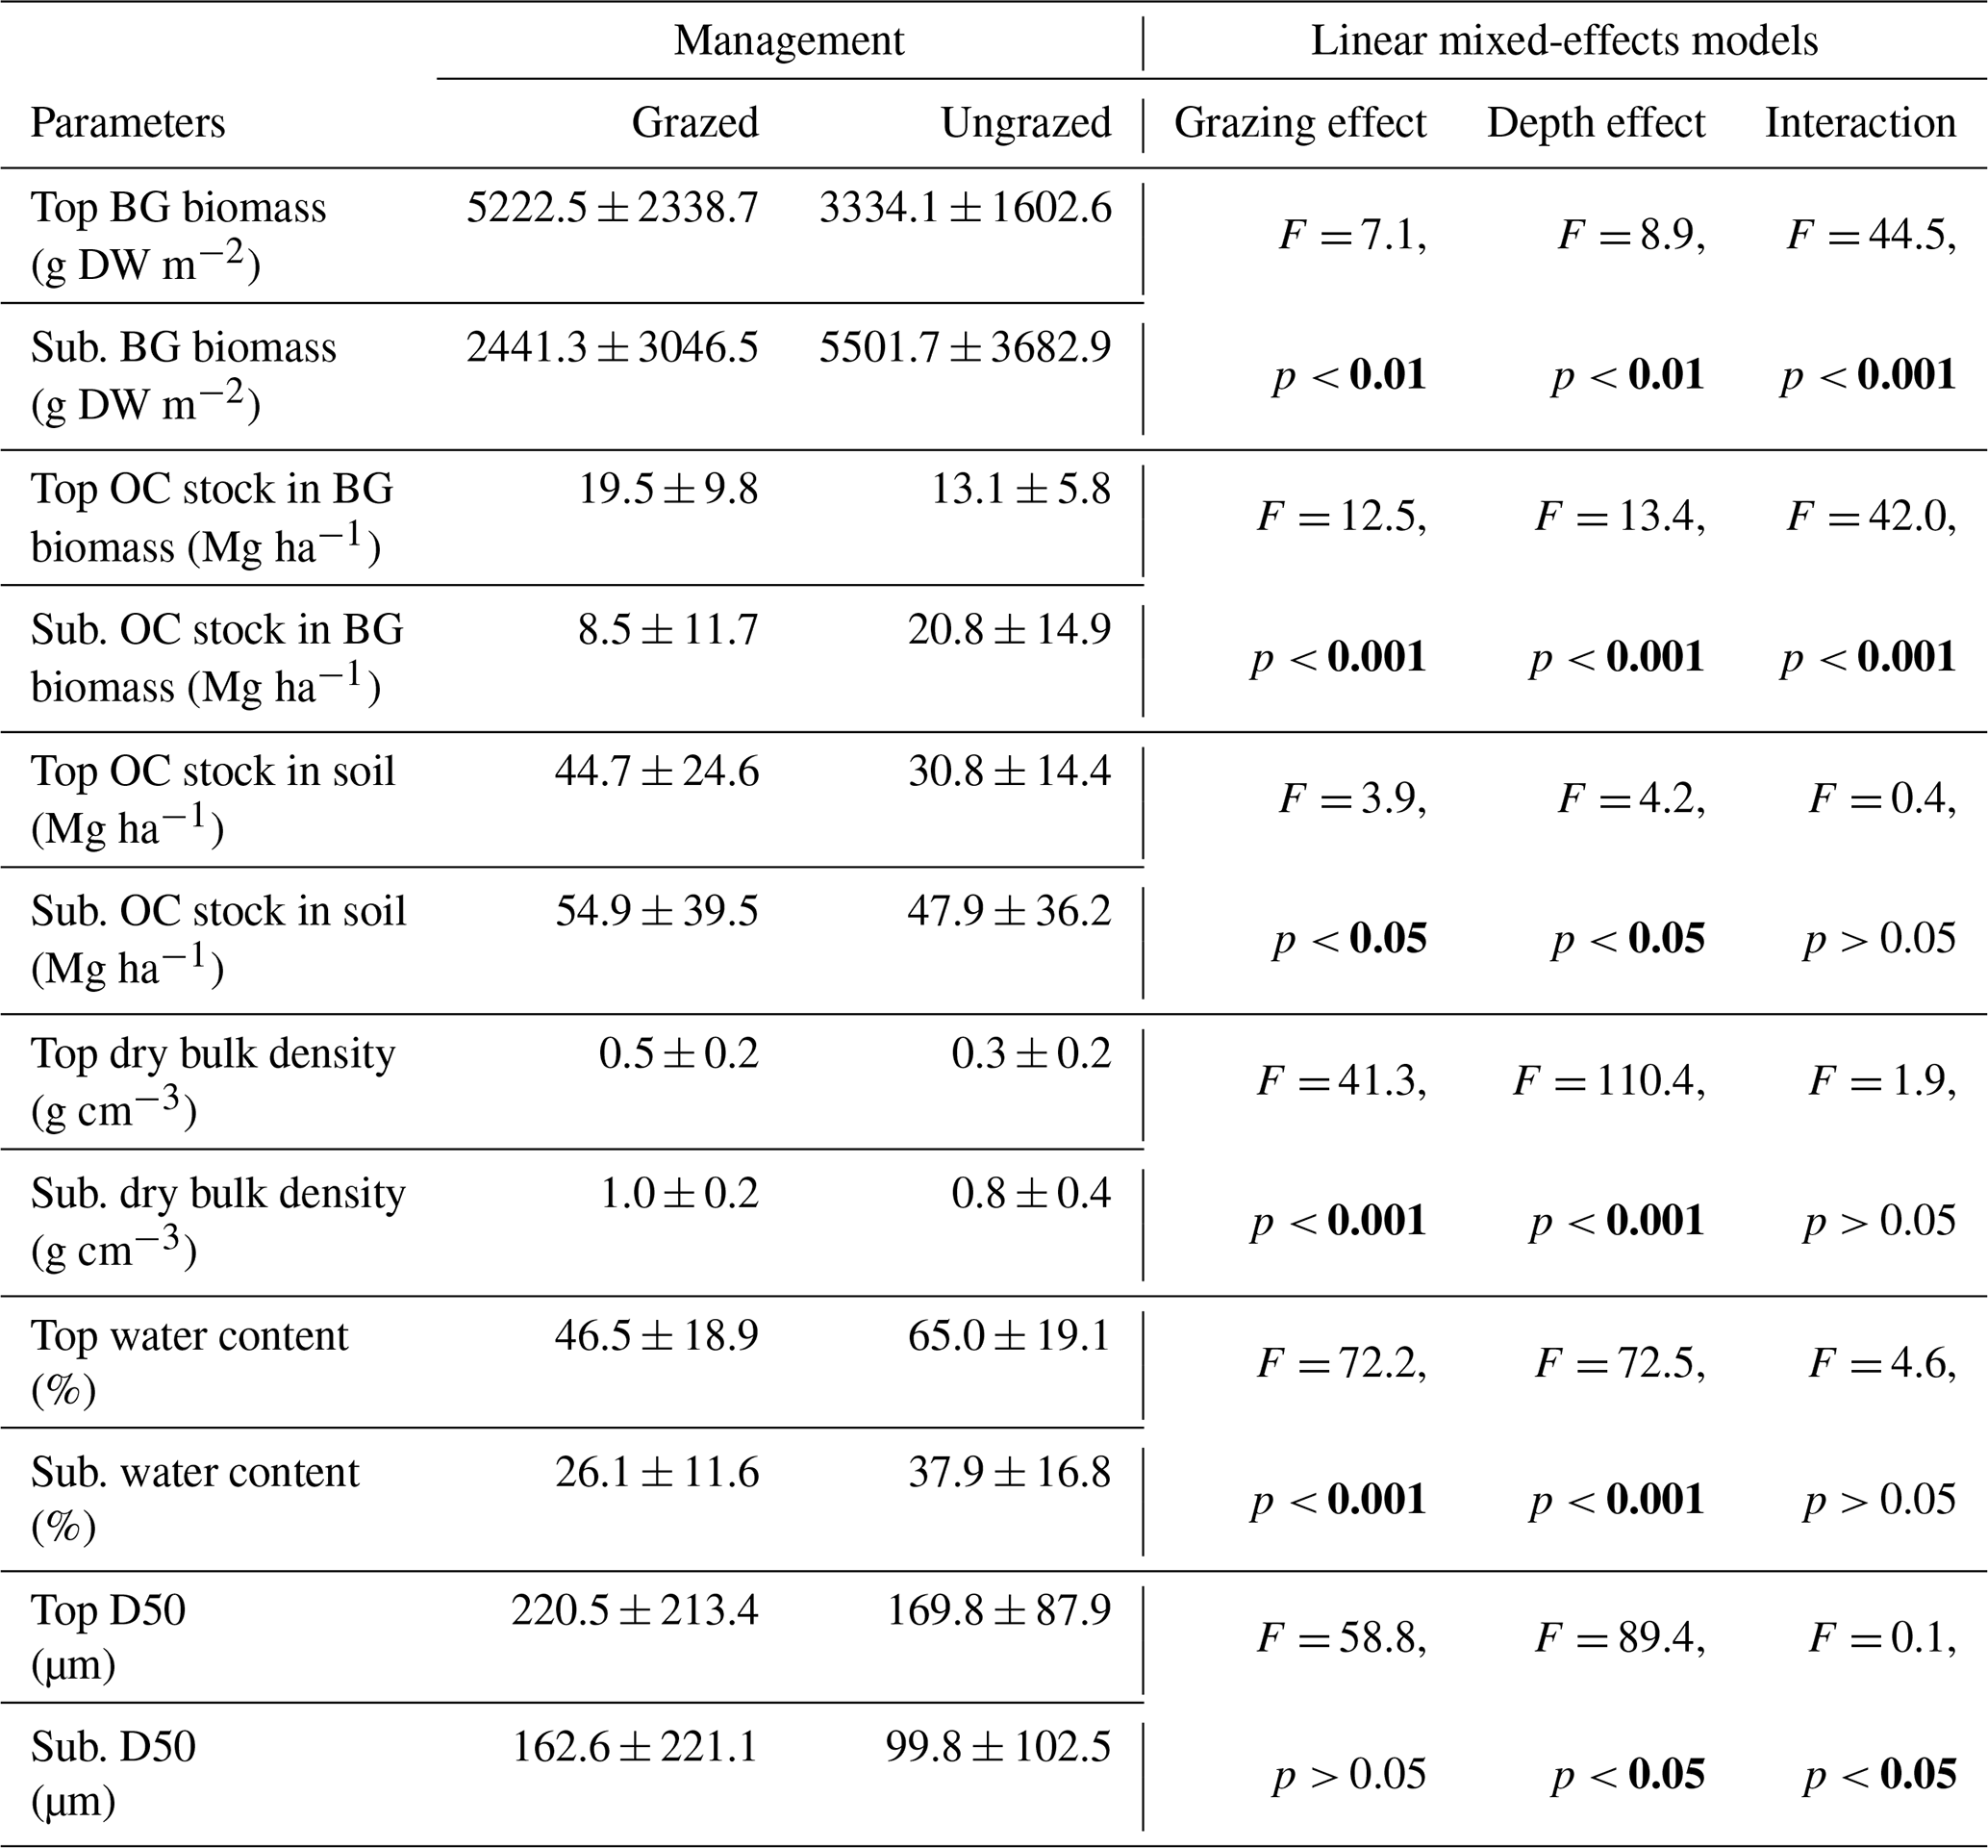
BG biomass (DW and associated OC stocks), soil OC stocks and sediment characteristics differed between grazed and ungrazed sites and between surface and subsurface soil layers (Table 4). BG biomass was higher at the surface in the grazed sites compared to subsurface and top surface soils of ungrazed sites. By contrast, BG biomass was higher in the subsurface soil in the ungrazed sites compared to both surface and subsurface soils of grazed sites (Table 4). The same pattern was observed for BG biomass OC stocks. Soil OC stocks were significantly affected by management type and soil depth, but not by their interaction. Highest soil OC stocks occurred in grazed sites irrespective of depth, and in subsurface layers irrespective of management (Table 4). Dry bulk density was significantly higher in grazed sites than ungrazed ones, and was higher in subsurface than surface soils, with no significant interaction between grazing and soil depth. Water content was significantly affected by grazing and soil depth, but not by their interaction, with higher values in ungrazed sites and in surface compared to subsurface soils. Median grain size was significantly lower in subsurface soils than in surface soils and was not affected by grazing, although a weak but significant interaction between grazing and soil depth was detected.
Table 4Surface (top 15 cm) and subsurface (sub., 15–50 cm) belowground (BG) biomass (g DW m2) and corresponding organic carbon (OC) stock (Mg ha −1), soil OC stock (Mg ha −1), mean dry bulk density (g cm−3), water content (%), and median grain size (D50; µm) of decompressed soil at 11 grazed (n= 33; except for D50: n= 11) and 12 ungrazed (n= 36; except for D50: n= 12) sites of coastal marshes in the Nordic region. Results of Type III ANOVA from the linear mixed-effects model testing the effects of grazing, depth, and their interaction on log-transformed variables. P-values in bold indicate significant effects (p< 0.05). For site details please see Tables S2, S3 and S4 .
This study is the first large-scale assessment of OC stocks over the top 50 cm of soil, and their drivers across coastal marshes of the Nordic region, integrating plant community composition, grazing and major environmental gradients. Our results show that grazing strongly shapes plant community structure, overall increasing plant species diversity and limiting the dominance of the competitive reed Phragmites australis, while grazing effects on OC stocks differ among ecosystem compartments. Above- and below-ground OC stocks were mainly influenced by grazing through direct biomass removal and indirect effects mediated by plant community composition, whereas soil OC stocks were instead primarily controlled by abiotic factors such as sediment texture and salinity. Using a structural equation modelling approach, this study highlights that grazing effects on soil OC storage were largely indirect and context-dependent, and that the large-scale environmental gradient from the Atlantic to the inner Baltic Sea override grazing effects on soil OC stocks. These findings highlight the need to consider both environmental gradients and local management practices when assessing OC storage and designing conservation strategies for coastal marshes.
4.1 Coastal marshes plant communities: influence of grazing and environmental gradients
Because plant community composition is a key biotic driver of carbon storage in coastal marshes, particularly through its influence on biomass production and belowground carbon inputs, the responses of plant communities to grazing and environmental gradients are first examined. The species composition observed in this study broadly aligns to plant communities reported in previous investigations in the Nordic region (Berg et al., 2012; Burnside et al., 2007; Dijkema, 1990; Pätsch et al., 2019; Ward et al., 2016). Grazed sites exhibited significantly higher plant species richness, greater evenness (equitability index), and shorter plant height. A differentiation of plant communities was highlighted along the environmental gradient, with more diverse communities in grazed than ungrazed sites. Generally, grazing reduces the dominance of highly competitive species and thereby facilitates the establishment of other species, increasing overall plant species diversity (Davidson et al., 2017). In our study, plant communities tended to be more diverse in the northern part of the Baltic Sea, where the salinity is low, and more specifically in grazed sites. High salinity exerts physiological stress on plants, limiting the number of species able to tolerate such conditions. Only a few halophytes, such as Lysimachia maritima and Salicornia europaea, are well adapted to survive in these environments (Hulisz et al., 2016; Suchrow et al., 2015; Tyler, 1971; Ward et al., 2016). However, despite high salinity, polyhaline sites in the Kattegat region, located at the entrance of the Baltic Sea, showed diverse plant communities. This heterogeneity in plant community structure, especially in grazed sites, may be attributed to the dynamic and transitional nature of local environmental conditions such as salinity, wind exposure, and hydrodynamic variability, which are generally more pronounced than in the semi-enclosed Baltic Sea (Danielssen, 1997; Lehmann et al., 2002).
Ungrazed sites were inhabited by fewer plant species per plot, with different growth forms depending on their position along the environmental gradient. Dense vegetation cover in these areas promote litter accumulation and slow water velocity, facilitating the deposition of organic matter and fine particles that enhance the porosity of the soil (Cahoon et al., 2021; Dijkema, 1990). In addition, the absence of livestock prevents soil compaction and permits greater water retention (Veldhuis et al., 2019). These hydrological and structural conditions strongly influence species composition, favouring competitive species in ungrazed plots (Grace and Jutila, 1999). Especially, the lack of grazing enabled the proliferation of the highly competitive tall grass Phragmites australis, which was dominant across the entire studied environmental gradient. Increased interspecific competition in ungrazed sites likely contributed to the observed lower species richness and lower evenness (monospecific community), with P. australis outcompeting other species especially due to its high productivity and tall stems, which can inhibit germination and growth of other species (Berg et al., 2012; Burnside et al., 2007; Grace and Jutila, 1999; Packer et al., 2017; Uddin and Robinson, 2017). P. australis is widespread in temperate wetlands (Adams and Bate, 1999) and can grow under a broad range of climatic and hydrological conditions. It can establish in aquatic, semi-aquatic or moist soils, tolerate salinity levels from 0 to 35, and adapt to various temperature regimes and tidal ranges, typically reaching stem heights between 1 and 2 m (Gu et al., 2020; Hughes et al., 2016).
In the present study, some ungrazed sites exhibited relatively high plant species richness and diversity. This pattern was mainly driven by a subset of sites distributed across the large-scale environmental gradient, spanning low-salinity Baltic sites (e.g. Lenholmen, Söderhamn, Sundsvall) to more marine-influenced and high-latitude sites (Als and Trondheim), where the cover of Phragmites australis was relatively low (below 80 %) or absent. The low cover or absence of P. australis at these sites could be due to local management practices, such as mowing, or abiotic constraints. At several of these sites, soils were either highly compacted, characterized by high dry bulk density, high silt and clay percentage and low water content, or excessively sandy as observed at Söderhamn, with a high proportion of coarse, medium and fine sands, limiting water and nutrient retention, and consequently P. australisgrowth (Packer et al., 2017; Yang et al., 2025). Furthermore, the Trondheim area is exposed to very high salinity with extreme winter condition and ice cover, which may damage plant tissues and reduce P. australis survival (Hughes et al., 2016; Yang et al., 2025). Some plant species observed in ungrazed sites were also common in grazed sites, such as Agrostis stolonifera, Glaux maritima and Plantago maritima. Previous studies suggest that their occurrence across contrasting management regimes is linked to flexible regeneration and dispersal strategies that allow rapid recolonization following disturbance, rather than to resistance to shifts in vegetation dominance (Burnside et al., 2007).
4.2 Biotic and abiotic drivers of organic carbon stocks: direct and indirect effects
Grazing, the large-scale environmental gradient, and soil characteristics also affected OC stocks through a combination of direct and indirect mechanisms. In the studied coastal marshes, most OC was stored in the soil, representing 73 ± 14 % of the total OC stock in grazed areas and 63 ± 13 % in ungrazed ones. These proportions are comparable to other European coastal marshes, where soil generally contains around 90 % of total OC (Smeaton et al., 2023). Biomass-related OC represented 26 ± 13 % and 30 ± 10 % for BG biomass, and 2 ± 2 %, and 7 ± 7 % for AG biomass in grazed and ungrazed areas, respectively.
Plant AG OC stocks were as expected primarily controlled by the direct effects of grazing, through the removal of leaves and stems, and indirectly through the suppression of reed, especially Phragmites australis. Usually, reed shoot can reach more than 2 m height, and can produce a large volume of biomass, making P. australisone of the most productive species in wetlands (Engloner, 2009; Park and Blossey, 2008). Its height and density can, however, vary depending especially on the latitude, which may reflect temperature and salinity variations, and nitrogen concentration in the soil (Hughes et al., 2016). Indeed, low temperatures, high salinity, high water level and low nitrogen soil content limit the growth of reeds (Hughes et al., 2016; Yang et al., 2025). In addition, variation in AG biomass and the associated OC stocks was observed between ungrazed sites in the present study, which can be due to differences in environmental conditions impacting plant growth.
Plant BG OC stocks and their vertical distribution were associated with plant community composition, while grazing showed an indirect relationship through its effects on plant community structure. BG biomass and associated OC varied along the soil depth, with a shift in depth distribution of root biomass depending on management type. Ungrazed sites had more plant biomass below 15 cm depth than at the surface, reflecting that the dominant P. australis produces horizontal and vertical 1–3 cm wide rhizomes, forming a complex system at 20–100 cm depth, and sometimes even down to 2 m depth (Packer et al., 2017). Reed roots grow from nodes of rhizomes, which are 2–4 mm wide and can reach 4 m deep. This dense mass explains the pattern found in ungrazed sites in the present study, with comparable biomass values in other Nordic studies (Leiva-Dueñas et al., 2024). In grazed sites, BG biomass and associated OC stocks were positioned higher in the topsoil of the coastal marshes. To compensate for the loss of AG biomass, the diverse plant community in grazed sites can adapt to grazing by modifying their resource allocation strategy and stimulate root growth (Elschot et al., 2015; Graversen et al., 2022; López-Mársico et al., 2015). The BG production is concentrated at the soil surface with thin roots because of the high root turnover due to livestock grazing characteristics showed weak and non-significant relationships with BG OC stocks, regardless of management type.
Soil OC stocks were mainly driven by abiotic factors, with highly significant effects of soil properties. Regardless of the management type, OC stocks were higher in fine grain soils, which aligns with previous regional studies highlighting the key role of soil types in shaping OC stocks (Ford et al., 2019; Leiva-Dueñas et al., 2024, 2026). Fine soils occur in low-energy environments where reduced hydrodynamics favour the deposition of OM and fine particles (Allen, 2000; Nichols, 2010). Moreover, soil texture affects redox conditions, thereby regulating microbial remineralization and ultimately OC storage. Fine-grain soils limit oxygen penetration, reducing its degradation and promoting long-term OC preservation (Burdige, 2007; Neiske et al., 2025). The large-scale environmental gradient also explained variations in soil OC, with marginal significance. The highest OC stocks were found in the south-western part of the study area, with high salinity, warm climate, and large tidal amplitude. High salinity tends to reduce microbial activity and biomass due to osmotic stress (Yan et al., 2015), which promotes OC burial and preservation. The stronger tidal influence near the North Sea increases the duration of flooding, which may promote the deposition of OM and anoxic conditions (Allen, 2000; Lehmann et al., 2002). Because oxygen diffusion is 10 000 × slower in water than in air, prolonged saturation limits aerobic microbial activity, thereby also favouring the preservation of soil OC (Burdige, 2007; Skopp et al., 1990). However, because these environmental gradients co-vary across the study region, it was not possible to disentangle their relative or interactive effects. Future studies based on more independent environmental gradients would be needed to better isolate the specific drivers of soil OC stocks.
Interestingly, no significant direct effects of plant community structure and grazing were detected on soil OC stocks at large-scale, despite previous studies reporting grazing effects on soil OC conservation in coastal marshes. Livestock grazing can increase soil OC through trampling-induced compaction, which reduces soil pore space, limits oxygen diffusion and slows microbial decomposition rates, especially in deeper layers (Elschot et al., 2015; Mueller et al., 2019). In ungrazed sites, the dominance of P. australis may enhance soil aeration through its large and deep rhizomes with abundant aerenchyma, which facilitate internal gas transport throughout the plant and promote radial oxygen loss into the surrounding soil, thereby stimulating OM remineralization and potentially reducing long-term OC storage (Colmer, 2003; Engloner, 2009; Freeman et al., 2001). The absence of a consistent grazing effect on soil OC stocks in the present study likely reflects the interplay of these processes with opposite effects on OC accumulation, whose relative importance varies among sites due to differences in local site characteristics, varying grazing pressures, and different grazers. The grazed areas hosted different types and intensities of herbivores (cattle, sheep, horses), which are known to exert differing effects on vegetation structure, trampling pressure and carbon inputs. Consequently, grazing effects on soil OC storage appear to be highly site-specific, consistent with previous studies highlighting the context dependency of grazing impacts on carbon storage in coastal marsh soils (e.g. Davidson et al., 2017; Leiva-Dueñas et al., 2024). Grazer identity may further modulate these effects, as different livestock types (e.g., cattle, sheep, horses) differ in grazing selectivity and trampling intensity, thereby influencing plant traits and carbon inputs. Although grazer type was recorded, its effect could not be disentangled within our study design, due to limited replication across grazer types, but it likely contributes to the context-dependent patterns observed.
Overall, the soil OC stocks measured in the present study corresponded to the range reported for other temperate and boreal European coastal marshes. An updated global synthesis of coastal marshes OC stocks reported average values of 79 ± 38 Mg OC ha−1 in the top 30 cm and 231 ± 134 Mg OC ha−1 in the top 1 m of soil (Maxwell et al., 2023). Within the Nordic region, previous studies report 42 to 82 Mg OC ha−1 in top 43 cm (Graversen et al., 2022) and a median of 71 Mg OC ha−1 (IQR: 89–42) in the top 50 cm soil (Leiva-Dueñas et al., 2024) for Danish coastal marshes. In Norwegian marshes, substantially lower stocks have been reported (6 ± 3 Mg OC ha−1 in > 1 m soil cores) due to the young age of the marshes and related thin organic soil layers (Ward, 2020). OC stocks along the Baltic Sea coast of Germany also typically reach 106 ± 30 Mg OC ha−1 in the top 30 cm and 222 ± 61 Mg OC ha−1 in the top 1 m soil (Logemann et al., 2025). The OC stocks observed in the present study (100 ± 58 Mg OC ha−1 in grazed sites and 78 ± 44 Mg OC ha−1 in ungrazed sites, integrated over the top 50 cm) are therefore consistent with values reported for other Nordic and Baltic coastal marshes. These findings provide a baseline assessment of soil OC stocks in Nordic coastal marshes, a region that remains underrepresented in global Blue Carbon datasets.
This study provides the first regional assessment of organic carbon stocks in coastal marshes of the Nordic region and identifies the main biotic and abiotic drivers acting across a strong environmental gradient. Plant diversity, composition, biomass, and height were strongly shaped by the interactive effects of grazing and environmental conditions, particularly through their influence on the competitive and dominant reed, Phragmites australis, in ungrazed sites. These vegetation differences explained most of the variation in plant above- and below-ground OC stocks. In contrast, soil OC stocks were primarily determined by large-scale abiotic factors, especially soil characteristics, while management (grazing) and vegetation effects appeared more variable and context dependent. The diversity of grazer types and intensities likely masked consistent grazing effects on soil OC at the regional scale. These findings may underpin sustainable management of coastal marshes in the Nordic region and their carbon storage capacity and plant diversity along complex environmental gradients and grazing regimes.
The data supporting this study are archived on Zenodo (https://doi.org/10.5281/zenodo.18599372, Richard et al., 2026) in restricted access during the peer-review process.
The supplement related to this article is available online at https://doi.org/10.5194/bg-23-4583-2026-supplement.
AR: conceptualization, methodology, investigation, formal analysis, visualization, writing (original draft preparation); CLD: conceptualization, methodology, investigation, writing (review and editing); CB: conceptualization, investigation, funding acquisition, writing (review and editing); BKE: investigation, writing (review and editing); AG: investigation, writing (review and editing); NHN: investigation, writing (review and editing); LHA: methodology, investigation, writing (review and editing); KJ: conceptualization, funding acquisition, writing (review and editing); HJ: investigation, writing (review and editing); DKJ: conceptualization, investigation, funding acquisition, writing (review and editing); NL: investigation, writing (review and editing); ML: investigation, writing (review and editing); ELL: writing (review and editing); KM: investigation, writing (review and editing); MvN: investigation, writing (review and editing); GF: conceptualization, investigation, writing (review and editing); SAW: investigation, writing (review and editing); COQ: conceptualization, investigation, writing (review and editing); GTB: conceptualization, funding acquisition, writing (review and editing), project administration; JSE: conceptualization, investigation, funding acquisition, writing (review and editing).
The contact author has declared that none of the authors has any competing interests.
Publisher's note: Copernicus Publications remains neutral with regard to jurisdictional claims made in the text, published maps, institutional affiliations, or any other geographical representation in this paper. The authors bear the ultimate responsibility for providing appropriate place names. Views expressed in the text are those of the authors and do not necessarily reflect the views of the publisher.
The authors would like to thank Kitte Linding Gerlich, Elizabeth Graversen, Sara Barilari, Maria Cannarozzi, Rhonda Ridley, Lars Klarhost, Alicia Ok, Birthe Christensen, Carina Johansson, Haoyi Yao, Mikkel Jensen and Ocea van Loenen for their help during field sampling and laboratory analyses. Our gratitude also goes to Lacie Setsass and Anne Gaspers for their help in selecting Norwegian marsh sites and field sampling. The International Atomic Energy Agency thanks the Government of the Principality of Monaco for supporting its IAEA Marine Environment Laboratories.
This research was funded by BiodivERsA/BiodivClim ERA-Net COFUND programme (“NordSalt - Climate Change Impacts and Biodiversity Interactions in Nordic Salt Marshes”, grant no. BiodivClim-845; 2019-2022) in collaboration with national agencies: Innovation Fund Denmark (ID), The Academy of Finland (AKA), German Research Foundation (DFG), The Research Council of Norway (RCN), and the Swedish Research Council for Environment, Agricultural Sciences and Spatial Planning (FORMAS); as well as from the LIFE Programme COASTal LIFE project (grant no. LIFE21-NAT-DK-COASTal-LIFE/101074422).
The publication of this article was funded by the Swedish Research Council, Forte, Formas, and Vinnova.
This paper was edited by Sebastian Naeher and reviewed by Nezha Mejjad and Scott Jones.
Adams, J. B. and Bate, G. C.: Growth and photosynthetic performance of Phragmites australis in estuarine waters: a field and experimental evaluation, Aquat. Bot., 64, 359–367, https://doi.org/10.1016/S0304-3770(99)00063-7, 1999.
Allen, J.: Morphodynamics of Holocene salt marshes: a review sketch from the Atlantic and Southern North Sea coasts of Europe, Quat. Sci. Rev., 19, 1155–1231, https://doi.org/10.1016/S0277-3791(99)00034-7, 2000.
Anderson, M. J.: A new method for non-parametric multivariate analysis of variance: non-parametric MANOVA for ecology, Austral Ecol., 26, 32–46, https://doi.org/10.1111/j.1442-9993.2001.01070.pp.x, 2001.
Anderson, M. J.: Distance-Based Tests for Homogeneity of Multivariate Dispersions, Biometrics, 62, 245–253, https://doi.org/10.1111/j.1541-0420.2005.00440.x, 2006.
Bakker, J. P., Bos, D., and De Vries, Y.: To graze or not to graze: that is the question, Challenges to the Wadden Sea Area, Proceedings International Wadden Sea Symposium, edited by: Wolff, W., Essink, L., and van Leeuwe, M. A., 67–88, https://www.researchgate.net/publication/258994720 (last access: 3 July 2026), 2003.
Bartoń, K.: MuMIn, Multi-Model Inference, CRAN [code], https://doi.org/10.32614/CRAN.package.MuMIn, 2025.
Bates, D., Mächler, M., Bolker, B., and Walker, S.: Fitting Linear Mixed-Effects Models Using lme4, J. Stat. Softw., 67, https://doi.org/10.18637/jss.v067.i01, 2015.
Berg, M., Joyce, C., and Burnside, N.: Differential responses of abandoned wet grassland plant communities to reinstated cutting management, Hydrobiologia, 692, 83–97, https://doi.org/10.1007/s10750-011-0826-x, 2012.
Burdige, D. J.: Preservation of Organic Matter in Marine Sediments: Controls, Mechanisms, and an Imbalance in Sediment Organic Carbon Budgets?, Chem. Rev., 107, 467–485, https://doi.org/10.1021/cr050347q, 2007.
Burnside, N. G., Joyce, C. B., Puurmann, E., and Scott, D. M.: Use of vegetation classification and plant indicators to assess grazing abandonment in Estonian coastal wetlands, J. Veg. Sci., 18, 645–654, https://doi.org/10.1111/j.1654-1103.2007.tb02578.x, 2007.
Cahoon, D. R., McKee, K. L., and Morris, J. T.: How Plants Influence Resilience of Salt Marsh and Mangrove Wetlands to Sea-Level Rise, Estuar. Coast., 44, 883–898, https://doi.org/10.1007/s12237-020-00834-w, 2021.
Calvin, K., Dasgupta, D., Krinner, G. et al.: IPCC, 2023, Climate Change 2023, Synthesis Report, Contribution of Working Groups I, II and III to the Sixth Assessment Report of the Intergovernmental Panel on Climate Change [Core Writing Team, edited by: Lee, H. and Romero, J., IPCC, Geneva, Switzerland, Intergovernmental Panel on Climate Change (IPCC), https://doi.org/10.59327/IPCC/AR6-9789291691647, 2023.
Campbell, A. D., Fatoyinbo, L., Goldberg, L., and Lagomasino, D.: Global hotspots of salt marsh change and carbon emissions, Nature, 612, 701–706, https://doi.org/10.1038/s41586-022-05355-z, 2022.
Canal-Vergés, P., Frederiksen, L., Egemose, S., Ebbensgaard, T., Laustsen, K., and Flindt, M. R.: Impacts of Sea Level Rise on Danish Coastal Wetlands – a GIS-based Analysis, Environ. Manage., 75, 1039–1054, https://doi.org/10.1007/s00267-024-02096-9, 2025.
Colmer, T. D.: Long-distance transport of gases in plants: a perspective on internal aeration and radial oxygen loss from roots, Plant Cell Environ., 26, 17–36, https://doi.org/10.1046/j.1365-3040.2003.00846.x, 2003.
Cowardin, L., Carter, V., Golet, F. C., and LaRoe, E. T.: Classification of wetlands and deepwater habitats of the United States, John Wiley & Sons, Inc., Washington, DC, https://doi.org/10.1002/047147844x.sw2162, 1979.
Craft, C. B., Seneca, E. D., and Broome, S. W.: Loss on Ignition and Kjeldahl Digestion for Estimating Organic Carbon and Total Nitrogen in Estuarine Marsh Soils: Calibration with Dry Combustion, Estuaries, 14, 175, https://doi.org/10.2307/1351691, 1991.
Danielssen, D.: Oceanographic variability in the Skagerrak and Northern Kattegat, May–June, 1990, ICES J. Mar. Sci., 54, 753–773, https://doi.org/10.1006/jmsc.1996.0210, 1997.
Davidson, K. E., Fowler, M. S., Skov, M. W., Doerr, S. H., Beaumont, N., and Griffin, J. N.: Livestock grazing alters multiple ecosystem properties and services in salt marshes: a meta-analysis, J. Appl. Ecol., 54, 1395–1405, https://doi.org/10.1111/1365-2664.12892, 2017.
De Deyn, G. B., Cornelissen, J. H. C., and Bardgett, R. D.: Plant functional traits and soil carbon sequestration in contrasting biomes, Ecol. Lett., 11, 516–531, https://doi.org/10.1111/j.1461-0248.2008.01164.x, 2008.
Deegan, L. A., Johnson, D. S., Warren, R. S., Peterson, B. J., Fleeger, J. W., Fagherazzi, S., and Wollheim, W. M.: Coastal eutrophication as a driver of salt marsh loss, Nature, 490, 388–392, https://doi.org/10.1038/nature11533, 2012.
Dijkema, K. S.: Salt and Brackish Marshes Around the Baltic Sea and Adjacent Parts of the North Sea: Their Vegetation and Management, Biol. Conserv., 51, 191–209, https://doi.org/10.1016/0006-3207(90)90151-E, 1990.
Duarte, C. M., Losada, I. J., Hendriks, I. E., Mazarrasa, I., and Marbà, N.: The role of coastal plant communities for climate change mitigation and adaptation, Nat. Clim. Change, 3, 961–968, https://doi.org/10.1038/nclimate1970, 2013.
Duarte De Paula Costa, M. and Macreadie, P. I.: The Evolution of Blue Carbon Science, Wetlands, 42, 109, https://doi.org/10.1007/s13157-022-01628-5, 2022.
Dufrêne, M. and Legendre, P.: Species Assemblages and Indicator Species: The Need for a Flexible Asymmetrical Approach, Ecol. Monogr., 7, 345–366, https://doi.org/10.1890/0012-9615(1997)067[0345:SAAIST]2.0.CO;2, 1997.
Elschot, K., Bakker, J., Temmerman, S., Van De Koppel, J., and Bouma, T.: Ecosystem engineering by large grazers enhances carbon stocks in a tidal salt marsh, Mar. Ecol. Prog. Ser., 537, 9–21, https://doi.org/10.3354/meps11447, 2015.
Engloner, A. I.: Structure, growth dynamics and biomass of reed (Phragmites australis) – A review, Flora-Morphol. Distrib. Funct. Ecol. Plants, 204, 331–346, https://doi.org/10.1016/j.flora.2008.05.001, 2009.
European Commission: Interpretation manual for the Annex I of european union habitats, https://eunis.eea.europa.eu/references/2435 (last access: 3 July 2026), 2013.
European Environment Agency: EUNIS habitat classification, https://www.eea.europa.eu/data-and-maps/data/eunis-habitat-classification-1 (last access: 3 July 2026), 2022.
Ford, H., Garbutt, A., Duggan-Edwards, M., Pagès, J. F., Harvey, R., Ladd, C., and Skov, M. W.: Large-scale predictions of salt-marsh carbon stock based on simple observations of plant community and soil type, Biogeosciences, 16, 425–436, https://doi.org/10.5194/bg-16-425-2019, 2019.
Freeman, C., Ostle, N., and Kang, H.: An enzymic “latch” on a global carbon store, Nature, 409, 149–149, https://doi.org/10.1038/35051650, 2001.
Friess, D. A., Yando, E. S., Alemu I, J. B., Wong, L.-W., Soto, S. D., and Bhatia, N.: Ecosystem services and disservices of mangrove forests and salt marshes, in: Oceanography and Marine Biology, edited by: Hawkins, S. J., Allcock, A. L., Bates, A. E., Evans, A. J., Firth, L. B., McQuaid, C. D., Russell, B. D., Smith, I. P., Swearer, S. E., and Todd, P. A., CRC Press, 107–141, https://doi.org/10.1201/9780429351495-3, 2020.
Gotelli, N. J., Chao, A., and Colwell, R. K.: Measuring and Estimating Species Richness, Taxonomic and Phylogenetic Diversity, and Related Biotic (Dis)similarity Indices From Sampling Data, in: Encyclopedia of Biodiversity, Elsevier, 314–339, https://doi.org/10.1016/B978-0-12-822562-2.00104-3, 2024.
Grace, J. B. and Jutila, H.: The Relationship between Species Density and Community Biomass in Grazed and Ungrazed Coastal Meadows, Oikos, 85, 398, https://doi.org/10.2307/3546689, 1999.
Graversen, A. E. L., Banta, G. T., Masque, P., and Krause-Jensen, D.: Carbon sequestration is not inhibited by livestock grazing in Danish salt marshes, Limnol. Oceanogr., 67, https://doi.org/10.1002/lno.12011, 2022.
Gu, J., Van Ardenne, L. B., and Chmura, G. L.: Invasive Phragmites Increases Blue Carbon Stock and Soil Volume in a St. Lawrence Estuary Marsh, J. Geophys. Res. Biogeosciences, 125, e2019JG005473, https://doi.org/10.1029/2019JG005473, 2020.
Heiri, O., Lotter, A. F., and Lemcke, G.: Loss on ignition as a method for estimating organic and carbonate content in sediments: reproducibility and comparability of results, J. Paleolimnol., 25, 101–110, https://doi.org/10.1023/A:1008119611481, 2001.
Hiraishi, T., Krug, T., Tanabe, K., Srivastava, N., Baasansuren, J., Fukuda, M., and Troxler, T. G.: Supplement to the 2006 IPCC Guidelines for National Greenhouse Gas Inventories, Wetlands, IPCC, Intergovernmental Panel on Climate Change, Geneva, Switzerland, https://www.ipcc.ch/publication/2013-supplement-to-the-2006-ipcc-guidelines-for-national-greenhouse-gas-inventories-wetlands/ (last access: 3 July 2026), 2014.
Howard, J., Hoyt, S., Isensee, K., Telszewski, M., and Pidgeon, E. (Eds.): Coastal blue carbon: Methods for assessing carbon stocks and emissions factors in mangroves, tidal salt marshes, and seagrasses., Conservation International, Intergovernmental Oceanographic Commission of UNESCO, International Union for Conservation of Nature, https://www.unep.org/resources/publication/coastal-blue-carbon-methods-assessing-carbon-stocks-and-emissions-factors (last access: 3 July 2026), 2014.
Hughes, A. R., Schenck, F. R., Bloomberg, J., Hanley, T. C., Feng, D., Gouhier, T. C., Beighley, R. E., and Kimbro, D. L.: Biogeographic gradients in ecosystem processes of the invasive ecosystem engineer Phragmites australis, Biol. Invasions, 18, 2577–2595, https://doi.org/10.1007/s10530-016-1143-0, 2016.
Hulisz, P., Piernik, A., Mantilla-Contreras, J., and Elvisto, T.: Main Driving Factors for Seacoast Vegetation in the Southern and Eastern Baltic, Wetlands, 36, 909–919, https://doi.org/10.1007/s13157-016-0803-2, 2016.
Janssen, J. A. M., Rodwell, J. S., García Criado, M., Gubbay, S., Haynes, T., Nieto, A., Sanders, N., Landucci, F., Loidi, J., Ssymank, A., Tahvanainen, T., Valderrabano, M., Acosta, A., Aronsson, M., Arts, G., Attorre, F., Bijlsma, R.-J., Bioret, F., Biţă-Nicolae, C., Biurrun, I., Calix, M., Capelo, J., Čarni, A., Chytrý, M., Dengler, J., Dimopoulos, P., Essl, F., Gardfjell, H., Gigante, D., Giusso del Galdo, G., Hájek, M., Jansen, F., Jansen, J., Kapfer, J., Kontula, T., Mickolajczak, A., Molina, J. A., Molnar, Z., Paternoster, D., Pierik, A., Poulin, B., Renaux, B., Schaminée, J. H. J., Sumberova, K., Toivonen, H., Tonteri, T., Tsiripidis, I., Tzonev, R., and Valachovič, M.: European red list of habitats, Part 2, Terrestrial and freshwater habitats., Publications Office, LU, https://doi.org/10.2779/091372, 2016.
Jutila, H.: Effect of grazing on the vegetation of shore meadows along the Bothnian Sea, Finland, Plant Ecol., 140, 77–88, https://doi.org/10.1023/A:1009744117329, 1999.
Kelleway, J. J., Saintilan, N., Macreadie, P. I., and Ralph, P. J.: Sedimentary Factors are Key Predictors of Carbon Storage in SE Australian Saltmarshes, Ecosystems, 19, 865–880, https://doi.org/10.1007/s10021-016-9972-3, 2016.
Kirwan, M. L. and Megonigal, J. P.: Tidal wetland stability in the face of human impacts and sea-level rise, Nature, 504, 53–60, https://doi.org/10.1038/nature12856, 2013.
Krause-Jensen, D., Gundersen, H., Björk, M., Gullström, M., Dahl, M., Asplund, M. E., Boström, C., Holmer, M., Banta, G. T., Graversen, A. E. L., Pedersen, M. F., Bekkby, T., Frigstad, H., Skjellum, S. F., Thormar, J., Gyldenkærne, S., Howard, J., Pidgeon, E., Ragnarsdóttir, S. B., Mols-Mortensen, A., and Hancke, K.: Nordic Blue Carbon Ecosystems: Status and Outlook, Front. Mar. Sci., 9, 847544, https://doi.org/10.3389/fmars.2022.847544, 2022.
Kristensen, E. and Holmer, M.: Decomposition of plant materials in marine sediment exposed to different electron acceptors (O2, NO, and SO), with emphasis on substrate origin, degradation kinetics, and the role of bioturbation, Geochim. Cosmochim. Acta, 65, 419–433, https://doi.org/10.1016/S0016-7037(00)00532-9, 2001.
Lefcheck, J. S.: piecewiseSEM, Piecewise structural equation modelling in r for ecology, evolution, and systematics, Methods Ecol. Evol., 7, 573–579, https://doi.org/10.1111/2041-210X.12512, 2016.
Lehmann, A., Krauss, W., and Hinrichsen, H.-H.: Effects of remote and local atmospheric forcing on circulation and upwelling in the Baltic Sea, Tellus Dyn. Meteorol. Oceanogr., 54, 299, https://doi.org/10.3402/tellusa.v54i3.12138, 2002.
Leiva-Dueñas, C., Graversen, A. E. L., Banta, G. T., Hansen, J. N., Schrøter, M. L. K., Masqué, P., Holmer, M., and Krause-Jensen, D.: Region-specific drivers cause low organic carbon stocks and sequestration rates in the saltmarsh soils of southern Scandinavia, Limnol. Oceanogr., 69, 290–308, https://doi.org/10.1002/lno.12480, 2024.
Leiva-Dueñas, C., Banta, G. T., Boström, C., Eller, F., Eklöf, J., Andersen, L. H., Jensen, K., Lanari, M., Logemann, E., Masque, P., Ostertag, T., Reisdorff, C., Richard, A., Vehmaa, A., Alm, J., Von Numers, M., and Krause-Jensen, D.: Low Climate Benefit of Nordic Coastal Marshes: Site Conditions Outweigh Grazing Effects and Shape Trade-Offs Between Carbon Storage and Its Stability, Glob. Change Biol., 32, https://doi.org/10.1111/gcb.70889, 2026.
Logemann, E. L., Goesele, C., Jensen, K., and Mueller, P.: Soil Organic Carbon Stocks of German Salt Marshes, A Comparative Study Along Low- and High-Energy Coastlines, J. Geophys. Res. Biogeosciences, 130, e2025JG008797, https://doi.org/10.1029/2025JG008797, 2025.
López-Mársico, L., Altesor, A., Oyarzabal, M., Baldassini, P., and Paruelo, J. M.: Grazing increases below-ground biomass and net primary production in a temperate grassland, Plant Soil, 392, 155–162, https://doi.org/10.1007/s11104-015-2452-2, 2015.
Lüdecke, D., Ben-Shachar, M. S., Patil, I., Waggoner, P., and Makowski, D.: performance, An R Package for Assessment, Comparison and Testing of Statistical Models, https://doi.org/10.31234/osf.io/vtq8f, 23 March 2021.
Macreadie, P. I., Ollivier, Q. R., Kelleway, J. J., Serrano, O., Carnell, P. E., Ewers Lewis, C. J., Atwood, T. B., Sanderman, J., Baldock, J., Connolly, R. M., Duarte, C. M., Lavery, P. S., Steven, A., and Lovelock, C. E.: Carbon sequestration by Australian tidal marshes, Sci. Rep., 7, 44071, https://doi.org/10.1038/srep44071, 2017.
Macreadie, P. I., Costa, M. D. P., Atwood, T. B., Friess, D. A., Kelleway, J. J., Kennedy, H., Lovelock, C. E., Serrano, O., and Duarte, C. M.: Blue carbon as a natural climate solution, Nat. Rev. Earth Environ., 2, 826–839, https://doi.org/10.1038/s43017-021-00224-1, 2021.
Magurran, A. E.: Measuring Biological Diversity, Blackwell Publishing, Oxford, 256 pp., ISBN 0-632-05633-9, 2004.
Martinetto, P., Alberti, J., Becherucci, M. E., Cebrian, J., Iribarne, O., Marbà, N., Montemayor, D., Sparks, E., and Ward, R.: The blue carbon of southern southwest Atlantic salt marshes and their biotic and abiotic drivers, Nat. Commun., 14, 8500, https://doi.org/10.1038/s41467-023-44196-w, 2023.
Maxwell, T. L., Rovai, A. S., Adame, M. F., Adams, J. B., Álvarez-Rogel, J., Austin, W. E. N., Beasy, K., Boscutti, F., Böttcher, M. E., Bouma, T. J., Bulmer, R. H., Burden, A., Burke, S. A., Camacho, S., Chaudhary, D. R., Chmura, G. L., Copertino, M., Cott, G. M., Craft, C., Day, J., De Los Santos, C. B., Denis, L., Ding, W., Ellison, J. C., Ewers Lewis, C. J., Giani, L., Gispert, M., Gontharet, S., González-Pérez, J. A., González-Alcaraz, M. N., Gorham, C., Graversen, A. E. L., Grey, A., Guerra, R., He, Q., Holmquist, J. R., Jones, A. R., Juanes, J. A., Kelleher, B. P., Kohfeld, K. E., Krause-Jensen, D., Lafratta, A., Lavery, P. S., Laws, E. A., Leiva-Dueñas, C., Loh, P. S., Lovelock, C. E., Lundquist, C. J., Macreadie, P. I., Mazarrasa, I., Megonigal, J. P., Neto, J. M., Nogueira, J., Osland, M. J., Pagès, J. F., Perera, N., Pfeiffer, E.-M., Pollmann, T., Raw, J. L., Recio, M., Ruiz-Fernández, A. C., Russell, S. K., Rybczyk, J. M., Sammul, M., Sanders, C., Santos, R., Serrano, O., Siewert, M., Smeaton, C., Song, Z., Trasar-Cepeda, C., Twilley, R. R., Van De Broek, M., Vitti, S., Antisari, L. V., Voltz, B., Wails, C. N., Ward, R. D., Ward, M., Wolfe, J., Yang, R., Zubrzycki, S., Landis, E., Smart, L., Spalding, M., and Worthington, T. A.: Global dataset of soil organic carbon in tidal marshes, Sci. Data, 10, 797, https://doi.org/10.1038/s41597-023-02633-x, 2023.
Mcleod, E., Chmura, G. L., Bouillon, S., Salm, R., Björk, M., Duarte, C. M., Lovelock, C. E., Schlesinger, W. H., and Silliman, B. R.: A blueprint for blue carbon: toward an improved understanding of the role of vegetated coastal habitats in sequestering CO2, Front. Ecol. Environ., 9, 552–560, https://doi.org/10.1890/110004, 2011.
Mueller, P., Do, H., Jensen, K., and Nolte, S.: Origin of organic carbon in the topsoil of Wadden Sea salt marshes, Mar. Ecol. Prog. Ser., 624, 39–50, https://doi.org/10.3354/meps13009, 2019.
Neiske, F., Seedtke, M., Eschenbach, A., Wilson, M., Jensen, K., and Becker, J. N.: Soil organic carbon stocks and stabilization mechanisms in tidal marshes along estuarine gradients, Geoderma, 456, 117274, https://doi.org/10.1016/j.geoderma.2025.117274, 2025.
Nellemann, C., Corcoran, E., Duarte, C. M., Valdés, L., De Young, C., Fonseca, L., and Grimsditch, G.: Blue carbon: the role of healthy oceans in binding carbonn: a rapid response assessment., edited by: United Nations Environment Programme, UNEP, Earthprint, Nairobi, 80 pp., https://portals.iucn.org/library/node/9442 (last access: 3 July 2026), 2009.
Nichols, G.: Sedimentology and stratigraphy, 2nd edn., Wiley-Blackwell, Chichester, 419 pp., ISBN 978-1-4051-3592-4, 2010.
Ouyang, X. and Lee, S. Y.: Updated estimates of carbon accumulation rates in coastal marsh sediments, Biogeosciences, 11, 5057–5071, https://doi.org/10.5194/bg-11-5057-2014, 2014.
Packer, J. G., Meyerson, L. A., Skálová, H., Pyšek, P., and Kueffer, C.: Biological Flora of the British Isles: Phragmites australis, J. Ecol., 105, 1123–1162, https://doi.org/10.1111/1365-2745.12797, 2017.
Park, M. G. and Blossey, B.: Importance of plant traits and herbivory for invasiveness of Phragmites australis (Poaceae), Am. J. Bot., 95, 1557–1568, https://doi.org/10.3732/ajb.0800023, 2008.
Pätsch, R., Schaminée, J. H. J., Janssen, J. A. M., Hennekens, S. M., Bruchmann, I., Jutila, H., Meisert, A., and Bergmeier, E.: Between land and sea – a classification of saline and brackish grasslands of the Baltic Sea coast, Phytocoenologia, 49, 319–348, https://doi.org/10.1127/phyto/2019/0339, 2019.
Pennings, S. C. and Callaway, R. M.: Salt Marsh Plant Zonation: The Relative Importance of Competition and Physical Factors, Ecology, 73, 681–690, https://doi.org/10.2307/1940774, 1992.
Richard, A., Leiva-Dueñas, C., Boström, C., Eichert, B. K., Garnell, A., Nijm, N. H., Andersen, L. H., Jensen, K., Jutila, H., Krause-Jensen, D., Labourdette, N., Lanari, M., Ella Lu Logemann, Möller, K., von Numers, M., Frederiksberg, G. O., Wikström, S. A., Quintana, C. O., Banta, G. T., and Eklöf, J.: Data for Livestock grazing, plant community and abiotic factors shape blue carbon stocks in Nordic coastal marshes, Zenodo [data set], https://doi.org/10.5281/zenodo.18599372, 2026.
Silvestri, S., Defina, A., and Marani, M.: Tidal regime, salinity and salt marsh plant zonation, Estuar. Coast. Shelf Sci., 62, 119–130, https://doi.org/10.1016/j.ecss.2004.08.010, 2005.
Skopp, J., Jawson, M. D., and Doran, J. W.: Steady-State Aerobic Microbial Activity as a Function of Soil Water Content, Soil Sci. Soc. Am. J., 54, 1619–1625, https://doi.org/10.2136/sssaj1990.03615995005400060018x, 1990.
Smeaton, C., Barlow, N. L. M., and Austin, W. E. N.: Coring and compaction: Best practice in blue carbon stock and burial estimations, Geoderma, 364, 114180, https://doi.org/10.1016/j.geoderma.2020.114180, 2020.
Smeaton, C., Ladd, C. J. T., Miller, L. C., McMahon, L., Garrett, E., Barlow, N. L. M., Gehrels, W. R., Skov, M. W., and Austin, W. E. N.: Organic carbon stocks of Great British saltmarshes, Front. Mar. Sci., 10, 1229486, https://doi.org/10.3389/fmars.2023.1229486, 2023.
Spivak, A. C., Sanderman, J., Bowen, J. L., Canuel, E. A., and Hopkinson, C. S.: Global-change controls on soil-carbon accumulation and loss in coastal vegetated ecosystems, Nat. Geosci., 12, 685–692, https://doi.org/10.1038/s41561-019-0435-2, 2019.
Suchrow, S., Stock, M., and Jensen, K.: Patterns of Plant Species Richness Along Environmental Gradients in German North Sea Salt Marshes, Estuar. Coast., 38, 296–309, https://doi.org/10.1007/s12237-014-9810-9, 2015.
Tyler, G.: Hydrology and Salinity of Baltic Sea-Shore Meadows: Studies in the Ecology of Baltic Sea-Shore Meadows III, Oikos, 22, 1, https://doi.org/10.2307/3543356, 1971.
Uddin, M. N. and Robinson, R. W.: Changes associated with Phragmites australis invasion in plant community and soil properties: A study on three invaded communities in a wetland, Victoria, Australia, Limnologica, 66, 24–30, https://doi.org/10.1016/j.limno.2017.07.006, 2017.
Valiela, I., Lloret, J., Bowyer, T., Miner, S., Remsen, D., Elmstrom, E., Cogswell, C., and Robert Thieler, E.: Transient coastal landscapes: Rising sea level threatens salt marshes, Sci. Total Environ., 640–641, 1148–1156, https://doi.org/10.1016/j.scitotenv.2018.05.235, 2018.
Vehmaa, A., Lanari, M., Jutila, H., Mussaari, M., Pätsch, R., Telenius, A., Banta, G., Eklöf, J., Jensen, K., Krause-Jensen, D., Quintana, C. O., Von Numers, M., and Boström, C.: Harmonization of Nordic coastal marsh habitat classification benefits conservation and management, Ocean Coast. Manag., 252, 107104, https://doi.org/10.1016/j.ocecoaman.2024.107104, 2024.
Veldhuis, E. R., Schrama, M., Staal, M., and Elzenga, J. T. M.: Plant Stress-Tolerance Traits Predict Salt Marsh Vegetation Patterning, Front. Mar. Sci., 5, 501, https://doi.org/10.3389/fmars.2018.00501, 2019.
Vestøl, O., Ågren, J., Steffen, H., Kierulf, H., and Tarasov, L.: NKG2016LU: a new land uplift model for Fennoscandia and the Baltic Region, J. Geod., 93, 1759–1779, https://doi.org/10.1007/s00190-019-01280-8, 2019.
Wang, F., Sanders, C. J., Santos, I. R., Tang, J., Schuerch, M., Kirwan, M. L., Kopp, R. E., Zhu, K., Li, X., Yuan, J., Liu, W., and Li, Z.: Global blue carbon accumulation in tidal wetlands increases with climate change, Natl. Sci. Rev., 8, https://doi.org/10.1093/nsr/nwaa296, 2021.
Wanner, A., Suchrow, S., Kiehl, K., Meyer, W., Pohlmann, N., Stock, M., and Jensen, K.: Scale matters: Impact of management regime on plant species richness and vegetation type diversity in Wadden Sea salt marshes, Agric. Ecosyst. Environ., 182, 69–79, https://doi.org/10.1016/j.agee.2013.08.014, 2014.
Ward, R. D.: Carbon sequestration and storage in Norwegian Arctic coastal wetlands: Impacts of climate change, Sci. Total Environ., 748, 141343, https://doi.org/10.1016/j.scitotenv.2020.141343, 2020.
Ward, R. D., Burnside, N. G., Joyce, C. B., and Sepp, K.: Importance of Microtopography in Determining Plant Community Distribution in Baltic Coastal Wetlands, J. Coast. Res., 321, 1062–1070, https://doi.org/10.2112/JCOASTRES-D-15-00065.1, 2016.
Yan, N., Marschner, P., Cao, W., Zuo, C., and Qin, W.: Influence of salinity and water content on soil microorganisms, Int. Soil Water Conserv. Res., 3, 316–323, https://doi.org/10.1016/j.iswcr.2015.11.003, 2015.
Yang, L., Lou, Y., and Tang, Z.: The Response of the Functional Traits of Phragmites australis and Bolboschoenus planiculmis to Water and Saline–Alkaline Stresses, Plants, 14, 2112, https://doi.org/10.3390/plants14142112, 2025.
Yapp, G., Walkerb, J., and Thackway, R.: Linking vegetation type and condition to ecosystem goods and services, Ecol. Complex., 7, 292–301, https://doi.org/10.1016/j.ecocom.2010.04.008, 2010.
Zhong, C., Li, T., Bi, R., Sanganyado, E., Huang, J., Jiang, S., Zhang, Z., and Du, H.: A systematic overview, trends and global perspectives on blue carbon: A bibliometric study (2003–2021), Ecol. Indic., 148, 110063, https://doi.org/10.1016/j.ecolind.2023.110063, 2023.
Zuur, A. F., Ieno, E. N., Walker, N., Saveliev, A. A., and Smith, G. M.: Mixed effects models and extensions in ecology with R, Springer New York, New York, https://doi.org/10.1007/978-0-387-87458-6, 2009.