
the Creative Commons Attribution 4.0 License.
the Creative Commons Attribution 4.0 License.
 | 07 Jul 2026
Radial growth decline in a tropical Andean treeline in Bolivia
Rose Oelkers
Laia Andreu-Hayles
Rosanne D'Arrigo
Hung T. T. Nguyen
Arturo Pacheco Solana
Milagros Rodriguez-Caton
M. Eugenia Ferrero
Ernesto Tejedor
Alfredo F. Fuentes
Carla Maldonado
Daniel Ruiz-Carrascal
The impact of rising temperatures on tropical treeline ecosystems remains understudied. Here we report on the growth history of Polylepis pepei trees growing in Madidi National Park, a tropical forest setting at elevational treeline in the Andes-Amazon ecotone of Bolivia. Using dendrochronological methods, we developed an annually-resolved tree-ring width chronology spanning from 1850 to 2018 CE. To our knowledge this is the longest tree-ring record for this species (168 years). The standardized ring-width chronology revealed a significant radial growth decline after the 1962–1963 growth ring (i.e. 1963–2018). From 1960–2015, smaller ring-widths were associated with drier and warmer conditions during the previous wet season (∼ November–March), while wetter and cooler conditions led to enhanced growth in the following year. P. pepei radial growth decline coincided with a significant increase in minimum temperature and decrease in precipitation and diurnal temperature range that was observed both locally and regionally across tropical South America between 1960–2015. These climate trends at treeline may indicate a reduction in moisture convergence and transport to such higher elevation settings in the Andes. If temperatures continue to rise at current rates, P. pepei growth may continue to decline, threatening the survival of tropical treeline ecosystems in Bolivia.
- Article
(11675 KB) - Full-text XML
- BibTeX
- EndNote


South American treelines or “high montane” forests refer to the upper range limit of tree growth within the Andes Mountains, and are the longest, most biodiverse ecotone in the tropical latitudes (Körner, 2012; Young and León, 2006; Zelazowski et al., 2023). Whether or not such tropical treelines will remain stable under global warming is a topic of great concern due to increasing anthropogenic and climate-related pressures that threaten South American forest dynamics. In recent decades, land-use change and warming temperatures have led to observed shifts in species composition, distribution and increased tree mortality in the tropical Andes treelines (Cuesta et al., 2020; Feeley et al., 2011, 2012; Macek et al., 2009; Young and León, 2006). In southern Peru, ice core records indicated that recent surface warming in the central Andes has been unprecedented in the past 5000 years, and land-atmosphere models suggest the net primary production of upper montane forests in South America will decrease as temperatures increase (Fajardo et al., 2019; Nagy et al., 2023; Thompson et al., 2006). Despite the value of these modeling and plot-based studies of tropical South American treelines, our knowledge of forest age, annual growth patterns, and historical response to climate trends remains limited.
Dendrochronological research in tropical South America is generally underrepresented but has been key in understanding long-term tree-growth and climate variability in the Andes (∼ 8° N to 24° S) (Andreu-Hayles et al., 2023; Groenendijk et al., 2025; Quesada-Román et al., 2022). Tree-ring studies have demonstrated that several Andean treeline species form annual growth rings and that the width (RW) and composition of the rings are tightly coupled to local precipitation and/or temperature conditions (e.g. Escallonia myrtilloides, Polylepis tarapacana, Polylepis reticulata) (Alvites et al., 2019; Argollo et al., 2004; Morales et al., 2004; Requena-Rojas et al., 2020, 2021). Interestingly, dendrochronology has confirmed that the annual climate-growth response of treeline species is not uniform and depends upon the latitudinal and elevational position of the forest along the Andes (e.g. Polylepis pepei RW chronologies in wetter northern Bolivia vs. drier Southern Bolivia) (Jomelli et al., 2012; Roig et al., 2001). In addition to local environmental effects on RW variability at the Andean treeline, some chronologies have been used for long-term high-resolution reconstructions of drought variability for broader South America (e.g. Polylepis tarapacana in Chile and Bolivia; Morales et al. 2020). Interannual to decadal hydroclimate variability in South America is mostly influenced by the El Niño-Southern Oscillation (ENSO) in the Pacific Ocean and South American summer monsoon which peaks in the tropical Andes between December-February (Garreaud, 2009; Vera et al., 2006; Vuille et al., 2000). ENSO-related SST anomalies have contributed to extreme weather events in South America such as seasonal drought, flooding, and other geohazards (Vera et al., 2006; Vuille et al., 2000). Although meteorological stations in South America are short and sparse, treeline Polylepis tarapacana tree-ring width (RW) and oxygen isotopes have faithfully recorded these extreme events and provided year-to-year to centennial records of ENSO variability (Christie et al., 2009; Crispín-DelaCruz et al., 2022; Rodriguez-Caton et al., 2022).
Polylepis is the dominant genus for tropical Andean treelines and the highest elevation tree species in South America (Peyre et al., 2025; Simpson, 1979). The name Polylepis is derived from the Greek word “many layers”, which refers to the multiple sheets of thin, compressed bark useful for thermal insulation at high elevations (Rada et al., 2001; Rodriguez-Caton et al., 2021). However, as the climate warms, frost tolerance may no longer be an advantageous trait, and some studies predict that the germination and spatial distribution of Polylepis at the treeline will decrease as vapor pressure deficits, temperatures, and overall aridity increase in the Andes (Cuyckens et al., 2016; López et al., 2022). To date, it is not known whether such projected decline has already occurred in treeline Polylepis populations.
Here we describe a new tree-ring record of Polylepis pepei from a treeline site at the Madidi National Park (MNP) in Bolivia, a hotspot for biodiversity in the southwestern Andes-Amazon region (Simpson, 1979). The geographic range of P. pepei (family Rosaceae; common name “Kenua” or “Queñoa”) spans from central Bolivia to northern Peru between 3550–4800 m a.s.l. (meters above sea level) (Espinoza and Kessler, 2022). The wide dispersion of leaves and long fruit distinguish P. pepei from other Polylepis species (Simpson, 1979). Tree-ring studies have shown P. pepei can reach significant age (greater than 135 years old) and the RW can be sensitive to both prior and current-year climate variability (Jomelli et al., 2012; Roig et al., 2001). This species is exclusively observed in rocky, and humid environments along the eastern cordillera of the Andes-Amazon and is tolerant to extreme variations in diurnal soil and air temperatures at high elevations (Hertel and Wesche, 2008; Kessler et al., 2014). Like much of the treeline species across the Andes-Amazon, P. pepei is under threat of shifting temperature regimes and human impacts on the ecosystem.
In the small community of Keara, Bolivia where this study is located, extraordinarily warm temperatures led to a catastrophic glacial lake outburst flood that eliminated roads, livestock, and structures in November 2009 (∼ 3800 m a.s.l.) (Hoffmann and Weggenmann, 2013). In recent years, increased temperatures and tree mortality recorded in the Upper Andes vegetation of the MNP has been attributed to an observed upslope migration of mid-elevation tree species (Farfan-Rios et al., 2025). Humans also play a role in modifying the broader forested region of the MNP. Prior to the designation of Madidi as a National Park in 1995, large swaths of economically valuable trees were harvested for timber near the riverbanks of the Tuichi River (e.g. Amburana cearensis near 1000 m a.s.l.) (Macía, 2008). Today, illegal mining and logging activities have deteriorated forest structure and health, with increasing loss of forest cover at lower elevations (below 2000 m a.s.l.) (Finer and Mamani, 2023). At treeline, P. pepei is at risk of endangerment due to habitat loss related to fires and land conversion for cattle ranching or religious practices (Espinoza and Kessler, 2022; Kessler et al., 2014). Since the MNP is facing a rapidly changing environment due to climate and human-related disturbances, high resolution tree-ring records may offer valuable insight on the past and current response of this treeline to rising temperatures. At present, only two tree-ring studies have been published for the MNP: one for Juglans boliviana in Oelkers et al. (2023) (14°40′ S, 68°41′ W; 1300 m a.s.l.) and another by Andreu-Hayles et al. (2015), the latter confirming the formation of annual rings in a Pseudomedia rigida cross-section (14°33′ S, 68°49′ W; 1000 m a.s.l.). The objectives for this study are: (i) to generate the first RW chronology for P. pepei in the MNP and assess radial growth patterns, (ii) to identify the primary climate variables that modulate tree-ring variability (e.g. temperature or precipitation), and (iii) to assess the impacts of extreme climate events at this treeline.
2.1 Climate data
The network of Polylepis pepei for this study is located at treeline in the MNP near the small community of Keara, Bolivia (14.72° S, 69.05° W; 3795–4400 m a.s.l.). Local precipitation data and gridded temperature products were used to generate monthly climate indices for the site between 1960 and 2015. This period was selected for the site climatology and climate-growth analyses due to the limited availability of continuous precipitation data for this region of Bolivia. Daily precipitation from the Italaque station in Bolivia (15.48° S, 69.03° W; 3500 m a.s.l.) was gap filled with nearby station data to generate a continuous monthly timeseries using the “reddPrec” package in R (Huerta et al., 2026). Nearest-neighbor interpolation was constrained to precipitation stations above 3000 m a.s.l. Raw precipitation data for Italaque (1978–2005) and nearby stations (∼ 1945–2015, non-continuous) were obtained from the DECADE dataset, which were originally sourced from the National Meteorology and Hydrology Service of Boliva (Hunziker et al., 2018; SENAMHI, https://senamhi.gob.bo/index.php, last access: 15 June 2026). Monthly mean, minimum, and maximum temperature data (Tavg, Tmin, Tmax) from the nearest grid point in the Climatic Research Unit dataset (CRU) were used for local temperature analyses (1960–2015; 14.75° S, 69.25° W) (Harris et al., 2020).
CRU precipitation and temperature between 1901–2018 was used to determine the average climate conditions during years of extreme ENSO-DJF events (Sect. 2.7; nearest grid point 14.75° S, 69.25° W). Precipitation values from the nearby station were also evaluated for climate during extreme ENSO years, but the timeseries is limited to the period of 1960–2015. We also used CRU monthly diurnal temperature range data (i.e. DTR; the difference between Tmax and Tmin) to evaluate long-term annual and seasonal temperature variability at this treeline between 1901 and 2015.
In addition to the local monthly precipitation and temperature timeseries, we also obtained gridded climate data for the tropical South America region (∼ 15° N–24° S, ∼ 82° W–39° W). Gridded CRU minimum and maximum temperature were used for spatial correlation analyses with the Polylepis pepei ring-width chronology between 1960–2015 (see Sect. 2.6 for more details). Satellite-derived rainfall data from the Climate Hazards Infrared Precipitation V2.0 (CHIRPS) was used for spatial precipitation analyses (Sect. 2.6; Funk et al., 2015). Although CHIRPS v2.0 is limited to observations after 1981, it has a higher spatial resolution (0.05°) than gridded CRU precipitation (0.5°), which can be more valuable for spatial climate-growth analyses in regions with complex topography such as the Andes-Amazon site studied here.
In situ high-resolution climate data was also obtained for this study. In August 2011, HOBO® temperature and relative humidity data loggers (https://www.onsetcomp.com/, last access: 12 June 2026) were installed near the P. pepei trees (14°40′ S, 69°06′ W; 4158 m a.s.l.) and data was recorded hourly from 1 September 2011 to 2 September 2014. New HOBO sensors were installed in 2021 and collected during fieldwork in 2023. Unfortunately, the 2021 system batteries failed within 9 months of the launch, and data was limited to only 20 September 2021 to 23 May 2022. To compare the in-situ records of wet-season climate with the long-term DTR data, daily minimum, maximum and mean temperature and relative humidity was calculated from 1 October to 30 April (∼ 212 d) for the 2011–2012, 2012–2013, 2013–2014 and 2021–2022 seasons. Daily climate distributions were visualized using ridgeline density curves generated with the “ggridges” package in R (Wilke and Wilke, 2022). Differences among the four seasonal distributions for temperature and humidity were evaluated using the nonparametric Kolmogorov-Smirnov (KS) statistic and implemented via the “stats” package in R (Kolmogorov, 1933; Smirnov, 1948). Significance was estimated using a moving-block bootstrap, to account for serial dependence in daily observations (e.g. contiguous 7 d blocks resampled 5000×; Kunsch, 1989).
2.2 Site description and climatology
Two populations of Polylepis pepei were sampled at the MNP treeline in October 2012 and July 2019 (3795–4400 m a.s.l. 14°40′–14°43′ S; 69°04′–69°06′ W; Fig. 1a, c, and d). The 2012 campaign took place within an open-canopy south-facing forest (3795–4100 m a.s.l.), while the 2019 collection was primarily located within a closed-canopy west-facing forest called Waca-cocha (named after a nearby lagoon; 4000–4400 m a.s.l., Fig. 1d). The forests were largely monospecific, dominated by fragmented patches of P. pepei, and a small number of Gynoxys compressissima trees. This treeline is characterized as Alto-Andino Yungueño vegetation (Upper Andean Yungas) with a seasonally humid climate illustrated by the monthly climatology (Fig. 1b).
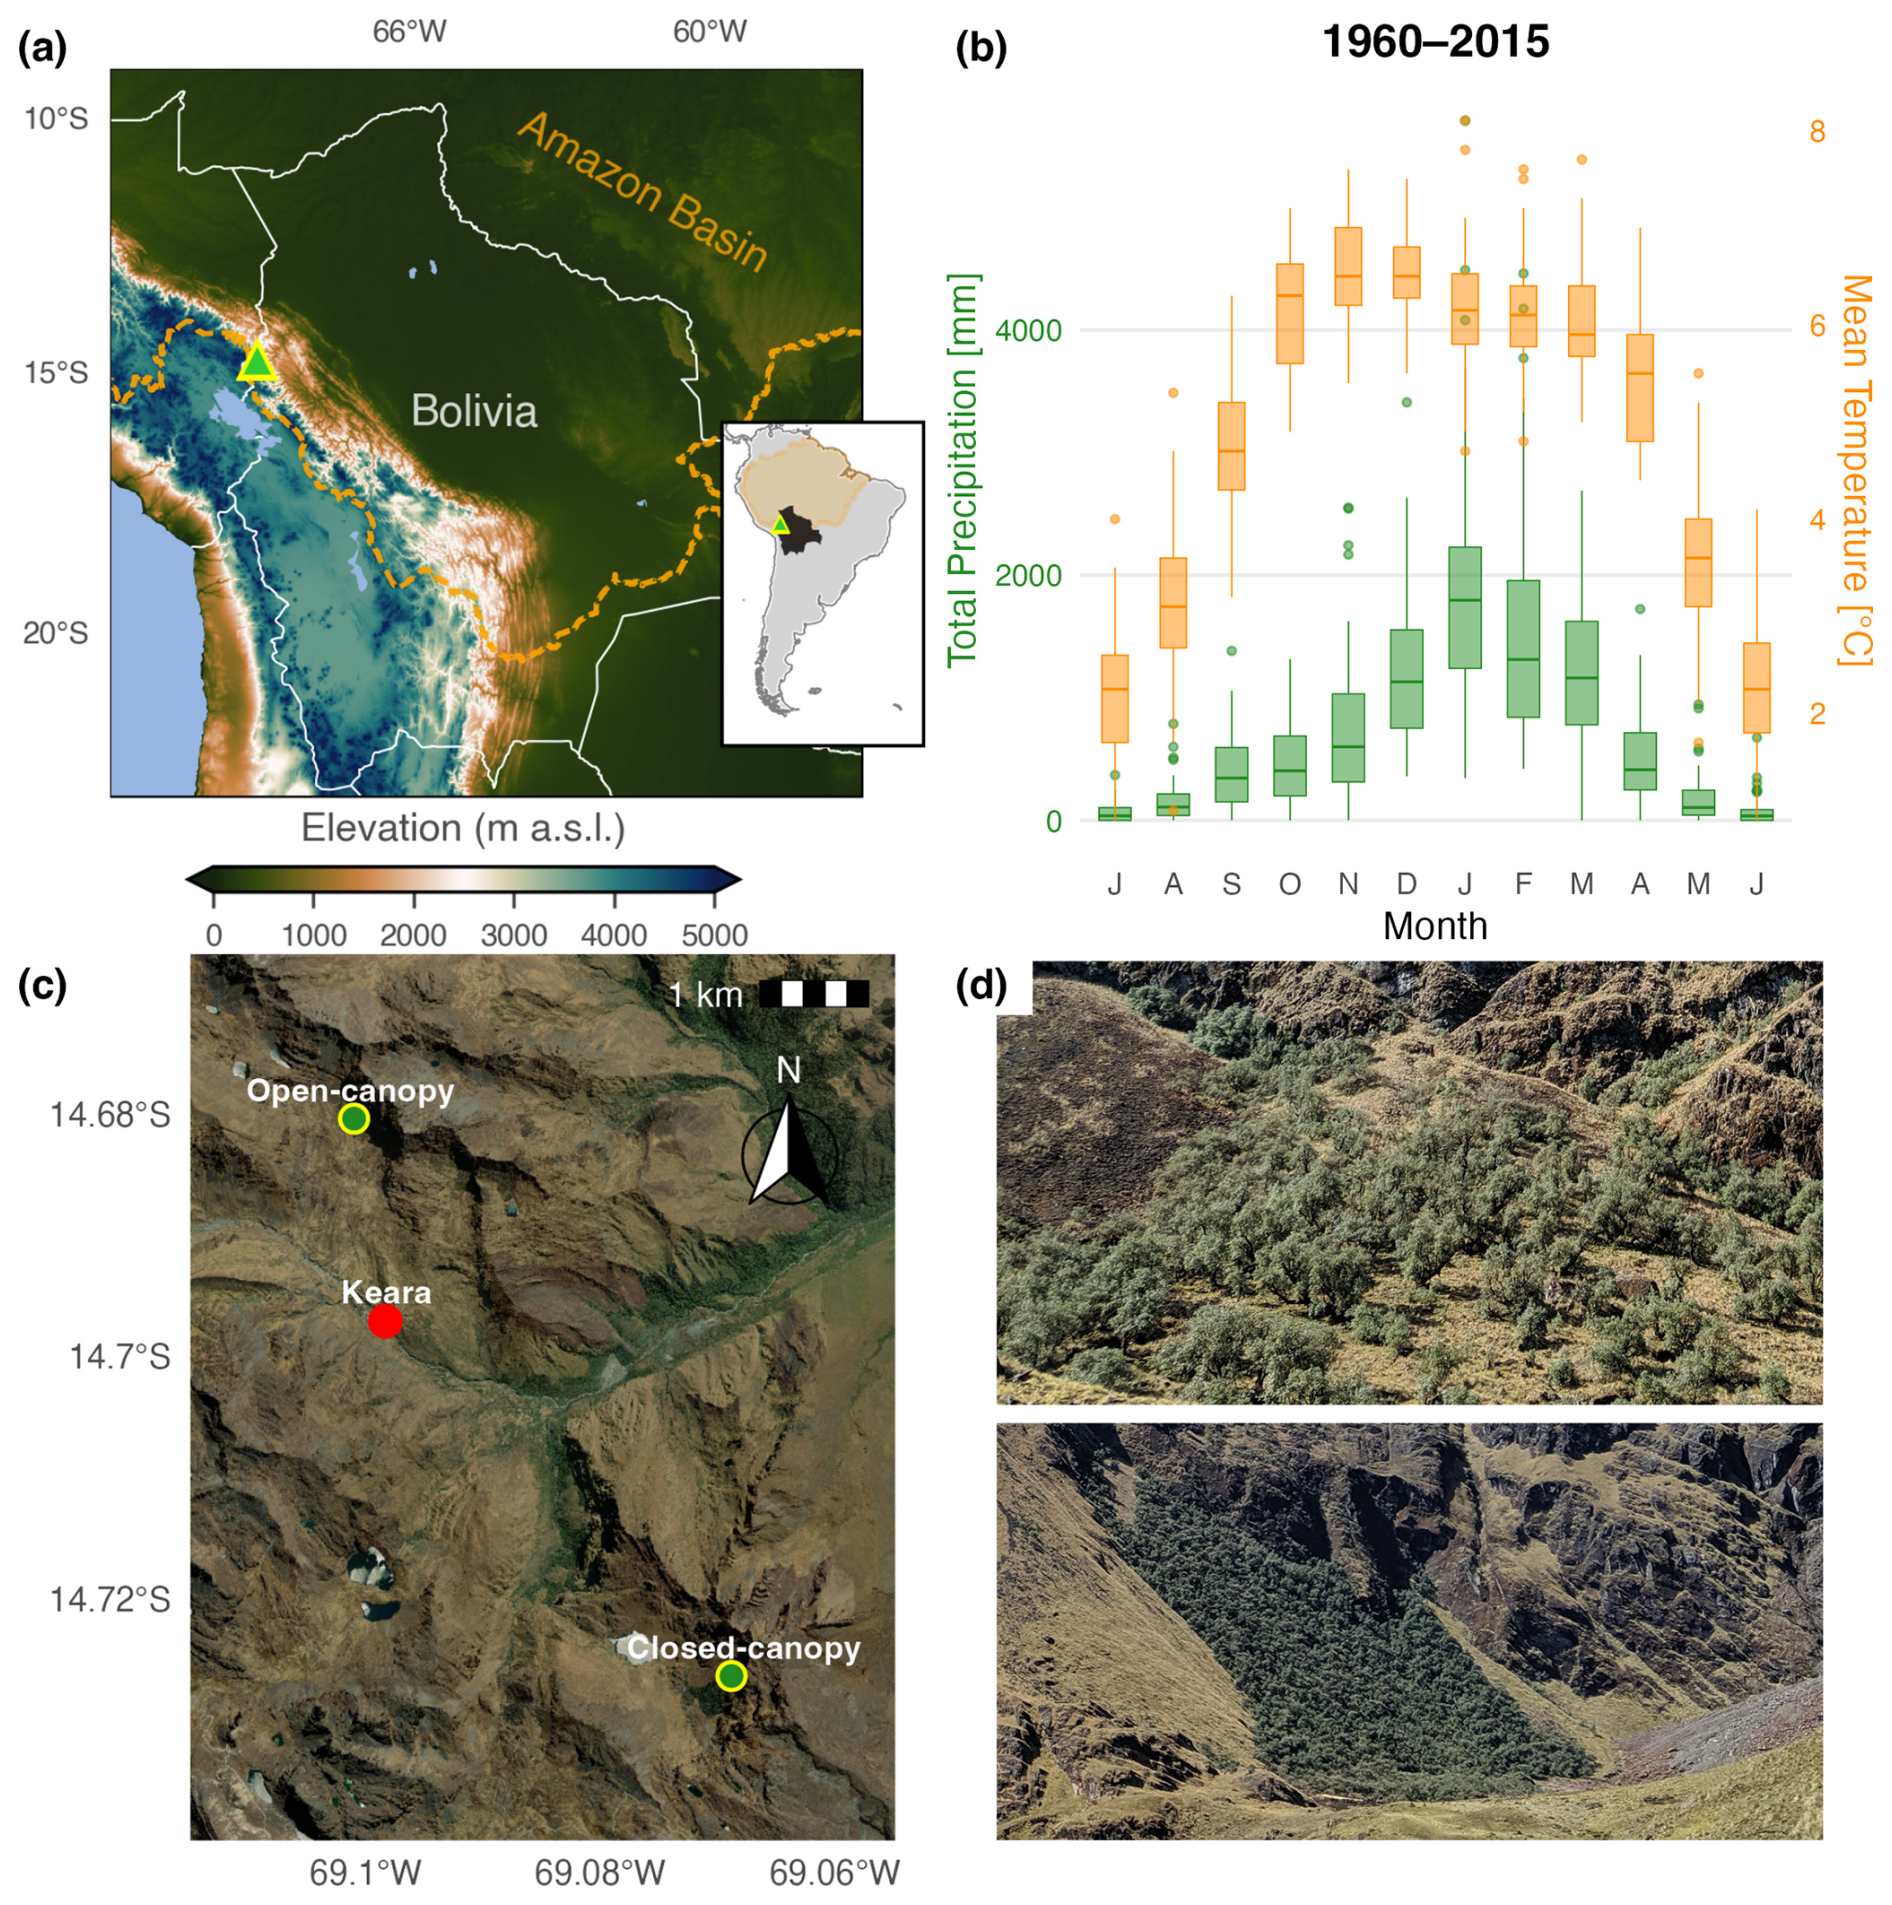
Figure 1(a) Location of Polylepis site in the Eastern Cordillera of the Andes-Amazon ecotone in Bolivia. The orange dotted line (and orange shading in the inset map) represent the spatial limits of the Amazon Basin. The elevation map was generated using the “ETOPO-1” model (https://www.ncei.noaa.gov/products/etopo-global-relief-model, last access: 12 June 2026) (b) The monthly climatology for the region of Keara between 1960–2015. Monthly distribution of mean temperature was generated using the nearest temperature CRU gridpoint (14.75° S, 69.5° W) and total precipitation is reconstructed for the Italaque station (15.48° S, 69.03° W). (c) Aerial view of the sampling locations near the community of Keara, and the MNP treeline (d) photos of open-canopy (top) and closed-canopy (bottom) forest patches sampled at altitudinal treeline in Bolivia's MNP (∼ 3800–4400 m a.s.l.). The basemap in (C) was obtained through opensource ESRI images | Powered by Esri.
There is a distinct wet season from October–April and dry season from June-August at this site (Fig. 1b). 90 % of annual rainfall occurs during the wet season with an average of 1045 mm month−1 and a mean temperature range between 5–7 °C. In contrast, the dry season is characterized by mean precipitation totals of 95 mm and cooler average temperatures between 2.2–3.1 °C. October and November are the warmest months of year with maximum temperatures around 14.5 °C (austral spring), but precipitation totals peak in January with an average of ∼ 1900 mm (austral summer). The coldest and driest month of the year is July when minimum temperatures and precipitation are as low as −8.3 °C and 65 mm, respectively (austral winter, Figs. 1b and A1). There is a marked seasonality in diurnal temperature range with smaller differences in minimum and maximum temperatures during the peak wet-season (∼ 14.5 °C, December–March; Fig. A1). Specifically, minimum temperatures range from −2.2 to 0 °C and maximum temperatures from 12 to 14.5 °C during the wetter months of October–April. Diurnal temperature differences are largest during the dry season (∼ 20 °C; June through August) with minimum temperatures ranging from −7 to −8.3 °C and maximum temperatures between 12.5 to 13.3 °C.
2.3 Wood processing and anatomical analyses
Tree-ring samples from at least 30 living P. pepei were collected using a 2-threaded 16 in. increment borer (5 mm in diameter) in October 2012 and July 2019. Two to four cores were extracted from varying directions within the stem (north, south, east, and/or west radii) in an to effort sample an accurate representation of radial growth. Trees were cored at breast height (∼ 1.2 m from the ground), or near the base of the largest stem for multi-stemmed trees (∼ 30 cm). During the 2019 field campaign, tree-diameter was also measured at the height core samples were sampled (1.2 m on average). Tree-ring cross sections from 3 recently dead trees were sliced using a standard saw-tooth blade.
Wood samples were shipped from the National Herbarium of Bolivia in La Paz to the Lamont-Doherty Earth Observatory in New York, USA for dendrochronological analysis. Cores and cross sections were finely sanded up to 1000 grit using an orbital sander and manually polished with microfiber paper. Most samples had surficial color differences within the stem, mainly reflecting transitions between the heartwood (functional xylem near the pith, darker color) and sapwood (the active xylem beyond the cambium layer, lighter color).
P. pepei is an angiosperm with diffuse porous wood anatomy, which is particularly hard to cross-date due to less distinct boundaries between the latewood of the prior year growth ring and the earlywood of the next year (Fig. A2). To aid in identifying ring-boundaries in the wood, histological (micro) cuts were performed on a single cross-section following the techniques described in von Arx et al. (2016) using a WSL Core microtome (https://www.wsl.ch/en/services-produkte/microtomes/, last access: 21 June 2026). High-resolution images of the thin sections were captured using an Echo Revolve R-4 microscope camera, with a magnification of 40X. Further information regarding the wood anatomy of this species is included in the Appendix (Fig. A2).
2.4 Tree-ring width chronology development
Tree rings from 31 trees (51 radii) were dated visually using standard dendrochronological techniques (Stokes and Smiley, 1968). Each wood sample was scanned using an Epson Expression 11000XL scanner at 3200 dpi resolution and RW was measured digitally using the CooRecorder image analysis program (Maxwell and Larsson, 2021). The P. pepei RW timeseries were statistically crossdated using both the COFECHA program (Holmes, 1983) and dplR package in R (Bunn, 2008). To independently confirm annual periodicity of the growth rings, radiocarbon dating was conducted on a cross-section collected in 2019 from the closed-canopy forest. Individual tree rings associated with the years 1957, 1958, 1962, 1963, 1964, 1965, 1971, and 1972 were sliced, extracted for cellulose, and processed for modern radiocarbon analyses. All radiocarbon measurements were compared to the monthly atmospheric Δ14C radiocarbon curves from the designated Southern Hemisphere Zones 1–2 and 3 (1950–2019 CE) (Hua et al., 2022). Further details on the radiocarbon analyses and earlier iterations of the Keara RW chronology can be found in the Appendix (Fig. A2c).
Once the tree-ring samples were cross-dated, we applied the Schulman convention to the RW timeseries (Schulman, 1956), which assigns each ring date as the year growth began (e.g. the last complete ring for samples collected in July 2019 is assigned 2018). Individual time series were detrended conservatively with age-dependent cubic splines using the “dplR” package in R (initial spline stiffness of 60 years) (Bunn, 2008; Cook and Peters, 1981; Melvin, 2004). We produced a dimensionless `standard' RW chronology by taking the ratio of the fitted and observed RW values of detrended time series and combining the series using a robust Tukey bi-weight mean (Cook et al., 1990). For the residual chronology, autocorrelation was removed from the series using autoregressive modelling determined by the Akaike Information Criterion (Akaike, 1974). A third chronology of average (raw) RW was also generated to review the absolute growth of these trees at treeline. The final chronologies (raw, standard, residual) represent the RW data for entire P. pepei network (i.e. 2012 and 2019 tree samples) and thus variance stabilization was applied to account for temporal changes in sample depth (Frank et al., 2006). The standard RW chronology was primarily used for changepoint and RW-climate correlation analyses (Sect. 2.5), and the residual chronology was used for (i) identification of small or large outliers in the chronology (top 5th and 95th percentiles) and (ii) analyses of the growth response of P. pepei to detrended monthly and residual climate and extreme ENSO events (see Sect. 2.6).
The subsample signal strength (SSS) calculation was used to determine how well the available tree-ring samples represent the common growth signal of the P. pepei population (i.e. site) (Cook and Pederson, 2011). SSS quantifies the strength of the shared variance through time by incorporating the number of cores per tree, the number of individual trees, and the mean interseries correlation among RW series. An SSS threshold of 0.85 (or better) is commonly used in dendrochronology and signifies the years when sample replication is adequate and the chronology is considered robust (see discussions in Buras (2017) and Wigley et al. (1984) for more details). The SSS metric for this site was evaluated using the “dplR” package in R (Bunn, 2008).
2.5 Changepoint detection
Changepoint analyses of the raw and standard RW chronologies was used to detect abrupt shifts in radial growth before and after low-frequency is removed (i.e. before and after detrending biological-related growth effects). We specifically analyzed the chronologies during the period in which SSS was greater than 0.85 (1900–2018). The Pettit's (1979) changepoint test was applied using the “trend” package in R (Pohlert, 2016). This test identifies a single year when the median tendency of the RW chronology is significantly higher or lower after the changepoint. Significance of the RW trend for the post-changepoint period was evaluated using the non-parametric Mann-Kendall test on an estimated Sen's slope (Sen, 1968).
2.6 Climate-growth analyses
To explore the climate sensitivity of treeline Polylepis pepei, we correlated annual RW with local monthly and seasonal precipitation, and minimum, maximum, and mean temperature data (1960–2015; see Sect. 2.1). Correlations were evaluated for a 24-month window which spanned from prior July to current June to account for potential lagged climate effects on P. pepei RW. Long-term and inter-annual growth response was assessed by correlating both (i) the standard RW with mean climate data, and (ii) residual RW with linearly detrended climate data. 3-and 4-month seasonal climate correlations (standard and residual) were calculated to determine whether P. pepei growth at this site is influenced by cumulative rather than monthly temperature and precipitation conditions.
Pearson correlations (r) were estimated using stationary block-bootstrapping methods and implemented with the “boot” package in R (Canty and Ripley, 2017). This technique resamples contiguous, randomly-sized blocks of data 1000 times to preserve autocorrelation and quantify the uncertainty of the RW-climate relationship (Politis and Romano, 1994). Significance was inferred from the two-tailed 95 % confidence intervals of the median bootstrapped correlation (i.e. 95 % CI excludes zero). Due to the covariance between temperature and precipitation in this region, we used bootstrapped partial correlations (rp) to evaluate the independent effect of one variable on RW (e.g. temperature), while controlling for the other (e.g. precipitation). Following methods of Meko et al. (2011), partial correlation coefficients for RW-temperature were obtained by: (i) first performing a linear regression between RW and precipitation and (ii) calculating bootstrapped correlations between temperature and the residuals from this regression. After removing the influence of precipitation, partial correlations represent the distinct portion of RW variability that is explained by monthly temperature.
Spatial correlations between the standard RW chronology and tropical South America climate were conducted to evaluate the magnitude of P. pepei climate sensitivity to regional temperature (Tmax and Tmin) and precipitation variability. The seasonal window for each climate variable was inferred from the significant monthly and seasonal climate-growth correlations that were conducted with local station data. The CHIRPS v2.0 dataset was used for gridded precipitation correlations that covered the 1981–2015 period, and CRU TS 4.08 data for 1960–2015 maximum and minimum temperature correlations (Sect. 2.1). Field significance was cross-validated using a binomial test to assess the probability that n number of grid-cell correlations were significant (α=0.05) by chance due to the high number of comparisons (see Livezey and Chen, 1983).
Linear trends in the seasonal climate data between 1960–2015 were assessed using the Sen's slope estimation (Sen, 1968), and significance of the trend was evaluated using Mann Kendall tests. Slopes were reported as the average change in climate decade−1. Annual and seasonal (October–April; June–August) trends of diurnal temperature anomalies (DTR) were also evaluated for the same period. Additionally, monthly anomalies of minimum and maximum temperature were calculated relative to the 1901–2015 CRU baseline (full temporal extent of CRU data) to illustrate long-term temperature variability of the wet and dry seasons.
2.7 Superposed Epoch Analysis
ENSO varies between warmer (El Niño) and cooler (La Niña) SST phases in the Pacific Ocean, and both extremes substantially impact precipitation and temperature conditions over tropical South America (Ropelewski and Halpert, 1987). To investigate the effects of extreme ENSO events on tree-growth, Superposed Epoch Analysis (SEA) was performed on the residual RW timeseries using the method originally described by Haurwitz and Brier (1981) and modified by Rao et al. (2019). SEA is widely used to statistically determine whether the effects of episodic events (e.g. extreme climate events) on a response variable (in this case RW) are statistically significant or due to random noise. The Rao method uses 1000 random-sample double bootstrapping to quantify the RW response at the time of the event (lag = 0) and several years after (in this case four years).
We analyzed the growth response of P. pepei for 26 of the top-ranked December–February (DJF) El Niño and La Niña events (n=13 each) determined by the National Oceanic and Atmospheric Administration's Physical Science Laboratory (NOAA-PSL: https://psl.noaa.gov/enso/, last access: 21 June 2026). Extreme DJF Pacific SST anomalies identified by the NOAA-PSL are based on the multivariate ENSO indices (1871–2024; MEI). The MEI reflects the principal components, or dominant modes, of the entire tropical Pacific ENSO domain (30° N–30° S, 100° E–70° W) rather than any one region (e.g. Niño 3.4) and integrates observations of sea level pressure, SSTs, meridional wind, and outgoing longwave radiation (see Wolter and Timlin, 2011). These events coincide with the typical rainy season at our site, and when ENSO is phase-locked with the peak monsoon season for South America (Rasmusson and Carpenter, 1982). The list of DJF-ENSO years used for SEA are included in Appendix A Table A1.
3.1 Growth decline in a P. pepei tree-ring chronology
The P. pepei RW chronology covers the period 1850–2018 and consists of 51 tree-ring samples (31 individual trees) from open and closed-canopy forests near the MNP treeline (Table 1 and Fig. 2). Radiocarbon and standard dendrochronological methods confirmed these trees form annual rings and share a common growth signal in this region (Fig. 2a, c, and d). Site metadata and RW chronology statistics for the P. pepei network are summarized in Table 1.
Table 1Summary of P. pepei tree-ring sample location, age, sample size, and mean correlation among RW timeseries. The RW chronologies represent the entire collection of cross-dated P. pepei samples in Keara obtained in both 2012 and 2019.
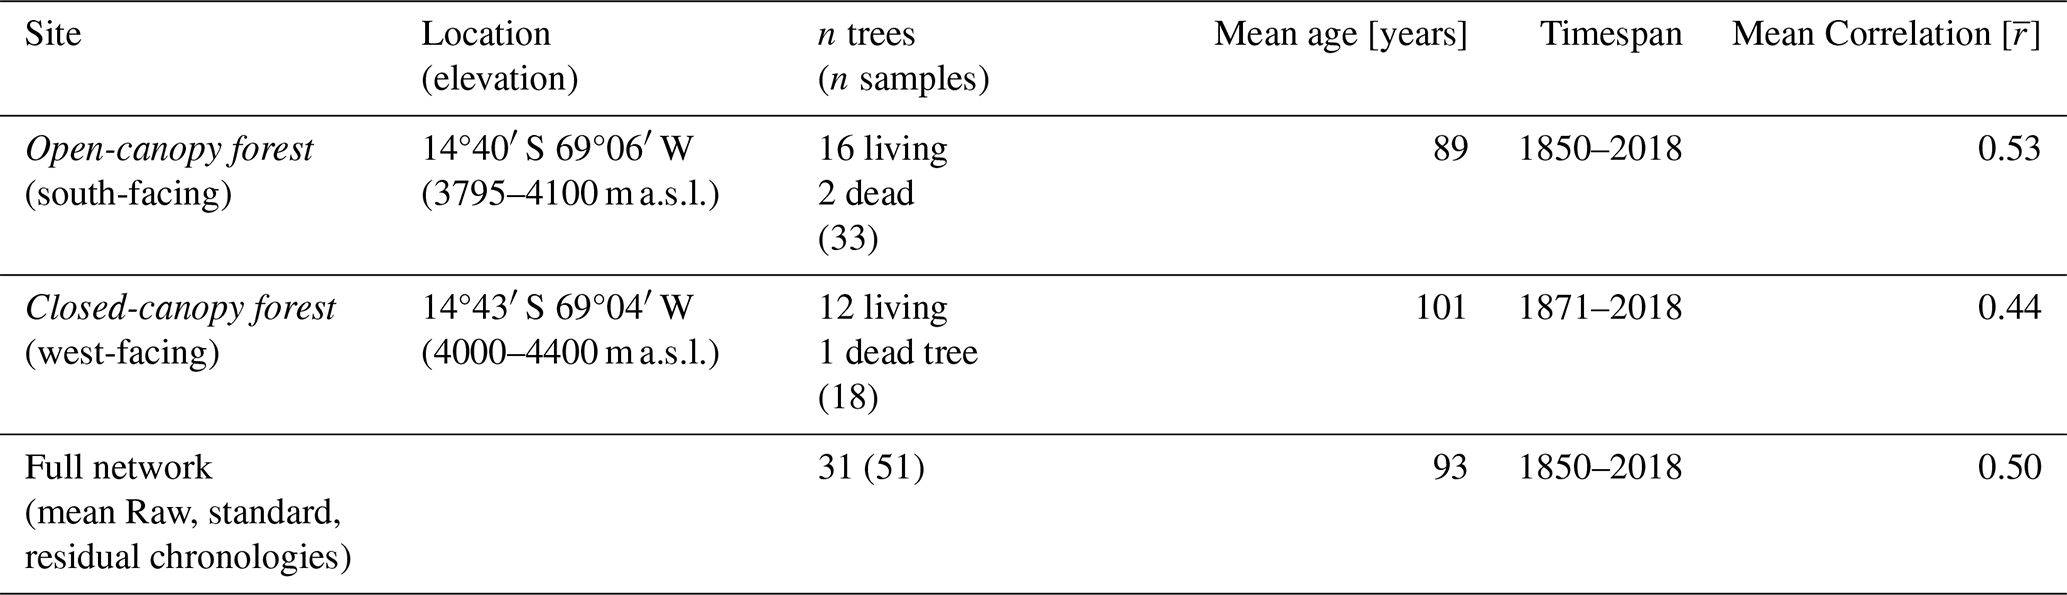
Due to extreme suppression in radial growth (Fig. 2b), only one or two cores from the living trees could be measured and included in the final RW chronologies. Despite the complex anatomy of P. pepei, the cross-dated samples shared a coherency in the RW patterns with a mean inter-series correlation of for the 1850–2018 period. The oldest living tree sampled was 168 years of age from the open-canopy forest. The average age of the trees was 93 years and the average growth rate between 1850–2018 at this site was ∼ 1.0 mm yr−1. DBH measurements in 2019 confirmed these trees were slow-growing with stem diameters ranging from 10 to 54 cm (mean DBH of 30 cm). The sub-sample signal strength indicated the RW chronology is particularly robust between 1900–2018 when sample size exceeds 17 (SSS >0.85).
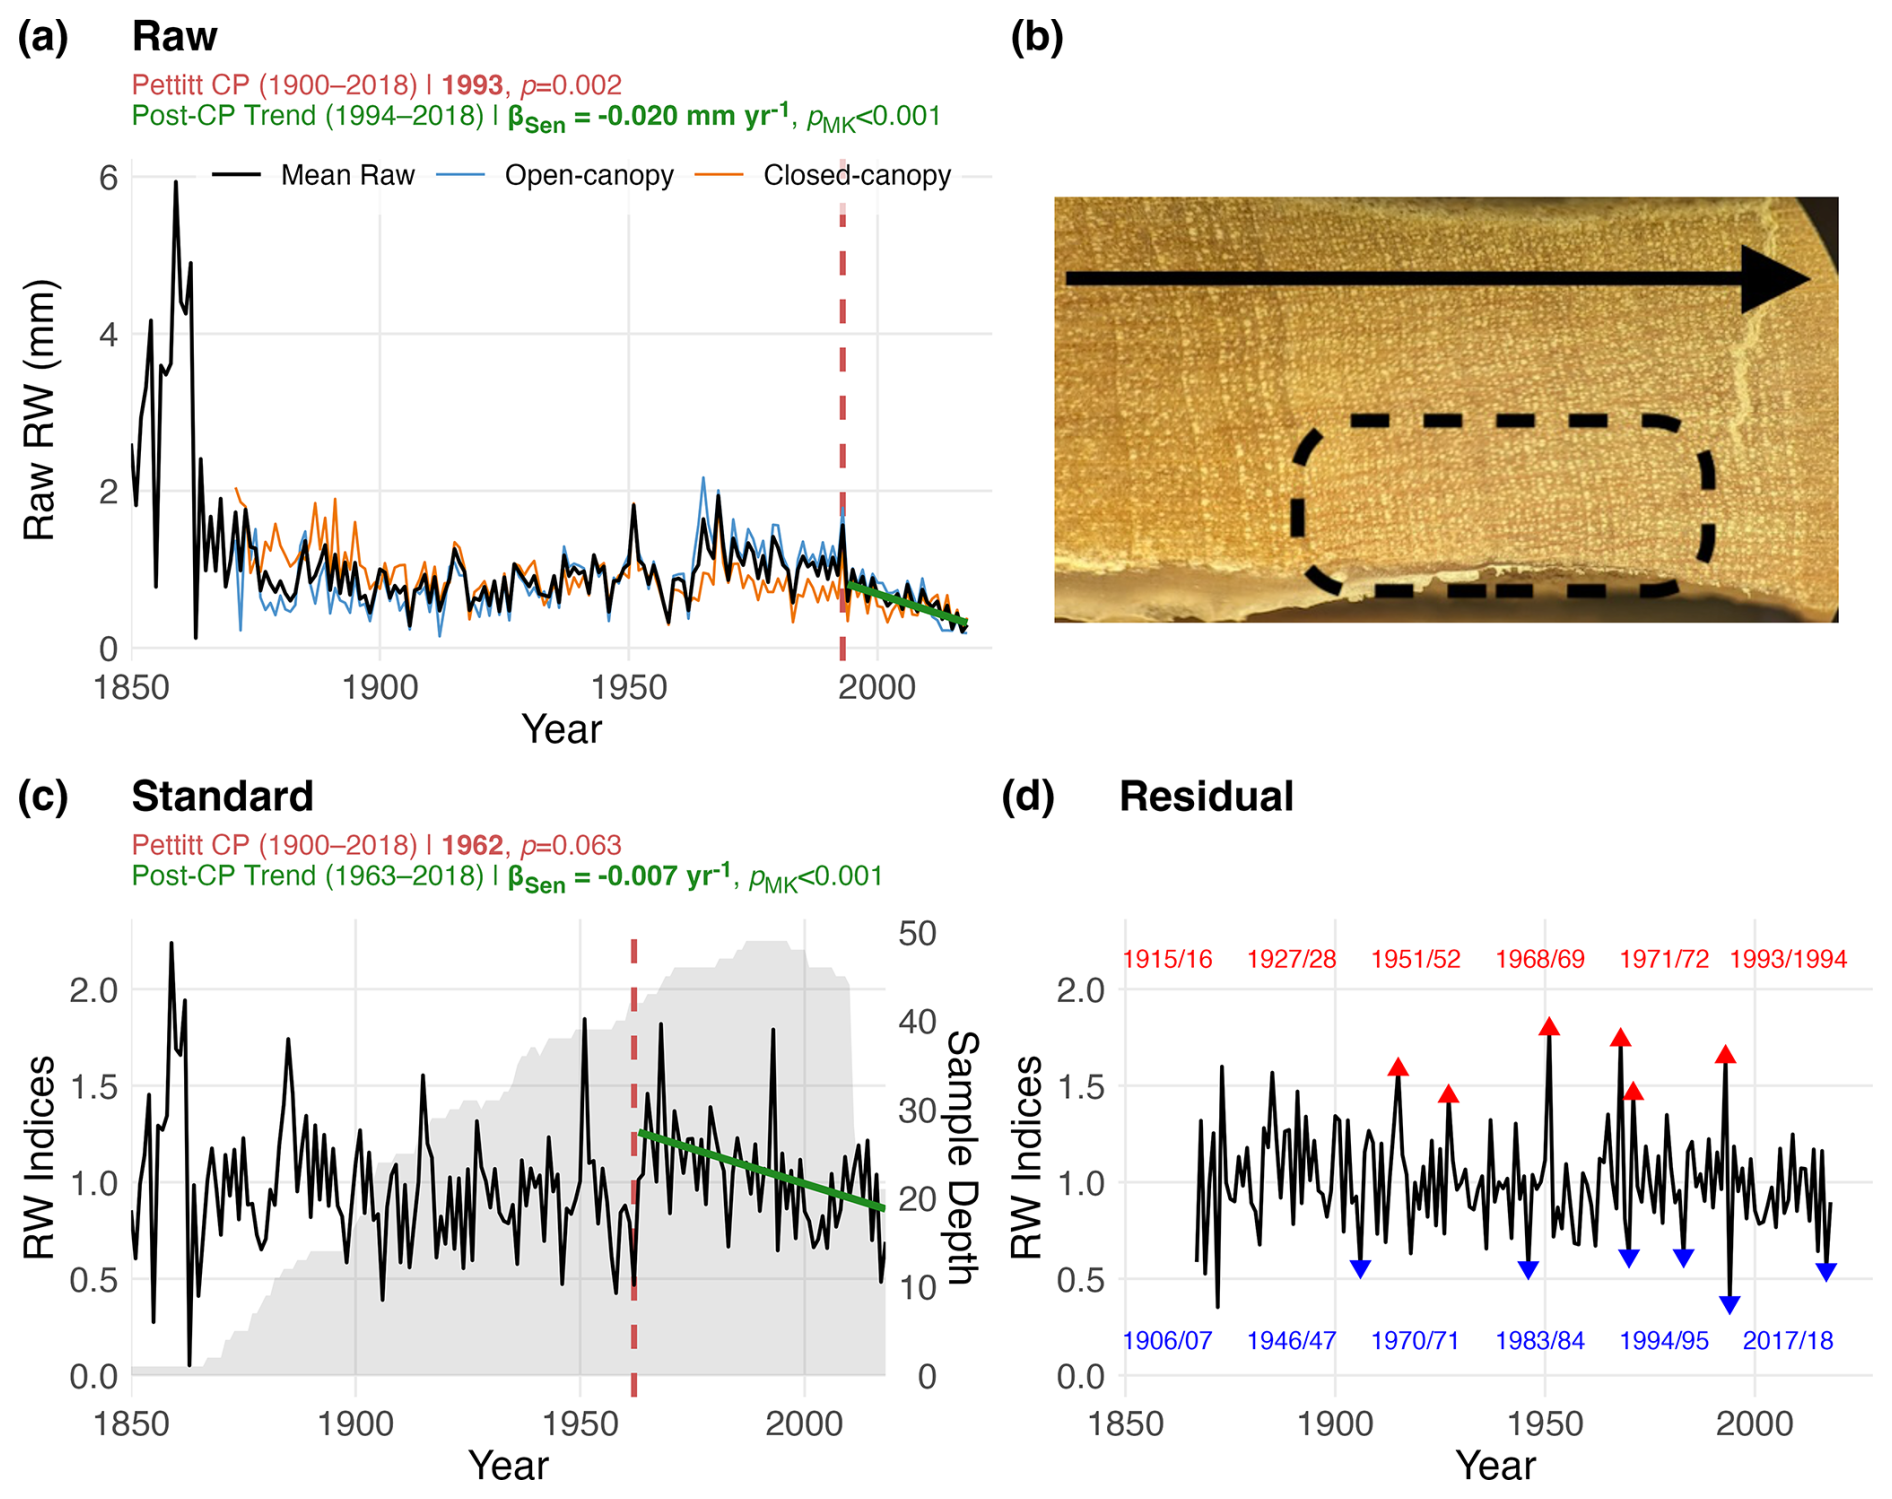
Figure 2The (a) raw (c) standard and (d) residual RW chronologies of P. pepei in Keara. The chronologies (1850–2018) are plotted using the Schulman convention (i.e., anchored on the year of initial ring formation; see Sect. 2.4). (b) An image depicts a core sample where several rings are suppressed within a 4 mm distance (dashed circle). The black arrow indicates the direction of radial growth for this core (from left to right). (c) The standard RW is plotted with the mean sample-depth of the full network through time (grey-shading). Blue and red triangles on the residual timeseries (d) signify the years within the top 5th and 95th percentiles of RW since 1900 (SSS > 0.85). Since the tree rings are estimated to form during the wet season (two calendar years between October and April), both years are labeled in the colored text and ordered chronologically within the plot (d). Vertical red lines signify the significant changepoints detected in the raw and standardized RW chronologies (1900–2018; SSS > 0.85), while the green solid lines represent the trends after the changepoint estimate via Sen's slope. Changepoint and trends statistics for the raw and standard RW chronologies are included in the subtitles for (a) and (c). There was a significant decline in raw (radial) RW after the 1993/1994 growth-year (i.e. 1994–2018) and between 1963–2018 in the standard RW chronology.
P. pepei RW at this treeline has been declining steadily since the 1960s (Fig. 2a and c). A changepoint in the raw RW chronology was detected in 1993 (p=0.0019), with a significant decline of 0.02 mm yr−1 after 1994. This trend in absolute growth is evident in both the open-canopy and closed-canopy forests at the site (Fig. 2a). Although a non-significant changepoint in the standard RW chronology was detected in 1962 (p=0.062), two-tailed Mann-Kendall tests determined the negative slope between 1963–2018 was significant (−0.007 units yr−1, p<0.001; Fig. 2c).
3.2 Monthly and seasonal climate-growth relationships at Keara's treeline
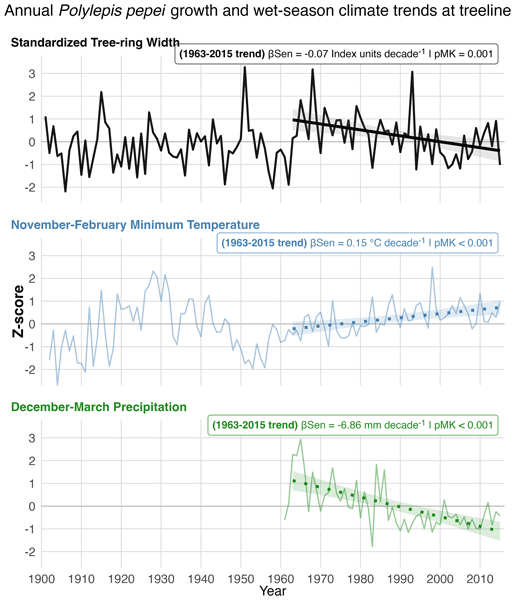
The climate sensitivity of P. pepei RW is illustrated by bootstrapped correlations with monthly mean precipitation and temperature timeseries (1960–2015; Figs. 3 and A3). P. pepei RW benefitted from higher rainfall in the months of December–April (lag = 1, r=0.39 for February; Fig. 3a). This forest had a more significant RW response to cumulative rather than monthly precipitation variability, with the highest correlations observed for the 4-month December–March season (DJFM lag = 1, r=0.42, p=0.008; Figs. A3a and A4a, b). Although DJFM precipitation significantly decreased at this site at a rate of ∼ 6 mm decade−1 after 1960 (Fig. 4a), residual RW-precipitation correlations remained significant after climate trends were removed (Fig. A4b).
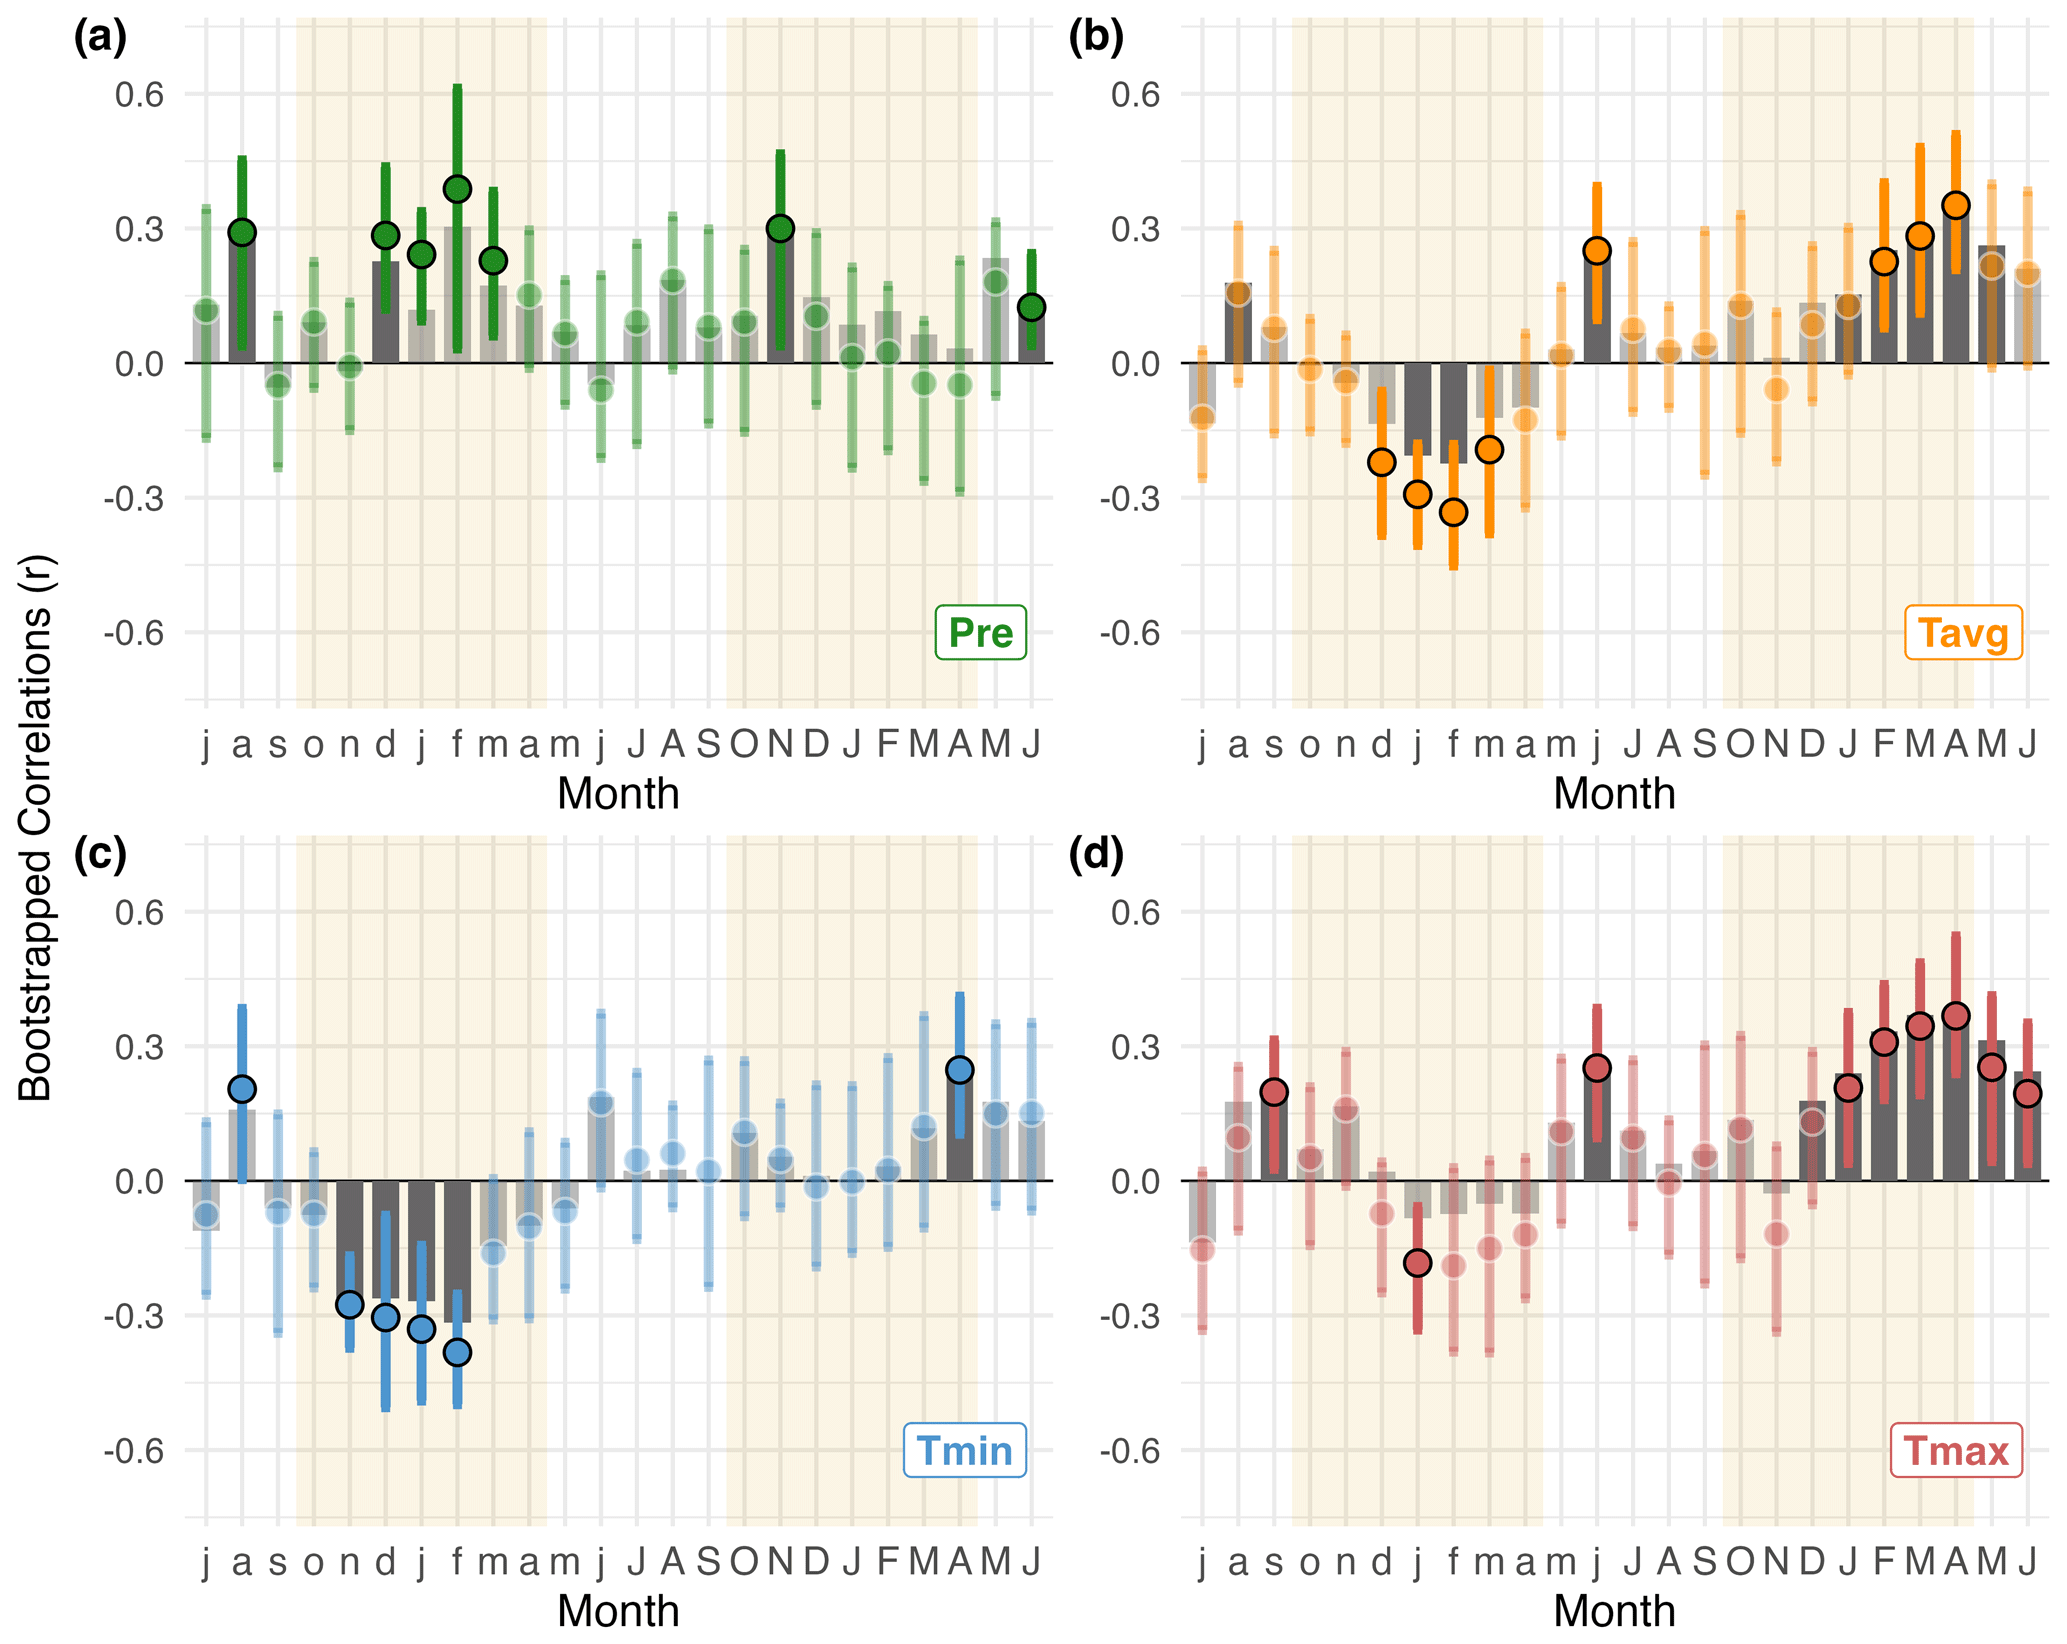
Figure 3Standard bootstrapped correlations between P. pepei RW and average monthly climate from 1960–2015. The x-axis covers the 24-month period between July of the prior-year (lag = 1, lowercase letters) and June of the current year (lag = 0, uppercase letters). Tan shading indicates the wet-season for the study region (∼ October–April). (a) correlations between RW and local precipitation data (green, Pre). (b–d) RW correlations with monthly mean (orange, Tavg), minimum (blue, Tmin), and maximum temperature (red, Tmax) from the nearest CRU TS 4.08 gridpoint data. Significant correlations, inferred by the 95 % bootstrapped confidence intervals, are represented as solid–colored circles (median Pearson coefficient r) or solid grey bars (partial correlations, rp).
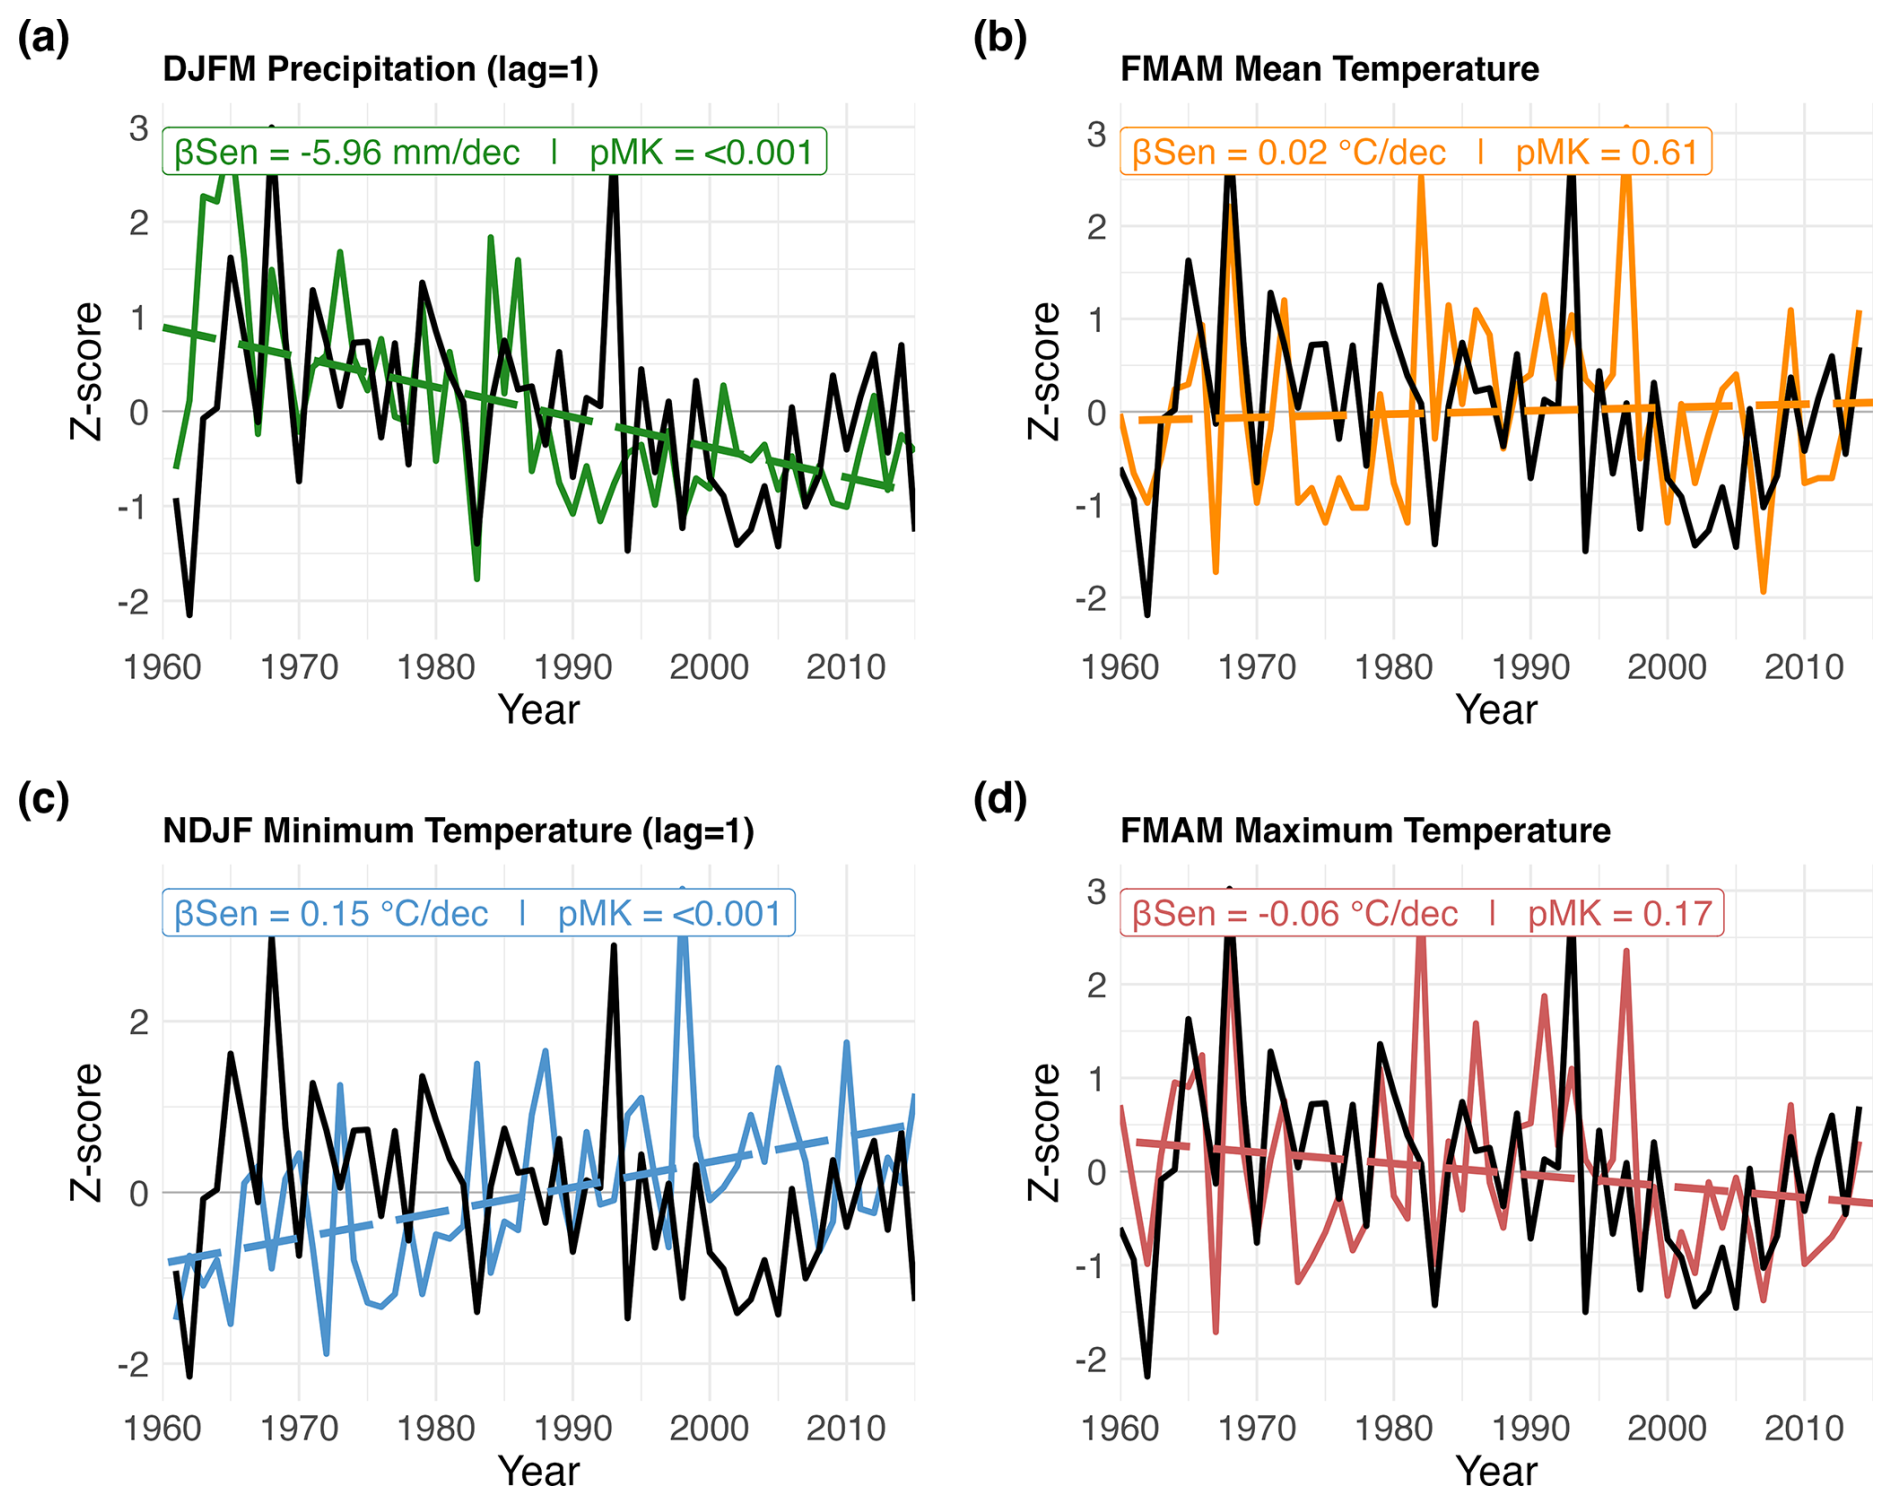
Figure 4Z-scored P. pepei RW (black lines) and seasonal climate variables (colored solid lines) near the study site for the 1960–2015 period. (a) Lagged DJFM Precipitation is green (lag = 1), (b) FMAM mean temperature is orange (lag = 0), (c) lagged NDJF minimum temperature is blue (lag = 1) and (d) FMAM maximum temperature is red (lag = 0). Seasonal windows were selected based on the most significant RW-Climate correlations (standard and residual, p<0.05). Averaged seasonal trends are reported in units of climate decade−1 (β, colored dashed lines). Mann-Kendall tests were used to estimate the two-tailed significance of the linear trend (pMK). Precipitation data is reconstructed from nearby station records and temperature data is sourced from the nearest CRU TS 4.08 grid point for the site.
In general, wet-season precipitation is significantly and negatively correlated with temperature variability at this treeline (October–April , p=0.02). Despite the covariance between precipitation and temperature conditions, partial correlations revealed a robust and independent relationship between RW and current-year temperatures (i.e. the monthly correlations persist after controlling for precipitation effects on RW variability; lag = 0 Fig. 3b–d). P. pepei RW was positively correlated with current-year mean and maximum temperatures particularly for the month of April (lag = 0, Tavg r=0.37, Tmax r=0.38; Fig. 3b and d). The strongest positive correlations with temperature were for the 4-month February–May season, emphasizing the importance of late summer temperature variability for tree-growth at this site (FMAM Tmax, lag = 0, r=0.47, Fig. A5h).
Monthly climate-growth correlations indicate Polylepis pepei RW variability was primarily influenced by interannual temperature conditions in this region (Tavg, Tmax, Tmin, Figs. 3b–c and A3b–c). However, after considering the effects of wet-season rainfall, the relationship between standard RW and prior-year mean and maximum temperature conditions was less significant (i.e. partial correlations with lagged ∼ November–February Tavg and Tmax were lower than simple correlations in Fig. 3b and d). Lagged minimum temperature variability, however, had a distinct and significant impact on RW (Tmin lag = 1, Figs. 3c and A3c). RW was negatively correlated to minimum temperature conditions that occurred during the previous wet-season (NDJF lag = 1; ; Fig. A4f). Although there were no significant trends in FMAM mean and max temperature for the 1960–2015 period (p>0.16; Fig. 4b and c), NDJF minimum temperatures significantly increased at a rate of 0.15 °C decade, Fig. 4c). Overall, Polylepis pepei RW was limited by minimum and maximum temperatures for distinct seasons (e.g. positive relationship with FMAM Tmax lag = 0 vs. negative relationship with NDJF Tmin lag = 1).
In summary, Polylepis pepei produced wider rings under wetter and cooler conditions at this treeline. RW was primarily limited by prior-year wet-season conditions (e.g. ∼ November–March precipitation and minimum temperature variability) but was also significantly and positively related to current-year temperature conditions at this site (February–May lag = 0). Interestingly, this site experienced significant warming and drying trends between 1960–2015 at the same time a growth decline in the treeline P. pepei was observed (Figs. 2c, 4a, and 4c). Although linear trends were identified in both the climate and RW data, residual climate-growth correlations were significant for the same seasons as the standard correlations (Figs. 3, A3 and A4). These results emphasize that both long-term and inter-annual climate variability at the MNP treeline had significant impacts on P. pepei RW.
3.3 Polylepis pepei RW and climate variability across tropical South America
Figure 5 highlights the regional extent of the seasonal climate signal recorded in P. pepei RW from the MNP treeline. Gridded DJFM precipitation (lag = 1), NDJF minimum temperature (lag = 1), and FMAM maximum temperature fields for tropical South America were used for spatial correlation analyses and were limited by the temporal extent of the climate data (1981–2015 for Fig. 5a, and 1960–2015 for Fig. 5b and c). The RW-precipitation correlations reflect the heterogeneity of precipitation along the Andes Mountains, whereas the temperature fields are more uniform (Fig. 5a vs. Fig. 5b and c). P. pepei RW was positively correlated to lagged DJFM rainfall variability within the northern and western portions of the Andes-Amazon ecotone during the 1981–2015 period (Fig. 5a). The strongest RW-precipitation signal is observed along the eastern flanks of the Peruvian Andes and the northern Amazon Basin in Brazil (r=0.45 to 0.50). For the 1960–2015 period, growth at this site was significantly and negatively correlated with wet-season minimum temperature variability throughout most of tropical South America, especially in portions of southeastern Brazil (r>0.50). RW is also positively correlated to late austral summer maximum temperature variability in the northern and southern portions of the tropical Andes (FMAM Tmax lag = 0, 1960–2015, Fig. 5c). The highest correlations between RW and maximum temperature were centralized both locally at the treeline and near the Bolivian Altiplano (r>0.50). In summary, the relationship between P. pepei RW and large-scale seasonal climate variability was significant for the same seasons identified in the local climate-growth analyses (1960–2015, Figs. 3, A4 and A5).
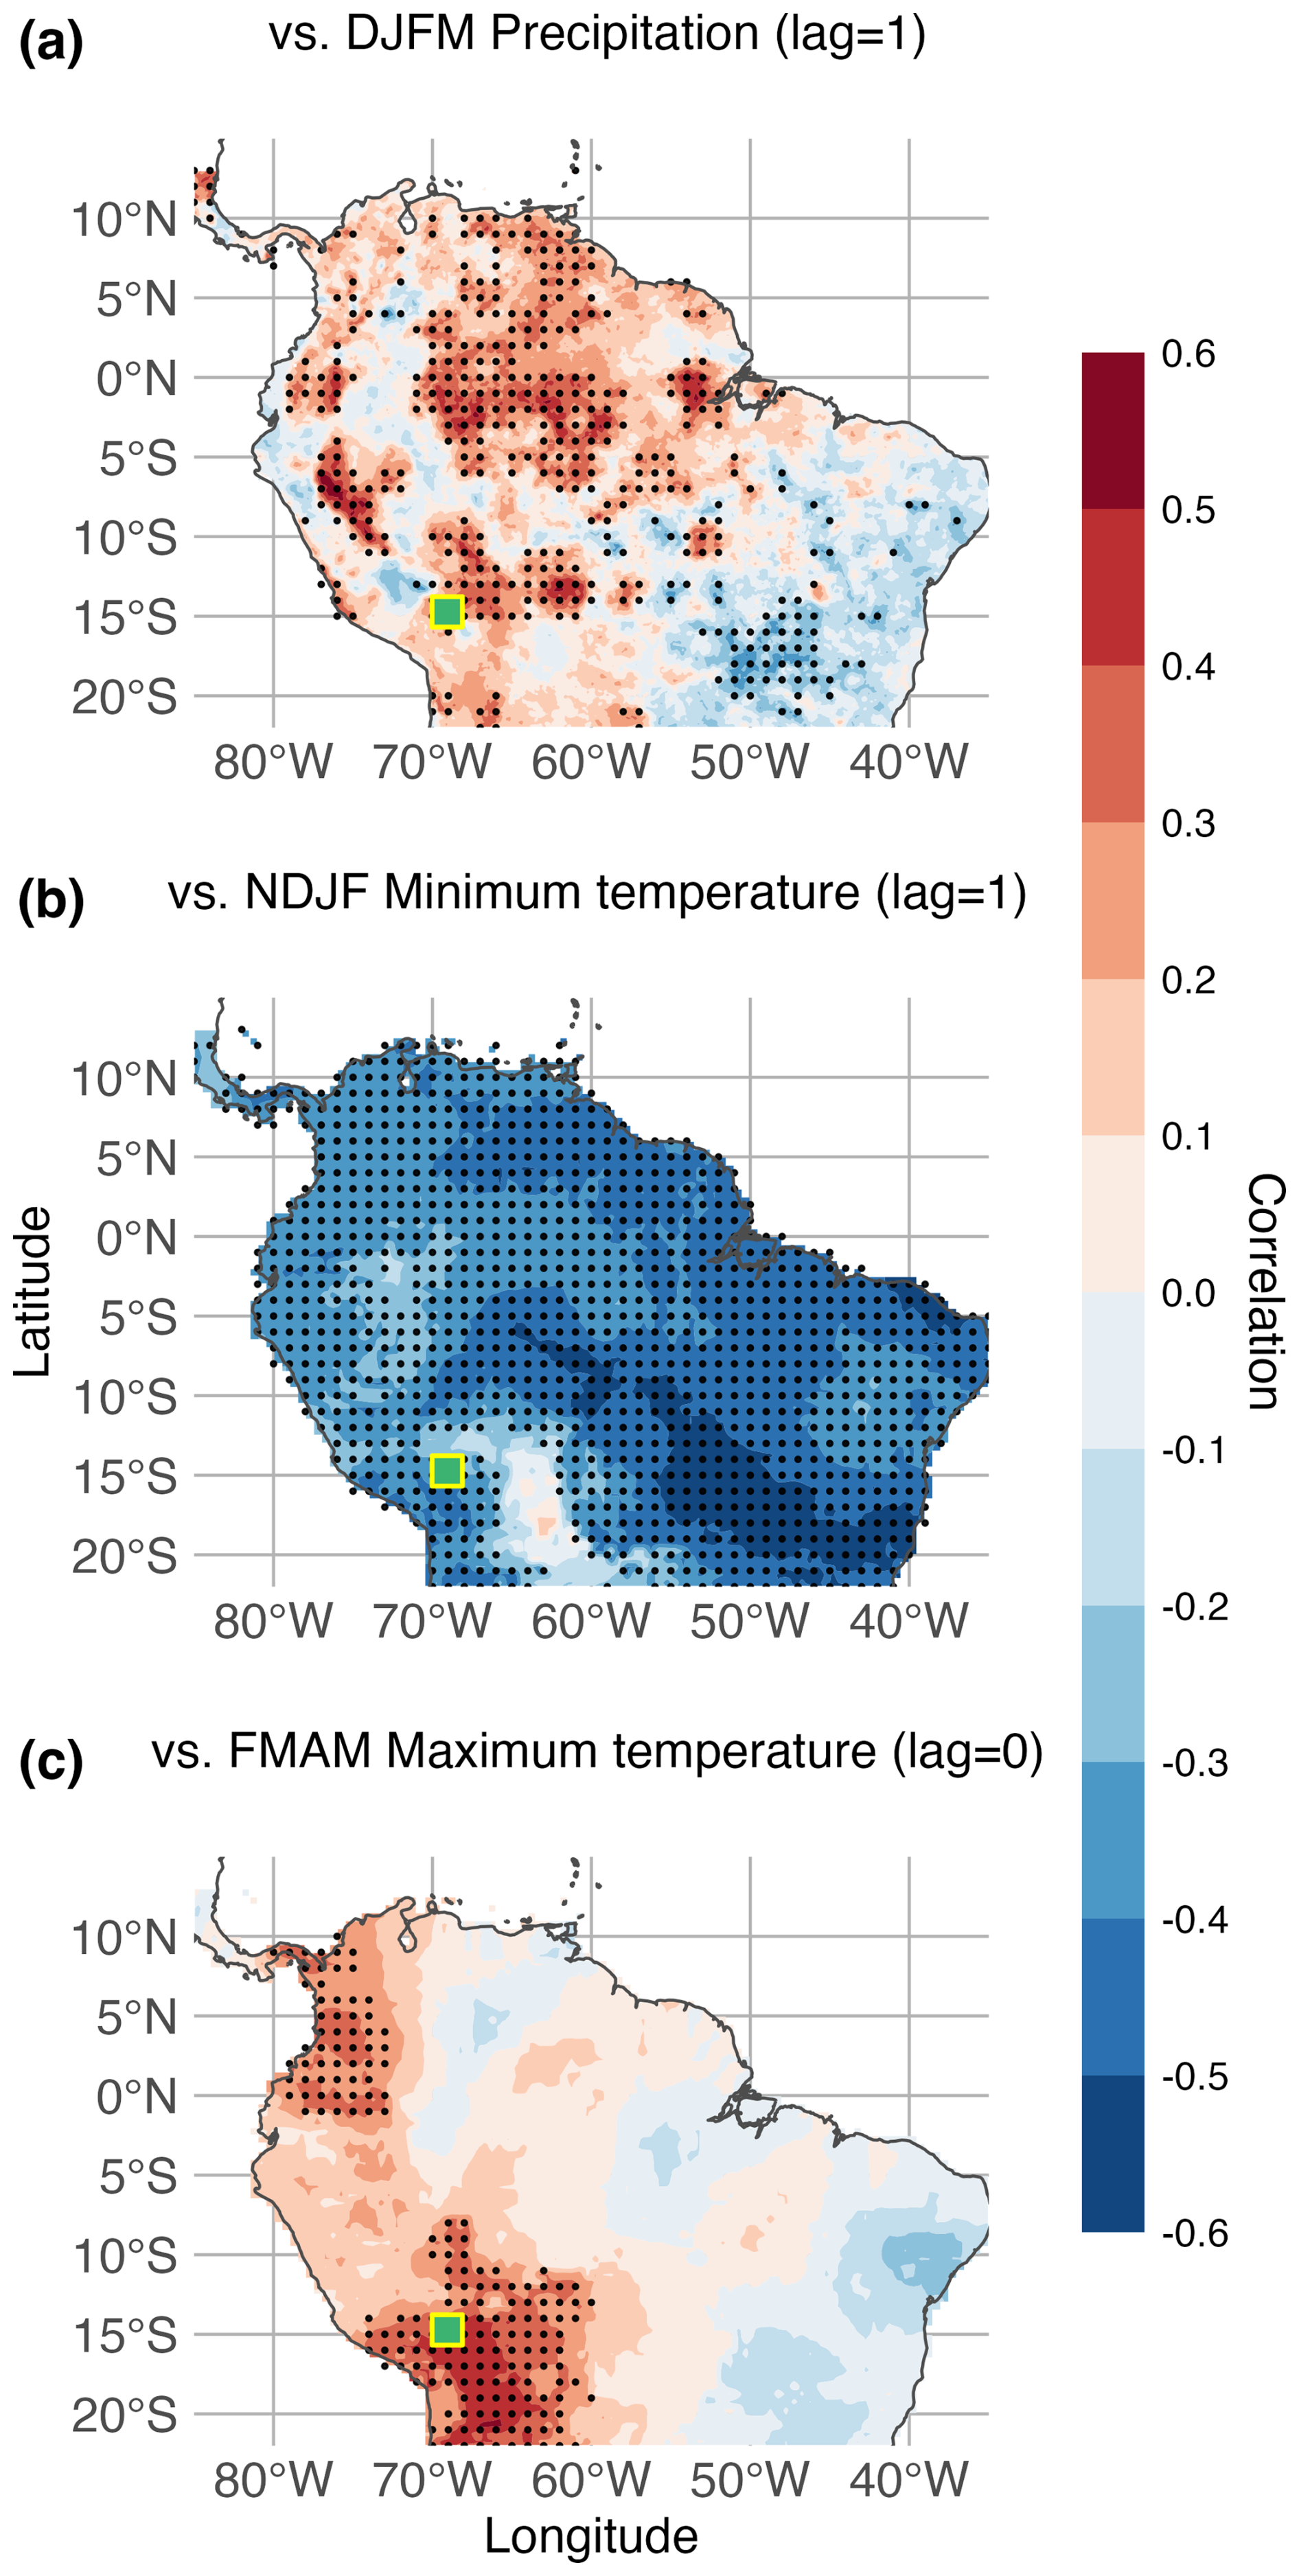
Figure 5Spatial correlations between P. pepei RW and (a) DJFM precipitation (lag = 1), (b) NDJF minimum temperatures (lag = 1), and (c) FMAM maximum temperatures (lag = 0) in tropical South America. Black dots represent the significant grid points (p<0.05). (a) Gridded precipitation analysis was limited to 1981–2015 due to the temporal constraint of CHIRPS v2.0 data while (b–c) RW-temperature correlations were conducted for the 1960–2015 period (CRU 4.08 TS gridded dataset). There were more significant cells than expected by chance for all spatiotemporal relationships (binomial field test α=0.05, p<0.001).
3.4 Long-term changes in diurnal climate conditions at the Keara treeline
The results of the climate-growth correlations clearly demonstrate the remarkable impact of temperature variability on treeline P. pepei growth during the 1960–2015 period. To visualize the significant increase of minimum temperatures in Keara in a long-term context, annual and seasonal diurnal temperature range anomalies were calculated for the full CRU TS 4.08 calibration period 1901–2015 (Fig. A5; DTR, Tmin, Tmax). There was a significant decrease in DTR and an increase in minimum temperature anomalies since the mid-20th century at this site. The largest decline in DTR was observed for the October–April season at a rate of −0.197 °C decade−1, though annual and July–August DTR declined at a similar rate (−0.191 °C and −0.194 °C decade−1 respectively, 1960–2015; Fig. A5b and c).
In agreement with the decreased DTR trend observed since 1960, in situ daily temperature loggers independently confirmed that wet season minimum temperatures have increased at this site (Fig. A6a). Minimum temperatures for the October–April season in 2011–2014 ranged from 1.9–2.3 °C and increased to 3 °C in 2021–2022, which is higher than the 0°C average between 1960–2015 (Sect. 2.2, Tmin Fig. A1). The distribution of daily minimum temperatures in 2021–2022 was significantly higher than the 2011–2014 seasons overall (bootstrap KS test p<0.001; Fig. A6a).
Interestingly, average October–April maximum temperatures recorded by the data loggers ranged from 7.2–8.2 °C (Fig. A6b), which is substantially lower than the 1960–2015 average (Tmax ∼ 13 °C; Fig. A1). Daily maximum temperature for the 2021–2022 season was significantly lower than the 2012–2013 and 2013–2014 seasons (p<0.01), while no significant difference was detected relative to the 2011–2012 season (p=0.37).
The daily data loggers also recorded a significant reduction in relative humidity within the 2011–2022 period (October–April; Fig. A6d–f). Relative humidity declined from an average of 98 % in 2011–2014 to 90 % in 2021–2022, while minimum daily humidity decreased from ∼ 94 % to 80 % (Fig. A6d and f). Although 2011–2012 corresponded to a DJF-La Niña year (Table A1), the distribution of daily relative humidity values during that season was comparable to the 2012–13 and 2013–14 years (p>0.05), and all 3 seasons were more humid than the 2021–2022 year (p<0.001, Fig. A6f). In fact, almost one third of daily relative humidity values for 2021–2022 (63 d) were below 90 % for October–April, while less than 25 d reached the same threshold for the 2011–2014 seasons.
In summary, the increase in annual minimum temperatures observed locally since 1960 coincides with (i.) a significant decrease in annual diurnal temperature range (Fig. A5a), (ii) drier wet-season conditions (Figs. 4a, A6d and f), and (iii) a decrease in radial growth at this treeline (Fig. 2a and c). These long-term warming and drying trends in the local precipitation and temperature records (Fig. 4) are consistent with in situ measurements of higher temperature and lower relative humidity recorded in Keara for 4 distinct October–April seasons between 2011–2022 (Fig. A6).
3.5 Growth response of treeline P. pepei to extreme climate events
Table A1 lists the years of known hydroclimate anomalies in tropical South America connected to El Niño (warmer SST) or La Niña (cooler SST) conditions in the Pacific Ocean. Regardless of the spatiotemporal resolution, climate datasets agree that the El Niño-DJF events were linked to drier and warmer conditions at this site, while extreme La Niña-DJF years were wetter and cooler (Fig. 6a and b). SEA of the residual RW response depicts temporal growth anomalies for the top 26 ENSO DJF events: 13 El Niño and 13 La Niña (Fig. 6c and d). There was a one-year delayed and negative RW response to El Niño events, i.e., one year after an event, P. pepei showed a significant decrease in radial growth (α=0.1). There was a significant negative response two and three years after an extreme DJF-La Niña.
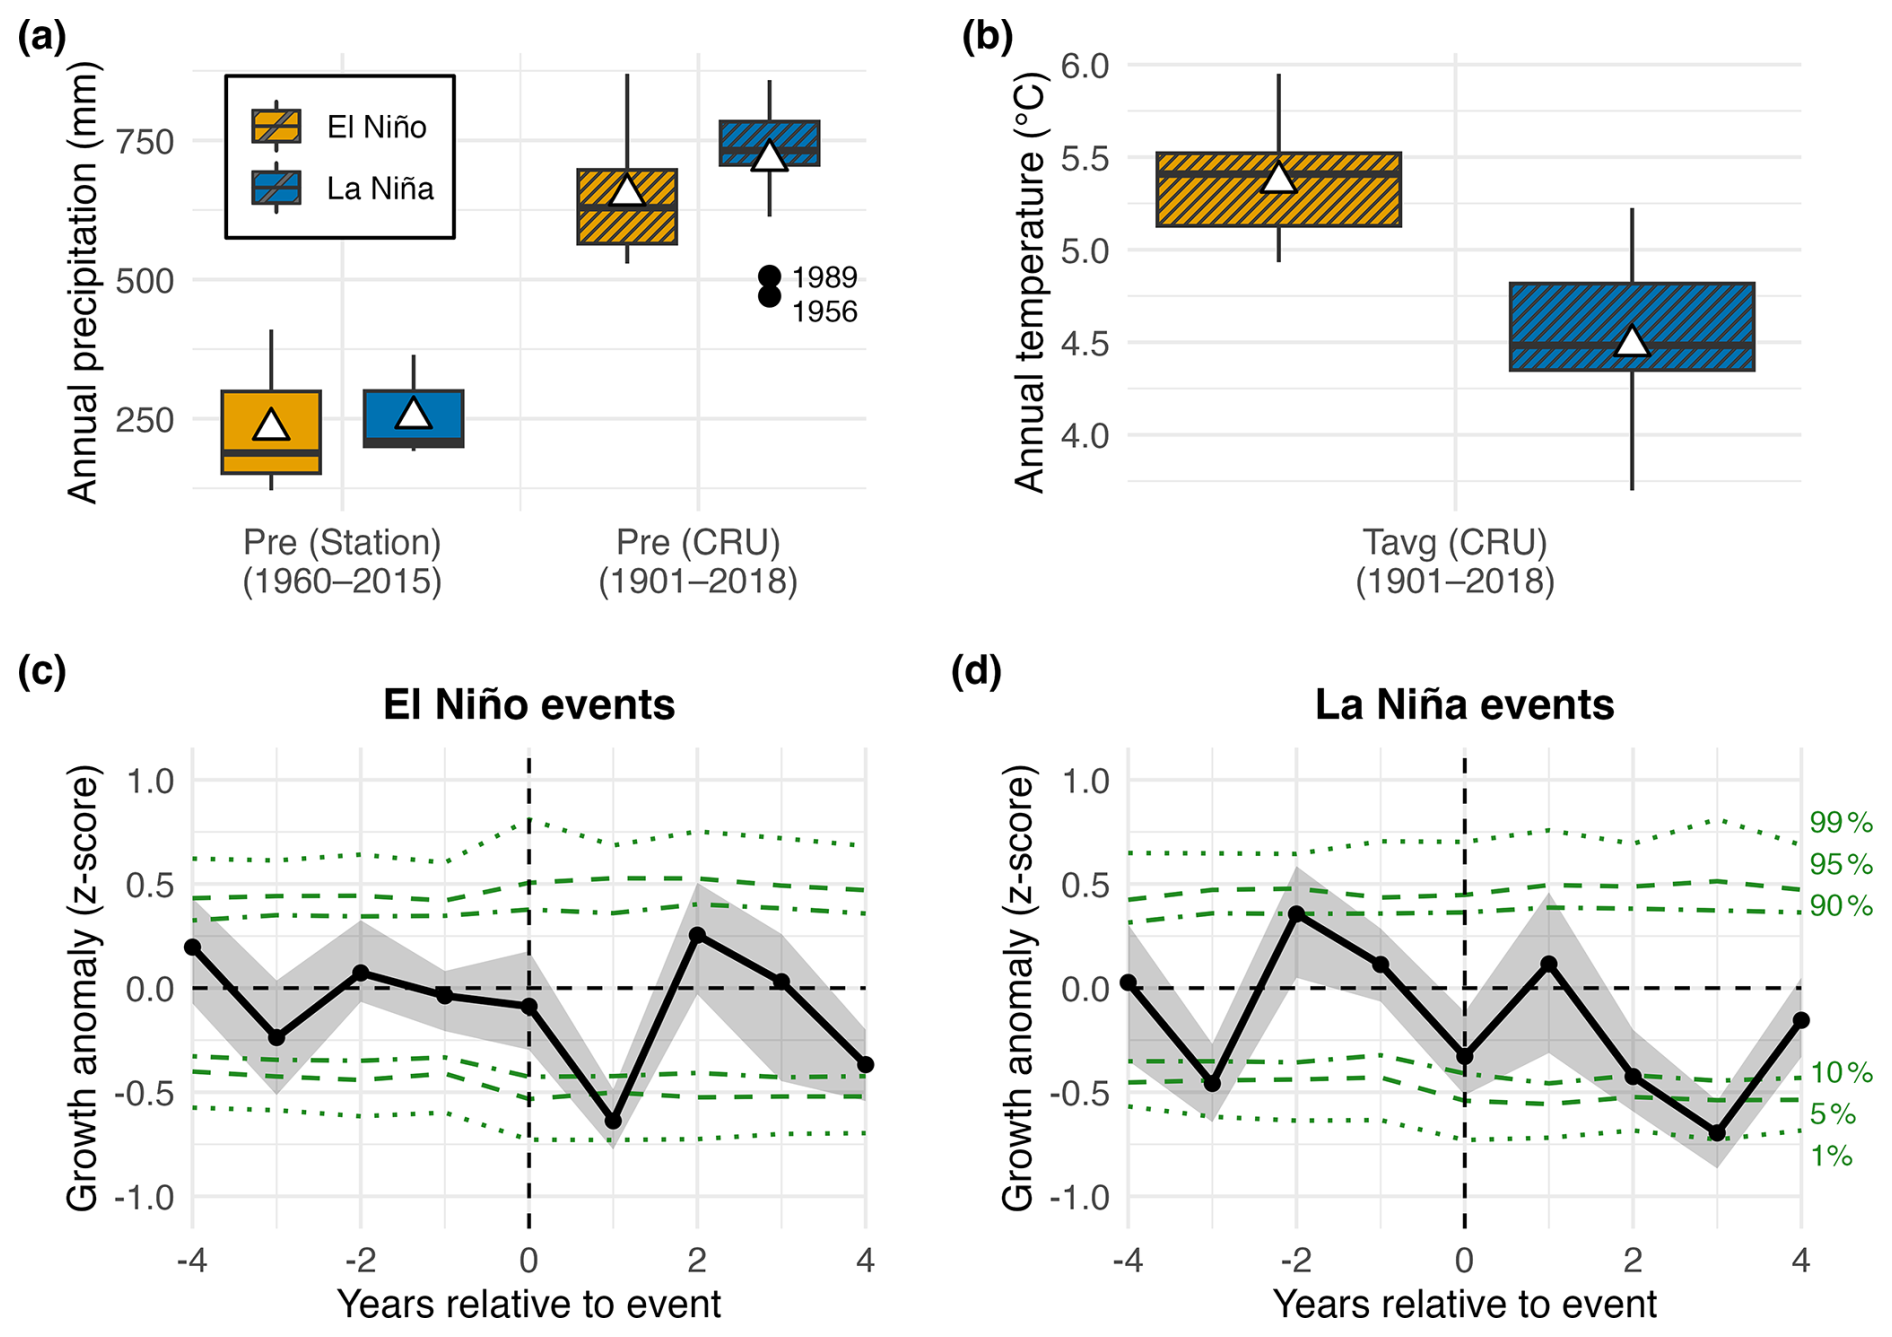
Figure 6Boxplots of annual (a) precipitation and (b) temperature for the 26 years of extreme DJF-ENSO events, using both station and CRU data. Outlier years in the CRU precipitation data are represented as black dots (a: 1956, 1989). Annual mean climate during El Nino-DJF is represented as orange colors, while La Niña is shown in blue (n=13 years per event). (c–d) Superposed epoch analysis of the residual RW response 4 years before and 4 years after the DJF-ENSO events (black line). The uncertainty of the growth response is depicted as grey shading. Horizontal green-lines represent the two-tailed significance thresholds that were derived from stationary bootstrapping (10 %–90 %, 5 %–95 % 1 %–99 %).
Some RW outliers identified in the residual RW chronology coincide with years of known ENSO events (Fig. 2d). The largest tree-ring observed in P. pepei occurred at the same time as an extreme DJF-La Niña event in 1950–1951 while the smallest growth ring in the chronology was formed after a DJF-El Niño event in 1905 (Table 1; Fig. 2d). Overall, the inter-annual P. pepei RW at the Andes-Amazon treeline had a lagged and significant response to extreme DJF-ENSO conditions.
4.1 Climate sensitivity and radial growth decline of a tropical treeline site in Bolivia
Here we have generated the first P. pepei tree-ring chronology from the MNP treeline in Bolivia and the longest annual growth record for this species in South America spanning from 1850 to 2018 CE (3795–4400 m a.s.l.). These results provide new information of tree growth and climate dynamics in an understudied biodiversity hotspot in the southwestern Andes-Amazon corridor (14.72° S). We found that P. pepei RW is limited by prior-year minimum temperature (negatively) and precipitation variability (positively) during the wet season, leading to larger RW in the subsequent growth year when it was colder and wetter (Figs. 3–5, and A3–4). There was also a positive relationship between current-year maximum temperature and RW variability between 1960–2015 at this treeline (Figs. 3b, d, A3b, d, A4c–d, g–h). The lagged RW-precipitation signal is consistent with one of the two P. pepei tree-ring studies (1969–2004; 16°12 S, 68°79 W; 4130 m a.s.l.) (Jomelli et al., 2012) and several Polylepis tarapacana investigations that reported prior-year water availability is a useful predictor of RW variability at treeline (Argollo et al., 2004; Christie et al., 2009; Crispín-DelaCruz et al., 2022; Morales et al., 2004; Rodriguez-Caton et al., 2021; Solíz et al., 2009). The second study of P. pepei found that RW was positively correlated to current-year temperature variability (1941–1983; 17° S, 65.39° W; 4100 m a.s.l.) (Roig et al., 2001). However, the dominant and negative relationship between RW and lagged minimum temperature variability has yet to be explored for treeline P. pepei.
The pronounced decline of radial growth in P. pepei since 1960 coincided with warmer and drier austral summers at this treeline (∼ November–March, 1960–2015; Figs. 2c, 4a and c). There was also a significant step change and subsequent decline in raw RW after the 1993 growth-ring (Fig. 2a). It can be speculated that this area was affected by an 8.2 magnitude earthquake recorded in June 1994 ∼ 150 km east of the site (Myers et al., 1995). Although this region of Bolivia is sparsely populated and historical records are limited, landslides were reported further way from the epicenter in southern Peru and Chile, and thus it is possible that slope failures in 1994 occurred near this treeline in Keara Bolivia (Blodgett et al., 1998). For example, talus slope conditions were observed for both the open and closed canopy sampling locations in Keara in 2019 (Fig. 1d). The decline in RW also occurred 1 year before the broader study region of Madidi was designated a National Park in September 1995 due to its extremely high levels of biodiversity and endemism in the Bolivian Amazon. The results herein highlight the potential of P. pepei tree-ring width to record both climate and environmental disturbances. An upward migration of this treeline in the future is unlikely due to local geomorphologic constraints (Fig. 1d) (see Macias-Fauria and Johnson, 2013). Further, due to increasing temperature trends observed near Keara in recent decades, the species-specific thermal niches that are required for seedling establishment and recruitment may be at risk (Figs. 4 and A5) (Kessler et al., 2014; Körner and Hoch, 2023). Although the spatial extent of this forest under increased warming and environmental change is uncertain, this study has helped clarify the nature of past and current growth variability of P. pepei in this region.
Human activity in Andes-Amazon forests should be considered when evaluating the growth patterns at tropical treelines. Forest fragmentation was observed in the lower elevation open-canopy forest (3795–4100 m a.s.l.) and tree-ring samples showed evidence of fire scars in the 1940s. This subpopulation is likely more threatened by small-scale cattle ranching in Keara than the closed canopy forest located at higher elevations (4000–4400 m a.s.l., Fig. 1c and d). Herein, efforts were made to minimize potential impacts of land use and disturbance in field sampling, but ecosystem disturbances in certain regions of the MNP were nevertheless observed (mostly in areas below 2000 m a.s.l.). Despite these observations, correlations between P. pepei RW and regional temperature and precipitation variability were robust and may signify a response to larger-scale hydroclimate patterns observed throughout tropical South America (Fig. 5).
The MNP treeline revealed an imprint of extreme ENSO-related drought events in P. pepei growth rings. Hot and dry conditions related to DJF-El Niño years had significant and negative impacts on radial growth (Fig. 6c). Although DJF-ENSO events were selected for analyses because they occur during mature phase of the summer monsoon (i.e. 70 % of annual rainfall occurs during DJF), it's possible the impacts of annual or broader seasonal ENSO extremes may be more informative due to the sensitivity of RW to cumulative climate conditions (Fig. A4). Overall local and regional climate-growth analyses suggest that this treeline is primarily limited by temperature-driven moisture stress during the peak wet season (∼ November–March, Figs. 3, 4, A3 and A4). In the following sections we discuss both site-level and large-scale hydroclimate conditions that may have contributed to the growth decline of treeline P. pepei in northern Bolivia since the mid 20th century.
4.2 Local temperature and humidity changes at the P. pepei treeline in Bolivia
Increases in minimum temperature in the MNP region may be linked to a reduction of moisture availability near the Upper Andes vegetation. The mean diurnal temperature range near Keara has significantly and negatively declined since 1960, signifying that the rate of minimum temperature increase has surpassed that of maximum temperature (Fig. A5). In addition to a decrease wet-season precipitation observed in this region since 1960 (Fig. 4a), daily climate loggers within the P. pepei site indicated the 2021–2022 wet season was significantly warmer and drier than in 2011–2014 (p<0.0001 October–April; Fig. A6). This decrease in relative humidity alongside an increase in minimum temperatures suggests that the capacity of air to hold moisture has outpaced the actual moisture content, making the air drier despite higher temperatures. Although the data logger records cover a short time window, they provide in situ, high-resolution data of wet-season climate variability in Keara over a 10-year period, and thus they are useful to confirm: (i) the warming trends observed in the long-term climate data (Figs. 4 and A5), and (ii) that the increase in minimum temperatures coincided with a decrease in humidity at this site (Fig. A6) .
P. pepei RW was significantly and negatively impacted by lower wet-season precipitation and higher minimum temperatures even after linear trends in climate were removed (residual correlations, Fig. A4). Minimum temperatures influence convection, as rainfall in the Andes-Amazon ecotone largely occurs in the afternoon/night when radiative cooling drives cold air downslope and converges with rising warm moist air from the tropical lowlands (Garreaud, 2009; Junquas et al., 2018; Romatschke and Houze, 2010; Rosales et al., 2022). Known as “orographic precipitation”, this process is key for rainfall distribution across the Andean foothills (Arias et al., 2021; Chavez and Takahashi, 2017). According to the hourly in situ data loggers in Keara, daily RH peaked at 03:00 p.m. on average, likely reflecting afternoon cloud formation at this site. In the region of the MNP, maximum precipitation totals occur between 1000–1300 m a.s.l., with a sharp decrease in moisture transport above 3000 m a.s.l. (Chavez and Takahashi, 2017). If minimum temperatures increase, the radiative cooling effect weakens, which may result in warm, moist air converging at lower elevations (e.g. below our P. pepei site) (Romatschke and Houze, 2010). In terms of tree-growth in this area, one interesting observation is the declining P. pepei RW trends observed at the MNP treeline (above 4000 m a.s.l.) diverge from the increasing RW trends observed in lower-elevation humid forests in the MNP (e.g. Juglans boliviana, ∼ 1300 m a.s.l.) (Oelkers et al., 2023).
One possible explanation for this pattern is that warmer minimum temperatures alter the local balance between temperature, humidity, and upslope moisture transport in the Andes–Amazon ecotone. Because precipitation at these elevations depends strongly on orographic processes and on the interaction between moist lowland air and cooler mountain conditions, weaker nighttime cooling could reduce the efficiency of moisture convergence at the elevation of the treeline. We cannot demonstrate that mechanism directly here, but the observed increase in minimum temperature, decline in DTR, and reduction in relative humidity in Keara are all consistent with a shift toward locally dry conditions that may limit P. pepei growth (Figs. 4, A5, A6). In this sense, the results point to moisture stress amplified by warming, rather than temperature alone, as the most plausible explanation for the long-term decline in ring width at the MNP treeline. Future research needs to be conducted on elevational moisture transport in the Andes-Amazon and these diverging tree growth trends observed within the MNP.
Besides inhibiting moisture convergence and transport from lower elevations, warmer minimum temperatures could also affect the tree water-balance in Keara. A global analysis of tropical tree longevity found that tree mortality is increasing in all tropical biomes due to heat-related water stress and increased evaporative demand at the leaf level (Locosselli et al., 2020). From an ecophysiology perspective, respiration rates increase with warmer temperatures. Excessive warming at night (i.e. increased Tmin) without the process of photosynthesis may increase the amount of tree-level carbon (respiration) and soil-water content released to the atmosphere (Körner, 2012). Temperature and precipitation near the P. pepei site are inversely correlated during peak wet season (∼ November–March, p<0.05). Thus, if there is less cloud cover (and precipitation), there is higher solar irradiance and temperatures, which may limit the photosynthetic capacity of trees especially in tropical moist treelines (García-Núñez et al., 2004; Hoch and Körner, 2005; Jaramillo, 2015). Further research must be conducted to determine the physiological response of P. pepei at this treeline to diurnal and seasonal changes in orography and soil-water availability.
The positive relationship between P. pepei and February–May mean and max temperatures may demonstrate an ecophysiological link between tree-ring size (i.e. xylogenesis) and cooling observed at the end of the wet season (FMAM Tmax Figs. 3b, d, A3b and d). Although it is possible the mechanisms controlling primary and secondary growth may not occur at the same time (i.e. photosynthesis vs. wood formation), the RW-climate correlations indicate growth rings are smaller when there are cooler conditions in mid-to-late austral summer (or vice versa; Figs. 3 and 4). It is interesting to note that an extreme cold period observed near Keara during the late 1950s corresponds with a growth suppression observed in raw, standard and residual P. pepei RW chronologies, emphasizing the coupled relationship between RW and mean and maximum temperatures during this period (Figs. 2, A5b and c). The growing season for P. pepei in Keara is estimated to be during the wet season (∼ October–April), but the phenology of P. pepei in the MNP and elsewhere is largely unknown. The use of point-dendrometer bands which can record high resolution variations of stem circumference may reduce uncertainty regarding the onset and cessation of tree-growth during the hydrological year and its relationship to wet-to-dry season temperature variability between February and May.
4.3 Large-scale climate variability impacting tree growth in tropical Andean treelines
In addition to site-level conditions at this treeline, the recent decline in annual growth may also be linked to broader scale hydroclimate patterns observed in tropical South America. In the central Andes treeline, negative RW trends observed in P. tarapacana since the 1970s were attributed to increasing drought conditions in southern Peru and northern Chile (> 17° S; 4657–4800 m a.s.l.) (Morales et al., 2023). Increasing drought frequency in this region has been linked to a delayed wet-season onset (Espinoza et al., 2016; Fu et al., 2013; Marengo et al., 2011). One possible explanation is that the intensification of the atmospheric Hadley Circulation, driven mostly by warming SST in the tropical Atlantic during the 20th century, has led to a weakening of zonal moisture transport and an increase in subsidence during transitional dry-to-wet seasons in the central Andes (Beveridge et al., 2024; Espinoza et al., 2019, 2021; Sierra et al., 2022; Yoon and Zeng, 2010). In that context, the decline observed in P. pepei may be part of a wider pattern of increasing hydroclimatic stress at high elevations in the tropical Andes. At the same time, the P. pepei treeline lies in the southwestern limits of the Amazon Basin (∼ 14° S) and thus differs from drier, higher latitude Polylepis treelines such as P. tarapacana (Morales et al., 2023), so annual growth-comparisons should be interpreted cautiously.
In contrast to a drier start to the wet season, a recent increase in precipitation at the end of the wet season has been observed in lowland regions below 2000 m a.s.l. in the northern Andes and Amazon Basin (Arias et al., 2021; Espinoza et al., 2019, 2021; Malhi et al., 2008; Zanin and Satyamurty, 2020). These studies argue that the warming of the Atlantic Ocean, land-surface changes in the Amazon, and wind anomalies are the primary factors contributing to changes in atmospheric circulation and specific humidity in tropical South America overall (see references in Beveridge et al., 2024). Contrasting precipitation trends have been observed at various latitudes and elevations within Bolivia as well. Tree-ring oxygen isotopes (δ18O) from Cedrela odorata in the lowland Bolivian Amazon reflected an increase in November-March precipitation between 1980–2010 (10°5′ S, 66°18′ W; 106 m a.s.l.), while treeline P. tarapacana δ18O from the Bolivian Altiplano recorded a decrease in December-March precipitation between 1992–2012 (22.3° S, 67.23° W; ∼ 4600 m a.s.l.) (Baker et al., 2016; Cintra et al., 2025; Rodriguez-Caton et al., 2024). Even though these hydroclimate trends are complex and spatially variable, having in situ high-resolution climate proxies at the Andes-Amazon treeline such as this P. pepei may be useful in understanding long-term changes in orography.
Overall, growth variability at this P. pepei treeline is modulated by temperatures and water availability at the site. Moisture variability at high-elevation ecosystems of the MNP may be influenced by local climate dynamics related to orography but may also be reflective of broader hydroclimatic changes observed the tropical Andes and adjacent Amazon basin mentioned above. Rather than implying a shared mechanism across all Andean treelines, our results suggest that distinct Polylepis treelines may be responding to a common regional trend toward warmer and, in some cases, effectively drier conditions during the peak wet-season near the Andes-Amazon treeline (∼ November–March). Overall, this record has provided new in situ evidence of a long-term, and negative growth response of a tropical treeline (14° S, 4400 m a.s.l.) to increased temperature trends between 1960–2015 observed in northwestern Bolivia.
We report a significant decrease in radial growth for Polylepis pepei at a tropical treeline in the southwestern Amazon Basin (∼ 4400 m a.s.l.). Our results indicate that this decline is associated with increasingly warm and dry conditions since the 1960s, particularly through reduced precipitation and higher minimum temperatures during the wet season preceding ring formation. Together, these changes suggest increasing moisture stress at the site. Rising minimum temperatures, especially when not matched by equivalent increases in maximum temperatures, may also reduce moisture availability by lowering relative humidity, altering local moisture transport, and increasing nighttime respiratory carbon losses. More broadly, warmer conditions are likely to enhance evaporative demand and further constrain tree growth. We also found a tendency for narrower rings in the year following warm and dry El Niño events, whereas the influence of La Niña on tree-growth remained less clear, suggesting an asymmetric ENSO effect that deserves further study. Expanding the P. pepei network in Keara could provide the basis for the first tree-ring-based climate reconstruction for northern Bolivia, extending the short instrumental record back to the mid-nineteenth century. Overall, our findings provide new insight into the vulnerability of tropical treelines to ongoing warming and hydroclimatic change, and they highlight the value of P. pepei for future dendrochronological and ecophysiological research in the tropical Andes. Future work should thus focus on quantifying leaf respiration, temperature sensitivity, and the timing of wood formation using ecophysiological measurements and point dendrometers, to better understand the mechanisms linking climate change and growth decline in this species.
Table A1Years of the top ranked DJF-ENSO events determined by NOAA-PSL. Dates associated with 13 El Niño and 13 La Niña evets were selected for SEA of P. pepei RW. The years for the DJF seasons are centered on the month of January. The remaining 22 top ranked events (48 total) are available on the website (https://psl.noaa.gov/enso/past_events.html, last access: 21 June 2026).
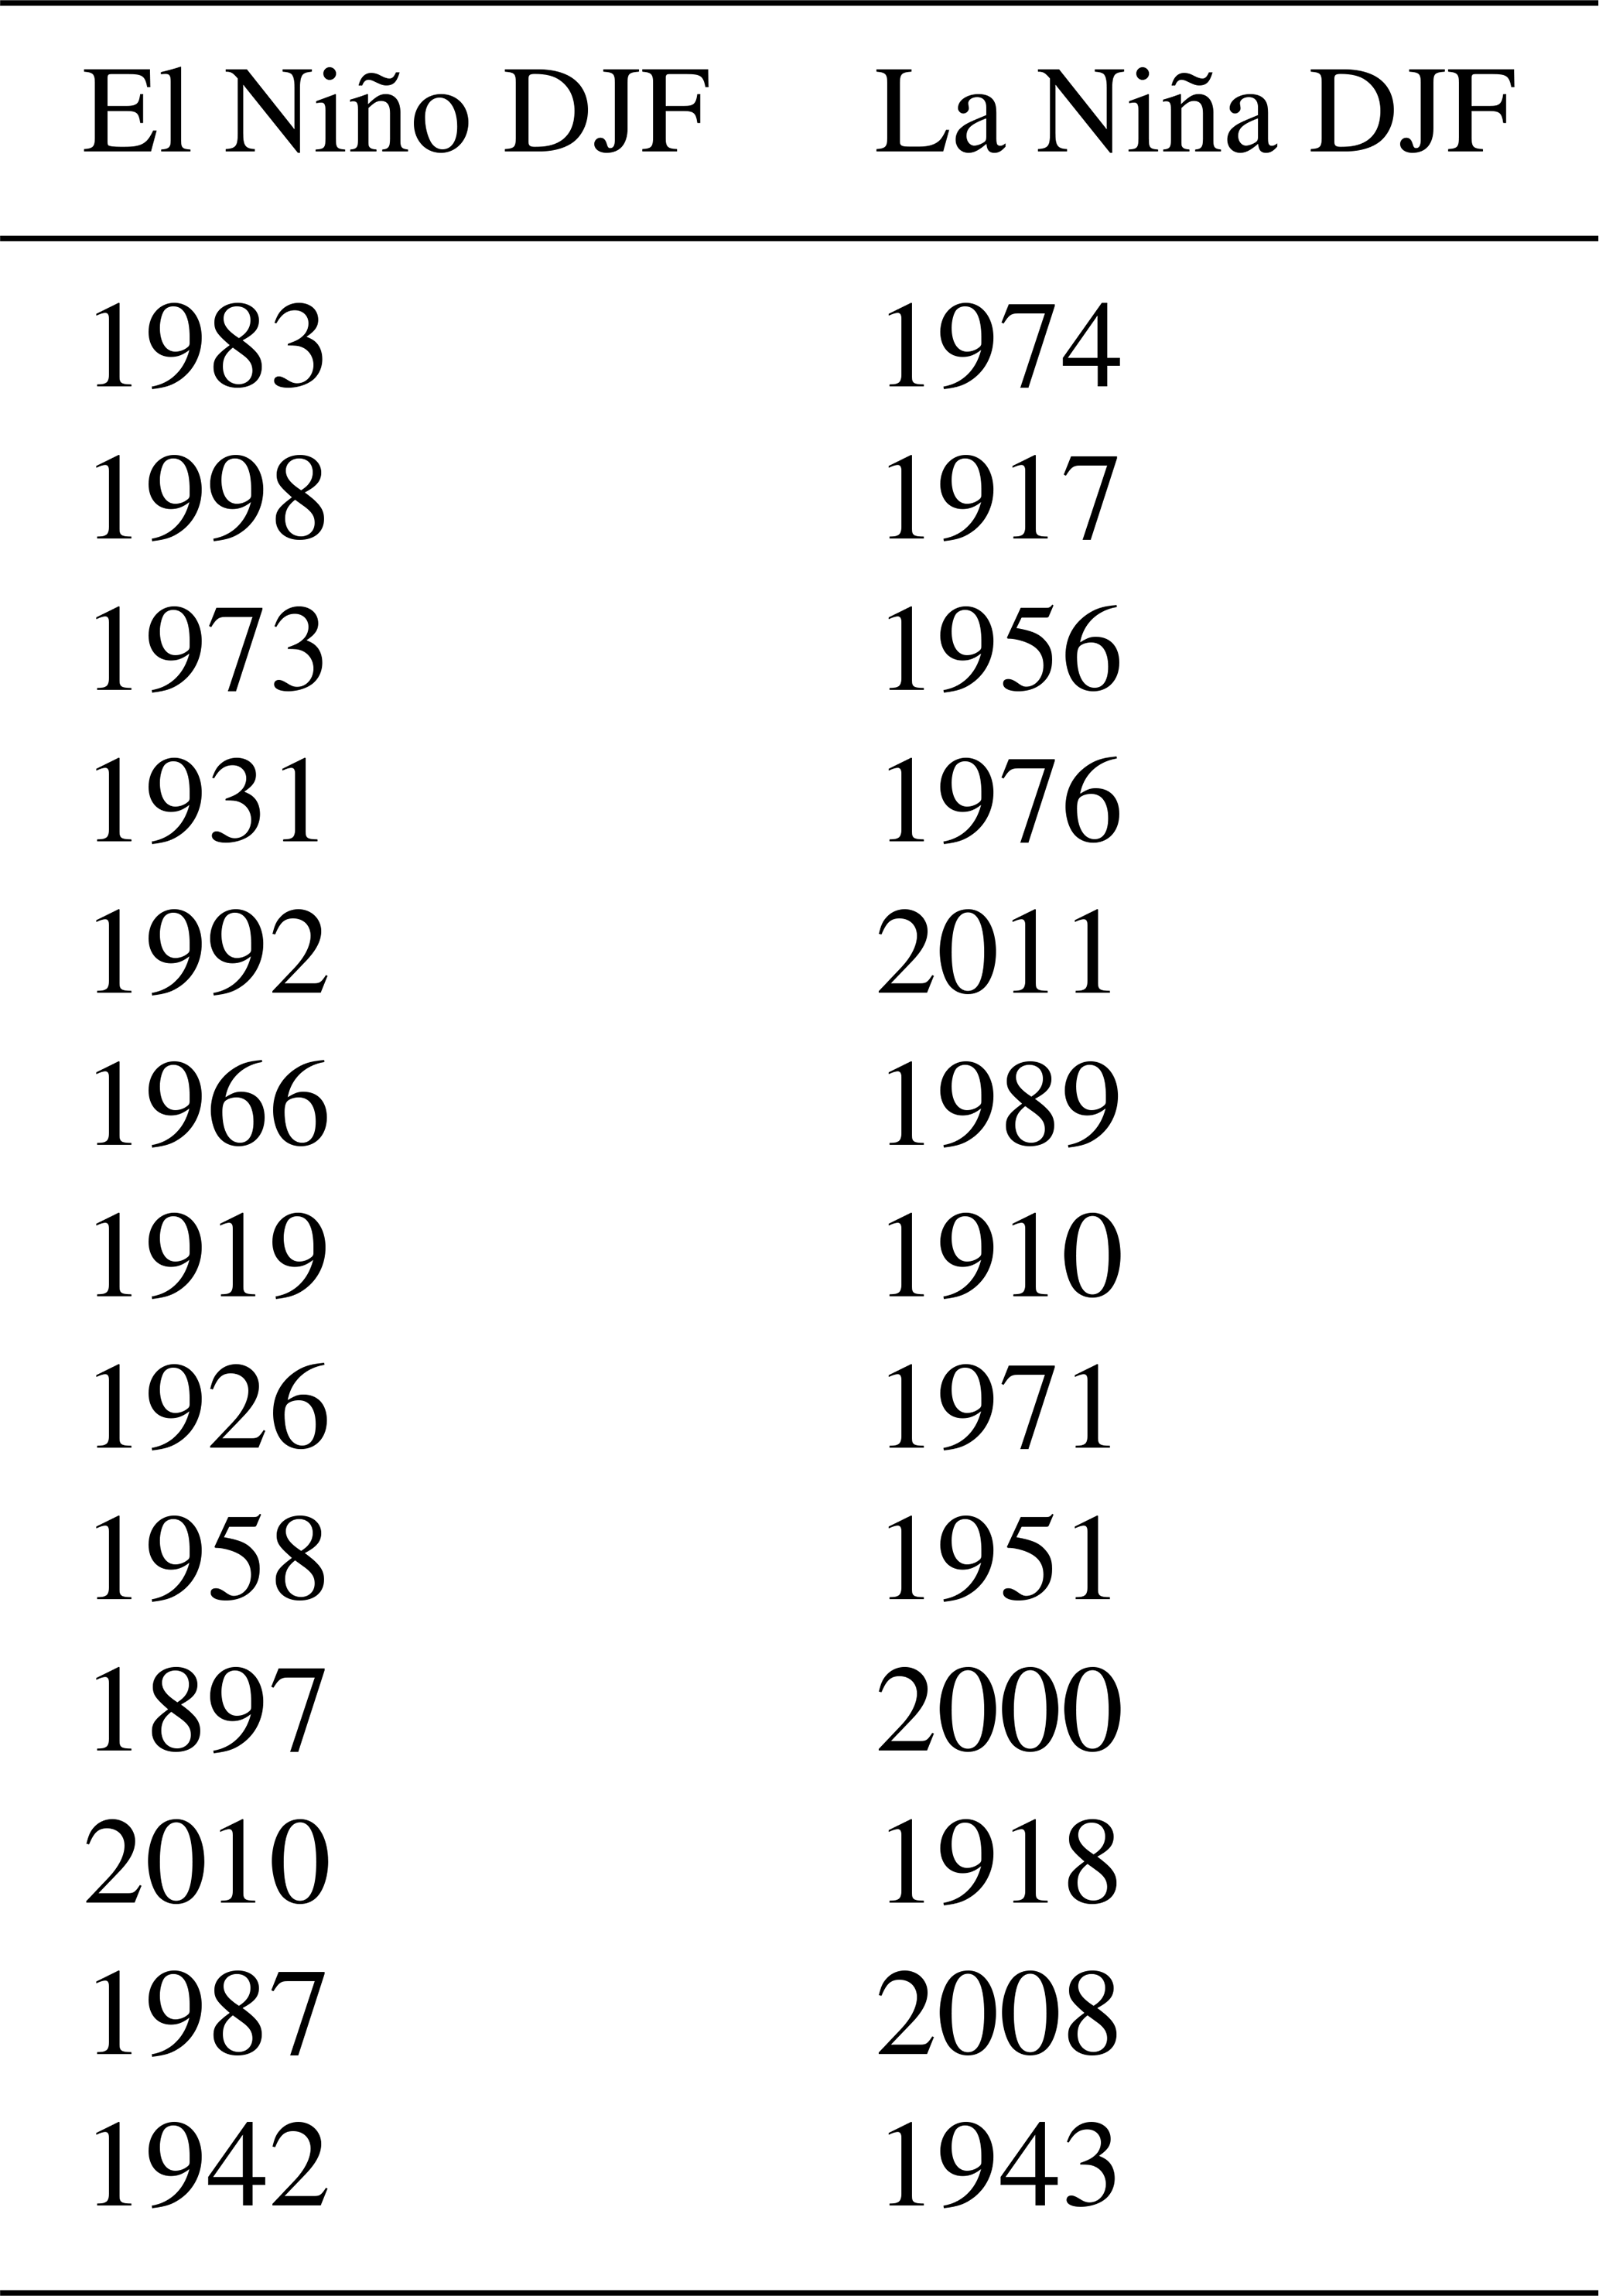
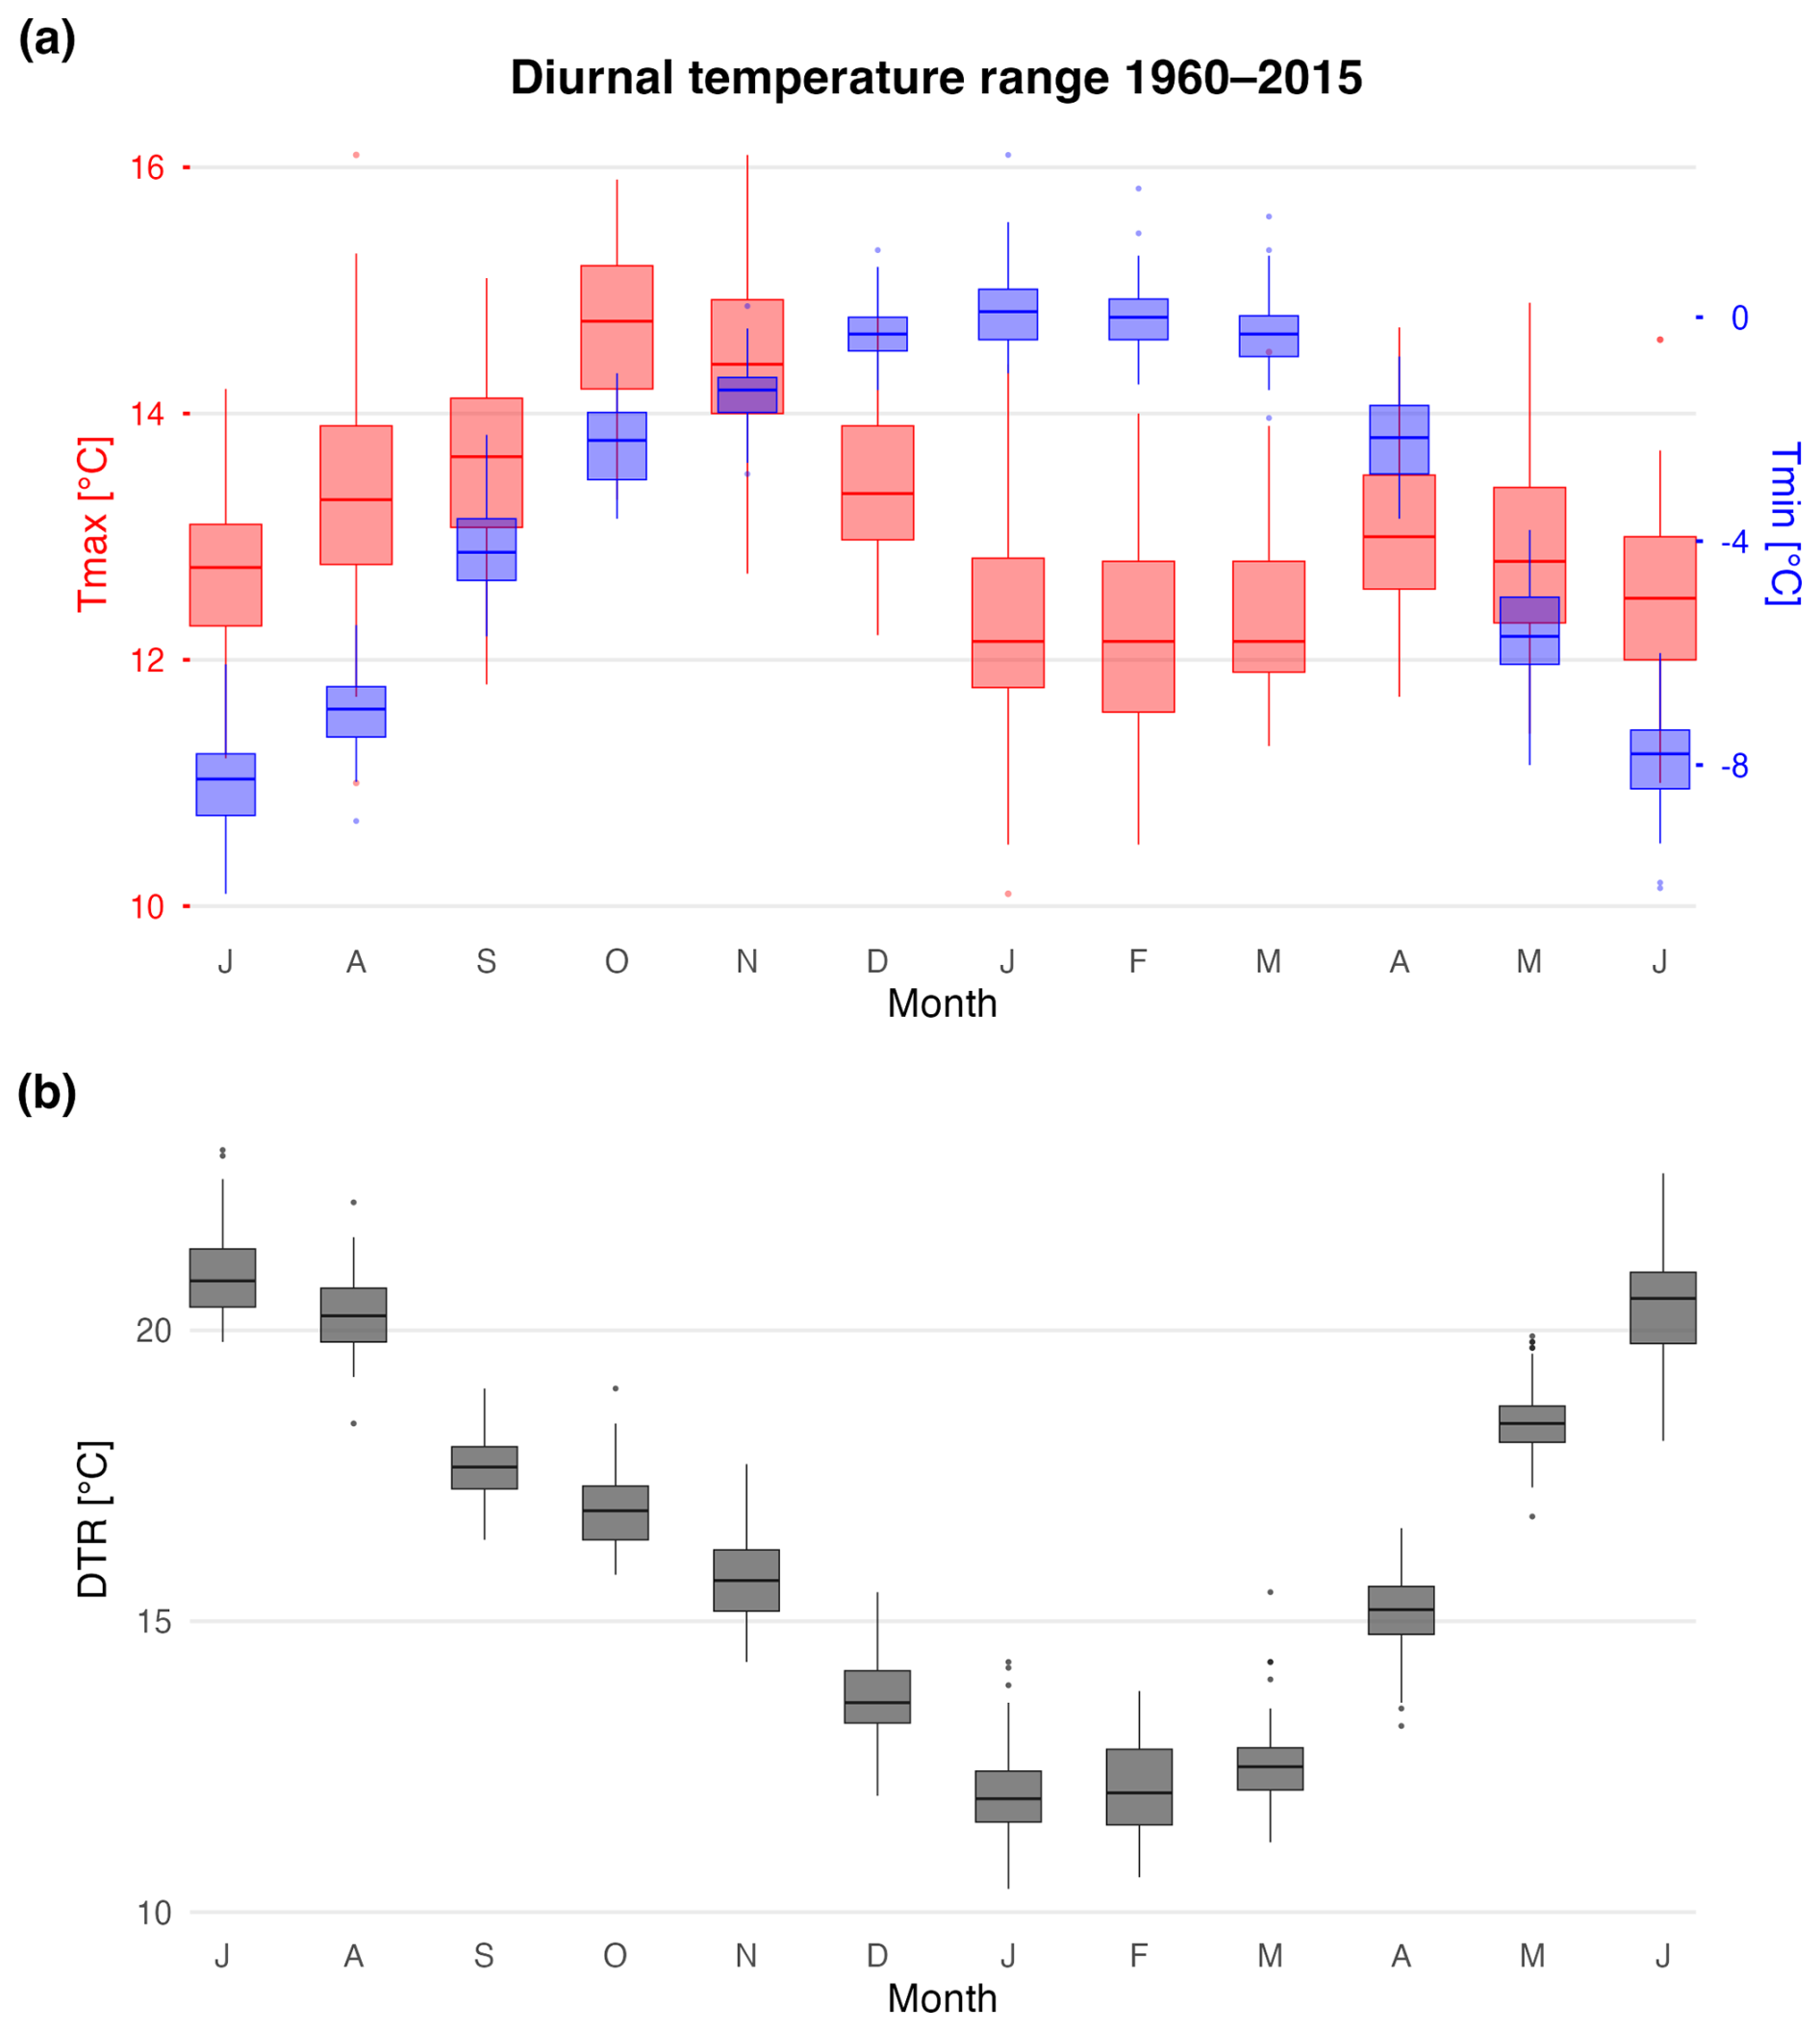
Figure A1(a) Average monthly distribution of maximum (red), minimum temperatures (blue) between 1960–2015 using the nearest CRU 4.08 grid point data (14.75° S,69.25° W). (b) Monthly diurnal temperature ranges for the study region (grey). Boxplots include the temperature median (horizontal line), 1.5× the inter-quartile range (whiskers), and outliers (colored dots).
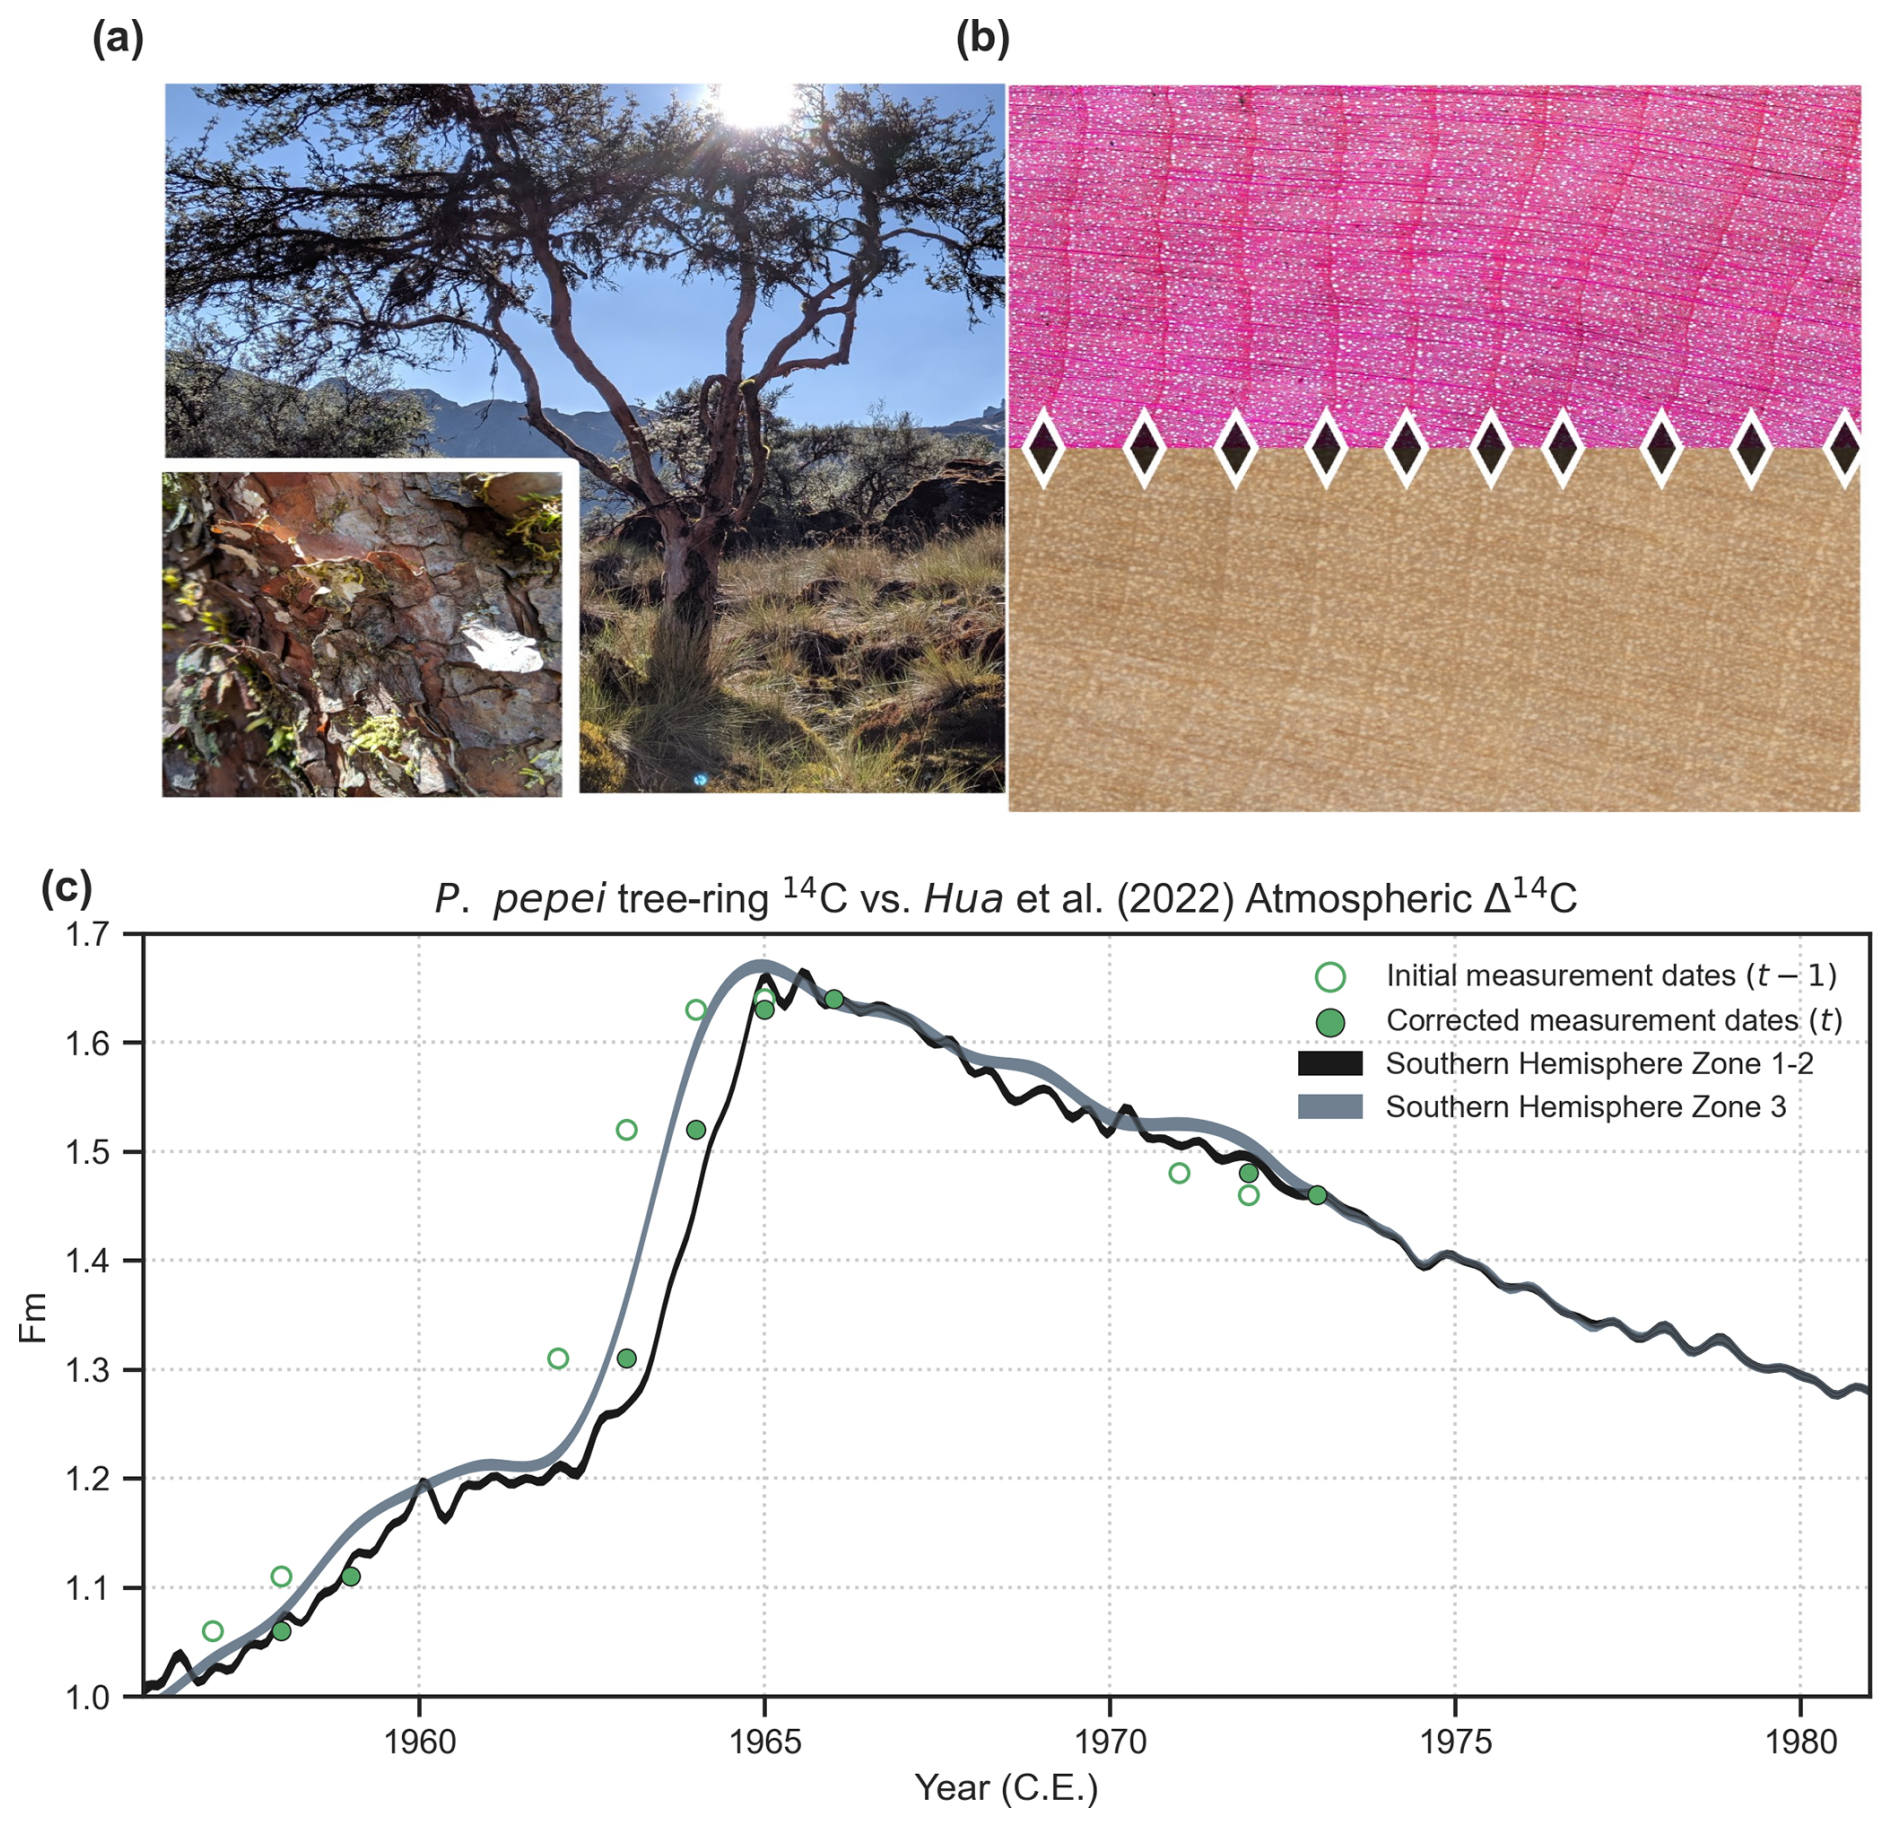
Figure A2(a) Photo of a P. pepei tree in Keara during the dry season of July 2019. The trees have evergreen foliage, and can appear shrublike, with twisted, and at times multiple, stems. The bark consists of thick layers of compressed flakes that are red and brown in color. (b) P. pepei wood anatomy for a histological slice (40X magnification Echo microscope camera) and scanned image of a tree-core (3200 dpi). The direction of radial growth is from left to right (pith to bark) while diamond shapes indicate the latewood/earlywood boundary between annua tree-rings. P. pepei tree rings feature large, uniformly distributed vessels in the earlywood while the latewood includes both solitary vessels and thicker, fiber-like tracheid cells. The vessel lumen area in the latewood appears to taper tangentially in size before each subsequent growth-ring boundary. (c) Radiocarbon measurements (green circles) from the alpha-cellulose of selected rings in a cross-section is plotted with the Hua et al. (2022) 1950–2019 atmospheric Δ14C reference curves for Southern Hemisphere Zone 1–2 and Zone 3. The traditional dendrochronological techniques of crossdating RW measurements, wood anatomical cuts for ring visualization, and radiocarbon results confirmed the annual periodicity of Polylepis pepei growth rings at the MNP treeline. At early stages of RW chronology development, radiocarbon results from a core and cross-section sample indicated that ring dates were offset by 1 year in relation to the SH Zone 14C curves. Upon a re-inspection of the samples collected in October 2012, we observed that the first ring behind the bark did not always represent a “complete” growth year as some trees had not yet started wood formation for the 2012 season (at least for the side of the stem where the core was sampled). Therefore, the calendar year assigned to the last ring that included both earlywood and latewood cells was corrected to 2011. This date-adjustment on the samples was confirmed after cross-dating additional RW series from living trees collected during the dry-season of 2019 (Waca-cocha closed-canopy forest). The final RW chronologies represent the common growth variability of 31 individual trees (mean correlation among RW series of r=0.50).
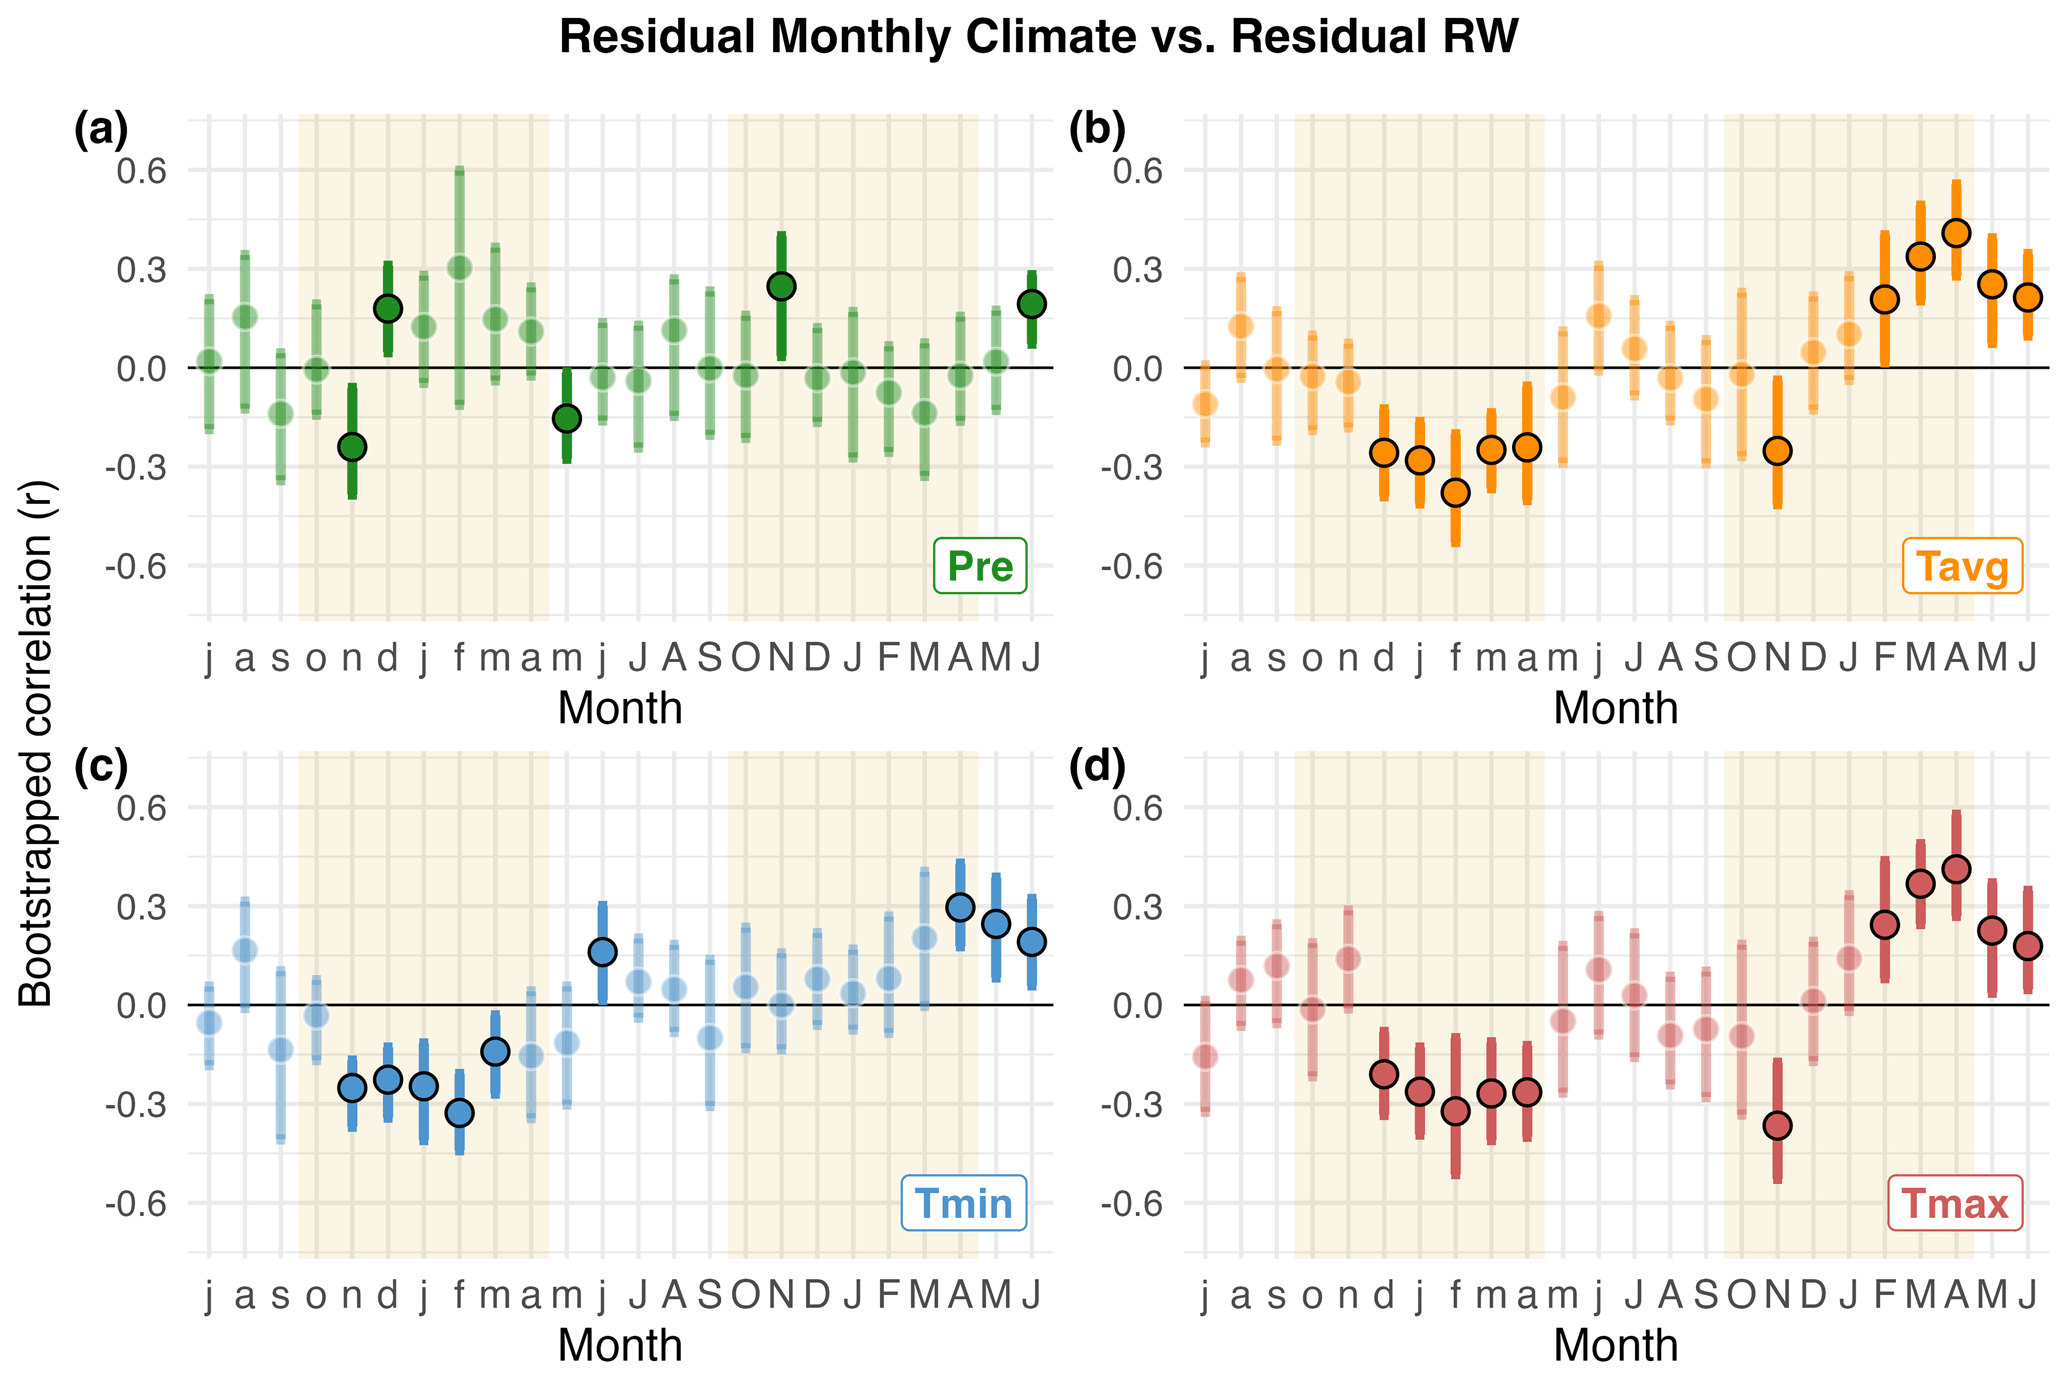
Figure A3Residual P. pepei RW correlations with residual monthly climate data 1960–2015. The residuals from a linear regression were applied to the local monthly precipitation (a), and mean, minimum, and maximum temperature series for the site (b–d) to evaluate the interannual relationships between annual RW and monthly climate variables. Lowercase letters on the x-axis represent prior-year climate (lag = 1). Correlations are reported as the median r estimated using stationary bootstrapping. Significance was defined from 95 % bootstrapped confidence intervals and are denoted in solid-colored circles outlined in black. Tan-shading represents the estimated “wet-season” for the treeline site which extends between October–April for this period.
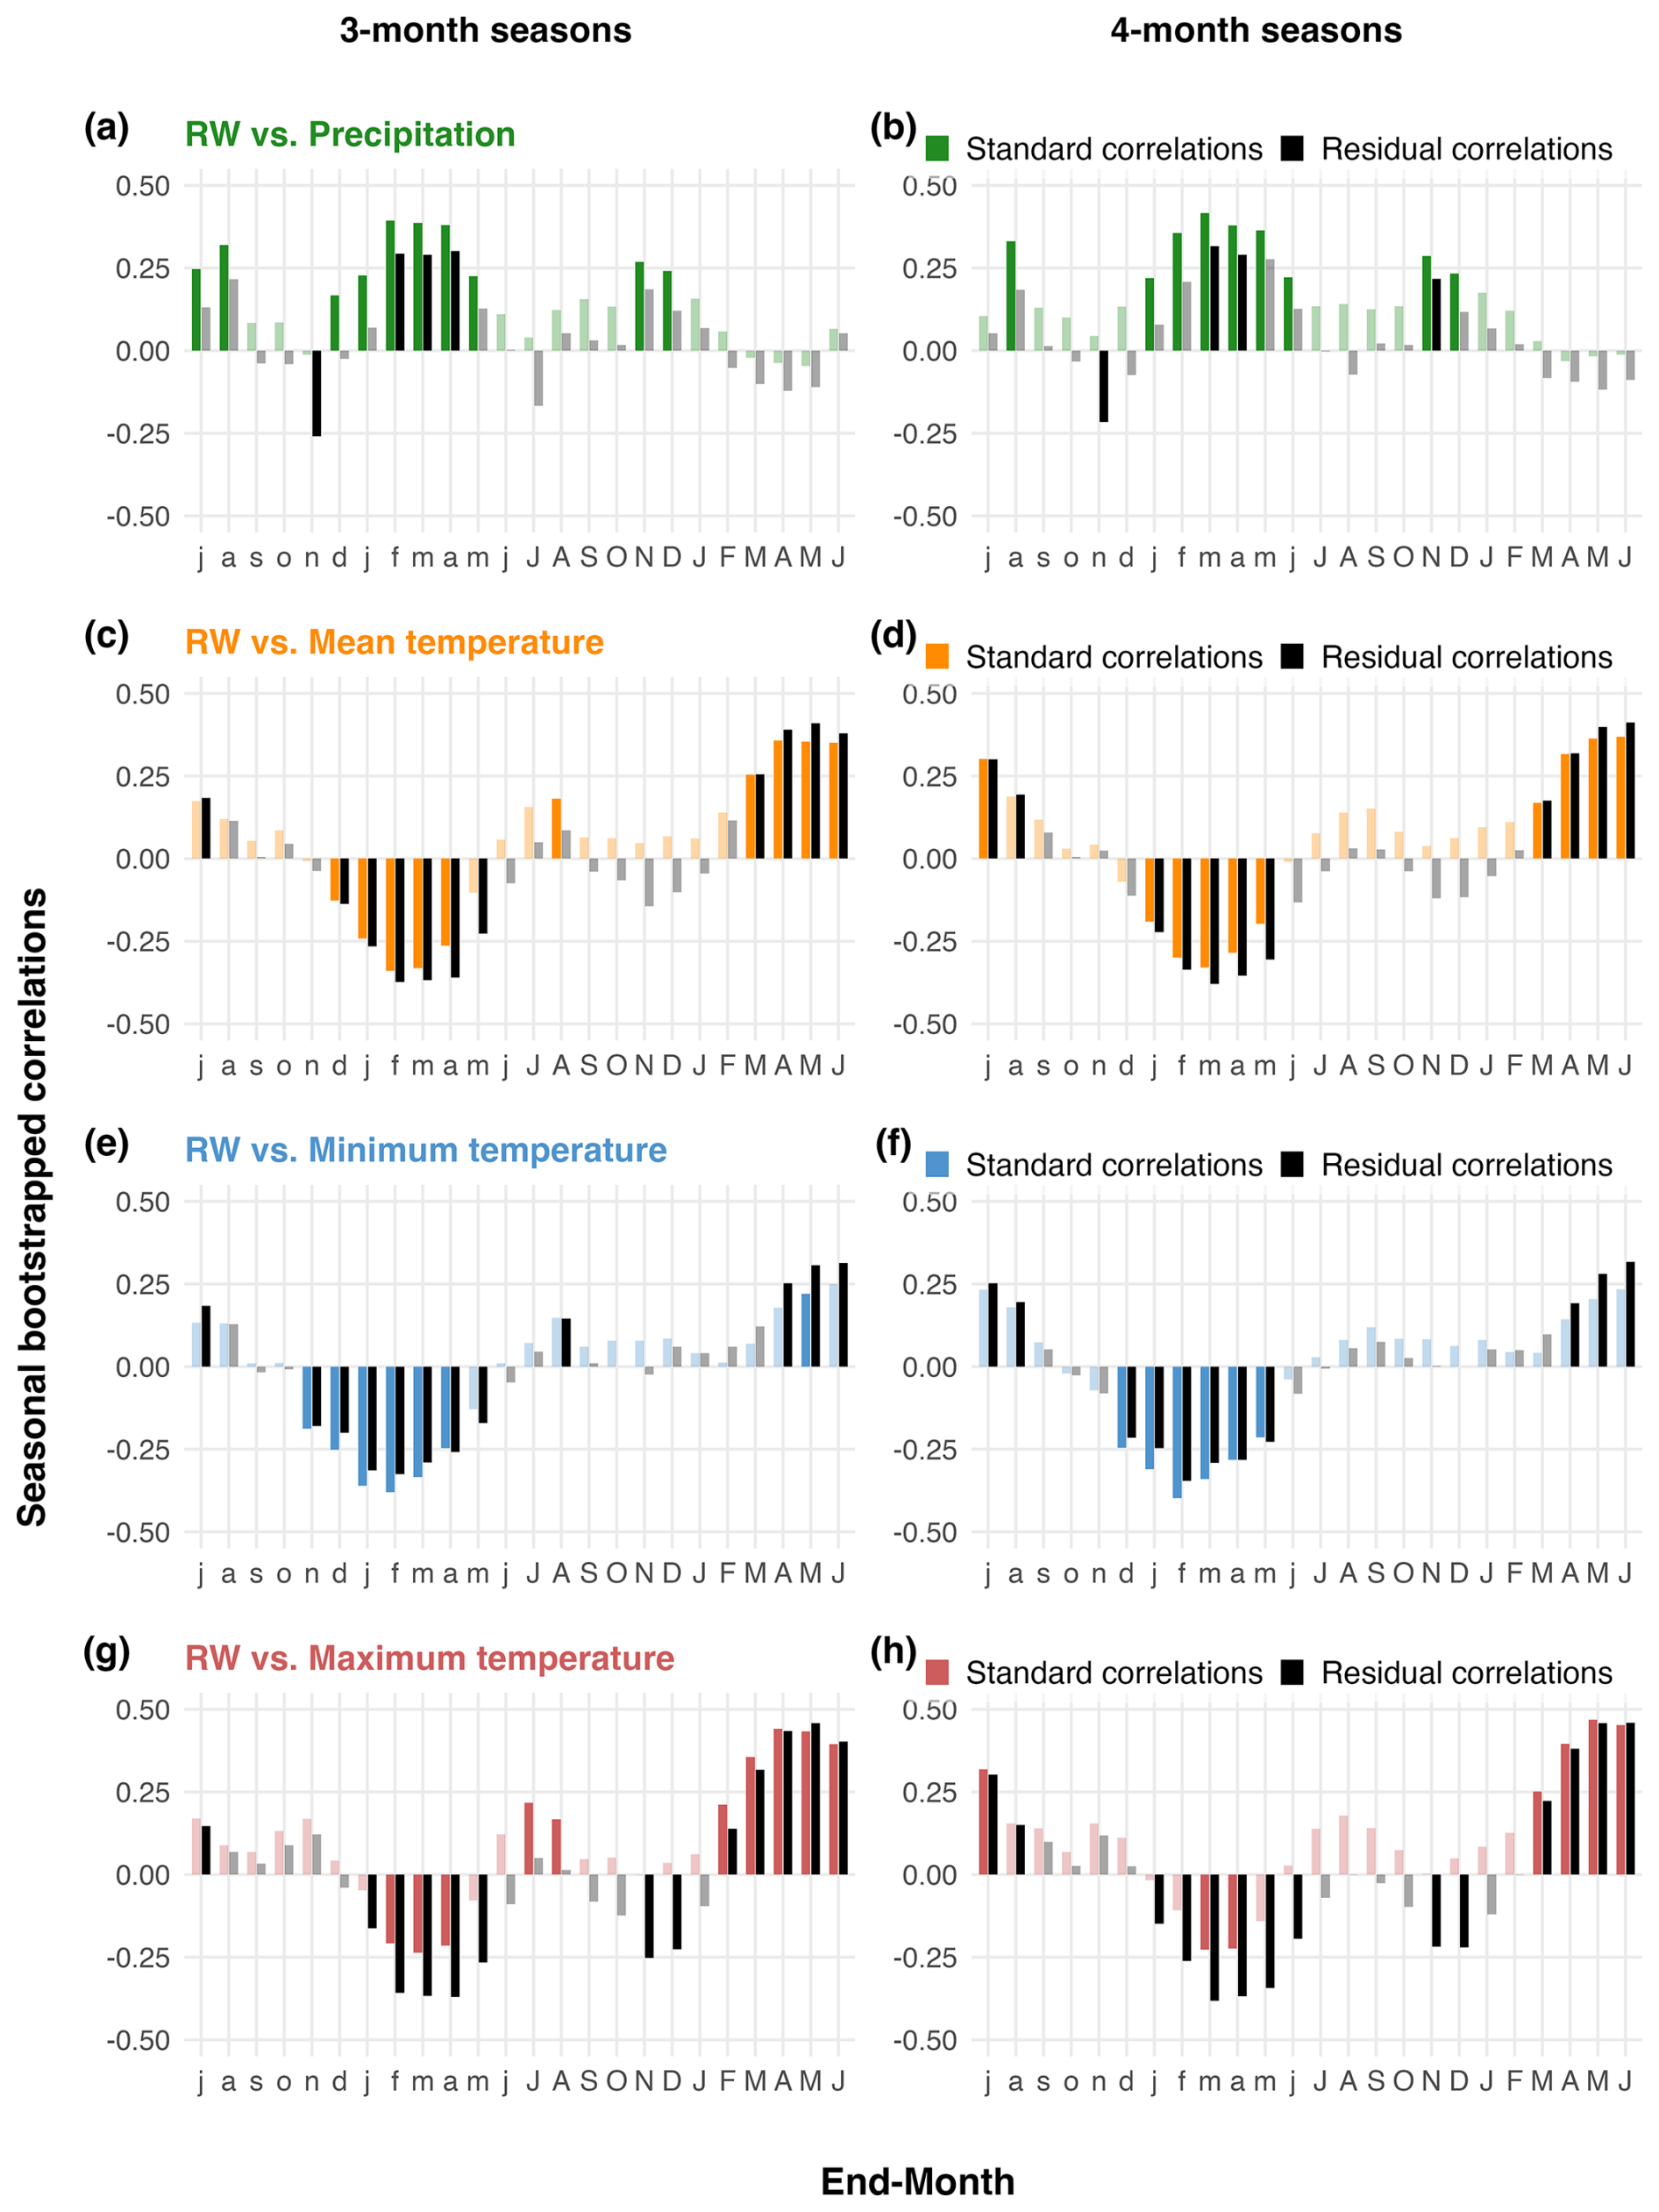
Figure A4Running seasonal climate correlations with P. pepei RW for 3-month (left column) and 4-month (right column) seasonal averages using local temperature and precipitation data (1960–2015). “Residual correlations” are represented as black bars (i.e. detrended climate vs. residual RW), while colored bars represent “standard correlations” (i.e. mean climate vs. standard RW). The x-axis represents the “end-month” of the season. For example, lowercase “f” in panel (a) represents correlations between RW and prior-year December-February precipitation (lag = 1). Significance was inferred from 95 % bootstrapped confidence intervals. Non-significant seasonal correlations are faded, while significant correlations are solid-colored bars.
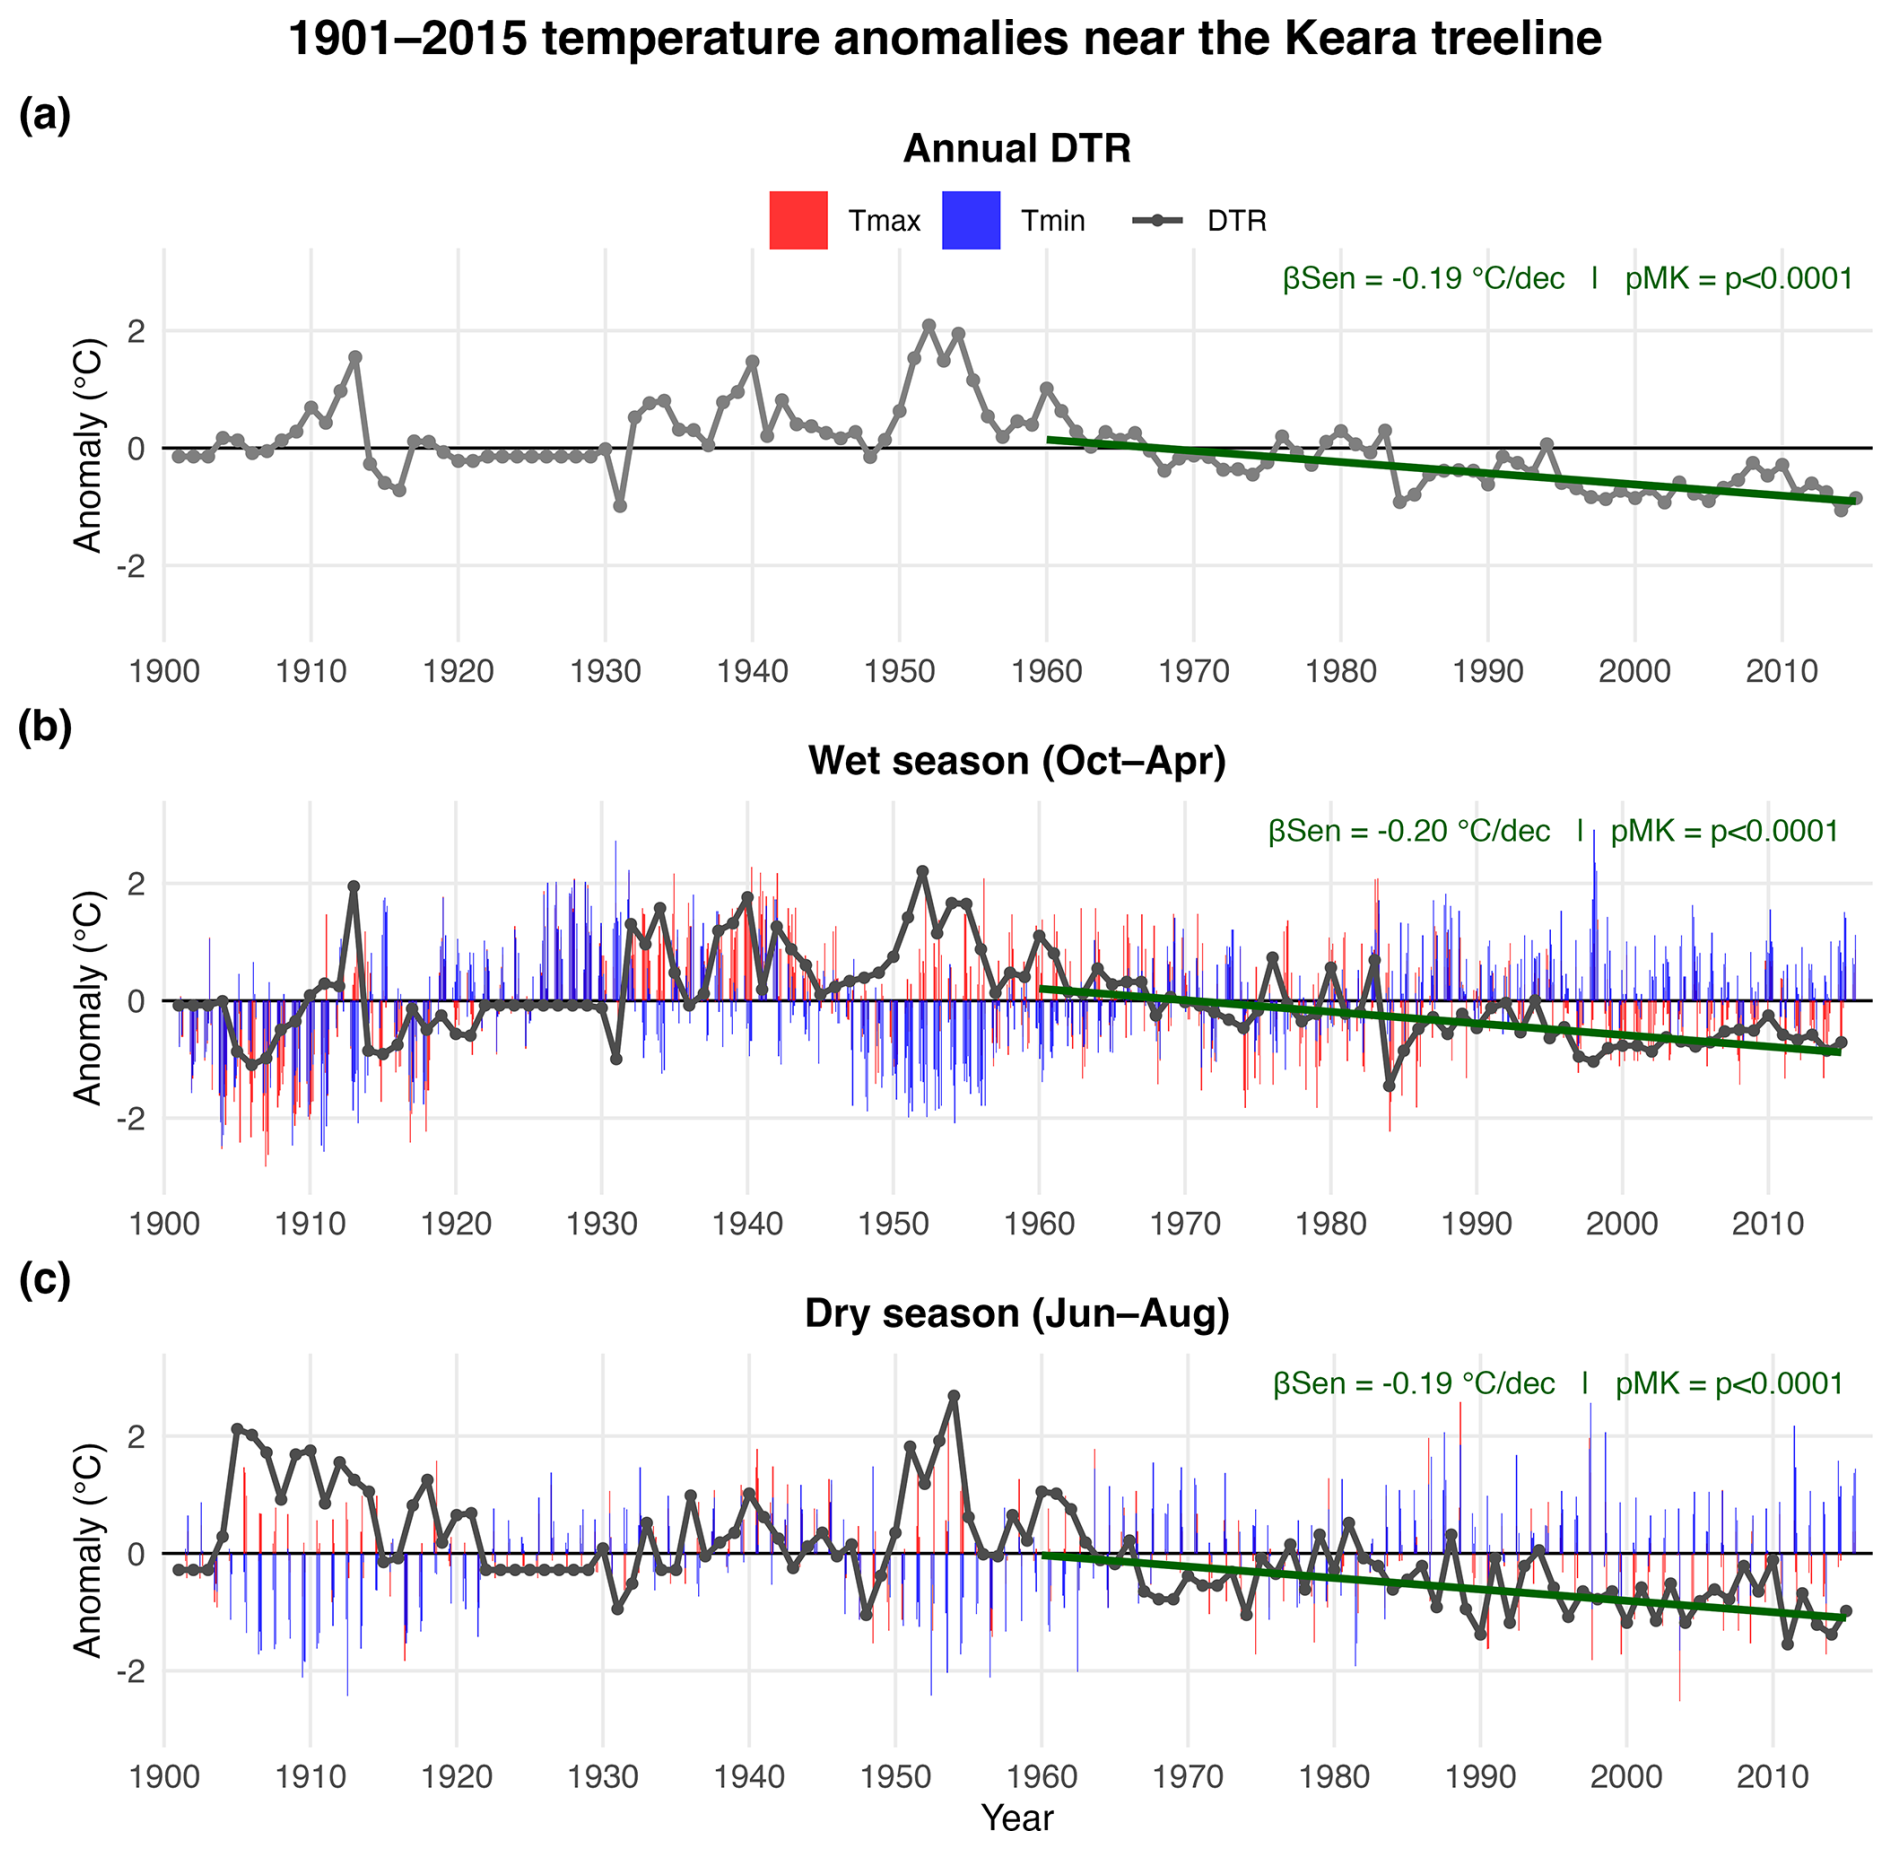
Figure A5Long-term temperature anomalies for the Keara site (1901–2015). The grey timeseries represents annual (a) and seasonal (b–c) diurnal temperature ranges based on the nearest CRU TS 4.08 gridpoint for this site (DTR). 1901 is the earliest date of available data for CRU. Linear trends in DTR anomalies were estimated using Sen's slope. The significance of the 1960–2015 trend was evaluated using a two-tailed Mann-Kendall test. The mean slope is reported as the average change in DTR (°C decade−1). Seasonal anomalies for Tmax (red) and Tmin (blue) are represented as vertical bars for the 1901–2015 period (b–c).
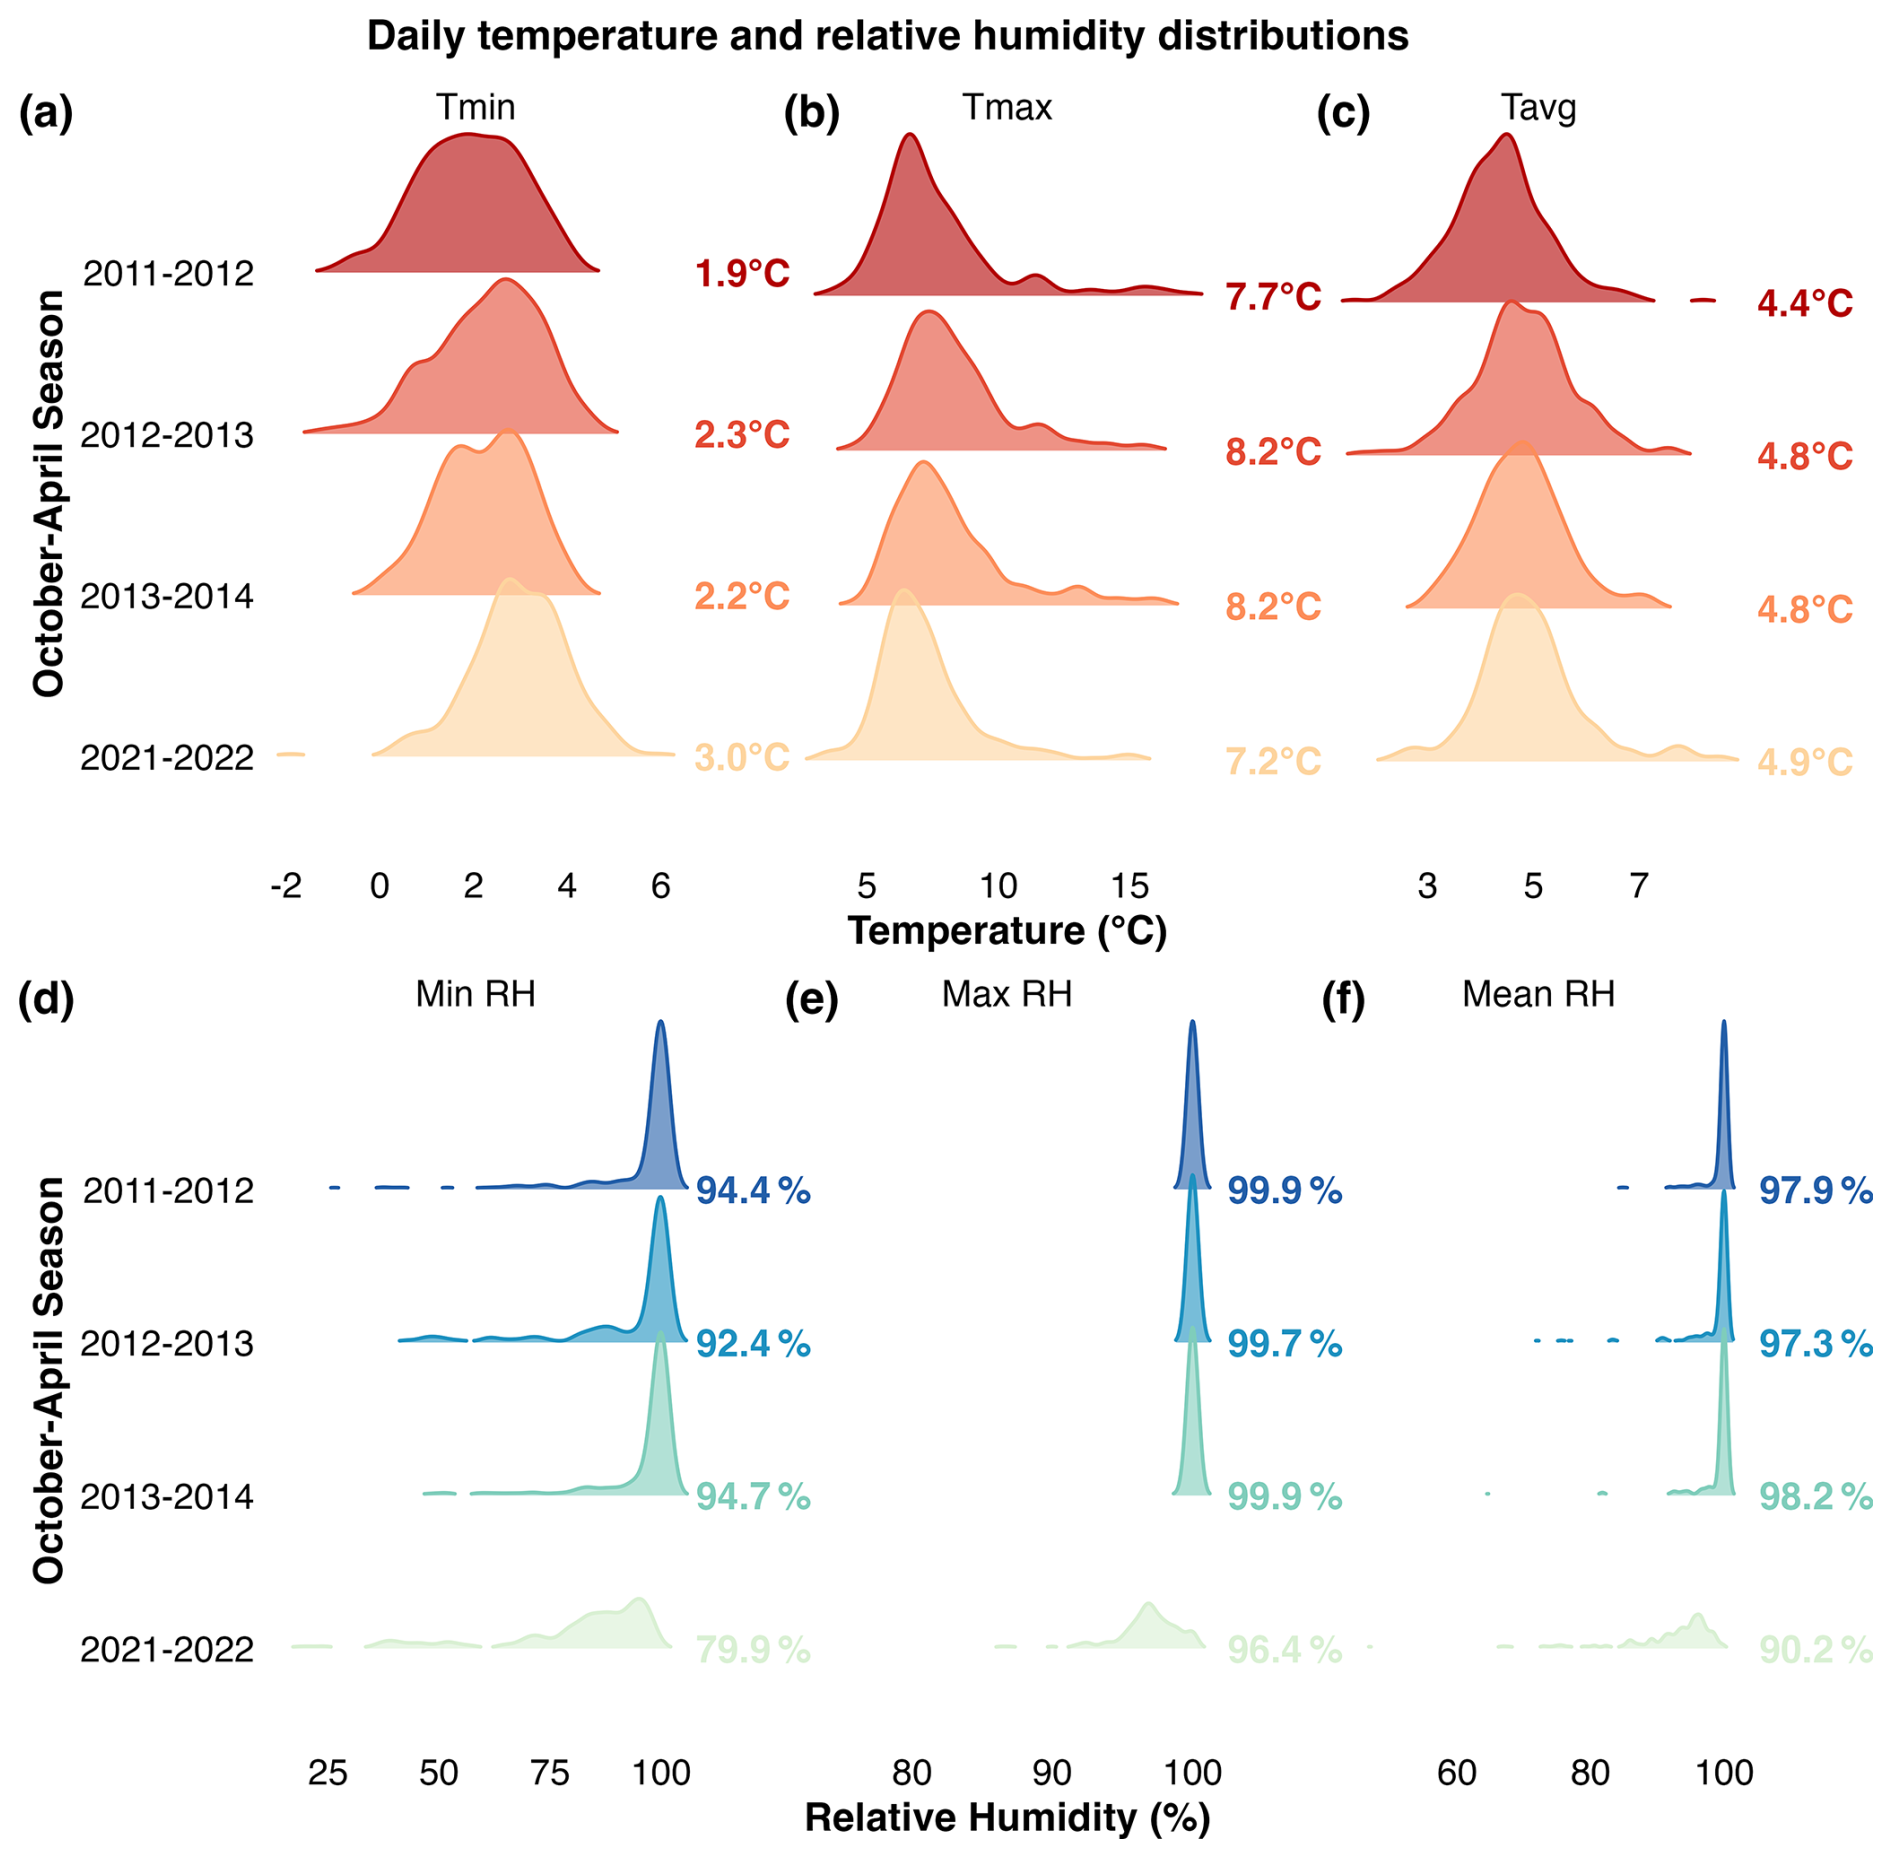
Figure A6Ridgeline distributions of daily temperature (a–c) and relative humidity (d–f) between October–April for the 2011–2012, 2012–2013, 2013–2014, and 2021–2022 seasons at the site. This data was resampled from hourly measurements recorded in situ from dataloggers installed near the Keara open-canopy forest in 2011 (see Sect. 2.1). The top row (a–c) represents daily minimum (Tmin), maximum (Tmax), and mean (Tavg) temperature. The bottom row (d–f) displays minimum, maximum, and mean relative humidity (RH). Colored ridges represent daily observations within each season, and bold values in the right margin represent the seasonal means.
The code and datasets used in the analysis of this research are available upon request from the first author.
Co-authors LAH, DRC, MRC, MEF, RO, ET, AF collected tree samples in Keara. CM and AF organized field campaigns and provided essential information regarding Madid National Park. RDD and LAH assisted in initial experimental design and editing. LAH orchestrated field logistics. Tree-ring dating, measuring, and analyses was conducted by corresponding author RO. HTTN, aided in correlation analyses and concept. APS assisted in wood anatomical methods. Editorial review provided by all co-authors. Site images for Figs. 1 and A2 were taken by RO.
The contact author has declared that none of the authors has any competing interests.
Publisher's note: Copernicus Publications remains neutral with regard to jurisdictional claims made in the text, published maps, institutional affiliations, or any other geographical representation in this paper. The authors bear the ultimate responsibility for providing appropriate place names. Views expressed in the text are those of the authors and do not necessarily reflect the views of the publisher.
This article is part of the special issue “Treeline ecotones under global change: linking spatial patterns to ecological processes”. It is not associated with a conference.
We thank Marco Tedesco's Lab at LDEO for making the Echo microscope camera available for the anatomical images. Ernesto Tejedor would like to aknowledge support from Comunidad de Madrid program Atracción Talento “César Nombela” grant number 2023-T1/ECO-29118. This work is dedicated to Renaud, his family and the community of Keara for their hospitality, knowledge, and assistance in the field. Special thanks the Nacional Herbario in La Paz, including Alfredo Fuentes and Freddy “Zen” Ruiz, for their guidance during the 2012, 2019, and 2023 Bolivian field campaigns.
This research has been supported by the Division of Atmospheric and Geospace Sciences (grant nos. 1702789, 1903687, 2303524, and 1903690) and the Office of International Science and Engineering (grant no. 1743738).
This paper was edited by Matteo Garbarino and reviewed by Giulia Antonia Resente and two anonymous referees.
Akaike, H.: A new look at the statistical model identification, IEEE Trans. Autom. Control, 19, 716–723, 1974.
Alvites, C., Battipaglia, G., Santopuoli, G., Hampel, H., Vázquez, R. F., Matteucci, G., and Tognetti, R.: Dendrochronological analysis and growth patterns of Polylepis reticulata (Rosaceae) in the Ecuadorian Andes, IAWA J., 40, 331–351, https://doi.org/10.1163/22941932-40190240, 2019.
Andreu-Hayles, L., Santos, G. M., Herrera-Ramírez, D. A., Martin-Fernández, J., Ruiz-Carrascal, D., Boza-Espinoza, T. E., Fuentes, A. F., and Jørgensen, P. M.: Matching Dendrochronological Dates with the Southern Hemisphere 14 C Bomb Curve to Confirm Annual Tree Rings in Pseudolmedia rigida from Bolivia, Radiocarbon, 57, 1–13, https://doi.org/10.2458/azu_rc.57.18192, 2015.
Andreu-Hayles, L., Tejedor, E., D'Arrigo, R., Locosselli, G. M., Rodríguez-Catón, M., Daux, V., Oelkers, R., Pacheco-Solana, A., Paredes-Villanueva, K., and Rodríguez-Morata, C.: Dendrochronological advances in the tropical and subtropical Americas: Research priorities and future directions, Dendrochronologia, 81, 126124, https://doi.org/10.1016/j.dendro.2023.126124, 2023.
Argollo, J., Soliz, C., and Villalba, R.: Potencialidad dendrocronológica de Polylepis tarapacana en los Andes Centrales de Bolivia, Ecol. En Boliv., 39, 5–24, 2004.
Arias, P. A., Garreaud, R., Poveda, G., Espinoza, J. C., Molina-Carpio, J., Masiokas, M., Viale, M., Scaff, L., and van Oevelen, P. J.: Hydroclimate of the Andes Part II: Hydroclimate Variability and Sub-Continental Patterns, Front. Earth Sci., 8, https://doi.org/10.3389/feart.2020.505467, 2021.
Baker, J. C. A., Gloor, M., Spracklen, D. V., Arnold, S. R., Tindall, J. C., Clerici, S. J., Leng, M. J., and Brienen, R. J. W.: What drives interannual variation in tree ring oxygen isotopes in the Amazon?, Geophys. Res. Lett., 43, 11831–11840, https://doi.org/10.1002/2016GL071507, 2016.
Beveridge, C. F., Espinoza, J.-C., Athayde, S., Correa, S. B., Couto, T. B. A., Heilpern, S. A., Jenkins, C. N., Piland, N. C., Utsunomiya, R., Wongchuig, S., and Anderson, E. P.: The Andes–Amazon–Atlantic pathway: A foundational hydroclimate system for social–ecological system sustainability, P. Natl. Acad. Sci. USA, 121, e2306229121, https://doi.org/10.1073/pnas.2306229121, 2024.
Blodgett, T. A., Blizard, C., and Isacks, B. L.: Andean Landslide Hazards, in: Geomorphological Hazards in High Mountain Areas, edited by: Kalvoda, J. and Rosenfeld, C. L., Springer Netherlands, Dordrecht, 211–227, https://doi.org/10.1007/978-94-011-5228-0_12, 1998.
Bunn, A. G.: A dendrochronology program library in R (dplR), Dendrochronologia, 26, 115–124, https://doi.org/10.1016/j.dendro.2008.01.002, 2008.
Buras, A.: A comment on the expressed population signal, Dendrochronologia, 44, 130–132, https://doi.org/10.1016/j.dendro.2017.03.005, 2017.
Canty, A. and Ripley, B.: Package “boot”, Bootstrap Funct. CRAN R Proj, https://doi.org/10.32614/CRAN.package.boot, 2017.
Chavez, S. P. and Takahashi, K.: Orographic rainfall hot spots in the Andes-Amazon transition according to the TRMM precipitation radar and in situ data, J. Geophys. Res.-Atmos., 122, 5870–5882, https://doi.org/10.1002/2016JD026282, 2017.
Christie, D. A., Lara, A., Barichivich, J., Villalba, R., Morales, M. S., and Cuq, E.: El Niño-Southern Oscillation signal in the world's highest-elevation tree-ring chronologies from the Altiplano, Central Andes, Palaeogeogr. Palaeocl., 281, 309–319, https://doi.org/10.1016/j.palaeo.2007.11.013, 2009.
Cintra, B. B. L., Gloor, E., Baker, J. C. A., Boom, A., Schöngart, J., Clerici, S., Pattnayak, K., and Brienen, R. J. W.: Tree ring isotopes reveal an intensification of the hydrological cycle in the Amazon, Commun. Earth Environ., 6, 453, https://doi.org/10.1038/s43247-025-02408-9, 2025.
Cook, E. R. and Pederson, N.: Uncertainty, Emergence, and Statistics in Dendrochronology, in: Dendroclimatology: Progress and Prospects, edited by: Hughes, M. K., Swetnam, T. W., and Diaz, H. F., Springer Netherlands, Dordrecht, 77–112, https://doi.org/10.1007/978-1-4020-5725-0_4, 2011.
Cook, E. R. and Peters, K.: The smoothing spline: a new approach to standardizing forest interior tree-ring width series for dendroclimatic studies, Tree-Ring Bull., 41, 45–53, 1981.
Cook, E. R., Briffa, K. R., Shiyatov, S. G., and Mazepa, V. S.: Tree-ring standardization and growth-trend estimation, in: Methods of Dendrochronology: Applications in the Environmental Sciences, edited by: Cook, E. R. and Kairiukstis, L. A., Kluwer Academic Publishers, Dordrecht, 104–123, https://doi.org/10.1007/978-94-015-7879-0, 1990.
Crispín-DelaCruz, D. B., Morales, Mariano. S., Andreu-Hayles, Laia., Christie, Duncan. A., Guerra, A., and Requena-Rojas, E. J.: High ENSO sensitivity in tree rings from a northern population of Polylepis tarapacana in the Peruvian Andes, Dendrochronologia, 71, 125902, https://doi.org/10.1016/j.dendro.2021.125902, 2022.
Cuesta, F., Tovar, C., Llambí, L. D., Gosling, W. D., Halloy, S., Carilla, J., Muriel, P., Meneses, R. I., Beck, S., Ulloa Ulloa, C., Yager, K., Aguirre, N., Viñas, P., Jácome, J., Suárez-Duque, D., Buytaert, W., and Pauli, H.: Thermal niche traits of high alpine plant species and communities across the tropical Andes and their vulnerability to global warming, J. Biogeogr., 47, 408–420, https://doi.org/10.1111/jbi.13759, 2020.
Cuyckens, G. A. E., Christie, D. A., Domic, A. I., Malizia, L. R., and Renison, D.: Climate change and the distribution and conservation of the world's highest elevation woodlands in the South American Altiplano, Glob. Planet. Change, 137, 79–87, https://doi.org/10.1016/j.gloplacha.2015.12.010, 2016.
Espinoza, J. C., Segura, H., Ronchail, J., Drapeau, G., and Gutierrez-Cori, O.: Evolution of wet-day and dry-day frequency in the western Amazon basin: Relationship with atmospheric circulation and impacts on vegetation, Water Resour. Res., 52, 8546–8560, https://doi.org/10.1002/2016WR019305, 2016.
Espinoza, J. C., Ronchail, J., Marengo, J. A., and Segura, H.: Contrasting North–South changes in Amazon wet-day and dry-day frequency and related atmospheric features (1981–2017), Clim. Dyn., 52, 5413–5430, https://doi.org/10.1007/s00382-018-4462-2, 2019.
Espinoza, J.-C., Arias, P. A., Moron, V., Junquas, C., Segura, H., Sierra-Pérez, J. P., Wongchuig, S., and Condom, T.: Recent Changes in the Atmospheric Circulation Patterns during the Dry-to-Wet Transition Season in South Tropical South America (1979–2020): Impacts on Precipitation and Fire Season, J. Clim., 34, 9025–9042, https://doi.org/10.1175/JCLI-D-21-0303.1, 2021.
Espinoza, T. E. B. and Kessler, M.: A monograph of the genus Polylepis (Rosaceae), PhytoKeys, 203, 1–274, https://doi.org/10.3897/phytokeys.203.83529, 2022.
Fajardo, A., Gazol, A., Mayr, C., and Camarero, J. J.: Recent decadal drought reverts warming-triggered growth enhancement in contrasting climates in the southern Andes tree line, J. Biogeogr., 46, 1367–1379, https://doi.org/10.1111/jbi.13580, 2019.
Farfan-Rios, W., Feeley, K. J., Myers, J. A., Tello, S., Sallo-Bravo, J., Malhi, Y., Phillips, O. L., Baker, T. R., Nina-Quispe, A., and Garcia-Cabrera, K.: Amazonian and Andean tree communities are not tracking current climate warming, P. Natl. Acad. Sci. USA, 122, e2425619122, https://doi.org/10.1073/pnas.2425619122, 2025.
Feeley, K. J., Silman, M. R., Bush, M. B., Farfan, W., Cabrera, K. G., Malhi, Y., Meir, P., Revilla, N. S., Quisiyupanqui, M. N. R., and Saatchi, S.: Upslope migration of Andean trees, J. Biogeogr., 38, 783–791, https://doi.org/10.1111/j.1365-2699.2010.02444.x, 2011.
Feeley, K. J., Rehm, E. M., and Machovina, B.: perspective: The responses of tropical forest species to global climate change: acclimate, adapt, migrate, or go extinct?, Front. Biogeogr., 4, https://doi.org/10.21425/F5FBG12621, 2012.
Finer, M. and Mamani, N.: Amazon Deforestation & Fire Hotspots 2022, MAAP, 187, 2017–21, 2023.
Frank, D., Esper, J., and Cook, E.: On variance adjustments in tree-ring chronology development, Tree Rings Archaeol. Climatol. Ecol. TRACE, 4, 56–66, 2006.
Fu, R., Yin, L., Li, W., Arias, P. A., Dickinson, R. E., Huang, L., Chakraborty, S., Fernandes, K., Liebmann, B., Fisher, R., and Myneni, R. B.: Increased dry-season length over southern Amazonia in recent decades and its implication for future climate projection, P. Natl. Acad. Sci. USA, 110, 18110–18115, https://doi.org/10.1073/pnas.1302584110, 2013.
Funk, C., Peterson, P., Landsfeld, M., Pedreros, D., Verdin, J., Shukla, S., Husak, G., Rowland, J., Harrison, L., and Hoell, A.: The climate hazards infrared precipitation with stations – a new environmental record for monitoring extremes, Sci. Data, 2, 1–21, 2015.
García-Núñez, C., Rada, F., Boero, C., González, J., Gallardo, M., Azócar, A., Liberman-Cruz, M., Hilal, M., and Prado, F.: Leaf Gas Exchange and Water Relations in Polylepis tarapacana at Extreme Altitudes in the Bolivian Andes, Photosynthetica, 42, 133–138, https://doi.org/10.1023/B:PHOT.0000040581.94641.ed, 2004.
Garreaud, R. D.: The Andes climate and weather, Adv. Geosci., 22, 3–11, https://doi.org/10.5194/adgeo-22-3-2009, 2009.
Groenendijk, P., Babst, F., Trouet, V., Fan, Z.-X., Granato-Souza, D., Locosselli, G. M., Mokria, M., Panthi, S., Pumijumnong, N., Abiyu, A., Acuña-Soto, R., Adenesky-Filho, E., Alfaro-Sánchez, R., Anholetto Junior, C. R., Aragão, J. R. V., Assis-Pereira, G., Astudillo-Sánchez, C. C., Carolina Barbosa, A., Barreto, N. de O., Battipaglia, G., Beeckman, H., Botosso, P. C., Bourland, N., Bräuning, A., Brienen, R., Brookhouse, M., Buajan, S., Buckley, B. M., Camarero, J. J., Carrillo-Parra, A., Ceccantini, G., Centeno-Erguera, L. R., Cerano-Paredes, J., Cervantes-Martínez, R., Chanthorn, W., Chen, Y.-J., Cintra, B. B. L., Cornejo-Oviedo, E. H., Cortés-Cortés, O., Costa, C. M., Couralet, C., Crispin-DelaCruz, D. B., D'Arrigo, R., David, D. A., De Ridder, M., Del Valle, J. I., Díaz-Carrillo, O. A., Dobner Jr, M., Doucet, J.-L., Dünisch, O., Enquist, B. J., Esemann-Quadros, K., Esquivel-Arriaga, G., Fayolle, A., Fenilli, T. A. B., Ferrero, M. E., Fichtler, E., Finnegan, P. M., Fontana, C., Francisco, K. S., Fu, P.-L., Galvão, F., Gebrekirstos, A., Giraldo, J. A., Gloor, E., Godoy-Veiga, M., Guerra, A., Haneca, K., Harley, G. L., Heinrich, I., Helle, G., Hernández-Díaz, J. C., Hornink, B., Hubau, W., Inga, J. G., Islam, M., Jiang, Y., Kaib, M., Hassan Khamisi, Z., Koprowski, M., Layme, E., Leffler, A. J., Ligot, G., Lisi, C. S., Loader, N. J., Lobo, F. de A., Longhi-Santos, T., Lopez, L., López-Hernández, M. I., Lousada, J. L. P. C., Manzanedo, R. D., Marcon, A. K., Maxwell, J. T., Mendivelso, H. A., Mendoza-Villa, O. N., Menezes, Í. R. N., Montóia, V. R., Moors, E., Moreno, M., et al.: The importance of tropical tree-ring chronologies for global change research, Quaternary Sci. Rev., 355, 109233, https://doi.org/10.1016/j.quascirev.2025.109233, 2025.
Harris, I., Osborn, T. J., Jones, P., and Lister, D.: Version 4 of the CRU TS monthly high-resolution gridded multivariate climate dataset, Sci. Data, 7, 109, https://doi.org/10.1038/s41597-020-0453-3, 2020.
Haurwitz, M. W. and Brier, G. W.: A critique of the superposed epoch analysis method: its application to solar–weather relations, Mon. Weather Rev., 109, 2074–2079, 1981.
Hertel, D. and Wesche, K.: Tropical moist Polylepis stands at the treeline in East Bolivia: the effect of elevation on stand microclimate, above- and below-ground structure, and regeneration, Trees, 22, 303–315, https://doi.org/10.1007/s00468-007-0185-4, 2008.
Hoch, G. and Körner, C.: Growth, Demography and Carbon Relations of Polylepis Trees at the World's Highest Treeline, Funct. Ecol., 19, 941–951, 2005.
Hoffmann, D. and Weggenmann, D.: Climate Change Induced Glacier Retreat and Risk Management: Glacial Lake Outburst Floods (GLOFs) in the Apolobamba Mountain Range, Bolivia, in: Climate Change and Disaster Risk Management, edited by: Leal Filho, W., Springer, Berlin, Heidelberg, 71–87, https://doi.org/10.1007/978-3-642-31110-9_5, 2013.
Holmes, R. L.: Program COFECHA user's manual, Lab. Tree-Ring Res. Univ. Ariz. Tucson, Tree-ring Society, Tree-ring Bulletin, Vol. 43, 69–78, ISSN 0041-2198, https://repository.arizona.edu/handle/10150/261223 (last access: 24 June 2026), 1983.
Hua, Q., Turnbull, J. C., Santos, G. M., Rakowski, A. Z., Ancapichún, S., Pol-Holz, R. D., Hammer, S., Lehman, S. J., Levin, I., Miller, J. B., Palmer, J. G., and Turney, C. S. M.: Atmospheric radiocarbon for the period 1950–2019, Radiocarbon, 64, 723–745, https://doi.org/10.1017/RDC.2021.95, 2022.
Huerta, A., Brönnimann, S., de Luis, M., Beguería, S., and Serrano-Notivoli, R.: Enhancing daily precipitation reconstruction: An improved version of the reddPrec R package, Environ. Model. Softw., 195, 106717, https://doi.org/10.1016/j.envsoft.2025.106717, 2026.
Hunziker, S., Brönnimann, S., Calle, J., Moreno, I., Andrade, M., Ticona, L., Huerta, A., and Lavado-Casimiro, W.: Effects of undetected data quality issues on climatological analyses, Clim. Past, 14, 1–20, https://doi.org/10.5194/cp-14-1-2018, 2018.
Jaramillo, A. D.: Fotosíntesis en los Bosques a Mayor Elevación en el Planeta: Polylepis tarapacana en un Gradiente de Elevación en los Andes de Arica y Parinacota, Chile, Doctoral thesis, Universidad Austral de Chile, Valdivia, Chile, 2015.
Jomelli, V., Pavlova, I., Guin, O., Soliz-Gamboa, C., Contreras, A., Toivonen, J. M., and Zetterberg, P.: Analysis of the Dendroclimatic Potential of Polylepis pepei, P. subsericans and P. rugulosa In the Tropical Andes (Peru-Bolivia), Tree-Ring Res., 68, 91–103, https://doi.org/10.3959/2011-10.1, 2012.
Junquas, C., Takahashi, K., Condom, T., Espinoza, J.-C., Chavez, S., Sicart, J.-E., and Lebel, T.: Understanding the influence of orography on the precipitation diurnal cycle and the associated atmospheric processes in the central Andes, Clim. Dyn., 50, 3995–4017, https://doi.org/10.1007/s00382-017-3858-8, 2018.
Kessler, M., Toivonen, J. M., Sylvester, S. P., Kluge, J., and Hertel, D.: Elevational patterns of Polylepis tree height (Rosaceae) in the high Andes of Peru: role of human impact and climatic conditions, Front. Plant Sci., 5, 194, https://doi.org/10.3389/fpls.2014.00194, 2014.
Kolmogorov, A.: Sulla determinazione empirica di una legge didistribuzione, Giorn Dellinst Ital Degli Att, 4, 89–91, 1933.
Körner, C.: Definitions and conventions, in: Alpine Treelines: Functional Ecology of the Global High Elevation Tree Limits, edited by: Körner, C., Springer, Basel, 11–19, https://doi.org/10.1007/978-3-0348-0396-0_2, 2012.
Körner, C. and Hoch, G.: Not every high-latitude or high-elevation forest edge is a treeline, J. Biogeogr., 50, 838–845, https://doi.org/10.1111/jbi.14593, 2023.
Kunsch, H. R.: The Jackknife and the Bootstrap for General Stationary Observations, Ann. Stat., 17, 1217–1241, https://doi.org/10.1214/aos/1176347265, 1989.
Maxwell, R. S. and Larsson, L. A.: Measuring tree-ring widths using the CooRecorder software application, Dendrochronologia, 67, 125841, https://doi.org/10.1016/j.dendro.2021.125841, 2021.
Livezey, R. E. and Chen, W. Y.: Statistical field significance and its determination by Monte Carlo techniques, Mon. Weather Rev., 111, 46–59, 1983.
Locosselli, G. M., Brienen, R. J. W., Leite, M. de S., Gloor, M., Krottenthaler, S., Oliveira, A. A. de, Barichivich, J., Anhuf, D., Ceccantini, G., Schöngart, J., and Buckeridge, M.: Global tree-ring analysis reveals rapid decrease in tropical tree longevity with temperature, P. Natl. Acad. Sci. USA, 117, 33358–33364, https://doi.org/10.1073/pnas.2003873117, 2020.
López, V. L., Huertas Herrera, A., Rosas, Y. M., and Cellini, J. M.: Optimal environmental drivers of high-mountains forest: Polylepis tarapacana cover evaluation in their southernmost distribution range of the Andes, Trees For. People, 9, 100321, https://doi.org/10.1016/j.tfp.2022.100321, 2022.
Macek, P., Macková, J., and de Bello, F.: Morphological and ecophysiological traits shaping altitudinal distribution of three Polylepis treeline species in the dry tropical Andes, Acta Oecol., 35, 778–785, https://doi.org/10.1016/j.actao.2009.08.013, 2009.
Macía, M. J.: Woody plants diversity, floristic composition and land use history in the Amazonian rain forests of Madidi National Park, Bolivia, Biodivers. Conserv., 17, 2671–2690, https://doi.org/10.1007/s10531-008-9348-x, 2008.
Macias-Fauria, M. and Johnson, E. A.: Warming-induced upslope advance of subalpine forest is severely limited by geomorphic processes, P. Natl. Acad. Sci. USA, 110, 8117–8122, https://doi.org/10.1073/pnas.1221278110, 2013.
Malhi, Y., Roberts, J. T., Betts, R. A., Killeen, T. J., Li, W., and Nobre, C. A.: Climate Change, Deforestation, and the Fate of the Amazon, Science, 319, 169–172, 2008.
Marengo, J. A., Tomasella, J., Alves, L. M., Soares, W. R., and Rodriguez, D. A.: The drought of 2010 in the context of historical droughts in the Amazon region, Geophys. Res. Lett., 38, https://doi.org/10.1029/2011GL047436, 2011.
Meko, D. M., Touchan, R., and Anchukaitis, K. J.: Seascorr: A MATLAB program for identifying the seasonal climate signal in an annual tree-ring time series, Comput. Geosci., 37, 1234–1241, https://doi.org/10.1016/j.cageo.2011.01.013, 2011.
Melvin, T. M.: Historical Growth Rates and Changing Climatic Sensitivity of Boreal Conifers, doctoral thesis, University of East Anglia, https://ueaeprints.uea.ac.uk/id/eprint/42398 (last access: 24 June 2026), 2004.
Morales, M. S., Villalba, R., Grau, H. R., and Paolini, L.: Rainfall-Controlled Tree Growth in High-Elevation Subtropical Treelines, Ecology, 85, 3080–3089, https://doi.org/10.1890/04-0139, 2004.
Morales, M. S., Crispín-DelaCruz, D. B., Álvarez, C., Christie, D. A., Ferrero, M. E., Andreu-Hayles, L., Villalba, R., Guerra, A., Ticse-Otarola, G., Rodríguez-Ramírez, E. C., LLocclla-Martínez, R., Sanchez-Ferrer, J., and Requena-Rojas, E. J.: Drought increase since the mid-20th century in the northern South American Altiplano revealed by a 389-year precipitation record, Clim. Past, 19, 457–476, https://doi.org/10.5194/cp-19-457-2023, 2023.
Myers, S. C., Wallace, T. C., Beck, S. L., Silver, P. G., Zandt, G., Vandecar, J., and Minaya, E.: Implications of spatial and temporal development of the aftershock sequence for the Mw 8.3 June 9, 1994 Deep Bolivian Earthquake, Geophys. Res. Lett., 22, 2269–2272, https://doi.org/10.1029/95GL01600, 1995.
Nagy, L., Eller, C. B., Mercado, L. M., Cuesta, F. X., Llambí, L. D., Buscardo, E., Aragão, L. E. O. C., García-Núñez, C., Oliveira, R. S., Barbosa, M., Ceballos, S. J., Calderón-Loor, M., Fernandes, G. W., Aráoz, E., Muñoz, A. M. Q., Rozzi, R., Aguirre, F., Álvarez-Dávila, E., Salinas, N., and Sitch, S.: South American mountain ecosystems and global change – a case study for integrating theory and field observations for land surface modelling and ecosystem management, Plant Ecol. Divers., 16, 1–27, https://doi.org/10.1080/17550874.2023.2196966, 2023.
Oelkers, R. C., Andreu-Hayles, L., D'Arrigo, R., Pacheco-Solana, A., Rodriguez-Caton, M., Fuentes, A., Santos, G. M., Tejedor, E., Ferrero, M. E., and Maldonado, C.: Recent growth increase in endemic Juglans boliviana from the tropical Andes, Dendrochronologia, 79, 126090, https://doi.org/10.1016/j.dendro.2023.126090, 2023.
Pettitt, A. N.: A Non-Parametric Approach to the Change-Point Problem, J. R. Stat. Soc. Ser. C, 28, 126–135, https://doi.org/10.2307/2346729, 1979.
Peyre, G., Zuñiga, E., Cornejo Paredes, A., Paja Medina, A., Sulla Torres, J. A., Zúñiga Carnero, M., and Rosas Paredes, K.: Socio-ecological dynamics of Andean treelines in the 21st century, Front. Ecol. Evol., 13, https://doi.org/10.3389/fevo.2025.1613871, 2025.
Pohlert, T.: Non-parametric trend tests and change-point detection, CC -ND, 4, 1–18, 2016.
Politis, D. N. and Romano, J. P.: The Stationary Bootstrap, J. Am. Stat. Assoc., 89, 1303–1313, https://doi.org/10.1080/01621459.1994.10476870, 1994.
Quesada-Román, A., Ballesteros-Cánovas, J. A., St. George, S., and Stoffel, M.: Tropical and subtropical dendrochronology: Approaches, applications, and prospects, Ecol. Indic., 144, 109506, https://doi.org/10.1016/j.ecolind.2022.109506, 2022.
Rada, F., García-Núñez, C., Boero, C., Gallardo, M., Hilal, M., González, J., Prado, F., Liberman-Cruz, M., and Azócar, A.: Low-temperature resistance in Polylepis tarapacana, a tree growing at the highest altitudes in the world, Plant Cell Environ., 24, 377–381, https://doi.org/10.1046/j.1365-3040.2001.00685.x, 2001.
Rao, M. P., Cook, E. R., Cook, B. I., Anchukaitis, K. J., D'Arrigo, R. D., Krusic, P. J., and LeGrande, A. N.: A double bootstrap approach to Superposed Epoch Analysis to evaluate response uncertainty, Dendrochronologia, 55, 119–124, https://doi.org/10.1016/j.dendro.2019.05.001, 2019.
Rasmusson, E. M. and Carpenter, T. H.: Variations in tropical sea surface temperature and surface wind fields associated with the Southern Oscillation/El Niño, Mon. Weather Rev., 110, 354–384, 1982.
Requena-Rojas, E. J., Crispín-DelaCruz, D. B., Ticse-Otarola, G., Quispe-Melgar, H. R., Inga Guillen, J. G., Camel Paucar, V., Guerra, A., Ames-Martinez, F. N., and Morales, M.: Temporal Growth Variation in High-Elevation Forests: Case Study of Polylepis Forests in Central Andes, in: Latin American Dendroecology: Combining Tree-Ring Sciences and Ecology in a Megadiverse Territory, edited by: Pompa-García, M. and Camarero, J. J., Springer International Publishing, Cham, 263–279, https://doi.org/10.1007/978-3-030-36930-9_12, 2020.
Requena-Rojas, E. J., Amoroso, M. M., Ticse-Otarola, G., and Crispin-Delacruz, D. B.: Assessing Dendrochronological Potential of Escallonia myrtilloides in the High Andes of Peru, Tree-Ring Res., 77, 41–52, https://doi.org/10.3959/TRR2019-8, 2021.
Rodriguez-Caton, M., Andreu-Hayles, L., Morales, M. S., Daux, V., Christie, D. A., Coopman, R. E., Alvarez, C., Rao, M. P., Aliste, D., Flores, F., and Villalba, R.: Different climate sensitivity for radial growth, but uniform for tree-ring stable isotopes along an aridity gradient in Polylepis tarapacana, the world's highest elevation tree species, Tree Physiol., 41, 1353–1371, https://doi.org/10.1093/treephys/tpab021, 2021.
Rodriguez-Caton, M., Andreu-Hayles, L., Daux, V., Vuille, M., Varuolo-Clarke, A. M., Oelkers, R., Christie, D. A., D'Arrigo, R., Morales, M. S., Palat Rao, M., Srur, A. M., Vimeux, F., and Villalba, R.: Hydroclimate and ENSO Variability Recorded by Oxygen Isotopes From Tree Rings in the South American Altiplano, Geophys. Res. Lett., 49, https://doi.org/10.1029/2021GL095883, 2022.
Rodriguez-Caton, M., Morales, M. S., Rao, M. P., Nixon, T., Vuille, M., Rivera, J. A., Oelkers, R., Christie, D. A., Varuolo-Clarke, A. M., Ferrero, M. E., Magney, T., Daux, V., Villalba, R., and Andreu-Hayles, L.: A 300-year tree-ring δ18O-based precipitation reconstruction for the South American Altiplano highlights decadal hydroclimate teleconnections, Commun. Earth Environ., 5, 1–13, https://doi.org/10.1038/s43247-024-01385-9, 2024.
Roig, F., Fernández, M., Gareca León, E., Altamirano, S., and Monge, S.: Estudios dendrocronológicos en los ambientes húmedos de la puna boliviana dendrochronological studies in the humid puna environments of bolivia, Rev. Bol. Ecol., 9, 3–13, 2001.
Romatschke, U. and Houze, R. A.: Extreme Summer Convection in South America, 23, 3761–391, https://doi.org/10.1175/2010JCLI3465.1, 2010.
Ropelewski, C. F. and Halpert, M. S.: Global and Regional Scale Precipitation Patterns Associated with the El Niño/Southern Oscillation, Mon. Weather Rev., 15, 1606–1626, 1987.
Rosales, A. G., Junquas, C., Rocha, R. P. da, Condom, T., and Espinoza, J.-C.: Valley–Mountain Circulation Associated with the Diurnal Cycle of Precipitation in the Tropical Andes (Santa River Basin, Peru), Atmosphere, 13, https://doi.org/10.3390/atmos13020344, 2022.
Schulman, E.: Dendroclimatic Changes in Semiarid America, University of Arizona Press, Tucson, 142 pp., 1956.
Sen, P. K.: Estimates of the Regression Coefficient Based on Kendall's Tau, J. Am. Stat. Assoc., 63, 1379–1389, https://doi.org/10.1080/01621459.1968.10480934, 1968.
Sierra, J. P., Junquas, C., Espinoza, J. C., Segura, H., Condom, T., Andrade, M., Molina-Carpio, J., Ticona, L., Mardoñez, V., Blacutt, L., Polcher, J., Rabatel, A., and Sicart, J. E.: Deforestation impacts on Amazon-Andes hydroclimatic connectivity, Clim. Dyn., 58, 2609–2636, https://doi.org/10.1007/s00382-021-06025-y, 2022.
Simpson, B. B.: A revision of the genus Polylepis (Rosaceae: Sanguisorbeae), Smithson. Contrib. Bot., Smithsonian University Press, Washington, No. 43, 1–62, 1979.
Smirnov, N.: Table for estimating the goodness of fit of empirical distributions, Ann. Math. Stat., 19, 279–281, 1948.
Solíz, C., Villalba, R., Argollo, J., Morales, M. S., Christie, D. A., Moya, J., and Pacajes, J.: Spatio-temporal variations in Polylepis tarapacana radial growth across the Bolivian Altiplano during the 20th century, Palaeogeogr. Palaeocl., 281, 296–308, https://doi.org/10.1016/j.palaeo.2008.07.025, 2009.
Stokes, M. A. and Smiley, T. L.: An introduction to tree-ring dating, University of Chicago Press, Chicago, Illinois, ISBN: 9780226775401, 1968.
Thompson, L. G., Mosley-Thompson, E., Brecher, H., Davis, M., León, B., Les, D., Lin, P.-N., Mashiotta, T., and Mountain, K.: Abrupt tropical climate change: Past and present, P. Natl. Acad. Sci. USA, 103, 10536–10543, https://doi.org/10.1073/pnas.0603900103, 2006.
Vera, C., Higgins, W., Amador, J., Ambrizzi, T., Garreaud, R., Gochis, D., Gutzler, D., Lettenmaier, D., Marengo, J., Mechoso, C. R., Nogues-Paegle, J., Silva Dias, P. L., and Zhang, C.: Toward a Unified View of the American Monsoon Systems, J. Clim., 19, 4977–5000, https://doi.org/10.1175/JCLI3896.1, 2006.
von Arx, G., Crivellaro, A., Prendin, A. L., Čufar, K., and Carrer, M.: Quantitative Wood Anatomy–Practical Guidelines, Front. Plant Sci., 7, 781, https://doi.org/10.3389/fpls.2016.00781, 2016.
Vuille, M., Bradley, R. S., and Keimig, F.: Interannual climate variability in the Central Andes and its relation to tropical Pacific and Atlantic forcing, J. Geophys. Res.-Atmos., 105, 12447–12460, https://doi.org/10.1029/2000JD900134, 2000.
Wigley, T. M. L., Briffa, K. R., and Jones, P. D.: On the Average Value of Correlated Time Series, with Applications in Dendroclimatology and Hydrometeorology, J. Appl. Meteorol. Climatol., 23, 201–213, https://doi.org/10.1175/1520-0450(1984)023<0201:OTAVOC>2.0.CO;2, 1984.
Wilke, C. O. and Wilke, M. C. O.: Package “ggridges”, Ridgeline Plots “ggplot2 (Version 0.5.7), R package, https://doi.org/10.32614/CRAN.package.ggridges, 2022.
Wolter, K. and Timlin, M. S.: El Niño/Southern Oscillation behaviour since 1871 as diagnosed in an extended multivariate ENSO index (MEI.ext), Int. J. Climatol., 31, 1074–1087, https://doi.org/10.1002/joc.2336, 2011.
Yoon, J. and Zeng, N.: An Atlantic influence on Amazon rainfall, Clim. Dyn., 34, 249–264, https://doi.org/10.1007/s00382-009-0551-6, 2010.
Young, K. R. and León, B.: Tree-line changes along the Andes: implications of spatial patterns and dynamics, Philos. Trans. R. Soc. B, 362, 263–272, https://doi.org/10.1098/rstb.2006.1986, 2006.
Zanin, P. R. and Satyamurty, P.: Hydrological processes interconnecting the two largest watersheds of South America from multi-decadal to inter-annual time scales: A critical review, Int. J. Climatol., 40, 4006–4038, https://doi.org/10.1002/joc.6442, 2020.
Zelazowski, P., Jozefowicz, S., Feeley, K. J., and Malhi, Y.: Establishing the Position and Drivers of the Eastern Andean Treeline with Automated Transect Sampling, Remote Sens., 15, 2679, https://doi.org/10.3390/rs15102679, 2023.