
the Creative Commons Attribution 4.0 License.
the Creative Commons Attribution 4.0 License.
 | 09 Jul 2026
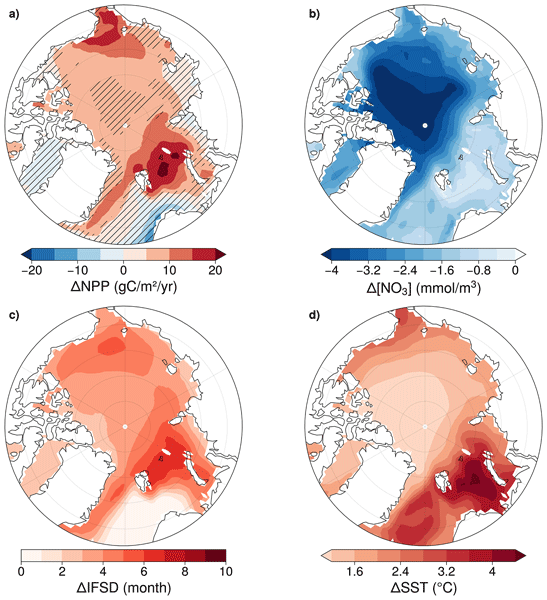
Heterogeneous future Arctic Ocean primary productivity changes projected in CMIP6
Léna Champiot-Bayard
Lester Kwiatkowski
Martin Vancoppenolle
The Arctic Ocean is experiencing profound environmental changes due to climate change, with Net Primary Production (NPP) broadly projected to increase this century. This study analyzes NPP trends and their drivers across pan-Arctic and sub-regional scales throughout the 21st century, comparing Coupled Model Intercomparison Project Phase 6 (CMIP6) and Phase 5 (CMIP5) projections to assess how model generations differ. Using a multi-model approach, we assess projections for different Phytoplankton Functional Types (PFTs), diatoms and nanophytoplankton, and examine the role of physical and biogeochemical constraints including light, nutrient, and temperature limitations. Our results reveal that Arctic Ocean NPP increases are primarily driven by reduced sea ice cover, leading to longer ice-free seasons in the expanding seasonal ice zone. However, NPP changes exhibit pronounced spatial heterogeneity, with strong increases in Arctic inflow shelf regions, tempered by decreases in Baffin Bay and Nordic Seas. These differences are due to the varying balance between physical and biogeochemical NPP constraints across the Arctic Ocean. The multi-model mean Arctic Ocean NPP increase is four times larger in CMIP6 than in CMIP5, under comparable radiative forcing, with a three times higher uncertainty at the end of the century. This difference is attributed to higher baseline nutrient levels in CMIP6, combined with more pronounced sea ice loss and greater warming than in CMIP5. Key aspects to better simulate future Arctic Ocean NPP remain the representation of present-day nutrient levels, light transmission through sea ice and reduced model uncertainty in climate sensitivity.
- Article
(20485 KB) - Full-text XML
- BibTeX
- EndNote


Phytoplankton are marine microorganisms that serve as primary producers in ocean ecosystems, forming the foundation of marine food webs (Vincent and Laybourn-Parry, 2008). Their development depends on biomass accumulation and growth rates, which are controlled by environmental factors such as light availability, nutrient concentrations and temperature. Marine Net Primary Production (NPP) represents a fundamental indicator of phytoplankton activity, quantifying net carbon fixation after losses due to cellular respiration and maintenance processes are accounted for. As an indicator of primary producer activity, NPP drives the biological ocean carbon pump and therefore plays a key role in long-term ocean carbon sequestration (Sarmiento, 2013).
The dependence of NPP on environmental conditions makes it sensitive to climate change. Global NPP has declined by −2.1 % per decade from 1998 to 2015 according to satellite observations (Gregg and Rousseaux, 2019). Model hindcast simulations indicate NPP has declined by −6.5 % since 196) and is projected to continue to decline throughout the 21st century (Bopp et al., 2013). This decrease is particularly apparent in tropical and mid-latitude regions where vertical mixing and nutrient supply decline due to enhanced upper-ocean stratification (Doney, 2006). In contrast, at high latitudes, and in particular in the Arctic Ocean where NPP is primarily light limited, observations suggest a recent increase in NPP, rising by 57 % between 1998 and 2018 (Lewis et al., 2020). However, there is disagreement on the sign of the projected changes in these regions (Laufkötter et al., 2015).
The Arctic Ocean is particularly sensitive to the effects of climate change (Kwiatkowski et al., 2020; Laufkötter et al., 2015; Vancoppenolle et al., 2013) and is projected to experience warming nearly four times the global average (Rantanen et al., 2022). This warming results in ocean freshening through increased freshwater input from multiple sources, including melting glaciers and sea ice, enhanced precipitation, and greater river inflow (McCrystall et al., 2021; Shu et al., 2018). Moreover, climate change also impacts global ocean circulation patterns such as the Atlantic Meridional Overturning Circulation (AMOC), which is an important regulator of the climate system, and which could in turn have an impact on the Arctic Ocean and thus on NPP (Weijer et al., 2020). In polar regions, stratification is primarily driven by salinity gradients rather than temperature differences, making this freshening particularly impactful for ocean mixing and circulation patterns (Timmermans and Marshall, 2020).
The Arctic Ocean phytoplankton community consists of diatoms and smaller taxa including coccolithophores, prymnesiophytes, flagellates, and picoeukaryotes (Ardyna and Arrigo, 2020). Climate change is projected to drive a compositional shift toward smaller phytoplankton (Bopp et al., 2005), fundamentally altering marine food web structure and efficiency. This size-structure transition extends food chain length and reduces trophic transfer efficiency, consequently reducing carbon export. The shift particularly weakens export through two mechanisms: smaller phytoplankton are more efficiently recycled within the microbial loop, while larger phytoplankton like diatoms contribute disproportionately to carbon export via gravitational sinking. These structural modifications have cascading effects on both ecosystem functioning and carbon sequestration capacity (Grebmeier et al., 2010; Ward et al., 2012). Furthermore, phytoplankton community restructuring propagates through upper trophic levels, ultimately impacting commercial fisheries and marine food security (Ardyna and Arrigo, 2020; Hegseth and Sundfjord, 2008; Neukermans et al., 2018). The implications of global warming on the Arctic Ocean extend beyond primary productivity and encompass Arctic Ocean biogeochemical cycles, especially the carbon pump and the regional contribution to climate regulation (Sarmiento, 2013).
Arctic Ocean NPP has increased by > 50 % over recent decades, according to satellite observations (Arrigo and van Dijken, 2015; Lewis et al., 2020). This increase is largely attributed to the decrease in sea ice coverage and thickness, as well as associated changes in sea ice scape, which enhances light penetration into the water column and fosters higher phytoplankton productivity (Lannuzel et al., 2020). Additionally, riverine fluxes and coastal erosion supply a substantial amount of nutrients, supporting approximately one-third of Arctic Ocean productivity (Terhaar et al., 2021).
The Arctic Ocean is projected to experience a continued increase in NPP under climate change (Tagliabue et al., 2021). Future sea ice retreat will further extend the open-water season duration, enhance light availability and stimulate phytoplankton growth. However, the melting of sea ice will also introduce large volumes of freshwater, which may further stratify the water column, reducing nutrient transport from deeper waters and potentially modifying NPP dynamics (Pabi et al., 2008; Popova et al., 2010) and the distribution of the phytoplankton in the water column (Steiner et al., 2016).
CMIP5 Arctic Ocean NPP projections exhibited considerable model divergence with even the sign of future Arctic Ocean NPP anomalies uncertain (Vancoppenolle et al., 2013). However, there is model agreement on the driving mechanisms: decreasing sea ice extent (and thus increasing light availability) and declining nitrate concentrations, almost reaching an oligotrophy onset in 2100. Increased temperatures could also contribute to enhanced NPP, however the analysis of CMIP5 projections did not consider thermal sensitivity as a mechanism influencing NPP (Vancoppenolle et al., 2013). There is also a high uncertainty amongst CMIP5 models concerning the deepening of the future Subsurface Chlorophyll Maximum (SCM) (Steiner et al., 2016).
Despite the recognized importance of environmental drivers in controlling Arctic phytoplankton productivity, several critical knowledge gaps remain. First, it is unclear how projections of key environmental factors (light availability, nutrient concentrations, and temperature) have evolved between CMIP5 and CMIP6 model generations, and whether improved model physics in CMIP6 has led to more consistent or divergent projections. Second, the relative importance of these drivers in CMIP6 varies spatially across the Arctic Ocean, but a systematic analysis of these spatial patterns is lacking. Third, different PFTs respond differently to environmental changes, yet how these differential responses are captured across regions remains poorly understood. Finally, while previous studies have identified sign inconsistencies in CMIP5 NPP projections (Vancoppenolle et al., 2013), the mechanisms underlying the substantially larger NPP increases projected by CMIP6 models have not been systematically analyzed in the Arctic Ocean (Tagliabue et al., 2021). These gaps limit our ability to assess the reliability of future Arctic Ocean productivity projections and their implications for marine ecosystems and biogeochemical cycles.
To address this knowledge gap, we investigate the environmental drivers of phytoplankton growth using both CMIP6 and CMIP5 models. Our analysis aims to understand how projections and associated uncertainties have changed between the two model generations over the 21st century, examine spatial variations in these projections across the Arctic Ocean, and assess how different phytoplankton functional types respond to these environmental changes.
2.1 Model selection
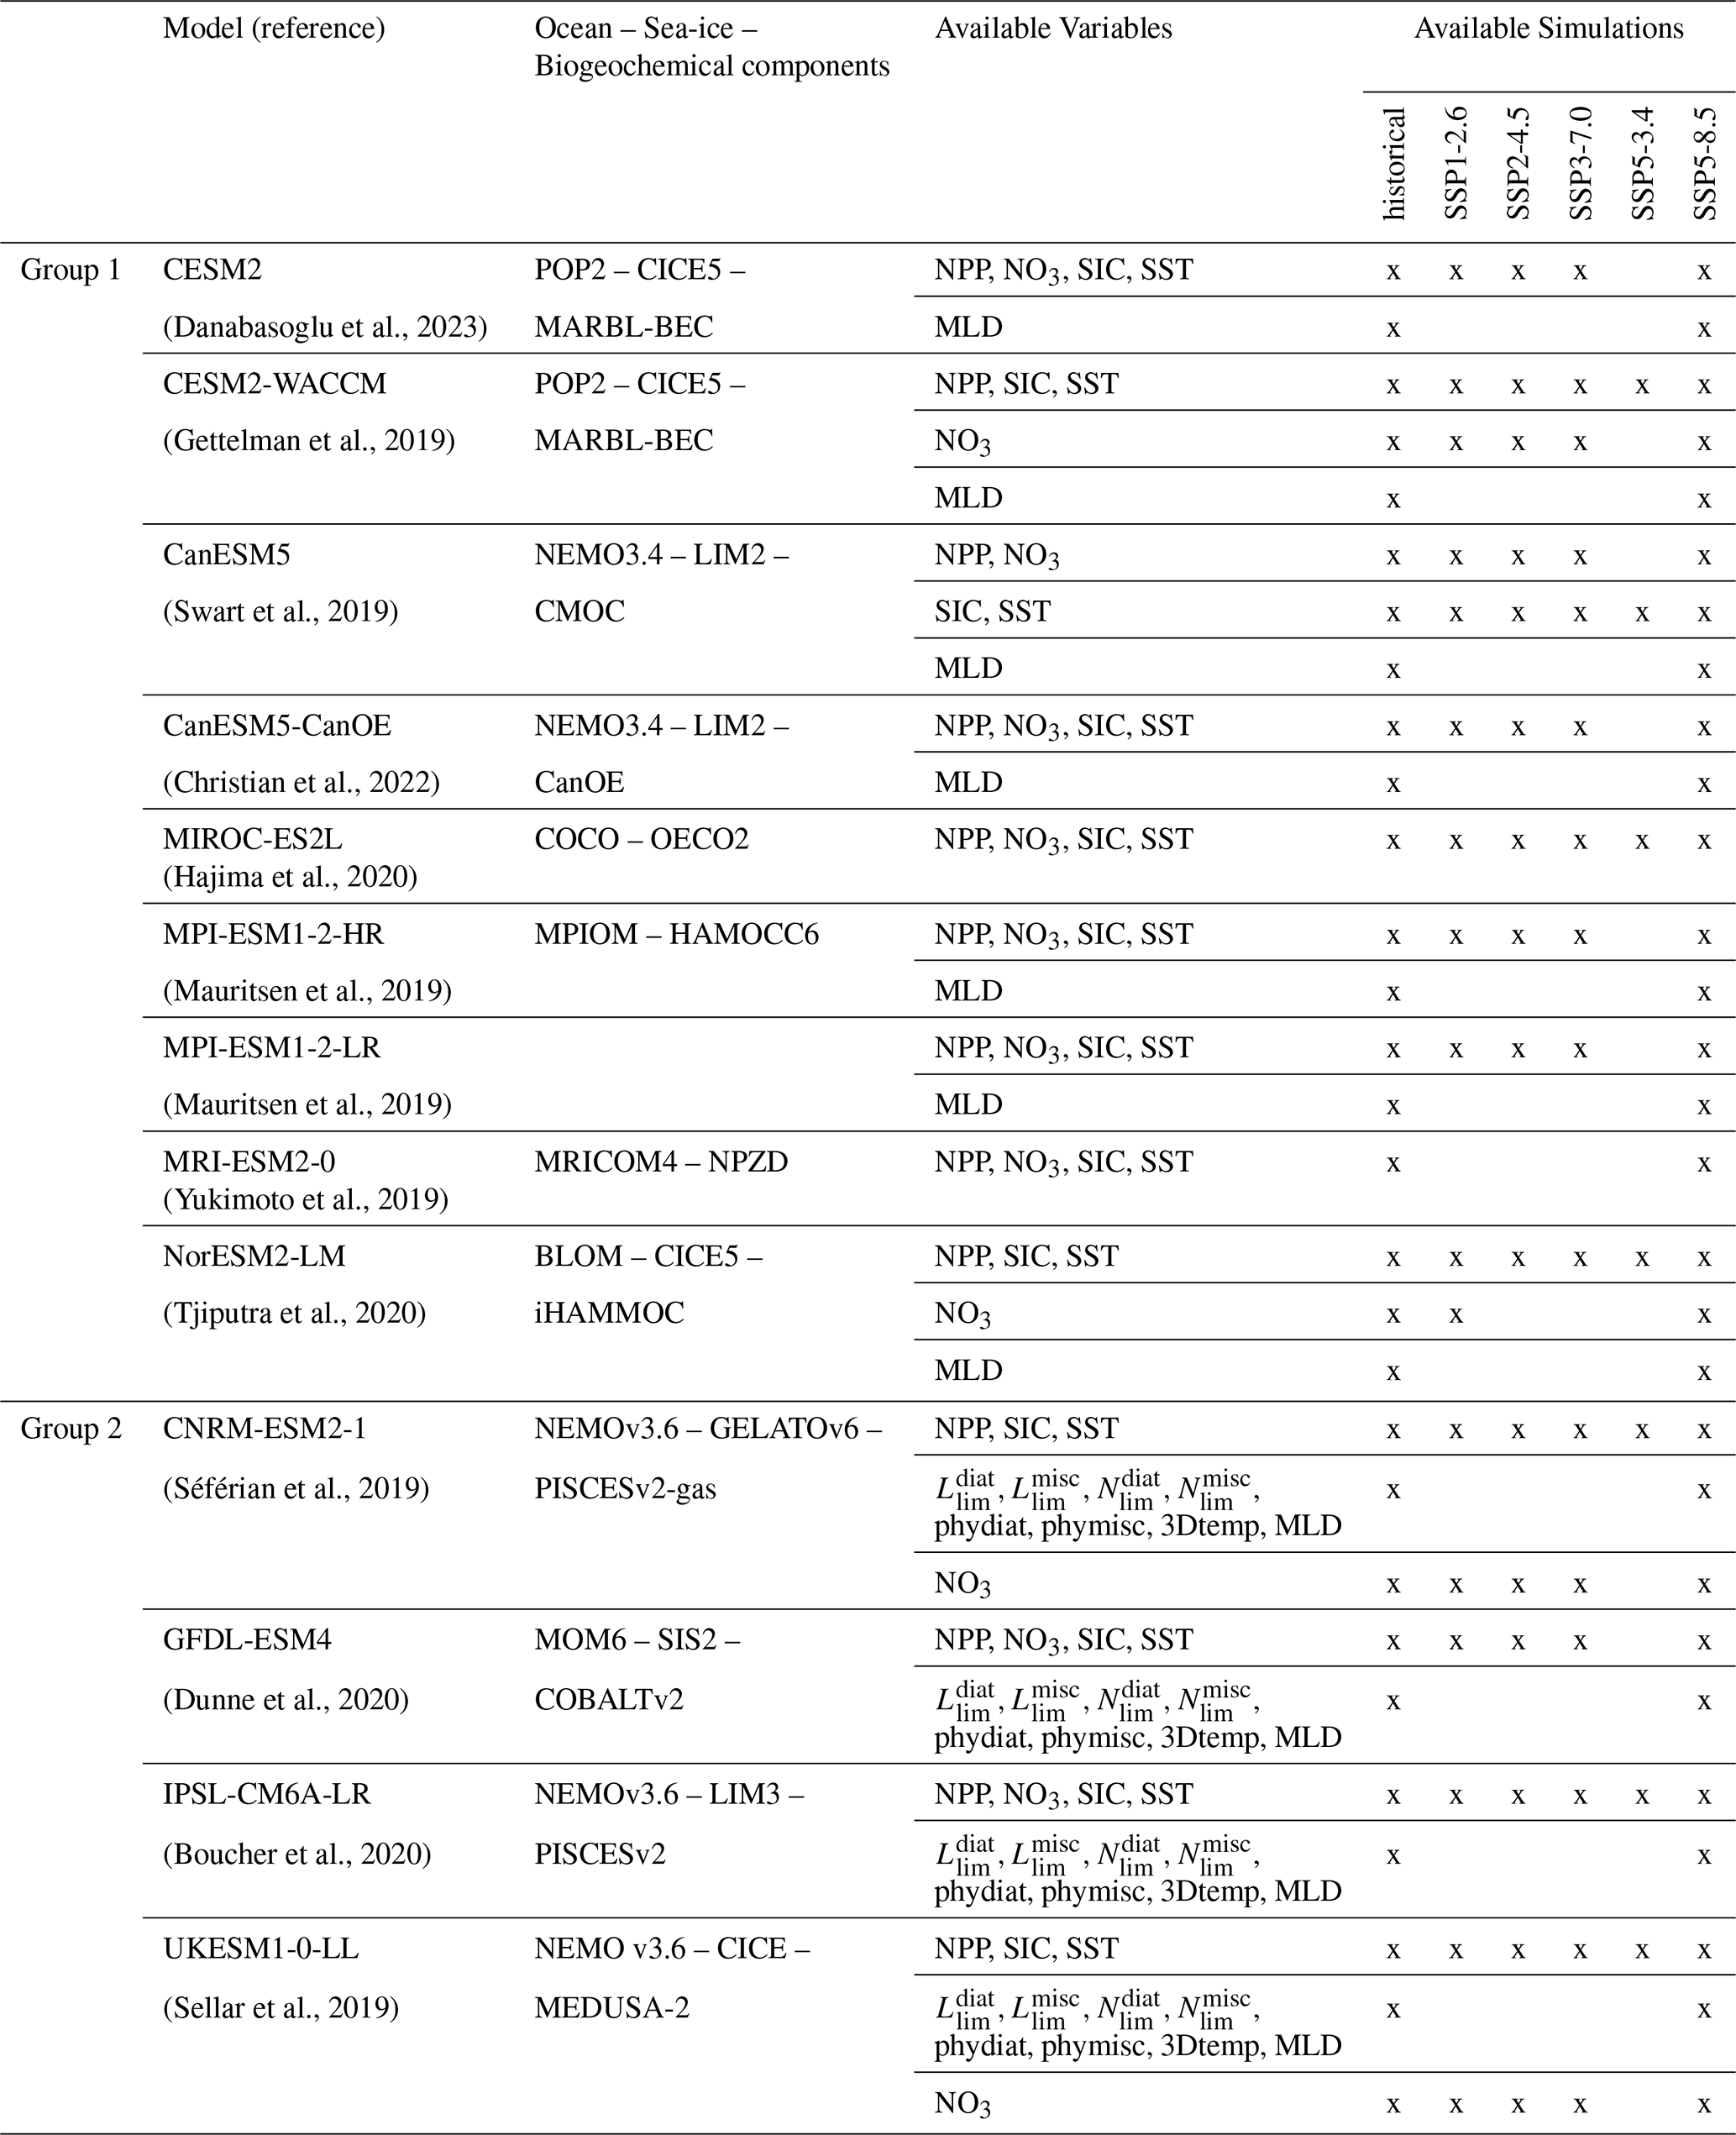
We used output from the Coupled Model Intercomparison Project Phase 6 (Eyring et al., 2016) downloaded from the Earth System Grid Federation (ESGF) servers (Table 1). Each ESM member is identified by a nomenclature composed of letters and various numbers, such as rWiXpYfZ, where W indicates the realization number (different for each run), X denotes the initialization method, Y refers to the set of physical parameterizations used, and Z represents the forcing configuration number. For each model, we prioritized selecting the ensemble member r1i1p1f1 when available. If r1i1p1f1 was not available, the ensemble member most similar to it, such as r2i1p1f1, r1i1p1f2, or the closest alternative was chosen. The historical period spans 1850–2014, while the SSP scenarios cover 2015–2100. Five SSP scenarios were selected: SSP1-2.6, SSP2-4.5, SSP3-7.0, SSP5-3.4 and SSP5-8.5 (Meinshausen et al., 2020).
Table 1Description of CMIP6 models used in this study, along with the associated available variables and simulations. The first group includes models used to project environmental conditions (NPP, NO3, SIC, and SST). The second group includes models used for both environmental projections and analysis of phytoplankton growth limitation terms (Nlim, Llim and Tf).
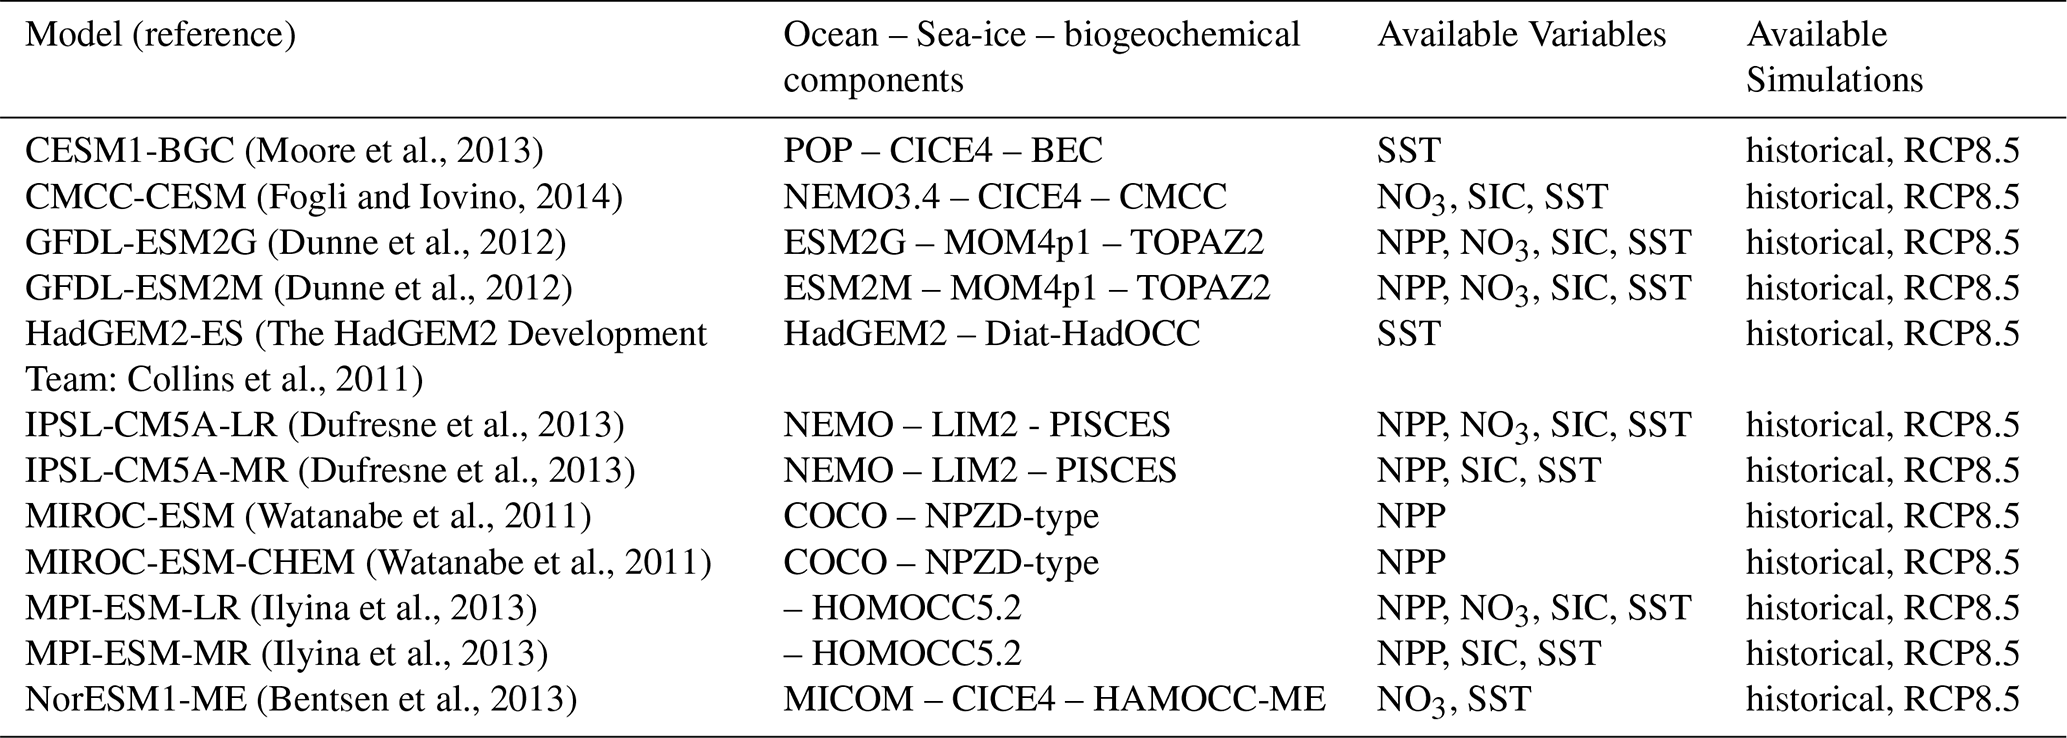
To compare with the previous generation of models, from the Coupled Model Intercomparison Project Phase 5 (Taylor et al., 2012), we downloaded output from ESGF servers (Table 2) for the scenario RCP8.5 (van Vuuren et al., 2013). As with CMIP6, we prioritized r1i1f1 when possible. The CMIP5 historical period spans from 1850 to 2005 while the RCP8.5 scenario covers the period 2006–2100.
Table 2CMIP5 models used in this study, along with the available variables and simulations.
Although additional scenarios were briefly examined, the detailed analysis is restricted to SSP5-8.5 and RCP8.5 (as in Vancoppenolle et al., 2013), since the primary objective of this study is to investigate the dominant mechanisms and processes underlying future changes rather than to provide precise scenario-dependent projections.
2.2 Models diagnostic
2.2.1 Study region and interpolation methods
The Arctic Ocean was defined as the waters above 66.5° N latitude and divided into 10 different regions, following (Arrigo and van Dijken, 2011). Both model output and observations were interpolated onto a regular latitude-longitude grid with a resolution of 360×180 using the CDO (Climate Data Operators) software with the remapdis interpolation method (Schulzweida, 2023).
2.2.2 NPP diagnostics
Model outputs are not always available for all variables of interest, so we categorized the models into two groups based on data availability (Table 1), corresponding to the two sections of our study: In the first section, we examined the prognostic environmental variables that may influence NPP, namely NO3 concentrations, sea ice concentrations and sea surface temperatures (respectively named in CMIP6: NO3, sic and tos) and in the second section we investigated the light, nutrient and thermal limitation terms that directly impact phytoplankton growth rates. The first section uses outputs from Group 1 and Group 2 models, while the second section focuses on models from Group 2, which provide direct limitation term diagnostics. These limitation terms are derived from the variables mentioned above and represent key factors influencing phytoplankton growth rate (μ) for a given phytoplankton type:
where μmax is the maximum growth rate, Llim and Nlim are the limitation terms for light and nutrient respectively, and Tf represents the temperature function.
2.2.3 Nutrients, SST, Sea ice and limitation factors
Nitrate (NO3) was selected as the limiting nutrient, as the Arctic Ocean is primarily nitrogen-limited, and ammonium (NH4) is not available for all models (Browning and Moore, 2023; Tremblay and Gagnon, 2009). Two different approaches were used to calculate nitrate concentrations. When data were available, nitrate concentrations were integrated over the mixed layer (MLD). However, as mixed-layer depth and vertically-resolved NO3 data were not available for all scenarios (especially for CMIP5), some analyses were conducted using surface nitrate concentrations, i.e., from the upperocean model layer. An oligotrophy threshold was set at 1.6 mmol m−3, i.e., at the half-saturation constant of diatoms for NO3 uptake (Sarthou et al., 2005). Additional analysis is provided in the appendix, where NO3 is integrated over the upper 100 m of the water column (see Fig. A1).
As a diagnostic of ice coverage, we used monthly mean sea ice concentration (SIC) outputs. From this, we derived the September sea ice area (SSIA), the mean September sea ice concentration (SSIC), and the mean ice-free season duration (IFSD). The IFSD was defined as the number of months with sea ice concentration lower than 15 % (Lebrun et al., 2019).
We analyzed growth rates for the two PFTs available in model output: diatoms and miscellaneous phytoplankton. The direct limitation terms provided by the models include: the light limitation term for miscellaneous phytoplankton (, named limirrmisc in CMIP6 terminology), the light limitation term for diatoms (, limirrdiat), the nutrient limitation term for miscellaneous phytoplankton (, limnmisc) and the nutrient limitation term for diatoms (, limndiat). These limitation terms can vary between 0 and 1, with lower values indicative of greater constraint on phytoplankton growth rates.
The temperature function (Tf) is not directly provided by the models, but it is calculated using the Eppley function (, where KEppley=0.063 °C−1) except for UKESM1-0-LL which calculates the temperature function as Tf=1.006T, based on vertically gridded potential temperature (3Dtemp, thetao). Monthly Tf was computed for each depth level and weighted according to the biomass of each PFT (phymisc or phydiat) to obtain PFT-specific depth integrated temperature functions for each model ( and ).
2.3 Data used for model evaluation
2.3.1 Primary Production
The primary production observational data product used in this study provides recalculated depth-integrated NPP values based on satellite-derived chlorophyll concentrations, sea surface temperature, and sea ice cover (Lewis et al., 2020). This dataset spans 1998–2018 and offers satellite-based estimates in the Arctic Ocean. It was regridded onto a 1°×1° spatial resolution. Only NPP data from 1 March to 30 September were considered for model evaluation, due to the lack of ocean color observations during the dark season.
2.3.2 Nitrate (NO3)
To evaluate nitrate concentrations, we used a climatology derived from in situ hydrographic observations from the World Ocean Atlas 2018 (Garcia et al., 2019; Randelhoff et al., 2020). This dataset provides an average nitrate concentration from 1978 to 2017 on a 1°×1° grid. Observed nitrate concentrations were extracted over the upper 100 m of the ocean. Depending on analysis, depth-averaging was performed consistently with model output, as detailed in Sect. 2.2.3. However, nitrate data in the Arctic Ocean remain sparse, particularly in summer, and may be subject to significant biases (Gibson et al., 2020).
2.3.3 Sea ice concentration
Passive microwave satellite sea ice concentration fields were taken from the OSI-SAF Global sea ice concentration data record v3 (EUMETSAT OSI SAF, 2022). This dataset provides daily averaged sea ice cover (in percentage) at 25 km spatial resolution, covering the period 1979–2022.
2.3.4 Sea Surface Temperature (SST)
The sea surface temperature observational dataset is derived from the Climate Change Initiative (CCI) satellite product, covering the period 1982–2019, providing daily analyses at a high spatial resolution of 0.05° (Embury and Good, 2024). This dataset provides a long-term, high-quality observational record of SST, allowing for comparison with model outputs.
3.1 Model evaluation
Simulated ranges of NPP, MLD, NO3 concentration, SSIA and SST encompass data-based estimates over the observational period (Fig. 1). While the simulated trends in Arctic Ocean warming and declining SSIA are broadly consistent with observations, simulated increases in NPP are low biased. The multi-model mean NPP is slightly higher than observed, over the 1998–2018 period over which all models consistently simulate an NPP increase. Observed NPP increases from 256 in 1998 to 391 Tg C yr−1 in 2018, increasing by 135 Tg C yr−1 in 21 years. The increase in NPP in models is lower, increasing from 354 to 394 Tg C yr−1, increasing by 40 Tg C yr−1 in 21 years (Fig. 1a, Table 3). The multi-model annual mean NO3 concentration for the period 1979–2005 is 6.90 mmol m−3, which is higher than the observations of 4.67 mmol m−3 for the same period. However, this discrepancy is not unexpected, as Arctic Ocean NO3 observations contain significant uncertainties due to limited accessibility beneath sea ice cover (Fig. 1b). Models and observations agree on a loss of sea ice coverage, although the simulated rate of decrease is lower than observed (Fig. 1c, Table 3), confirming previous studies (Notz and Community, 2020). Similarly, observed Arctic Ocean warming is ∼ 50 % higher than that simulated over the same period (Fig. 1d, Table 3).
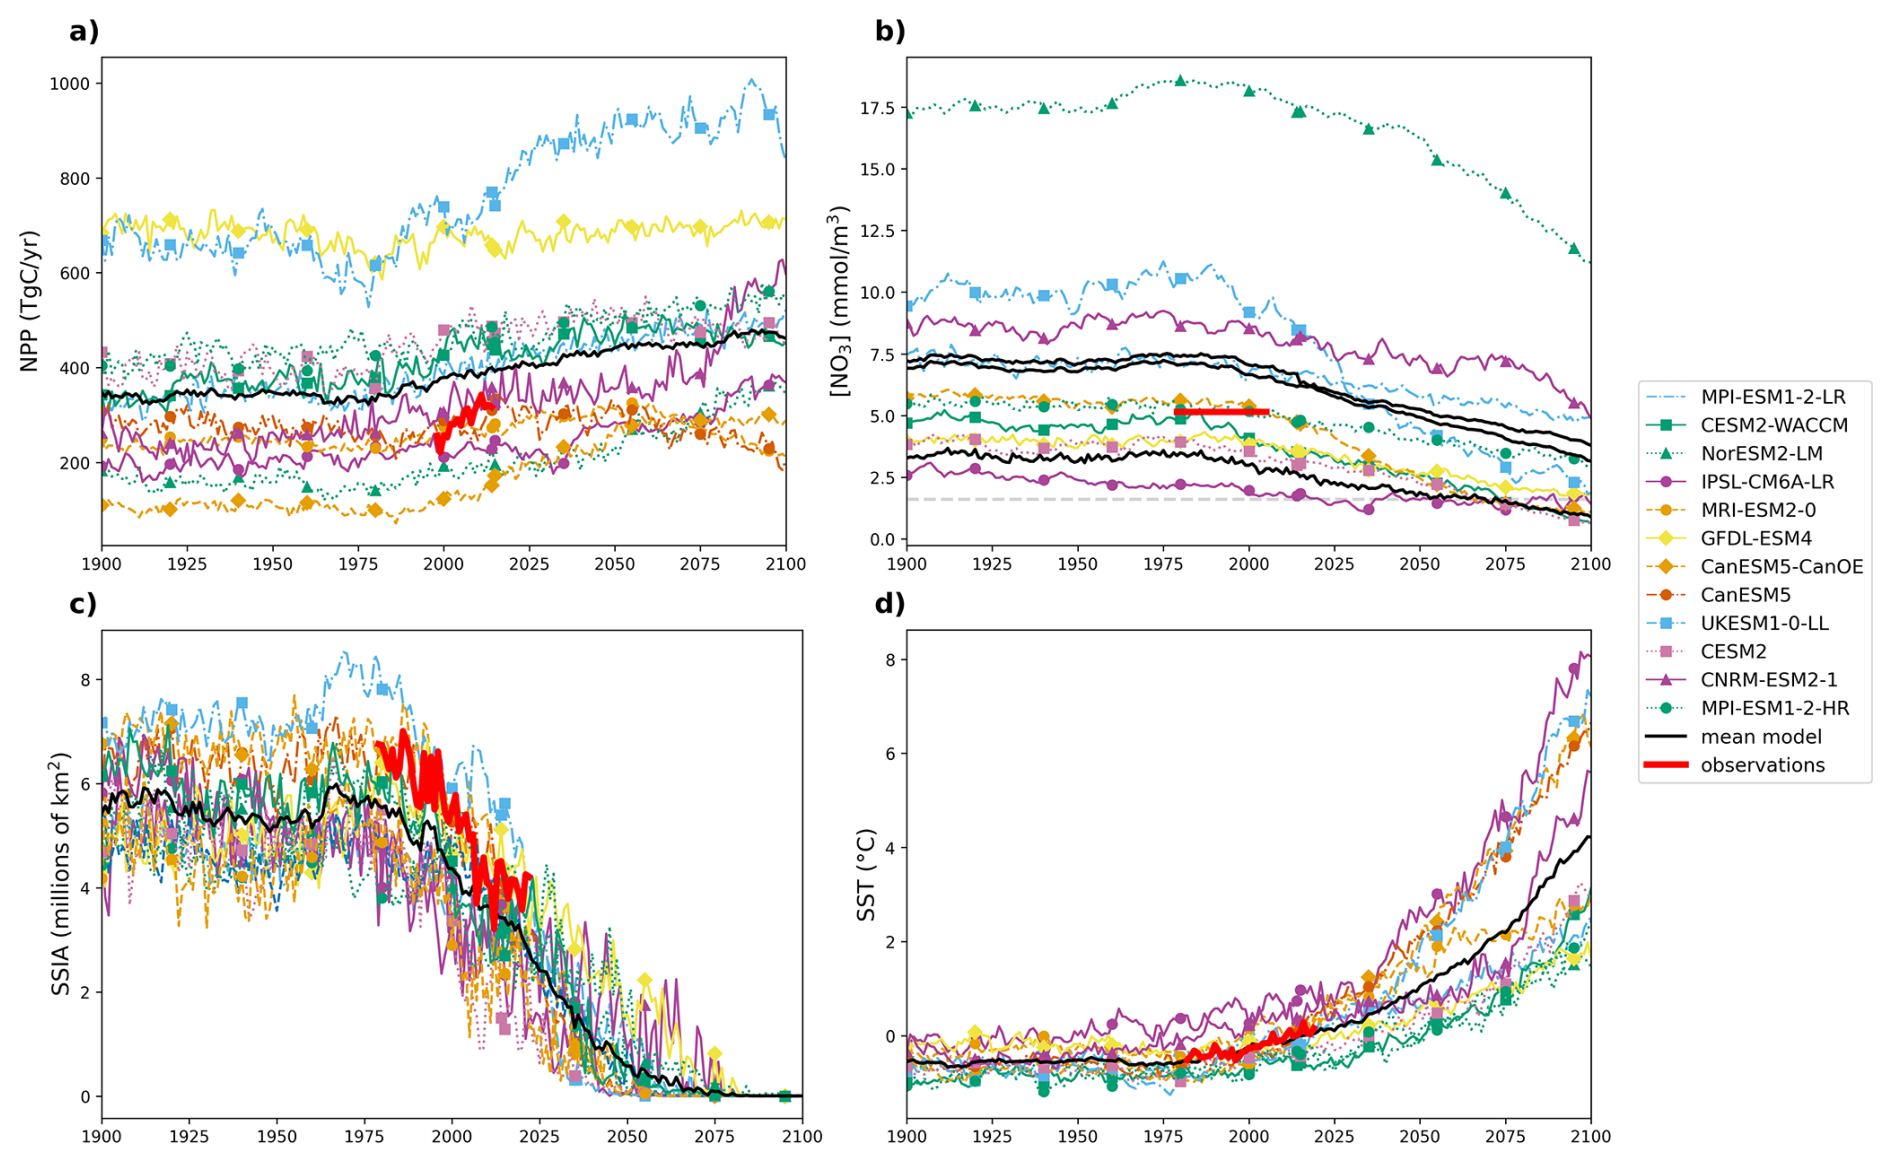
Figure 1Projections of Arctic Ocean (a) annual mean depth-integrated NPP, (b) NO3 concentration in the mixed layer depth (MLD), (c) September Sea Ice Area (SSIA), and (d) annual mean SST, derived from individual CMIP6 models (Group 1) using historical and SSP5-8.5 simulations over the period 1900–2100. In panel (b), three metrics are displayed as multi-model mean (black lines): the annual maximum (February, upper line), annual mean (middle line), and annual minimum (July, lower line); individual model trajectories are shown only for the annual mean. The horizontal grey dashed line indicates the NO3 concentration threshold associated with oligotrophic conditions. In all panels, colored lines represent individual model simulations, the thick red line represents the observations, and the thick black line denotes the multi-model mean.
Table 3Observed and simulated NPP, SSIA and SST values throughout the observational period. Nitrate concentrations are not given as an Arctic Ocean time series is not available.
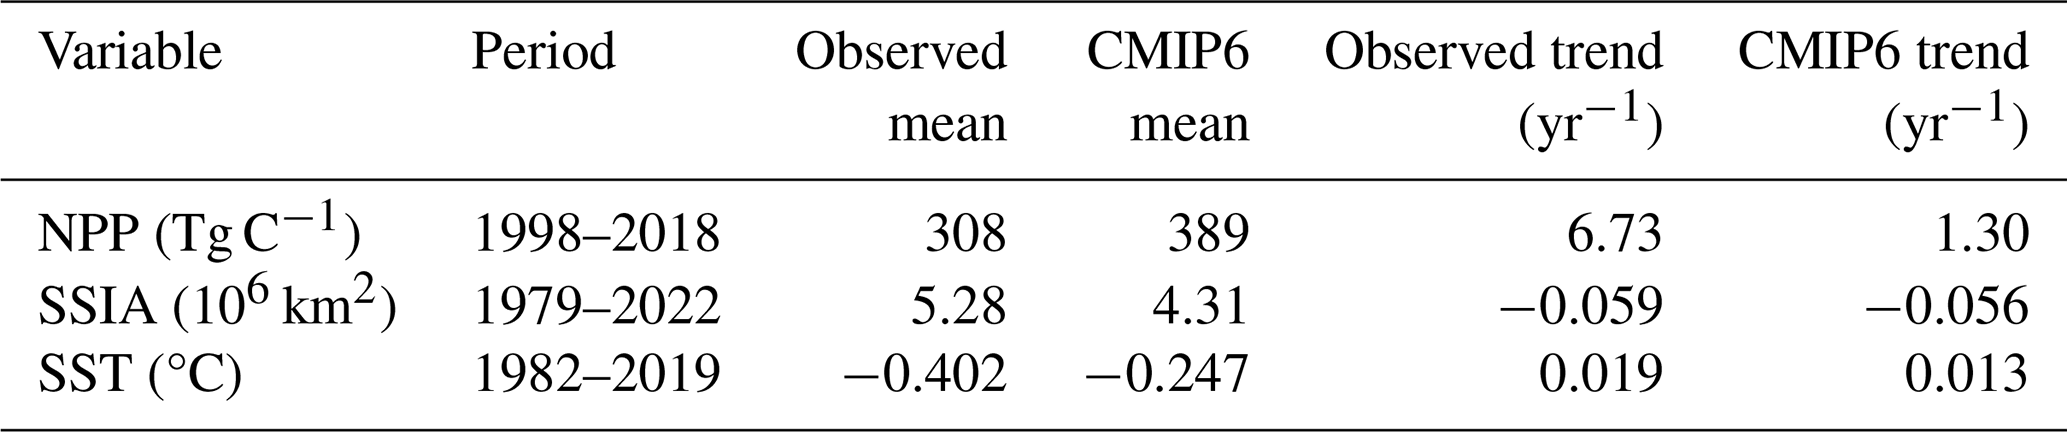
The drivers of these projected anomalies are changing in the same direction across all Arctic subregions: NO3 and September sea ice decrease and SST increases for all models and regions, consistent with earlier CMIP-based assessments (Vancoppenolle et al., 2013) (see Figs. A1, A2, A3, A4).
Several additional figures on individual model and regional analysis are provided in the appendix.
The spatial distribution of key variables across the Arctic Ocean is generally well represented by the multi-model mean and comparable to observations despite some regional discrepancies that reflect both model limitations and observational uncertainties (Fig. 2).
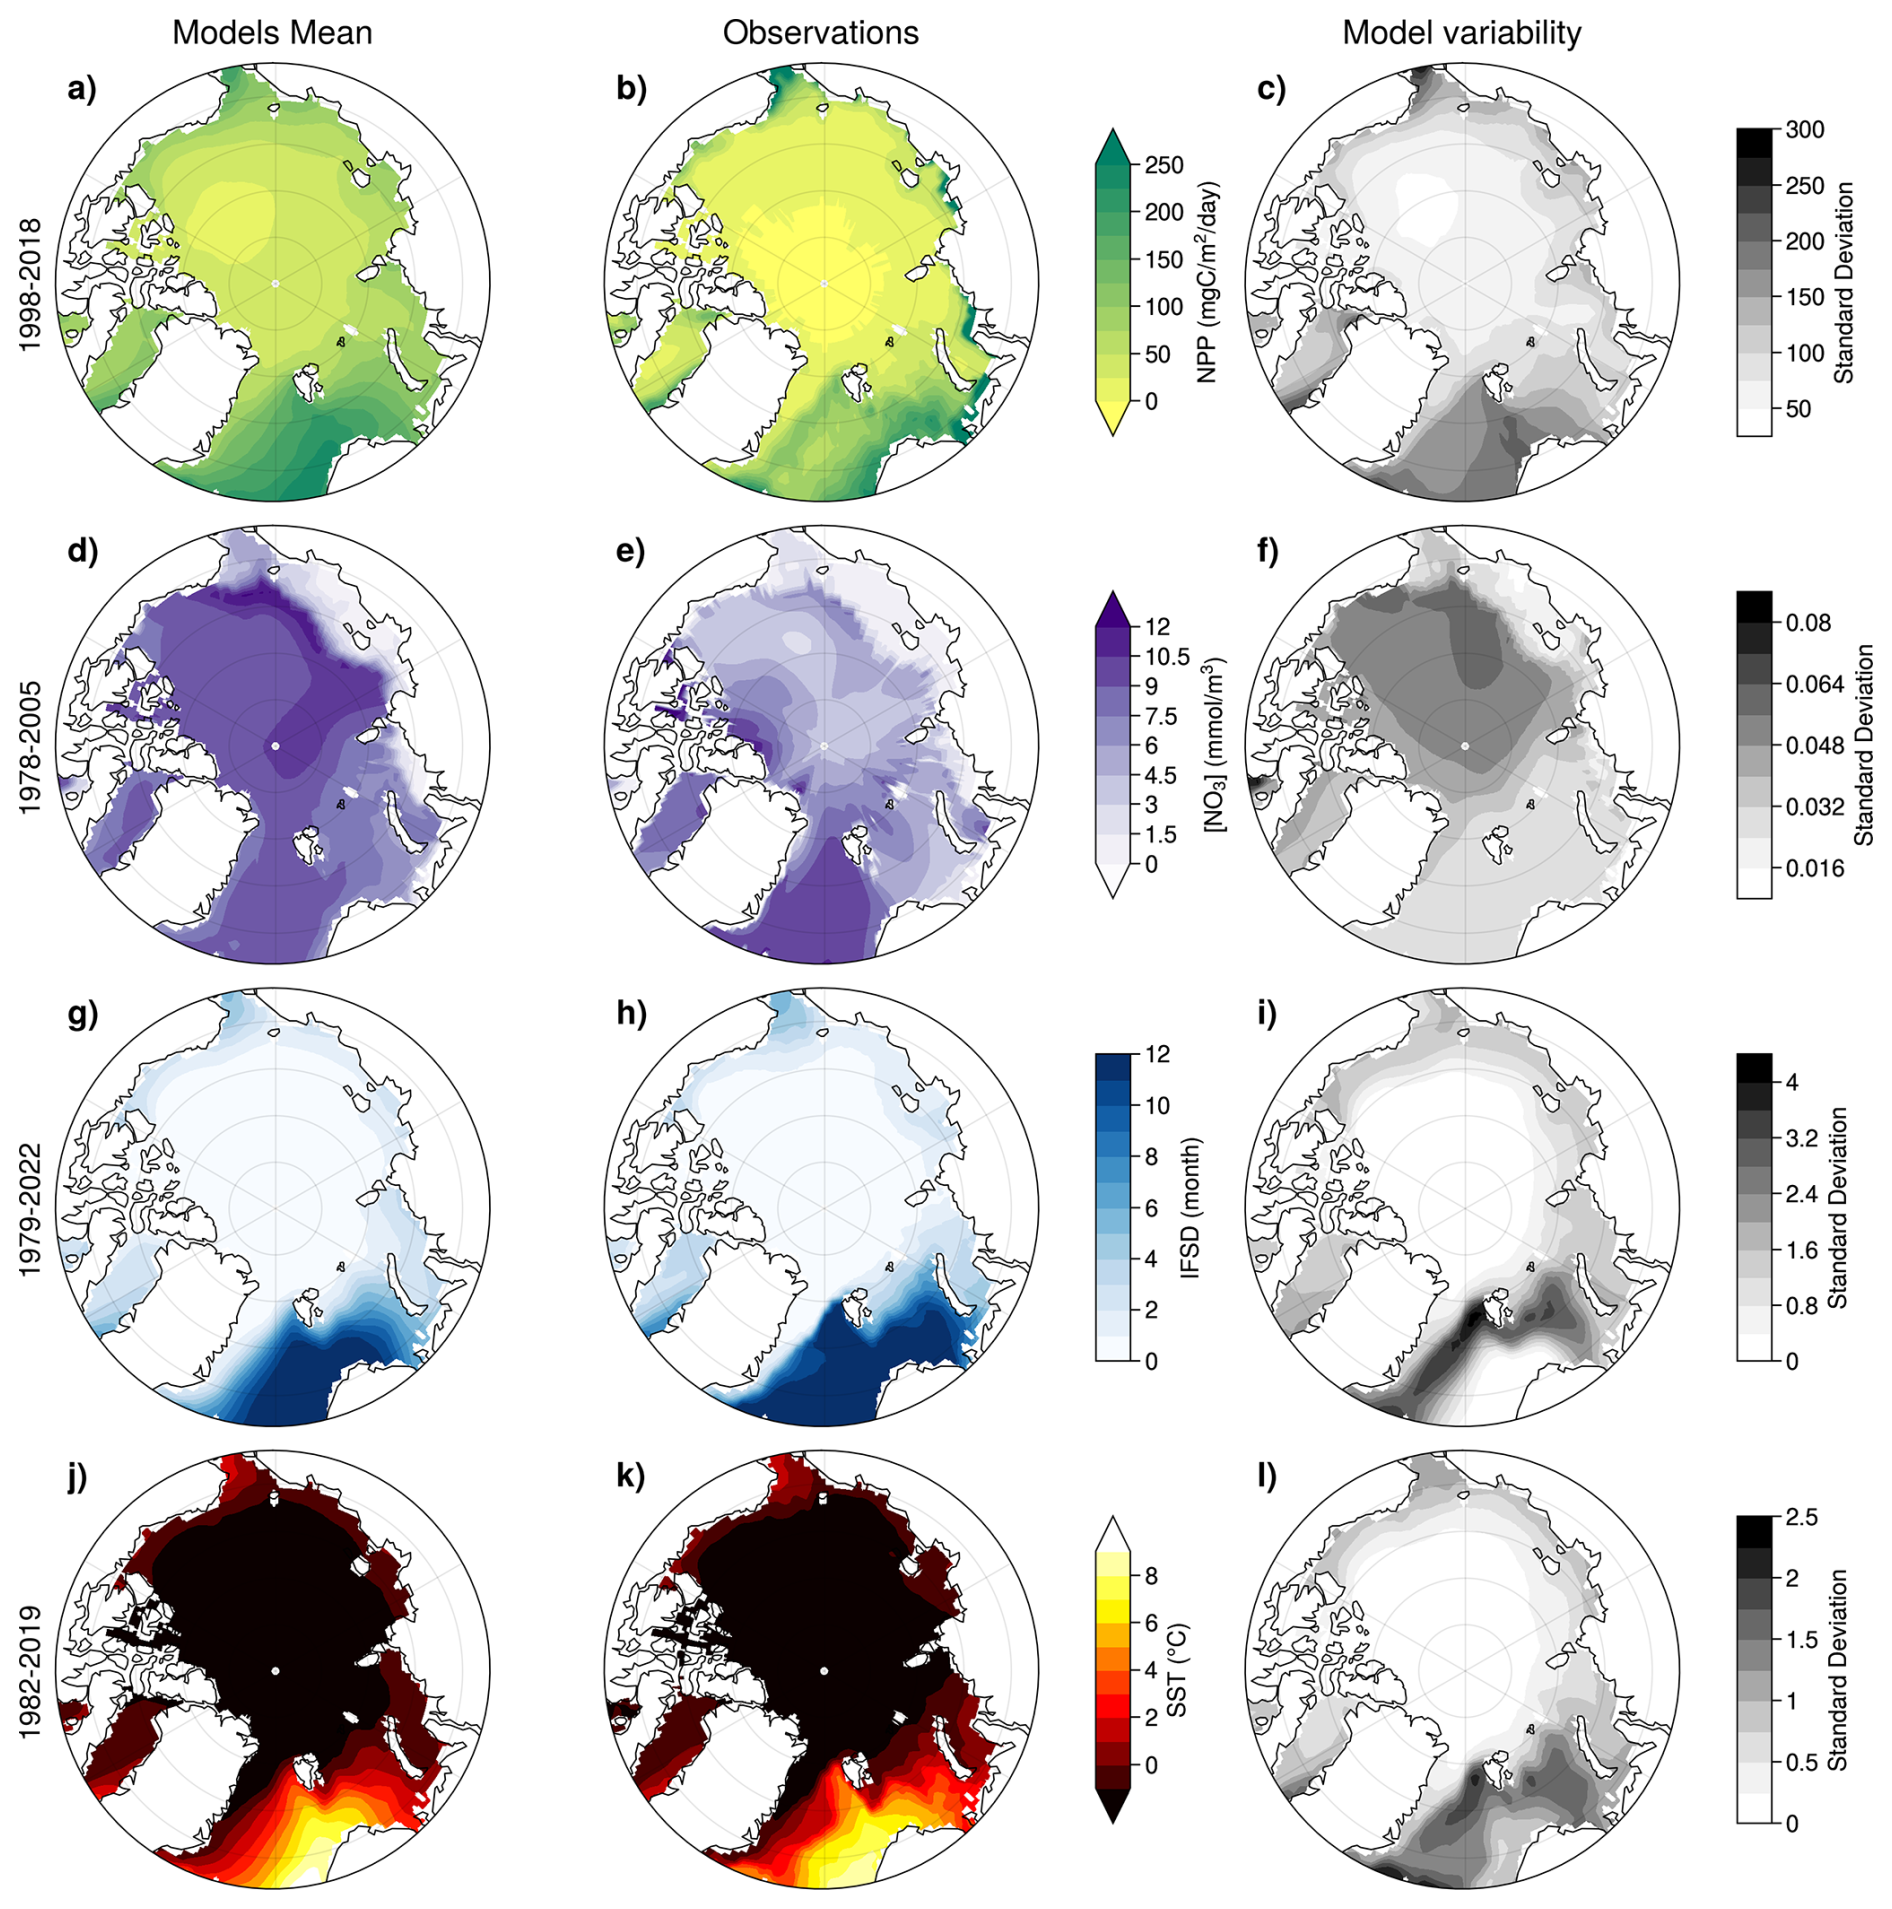
Figure 2NPP, NO3 (integrated over the upper 100 m of the water column), IFSD, and SST, over the recent past, as represented by the multi-model mean (left), observational data products (middle) and the multi-model standard deviation (right). The averaging period corresponds to the availability of observations prior to 2015. Model outputs are combined from historical simulations for years prior to 2015 and SSP5-8.5 thereafter. For NPP, the March to September average is shown.
March–September NPP resembles satellite-derived estimates, with the highest values in the Nordic Seas, the Bering Strait, and along the Siberian shelf, while the Arctic Basin exhibits the lowest NPP values (Fig. 2a and b). The multi-model mean IFSD and SST spatial distributions also closely align with observations. The warmest regions (Nordic Seas, Barents Sea, and Chukchi Sea) correspond to areas with the least sea ice (Fig. 2g, h, j and k). While the multi-model mean represents low values for coastal NO3 concentrations, in the Chukchi Sea and along the eastern Arctic Basin, it may overestimate nitrate concentrations in the Arctic Basin, though observations in this region remain limited. The coastal shelves of the Kara, Laptev and East Siberian Seas show low NO3 values – of less than 1.5 mmol m−3 in both models and observations (Fig. 2d and e).
3.2 Projections of NPP and its environmental drivers
Across all SSPs, Arctic Ocean NPP and SST are projected to increase over this century, while nitrate concentration and IFSD decline (Fig. 3). However, the magnitude of change in each variable depends on the scenario, with generally larger anomalies and associated uncertainty under higher radiative forcing. An exception to this is SSP5-3.4, for which there is lower model uncertainty, possibly due to the smaller model ensemble (Fig. 6).
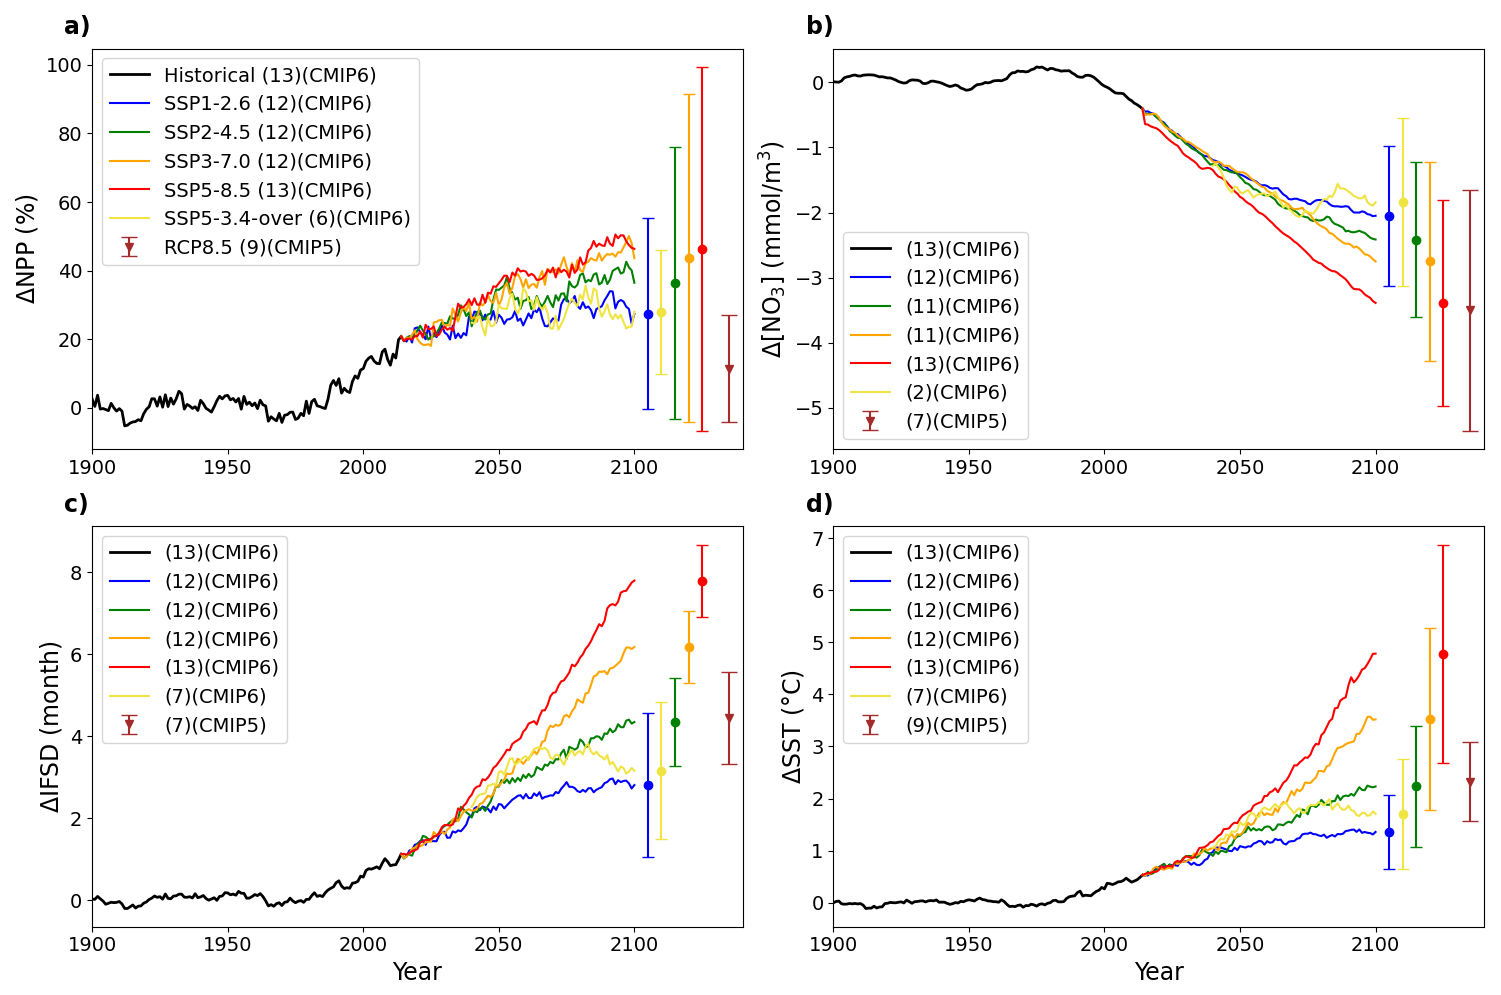
Figure 3CMIP6 projected pan-Arctic Ocean anomalies of NPP (a), surface NO3 (b), SSIA (c) and SST (d) over the period 1900–2100 relative to 1850–1899, for the different emission scenarios. Vertical bars represent multi-model means and standard deviation in 2100. The last vertical bar and triangle represent the range and mean value for the CMIP5 RCP8.5 scenario in 2100. The numbers within parentheses in the legend give the number of available models. Additional figures representing the timeseries for subregions are shown in the appendix.
Projected Arctic Ocean NPP and nitrate inter-model uncertainty is greater than inter-scenario uncertainty by the end of the century (Fig. 3a and b). Contrary to the other variables, IFSD exhibits reduced uncertainty under higher radiative forcing scenarios. This reflects the strong model agreement that the Arctic Ocean will be ice-free for most months by the end of the century (Fig. 3c). Surface ocean warming shows significant sensitivity across scenarios, with the greatest warming (multi-model mean +4.78 °C in 2081–2100), simulated in SSP5-8.5 (Fig. 6d).
Projected twenty-first century NPP increases are highly divergent between CMIP6 and CMIP5 scenarios of comparable high radiative forcing (Fig. 3a). For RCP8.5, the relative anomaly in NPP reaches 11.5±15.7 % at the end of the century. In contrast, SSP5-8.5 projects a much larger increase of 46.4±53.7 %. This highlights greater CMIP6 model agreement of increasing future NPP alongside a more than 3-fold increase in associated uncertainty (Fig. 3a). The projected twenty-first century Arctic Ocean NO3 surface concentration decline is higher in SSP5-8.5 (4.38±1.98 mmol m−3) than in RCP8.5 (3.09±1.45 mmol m−3, Fig. 3b). The increase in IFSD is greater in CMIP6 than in CMIP5 (7.8 months vs. 4.2 months), indicating a stronger reduction in sea-ice duration in CMIP6 compared to CMIP5. However, when expressed as anomalies relative to the reference period, the magnitude of change is slightly lower in CMIP6 than in CMIP5 (Fig. 3c). The surface ocean warming is two times higher in SSP5-8.5 (4.78±2.09 °C) than in RCP8.5 (2.32±0.75 °C) with higher associated uncertainty (Fig. 3d).
Multi-model mean declines in NO3 and increases in IFSD and SST occur across the Arctic Ocean domain, however NPP exhibits both regional-scale increases and decreases (Fig. 4). NPP increases are greatest in the northern Barents Sea, along the east coast of Greenland, and in the Chukchi Sea, reaching more than 20 g C m−2 yr−1. In contrast, there are NPP decreases along the coast of the Kara Sea, in the North Atlantic, and in Baffin Bay (Fig. 4a). NO3 concentration decreases across the entire basin, with the most pronounced reductions on the Siberian shelf and off the East Siberian Shelf, where declines can exceed 4 mmol m−3 (Fig. 4b). The region experiencing the highest increase in the ice-free season duration is the northern Barents Sea, east of Svalbard Archipelago. In the central Arctic Basin, sea ice decline is also strong, with a loss of more than 6 months ice coverage (Fig. 4c). The Barents and Greenland Seas are the regions most affected by rising SST, with increases of up to 6 °C (Fig. 4d).
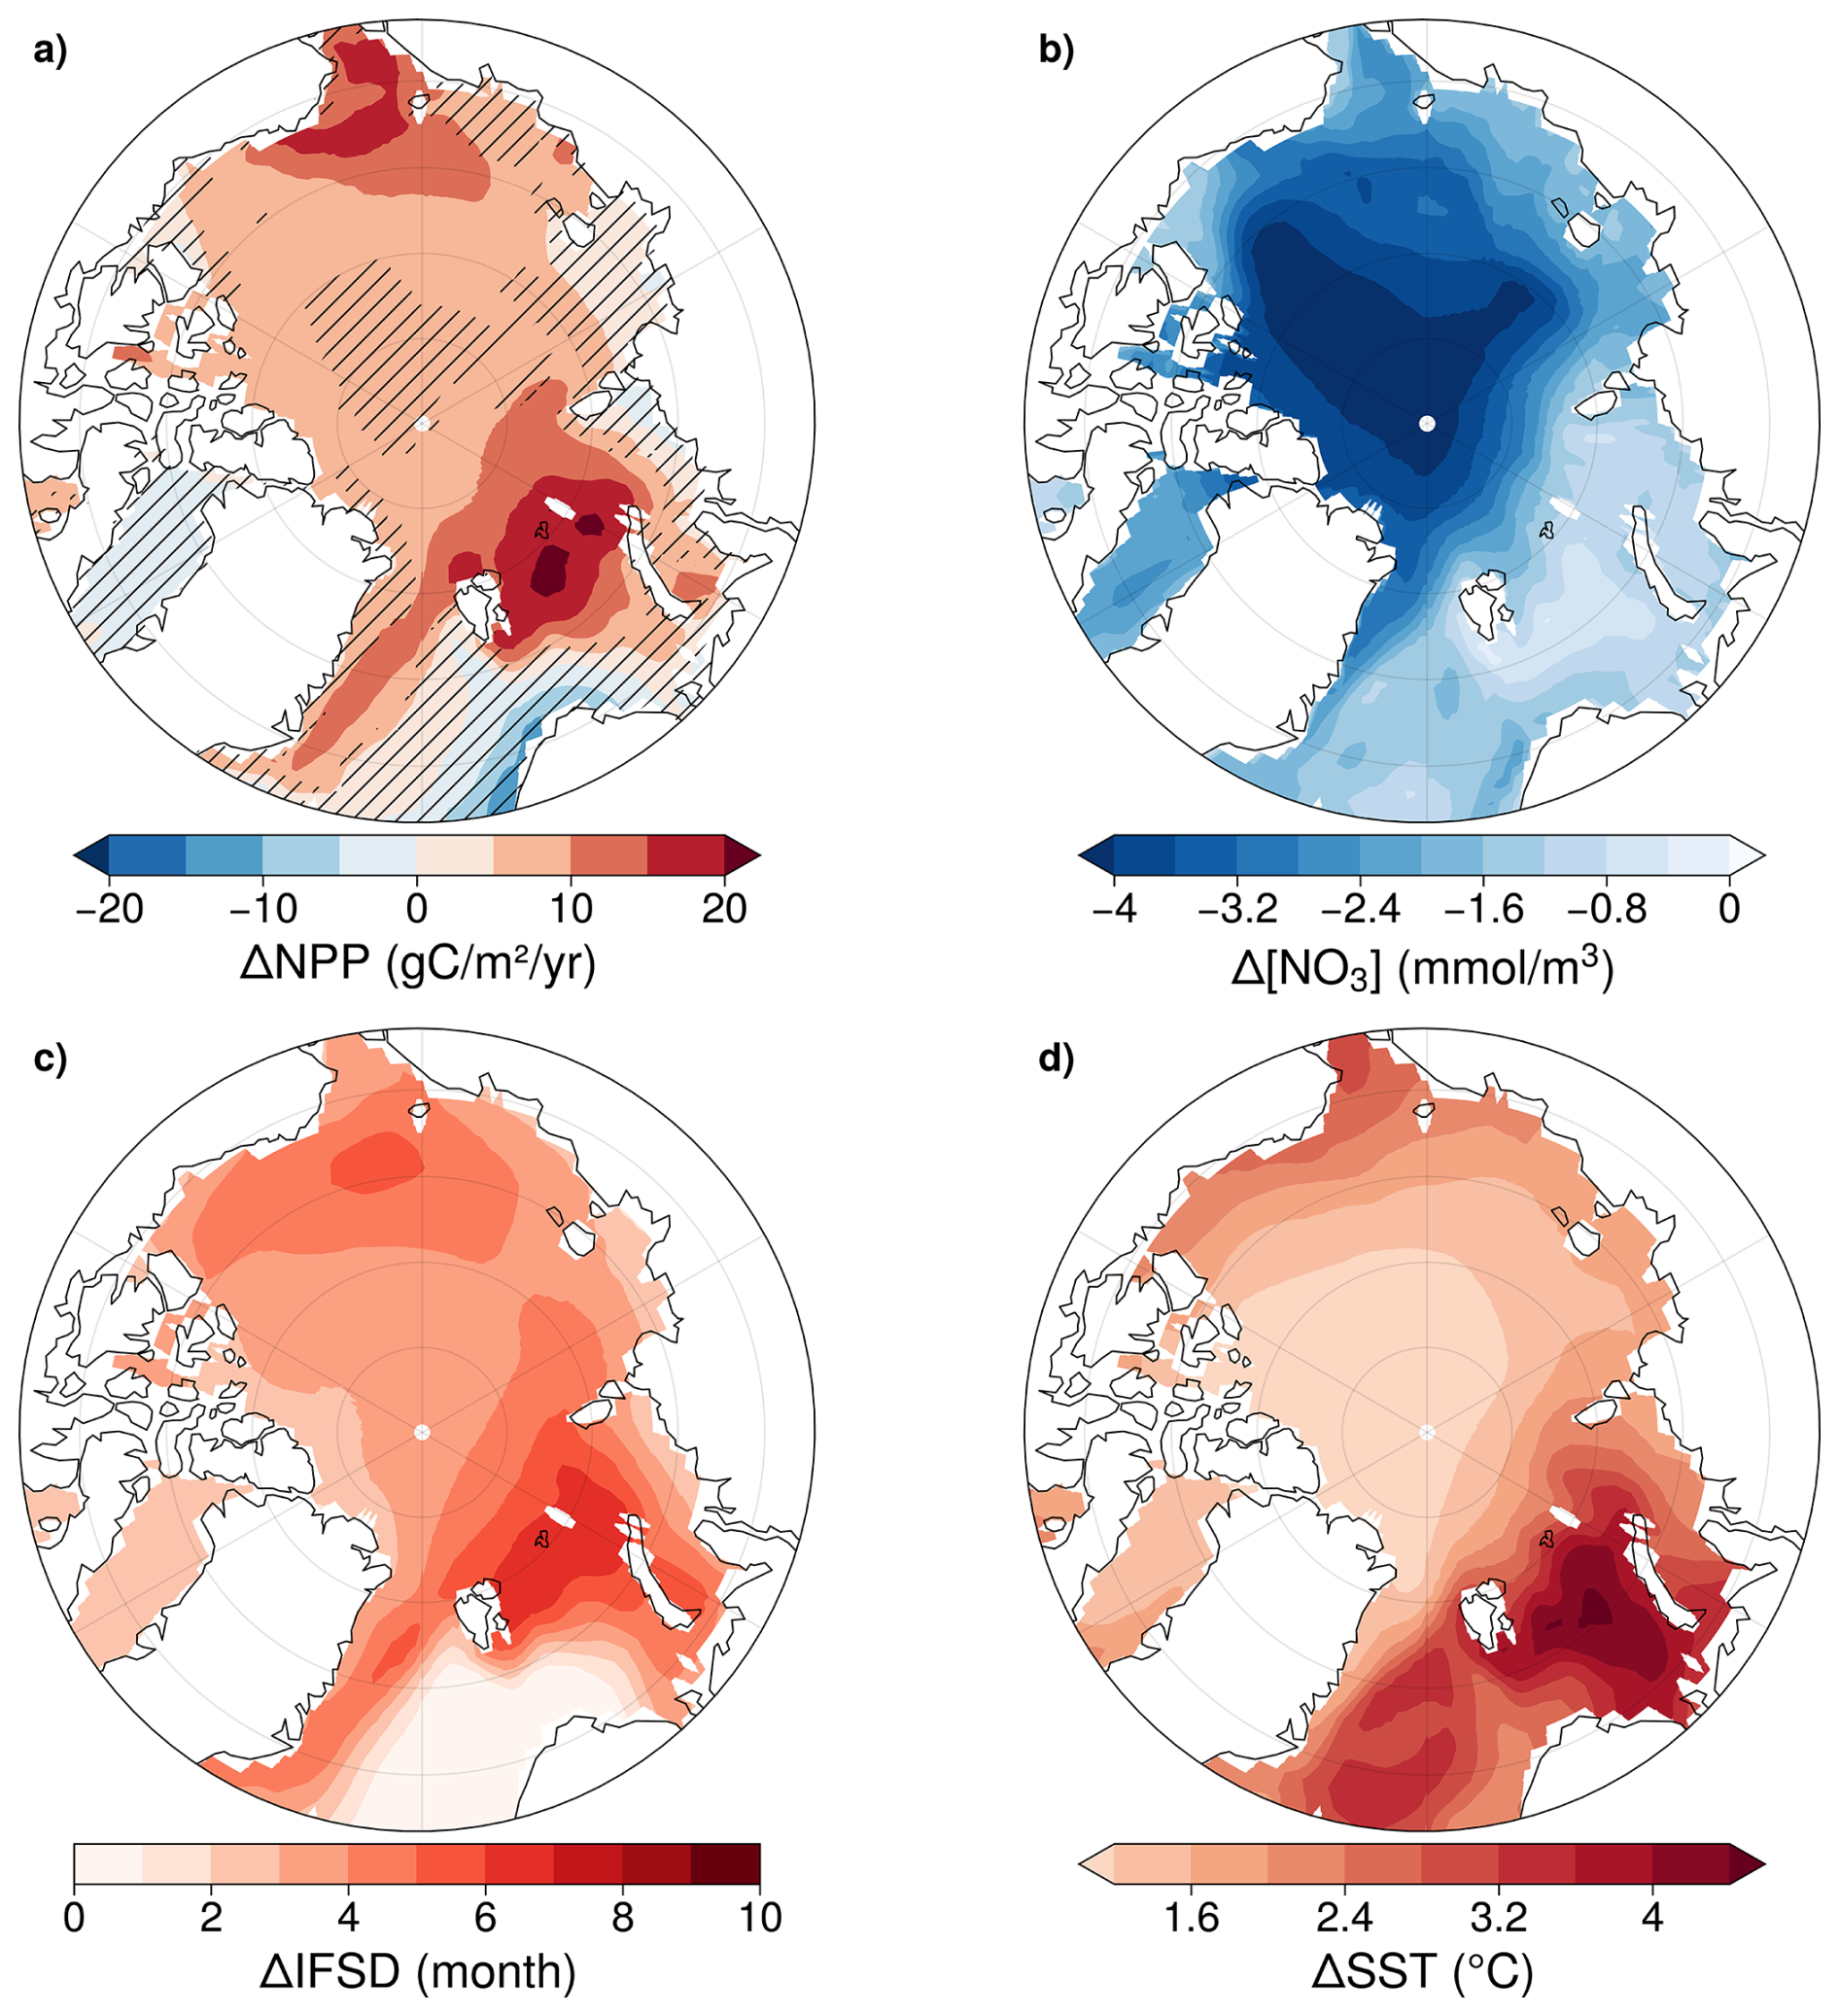
Figure 4CMIP6 multi-model mean anomalies of NPP (a), NO3 (b), IFSD (c) and SST (d). Anomalies are for 2081–2100 of SSP5-8.5 relative to 1995–2014 of the historical simulation. Hatched areas indicate where < 80 % of the models agree on the sign of the change.
Most models project consistent NPP increases under SSP5-8.5 except over the shelves (where anomalies are less pronounced) and in the central Arctic Ocean. For other variables, such as nitrate concentration, IFSD and SST, models agree on the sign of future change across the entire basin (Fig. 4).
By the end of the century, most CMIP6 models simulate a transition toward oligotrophic conditions, with an increasing fraction of ensemble members exhibiting oligotrophy and longer seasonal persistence of these conditions (Fig. 5). The seasonal cycle of nutrient concentration indicates that during the period 1995–2014, only seven CMIP6 models reach oligotrophy during the productive period, generally from mid-May to September (CanESM5, MPI-ESM1-2-LR, MPI-ESM1-2-HR, GFDL-ESM4, CESM2, CESM2-WACCM, and IPSL-CM6A-LR). An exception occurs for IPSL-CM6A-LR, which remains oligotrophic until November, and for CanESM5, which is oligotrophic throughout the year. By the end of the century, nine models reach oligotrophy (all except MPI-ESM1-2-HR and CNRM-ESM2-1), with duration extending from early May to February. However, the multi-model mean is influenced by models with higher nutrient concentrations and reaches oligotrophy only during July and August.
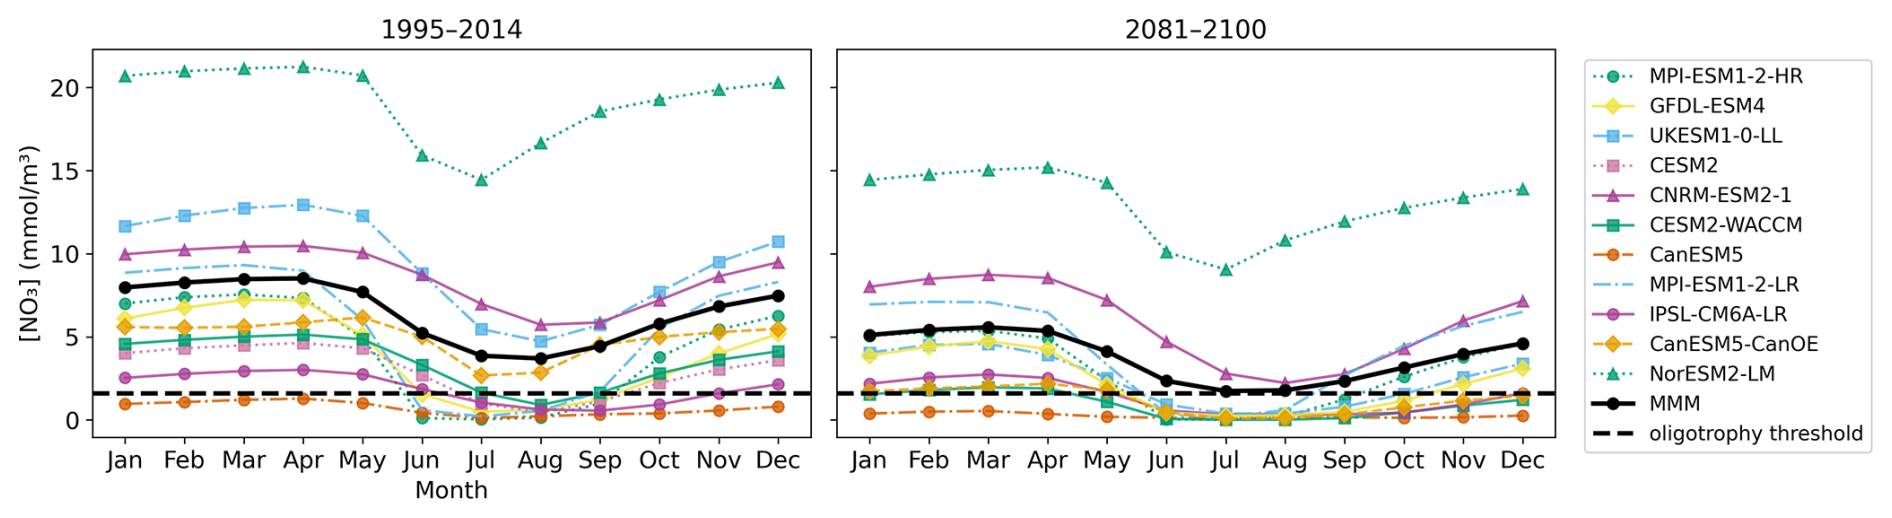
Figure 5Seasonal cycle of nitrate concentration during the two last decades of the historical simulation (1995–2014) (left) and the last two decades of SSP5-8.5 (2081–2100) (right). Each model is represented in a different color while the multi-model mean is shown in black.
The multi-model mean SCM deepens throughout the century across the Arctic Ocean, while the inter-model standard deviation increases (Fig. 6). During the period 1995–2014, the SCM is below 25 m over most of the Arctic Ocean, whereas it increases to up to 50 m by the end of the century, particularly in the Beaufort Sea and the central Arctic. A slight deepening is projected along the coastal regions of the Chukchi, Siberian, Laptev, and Kara seas.
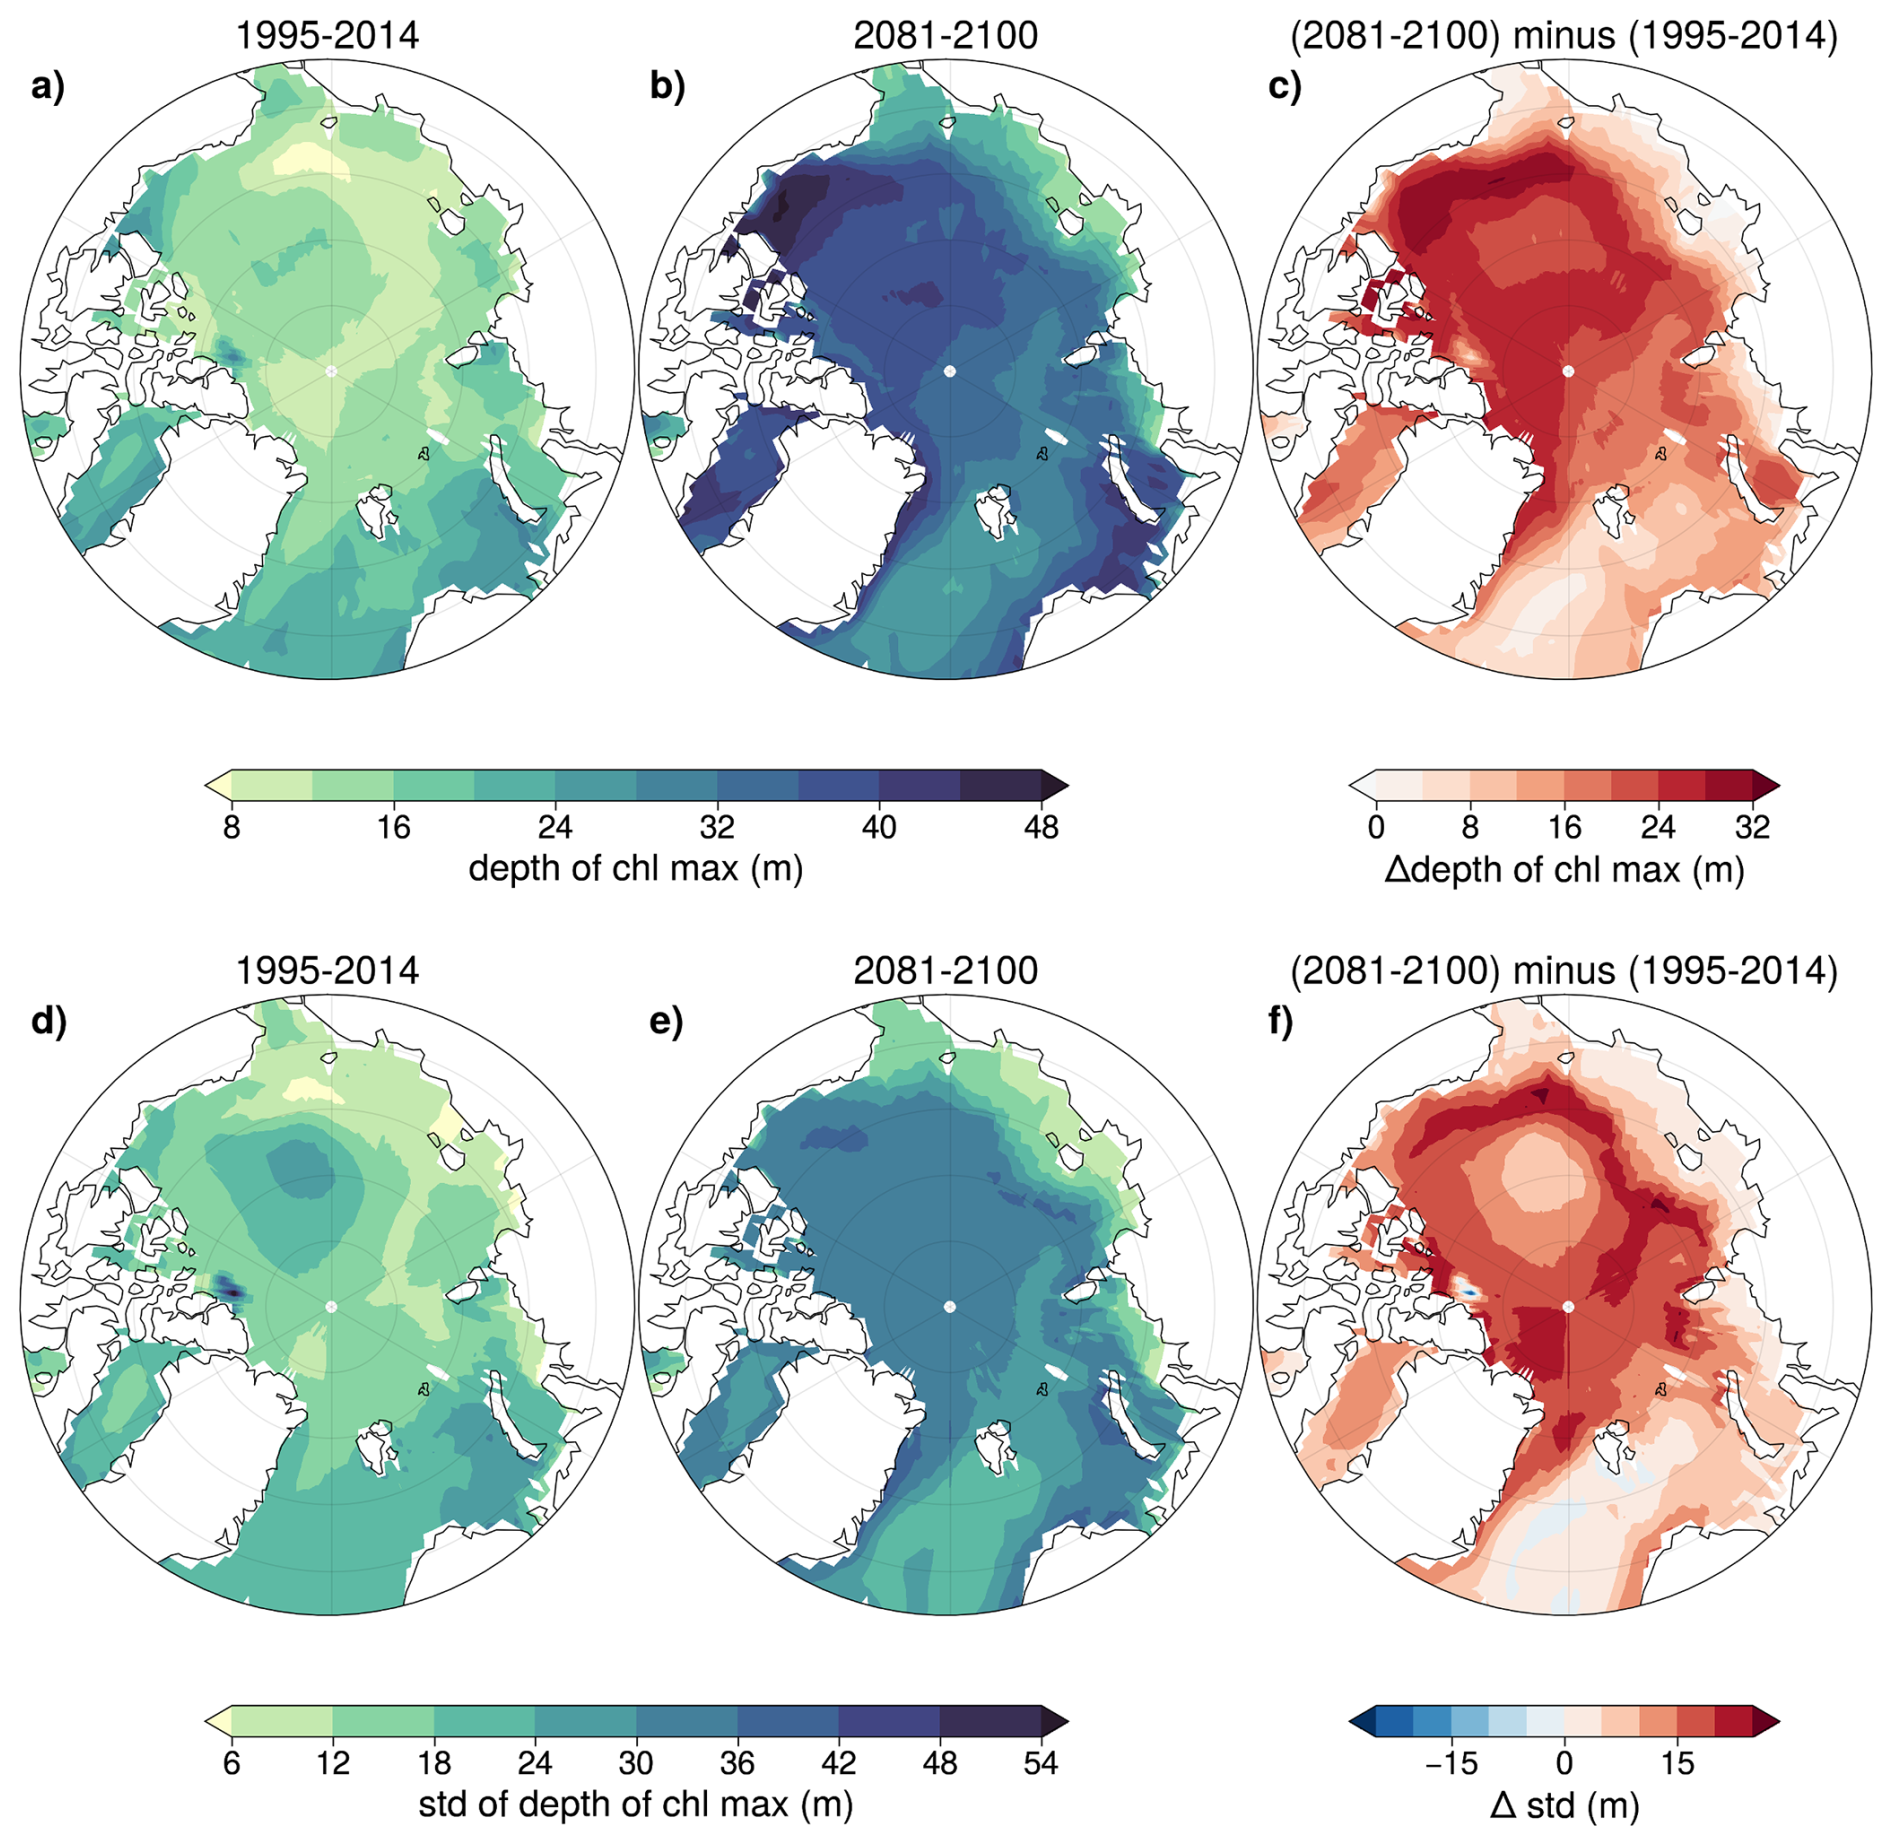
Figure 6Depth of subsurface chlorophyll maximum (SCM) in July for the periods 1995–2014 (a) and 2081–2100 of SSP5-8.5 (b), and the difference between these two periods (c) (top row). Standard deviation of the July maximum chlorophyll depth across models for 1995–2014 (d), 2081–2100 of SSP5-8.5 (e), and the difference in standard deviation between these two periods (f) (bottom row).
Models largely disagree on the depth of the SCM, particularly in future projections where deepening is observed. In some regions, the uncertainty is nearly as high as the SCM depth, possibly indicating that while some models predict a deep SCM, others do not, consistent with findings from CMIP5 models (Steiner et al., 2016).
Across all Arctic sub-regions, multi-model mean NPP, NO3, SSIC and SST are relatively stable until ∼ 1980, after which all basins begin to exhibit varying levels of surface ocean warming alongside NO3 and SSIC declines (Fig. 7). The sign of regional-scale anomalies in NO3, SSIC and SST is consistent across the CMIP6 ensemble, however model uncertainty varies across regions (Figs. 7 and 8).
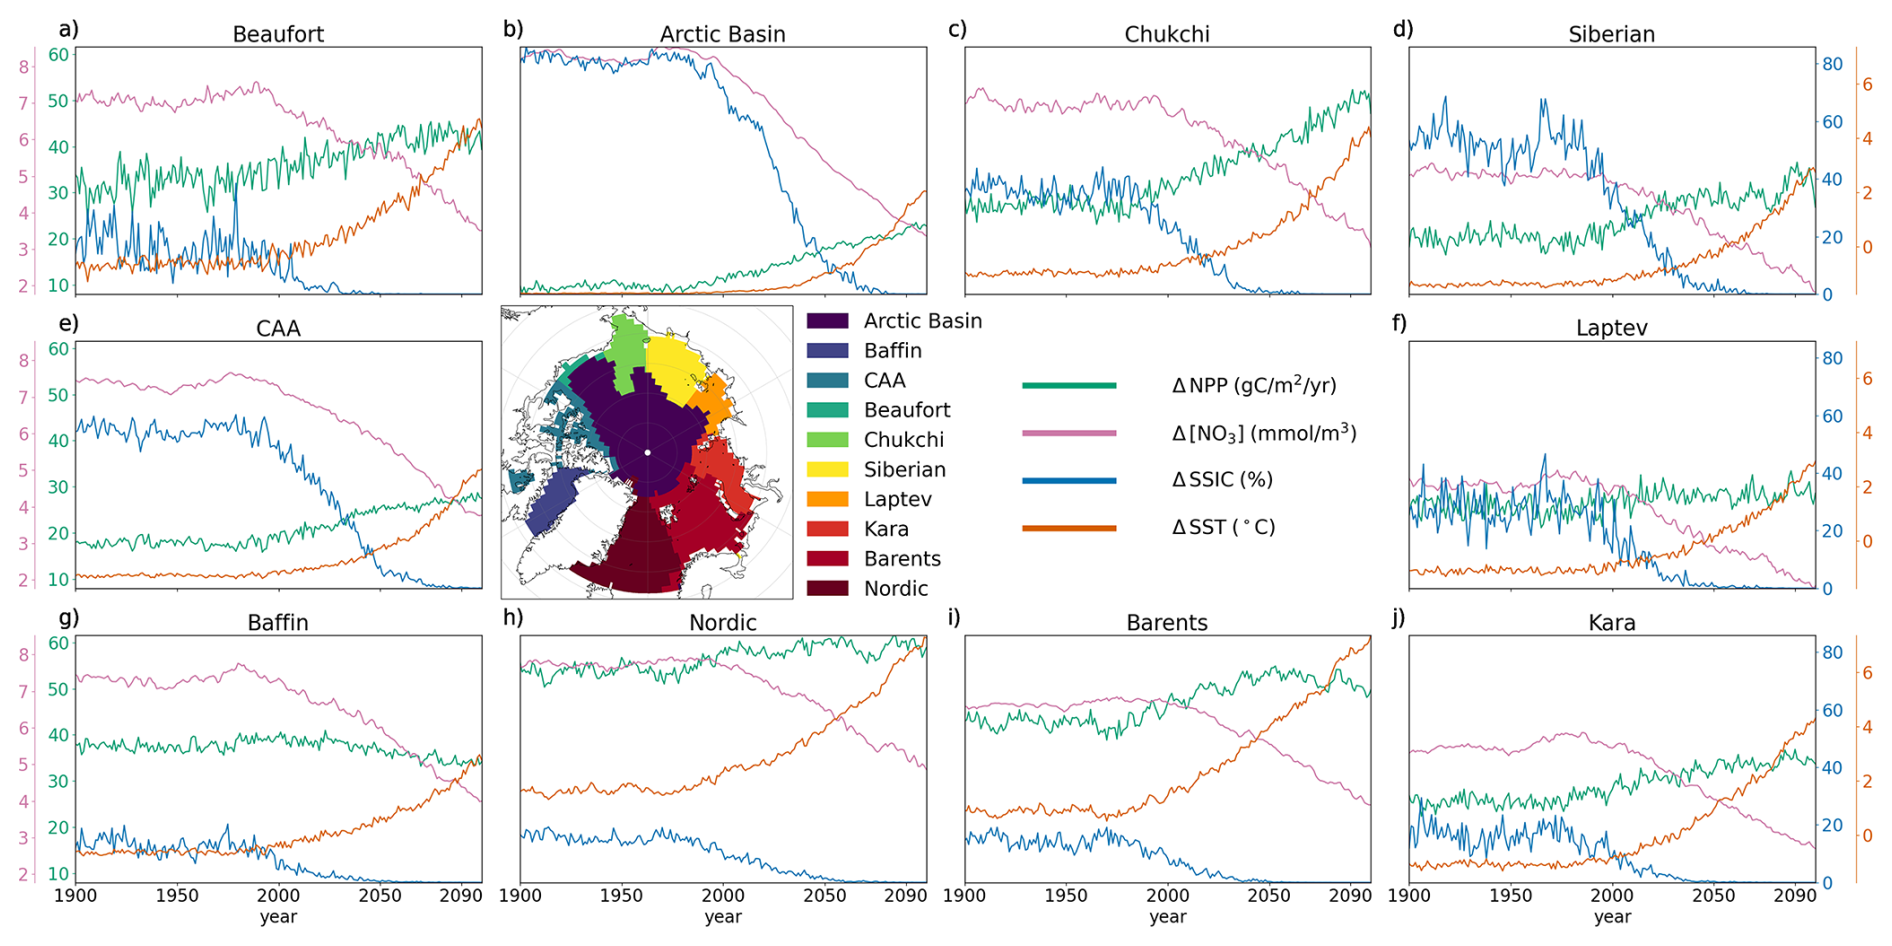
Figure 7CMIP6 multi-model mean basin-scale evolution of NPP (green), NO3 (pink), SSIC (blue) and SST (orange), over the period 1900–2100 of the historical and SSP5-8.5 simulations, relative to 1850–1899.
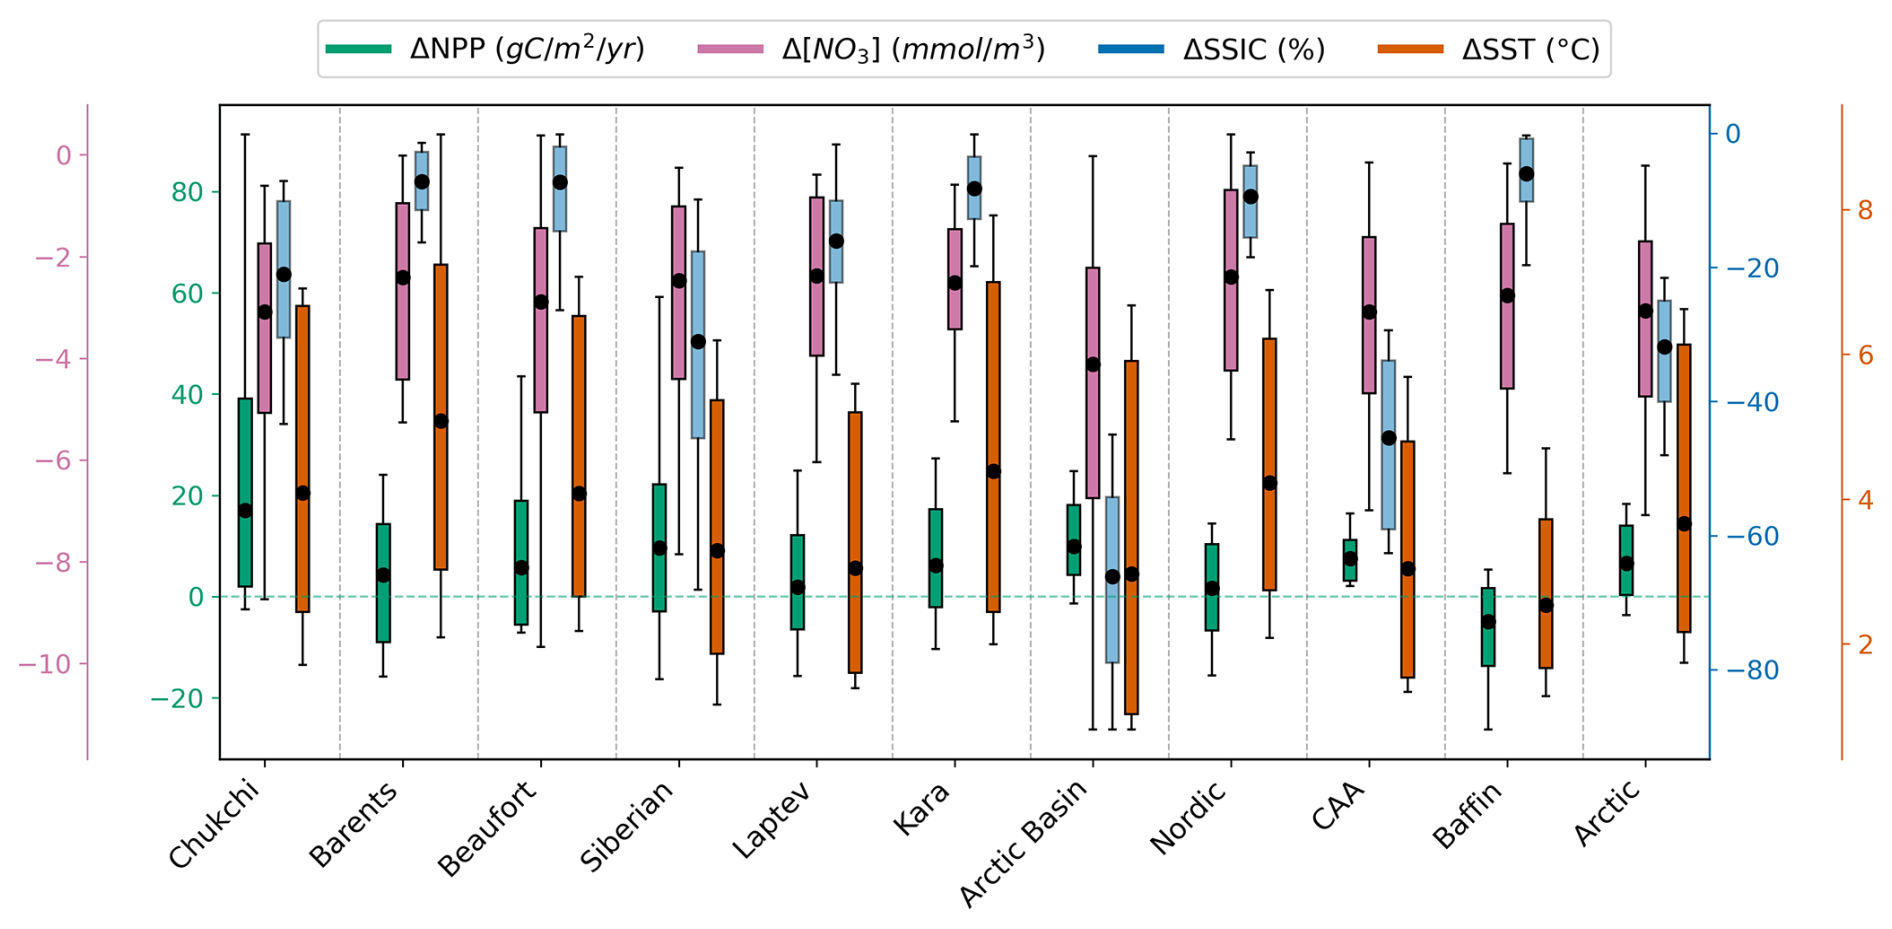
Figure 8SSP5-8.5 ensemble anomalies of NPP (green), NO3 (pink), SSIC (blue) and SST (orange) for each Arctic basin and the entire Arctic Ocean domain. Each boxplot represents the multi-model mean, interquartile range and ensemble outliers in 2081–2100 relative to 1995–2014.
The pan-Arctic Ocean ΔNPP is relatively low compared to some other regions, with an ensemble range of −3.62 to 18.3 g C m−2 yr−1 for the entire Arctic Ocean and −2.52 to 91.3 g C m−2 yr−1 for the Chukchi Sea, where the increase and associated uncertainty is the highest. The decrease in NO3 concentration is relatively consistent across Arctic sub-regions, ranging from approximately −2.38 in the Laptev Sea to −4.12 mmol m−3 in the Arctic Basin. SST increases across all subregions, with an average increase of approximately 3.66 °C across the entire Arctic Ocean. The highest multi-model ΔSST uncertainty is in the Barents Sea, with a model spread of 6.95 °C, while the lowest uncertainty occurs in Baffin Bay, with a spread of 3.42 °C (Fig. 8).
Baffin Bay differs from other regions as the only area where the multi-model mean NPP is projected to decline under SSP5-8.5. During the historical period (1995–2014), this subregion already has low annual mean sea ice coverage, therefore although it becomes ice-free by the end of the century under SSP5-8.5, the change in coverage remains small. Baffin Bay is also projected to experience the lowest multi-model mean surface ocean warming (2.53 °C) compared to other Arctic Ocean regions, with low uncertainty (Fig. 8).
3.3 Phytoplankton growth limitation terms
As phytoplankton growth is the product of multiple limiting factors (Eq. 1), the analysis of their relative anomalies throughout the 21st century is necessary to assess their respective contributions to phytoplankton growth rate perturbations and the projected increase in Arctic Ocean NPP. Diatoms exhibit a smaller increase in NPP compared to miscellaneous phytoplankton, with respective increases of approximately 11 % and 52 % relative to 1995–2014. However, the uncertainty associated with both groups is high and increases throughout SSP5-8.5 (Fig. 9a). The greatest driver of relative increases in multi-model mean phytoplankton growth rates is a reduction in light limitation (Fig. 9). Alongside this, warming directly enhances growth rates via increases in Tf although this is offset by enhanced nutrient limitation. The Llim and Tf increase is consistent between PFTs (Fig. 9b, c). However, the ΔLlim uncertainty increases sharply, exceeding ±30 % by 2100 for both PFTs while ΔTf and ΔNlim uncertainty is between ±10 % and ±20 % by 2100 (Fig. 9b, c and d). Both PFTs are increasingly nutrient limited in the Arctic Ocean over the 21st century, but diatoms are more impacted by nutrient concentration declines (Fig. 9b). These trends are consistent across models (see Fig. A5).
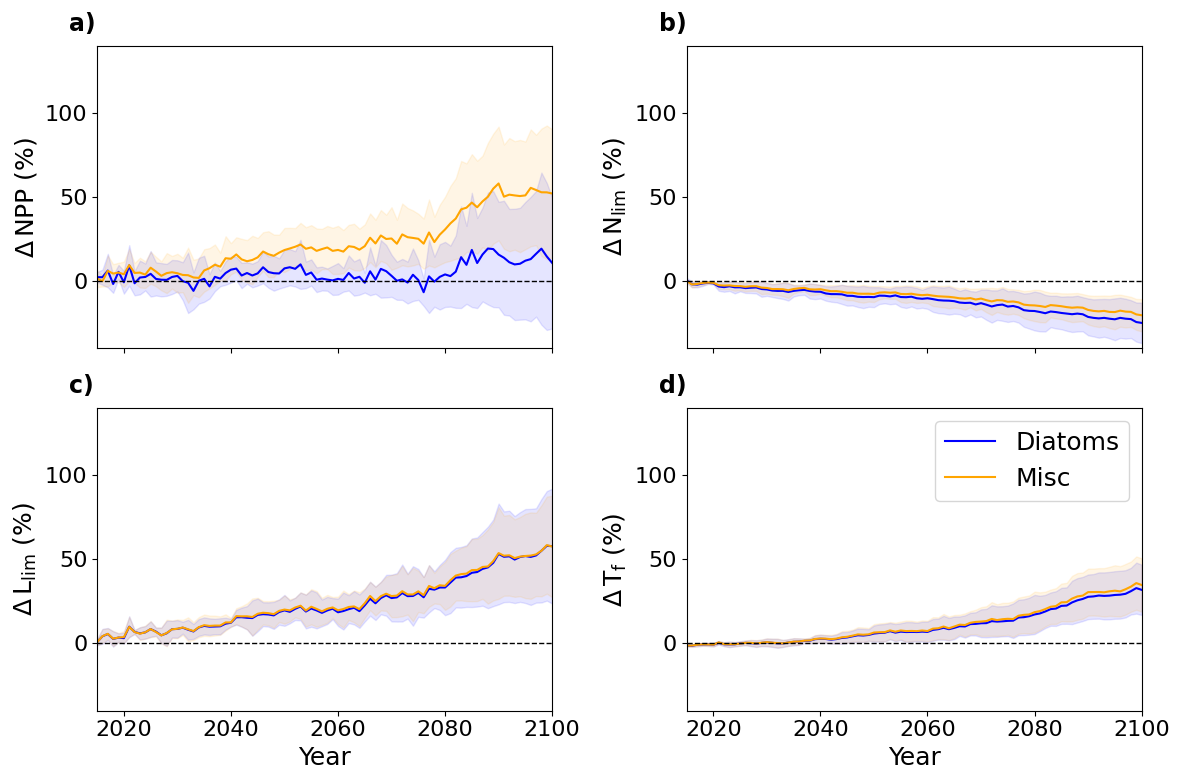
Figure 9Multi-model mean SSP5-8.5 pan-Arctic Ocean anomalies of diatom (blue) and miscellaneous phytoplankton (orange) NPP (a), nutrient limitation (b), light limitation (c) and temperature function (d). Anomalies are relative to 1995–2014 values with the multi-model standard deviations shaded.
To better understand NPP uncertainties, their causes and their distribution across the Arctic, we represented the multi-model standard deviation of SSP5-8.5 anomalies in NPP and growth limitation terms (Fig. 10). Diatoms and miscellaneous phytoplankton show comparable Arctic Ocean patterns of multi-model uncertainty associated with SSP5-8.5. Relative ΔNPP uncertainty is particularly pronounced in the central Arctic Ocean (Fig. 10a and e). This is coincident with the location of greatest ΔLlim uncertainty which reaches > 210 % over the century in this region (Fig. 10c and g). In contrast, ΔTf and ΔNlim exhibit much lower uncertainty, remaining below 30 % across the entire Arctic Ocean (Fig. 10b, d, f and h). Given the very low NPP values in the Central Arctic Ocean, it is not surprising that the regions of greatest relative NPP uncertainty (central Arctic Ocean) differ from those exhibiting the largest absolute NPP increases (shelf regions, Fig. 4a).
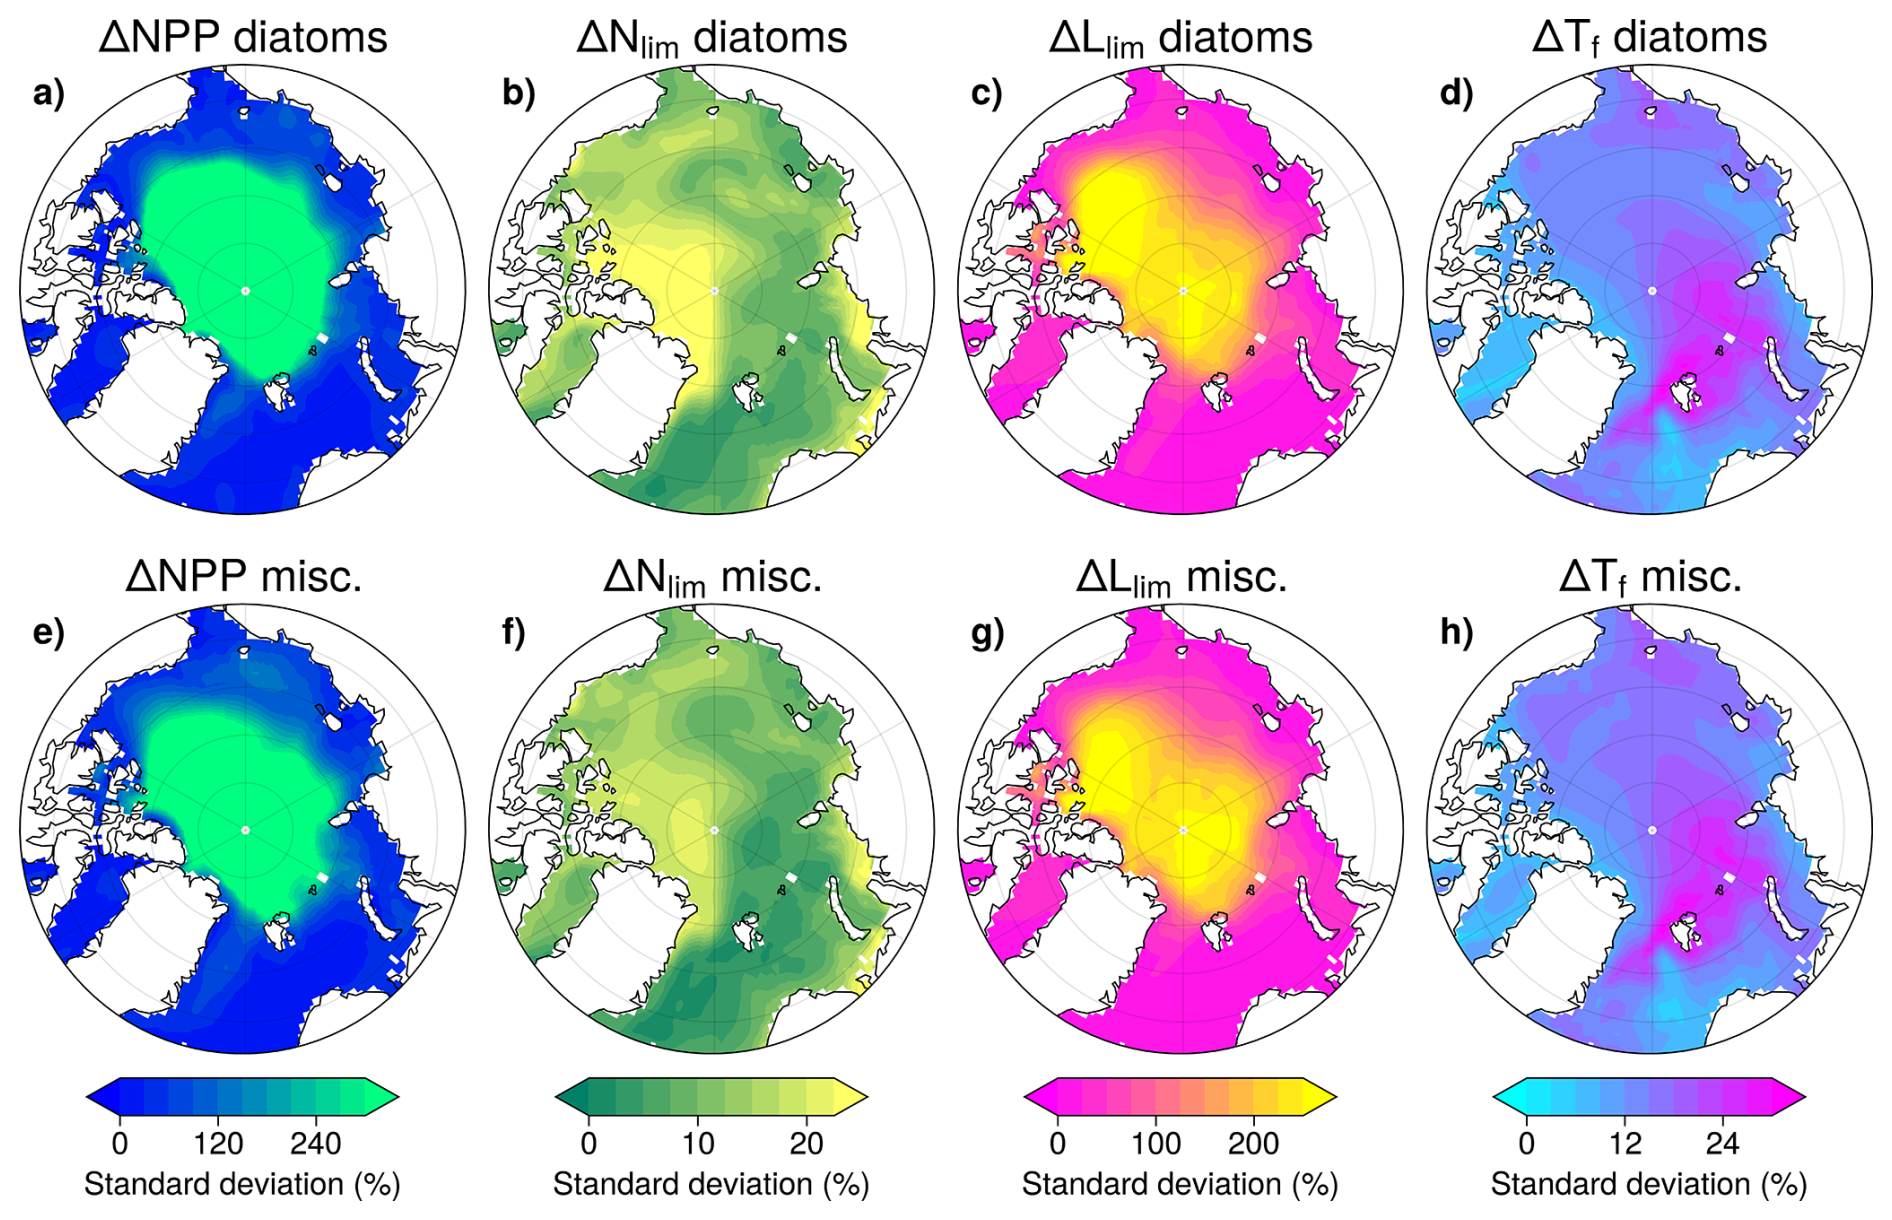
Figure 10Regional differences in the multi-model standard deviation of anomalies in NPP (a, e), nutrient limitation (b, f), light limitation (c, g) and temperature function (d, h) in 2081–2100 of SSP5-8.5 relative to 1995–2014 of the historical. The upper row represents diatoms and the lower row miscellaneous phytoplankton.
In the two decades 1995–2014, diatoms are not the dominant contributor to total NPP across the majority of the Arctic Ocean with the exception of the coastal East Siberian Sea where diatom NPP is particularly important (Fig. 11a). Under SSP5-8.5, miscellaneous phytoplankton dominance is enhanced, notably in the central Arctic Ocean where they contribute to up to 70 % of total NPP. In contrast, diatom NPP remains dominant in the coastal East Siberian Sea and exhibits increasing dominance in the Kara and Laptev Seas (Fig. 11b).
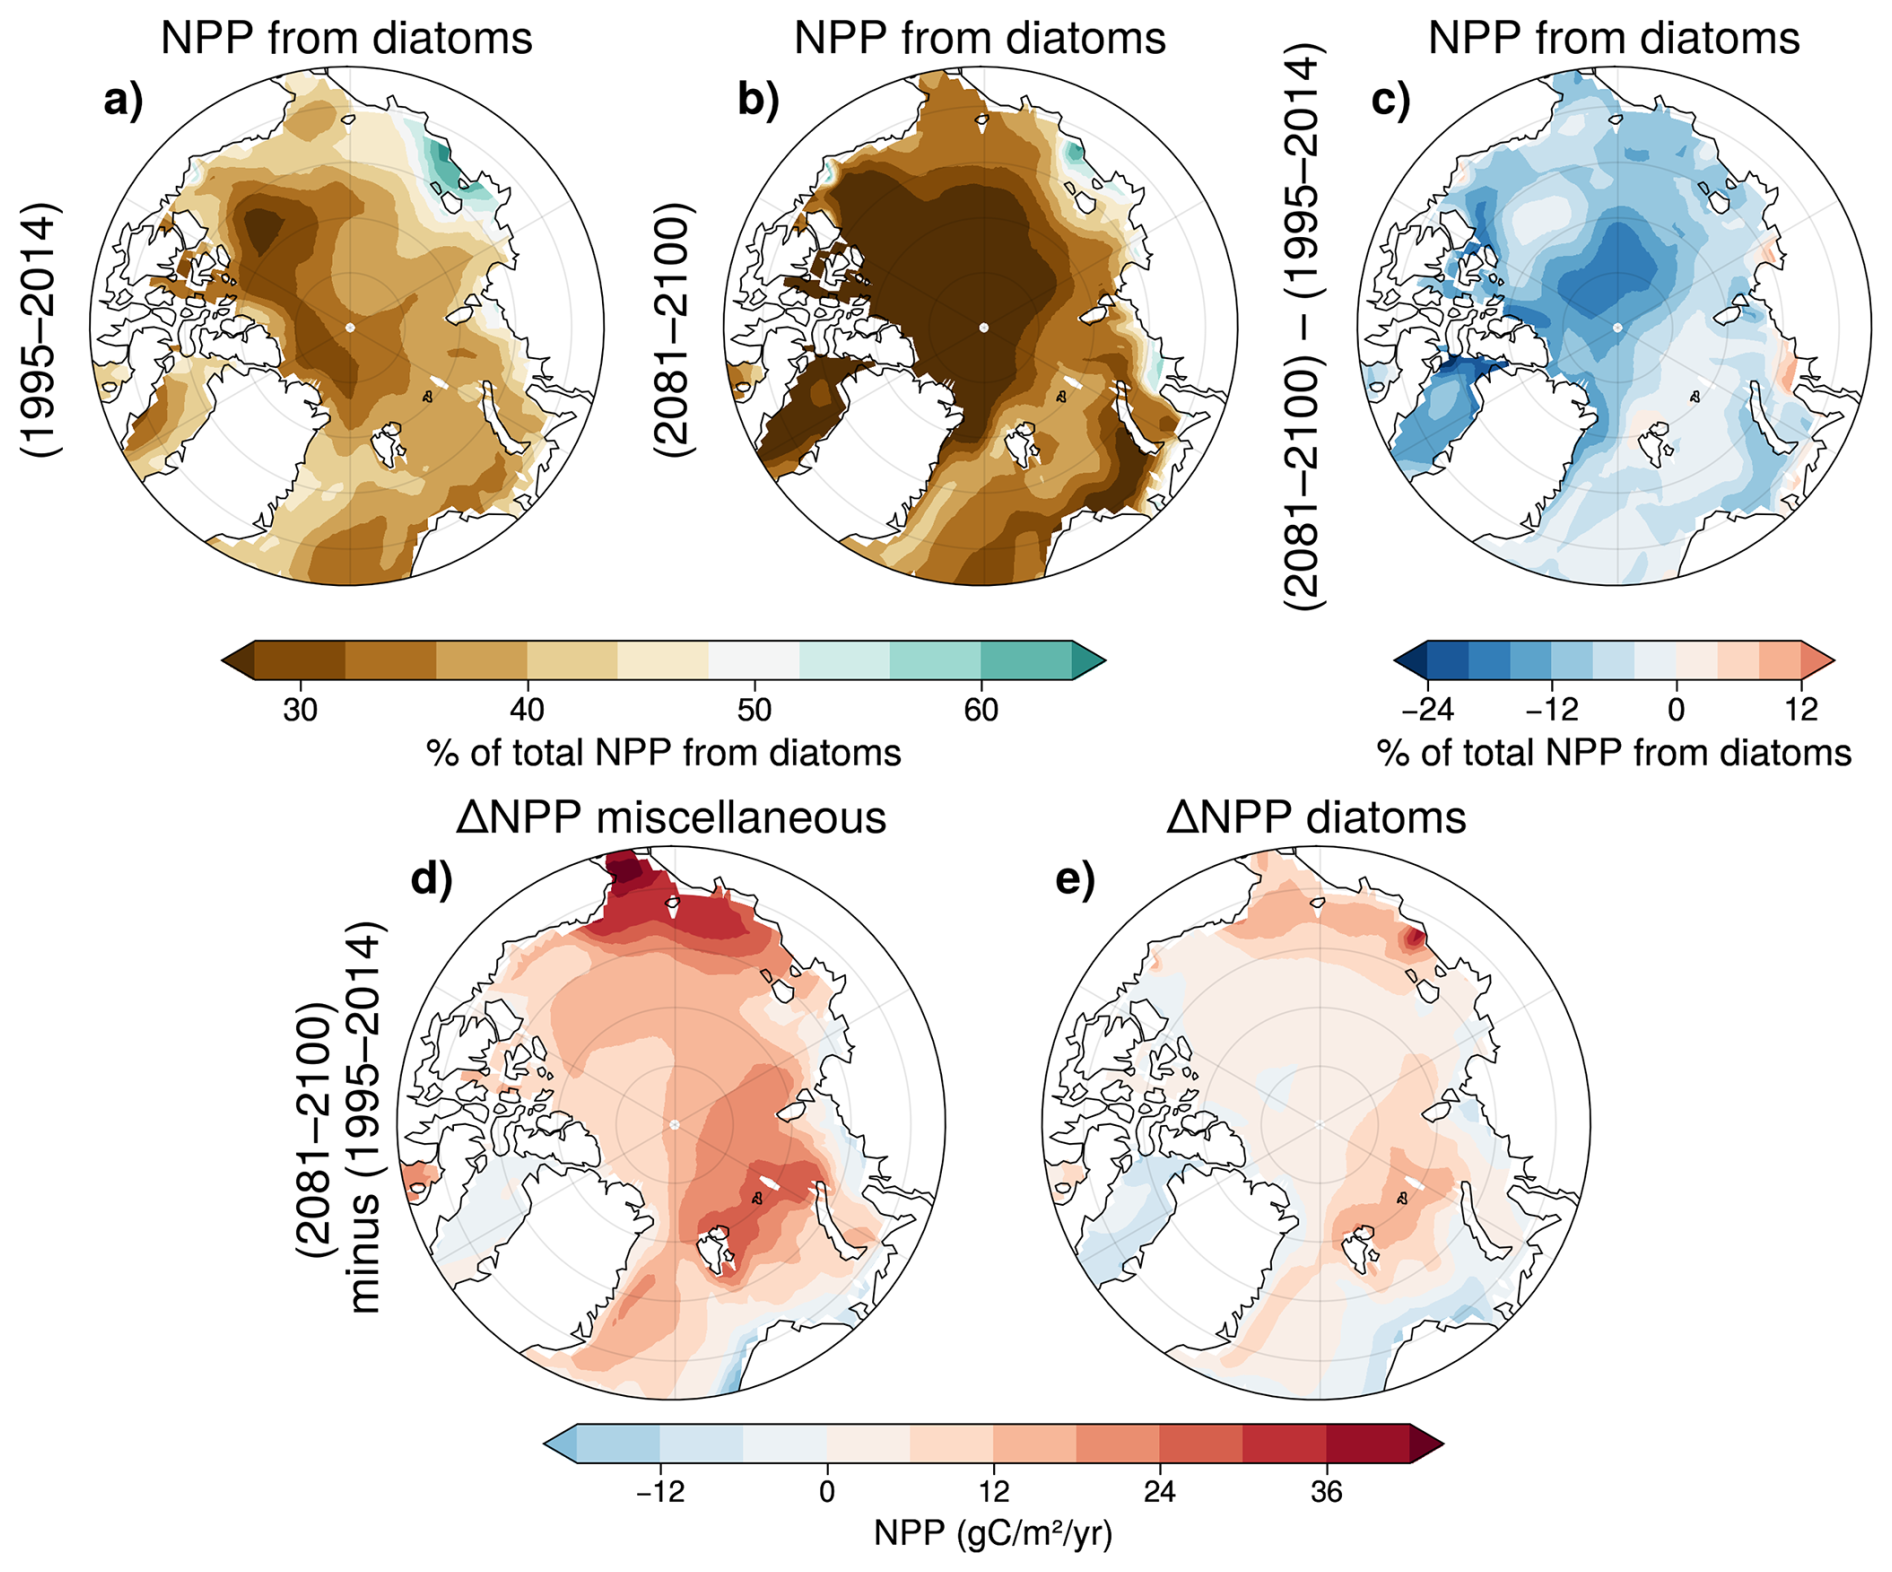
Figure 11Multi-model mean fraction of total NPP due to diatoms in 1995–2014 (a), and 2081–2100 under SSP5-8.5 (b). Change in % of total NPP due to diatoms (c). Panels (d) and (e) show the anomalies in miscellaneous phytoplankton NPP (d), and diatom NPP (e) in 2081–2100 compared to 1995–2014.
The NPP increase is the greatest in Chukchi and Barents seas for both PFTs but highest for miscellaneous phytoplankton (Fig. 11d, e). It confirms that the increase in total NPP in the pan-Arctic Ocean is driven mainly by enhanced productivity of miscellaneous phytoplankton, rather than an increase in diatom productivity (Fig. 4). NPP of both PFTs, and in particular diatom NPP, declines in the Baffin Bay, as well as in regions of the Nordic Seas and on the West Siberian shelf (Fig. 11d, e).
In the reference period (1995–2014), Nlim is lower for diatoms than for miscellaneous phytoplankton (Fig. 12a and b). This is likely indicative of diatoms typically having higher nutrient half-saturation constants than nanophytoplankton in most ocean biogeochemical models (e.g. Laufkötter et al., 2015). It could also be due to differences in the limiting nutrient but this is unlikely given the agreement between the spatial distributions of Nlim and ΔNlim for each phytoplankton type (Fig. 12m and n). In the Canadian Basin and in Baffin Bay, diatom Nlim decreases by over 40 %, with changes in diatom growth rate dominated by Nlim anomalies. For miscellaneous phytoplankton, nutrient limitation is also enhanced but to a lesser extent, with a maximum Nlim decrease below 20 % (Fig. 12m and n).
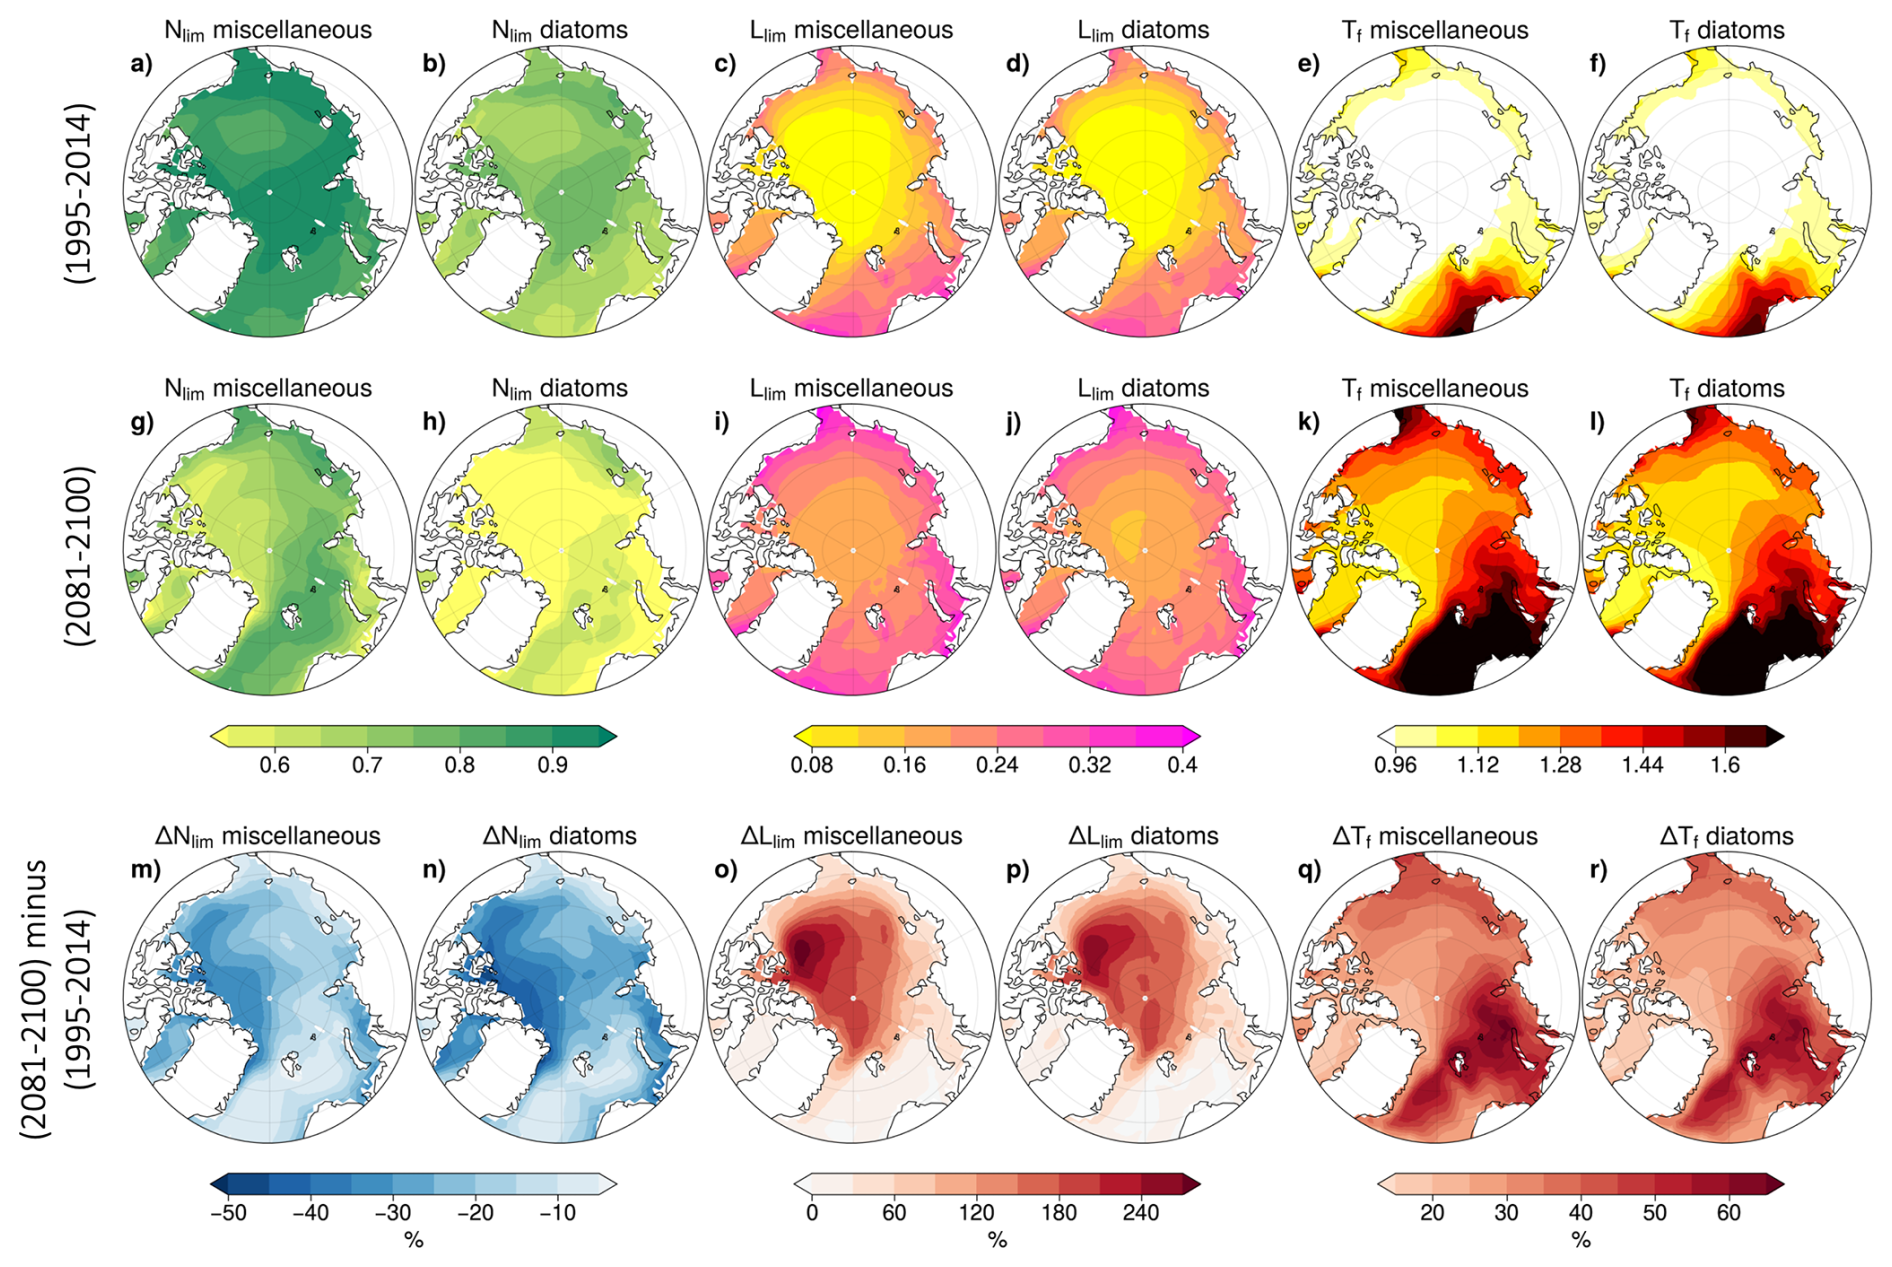
Figure 12CMIP6 multi-model mean nutrient limitation, light limitation and temperature function for each PFT in 1995–2014 of the historical simulation (top), 2081–2100 of SSP5-8.5 (middle) and anomalies between these periods (bottom).
For both PFTs, Llim and Tf exhibit similar regional distributions during the reference period (1995–2014). Llim is highest in the Nordic and Barents Seas, reaching 0.4, while Tf is also highest in these regions with values exceeding 1.8. Conversely, both Llim and Tf show their lowest values in the Arctic Basin (Fig. 12c, d, e, and f). The temporal evolution of these terms is consistent between PFTs. Llim increases most substantially in the central Arctic, with an increase of approximately 180 % relative to the reference period (Fig. 12o and p) demonstrating strong alleviation of light limitation, while Tf increases are most pronounced in the Kara Sea, Barents Sea, and Nordic Seas, exceeding 50 % relative to the reference period (Fig. 12q and r).
In SSP5-8.5 simulations, increasing Llim (reduced light limitation) is the principal driver of multi-model mean increases in phytoplankton growth rates for both diatoms and miscellaneous phytoplankton across the Arctic Ocean, particularly in the central Arctic where this is coincident with NPP increases (Fig. 13). In the Nordic, Barents, and Kara Seas, phytoplankton growth rate changes of both PFTs are mainly driven by increasing Tf (thermal enhancement) and generally consistent with NPP increases, except off the Norwegian coast. In contrast, in Baffin Bay, declining Nlim (greater nutrient limitation) is the dominant contributor to growth rate changes for diatoms and is consistent with declining diatom NPP (see Fig. A6, A7, A8, A9). For miscellaneous phytoplankton however, increasing Llim is the dominant contributor to growth rate changes. This is indicative of enhanced growth rates but miscellaneous phytoplankton NPP is projected to decline in Baffin Bay (Fig. 13b). This suggests that other mechanisms, such as enhanced zooplankton grazing rates (Rohr et al., 2023) may contribute to projected NPP declines in this region.
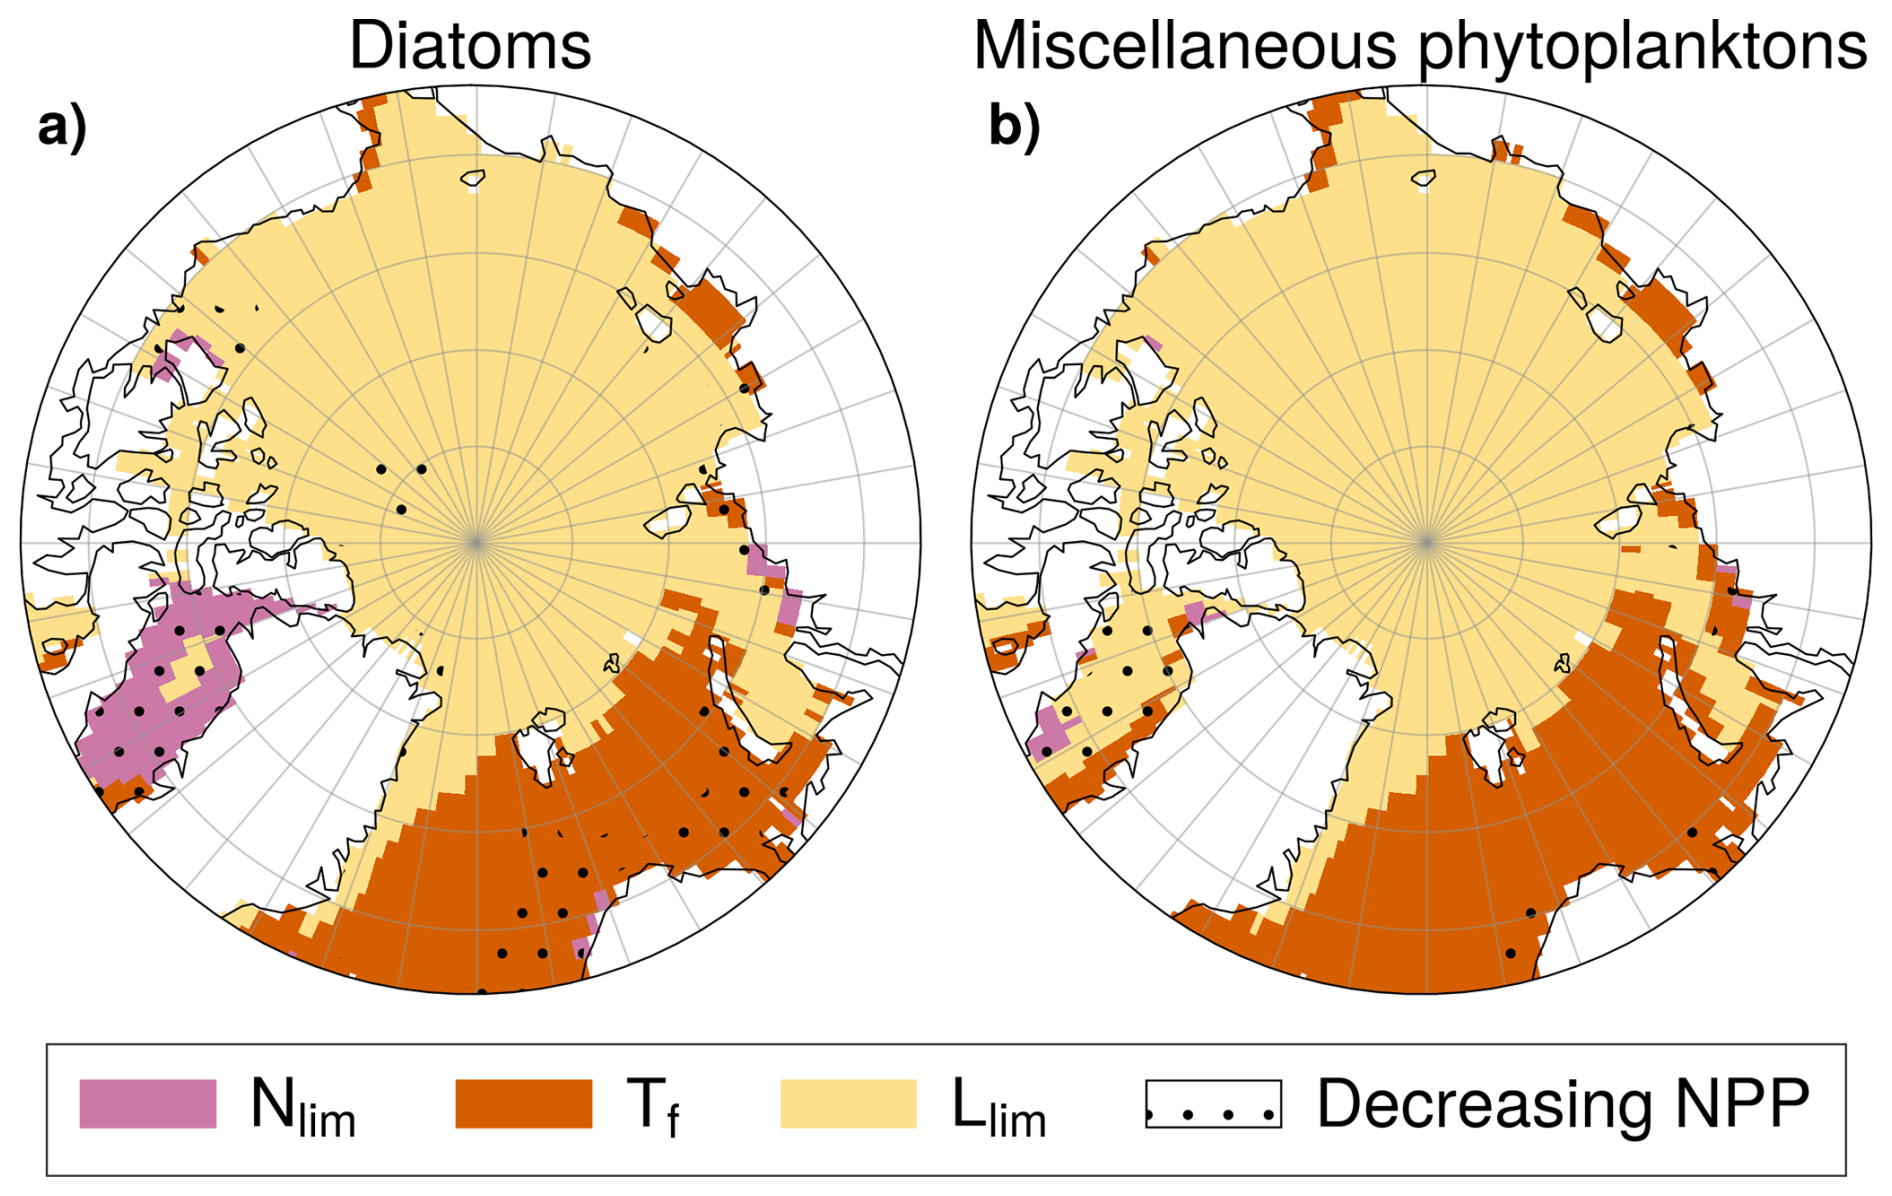
Figure 13Dominant driver of phytoplankton growth rate changes (Δμ) in SSP5-8.5 for diatoms (a) and miscellaneous phytoplankton (b). Colors denote whether Llim (yellow), Tf (orange) or Nlim (pink) is the largest contributors to Δμ. NPP anomalies are negative in stippled areas and positive elsewhere.
Projected twenty-first century increases in Arctic Ocean NPP are higher and more variable in CMIP6 than in CMIP5. The multi-model mean NPP increase is four times larger under comparable high radiative forcing in CMIP6 than in CMIP5 (respectively 46.4 % and 11.5 % compared to the historical period, see Fig. 6a), with uncertainty at the end of the century three times higher in CMIP6 than CMIP5, consistent with previous studies (Tagliabue et al., 2021). The CMIP6 and CMIP5 ensembles also exhibit differing temporal evolution of NPP over the 21st century. All CMIP6 models exhibit monotonic increases in Arctic Ocean NPP, whereas CMIP5 models exhibit more diverse responses, with some models showing an initial increase in NPP followed by a subsequent decrease due to the emergence of oligotrophic conditions (Vancoppenolle et al., 2013). In absolute values, the most substantial NPP increases in CMIP6 are observed in the inflow shelf regions, which experience the greatest warming, sustained nutrient levels and limited change in light availability. This is consistent with the trend in the current observations (Lewis et al., 2020). The model uncertainty associated with CMIP6 Arctic Ocean NPP projections is higher than the scenario uncertainty (Fig. 3). This result is consistent with global NPP projections, which indicates finely balanced limitations on NPP, which often compensate one another (Bopp et al., 2013; Kwiatkowski et al., 2020).
The direct influence and balance among climate-driven drivers of phytoplankton growth rates, namely temperature, light and nutrient availability, shifts substantially in CMIP6 compared to CMIP5. The stronger Arctic Ocean surface warming projected in CMIP6 and greater associated uncertainty (Fig. 6) relates to higher and more variable climate sensitivity (Zelinka et al., 2020) with similar Arctic amplification simulated across both ensembles (Hahn et al., 2021). This results in greater thermally-driven increases in phytoplankton growth rates than previously simulated in CMIP5 (Laufkötter et al., 2015; Nakamura and Oka, 2019). The more pronounced Arctic Ocean sea ice loss in CMIP6 (Notz and Community, 2020) increases light availability in the upper ocean, thereby further acting to enhance phytoplankton growth rates and associated NPP. In addition to this intensified sea ice loss, a number of CMIP6 models include an improved representation of sea ice light attenuation, resulting in generally higher under-ice light transmission (Lebrun et al., 2023). Although CMIP6 simulations exhibit a larger decrease in upper Arctic Ocean nitrate concentrations over the 21st century (Fig. 6b), oligotrophic conditions are reached later and less frequently compared to CMIP5 models (Vancoppenolle et al., 2013), due to higher simulated mean state nutrient concentrations.
Beyond changes in mean nutrient concentration, CMIP6 projections point to a reorganization of the seasonal dynamics of nutrient limitation throughout the century in the Arctic Ocean. The lengthening of the oligotrophic period in CMIP6 projections suggests a progressive extension of nutrient limitation beyond the peak bloom phase, potentially affecting both the magnitude and the phenology of phytoplankton production (Manizza et al., 2023). The intensity of the bloom is constrained by the seasonal depletion of nutrients, despite enhanced light availability and warmer temperatures, while a delayed replenishment in autumn and winter could limit the recovery of nutrient inventories prior to the following growing season. Contrary to expectations, nutrient replenishment is not occurring in autumn despite the expansion of open water areas. Under usual conditions, the reduced sea ice cover in this season would increase fetch, which could allow stronger storm-driven mixing and entrain nutrient-rich deep waters into the surface layer (Ardyna et al., 2014). Our analysis suggests that if his phenomenon is occurring, it is inefficient.
Although NPP is projected to increase in most regions of the Arctic Ocean, many models simulate local declines, particularly in Baffin Bay and in the Nordic Seas. These regions are characterized by rising temperatures, reduced nutrient availability and little or no sea ice in present-day conditions. As such, the potential for changes in light supply is low in these areas and phytoplankton growth shows little to no increase due to increased light availability. While higher temperatures do stimulate growth rates, the limiting effect of declining nutrient availability dominates, resulting in overall NPP declines in Baffin Bay and Nordic Seas. The projected decline in NPP in Baffin Bay is consistent with recent observations of decreasing productivity in this region (Ardyna and Arrigo, 2020).
In addition to this projected NPP increase, in CMIP6 models, the SCM deepens in CMIP6, consistent with CMIP5 (Steiner et al., 2016). However, the uncertainty associated with this deepening is high and the modeled historical SCM depth is still inconsistent with observational estimates.
Arctic Ocean phytoplankton communities are projected to shift toward smaller size classes, with miscellaneous phytoplankton increasingly dominating primary production throughout the 21st century (Fig. 11). This change in phytoplankton community structure aligns with previous projections from ESMs (Bopp et al., 2005; Fu et al., 2016), and is driven by differential nutrient affinities among PFTs. Miscellaneous phytoplankton demonstrate greater competitive advantage than diatoms under the increasingly low-nutrient conditions (Ward et al., 2012). In most of the Arctic Basin where NPP is increasing, productivity exhibits substantial gains, with miscellaneous phytoplankton driving most of this enhancement. This production is facilitated by newly ice-free waters that provide increased light availability and extended growing seasons. In contrast, in Baffin Bay and Nordic Seas, the decline of NPP is driven by a pronounced decrease in diatom productivity. While smaller miscellaneous phytoplankton can efficiently exploit low-nutrient environments and capitalize on higher temperatures, larger diatoms require higher nutrient concentrations to maintain growth (Marinov et al., 2010). These contrasting patterns suggest a fundamental shift in Arctic marine ecosystems, with implications for higher trophic levels and thus carbon pump efficiency (Grebmeier et al., 2010; Ward et al., 2012).
In particular, a transition toward smaller phytoplankton cells is expected to reduce the efficiency of energy transfer to zooplankton, especially large lipid-rich copepods such as Calanus glacialis and Calanus hyperboreus, whose development depends on the timing and magnitude of diatom-dominated blooms for feeding and reproduction (Leu et al., 2011; Wassmann, 2011). Such temporal mismatches can cascade through the food web, affecting the growth, recruitment and distribution of key predators including fish, seabirds and marine mammals (Haug et al., 2017). Moreover, although export production is not assessed in this study, reduced export of large, fast-sinking diatom aggregates may weaken pelagic–benthic coupling, ultimately altering benthic communities and their role in carbon remineralization (Wassmann et al., 2006).
This study highlights the complexity of projecting future NPP in the Arctic Ocean under anthropogenic pressure. While Arctic Ocean NPP is projected to increase throughout the 21st century, substantial uncertainties persist alongside pronounced spatial heterogeneity, with diverse impacts. The projected shift in phytoplankton community structure toward smaller taxa may exacerbate the weakening of the Arctic Ocean carbon sink, which is already projected to decline due to surface ocean warming that reduces CO2 solubility and enhances stratification (Oziel et al., 2025). Concurrently, these ecosystem changes could cause unclear impacts to local communities, whose economic livelihoods, food security, public health, and cultural identity depend heavily on marine resources (Malik and Ford, 2025; Mudryk et al., 2021). The magnitude and spatial distribution of future NPP changes remain highly uncertain due to differences in key limiting factors, biogeochemical parameterizations and their impact on phytoplankton community structure. In particular, the limited representation of sea-ice algae in most CMIP6 models might affect the phenology of pan-Arctic NPP as well as its vertical distribution and associated carbon export. Specifically, uncertainties in light penetration through varying sea ice thickness and optical properties, coupled with incomplete understanding of nutrient availability and cycling beneath ice-covered waters, represent critical knowledge gaps. Improving future Arctic Ocean NPP simulations requires enhanced representation of present-day nutrient levels, more accurate light transmission parameterizations through sea ice, and reduced climate sensitivity uncertainties across model ensembles.
The increase in Arctic Ocean NPP projected by CMIP6 models for the end of the 21st century under high anthropogenic emissions is about four times higher than in CMIP5. This is mostly due to the higher climate sensitivity of CMIP6 models, leading to greater warming and earlier September sea-ice loss and a longer open-water season, together with a lower limitation by nutrients. CMIP6 models also incidentally simulate higher nutrient levels than their CMIP5 counterparts. The NPP increase is accompanied by a shift toward smaller phytoplankton species, driven by projected nutrient decline over the 21st century – despite CMIP6 models simulating higher absolute nutrient levels than CMIP5. This community shift has implications for higher trophic levels, biogeochemical cycling, and carbon export. The implications for ecosystem services and indigenous communities that depend on marine resources remain largely unassessed.
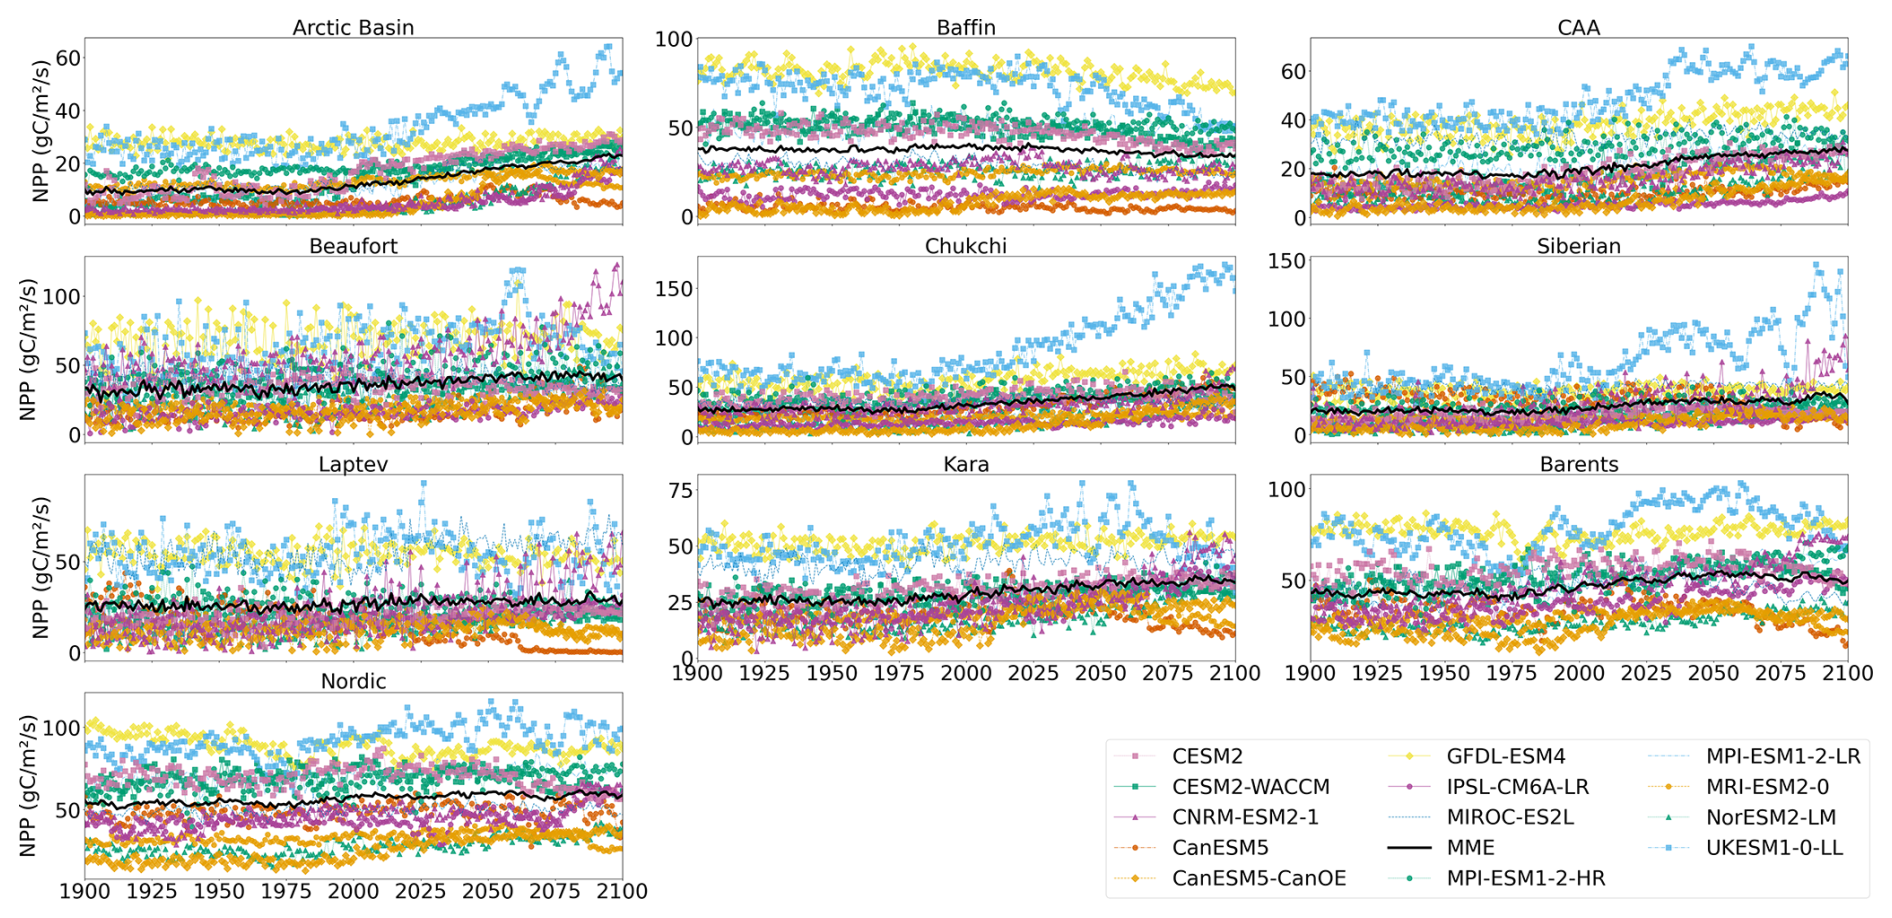
Figure A1Projected regional annual mean NPP during the period 1900–2100 (historical and SSP5-8.5). Multi-model mean is shown in black.
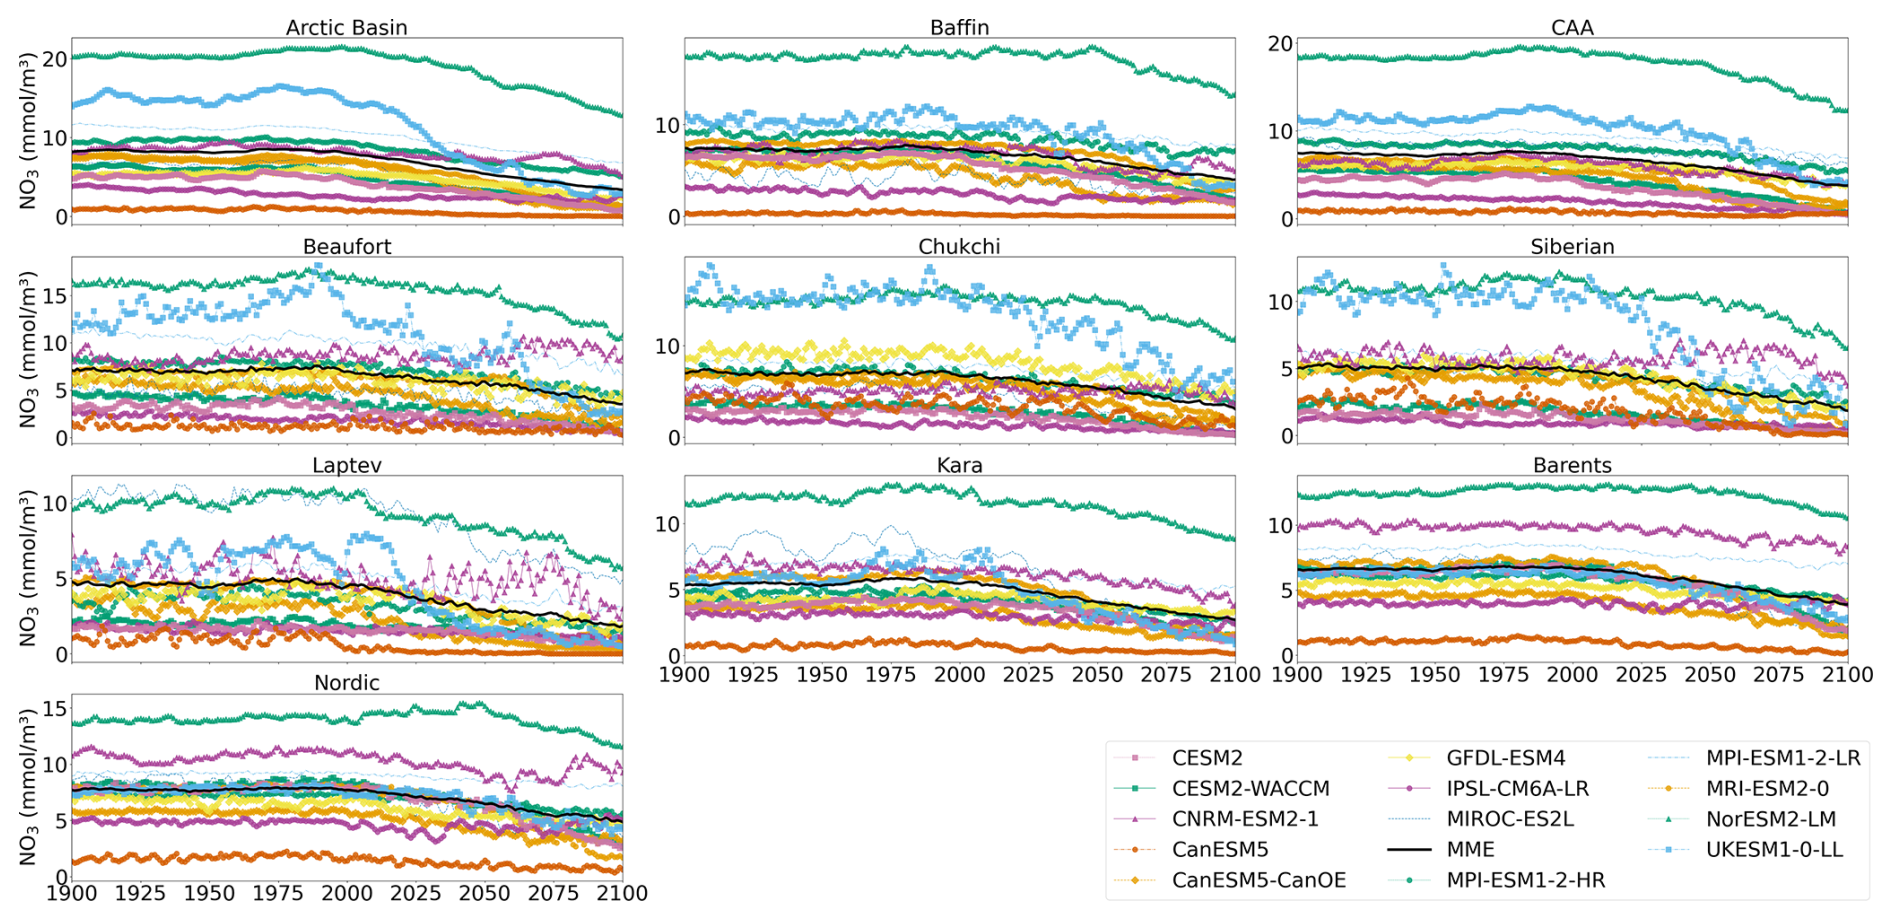
Figure A2Projected regional annual mean MLD NO3 concentration during the period 1900–2100 (historical and SSP5-8.5). Multi-model mean is shown in black.
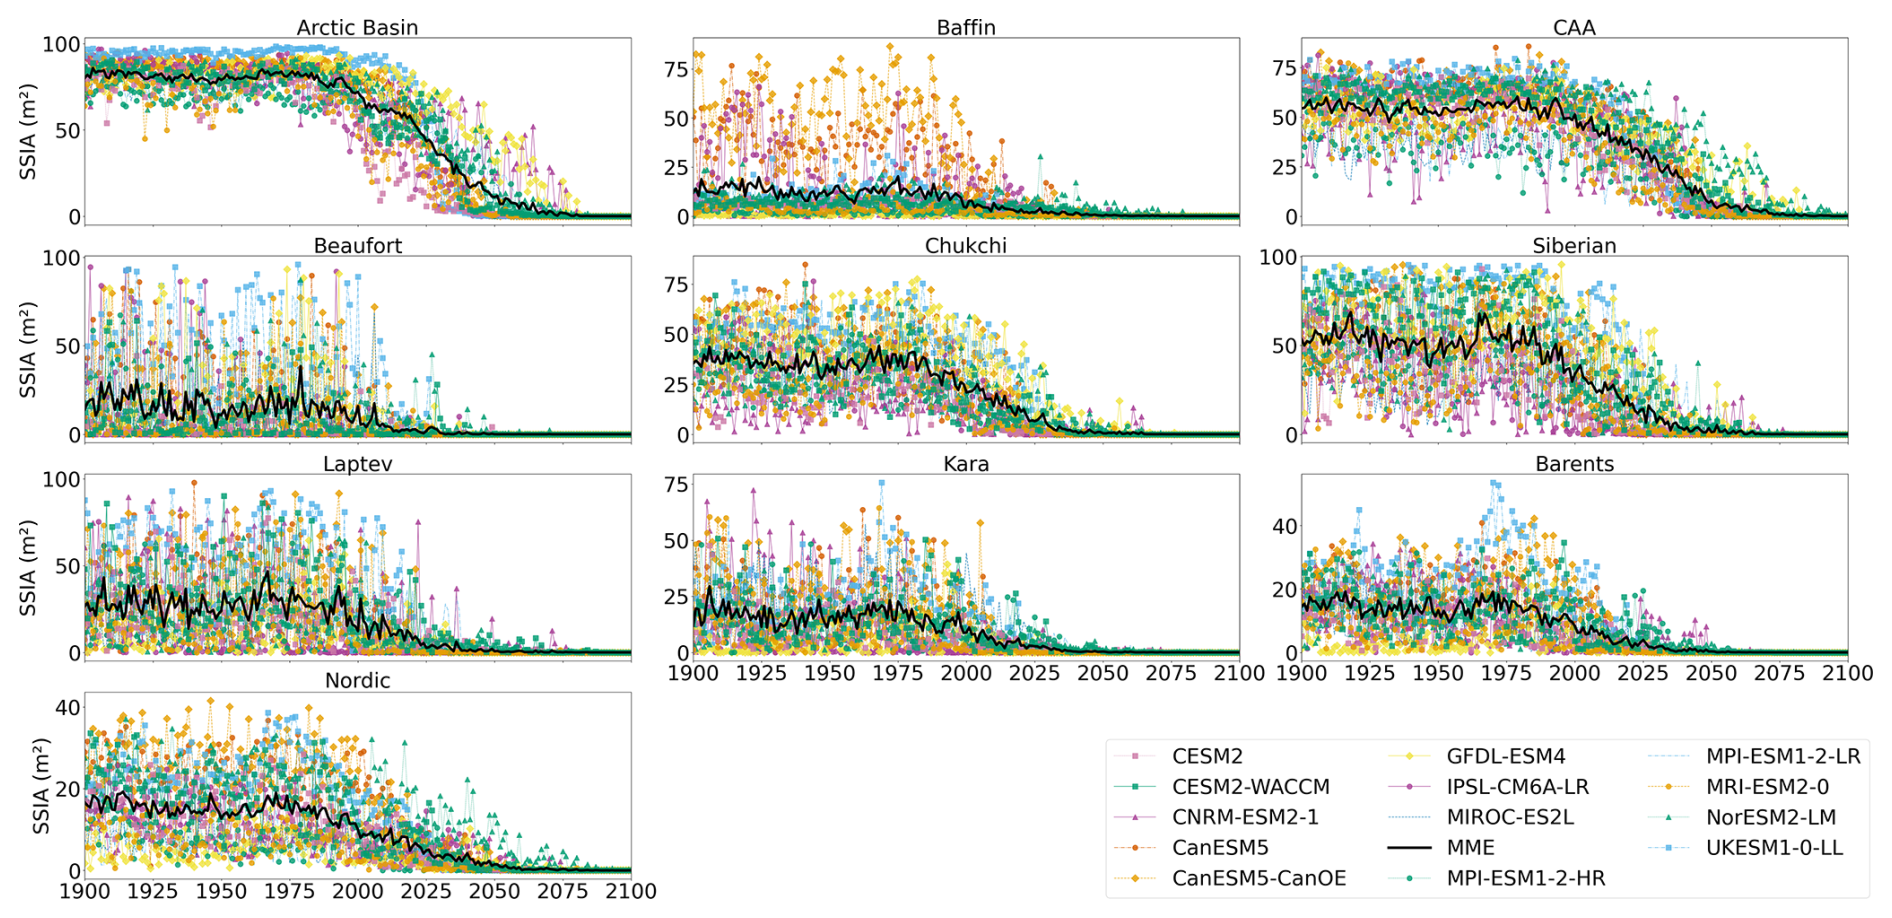
Figure A3Projected regional September sea ice concentration during the period 1900–2100 (historical and SSP5-8.5). Multi-model mean is shown in black.
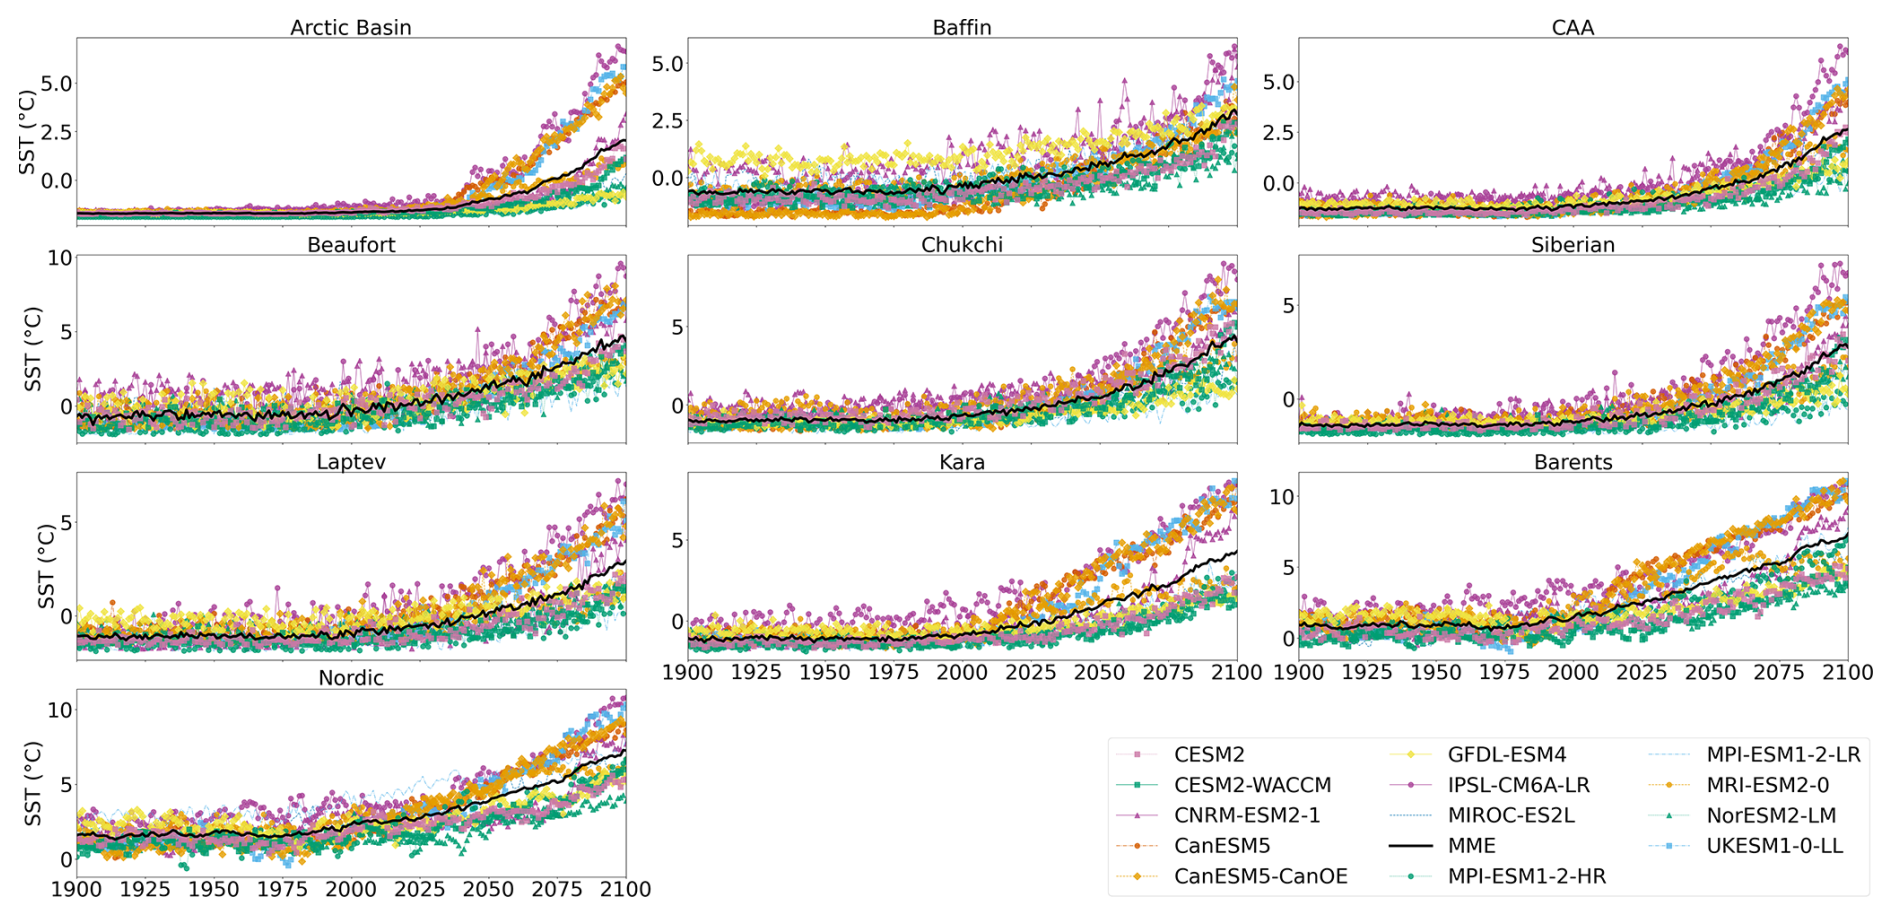
Figure A4Projected regional SST during the period 1900–2100 (historical and SSP5-8.5). Multi-model mean is shown in black.
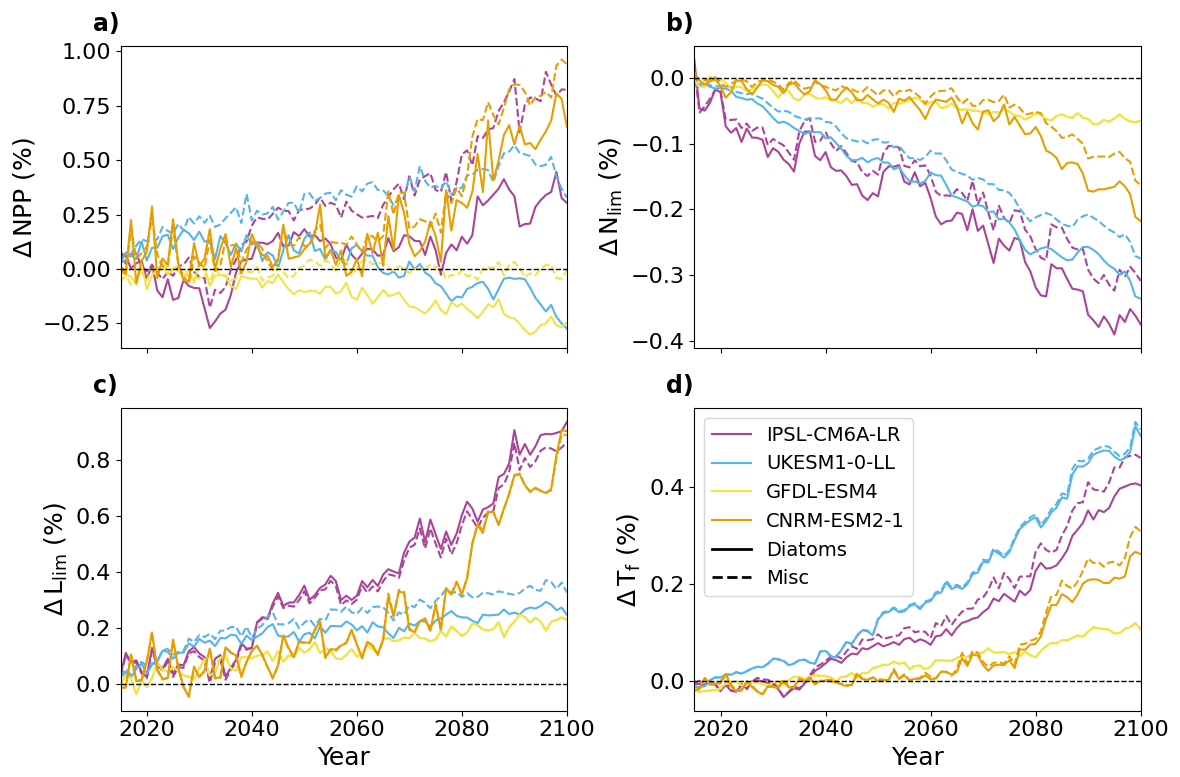
Figure A5Evolution of SSP5-8.5 NPP (a), Nlim (b), Llim (c) and Tf (d) for each model and each PFT, relative to the period 1995–2014 averaged over the pan-Arctic Ocean.
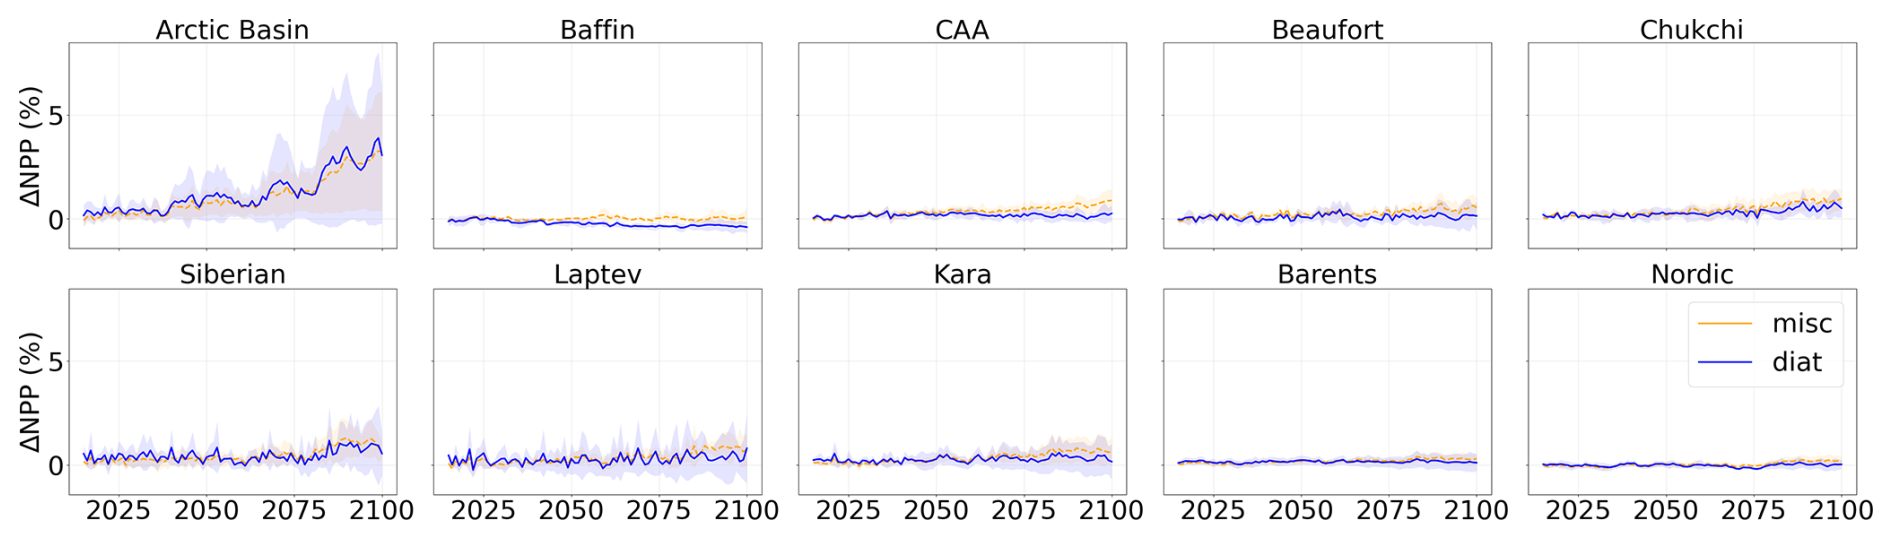
Figure A6Projected NPP relative to 1995–2014 during the period 2015–2100 of SSP5-8.5 in each subregion of the Arctic Ocean. Diatoms are represented in blue and miscellaneous phytoplankton in orange. Shading represents the multi-model standard deviation.
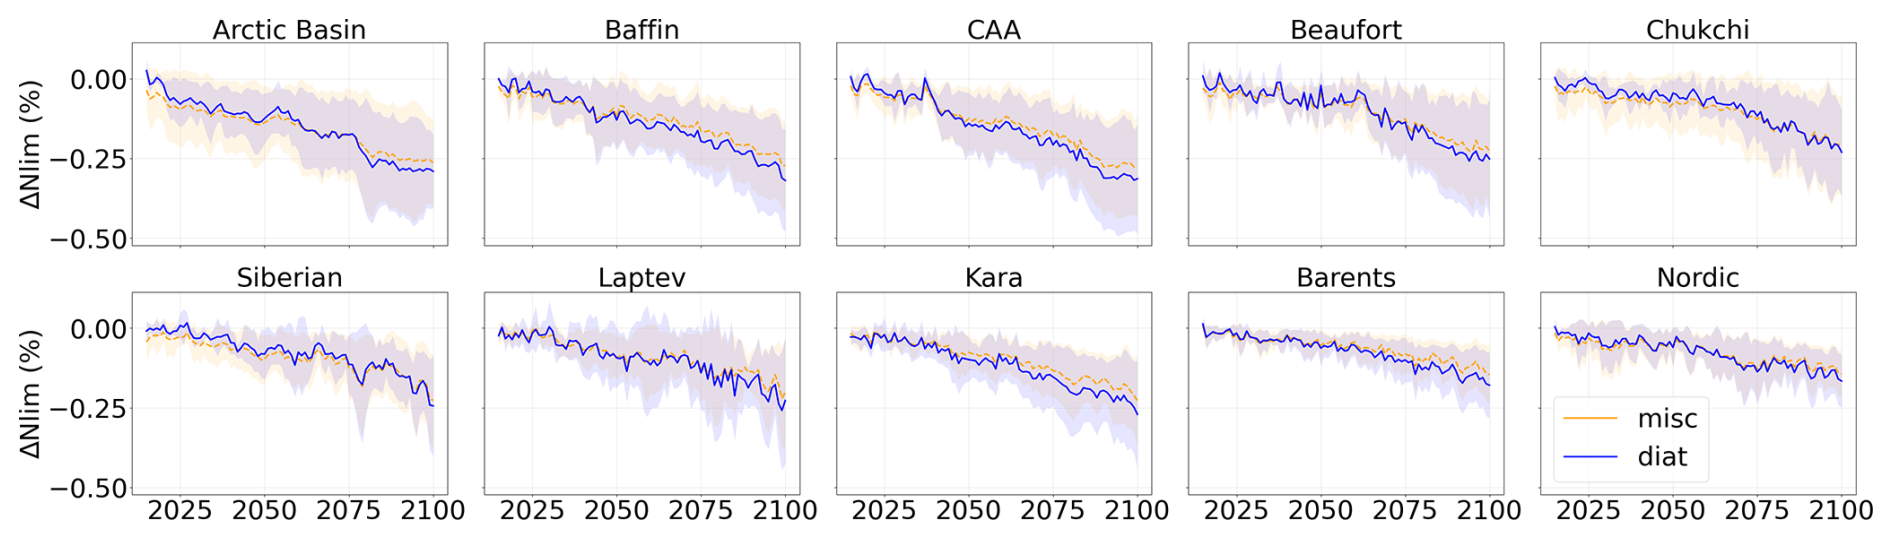
Figure A7Projected nutrient limitation factor relative to 1995–2014 during the period 2015–2100 of SSP5-8.5 in each subregion of the Arctic Ocean. Diatoms are represented in blue and miscellaneous phytoplankton in orange. Shading represents the multi-model standard deviation.
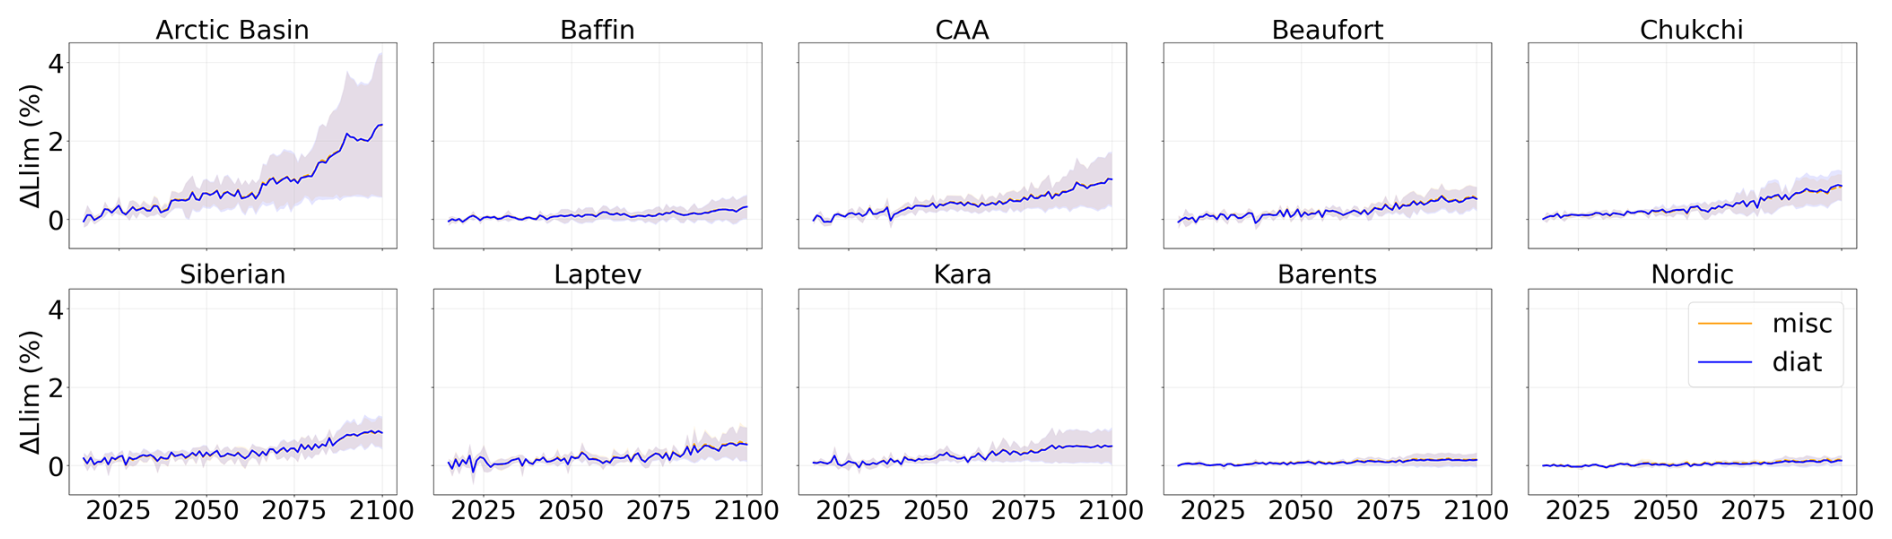
Figure A8Projected light limitation factor relative to 1995–2014 during the period 2015–2100 of SSP5-8.5 in each subregion of the Arctic Ocean. Diatoms are represented in blue and miscellaneous phytoplankton in orange. Shading represents the multi-model standard deviation.
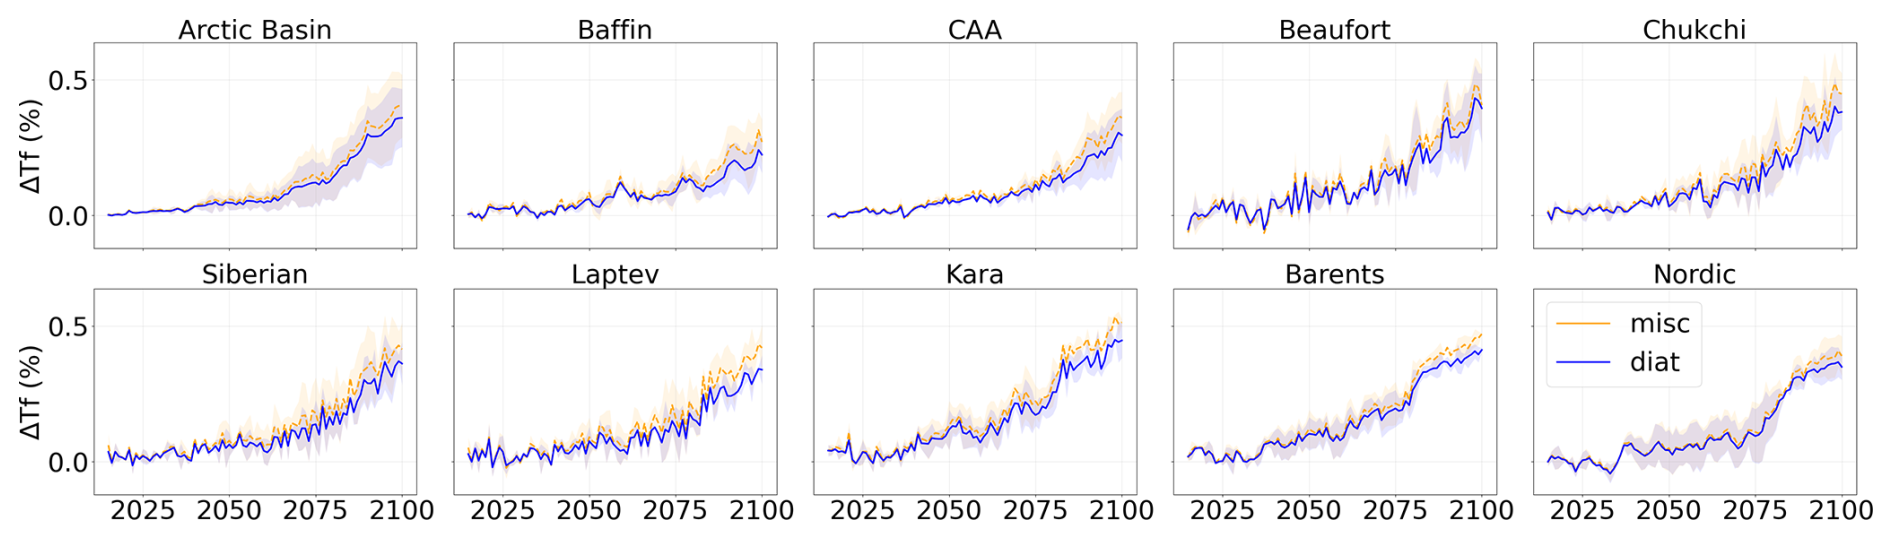
Figure A9Projected temperature function relative to 1995–2014 during the period 2015–2100 of SSP5-8.5 in each subregion of the Arctic Ocean. Diatoms are represented in blue and miscellaneous phytoplankton in orange. Shading represents the multi-model standard deviation.
Publicly available datasets were analysed in this study. This data can be found at https://esgf.llnl.gov/ (Earth System Grid Federation, 2025). Codes are available upon request to the corresponding author LCB.
LK, MV and LCB conceived the study. LCB did the analysis and wrote the paper.
The contact author has declared that none of the authors has any competing interests.
Publisher's note: Copernicus Publications remains neutral with regard to jurisdictional claims made in the text, published maps, institutional affiliations, or any other geographical representation in this paper. The authors bear the ultimate responsibility for providing appropriate place names. Views expressed in the text are those of the authors and do not necessarily reflect the views of the publisher.
We gratefully acknowledge the ClimArctic project for supporting and enabling this study, as well as Olivier Torres for his help in processing the CMIP6 output data. This work was supported by a French government grant managed by the Agence Nationale de la Recherche under the France 2030 program (project CLIMArcTIC (grant no. ANR-22-POCE-0005)).
This research has been supported by the Agence Nationale de la Recherche (Climarctic grant).
This paper was edited by Mathilde Hagens and reviewed by Stephen Kelly and Nadja Steiner.
Ardyna, M. and Arrigo, K. R.: Phytoplankton dynamics in a changing Arctic Ocean, Nat. Clim. Change, 10, 892–903, https://doi.org/10.1038/s41558-020-0905-y, 2020.
Ardyna, M., Babin, M., Gosselin, M., Devred, E., Rainville, L., and Tremblay, J.-É.: Recent Arctic Ocean sea ice loss triggers novel fall phytoplankton blooms, Geophys. Res. Lett., 41, 6207–6212, https://doi.org/10.1002/2014GL061047, 2014.
Arrigo, K. R. and van Dijken, G. L.: Secular trends in Arctic Ocean net primary production, J. Geophys. Res.-Oceans, 116, https://doi.org/10.1029/2011JC007151, 2011.
Arrigo, K. R. and van Dijken, G. L.: Continued increases in Arctic Ocean primary production, Prog. Oceanogr., 136, 60–70, https://doi.org/10.1016/j.pocean.2015.05.002, 2015.
Bentsen, M., Bethke, I., Debernard, J. B., Iversen, T., Kirkevåg, A., Seland, Ø., Drange, H., Roelandt, C., Seierstad, I. A., Hoose, C., and Kristjánsson, J. E.: The Norwegian Earth System Model, NorESM1-M – Part 1: Description and basic evaluation of the physical climate, Geosci. Model Dev., 6, 687–720, https://doi.org/10.5194/gmd-6-687-2013, 2013.
Bopp, L., Aumont, O., Cadule, P., Alvain, S., and Gehlen, M.: Response of diatoms distribution to global warming and potential implications: A global model study, Geophys. Res. Lett., 32, https://doi.org/10.1029/2005GL023653, 2005.
Bopp, L., Resplandy, L., Orr, J. C., Doney, S. C., Dunne, J. P., Gehlen, M., Halloran, P., Heinze, C., Ilyina, T., Séférian, R., Tjiputra, J., and Vichi, M.: Multiple stressors of ocean ecosystems in the 21st century: projections with CMIP5 models, Biogeosciences, 10, 6225–6245, https://doi.org/10.5194/bg-10-6225-2013, 2013.
Boucher, O., Servonnat, J., Albright, A. L., Aumont, O., Balkanski, Y., Bastrikov, V., Bekki, S., Bonnet, R., Bony, S., Bopp, L., Braconnot, P., Brockmann, P., Cadule, P., Caubel, A., Cheruy, F., Codron, F., Cozic, A., Cugnet, D., D'Andrea, F., Davini, P., Lavergne, C. de, Denvil, S., Deshayes, J., Devilliers, M., Ducharne, A., Dufresne, J.-L., Dupont, E., Éthé, C., Fairhead, L., Falletti, L., Flavoni, S., Foujols, M.-A., Gardoll, S., Gastineau, G., Ghattas, J., Grandpeix, J.-Y., Guenet, B., Lionel, E. G., Guilyardi, E., Guimberteau, M., Hauglustaine, D., Hourdin, F., Idelkadi, A., Joussaume, S., Kageyama, M., Khodri, M., Krinner, G., Lebas, N., Levavasseur, G., Lévy, C., Li, L., Lott, F., Lurton, T., Luyssaert, S., Madec, G., Madeleine, J.-B., Maignan, F., Marchand, M., Marti, O., Mellul, L., Meurdesoif, Y., Mignot, J., Musat, I., Ottlé, C., Peylin, P., Planton, Y., Polcher, J., Rio, C., Rochetin, N., Rousset, C., Sepulchre, P., Sima, A., Swingedouw, D., Thiéblemont, R., Traore, A. K., Vancoppenolle, M., Vial, J., Vialard, J., Viovy, N., and Vuichard, N.: Presentation and Evaluation of the IPSL-CM6A-LR Climate Model, J. Adv. Model. Earth Syst., 12, e2019MS002010, https://doi.org/10.1029/2019MS002010, 2020.
Browning, T. J. and Moore, C. M.: Global analysis of ocean phytoplankton nutrient limitation reveals high prevalence of co-limitation, Nat. Commun., 14, 5014, https://doi.org/10.1038/s41467-023-40774-0, 2023.
Christian, J. R., Denman, K. L., Hayashida, H., Holdsworth, A. M., Lee, W. G., Riche, O. G. J., Shao, A. E., Steiner, N., and Swart, N. C.: Ocean biogeochemistry in the Canadian Earth System Model version 5.0.3: CanESM5 and CanESM5-CanOE, Geosci. Model Dev., 15, 4393–4424, https://doi.org/10.5194/gmd-15-4393-2022, 2022.
Collins, W. J., Bellouin, N., Doutriaux-Boucher, M., Gedney, N., Halloran, P., Hinton, T., Hughes, J., Jones, C. D., Joshi, M., Liddicoat, S., Martin, G., O'Connor, F., Rae, J., Senior, C., Sitch, S., Totterdell, I., Wiltshire, A., and Woodward, S.: Development and evaluation of an Earth-System model – HadGEM2, Geosci. Model Dev., 4, 1051–1075, https://doi.org/10.5194/gmd-4-1051-2011, 2011.
Danabasoglu, G., Lamarque, J.-F., Bacmeister, J., Bailey, D. A., DuVivier, A. K., Edwards, J., Emmons, L. K., Fasullo, J., Garcia, R., Gettelman, A., Hannay, C., Holland, M. M., Large, W. G., Lauritzen, P. H., Lawrence, D. M., Lenaerts, J. T. M., Lindsay, K., Lipscomb, W. H., Mills, M. J., Neale, R., Oleson, K. W., Otto-Bliesner, B., Phillips, A. S., Sacks, W., Tilmes, S., van Kampenhout, L., Vertenstein, M., Bertini, A., Dennis, J., Deser, C., Fischer, C., Fox-Kemper, B., Kay, J. E., Kinnison, D., Kushner, P. J., Larson, V. E., Long, M. C., Mickelson, S., Moore, J. K., Nienhouse, E., Polvani, L., Rasch, P. J., and Strand, W. G.: The Community Earth System Model Version 2 (CESM2), J. Adv. Model. Earth Syst., 12, e2019MS001916, https://doi.org/10.1029/2019MS001916, 2020.
Doney, S. C.: Phytoplankton in a warmer world, Nature, 444, 695–696, 2006.
Dufresne, J.-L., Foujols, M.-A., Denvil, S., Caubel, A., Marti, O., Aumont, O., Balkanski, Y., Bekki, S., Bellenger, H., Benshila, R., Bony, S., Bopp, L., Braconnot, P., Brockmann, P., Cadule, P., Cheruy, F., Codron, F., Cozic, A., Cugnet, D., de Noblet, N., Duvel, J.-P., Ethé, C., Fairhead, L., Fichefet, T., Flavoni, S., Friedlingstein, P., Grandpeix, J.-Y., Guez, L., Guilyardi, E., Hauglustaine, D., Hourdin, F., Idelkadi, A., Ghattas, J., Joussaume, S., Kageyama, M., Krinner, G., Labetoulle, S., Lahellec, A., Lefebvre, M.-P., Lefevre, F., Levy, C., Li, Z. X., Lloyd, J., Lott, F., Madec, G., Mancip, M., Marchand, M., Masson, S., Meurdesoif, Y., Mignot, J., Musat, I., Parouty, S., Polcher, J., Rio, C., Schulz, M., Swingedouw, D., Szopa, S., Talandier, C., Terray, P., Viovy, N., and Vuichard, N.: Climate change projections using the IPSL-CM5 Earth System Model: from CMIP3 to CMIP5, Clim. Dynam., 40, 2123–2165, https://doi.org/10.1007/s00382-012-1636-1, 2013.
Dunne, J. P., John, J. G., Adcroft, A. J., Griffies, S. M., Hallberg, R. W., Shevliakova, E., Stouffer, R. J., Cooke, W., Dunne, K. A., Harrison, M. J., Krasting, J. P., Malyshev, S. L., Milly, P. C. D., Phillipps, P. J., Sentman, L. T., Samuels, B. L., Spelman, M. J., Winton, M., Wittenberg, A. T., and Zadeh, N.: GFDL's ESM2 Global Coupled Climate–Carbon Earth System Models. Part I: Physical Formulation and Baseline Simulation Characteristics, J. Climate, https://doi.org/10.1175/JCLI-D-11-00560.1, 2012.
Dunne, J. P., Horowitz, L. W., Adcroft, A. J., Ginoux, P., Held, I. M., John, J. G., Krasting, J. P., Malyshev, S., Naik, V., Paulot, F., Shevliakova, E., Stock, C. A., Zadeh, N., Balaji, V., Blanton, C., Dunne, K. A., Dupuis, C., Durachta, J., Dussin, R., Gauthier, P. P. G., Griffies, S. M., Guo, H., Hallberg, R. W., Harrison, M., He, J., Hurlin, W., McHugh, C., Menzel, R., Milly, P. C. D., Nikonov, S., Paynter, D. J., Ploshay, J., Radhakrishnan, A., Rand, K., Reichl, B. G., Robinson, T., Schwarzkopf, D. M., Sentman, L. T., Underwood, S., Vahlenkamp, H., Winton, M., Wittenberg, A. T., Wyman, B., Zeng, Y., and Zhao, M.: The GFDL Earth System Model Version 4.1 (GFDL-ESM 4.1): Overall Coupled Model Description and Simulation Characteristics, J. Adv. Model. Earth Syst., 12, e2019MS002015, https://doi.org/10.1029/2019MS002015, 2020.
Earth System Grid Federation (ESGF): https://esgf.llnl.gov/, last access: December 2025.
Embury, O. and Good, S. A.: ESA Sea Surface Temperature Climate Change Initiative (SST_cci): Climatology product, version 3.0, CEDA [data set], https://doi.org/10.5285/62800d3d2227449085b430b503d36b01, 2024.
EUMETSAT OSI SAF: Global Sea Ice Concentration Climate Data Record v3.0 – Multimission, V.3., EUMETSAT [data set], https://doi.org/10.15770/EUM_SAF_OSI_0013, 2022.
Eyring, V., Bony, S., Meehl, G. A., Senior, C. A., Stevens, B., Stouffer, R. J., and Taylor, K. E.: Overview of the Coupled Model Intercomparison Project Phase 6 (CMIP6) experimental design and organization, Geosci. Model Dev., 9, 1937–1958, https://doi.org/10.5194/gmd-9-1937-2016, 2016.
Fogli, P. G. and Iovino, D.: CMCC–CESM–NEMO: Toward the New CMCC Earth System Model, CMCC Research Paper No. 248, https://doi.org/10.2139/ssrn.2603176, 2014.
Fu, W., Randerson, J. T., and Moore, J. K.: Climate change impacts on net primary production (NPP) and export production (EP) regulated by increasing stratification and phytoplankton community structure in the CMIP5 models, Biogeosciences, 13, 5151–5170, https://doi.org/10.5194/bg-13-5151-2016, 2016.
Garcia, H. E., Boyer, T. P., Baranova, O. K., Locarnini, R. A., Mishonov, A. V., Grodsky, A., Paver, C. R., Weathers, K. W., Smolyar, I. V., Reagan, J. R., Seidov, D., and Zveng, M. M.: World Ocean Atlas 2018: Product Documentation, NOAA National Centers for Environmental Information, https://doi.org/10.25923/tzyw-rp36, 2019.
Gettelman, A., Mills, M. J., Kinnison, D. E., Garcia, R. R., Smith, A. K., Marsh, D. R., Tilmes, S., Vitt, F., Bardeen, C. G., McInerny, J., Liu, H.-L., Solomon, S. C., Polvani, L. M., Emmons, L. K., Lamarque, J.-F., Richter, J. H., Glanville, A. S., Bacmeister, J. T., Phillips, A. S., Neale, R. B., Simpson, I. R., DuVivier, A. K., Hodzic, A., and Randel, W. J.: The whole atmosphere community climate model version 6 (WACCM6), J. Geophys. Res.-Atmos., 124, 12380–12403, https://doi.org/10.1029/2019JD030943, 2019.
Gibson, G., Weijer, W., Jeffery, N., and Wang, S.: Relative Impact of Sea Ice and Temperature Changes on Arctic Marine Production, J. Geophys. Res.-Biogeo., 125, e2019JG005343, https://doi.org/10.1029/2019JG005343, 2020.
Grebmeier, J. M., Moore, S. E., Overland, J. E., Frey, K. E., and Gradinger, R.: Biological Response to Recent Pacific Arctic Sea Ice Retreats, Eos Trans. Am. Geophys. Union, 91, 161–162, https://doi.org/10.1029/2010EO180001, 2010.
Gregg, W. W. and Rousseaux, C. S.: Global ocean primary production trends in the modern ocean color satellite record (1998–2015), Environ. Res. Lett., 14, 124011, https://doi.org/10.1088/1748-9326/ab4667, 2019.
Hahn, L. C., Armour, K. C., Zelinka, M. D., Bitz, C. M., and Donohoe, A.: Contributions to Polar Amplification in CMIP5 and CMIP6 Models, Front. Earth Sci., 9, https://doi.org/10.3389/feart.2021.710036, 2021.
Hajima, T., Watanabe, M., Yamamoto, A., Tatebe, H., Noguchi, M. A., Abe, M., Ohgaito, R., Ito, A., Yamazaki, D., Okajima, H., Ito, A., Takata, K., Ogochi, K., Watanabe, S., and Kawamiya, M.: Development of the MIROC-ES2L Earth system model and the evaluation of biogeochemical processes and feedbacks, Geosci. Model Dev., 13, 2197–2244, https://doi.org/10.5194/gmd-13-2197-2020, 2020.
Haug, T., Bogstad, B., Chierici, M., Gjøsæter, H., Hallfredsson, E., Høines, Å., Hoel, A. H., Ingvaldsen, R., Jørgensen, L., Knutsen, T., Loeng, H., Naustvoll, L., Røttingen, I., and Sunnanå, K.: Future harvest of living resources in the Arctic Ocean north of the Nordic and Barents Seas: A review of possibilities and constraints, Fish. Res., 188, 38–57, https://doi.org/10.1016/j.fishres.2016.12.002, 2017.
Hegseth, E. N. and Sundfjord, A.: Intrusion and blooming of Atlantic phytoplankton species in the high Arctic, J. Mar. Syst., 74, 108–119, https://doi.org/10.1016/j.jmarsys.2007.11.011, 2008.
Ilyina, T., Six, K. D., Segschneider, J., Maier-Reimer, E., Li, H., and Núñez-Riboni, I.: Global ocean biogeochemistry model HAMOCC: Model architecture and performance as component of the MPI-Earth system model in different CMIP5 experimental realizations, J. Adv. Model. Earth Sy., 5, 287–315, https://doi.org/10.1029/2012MS000178, 2013.
Kwiatkowski, L., Torres, O., Bopp, L., Aumont, O., Chamberlain, M., Christian, J. R., Dunne, J. P., Gehlen, M., Ilyina, T., John, J. G., Lenton, A., Li, H., Lovenduski, N. S., Orr, J. C., Palmieri, J., Santana-Falcón, Y., Schwinger, J., Séférian, R., Stock, C. A., Tagliabue, A., Takano, Y., Tjiputra, J., Toyama, K., Tsujino, H., Watanabe, M., Yamamoto, A., Yool, A., and Ziehn, T.: Twenty-first century ocean warming, acidification, deoxygenation, and upper-ocean nutrient and primary production decline from CMIP6 model projections, Biogeosciences, 17, 3439–3470, https://doi.org/10.5194/bg-17-3439-2020, 2020.
Lannuzel, D., Tedesco, L., van Leeuwe, M., Campbell, K., Flores, H., Delille, B., Miller, L., Stefels, J., Assmy, P., Bowman, J., Brown, K., Castellani, G., Chierici, M., Crabeck, O., Damm, E., Else, B., Fransson, A., Fripiat, F., Geilfus, N.-X., Jacques, C., Jones, E., Kaartokallio, H., Kotovitch, M., Meiners, K., Moreau, S., Nomura, D., Peeken, I., Rintala, J.-M., Steiner, N., Tison, J.-L., Vancoppenolle, M., Van der Linden, F., Vichi, M., and Wongpan, P.: The future of Arctic sea-ice biogeochemistry and ice-associated ecosystems, Nat. Clim. Change, 10, 983–992, https://doi.org/10.1038/s41558-020-00940-4, 2020.
Laufkötter, C., Vogt, M., Gruber, N., Aita-Noguchi, M., Aumont, O., Bopp, L., Buitenhuis, E., Doney, S. C., Dunne, J., Hashioka, T., Hauck, J., Hirata, T., John, J., Le Quéré, C., Lima, I. D., Nakano, H., Seferian, R., Totterdell, I., Vichi, M., and Völker, C.: Drivers and uncertainties of future global marine primary production in marine ecosystem models, Biogeosciences, 12, 6955–6984, https://doi.org/10.5194/bg-12-6955-2015, 2015.
Lebrun, M., Vancoppenolle, M., Madec, G., and Massonnet, F.: Arctic sea-ice-free season projected to extend into autumn, The Cryosphere, 13, 79–96, https://doi.org/10.5194/tc-13-79-2019, 2019.
Lebrun, M., Vancoppenolle, M., Madec, G., Babin, M., Becu, G., Lourenço, A., Nomura, D., Vivier, F., and Delille, B.: Light Under Arctic Sea Ice in Observations and Earth System Models, J. Geophys. Res.-Oceans, 128, e2021JC018161, https://doi.org/10.1029/2021JC018161, 2023.
Leu, E., Søreide, J. E., Hessen, D. O., Falk-Petersen, S., and Berge, J.: Consequences of changing sea-ice cover for primary and secondary producers in the European Arctic shelf seas: Timing, quantity, and quality, Prog. Oceanogr., 90, 18–32, https://doi.org/10.1016/j.pocean.2011.02.004, 2011.
Lewis, K. M., van Dijken, G. L., and Arrigo, K. R.: Changes in phytoplankton concentration now drive increased Arctic Ocean primary production, Science, 369, 198–202, https://doi.org/10.1126/science.aay8380, 2020.
Malik, I. H. and Ford, J. D.: Understanding the Impacts of Arctic Climate Change Through the Lens of Political Ecology, WIREs Clim. Change, 16, e927, https://doi.org/10.1002/wcc.927, 2025.
Manizza, M., Carroll, D., Menemenlis, D., Zhang, H., and Miller, C. E.: Modeling the Recent Changes of Phytoplankton Blooms Dynamics in the Arctic Ocean, J. Geophys. Res.-Oceans, 128, e2022JC019152, https://doi.org/10.1029/2022JC019152, 2023.
Marinov, I., Doney, S. C., and Lima, I. D.: Response of ocean phytoplankton community structure to climate change over the 21st century: partitioning the effects of nutrients, temperature and light, Biogeosciences, 7, 3941–3959, https://doi.org/10.5194/bg-7-3941-2010, 2010.
Mauritsen, T., Bader, J., Becker, T., Behrens, J., Bittner, M., Brokopf, R., Brovkin, V., Claussen, M., Crueger, T., Esch, M., Fast, I., Fiedler, S., Fläschner, D., Gayler, V., Giorgetta, M., Goll, D. S., Haak, H., Hagemann, S., Hedemann, C., Hohenegger, C., Ilyina, T., Jahns, T., Jimenéz-de-la-Cuesta, D., Jungclaus, J., Kleinen, T., Kloster, S., Kracher, D., Kinne, S., Kleberg, D., Lasslop, G., Kornblueh, L., Marotzke, J., Matei, D., Meraner, K., Mikolajewicz, U., Modali, K., Möbis, B., Müller, W. A., Nabel, J. E. M. S., Nam, C. C. W., Notz, D., Nyawira, S.-S., Paulsen, H., Peters, K., Pincus, R., Pohlmann, H., Pongratz, J., Popp, M., Raddatz, T. J., Rast, S., Redler, R., Reick, C. H., Rohrschneider, T., Schemann, V., Schmidt, H., Schnur, R., Schulzweida, U., Six, K. D., Stein, L., Stemmler, I., Stevens, B., von Storch, J.-S., Tian, F., Voigt, A., Vrese, P., Wieners, K.-H., Wilkenskjeld, S., Winkler, A., and Roeckner, E.: Developments in the MPI-M Earth System Model version 1.2 (MPI-ESM1.2) and Its Response to Increasing CO2, J. Adv. Model. Earth Syst., 11, 998–1038, https://doi.org/10.1029/2018MS001400, 2019.
McCrystall, M. R., Stroeve, J., Serreze, M., Forbes, B. C., and Screen, J. A.: New climate models reveal faster and larger increases in Arctic precipitation than previously projected, Nat. Commun., 12, 6765, https://doi.org/10.1038/s41467-021-27031-y, 2021.
Meinshausen, M., Nicholls, Z. R. J., Lewis, J., Gidden, M. J., Vogel, E., Freund, M., Beyerle, U., Gessner, C., Nauels, A., Bauer, N., Canadell, J. G., Daniel, J. S., John, A., Krummel, P. B., Luderer, G., Meinshausen, N., Montzka, S. A., Rayner, P. J., Reimann, S., Smith, S. J., van den Berg, M., Velders, G. J. M., Vollmer, M. K., and Wang, R. H. J.: The shared socio-economic pathway (SSP) greenhouse gas concentrations and their extensions to 2500, Geosci. Model Dev., 13, 3571–3605, https://doi.org/10.5194/gmd-13-3571-2020, 2020.
Moore, J. K., Lindsay, K., Doney, S. C., Long, M. C., and Misumi, K.: Marine Ecosystem Dynamics and Biogeochemical Cycling in the Community Earth System Model [CESM1(BGC)]: Comparison of the 1990s with the 2090s under the RCP4.5 and RCP8.5 Scenarios, J. Climate, https://doi.org/10.1175/JCLI-D-12-00566.1, 2013.
Mudryk, L. R., Dawson, J., Howell, S. E. L., Derksen, C., Zagon, T. A., and Brady, M.: Impact of 1, 2 and 4 °C of global warming on ship navigation in the Canadian Arctic, Nat. Clim. Change, 11, 673–679, https://doi.org/10.1038/s41558-021-01087-6, 2021.
Nakamura, Y. and Oka, A.: CMIP5 model analysis of future changes in ocean net primary production focusing on differences among individual oceans and models, J. Oceanogr., 75, 441–462, https://doi.org/10.1007/s10872-019-00513-w, 2019.
Neukermans, G., Oziel, L., and Babin, M.: Increased intrusion of warming Atlantic water leads to rapid expansion of temperate phytoplankton in the Arctic, Glob. Change Biol., 24, 2545–2553, https://doi.org/10.1111/gcb.14075, 2018.
Notz, D. and Community, S.: Arctic Sea Ice in CMIP6, Geophys. Res. Lett., 47, e2019GL086749, https://doi.org/10.1029/2019GL086749, 2020.
Oziel, L., Gürses, Ö., Torres-Valdés, S., Hoppe, C. J. M., Rost, B., Karakuş, O., Danek, C., Koch, B. P., Nissen, C., Koldunov, N., Wang, Q., Völker, C., Iversen, M., Juhls, B., and Hauck, J.: Climate change and terrigenous inputs decrease the efficiency of the future Arctic Ocean's biological carbon pump, Nat. Clim. Change, 15, 171–179, https://doi.org/10.1038/s41558-024-02233-6, 2025.
Pabi, S., van Dijken, G. L., and Arrigo, K. R.: Primary production in the Arctic Ocean, 1998–2006, J. Geophys. Res.-Oceans, 113, https://doi.org/10.1029/2007JC004578, 2008.
Popova, E. E., Yool, A., Coward, A. C., Aksenov, Y. K., Alderson, S. G., de Cuevas, B. A., and Anderson, T. R.: Control of primary production in the Arctic by nutrients and light: insights from a high resolution ocean general circulation model, Biogeosciences, 7, 3569–3591, https://doi.org/10.5194/bg-7-3569-2010, 2010.
Randelhoff, A., Holding, J., Janout, M., Sejr, M. K., Babin, M., Tremblay, J.-É., and Alkire, M. B.: Pan-Arctic Ocean Primary Production Constrained by Turbulent Nitrate Fluxes, Front. Mar. Sci., 7, https://doi.org/10.3389/fmars.2020.00150, 2020.
Rantanen, M., Karpechko, A. Y., Lipponen, A., Nordling, K., Hyvärinen, O., Ruosteenoja, K., Vihma, T., and Laaksonen, A.: The Arctic has warmed nearly four times faster than the globe since 1979, Commun. Earth Environ., 3, 168, https://doi.org/10.1038/s43247-022-00498-3, 2022.
Rohr, T., Richardson, A. J., Lenton, A., Chamberlain, M. A., and Shadwick, E. H.: Zooplankton grazing is the largest source of uncertainty for marine carbon cycling in CMIP6 models, Commun. Earth Environ., 4, 212, https://doi.org/10.1038/s43247-023-00871-w, 2023.
Sarmiento, J. L.: Ocean Biogeochemical Dynamics, in: Ocean Biogeochemical Dynamics, Princeton University Press, https://doi.org/10.1515/9781400849079, 2013.
Sarthou, G., Timmermans, K. R., Blain, S., and Tréguer, P.: Growth physiology and fate of diatoms in the ocean: a review, J. Sea Res., 53, 25–42, https://doi.org/10.1016/j.seares.2004.01.007, 2005.
Schulzweida, U.: CDO User Guide, Zenodo, https://doi.org/10.5281/zenodo.10020800, 2023.
Séférian, R., Nabat, P., Michou, M., Saint-Martin, D., Voldoire, A., Colin, J., Decharme, B., Delire, C., Berthet, S., Chevallier, M., Sénési, S., Franchisteguy, L., Vial, J., Mallet, M., Joetzjer, E., Geoffroy, O., Guérémy, J.-F., Moine, M.-P., Msadek, R., Ribes, A., Rocher, M., Roehrig, R., Salas-y-Mélia, D., Sanchez, E., Terray, L., Valcke, S., Waldman, R., Aumont, O., Bopp, L., Deshayes, J., Éthé, C., and Madec, G.: Evaluation of CNRM Earth System Model, CNRM-ESM2-1: Role of Earth System Processes in Present-Day and Future Climate, J. Adv. Model. Earth Syst., 11, 4182–4227, https://doi.org/10.1029/2019MS001791, 2019.
Sellar, A. A., Jones, C. G., Mulcahy, J. P., Tang, Y., Yool, A., Wiltshire, A., O'Connor, F. M., Stringer, M., Hill, R., Palmieri, J., Woodward, S., de Mora, L., Kuhlbrodt, T., Rumbold, S. T., Kelley, D. I., Ellis, R., Johnson, C. E., Walton, J., Abraham, N. L., Andrews, M. B., Andrews, T., Archibald, A. T., Berthou, S., Burke, E., Blockley, E., Carslaw, K., Dalvi, M., Edwards, J., Folberth, G. A., Gedney, N., Griffiths, P. T., Harper, A. B., Hendry, M. A., Hewitt, A. J., Johnson, B., Jones, A., Jones, C. D., Keeble, J., Liddicoat, S., Morgenstern, O., Parker, R. J., Predoi, V., Robertson, E., Siahaan, A., Smith, R. S., Swaminathan, R., Woodhouse, M. T., Zeng, G., and Zerroukat, M.: UKESM1: Description and Evaluation of the U.K. Earth System Model, J. Adv. Model. Earth Syst., 11, 4513–4558, https://doi.org/10.1029/2019MS001739, 2019.
Shu, Q., Qiao, F., Song, Z., Zhao, J., and Li, X.: Projected Freshening of the Arctic Ocean in the 21st Century, J. Geophys. Res.-Oceans, 123, 9232–9244, https://doi.org/10.1029/2018JC014036, 2018.
Steiner, N. S., Sou, T., Deal, C., Jackson, J. M., Jin, M., Popova, E., Williams, W., and Yool, A.: The future of the subsurface chlorophyll-a maximum in the Canada Basin–A model intercomparison, J. Geophys. Res.-Oceans, 121, 387–409, https://doi.org/10.1002/2015JC011232, 2016.
Swart, N. C., Cole, J. N. S., Kharin, V. V., Lazare, M., Scinocca, J. F., Gillett, N. P., Anstey, J., Arora, V., Christian, J. R., Hanna, S., Jiao, Y., Lee, W. G., Majaess, F., Saenko, O. A., Seiler, C., Seinen, C., Shao, A., Sigmond, M., Solheim, L., von Salzen, K., Yang, D., and Winter, B.: The Canadian Earth System Model version 5 (CanESM5.0.3), Geosci. Model Dev., 12, 4823–4873, https://doi.org/10.5194/gmd-12-4823-2019, 2019.
Tagliabue, A., Kwiatkowski, L., Bopp, L., Butenschön, M., Cheung, W., Lengaigne, M., and Vialard, J.: Persistent Uncertainties in Ocean Net Primary Production Climate Change Projections at Regional Scales Raise Challenges for Assessing Impacts on Ecosystem Services, Front. Clim., 3, https://doi.org/10.3389/fclim.2021.738224, 2021.
Taylor, K. E., Stouffer, R. J., and Meehl, G. A.: An Overview of CMIP5 and the Experiment Design, Bull. Am. Meteorol. Soc., 93, https://doi.org/10.1175/BAMS-D-11-00094.1, 2012.
Terhaar, J., Lauerwald, R., Regnier, P., Gruber, N., and Bopp, L.: Around one third of current Arctic Ocean primary production sustained by rivers and coastal erosion, Nat. Commun., 12, 169, https://doi.org/10.1038/s41467-020-20470-z, 2021.
Timmermans, M.-L. and Marshall, J.: Understanding Arctic Ocean Circulation: A Review of Ocean Dynamics in a Changing Climate, J. Geophys. Res.-Oceans, 125, e2018JC014378, https://doi.org/10.1029/2018JC014378, 2020.
Tjiputra, J. F., Schwinger, J., Bentsen, M., Morée, A. L., Gao, S., Bethke, I., Heinze, C., Goris, N., Gupta, A., He, Y.-C., Olivié, D., Seland, Ø., and Schulz, M.: Ocean biogeochemistry in the Norwegian Earth System Model version 2 (NorESM2), Geosci. Model Dev., 13, 2393–2431, https://doi.org/10.5194/gmd-13-2393-2020, 2020.
Tremblay, J.-E. and Gagnon, J.: The effects of irradiance and nutrient supply on the productivity of Arctic waters: A perspective on climate change, in: Influence of Climate Change on the Changing Arctic and Sub-Arctic Conditions, 73–93, https://doi.org/10.1007/978-1-4020-9460-6_7, 2009.
Vancoppenolle, M., Bopp, L., Madec, G., Dunne, J., Ilyina, T., Halloran, P. R., and Steiner, N.: Future Arctic Ocean primary productivity from CMIP5 simulations: Uncertain outcome, but consistent mechanisms, Global Biogeochem. Cy., 27, 605–619, https://doi.org/10.1002/gbc.20055, 2013.
Vincent, W. F. and Laybourn-Parry, J.: Polar Lakes and Rivers: Limnology of Arctic and Antarctic Aquatic Ecosystems, Oxford University Press, 363 pp., 2008.
Ward, B. A., Dutkiewicz, S., Jahn, O., and Follows, M. J.: A size-structured food-web model for the global ocean, Limnol. Oceanogr., 57, 1877–1891, https://doi.org/10.4319/lo.2012.57.6.1877, 2012.
Wassmann, P.: Arctic marine ecosystems in an era of rapid climate change, Prog. Oceanogr., 90, 1–17, https://doi.org/10.1016/j.pocean.2011.02.002, 2011.
Wassmann, P., Reigstad, M., Haug, T., Rudels, B., Carroll, M. L., Hop, H., Gabrielsen, G. W., Falk-Petersen, S., Denisenko, S. G., Arashkevich, E., Slagstad, D., and Pavlova, O.: Food webs and carbon flux in the Barents Sea, Prog. Oceanogr., 71, 232–287, https://doi.org/10.1016/j.pocean.2006.10.003, 2006.
Watanabe, S., Hajima, T., Sudo, K., Nagashima, T., Takemura, T., Okajima, H., Nozawa, T., Kawase, H., Abe, M., Yokohata, T., Ise, T., Sato, H., Kato, E., Takata, K., Emori, S., and Kawamiya, M.: MIROC-ESM 2010: model description and basic results of CMIP5-20c3m experiments, Geosci. Model Dev., 4, 845–872, https://doi.org/10.5194/gmd-4-845-2011, 2011.
Weijer, W., Cheng, W., Garuba, O. A., Hu, A., and Nadiga, B. T.: CMIP6 Models Predict Significant 21st Century Decline of the Atlantic Meridional Overturning Circulation, Geophys. Res. Lett., 47, e2019GL086075, https://doi.org/10.1029/2019GL086075, 2020.
Yukimoto, S., Kawai, H., Koshiro, T., Oshima, N., Yoshida, K., Urakawa, S., Tsujino, H., Deushi, M., Tanaka, T., Hosaka, M., Yabu, S., Yoshimura, H., Shindo, E., Mizuta, R., Obata, A., Adachi, Y., and Ishii, M.: The Meteorological Research Institute Earth System Model Version 2.0, MRI-ESM2.0: Description and Basic Evaluation of the Physical Component, J. Meteorol. Soc. Jpn. Ser. II, 97, 931–965, https://doi.org/10.2151/jmsj.2019-051, 2019.
Zelinka, M. D., Myers, T. A., McCoy, D. T., Po-Chedley, S., Caldwell, P. M., Ceppi, P., Klein, S. A., and Taylor, K. E.: Causes of Higher Climate Sensitivity in CMIP6 Models, Geophys. Res. Lett., 47, e2019GL085782, https://doi.org/10.1029/2019GL085782, 2020.