
the Creative Commons Attribution 4.0 License.
the Creative Commons Attribution 4.0 License.
 | 20 Jul 2026
Assessing forest biomass and productivity with data-driven vegetation indices: insights from 900 000 simulated forest stands
Rico Fischer
Andreas Huth
Vegetation indices (VIs) are widely used in remote sensing, but deriving novel VIs for estimating specific forest attributes remains challenging. Here, “data-driven” VIs, yielding information based on correlations identified in large datasets of forest and reflectance data, could help. In this study, we systematically consider simulated reflectances of temperate forests (400–2400 nm range) and evaluate their correlations to above-ground biomass, leaf area index (LAI), yearly gross primary production (GPP), and yearly net primary production (NPP) production (NPP).
Considering 900 000 forest stands simulated via a classical forest model in combination with a radiative transfer model, we found that data-driven VIs could provide highly accurate estimates for the four analyzed forest attributes. Particularly VIs combining near infrared with shortwave infrared reflectances yielded good estimates. The wavelength combinations best suited for estimating above-ground biomass, LAI, and GPP showed considerable overlap. For less dense and structurally heterogeneous forests, reflectances from the visible band gained importance.
We introduced a new class of “non-parametric” vegetation indices and compared them with linear indices in scenarios of different environmental and physiological variability. Both the functional form of the VIs as well as the variability did not primarily affect the achievable accuracy of the model estimates, rather than the range of wavelengths from which good indices could be constructed. This suggests that data-driven vegetation indices can yield valuable results if the wavelength choice is optimized. These findings open new pathways for utilizing recent hyperspectral satellite missions such as EnMAP or CHIME.
- Article
(3702 KB) - Full-text XML
-
Supplement
(2025 KB) - BibTeX
- EndNote


Temperate forests are crucial for carbon cycling and climate regulation in Central Europe, while also delivering a wide range of essential ecosystem services. However, temperate forests are also increasingly affected by climate change, which alters forest structure, productivity and species composition through rising temperatures, drought and altered disturbance regimes (Patacca et al., 2023). Therefore, monitoring the structural and functional properties of these forests is essential for understanding their current state and anticipating future changes (Coops, 2015; Ferretti et al., 2024). Key forest characteristics include (1) the above-ground biomass, needed for estimating a forest's carbon stock, (2) the leaf area index (LAI), relevant for assessing a forest's physiological processes such as tree growth or evapotranspiration, (3) the gross primary production (GPP), denoting how much carbon a forest takes up per unit of time, and (4) the net primary production (NPP), measuring the difference between GPP and autotrophic respiration in a forest per unit time.
In remote sensing, such forest characteristics are often assessed via vegetation indices computed based on forests' reflectance (Xiao et al., 2019). Many vegetation indices for analyzing forest cover and productivity consider reflectance from the red and infrared range, as leaves strongly absorb red light but reflect infrared light, making the difference between red and infrared reflectance a good indicator for leaf coverage (Zeng et al., 2022). With the start of the MODIS satellite, global data products for GPP and NPP were developed by combining these data with meteorological data and forest models (Running et al., 2004). These approaches were later extended by integrating calibration data from Eddy-Covariance measurements, which provide highly detailed information on GPP and net ecosystem exchange (NEE) at field sites (Joiner et al., 2018; Badgley et al., 2019; Xiao et al., 2019).
Although they were used as inputs in these complex analysis pipelines, vegetation indices were not originally designed to directly infer forest characteristics from reflectance data. Instead, they served as more general proxies, sometimes with well-understood limitations. For example, it remained challenging to estimate biomass from spectral data in dense forests, because the forest height, a significant driver of biomass, is difficult to infer from a forest's reflectance. Moreover, leaves in the lower canopy of dense forests only have a minor effect on a forest's reflectance, resulting in saturation effects when determining the LAI. Therefore, other methods such as LiDAR or RADAR as well as machine learning approaches deriving forest attributes from high resolution images have gained importance but are not available across the entire globe (Dubayah et al., 2022; Santoro et al., 2021; Lang et al., 2023; Mugabowindekwe et al., 2023). GPP and NPP, in turn, are influenced by dynamic physiological and environmental factors as well as canopy structure, making these variables even more challenging to derive from reflectance data than purely structural attributes. NPP is especially difficult to estimate, as it is also affected by the respiration of trees. This has led to critique of the MODIS NPP product (Turner et al., 2006; Park et al., 2021).
A pathway for revising vegetation indices is to consider information encoded in a broader spectrum of light and to develop more intricate mathematical linking functions to estimate forest characteristics directly from these data. For example, Brown (2000) included reflectance from the shortwave infrared (SWIR) range to improve estimates of the LAI. Several studies used simple mechanistic models to derive functional forms for vegetation indices to achieve accuracy in predicting GPP and other forest characteristics (Jin and Eklundh, 2014; Badgley et al., 2019; Camps-Valls et al., 2021).
The novel availability of hyperspectral data, such as from the German EnMAP (Environmental Mapping and Analysis Program) satellite launched in 2022 or the planned CHIME (Copernicus Hyperspectral Imaging Mission for the Environment) mission (Guanter et al., 2015; Qian, 2021; Storch et al., 2023), and machine learning methods allow extending such approaches. The new data and methods make it feasible to develop vegetation indices that harness more subtle relationships between forests and their reflectance spectra – including those arising from a complex interplay of ecological processes and constraints and therefore difficult to derive analytically. To infer these relationships, systematic data-driven approaches are needed.
Such an analysis needs to account for the effects of biome, site and environmental conditions, forest structure, plant traits, phenology, viewing geometry and sensor noise (Dong et al., 2024). These factors can influence which combination of wavelengths and linking function are best suited for estimating a certain forest characteristic. For example, variations in leaf chlorophyll content propagate to variations in blue and red reflectances, and may thus blur relationships between blue/red reflectance and LAI. Therefore, a particularly robust index may be needed if, e.g., the forests' phenological state is inhomogeneous. Thus, a systematic assessment of spectral robustness is needed to identify vegetation indices that are accurate and reliable under heterogeneous field and observation conditions.
The aim of this study is hence twofold. First, we provide a methodological framework for systematically evaluating data-driven two-band vegetation indices, including a novel class, which we call “parameter-free” indices. That way, we assess the potential of data-driven vegetation indices for estimating different forest characteristics. Second, we aim to determine the most informative and robust wavelength combinations for predicting biomass, LAI, yearly GPP and yearly NPP in the presence of environmental and physiological variability, and we analyze how these wavelength combinations change dependent on the density and structural complexity of the considered forests.
This analysis requires a large-scale dataset of forest and reflectance data, covering the whole set of possible forests within the range of expected environmental conditions and plant traits. Because such datasets are often not available for NPP and other forest characteristics of interest, we bridged the data gap using forest models, which already have a long and successful tradition in ecological research (Fischer et al., 2016; Rödig et al., 2018; Shugart et al., 2018; Maréchaux et al., 2021; Bugmann and Seidl, 2022). Simulation models have also been used in several remote sensing studies (see e.g. Fang, 2003; Lemaire et al., 2008; Wang et al., 2022; Dong et al., 2024). We simulated and analyze a total of 900 000 Central European forest stands along with their reflectance profiles subject to different sources of variation and noise. The resulting dataset contains reflectance data for more than 250 different wavelength channels along with corresponding forest properties and is published along with this study for further analysis.
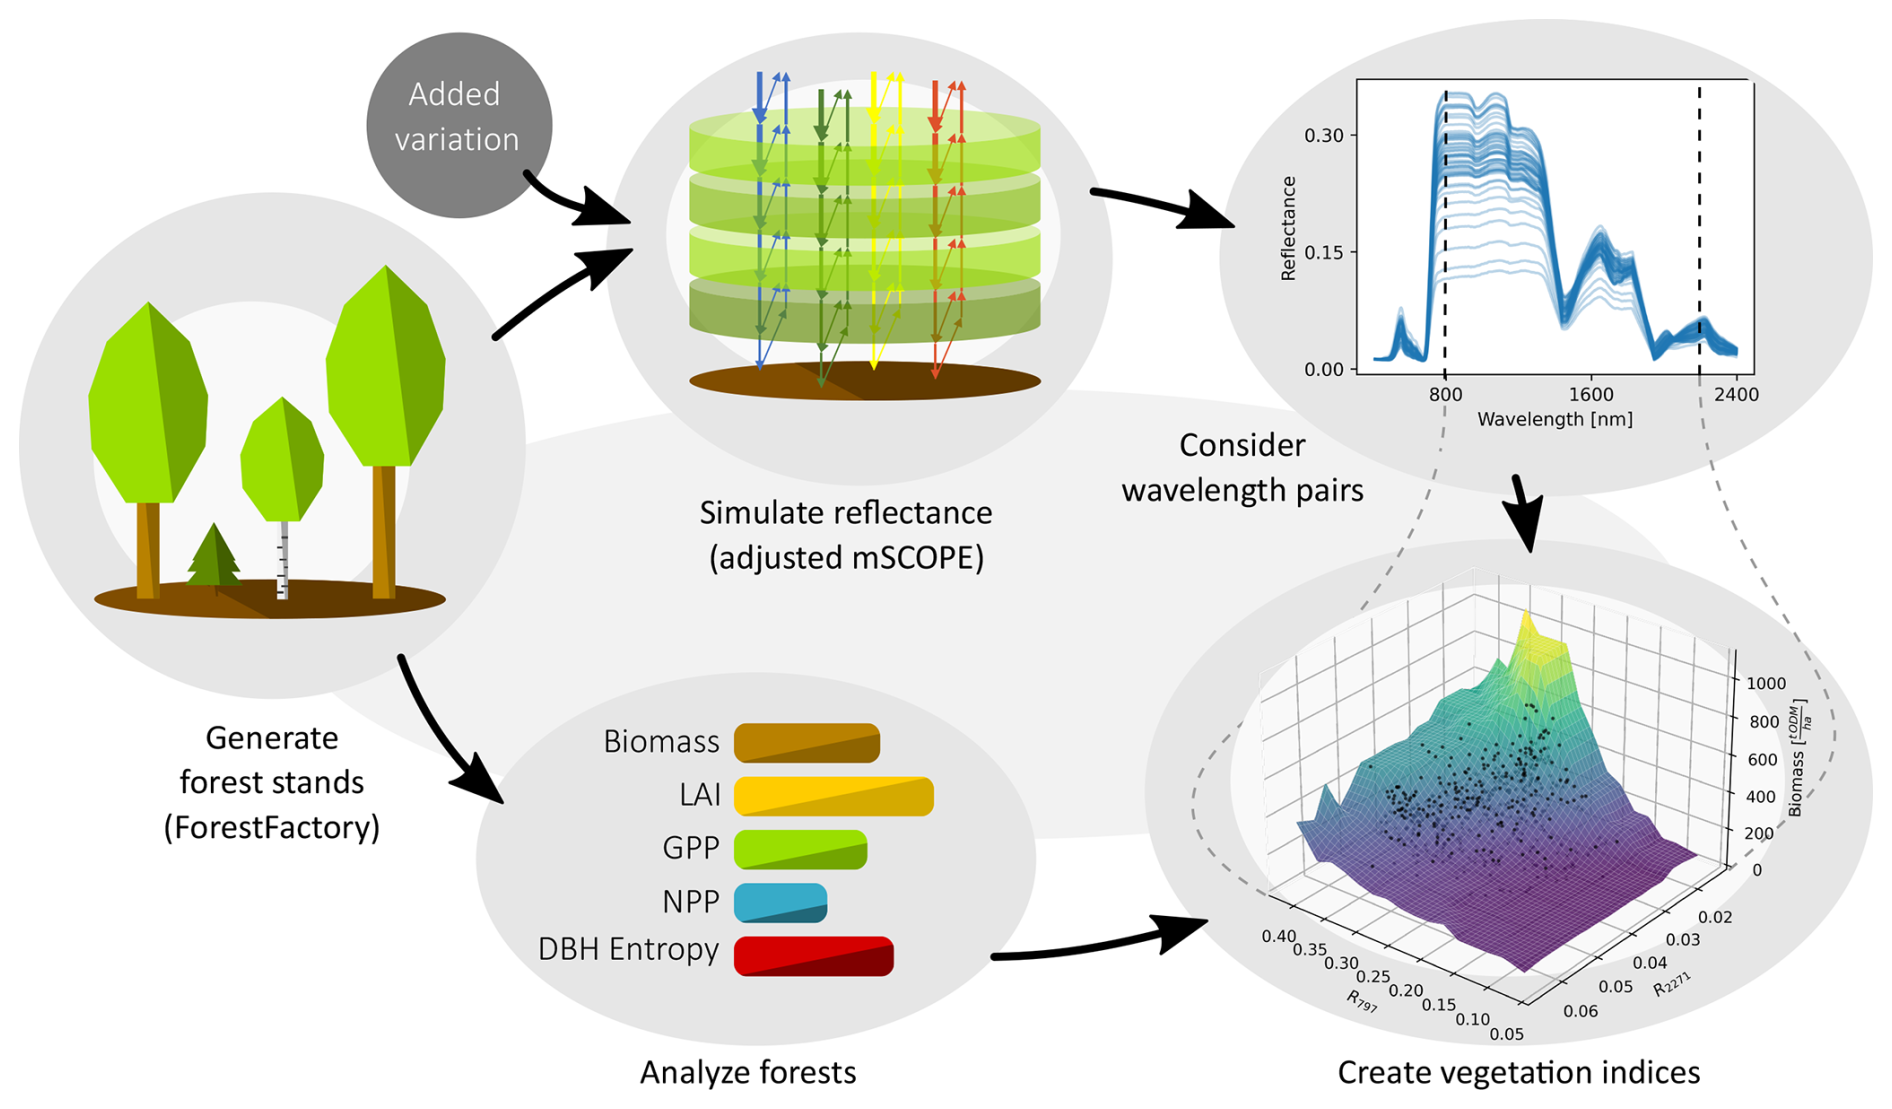
Figure 1Flow chart depicting the development of data-driven vegetation indices for biomass, leaf area index (LAI), gross primary production (GPP), and net primary production (NPP). The entropy of tree diameters (DBH entropy) is computed as measure of structural diversity to analyze the relationship between forest structure and optimal vegetation indices.
We analyzed the relationships between forests' solar reflectance spectra and their biomass, LAI, yearly GPP, and yearly NPP in scenarios with different heterogeneity of environmental and physiological parameters. For each scenario, we generated 100 000 forest states via a Markow Chain Monte Carlo (MCMC) approach applied to a forest model, and simulated the corresponding reflectance spectra using the radiative transfer model mSCOPE (Yang et al., 2017). Then we fitted linear and parameter-free models to investigate the links between the forest characteristics and the reflectance values at different wavelengths and compared their predictive capabilities to those of existing vegetation indices. To investigate how different sources of variation affect the investigated relationships, we applied variation terms to the parameters of the radiative transfer model in each scenario and analyzed their effects on the results. The process is depicted as a flow chart in Fig. 1. Below we provide details on each of these steps.
2.1 Generating forest stands
We used the process-based forest model Formind (Bohn and Huth, 2017; Fischer et al., 2024) along with a “ForestFactory” MCMC approach to generate a sample of forest stands representing the variety of forest compositions potentially found in the field, building on the work by Henniger et al. (2023b). Formind considers trees on the individual level and computes their gross and net productivity based on environmental conditions (e.g. temperature and precipitation), interactions between trees (e.g. light and water competition), as well as species-specific traits. As the model represents productivity and carbon fluxes explicitly and features both individual trees and their vertical leaf distribution, Formind is particularly suited to assess forest productivity and structure (Bohn and Huth, 2017; Fischer et al., 2024).
Before applying the model, we updated its parameterization for temperate forests in central Europe to better capture the carbon dynamics of heterogeneous forests. We considered forest inventory data collected at the “Hohes Holz” research site in central northern Germany (mean ann. temperature 10.8 °C; mean ann. precipitation 660 L m−2) and changed the temperate model parameterization (Bohn et al., 2014) in the following aspects: (1) we updated the allometric relationships according to data from Jucker et al. (2022); (2) we adjusted parameters for light climate and respiratory losses to better model the carbon dynamics in structurally heterogeneous forests; (3) we chose parameters on soil properties that matched the soil at the research site (values taken from Maidment, 1993); (4) we added the mechanistic defoliation and mortality mechanism introduced by Fischer et al. (2024); and (5) we used a new approach to consider weather data on a daily time scale whereas forest dynamics such as growth and mortality remain modelled on the yearly time scale. Details on the parameterization can be found in Sect. S5 of the Supplement. We validated the parameterization by comparing the simulated GPP, NPP, and respiration with independent estimates based on Eddy-Flux measurements (Pohl et al., 2023; see Sect. S5.3). A more in-depth validation study of an older parameterization of Formind was conducted by Holtmann et al. (2021) at the Hohes Holz site and by Rödig et al. (2017) at the Wetzstein site (Thuringia, Germany).
Typically, forest models such as Formind are initialized with existing forest inventory data or simulate forest successions starting from bare ground. However, since these simulations may not cover the entirety of forest states found in managed forests, we used a different approach here. Trees cannot survive if their GPP is insufficient to cover their respiratory needs. Hence, assuming that the GPP of any live tree found in a real forest must exceed its respiration (Bohn and Huth, 2017), we randomly assembled a sample of states satisfying this property, starting from a uniform prior of forest states.
We considered forest patches of 20 m×20 m size, for each randomly selecting a one-year sequence based on the climate at the Hohes Holz site (years 2000–2017; Muñoz Sabater, 2019). Starting from bare ground, we now randomly added or removed trees of random sizes and species. Then we computed the yearly GPP and autotrophic respiration of the forest stand given the climate sequence and evaluated whether the stand was “feasible”, i.e., (1) each tree's GPP exceeded its respiration, and (2) the tree crowns did not exceed the available space. If the stand was feasible, we repeated the tree addition/removal procedure; otherwise we returned to the last feasible state and repeated the attempt to add and remove trees until a feasible state was found.
To increase the range of qualitatively different forest stands, we used a hierarchical sampling approach when adding new trees, randomly constraining the potential tree sizes and species in some stands (Henniger et al., 2023b). Furthermore, we facilitated computational efficiency by dynamically adjusting the “step size”, i.e., the number of individual tree additions or removals between two forest feasibility checks: we started at 5 additions/removals and increased or decreased this number by factor 2 if the last five feasibility checks were positive or negative, respectively. After 200 tree additions or removals, we terminated the process. Further details regarding this approach are provided in Sect. S2.
We generated 100 000 forest stands for environmental conditions similar to those found at the Hohes Holz site. The forest stands differ, among others, in biomass, tree number, and species composition. For each stand, we computed the biomass, LAI, yearly GPP, and yearly NPP (mean values: biomass: 321 t ODM ha−1, i.e., tons organic dry matter per hactar, LAI: 3, GPP: 28.8 t ODM ha−1 yr−1, NPP: 3.4 t ODM ha−1 yr−1). Furthermore, we determined the basal-area-weighted DBH entropy for the tree size distribution (Fischer et al., 2024), which is a measure for the structural heterogeneity of forests (mean: −4.54). Here, a lower value indicates lower heterogeneity and/or stronger dominance of a single individual. We provide the formula of basal-area-weighted DBH entropy in Sect. S4. The distribution of the considered forest characteristics is visualized in Sect. S3. Lastly, we computed the forests' solar reflectance spectra using the radiative transfer model mSCOPE, as described below.
2.2 Simulating solar reflectance spectra
We simulated the solar reflectance spectra of the generated forest patches for wavelengths between 400 and 2400 nm. To that end, we used an extended version of the radiative transfer model mSCOPE, designed for application in forests with vertically heterogeneous leaf traits (Yang et al., 2017; Henniger et al., 2023a). Our extended model version adds on to the original in also considering vertically heterogeneous leaf densities. Furthermore, we adjusted the probability of observing sunflecks on the ground, as the structure and covering of the ground are difficult to model exactly.
We parameterized the radiative transfer model similar to Henniger et al. (2023a) but adjusted individual parameters based on data from the TRY plant trait database (Kattge et al., 2011). A list of the parameters can be found in Sect. S1. We set the view zenith angle to 0° and the sun zenith angle to 31.5°, corresponding to maximal zenith angle observed at the Hohes Holz site. Furthermore, we set the relative azimuth angle between sun and view direction to a value of 140° (Henniger et al., 2023a), but note that this value is only relevant if the view zenith is changed from its default 0°. We set the probability to observe direct sunlight (sunflecks) at the ground to 0, which reduced the simulated reflectance values in the visible range. This improved the agreement between model results and field observations at the study site.
We simulated forests and corresponding hyperspectral data for 9 scenarios with different dimensions of variation each. First, we considered the scenario without any parameter variations. Second, we varied the LAI input to the radiative transfer model in each simulated forest patch by a random factor from a log-uniform distribution: . Here, 𝒰(a, b) is the uniform distribution in [a,b]. Using a log-uniform multiplicative perturbation ensures that the parameters remain in the positive domain and in their respective order of magnitude.
Third, we perturbed all species' leaf trait parameters (Chlorophyll a+b content, leaf mass per unit area, equivalent water thickness, senescence material, carotenoid content) independently by random factors (log-uniform distribution). Fourth, we altered the leaf structure parameter in each patch by a random factor (log-uniform distribution), but constrained the resulting values to the admissible range [1,3] where necessary. Fifth, we changed the leaf inclination parameters by random values and constrained them to the admissible range if required. Furthermore, we normalized these parameters by their joint Euclidean norm if the norm exceeded 1.
Sixth, we drew the soil wetness parameter in each simulated patch randomly from 𝒰(0, 1). Seventh, we changed the sun and view zenith angles as well as the relative azimuth by independent random values from . Eighth, we imposed independent random perturbations to all simulated reflectance values. The perturbations followed normal distributions with mean 0 and standard deviation , where i indicates the wavelength and Ri the corresponding reflectance value. Finally, ninth, we combined all the perturbations listed above.
2.3 Analyzing vegetation indices
For each considered variation scenario, we generated 100 000 forest states with corresponding reflectance spectra and filtered out all forest states with a biomass below 50 t ODM ha−1, as the hyperspectral model was primarily designed for areas with full forest cover. This concerned less than 2 % of the forest patches. We split the datasets into 75 % training and 25 % validation data. Then we selected all possible pairs of two wavelengths and fitted a model estimating either biomass, LAI, GPP, or NPP based on the corresponding reflectance values of these wavelengths in the training data.
Here, we considered two types of models: (1) an affine-linear model of the form , where f is the forest attribute, w1 and w2 are the wavelengths, and and are the corresponding reflectance values, and (2) a parameter-free model based on regular binning of the data. The shape of parameter-free models is not given by a simple formula but directly derived from the data, making these models particularly useful for data-driven vegetation indices. To obtain the parameter-free model, we binned the data into 25 regular intervals along each wavelength axis, resulting in 625 potential bins for the tuples . Then we determined the mean value of the considered forest property in each bin and assigned this value to the middle point of this bin. That is, for a bin , we set
where ℬ is the set of all data points in the bin and |B| its cardinality. We then applied a bi-linear interpolation between these points to obtain model predictions for all other reflectance values. For reflectances outside the convex hull of the training data, we applied a nearest neighbour extrapolation based on the closest bin centre.
For both model types, we computed the Pearson R2 of each fitted model based on the validation data. Furthermore, we created heatmaps for the R2 values as function of the wavelengths. Afterwards, we determined for each forest characteristic the maximal obtained R2 and the percentage P0.9 of models achieving an R2 of at least 90 % of the maximum. We computed P0.9 by determining the surface area in the heatmap where models achieved a sufficiently large R2 and dividing it by the total surface area of all considered bands (Table 1). Specifically, we defined a function f0.9(w1,w2) with for wavelength pairs with sufficient R2 and otherwise, Then, , which we approximated via a midpoint Riemann sum (numerical integration) of f0.9 with those wavelength pairs as sampling points for which we had computed reflectance values.
To measure how important each individual band (Table 1) is for obtaining a large R2, we determined the fraction of all models that use a wavelength from the respective band and achieve a high R2 (90 % of max). We plotted this quantity (colour coded by band) along with the respective maximal R2 for each considered forest characteristic and variation scenario.
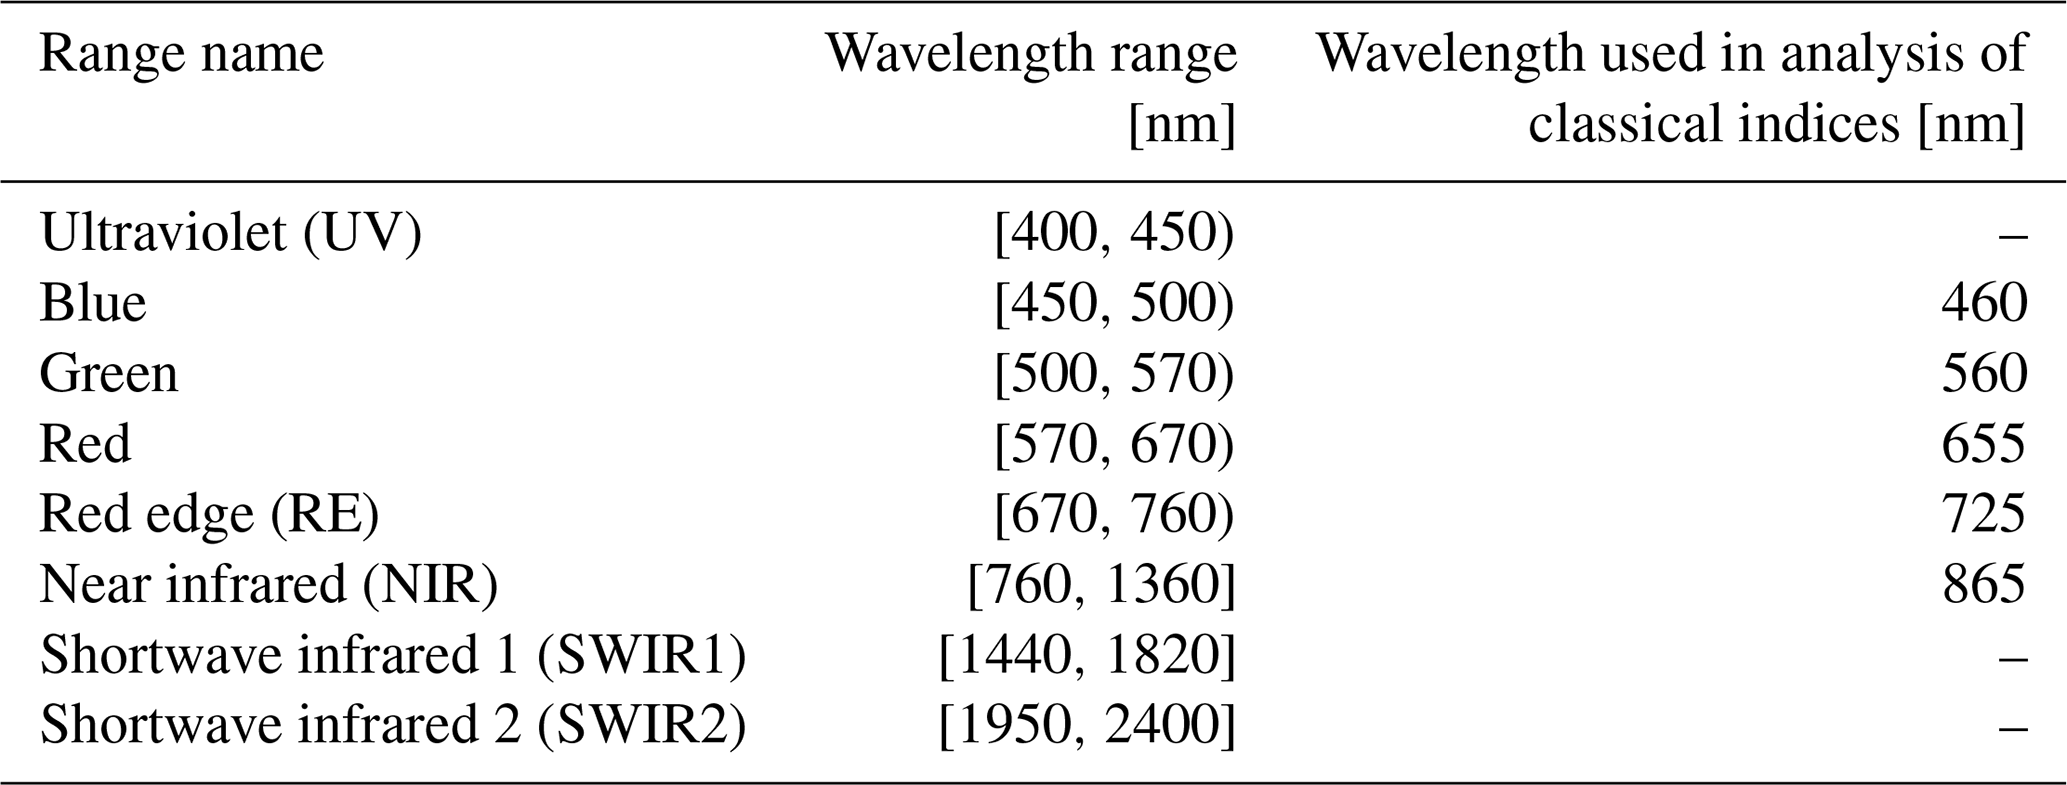
Table 1Considered wavelength ranges. The water absorption bands are excluded, as no reliable reflectance data can be obtained for these wavelengths in practice. The last column provides the wavelengths used for representing the band when analyzing classical vegetation indices (Table 2). The representing wavelengths were chosen from within the bands that existing satellite missions (MODIS, Landsat) record to represent the considered ranges.
To understand the impact of forest structure on these results, we repeated the analysis in the scenario without variations after grouping the data by forest structure. Specifically we split the forest set into sparse and dense forests (biomass below and above 200 t ODM ha−1, respectively) and structurally heterogeneous forests vs. forests dominated by few individuals (DBH entropy SDBH less or greater than −2.5, respectively; cf. Fischer et al., 2024). That way, we obtained the maximal R2 values and the most significant wavelength bands for forests with qualitatively different structural properties. To streamline our study, we focused our analysis on the NPP.
We visualized the functional form of the best models with heatmaps (scenario without variations). We set the obtained R2 values into context with existing vegetation indices by determining the correlations of classical vegetation indices with biomass, LAI, GPP, and NPP based on our simulated data without noise. Here, we considered all vegetation indices listed by Zeng et al. (2022) that use reflectances from clearly defined wavelengths or bands and do not depend on a site-specific parameterization. By squaring the correlation coefficients, we obtained the R2 values that could potentially be achieved with linear models predicting the forest properties based on the vegetation indices.
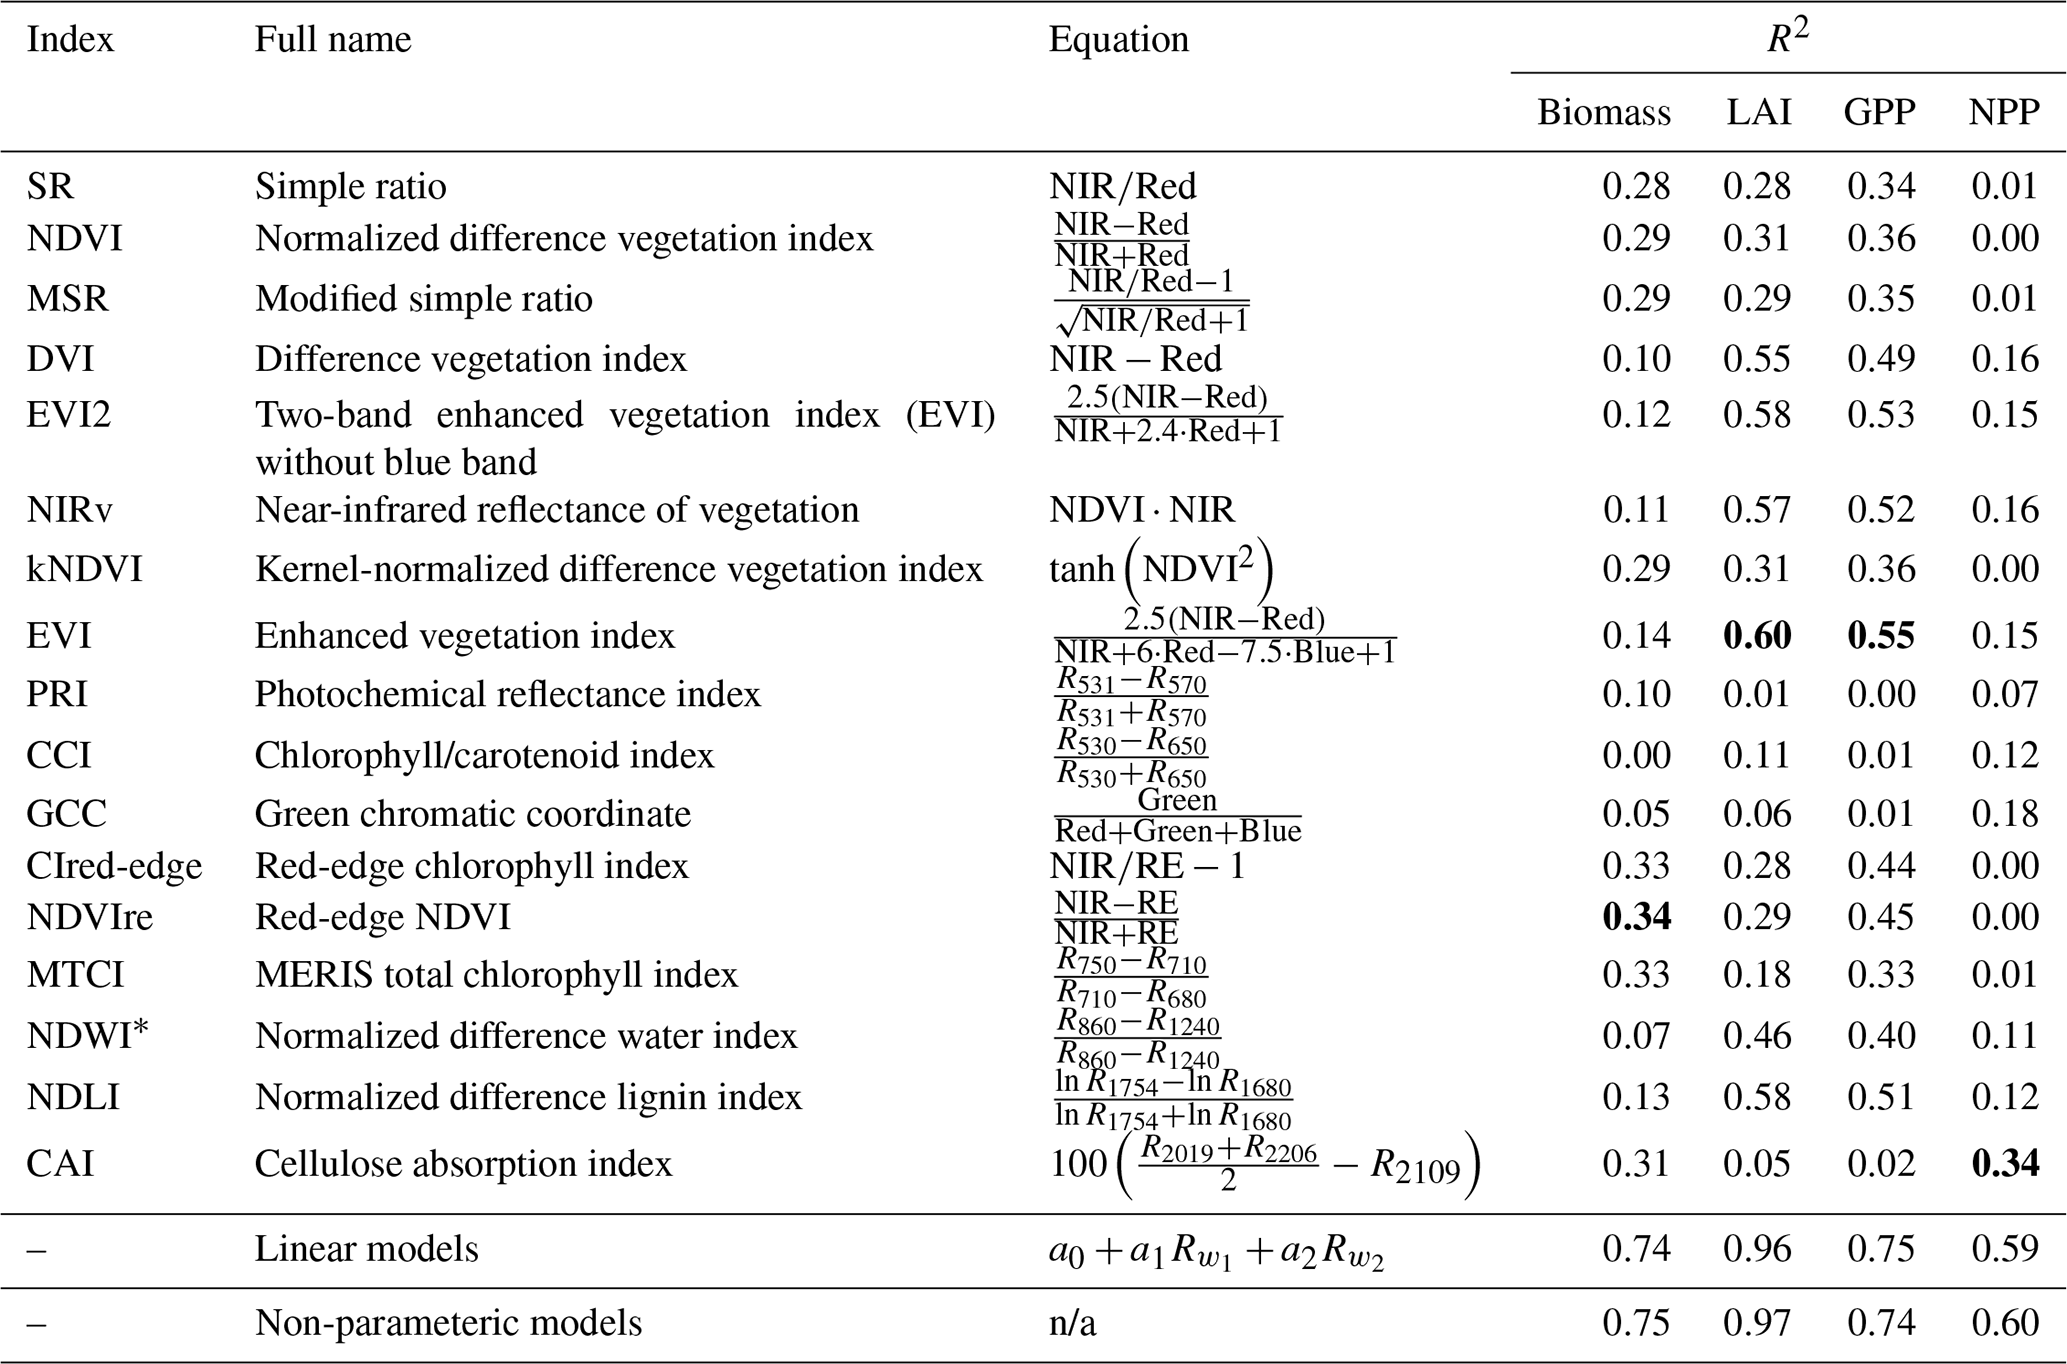
The R2 values of the analyzed classical vegetation indices and the best linear and parameter-free models are displayed in Table 2. For the scenario without variations, the new data-driven models achieve much higher R2 values than the best classical vegetation indices: 0.75 (data-driven) vs. 0.34 (NDVIre) for the biomass, 0.97 (data-driven) vs. 0.6 (EVI) for the LAI, 0.75 (data-driven) vs. 0.55 (EVI) for the GPP, and 0.6 (data-driven) vs. 0.34 (CAI) for the NPP. The maximal R2 achieved with linear models was almost equal to the value achieved with parameter-free models and in one case (GPP) even slightly higher.
Table 2Squared correlation coefficients between different forest characteristics and vegetation indices listed in Zeng et al. (2022). The bold font highlights the respective highest values in each column, excluding the values obtained by models developed in this paper, for which the best R2 values are given in the last two rows. The values were computed based on forests generated without considering environmental or physiological variations. The formulas and index names were taken from Zeng et al. (2022) with minor corrections. The specific wavelengths used for the named bands are provided in Table 1. * Note on NDWI: version by Gao (1996), not McFeeters (1996). n/a: not applicable.
While the maximal achieved R2 values were similar for linear and parameter-free models, the range P0.9 of wavelengths for which high R2 values (90 % of max.) were achieved differed and was much smaller for linear models, especially for biomass (drop by 66 %) and NPP (drop by 94 %; see Fig. 2). In the scenario without environmental or physiological variation, the biomass and LAI could be estimated best based on NIR reflectance combined with a reflectance from narrow bands from the SWIR range: one band close to the water absorption band between NIR and SWIR1, one at the centre of SWIR1, one close to the water absorption band between SWIR1 and SWIR2, and one encompassing the second half of SWIR2. These wavelength ranges were also well suited for estimating GPP, for which, however, an additional range combining green and red with NIR wavelengths yielded high R2 values as well.
NPP was best estimated based on wavelengths in the SWIR range combined with any other range. Specifically, combinations of the centre SWIR1 range with any visible or NIR wavelength, combinations of two significantly different SWIR1 wavelengths, and combinations of SWIR2 with visible wavelengths or SWIR1 wavelengths close to the first water absorption band permitted high R2 values.
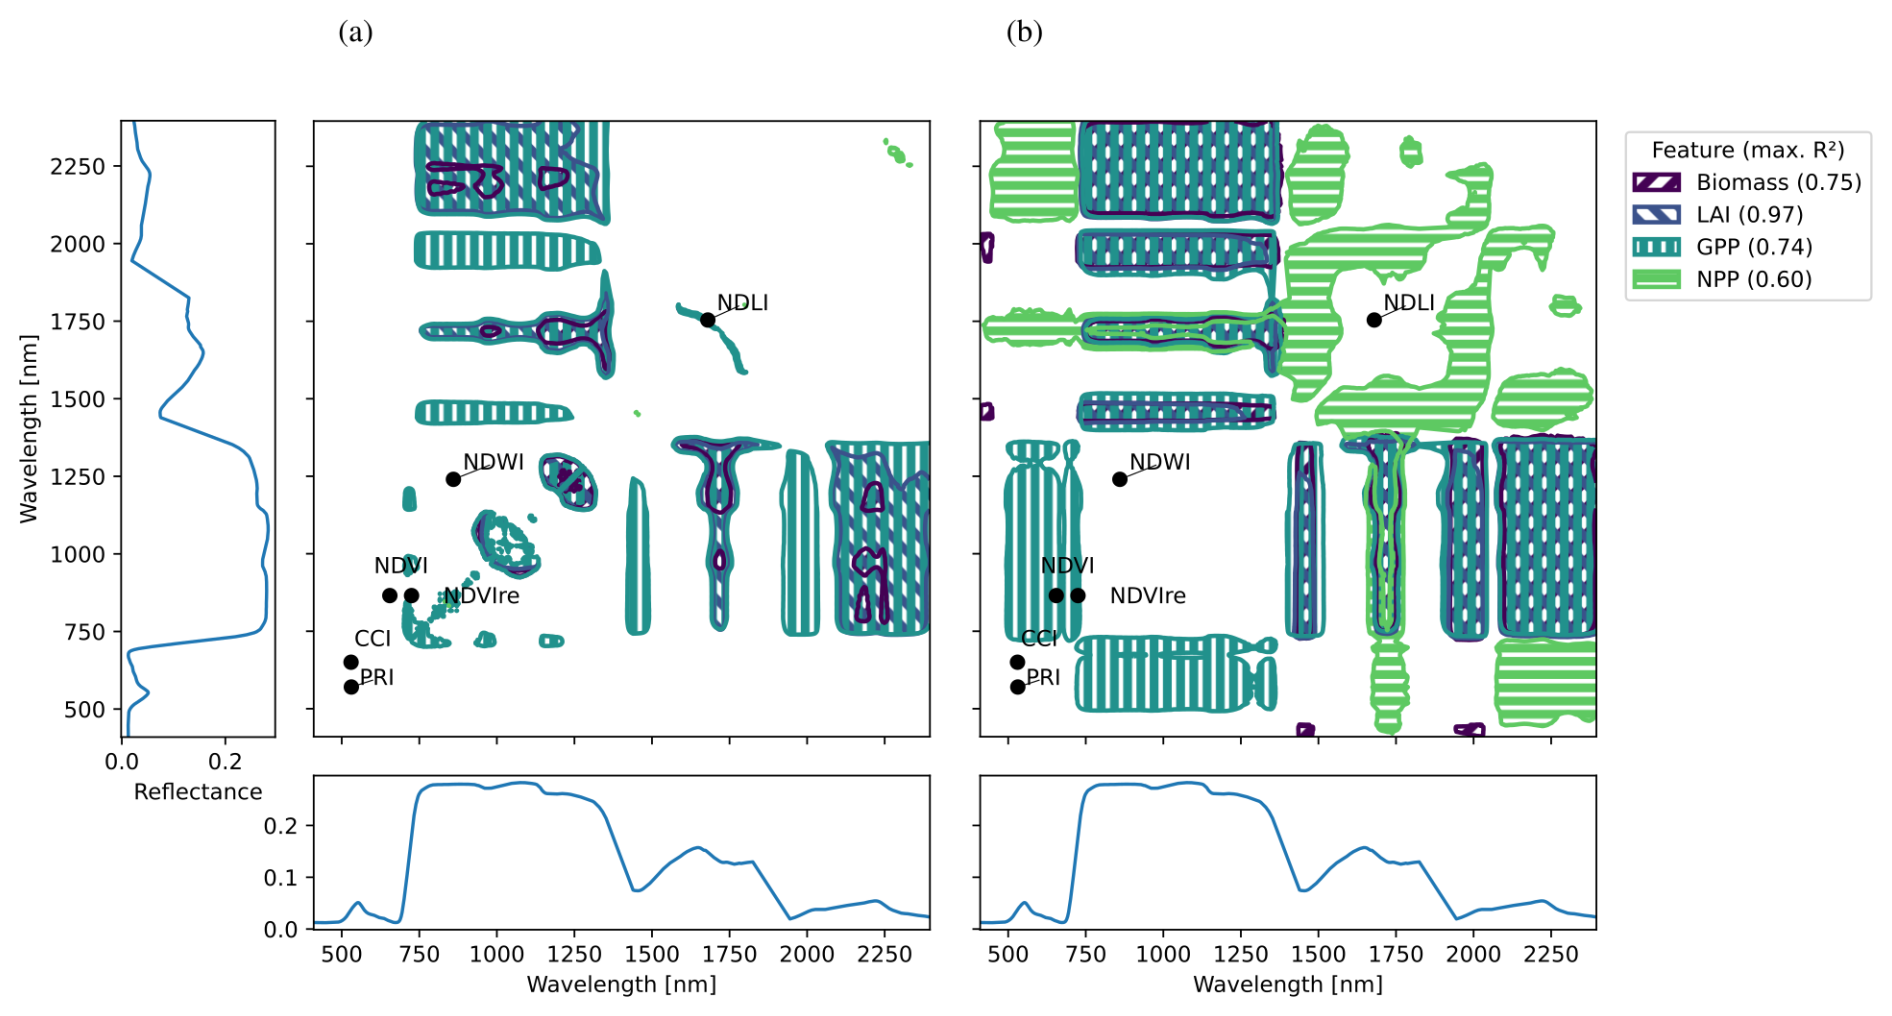
Figure 2Wavelength combinations used in the best (a) linear and (b) parameter-free models for different properties of forests without environmental or physiological variation. Each colour corresponds to a different forest characteristic. The shaded areas show the combinations of wavelengths for which models with at least 90 % the R2 value of the best 2-wavelength model could be constructed. The graphs on the x and y axis show the mean reflectance profiles of all considered forest stands.
Analyzing the best models for the considered forest characteristics yielded several similarities. The best models have in common that the estimated forest properties increase with the reflectance of one wavelength, while they decrease with the reflectance of the other (Fig. 3). The reflectance values we used for fitting the models were correlated and hence accumulated along increasing lines in the two-wavelength space (see dots in Fig. 3; and are the reflectances of the considered wavelengths w1 and w2). The gradient of the forest properties was perpendicular to this line, indicating that (1) many different reflectance pairs could lead to the same forest property estimate if they lie on a line parallel to the correlation line l and (2) the models were sensitive to changes in individual reflectance values (other reflectance held constant).
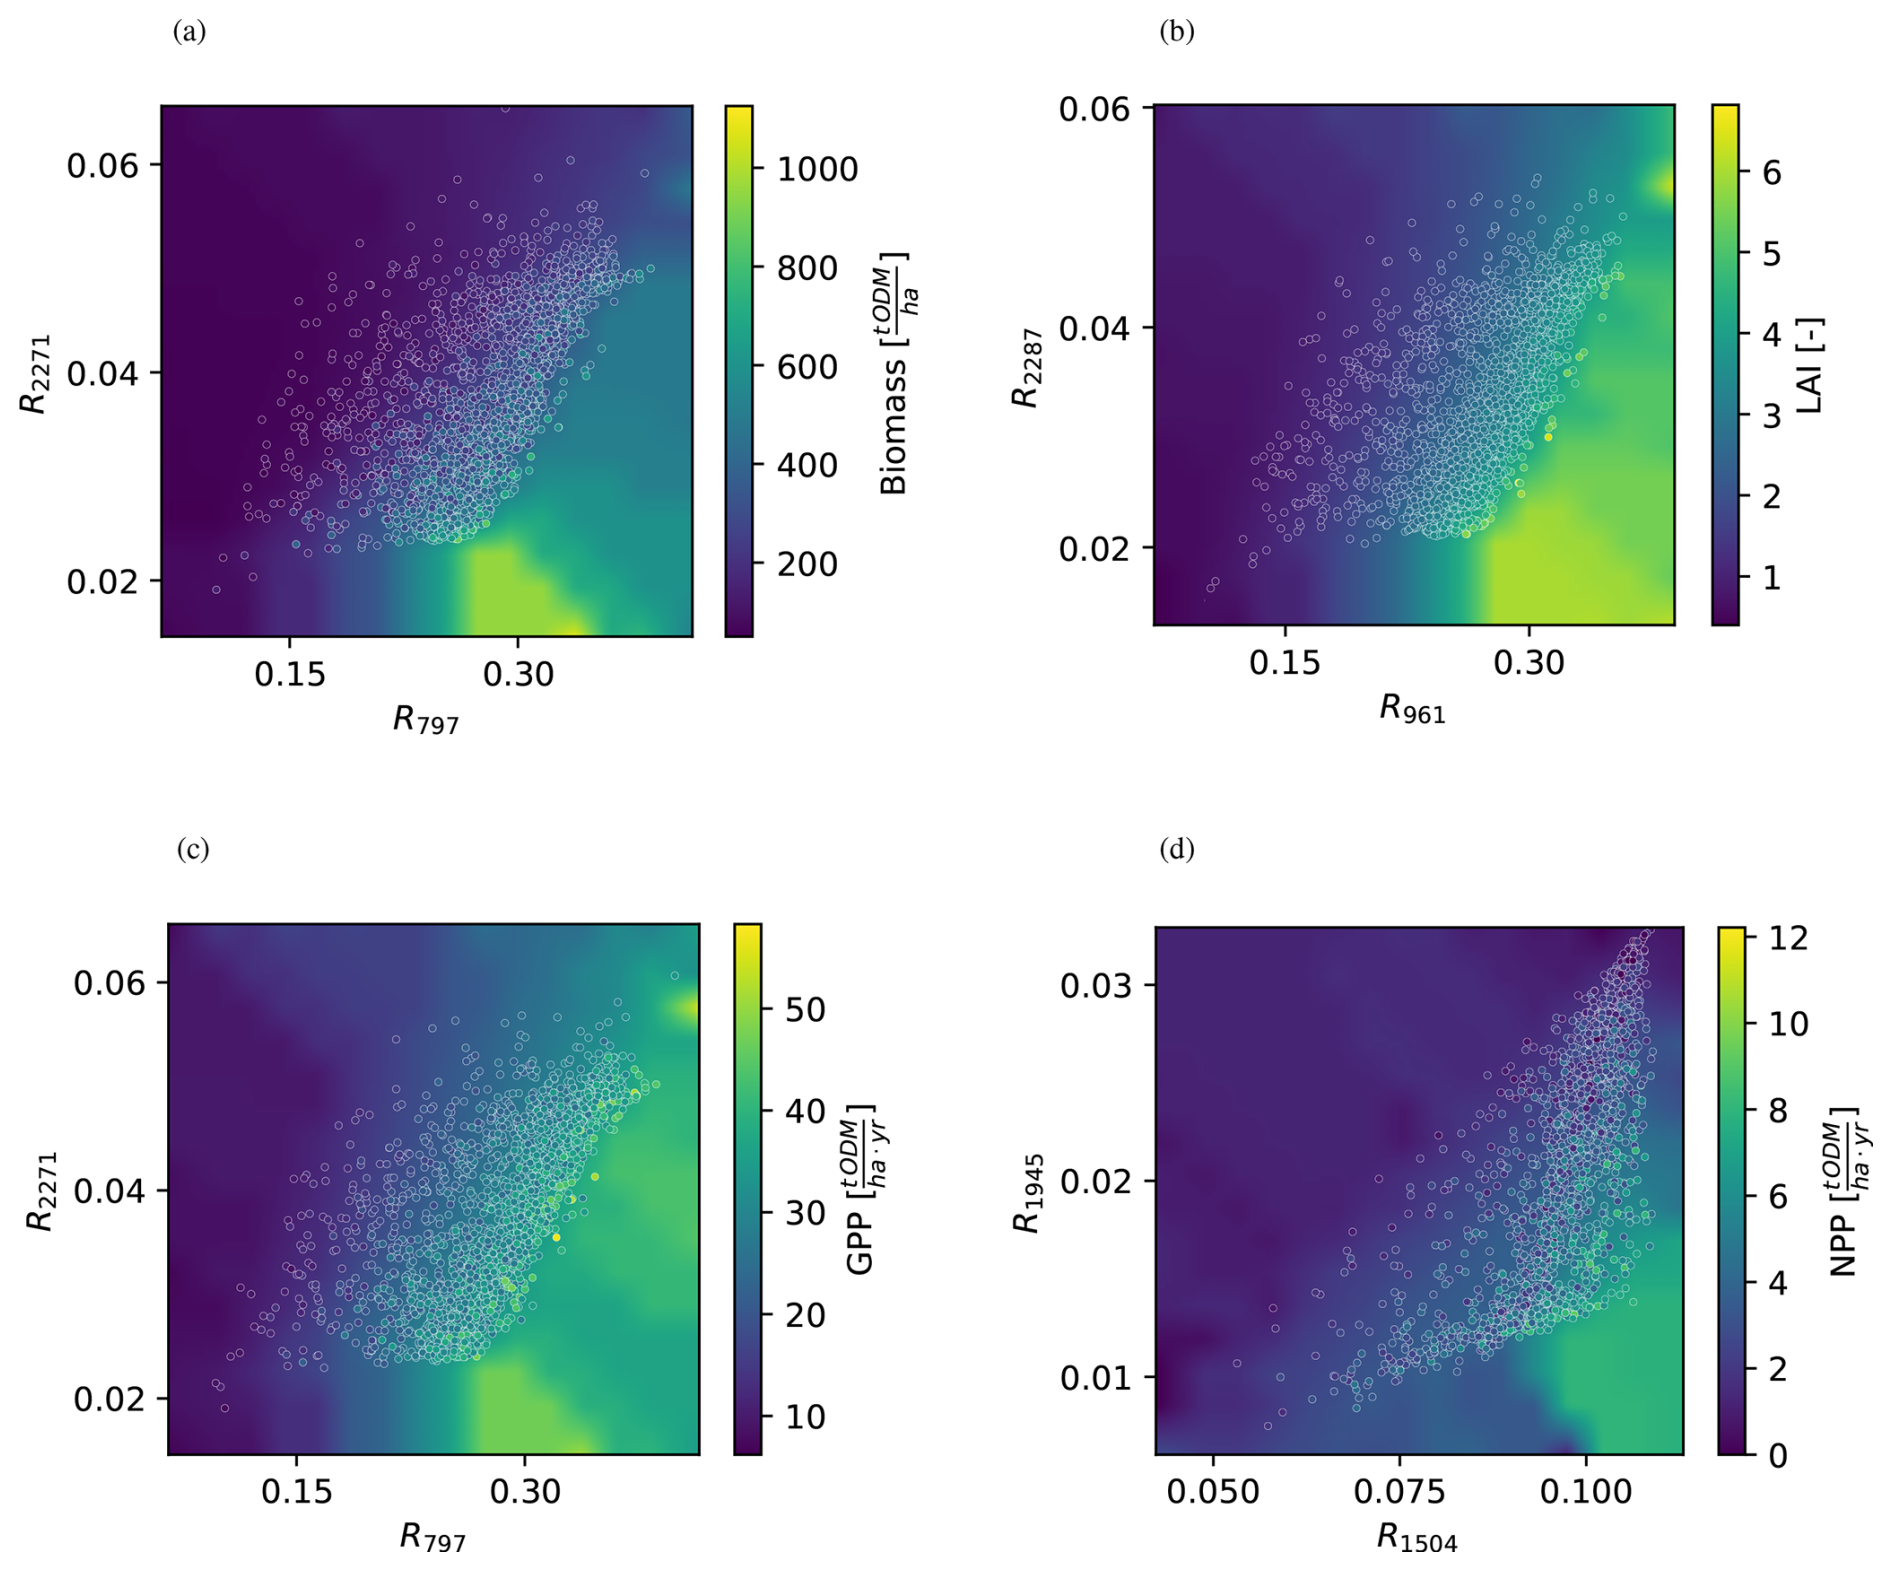
Figure 3The best parameter-free models for (a) biomass, (b) LAI, (c) GPP, and (d) NPP, respectively, for forests without environmental or physiological variations. The axes correspond to reflectance values (Rw is the reflectance of wavelength w in nanometers). The background colour depicts the model's prediction, i.e., the respective forest characteristic corresponding to a reflectance pair. The points correspond to simulated forest patches in the validation dataset: their positions correspond to their reflectances, their colours to their biomass, LAI, GPP, and NPP.
The effect of environmental and physiological variability on the potential R2 was moderate in most of the considered scenarios (dots in Fig. 4). In five of the seven considered noise scenarios with only one dimension of variation, the maximal obtained R2 was almost insensitive to noise and did not decrease by more than 0.07. For biomass, LAI, and GPP, this applied for variability in leaf traits, leaf structure, leaf angle, soil wetness, and sun and view angles. White noise had a slightly higher effect (R2 reduction by up to 0.15), and added variability in the LAI was the individual source of variation with the highest impact (R2 reduction up to 0.2 for biomass and GPP and 0.3 for LAI). For the NPP, LAI variability was less significant for the maximal R2. Instead, the leaf parameters played the most important individual role (R2 decrease by 0.16). For all forest characteristics, the combined noise scenario yielded the lowest R2, which was about half as big as without variations, respectively.
The ranges of wavelengths that yield a near-optimal R2 (bars in Fig. 4) were more strongly affected by variations than the optimal potential R2 values. Here, variability in the leaf traits and the leaf structure had the strongest effect, in particular for biomass and NPP, where the fraction P0.9 of evaluated models with an R2 exceeding 90 % of the optimum dropped by more than 82 %. For the NPP, variability in the leaf inclination parameters had a similarly strong impact. The value P0.9 decreased least in the presence of LAI and sun/view angle variations. In the joint noise scenario, P0.9 was strongly reduced for all forest characteristics.
In most considered scenarios, added variations did not affect the combinations of wavelength bands in which models with a high R2 could be found (colours in Fig. 4). However, in the presence of leaf trait variability, no models using visible and red edge bands achieved near-optimal R2 values. For the NPP, variability in the leaf structure parameters had a similar effect. Furthermore, models with near-infrared light lost their predictive capabilities for NPP if more factors than LAI and sun/view angles were variable.
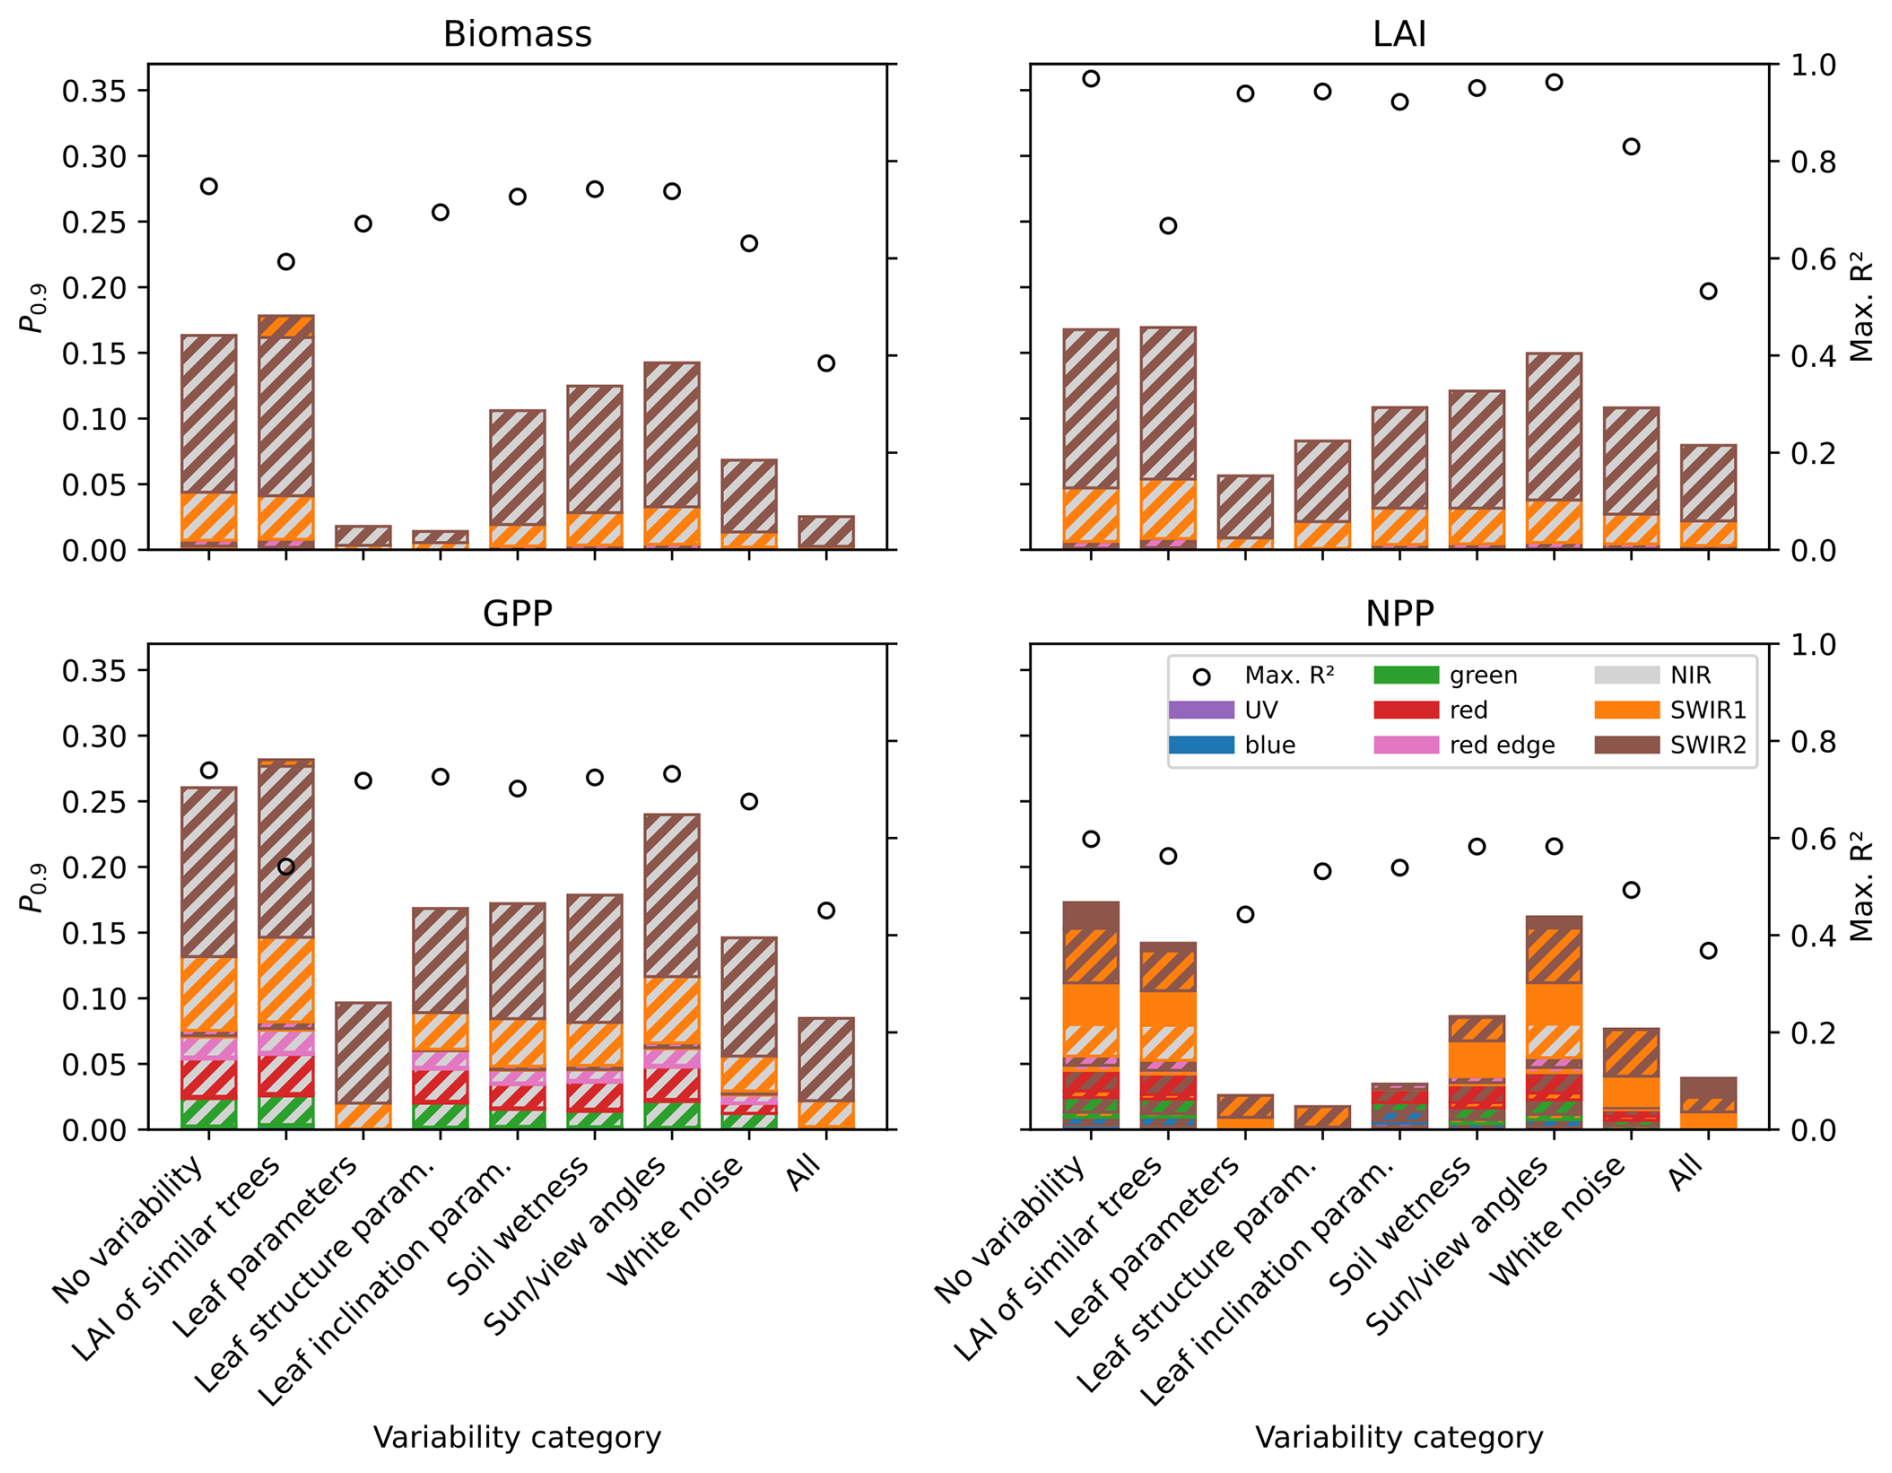
Figure 4Impact of different sources of variation on the predictability of forest characteristics. Each bar and point corresponds to a source of variation. The circles depict the maximal possible R2 values. The bars show the fraction of considered wavelength pairs for which a model with an R2 of at least 90 % of the respective maximum can be constructed. Here, the colours depict the bands from which the corresponding wavelengths are taken. It is visible that while the maximal R2 is only moderately sensitive to variability in environmental factors and leaf properties, the range of wavelengths for which a high R2 can be attained decreases significantly in the presence of noise.
Filtering the considered forest stands and developing specialized models for forests with high/low biomass and/or structural diversity generally improved the R2 values for NPP (black circles in Fig. 5). NPP estimates achieved particularly high R2 values (>0.7) in forests with small biomass (<200 t ODM ha−1), whereas the R2 values were lower in denser forests (R2<0.63). Binning by structural diversity yielded more intricate results: if the forests were also filtered by biomass, focusing on forests with lower structural heterogeneity () led to larger R2 values. Specifically, NPP could be estimated with an R2 of 0.81 in forests with low biomass and low structural heterogeneity, whereas the R2 dropped to 0.49 in forests structurally diverse forests with high biomass. If no biomass filter was applied, however, NPP could be better estimated in structurally diverse forests.
Structural diversity had a larger effect than the biomass on P0.9, the range of wavelengths based on which NPP estimates with a high R2 (≥90 % of max.) could be achieved (coloured circles in Fig. 5). More models achieved a near-maximal R2 in structurally homogeneous forests. The biomass range only made a strong difference for structurally homogeneous forests, where P0.9 was significantly larger in forests with a low biomass.
Filtering by biomass and structural diversity had a significant effect on the bands that were best suited to estimate NPP (colours in Fig. 5). Most prominently, the percentage of high-achieving models using NIR light was much larger in forests known to have a small biomass (namely 51 %–70 %) or large structural heterogeneity (20 %–99 %). In contrast, NIR light was much less used in the best models for unfiltered forests (14 % of the high-achieving models) or forests with neither large structural heterogeneity nor small biomass (0 %).
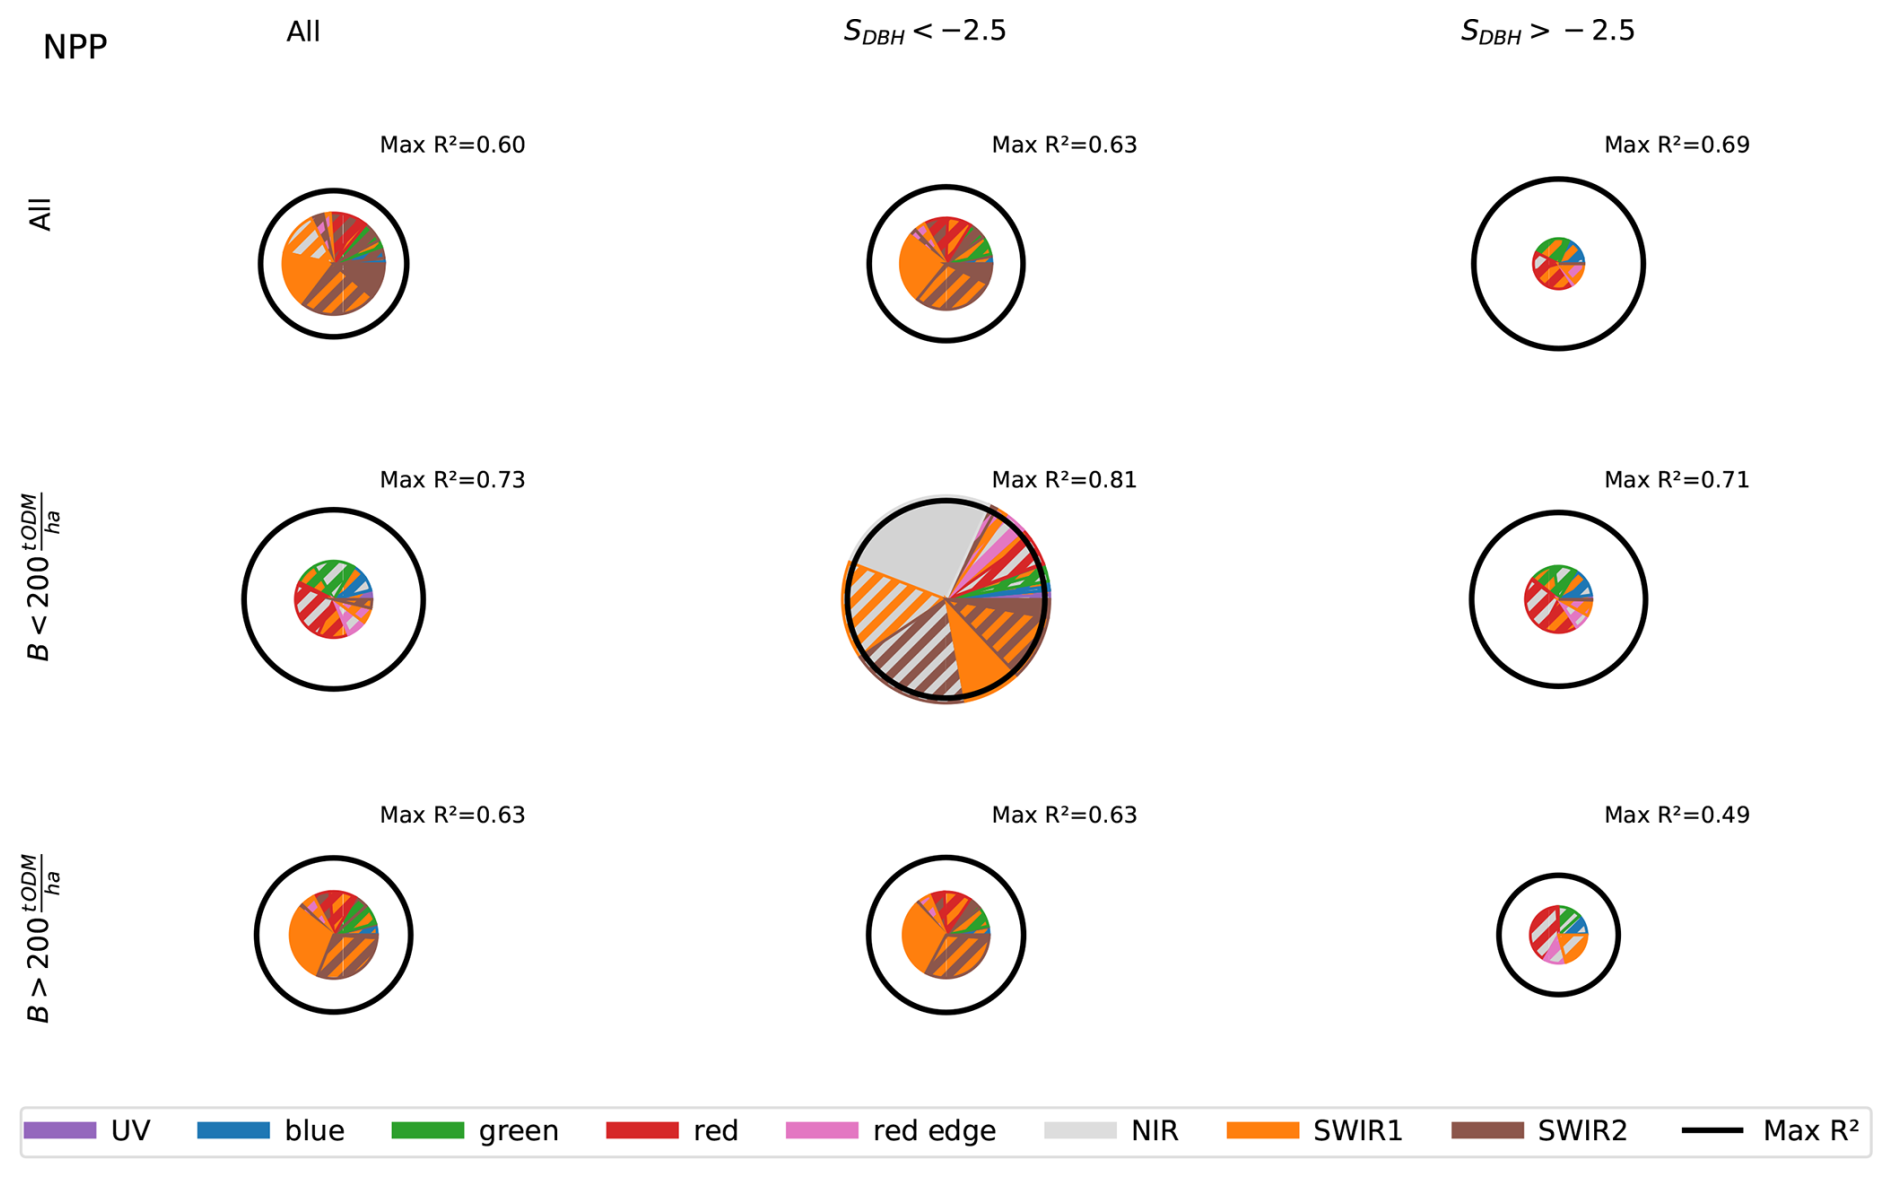
Figure 5Predictability of the NPP for subsets of the forest stands. In the second and third column, the forest stands are filtered by DBH entropy, where low values indicate dominance by a single tree or multiple similarly-sized trees, whereas high values indicate that the basal area is evenly distributed over trees of different size classes. In the first column, no filtering by DBH entropy is applied. Similarly, the second and third row correspond to forests with high and low above-ground biomass, respectively, whereas no filtering was applied in the first row. The diameters of the hollow black circles correspond to the respective maximal R2 values that could be achieved for the dataset. The shaded areas are proportional to the fraction of considered wavelength pairs for which a high R2 (> 90 % of maximum) could be achieved. The colours depict the bands from which the corresponding wavelengths were taken. It is visible that for dense forests, most models consider a wavelength from the near infrared band. In contrast, for sparser forests, the SWIR1 band was used more frequently. In general, it was easier to estimate the NPP of dense forests and forests dominated by trees from few size classes.
In this study, we conducted an extensive in-silicio study of 900 000 simulated temperate forest stands to (1) assess the general potential of data-driven vegetation indices to estimate forest characteristics and (2) analyze which wavelengths pairs yield the best estimates depending on the variability of traits and conditions within the considered datasets. To that end, we systematically evaluated a total of more than 7 million data-driven models for biomass, LAI, yearly GPP, and yearly NPP based on different wavelength pairs. We found that even if the forests were subject to significant variation of environmental and physiological properties, data-driven models yielded relatively large R2 values, significantly exceeding the R2 values obtained from classical vegetation indices. This suggests that data-driven vegetation indices, even if using only two wavelengths, are a promising tool for deriving forest properties from remote sensing data.
4.1 Main findings
Neither a large number of different wavelengths nor a complicated functional form were necessary to estimate forest attributes with relatively high accuracy. In fact, linear models superseded parameter-free models without pre-imposed functional form in some wavelength regions. However, focusing on a specific functional form limited the range of wavelengths suitable for analyzing forest attributes and increased the challenge of identifying the optimal wavelengths. This agrees with earlier findings by Gong et al. (2003), who evaluated different wavelength combinations and functional forms to estimate LAI based on reflectance data. The better suitability of linear models in some wavelength regions is due to the limited resolution of the binning method we applied in the parameter-free case, where we computed average values of forest characteristics for individual reflectance intervals. Increasing the resolution (i.e., using smaller intervals) or using more general parametric models will therefore lead to even better R2 values than we presented, but may require larger datasets.
Despite the relatively high R2 values we obtained, ranging from 0.6 for the NPP to 0.97 for the LAI, our results show that identifying the right wavelengths for estimating specific forest properties is key. In the absence of environmental and physiological variability, the classical vegetation indices rarely utilized wavelength pairs optimal for estimating any of the considered forest characteristics. Exceptions were the vegetation indices using red and NIR/red edge light (e.g. NDVI, EVI, NDVIre, NIRv), which were, however, only in the optimal range for estimating GPP and neither of the other forest characteristics. This is surprising, since LAI and GPP are typically assumed to be strongly correlated (Gitelson et al., 2014), and several vegetation indices were developed by considering the reflectance profile of leaves (Zeng et al., 2022).
In the presence of environmental or physiological variability, the range of suitable wavelengths decreased significantly, and some bands lost their suitability. For example, visible light became sub-optimal when leaf traits were uncertain, and NIR light became unsuited for estimating NPP in this case. This suggests that the choice of wavelengths for estimating forest characteristics should take into account the type and magnitude of variations expected in the field data. Identifying and quantifying these sources of variation will hence be an important preparational step to deriving data-driven vegetation indices for forest characteristics.
Aside the above-mentioned cases, the best band combinations for estimating forest characteristics remained remarkably stable throughout the considered scenarios. In particular, combinations of longer wavelengths (NIR, SWIR1, and SWIR2) were generally well suited. This is in line with previous studies (Gong et al., 2003; Lemaire et al., 2008; Psomas et al., 2011; Houborg and McCabe, 2018; Almeida et al., 2019), yet contrasts with the most common choices of wavelengths for vegetation indices (only 4 out of 23 vegetation indices listed in the review of Zeng et al. (2022) combined two wavelengths from these bands). However, these vegetation indices were typically not designed to quantitatively estimate the forest characteristics considered in this study. Instead, many are applied to assess the presence of vegetation, e.g. classify areas into forest landscapes and other landscape types, whereas in our study, we considered forests only, i.e., presumed that the landscape had been filtered to only include forests before. Nonetheless, a classification into forested and unforested land could be easily conducted in an independent preparational step, making forest-specific vegetation indices applicable in combined multi-step procedures in practice.
We found that combinations of NIR and SWIR wavelengths were particularly useful for estimating forest characteristics. Reflectance in the SWIR range is strongly related to leaf water content, lignin, proteins, nitrogen and cellulose (Curran, 1989; Fu et al., 2021; Zeng et al., 2022), and the combination of LAI and nitrogen content has been found well suited for estimating forest productivity (Reich, 2012; Zhang et al., 2023). The significance of NIR/SWIR combinations may be further understood by considering the sensitivity of forest reflectance to LAI, which is low in the NIR range but high in the SWIR range (Verrelst et al., 2015; sensitivity analysis of radiative transfer models). Furthermore, NIR and SWIR reflectances are much less sensitive to leaf constituents such as chlorophyll or carotenoid than reflectances from the visible spectrum (Mousivand et al., 2014; Verrelst et al., 2015; Prikaziuk and van der Tol, 2019). This may also explain why visible light became unsuitable for estimating GPP when the leaf properties were uncertain. We note, however, that a discussion of potential technical limitations in measuring NIR/SWIR light or required atmospheric corrections is beyond the scope of this study.
Since variations in leaf constituents may be induced by high species richness, reflectances from the visible spectrum may be unsuitable for assessing particularly diverse forests. The significance of visible light decreased similarly in forests with high biomass, potentially due to the low penetration depth of visible light (Hovi and Rautiainen, 2020) leading to a quick saturation of reflectance-LAI relationships (Mutanga et al., 2023). These findings suggest that visible light is sub-optimal to assess the considered forest characteristics in structurally complex forests.
Noteworthily, an increase in the heterogeneity of tree sizes had a contrasting effect: it increased the significance of visible light for estimating NPP. The tree size diversity, measured by the DBH entropy in this study, is low if forest patches are dominated by individual large trees, overshadowing understorey trees. If multiple differently sized trees contribute equally to a forest's basal area, it is more likely that their canopies are directly visible from above, making it easier and potentially optimal to use visible light to assess the forest state. This relationship may not hold in strongly stratified (e.g. tropical) forests, though.
4.2 Methodological contributions
A major aim of this study was to establish a simulation-based methodological framework for systematically evaluating two-band vegetation indices. Though building on previous work on generating ecologically feasible forests with simulation models (Bohn and Huth, 2017; Henniger et al., 2023b) and combining forest models with radiative transfer models (Henniger et al., 2023a), we introduced several methodological advancements. Our Markov Chain Monte Carlo approach for sampling forests allows a rigorous statistical interpretation of the distribution of the resulting forests. Furthermore, the algorithm's simplicity reduces the risk of model artifacts potentially favouring specific forest structures, makes it easier to incorporate climatic effects on forest states and to exchange the underlying forest model with other process-based forest models. The updates of the forest model Formind and its parameterization for temperate forests improved the model's efficiency and accuracy in heterogeneous forests.
The adjusted version of mSCOPE disentangles the vertical space and LAI dimensions, thereby permitting the simulation of forests with heterogeneous leaf densities in different layers of the canopy. The new soil sunfleck parameter reduces the impact of uncertain soil properties on reflectance and may lead to more accurate results in scenarios with large solar zenith angles.
The parameter-free vegetation indices proposed in this study circumvent the need to limit the predictive power of vegetation indices by pre-imposing specific functional forms. This makes this class of vegetation indices particularly useful for data-driven vegetation indices, as the optimal functional form can be directly derived from the data. At the same time, their methodological simplicity makes data-driven indices well-suited for considering large data sets and analyzing many vegetation indices systematically. However, if less data are available or more than two or three wavelengths are regarded jointly, other methods, such as machine learning approaches, should be considered.
4.3 Limitations
We used a model-based approach for a systematic analysis of the vegetation indices under controlled conditions. This is a typical method in theoretical studies (see e.g. Fang, 2003; Lemaire et al., 2008; Wang et al., 2022; Dong et al., 2024) and facilitates a general understanding of the studied relationships, as a variety of different scenarios can be considered easily. Nonetheless, the results depend on the assumptions underlying the applied models and are hence subject to associated limitations.
The applied forest model Formind considered climatic drivers such as droughts and their effects, but the relationships between these stressors with the optical leaf properties (Watt et al., 2021; Zhou et al., 2021) were not modelled explicitly. Similarly, the effects of shadows occurring on the surface of heterogeneous tree canopies (Hilker et al., 2010; Zeng et al., 2022), which could affect the estimability of forest characteristics by inducing a relationship between forests' height heterogeneity and their reflectance, are not accounted for in mSCOPE. We addressed these simplifications by modelling and investigating the effect of different sources of variation on the results, and our findings are in good agreement with earlier analyses of wavelength combinations for estimating LAI (Gong et al., 2003).
We simulated the analyzed forest stands considering environmental conditions at the Hohes Holz site, where the utilized forest model had been extensively validated in multiple respects (Rödig et al., 2017; Holtmann et al., 2021). The “ForestFactory” approach to generate forests yields stands with a broad variety of structures (Henniger et al., 2023b). This makes the simulated dataset representative for a large set of forests varying in site conditions and management. We accounted for weather-induced variability by additionally randomizing the utilized weather data. Nonetheless, the model results may not be representative for forests with significantly different site conditions or climate (e.g. montane forests). Additional studies are required to further assess the impacts of a wider range of environmental site characteristics on vegetation index performance (e.g. soil type, rooting depth, slope and aspect, mean temperature and precipitation).
4.4 Outlook and future directions
Our systematic in-silicio analysis of forests and their reflectance provides the basis for deriving data-driven vegetation indices from field data. Field data for structural forest properties such as biomass and LAI could be derived from LIDAR measurements and orthophotos. These data could then be combined with reflectance data from multi- and hyperspectral satellite missions. Data-driven vegetation indices for biomass, LAI, and yearly GPP could be derived based on data from the Landsat 8/Landsat 9 satellites (most promising band combination: band 5: NIR and band 7: SWIR 2), the Sentinel 2 satellite (band 8: NIR/band 12: SWIR 2), or the MODIS instrument (band 5: NIR/band 7: SWIR). Here, the MODIS data may be particularly well suited due to the sensor's relatively small bandwidth in the SWIR range.
Deriving a data-driven vegetation index for NPP may be more challenging, as corresponding field data are difficult to acquire. Furthermore, the wavelengths we found to be best suited for estimating NPP are often not considered by multispectral satellite missions, because these wavelengths are close to the atmospheric water absorption bands. Here, data from hyperspectral satellites such as EnMAP and CHIME could prove particularly useful, as they record a significantly larger number of wavelength channels.
Since we found the sensitivity towards wavelength choice to be minimized by parameter-free vegetation indices, we suggest taking a corresponding approach when developing data-driven vegetation indices. Once data-driven indices are established for some areas where field data are available, the results could be used to recalibrate and fine-tune our model-driven analysis pipeline, e.g., by providing insights into the variability of environmental conditions and plant traits. The refined model could then be used to generalize the results from the field studies or to develop indices specifically tailored towards specific forest types.
These indices could be derived by simulating forests with structural properties mimicking the those of the respective region of interest. Tailor-made vegetation indices could yield more precise results than presented in this study, where we considered a broad mixture ranging from even-aged monocultures to uneven-aged heterogeneous forests. Moreover, since data-driven vegetation indices require that the training data are representative for the area of interest, using carefully constrained data for fitting may even be a prerequisite for accurate estimates.
Besides generalizing results from spatially constrained field studies, the ability to jointly simulate forests and their reflectance can support the development of advanced vegetation indices that incorporate more wavelengths simultaneously. To that end, machine learning methods may be applied, which require sufficiently large training datasets. This increases the importance of simulation approaches. Our process-based modelling approach can furthermore be extended to consider variables beyond those analyzed in this study. For example, it might be possible to develop specialized vegetation indices for forest properties such as species diversity, structural diversity, net ecosystem exchange, forest health or disturbance.
We used a hybrid modelling approach to generate large datasets of forest stands and corresponding hyperspectral data in the 400–2400 nm range. Based on these datasets, we systematically evaluated the potential of vegetation indices to estimate above-ground biomass, LAI, yearly GPP, and yearly NPP. We found that estimates from data-driven indices have the potential to be significantly more accurate than predictions derived from “classical” vegetation indices.
We assessed which wavelength combinations were best suited for estimating the considered forest characteristics and observed that combinations of NIR and SWIR light yielded good results in general, with biomass, LAI, and GPP often being well inferable via the same wavelength combinations. The optimal choice of wavelengths depended on the structure of the considered forests, with visible light gaining in importance in less dense and structurally heterogeneous forests.
We proposed and evaluated a new class of vegetation indices, namely parameter-free vegetation indices. We found that the functional form of the vegetation indices did not significantly affect the maximal possible achievable accuracy, but instead constrained the range of wavelengths where this accuracy could be attained. We obtained a similar result with respect to environmental and physiological variability: evaluating different potential sources of uncertainty in physiological and environmental parameters, we observed that while uncertainty did not strongly reduce the achievable accuracy, it decreased the range of wavelengths where accurate vegetation indices could be constructed. These results, along with the simulation approach introduced in this study and the generated data, may facilitate the development of new data-driven vegetation indices, optimized for estimating individual forest characteristics of interest and tailored to the structure of the considered forests.
The forest characteristics and reflectance profiles generated in this study can be found at the Zenodo public repository at https://doi.org/10.5281/zenodo.16748241 (Fischer et al., 2025).
The supplement related to this article is available online at https://doi.org/10.5194/bg-23-4927-2026-supplement.
Samuel M. Fischer: Methodology, Software, Formal analysis, Investigation, Data Curation, Writing – Original Draft, Visualization. Rico Fischer: Conceptualization, Methodology, Writing – Review & Editing, Supervision, Project administration, Funding acquisition. Andreas Huth: Conceptualization, Methodology, Writing – Review & Editing, Supervision, Project administration.
The contact author has declared that none of the authors has any competing interests.
Publisher's note: Copernicus Publications remains neutral with regard to jurisdictional claims made in the text, published maps, institutional affiliations, or any other geographical representation in this paper. The authors bear the ultimate responsibility for providing appropriate place names. Views expressed in the text are those of the authors and do not necessarily reflect the views of the publisher.
The authors gratefully acknowledge the constructive comments of Colin Bloom and an anonymous reviewer, the valuable discussions with colleagues in the Department of Ecological Modelling at UFZ Leipzig, and the support of the FORMIND development team. The authors are particularly grateful to Niklas Bruns for his major contributions to the revision of the FORMIND model code.
This research has been supported by the Bundesministerium für Wirtschaft und Klimaschutz (grant no. 50EE 2235).
The article processing charges for this open-access publication were covered by the Helmholtz Centre for Environmental Research – UFZ.
This paper was edited by Benjamin Stocker and reviewed by Colin Bloom and one anonymous referee.
Almeida, C. T. D., Galvão, L. S., Aragão, L. E. D. O. C. E., Ometto, J. P. H. B., Jacon, A. D., Pereira, F. R. D. S., Sato, L. Y., Lopes, A. P., Graça, P. M. L. D. A., Silva, C. V. D. J., Ferreira-Ferreira, J., and Longo, M.: Combining LiDAR and Hyperspectral Data for Aboveground Biomass Modeling in the Brazilian Amazon Using Different Regression Algorithms, Remote Sens. Environ., 232, 111323, https://doi.org/10.1016/j.rse.2019.111323, 2019. a
Badgley, G., Anderegg, L. D. L., Berry, J. A., and Field, C. B.: Terrestrial Gross Primary Production: Using NIRV to Scale from Site to Globe, Glob. Change Biol., 25, 3731–3740, https://doi.org/10.1111/gcb.14729, 2019. a, b
Bohn, F. J. and Huth, A.: The Importance of Forest Structure to Biodiversity–Productivity Relationships, Royal Soc. Open Sci., 4, 160521, https://doi.org/10.1098/rsos.160521, 2017. a, b, c, d
Bohn, F. J., Frank, K., and Huth, A.: Of Climate and Its Resulting Tree Growth: Simulating the Productivity of Temperate Forests, Ecol. Model., 278, 9–17, https://doi.org/10.1016/j.ecolmodel.2014.01.021, 2014. a
Brown, L.: A Shortwave Infrared Modification to the Simple Ratio for LAI Retrieval in Boreal Forests An Image and Model Analysis, Remote Sens. Environ., 71, 16–25, https://doi.org/10.1016/S0034-4257(99)00035-8, 2000. a
Bugmann, H. and Seidl, R.: The Evolution, Complexity and Diversity of Models of Long-term Forest Dynamics, J. Ecol., 110, 2288–2307, https://doi.org/10.1111/1365-2745.13989, 2022. a
Camps-Valls, G., Campos-Taberner, M., Moreno-Martínez, Á., Walther, S., Duveiller, G., Cescatti, A., Mahecha, M. D., Muñoz-Marí, J., García-Haro, F. J., Guanter, L., Jung, M., Gamon, J. A., Reichstein, M., and Running, S. W.: A Unified Vegetation Index for Quantifying the Terrestrial Biosphere, Science Advances, 7, eabc7447, https://doi.org/10.1126/sciadv.abc7447, 2021. a
Coops, N. C.: Characterizing Forest Growth and Productivity Using Remotely Sensed Data, Current Forestry Reports, 1, 195–205, https://doi.org/10.1007/s40725-015-0020-x, 2015. a
Curran, P. J.: Remote Sensing of Foliar Chemistry, Remote Sens. Environ., 30, 271–278, https://doi.org/10.1016/0034-4257(89)90069-2, 1989. a
Dong, M., Liu, S., Jiang, R., Qi, J., De Solan, B., Comar, A., Li, L., Li, W., Ding, Y., and Baret, F.: Comparing and Combining Data-Driven and Model-Driven Approaches to Monitor Wheat Green Area Index with High Spatio-Temporal Resolution Satellites, Remote Sens. Environ., 305, 114118, https://doi.org/10.1016/j.rse.2024.114118, 2024. a, b, c
Dubayah, R., Armston, J., Healey, S. P., Bruening, J. M., Patterson, P. L., Kellner, J. R., Duncanson, L., Saarela, S., Ståhl, G., Yang, Z., Tang, H., Blair, J. B., Fatoyinbo, L., Goetz, S., Hancock, S., Hansen, M., Hofton, M., Hurtt, G., and Luthcke, S.: GEDI Launches a New Era of Biomass Inference from Space, Environ. Res. Lett., 17, 095001, https://doi.org/10.1088/1748-9326/ac8694, 2022. a
Fang, H.: Retrieving Leaf Area Index Using a Genetic Algorithm with a Canopy Radiative Transfer Model, Remote Sens. Environ., 85, 257–270, https://doi.org/10.1016/S0034-4257(03)00005-1, 2003. a, b
Ferretti, M., Fischer, C., Gessler, A., Graham, C., Meusburger, K., Abegg, M., Bebi, P., Bergamini, A., Brockerhoff, E. G., Brunner, I., Bühler, C., Conedera, M., Cothereau, P., D'Odorico, P., Düggelin, C., Ginzler, C., Grendelmeier, A., Haeni, M., Hagedorn, F., Hägeli, M., Hegetschweiler, K. T., Holderegger, R., Krumm, F., Gugerli, F., Queloz, V., Rigling, A., Risch, A. C., Rohner, B., Rosset, C., Scherrer, D., Schulz, T., Thürig, E., Traub, B., Von Arx, G., Waldner, P., Wohlgemuth, T., Zimmermann, N. E., and Shackleton, R. T.: Advancing Forest Inventorying and Monitoring, Ann. For. Sci., 81, 6, https://doi.org/10.1186/s13595-023-01220-9, 2024. a
Fischer, R., Bohn, F., Dantas de Paula, M., Dislich, C., Groeneveld, J., Gutiérrez, A. G., Kazmierczak, M., Knapp, N., Lehmann, S., Paulick, S., Pütz, S., Rödig, E., Taubert, F., Köhler, P., and Huth, A.: Lessons Learned from Applying a Forest Gap Model to Understand Ecosystem and Carbon Dynamics of Complex Tropical Forests, Ecol. Model., 326, 124–133, https://doi.org/10.1016/j.ecolmodel.2015.11.018, 2016. a
Fischer, S. M., Wang, X., and Huth, A.: Distinguishing mature and immature trees allows estimating forest carbon uptake from stand structure, Biogeosciences, 21, 3305–3319, https://doi.org/10.5194/bg-21-3305-2024, 2024. a, b, c, d, e
Fischer, S. M., Fischer, R., and Huth, A.: Forest Characteristics and Reflectance Spectra of Simulated Temperate Forests under Different Uncertainty Regimes, Zenodo [data set], https://doi.org/10.5281/zenodo.16748241, 2025. a
Fu, Y., Yang, G., Pu, R., Li, Z., Li, H., Xu, X., Song, X., Yang, X., and Zhao, C.: An Overview of Crop Nitrogen Status Assessment Using Hyperspectral Remote Sensing: Current Status and Perspectives, Eur. J. Agron., 124, 126241, https://doi.org/10.1016/j.eja.2021.126241, 2021. a
Gao, B.-c.: NDWI – A Normalized Difference Water Index for Remote Sensing of Vegetation Liquid Water from Space, Remote Sens. Environ., 58, 257–266, https://doi.org/10.1016/S0034-4257(96)00067-3, 1996. a
Gitelson, A. A., Peng, Y., Arkebauer, T. J., and Schepers, J.: Relationships between Gross Primary Production, Green LAI, and Canopy Chlorophyll Content in Maize: Implications for Remote Sensing of Primary Production, Remote Sens. Environ., 144, 65–72, https://doi.org/10.1016/j.rse.2014.01.004, 2014. a
Gong, P., Pu, R., Biging, G., and Larrieu, M.: Estimation of Forest Leaf Area Index Using Vegetation Indices Derived from Hyperion Hyperspectral Data, IEEE T. Geosci. Remote, 41, 1355–1362, https://doi.org/10.1109/TGRS.2003.812910, 2003. a, b, c
Guanter, L., Kaufmann, H., Segl, K., Foerster, S., Rogass, C., Chabrillat, S., Kuester, T., Hollstein, A., Rossner, G., Chlebek, C., Straif, C., Fischer, S., Schrader, S., Storch, T., Heiden, U., Mueller, A., Bachmann, M., Mühle, H., Müller, R., Habermeyer, M., Ohndorf, A., Hill, J., Buddenbaum, H., Hostert, P., Van Der Linden, S., Leitão, P., Rabe, A., Doerffer, R., Krasemann, H., Xi, H., Mauser, W., Hank, T., Locherer, M., Rast, M., Staenz, K., and Sang, B.: The EnMAP Spaceborne Imaging Spectroscopy Mission for Earth Observation, Remote Sensing, 7, 8830–8857, https://doi.org/10.3390/rs70708830, 2015. a
Henniger, H., Bohn, F. J., Schmidt, K., and Huth, A.: A New Approach Combining a Multilayer Radiative Transfer Model with an Individual-Based Forest Model: Application to Boreal Forests in Finland, Remote Sensing, 15, 3078, https://doi.org/10.3390/rs15123078, 2023a. a, b, c, d
Henniger, H., Huth, A., Frank, K., and Bohn, F. J.: Creating Virtual Forests around the Globe and Analysing Their State Space, Ecol. Model., 483, 110404, https://doi.org/10.1016/j.ecolmodel.2023.110404, 2023b. a, b, c, d
Hilker, T., Hall, F. G., Coops, N. C., Lyapustin, A., Wang, Y., Nesic, Z., Grant, N., Black, T. A., Wulder, M. A., and Kljun, N.: Remote Sensing of Photosynthetic Light-Use Efficiency across Two Forested Biomes: Spatial Scaling, Remote Sens. Environ., 114, 2863–2874, https://doi.org/10.1016/j.rse.2010.07.004, 2010. a
Holtmann, A., Huth, A., Pohl, F., Rebmann, C., and Fischer, R.: Carbon Sequestration in Mixed Deciduous Forests: The Influence of Tree Size and Species Composition Derived from Model Experiments, Forests, 12, 726, https://doi.org/10.3390/f12060726, 2021. a, b
Houborg, R. and McCabe, M. F.: A Hybrid Training Approach for Leaf Area Index Estimation via Cubist and Random Forests Machine-Learning, ISPRS J. Photogramm., 135, 173–188, https://doi.org/10.1016/j.isprsjprs.2017.10.004, 2018. a
Hovi, A. and Rautiainen, M.: Spectral Composition of Shortwave Radiation Transmitted by Forest Canopies, Trees, 34, 1499–1506, https://doi.org/10.1007/s00468-020-02005-7, 2020. a
Jin, H. and Eklundh, L.: A Physically Based Vegetation Index for Improved Monitoring of Plant Phenology, Remote Sens. Environ., 152, 512–525, https://doi.org/10.1016/j.rse.2014.07.010, 2014. a
Joiner, J., Yoshida, Y., Zhang, Y., Duveiller, G., Jung, M., Lyapustin, A., Wang, Y., and Tucker, C. J.: Estimation of Terrestrial Global Gross Primary Production (GPP) with Satellite Data-Driven Models and Eddy Covariance Flux Data, Remote Sensing, 10, 1346, https://doi.org/10.3390/rs10091346, 2018. a
Jucker, T., Fischer, F. J., Chave, J., Coomes, D. A., Caspersen, J., Ali, A., Loubota Panzou, G. J., Feldpausch, T. R., Falster, D., Usoltsev, V. A., Adu-Bredu, S., Alves, L. F., Aminpour, M., Angoboy, I. B., Anten, N. P. R., Antin, C., Askari, Y., Muñoz, R., Ayyappan, N., Balvanera, P., Banin, L., Barbier, N., Battles, J. J., Beeckman, H., Bocko, Y. E., Bond-Lamberty, B., Bongers, F., Bowers, S., Brade, T., van Breugel, M., Chantrain, A., Chaudhary, R., Dai, J., Dalponte, M., Dimobe, K., Domec, J.-C., Doucet, J.-L., Duursma, R. A., Enríquez, M., van Ewijk, K. Y., Farfán-Rios, W., Fayolle, A., Forni, E., Forrester, D. I., Gilani, H., Godlee, J. L., Gourlet-Fleury, S., Haeni, M., Hall, J. S., He, J.-K., Hemp, A., Hernández-Stefanoni, J. L., Higgins, S. I., Holdaway, R. J., Hussain, K., Hutley, L. B., Ichie, T., Iida, Y., Jiang, H.-s., Joshi, P. R., Kaboli, H., Larsary, M. K., Kenzo, T., Kloeppel, B. D., Kohyama, T., Kunwar, S., Kuyah, S., Kvasnica, J., Lin, S., Lines, E. R., Liu, H., Lorimer, C., Loumeto, J.-J., Malhi, Y., Marshall, P. L., Mattsson, E., Matula, R., Meave, J. A., Mensah, S., Mi, X., Momo, S., Moncrieff, G. R., Mora, F., Nissanka, S. P., O'Hara, K. L., Pearce, S., Pelissier, R., Peri, P. L., Ploton, P., Poorter, L., Pour, M. J., Pourbabaei, H., Dupuy-Rada, J. M., Ribeiro, S. C., Ryan, C., Sanaei, A., Sanger, J., Schlund, M., Sellan, G., Shenkin, A., Sonké, B., Sterck, F. J., Svátek, M., Takagi, K., Trugman, A. T., Ullah, F., Vadeboncoeur, M. A., Valipour, A., Vanderwel, M. C., Vovides, A. G., Wang, W., Wang, L.-Q., Wirth, C., Woods, M., Xiang, W., Ximenes, F. d. A., Xu, Y., Yamada, T., and Zavala, M. A.: Tallo: A Global Tree Allometry and Crown Architecture Database, Glob. Change Biol., 28, 5254–5268, https://doi.org/10.1111/gcb.16302, 2022. a
Kattge, J., Díaz, S., Lavorel, S., Prentice, I. C., Leadley, P., Bönisch, G., Garnier, E., Westoby, M., Reich, P. B., Wright, I. J., Cornelissen, J. H. C., Violle, C., Harrison, S. P., Van Bodegom, P. M., Reichstein, M., Enquist, B. J., Soudzilovskaia, N. A., Ackerly, D. D., Anand, M., Atkin, O., Bahn, M., Baker, T. R., Baldocchi, D., Bekker, R., Blanco, C. C., Blonder, B., Bond, W. J., Bradstock, R., Bunker, D. E., Casanoves, F., Cavender-Bares, J., Chambers, J. Q., Chapin Iii, F. S., Chave, J., Coomes, D., Cornwell, W. K., Craine, J. M., Dobrin, B. H., Duarte, L., Durka, W., Elser, J., Esser, G., Estiarte, M., Fagan, W. F., Fang, J., Fernández-Méndez, F., Fidelis, A., Finegan, B., Flores, O., Ford, H., Frank, D., Freschet, G. T., Fyllas, N. M., Gallagher, R. V., Green, W. A., Gutierrez, A. G., Hickler, T., Higgins, S. I., Hodgson, J. G., Jalili, A., Jansen, S., Joly, C. A., Kerkhoff, A. J., Kirkup, D., Kitajima, K., Kleyer, M., Klotz, S., Knops, J. M. H., Kramer, K., Kühn, I., Kurokawa, H., Laughlin, D., Lee, T. D., Leishman, M., Lens, F., Lenz, T., Lewis, S. L., Lloyd, J., Llusià, J., Louault, F., Ma, S., Mahecha, M. D., Manning, P., Massad, T., Medlyn, B. E., Messier, J., Moles, A. T., Müller, S. C., Nadrowski, K., Naeem, S., Niinemets, Ü., Nöllert, S., Nüske, A., Ogaya, R., Oleksyn, J., Onipchenko, V. G., Onoda, Y., Ordoñez, J., Overbeck, G., Ozinga, W. A., Patiño, S., Paula, S., Pausas, J. G., Peñuelas, J., Phillips, O. L., Pillar, V., Poorter, H., Poorter, L., Poschlod, P., Prinzing, A., Proulx, R., Rammig, A., Reinsch, S., Reu, B., Sack, L., Salgado-Negret, B., Sardans, J., Shiodera, S., Shipley, B., Siefert, A., Sosinski, E., Soussana, J.-F., Swaine, E., Swenson, N., Thompson, K., Thornton, P., Waldram, M., Weiher, E., White, M., White, S., Wright, S. J., Yguel, B., Zaehle, S., Zanne, A. E., and Wirth, C.: TRY – a Global Database of Plant Traits, Glob. Change Biol., 17, 2905–2935, https://doi.org/10.1111/j.1365-2486.2011.02451.x, 2011. a
Lang, N., Jetz, W., Schindler, K., and Wegner, J. D.: A High-Resolution Canopy Height Model of the Earth, Nat. Ecol. Evol., 7, 1778–1789, https://doi.org/10.1038/s41559-023-02206-6, 2023. a
Lemaire, G., Francois, C., Soudani, K., Berveiller, D., Pontailler, J., Breda, N., Genet, H., Davi, H., and Dufrene, E.: Calibration and Validation of Hyperspectral Indices for the Estimation of Broadleaved Forest Leaf Chlorophyll Content, Leaf Mass per Area, Leaf Area Index and Leaf Canopy Biomass, Remote Sens. Environ., 112, 3846–3864, https://doi.org/10.1016/j.rse.2008.06.005, 2008. a, b, c
Maidment, D. R. (Ed.): Handbook of Hydrology, McGraw-Hill, New York, ISBN 978-0-07-039732-3, 1993. a
Maréchaux, I., Langerwisch, F., Huth, A., Bugmann, H., Morin, X., Reyer, C. P., Seidl, R., Collalti, A., Dantas de Paula, M., Fischer, R., Gutsch, M., Lexer, M. J., Lischke, H., Rammig, A., Rödig, E., Sakschewski, B., Taubert, F., Thonicke, K., Vacchiano, G., and Bohn, F. J.: Tackling Unresolved Questions in Forest Ecology: The Past and Future Role of Simulation Models, Ecol. Evol., 11, 3746–3770, https://doi.org/10.1002/ece3.7391, 2021. a
McFeeters, S. K.: The Use of the Normalized Difference Water Index (NDWI) in the Delineation of Open Water Features, Int. J. Remote Sens., 17, 1425–1432, https://doi.org/10.1080/01431169608948714, 1996. a
Mousivand, A., Menenti, M., Gorte, B., and Verhoef, W.: Global Sensitivity Analysis of the Spectral Radiance of a Soil–Vegetation System, Remote Sens. Environ., 145, 131–144, https://doi.org/10.1016/j.rse.2014.01.023, 2014. a
Mugabowindekwe, M., Brandt, M., Chave, J., Reiner, F., Skole, D. L., Kariryaa, A., Igel, C., Hiernaux, P., Ciais, P., Mertz, O., Tong, X., Li, S., Rwanyiziri, G., Dushimiyimana, T., Ndoli, A., Uwizeyimana, V., Lillesø, J.-P. B., Gieseke, F., Tucker, C. J., Saatchi, S., and Fensholt, R.: Nation-Wide Mapping of Tree-Level Aboveground Carbon Stocks in Rwanda, Nat. Clim. Change, 13, 91–97, https://doi.org/10.1038/s41558-022-01544-w, 2023. a
Muñoz Sabater, J.: ERA5-Land Hourly Data from 1950 to Present, Copernicus Climate Change Service (C3S) Climate Data Store (CDS) [data set], https://doi.org/10.24381/CDS.E2161BAC, 2019. a
Mutanga, O., Masenyama, A., and Sibanda, M.: Spectral Saturation in the Remote Sensing of High-Density Vegetation Traits: A Systematic Review of Progress, Challenges, and Prospects, ISPRS J. Photogramm., 198, 297–309, https://doi.org/10.1016/j.isprsjprs.2023.03.010, 2023. a
Park, J. H., Gan, J., and Park, C.: Discrepancies between Global Forest Net Primary Productivity Estimates Derived from MODIS and Forest Inventory Data and Underlying Factors, Remote Sensing, 13, 1441, https://doi.org/10.3390/rs13081441, 2021. a
Patacca, M., Lindner, M., Lucas-Borja, M. E., Cordonnier, T., Fidej, G., Gardiner, B., Hauf, Y., Jasinevičius, G., Labonne, S., Linkevičius, E., Mahnken, M., Milanovic, S., Nabuurs, G.-J., Nagel, T. A., Nikinmaa, L., Panyatov, M., Bercak, R., Seidl, R., Ostrogović Sever, M. Z., Socha, J., Thom, D., Vuletic, D., Zudin, S., and Schelhaas, M.-J.: Significant Increase in Natural Disturbance Impacts on European Forests since 1950, Glob. Change Biol., 29, 1359–1376, https://doi.org/10.1111/gcb.16531, 2023. a
Pohl, F., Werban, U., Kumar, R., Hildebrandt, A., and Rebmann, C.: Observational Evidence of Legacy Effects of the 2018 Drought on a Mixed Deciduous Forest in Germany, Sci. Rep., 13, 10863, https://doi.org/10.1038/s41598-023-38087-9, 2023. a
Prikaziuk, E. and van der Tol, C.: Global Sensitivity Analysis of the SCOPE Model in Sentinel-3 Bands: Thermal Domain Focus, Remote Sensing, 11, 2424, https://doi.org/10.3390/rs11202424, 2019. a
Psomas, A., Kneubühler, M., Huber, S., Itten, K., and Zimmermann, N. E.: Hyperspectral Remote Sensing for Estimating Aboveground Biomass and for Exploring Species Richness Patterns of Grassland Habitats, Int. J. Remote Sens., 32, 9007–9031, https://doi.org/10.1080/01431161.2010.532172, 2011. a
Qian, S.-E.: Hyperspectral Satellites, Evolution, and Development History, IEEE J. Sel. Top. Appl., 14, 7032–7056, https://doi.org/10.1109/JSTARS.2021.3090256, 2021. a
Reich, P. B.: Key Canopy Traits Drive Forest Productivity, P. Roy. Soc. B-Biol. Sci., 279, 2128–2134, https://doi.org/10.1098/rspb.2011.2270, 2012. a
Rödig, E., Huth, A., Bohn, F., Rebmann, C., and Cuntz, M.: Estimating the Carbon Fluxes of Forests with an Individual-Based Forest Model, Forest Ecosystems, 4, 4, https://doi.org/10.1186/s40663-017-0091-1, 2017. a, b
Rödig, E., Cuntz, M., Rammig, A., Fischer, R., Taubert, F., and Huth, A.: The Importance of Forest Structure for Carbon Fluxes of the Amazon Rainforest, Environ. Res. Lett., 13, 054013, https://doi.org/10.1088/1748-9326/aabc61, 2018. a
Running, S. W., Nemani, R. R., Heinsch, F. A., Zhao, M., Reeves, M., and Hashimoto, H.: A Continuous Satellite-Derived Measure of Global Terrestrial Primary Production, BioScience, 54, 547, https://doi.org/10.1641/0006-3568(2004)054[0547:ACSMOG]2.0.CO;2, 2004. a
Santoro, M., Cartus, O., Carvalhais, N., Rozendaal, D. M. A., Avitabile, V., Araza, A., de Bruin, S., Herold, M., Quegan, S., Rodríguez-Veiga, P., Balzter, H., Carreiras, J., Schepaschenko, D., Korets, M., Shimada, M., Itoh, T., Moreno Martínez, Á., Cavlovic, J., Cazzolla Gatti, R., da Conceição Bispo, P., Dewnath, N., Labrière, N., Liang, J., Lindsell, J., Mitchard, E. T. A., Morel, A., Pacheco Pascagaza, A. M., Ryan, C. M., Slik, F., Vaglio Laurin, G., Verbeeck, H., Wijaya, A., and Willcock, S.: The global forest above-ground biomass pool for 2010 estimated from high-resolution satellite observations, Earth Syst. Sci. Data, 13, 3927–3950, https://doi.org/10.5194/essd-13-3927-2021, 2021. a
Shugart, H. H., Wang, B., Fischer, R., Ma, J., Fang, J., Yan, X., Huth, A., and Armstrong, A. H.: Gap Models and Their Individual-Based Relatives in the Assessment of the Consequences of Global Change, Environ. Res. Lett., 13, 033001, https://doi.org/10.1088/1748-9326/aaaacc, 2018. a
Storch, T., Honold, H.-P., Chabrillat, S., Habermeyer, M., Tucker, P., Brell, M., Ohndorf, A., Wirth, K., Betz, M., Kuchler, M., Mühle, H., Carmona, E., Baur, S., Mücke, M., Löw, S., Schulze, D., Zimmermann, S., Lenzen, C., Wiesner, S., Aida, S., Kahle, R., Willburger, P., Hartung, S., Dietrich, D., Plesia, N., Tegler, M., Schork, K., Alonso, K., Marshall, D., Gerasch, B., Schwind, P., Pato, M., Schneider, M., De Los Reyes, R., Langheinrich, M., Wenzel, J., Bachmann, M., Holzwarth, S., Pinnel, N., Guanter, L., Segl, K., Scheffler, D., Foerster, S., Bohn, N., Bracher, A., Soppa, M. A., Gascon, F., Green, R., Kokaly, R., Moreno, J., Ong, C., Sornig, M., Wernitz, R., Bagschik, K., Reintsema, D., La Porta, L., Schickling, A., and Fischer, S.: The EnMAP Imaging Spectroscopy Mission towards Operations, Remote Sens. Environ., 294, 113632, https://doi.org/10.1016/j.rse.2023.113632, 2023. a
Turner, D. P., Ritts, W. D., Cohen, W. B., Gower, S. T., Running, S. W., Zhao, M., Costa, M. H., Kirschbaum, A. A., Ham, J. M., Saleska, S. R., and Ahl, D. E.: Evaluation of MODIS NPP and GPP Products across Multiple Biomes, Remote Sens. Environ., 102, 282–292, https://doi.org/10.1016/j.rse.2006.02.017, 2006. a
Verrelst, J., Rivera, J. P., van der Tol, C., Magnani, F., Mohammed, G., and Moreno, J.: Global Sensitivity Analysis of the SCOPE Model: What Drives Simulated Canopy-Leaving Sun-Induced Fluorescence?, Remote Sens. Environ., 166, 8–21, https://doi.org/10.1016/j.rse.2015.06.002, 2015. a, b
Wang, J., Lopez-Lozano, R., Weiss, M., Buis, S., Li, W., Liu, S., Baret, F., and Zhang, J.: Crop Specific Inversion of PROSAIL to Retrieve Green Area Index (GAI) from Several Decametric Satellites Using a Bayesian Framework, Remote Sens. Environ., 278, 113085, https://doi.org/10.1016/j.rse.2022.113085, 2022. a, b
Watt, M. S., Leonardo, E. M. C., Estarija, H. J. C., Massam, P., De Silva, D., O'Neill, R., Lane, D., McDougal, R., Buddenbaum, H., and Zarco-Tejada, P. J.: Long-Term Effects of Water Stress on Hyperspectral Remote Sensing Indicators in Young Radiata Pine, Forest Ecol. Manag., 502, 119707, https://doi.org/10.1016/j.foreco.2021.119707, 2021. a
Xiao, J., Chevallier, F., Gomez, C., Guanter, L., Hicke, J. A., Huete, A. R., Ichii, K., Ni, W., Pang, Y., Rahman, A. F., Sun, G., Yuan, W., Zhang, L., and Zhang, X.: Remote Sensing of the Terrestrial Carbon Cycle: A Review of Advances over 50 Years, Remote Sens. Environ., 233, 111383, https://doi.org/10.1016/j.rse.2019.111383, 2019. a, b
Yang, P., Verhoef, W., and van der Tol, C.: The mSCOPE Model: A Simple Adaptation to the SCOPE Model to Describe Reflectance, Fluorescence and Photosynthesis of Vertically Heterogeneous Canopies, Remote Sens. Environ., 201, 1–11, https://doi.org/10.1016/j.rse.2017.08.029, 2017. a, b
Zeng, Y., Hao, D., Huete, A., Dechant, B., Berry, J., Chen, J. M., Joiner, J., Frankenberg, C., Bond-Lamberty, B., Ryu, Y., Xiao, J., Asrar, G. R., and Chen, M.: Optical Vegetation Indices for Monitoring Terrestrial Ecosystems Globally, Nat. Rev. Earth Environ., 3, 477–493, https://doi.org/10.1038/s43017-022-00298-5, 2022. a, b, c, d, e, f, g, h
Zhang, H., Bai, J., Sun, R., Wang, Y., Pan, Y., McGuire, P. C., and Xiao, Z.: Improved Global Gross Primary Productivity Estimation by Considering Canopy Nitrogen Concentrations and Multiple Environmental Factors, Remote Sensing, 15, 698, https://doi.org/10.3390/rs15030698, 2023. a
Zhou, J.-J., Zhang, Y.-H., Han, Z.-M., Liu, X.-Y., Jian, Y.-F., Hu, C.-G., and Dian, Y.-Y.: Evaluating the Performance of Hyperspectral Leaf Reflectance to Detect Water Stress and Estimation of Photosynthetic Capacities, Remote Sens., 13, 2160, https://doi.org/10.3390/rs13112160, 2021. a