the Creative Commons Attribution 4.0 License.
the Creative Commons Attribution 4.0 License.
 | 20 Jan 2026
A novel laser-based spectroscopic method reveals the isotopic signatures of nitrous oxide produced by eukaryotic and prokaryotic phototrophs in darkness
Maxence Plouviez
Peter Sperlich
Benoit Guieysse
Tim Clough
Rahul Peethambaran
Naomi Wells
Prokaryotic and eukaryotic microscopic phototrophs (“microalgae”) can synthesize the potent greenhouse gas and ozone depleting pollutant nitrous oxide (N2O). However, we do not know how much microalgae contribute to aquatic N2O emissions because these organisms co-occur with prolific N2O producers like denitrifying and nitrifying bacteria. Here we demonstrate for the first time that microalgae produce distinct N2O isotopic signatures that will enable us to fill this knowledge gap. The eukaryotes Chlamydomonas reinhardtii and Chlorella vulgaris, and the prokaryote Microcystis aeruginosa synthesized N2O 265 – 755 nmol g-DW−1 h−1 when in darkness and supplied with 10 mM nitrite (NO). The N2O isotopic composition (δ15N, δ18O, and site preference, SP) of each species was determined using a modified off-axis integrated-cavity-output spectroscopy analyser with an offline sample purification and homogenisation system. The SP values differed between eukaryotic and prokaryotic algae (25.8 ± 0.3 ‰ and 24.1 ± 0.2 ‰ for C. reinhardtii and C. vulgaris, respectively vs 2.1 ± 3.0 ‰ for M. aeruginosa), as did bulk isotope values. Both values differ from SP produced by denitrifiers. This first characterization of the N2O isotopic fingerprints of microscopic phototrophs suggests that SP-N2O could be used to untangle algal, bacterial, and fungal N2O production pathways. As the presence of microalgae could influence N2O dynamics in aquatic ecosystems, field monitoring is also needed to establish the occurrence and significance of microalgal N2O synthesis under relevant conditions.
- Article
(1544 KB) - Full-text XML
- Press release
-
Supplement
(823 KB) - BibTeX
- EndNote


Nitrous oxide (N2O) is a strong atmospheric pollutant and one of the three major greenhouse gases with carbon dioxide (CO2) and methane (CH4) (IPCC, 2013; Tian et al., 2016; Tian et al., 2020). N2O is an intermediate molecule that is readily produced (and consumed) by a wide range of chemical and biological processes (Plouviez et al., 2018; Tian et al., 2020). For years, bacterial nitrification and denitrification were the only known major biological sources of N2O in the environment. However, it is now recognized N2O can also be emitted during fungal heterotrophic denitrification, archaeal ammonium oxidation and, as most recently evidenced, microalgal NO assimilation (Bellido-Pedraza et al., 2020; Plouviez et al., 2018; Teuma et al., 2023; Zhang et al., 2023). The ability of microalgae to synthesize N2O now challenges the “bacteria-centric” view that all N2O emissions from aquatic ecosystems are related to bacterial metabolism (Plouviez and Guieysse, 2020; Plouviez et al., 2018; Teuma et al., 2023).
Under the Paris agreement, many countries have set stringent targets to reduce all greenhouse gases to net zero by 2050 (den Elzen et al., 2025). This means that all sources need to be accounted for and that accurate methodologies are used for budgeting. In the case of N2O, the Intergovernmental Panel on Climate Change (IPCC) provides guidelines that are based on nitrogen inputs, and where a proportion of these inputs is assumed to generate reactive nitrogen (e.g. ammonia, nitrate etc.) that can potentially form N2O (Webb et al., 2019; Teuma et al., 2023). While pragmatic, the IPCC method was shown to significantly underestimate or overestimate N2O emissions from many aquatic ecosystems (Webb et al., 2019; Sun et al., 2025). Unpredictable aquatic N2O emissions are unsurprising given that N2O is a reactive intermediate species of multiple redox-regulated reactions and metabolic pathways (Stein and Klotz, 2016). Photoautotrophic N2O production further complicates this picture because these organisms influence oxygen availability, a parameter widely recognised to regulate N2O production vs consumption (Plouviez and Guieysse, 2020; Chang et al., 2022; Gruber et al., 2022). Process-specific monitoring is therefore required for accurate inventories and mitigation strategies. Isotopic information on the processes driving N2O fluxes (Denk et al., 2017; McCue et al., 2019) potentially provides an effective tool for improving the accuracy of greenhouse gas inventories (Park et al., 2012) and more efficient mitigation strategies (Gruber et al., 2022).
Small variations in the natural abundance of atoms with different mass of the same element (stable isotope signatures) have been widely used to track interactions between, e.g., living organisms or waters (Glibert et al., 2018; Klaus and McDonnell, 2013). Stable isotopes are also a powerful tool to trace biogeochemical reactions – including identifying the source of greenhouse gases. This is because the biological and chemical processes that produce greenhouse gasses generally have a distinct “preference” for light vs heavy isotopes that, once known, can be used to “fingerprint” the origin of a given gas. For instance, isotopic signatures in methane produced from phytoplankton were used to verify the methane as biogenic (Klintzsch et al., 2023). Isotope tracers can be particularly powerful for N2O, where biogeochemical source information is imprinted on both its two stable isotopes (δ15N, δ18O) and the intermolecular position of 15N within the molecule (site preference, SP-N2O) (Denk et al., 2017; Ostrom and Ostrom, 2017; Yu et al., 2020). SP-N2O is uniquely powerful because these signatures tend to be mass-independent, meaning that they do not vary with the reaction rate or the isotopic composition of the substrate. Yet these analyses require highly specialised and expensive equipment which has limited their development and implementation. Advances in laser technology promised affordable, high-throughput N2O isotopic analyses, but their environmental application remains limited by complex analytical effects due to sample matrix and non-linear instrument responses (Harris et al., 2020).
Here we describe a new method for the accurate laser-based analysis of N2O isotopes, which has enabled us to, for the first time, measure the SP-N2O signatures of microalgae and cyanobacteria in darkness. Our study demonstrated that microalgae have specific SP-N2O signatures. While further research is needed, our study is a first step to ultimately develop process-specific N2O monitoring from aquatic ecosystems.
2.1 N2O synthesis from C. vulgaris, C. reinhardtii, and M. aeruginosa
Chlorella vulgaris, Chlamydomonas reinhardtii, and Microcystis aeruginosa have been reported to synthesize N2O (Table 1). Following the protocol from (Plouviez et al., 2017), pure cultures of these three species were incubated in darkness and supplied with NO to trigger N2O synthesis. The rates measured during this study are in the same order of magnitude to the ones reported previously for phototrophs (Table 1), however, lower than the rates reported by denitrifiers cultures (2544 ± 156 nmol N2O h−1 g-DW−1, n=3, further details about the denitrifier cultures can be found in Supplement Sect. S1).
Table 1The production rate and isotope composition of N2O by two eukaryotic microalgae (C. reinhardtii and C. vulgaris) and one prokaryotic cyanobacteria (M. aeruginosa). Values for N2O production and SP are reported as the mean ± SD of laboratory replicates, and the range of analytical uncertainty of the individual SP measurement (Utot) are also shown. Values for bulk isotopes (δ15N-N2O and δ18O-N2O) are reported as the mean ± SD of the laboratory replicates relative to the minimum – maximum source isotope range for NO and H2O, respectively. Letters indicate differences between species, see footnotes for associated ANOVA outputs.
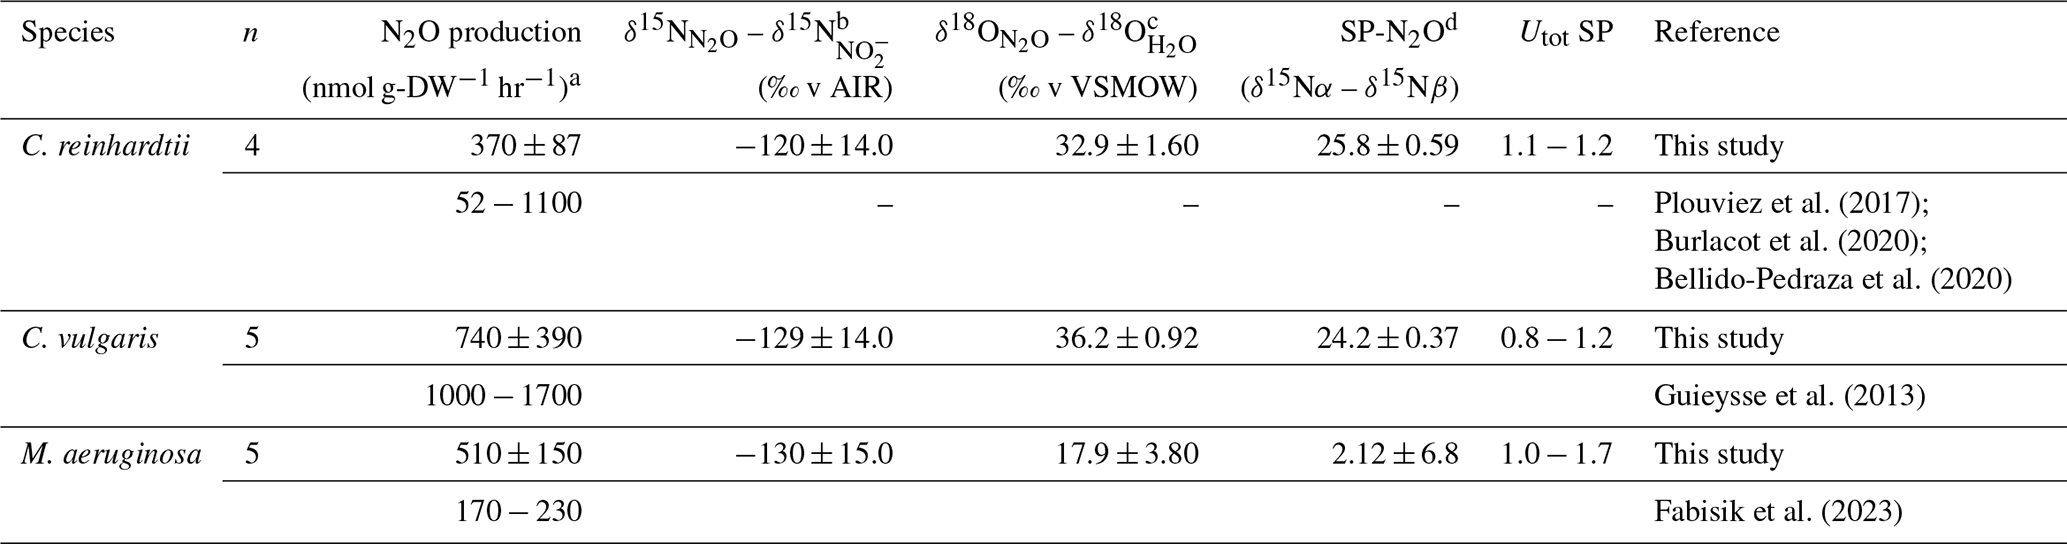
F represents the F-statistic computed for ANOVA tests of difference. a F = 62, p<0.0001. b F = 1200, p<0.0001. c F = 41, p<0.0001. d F = 45, p<0.0001.
Several broadly distributed N2O synthesis pathways have been described in microalgae. Microalgal N2O synthesis involves the reduction of NO into nitric oxide (NO) and the subsequent reduction of NO into N2O. NO synthesis via NOS synthases has previously been ruled out for both C. vulgaris and C. reinhardtii (Plouviez et al., 2017). In C. reinhardtii, NO reduction into NO, is catalyzed by the dual enzyme nitrate reductase–NO-forming nitrite reductase, NR-NOFNR (Plouviez et al., 2017) or the copper-containing nitrite reductase, NirK (Bellido-Pedraza et al., 2020). In light, NO reduction into N2O is mediated by flavodiiron proteins (FLVs) in the chloroplast using electrons from photosynthesis. By contrast, NO reduction into N2O, is catalyzed by cytochrome P450 in darkness (Plouviez et al., 2017; Burlacot et al., 2020). The presence of homologous proteins in C. vulgaris and C. reinhardtii (Bellido-Pedraza et al., 2020) and biochemical evidence from (Guieysse et al., 2013) strongly suggest that C. vulgaris and C. reinhardtii synthesize N2O using a similar biochemical pathway. During our experiment performed in darkness, it is likely that the N2O was synthesised via NO reduction by the cytochrome P450, CYP55. Because different enzymes are involved according to the light conditions experienced by eukaryotic microalgae (i.e. FLVs vs cytochrome P450), further research is critically needed to investigate the influence of light on SP-value reported from microalgae.
Fabisik et al. (2023) suggested a strong similarity between the biochemical pathways of N2O biosynthesis in the cyanobacterium M. aeruginosa and in the green microalgae C. reinhardtii, with M. aeruginosa harbouring homologs of the key proteins (NirK, CYP55, FLVs) involved in N2O synthesis in C. reinhardtii. However, the vastly different site preferences between the eukaryotic and prokaryotic N2O measured (see Sect. 2.3 below) would suggest different proteins are involved in the reduction of NO into N2O in eukaryotic and prokaryotic phototrophs. For instance, in eukaryotes, NOR belongs to the cytochrome P450 family. In contrast prokaryotic NORs are related to the haem/copper cytochrome oxidases and these enzymes fall into two subclasses according to the electron donors used (Hendriks et al., 2000). Further research involving, for example, knock out mutants is therefore needed to confirm which protein catalyses the reduction of NO into N2O in cyanobacteria. While a similar biochemical pathway to eukaryotic microalgae was suggested by (Fabisik et al., 2023) for M. aeruginosa, this remains to be elucidated.
2.2 Performance of the modified off-axis integrated-cavity-output spectroscopy analyser after sample preparation on an offline matrix purification and homogenisation system
Our analytical approach (Sect. 4) accounts for complex challenges previously reported for this instrument type (Harris et al., 2020). Accuracy and reproducibility of the combined sample purification and laser analysis procedure was verified in each measurement sequence by repeated analysis of a quality control standard. For that purpose, aliquots of USGS52-in-air were decanted in a sampling bag to be extracted, processed and analysed in the same way as the microalgal and cyanobacterial samples. This resulted in eight USGS52-in-air measurements that we used to quantify the reproducibility of SP-N2O of 0.4 ‰ as per Werner and Brand (2001) and the accuracy of −0.3 ‰ (Fig. 1), which is in agreement with the certified USGS52 value within the measurement uncertainty.
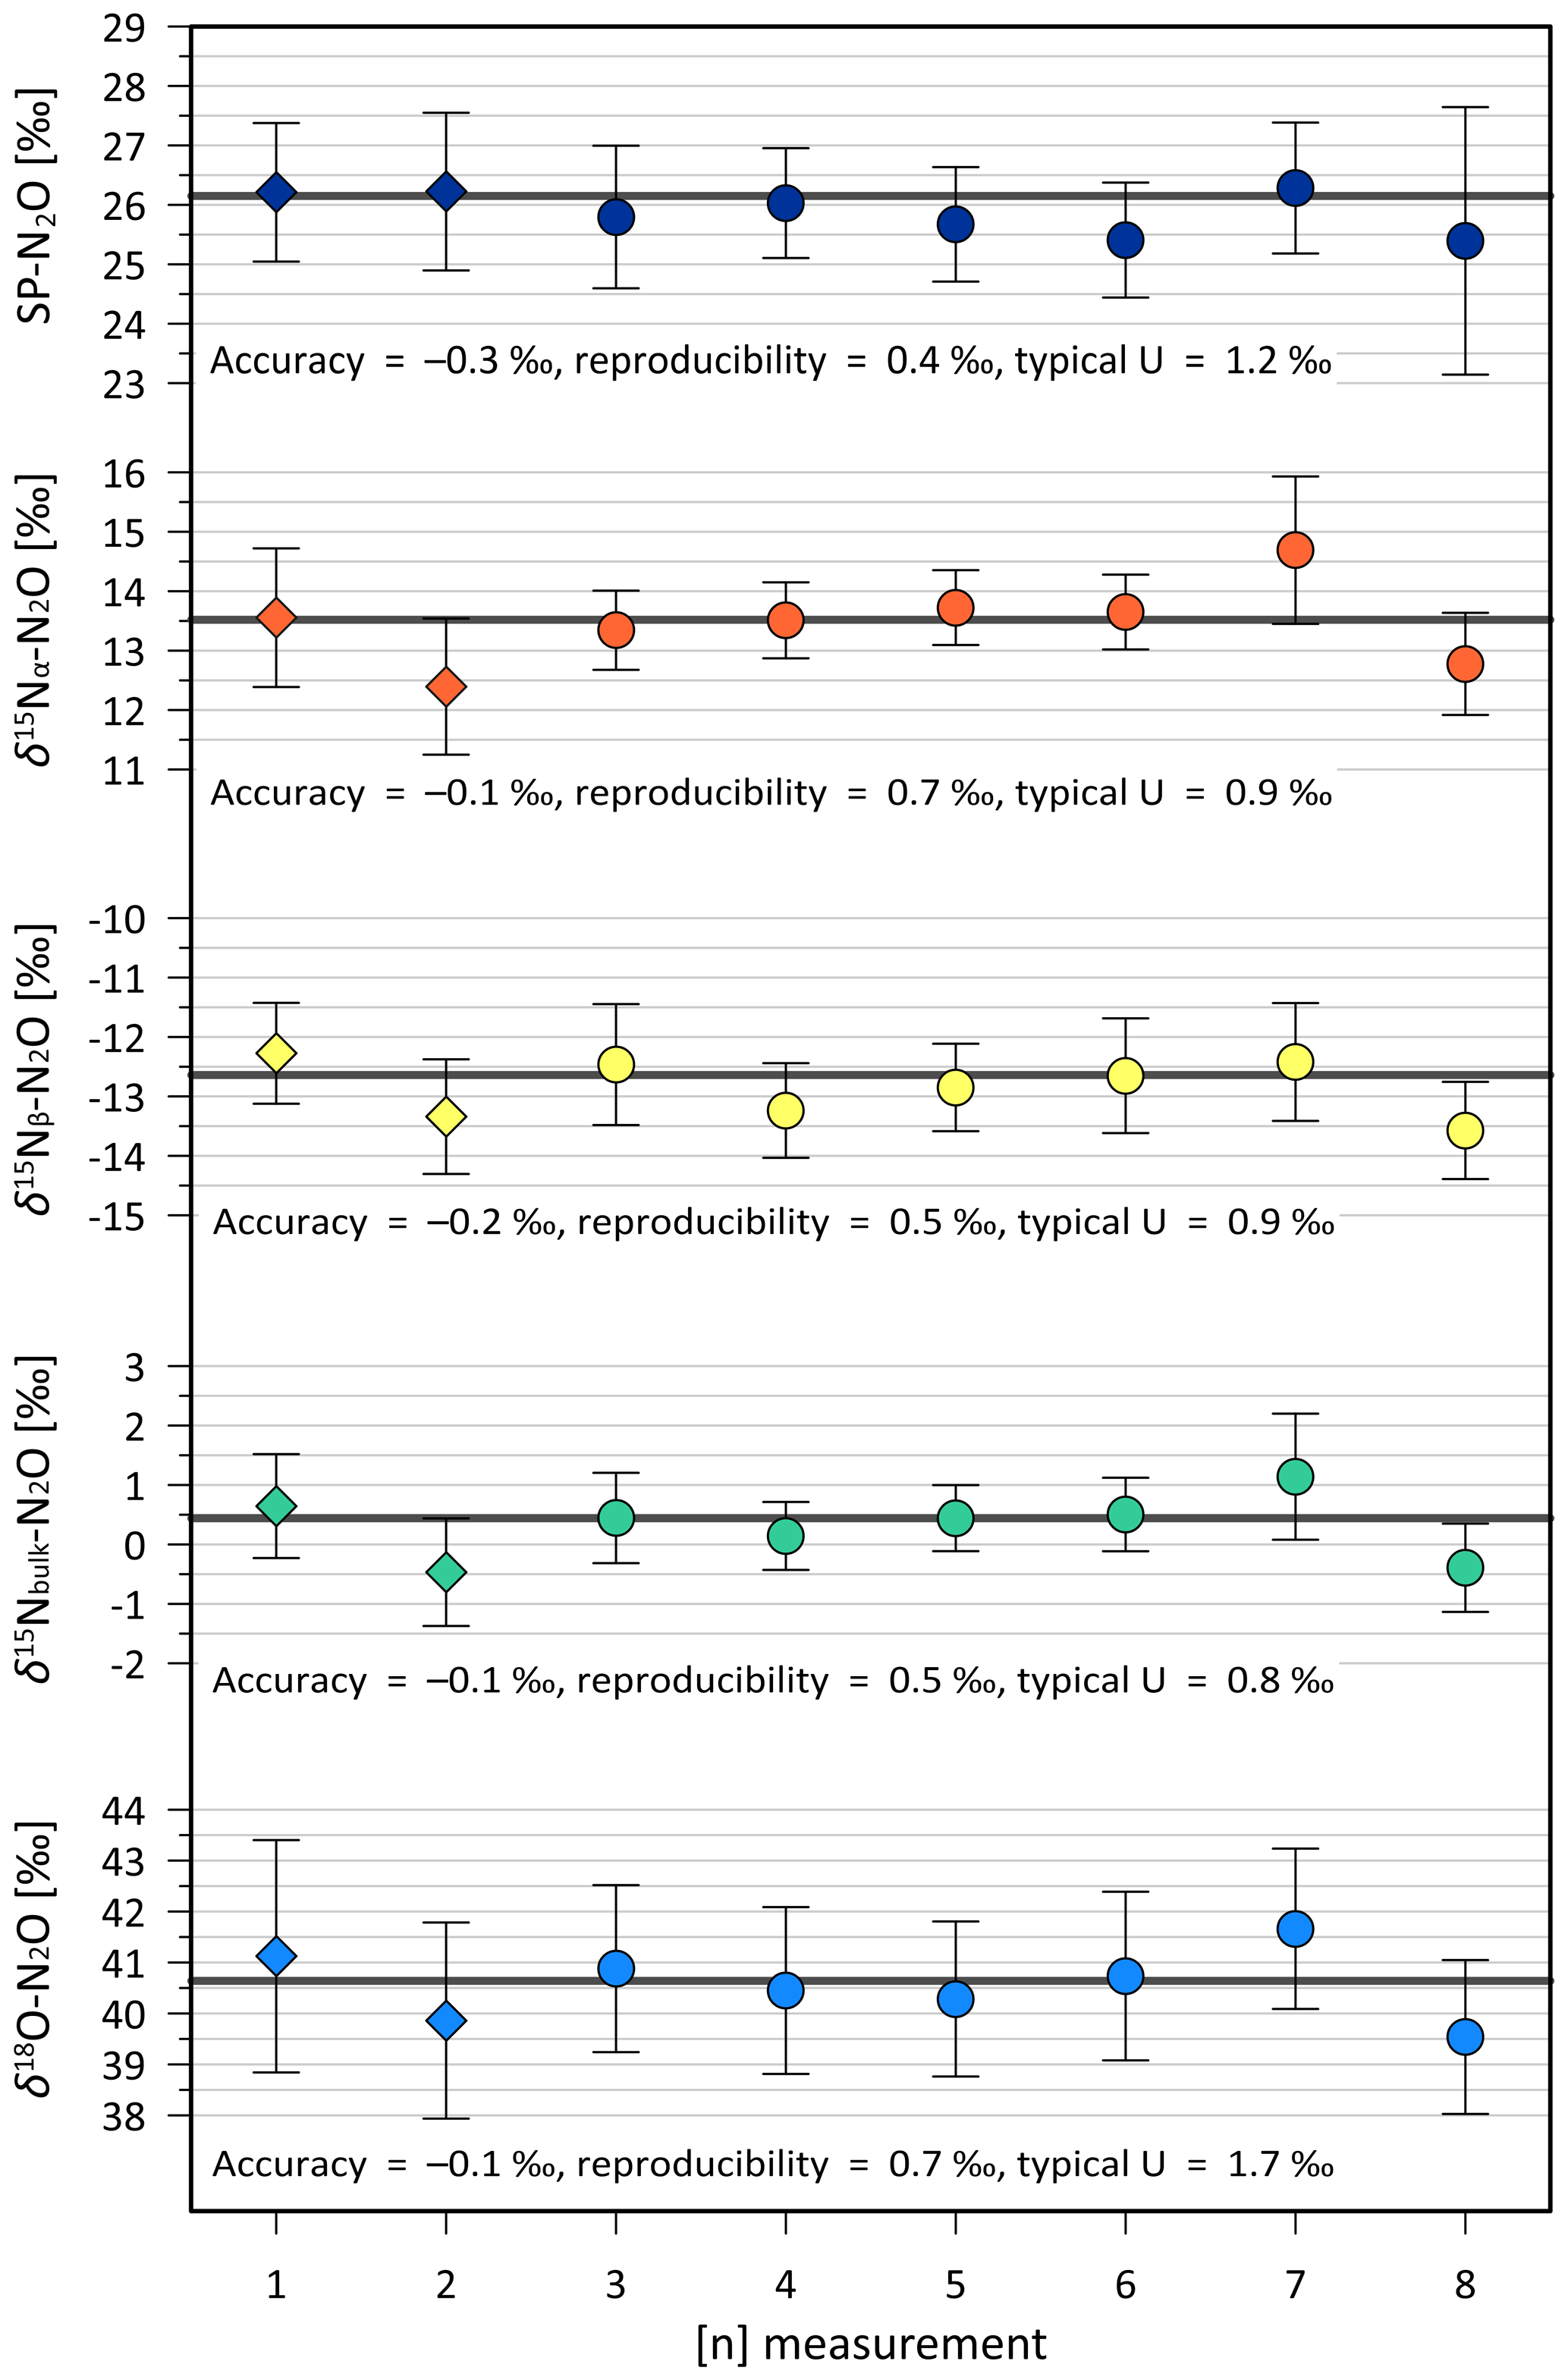
Figure 1Reproducibility of the analytical system for all isotopomer species. Diamonds show isotope results from USGS52-in-air measurements used to verify the robustness of the extraction system. Filled circles show measurements of USGS52-in-air as quality control standard during the measurements of unknown samples. Error bars indicate the propagated uncertainty for each measurement. Thick black lines indicate the target value for USGS52 (Table A2). Typical uncertainty (U) is calculated as the average of the uncertainties from each individual point in the respective panel.
2.3 SP-N2O values from C. vulgaris, C. reinhardtii, and M. aeruginosa
The eukaryotic microalgae (C. reinhardtii and C. vulgaris) and the cyanobacteria (M. aeruginosa) tested synthesized N2O and consistently produce a SP-N2O signature meaning there is a clear isotope preference during N2O production (Table 1 and Fig. 2). The SP-N2O signatures of the eukaryotic microalgae were similar (25.8 ± 0.59 ‰ and 24.1 ± 0.37 ‰, respectively) and significantly different to the SP-N2O from M. aeruginosa (2.1 ± 6.8 ‰), meaning this could indeed be used to distinguish between photosynthetic N2O producers.

Figure 2(a) The range of SP-N2O reported for different N2O production pathways from previously published values (Denk et al., 2017) in white (above dashed line) and obtained from this study in colour (below the dash line). The centre lines of the box show the median, the box edges the quartiles and the whiskers represent minimum/maximum values. (b) Findings from this study on the 3D N2O isotope composition for microalgae (C. vulgaris, C. reinhardtii), cyanobacteria (M. aeruginosa) and bacterial denitrifier samples, where bulk isotopes (δ18O-N2O and δ15N-N2O) are reported relative to H2O (δ18O-N2O – δ18O-H2O) and NO (δ15N-N2O – δ15N-NO), respectively. Error bars represent uncertainty in substrate correction (note δ18O-N2O error bars are too small to visualise, see Table 1 for values). See Table 1 for microalgal and cyanobacterial N2O production rates.
With several biochemical pathways potentially involved and unknowns (e.g. which protein is involved in M. aeruginosa NO reduction to N2O), consideration is, however, needed. The similarity of the isotopic signatures from the eukaryotic microalgae could be expected considering that both are chlorophyta, confirming that this division uses a consistent N2O biosynthetic pathway (Bellido-Pedraza et al., 2020; Plouviez et al., 2017). Nevertheless, this needs to be further confirmed by testing other chlorophyta and eukaryotic taxons (Timilsina et al., 2022).
The SP-value measured for M. aeruginosa is similar to that reported by Wang et al. (2024) for the bacteria P. aeruginosa, meaning that M. aeruginosa could use a similar biochemical pathway for N2O synthesis. However, no hits were found from a BLASTP search (BLAST: Basic Local Alignment Search Tool, https://blast.ncbi.nlm.nih.gov/Blast.cgi, last access: 4 December 2025) for the flavohemoglobin (A0A0H2ZC95) or NORb (A0A0H2ZLE2) or NORc (A0A0H2ZKE8) involved in NO reduction to N2O in P. aeruginosa (Wang et al., 2024). While M. aeruginosa harbour a homolog to C. reinhardtii P450, the difference in SP-value would suggest that a different protein is involved. As suggested in Sect. 2.1, further research is therefore needed to confirm the protein that catalyses the reduction of NO to N2O in cyanobacteria.
Overall, the values reported in this study are in systematic agreement with SP-N2O results from different categories of N2O sources. For the eukaryotic microalgae these signatures were distinct from bacterial denitrifiers (Fig. 2). In contrast, cyanobacteria SP-N2O overlapped with bacterial denitrifiers. These findings suggest, first, that N2O isotopomer data from eutrophic waterways where both cyanobacteria and denitrifiers are likely to be abundant should be interpreted with care, and, second, that SP-N2O could be used to untangle microalgal and denitrifier contributions to aquatic N2O emissions by comparing environmental signatures to site-specific SP-N2O community end-members. Using the full suite of isotopic information within the N2O molecule could greatly strengthen environmental identification of algal N2O production (see, e.g., Wu et al., 2019): the process potentially uniquely combine “intermediate” SP values with isotopically depleted δ15N (which even weak kinetic fractionation during NO reduction to N2O would produce given the low yields, Martin and Casciotti, 2016) and enriched δ18O (oxygen isotope effects are more complex, but high values could reflect oxygen exchange and associated equilibrium fractionation (Rohe et al., 2017; Barford et al., 2017)).
In natural environments, N2O can be abiotically produced by chemo-denitrification (Stanton et al., 2018) or photochemically (Leon-Palmero et al., 2025). In addition, N2O can be both produced and consumed by organisms (bacteria, fungi, archaea, plants – and algae) with very different life cycles, functions, and growth requirements. These organisms can synthesise N2O as an intermediate, by-product, or end-product (Plouviez et al., 2018; Stein and Klotz, 2016; Bakken and Frostegård, 2017; Shan et al., 2021; Butterbach-Bahl et al., 2013), which makes N2O emissions particularly difficult to track when simply measuring changes in N2O concentration. Empirical reports of contradictory responses to environmental fluctuations highlight the need for process-based measurements in order to accurately predict, and thus manage, aquatic N2O emissions. Microalgal N2O production could contribute to these seemingly contradictory responses. Preliminary testing of a mixed gas sample from a denitrification reactor and C. vulgaris cultures showed that our methodology could provide the tool needed to start untangling this contribution as it will enable identifying and quantifying the source of the N2O based on isotopic signatures in a mixed sample (Supplement Sect. S2). Further testing using environmental samples is now needed to establish the suitability of the method for N2O process-specific monitoring. As mentioned above, N2O can be synthesized via several biotic and abiotic synthetic pathways under natural conditions. To accurately attribute N2O sources in complex environments it is therefore essential to consider the full spectrum of biotic and abiotic processes that may contribute to its production.
Microalgae, including the ones selected for this study, are ubiquitous in the environment (Fabisik et al., 2023; Hou et al., 2023; Sasso et al., 2018). While we know that microalgae can synthesise N2O, we actually know little about the occurrence and environmental significance of microalgal N2O synthesis in ecosystems where algae are abundant, such as eutrophic environments (Plouviez et al., 2018). Human-related pollution causes massive eutrophication worldwide (e.g. 30 %–40 % of the world's lakes are affected by eutrophication) so even a relatively “modest” microalgal N2O production could be globally significant (DelSontro et al., 2019). Indeed, our findings suggest that some of the fluctuations in SP-N2O reported during algae blooms (Glibert et al., 2018; Wang et al., 2023) could be due to N2O production by microalgae. Understanding N2O emissions from cyanobacteria and microalgae in aquatic ecosystems have, therefore environmental (climate science and nutrient management), and ecological (role of microalgae in N cycling) implications.
For the first time we characterized the isotopomer signatures of the microalgae C. reinhardtii, C. vulgaris and the cyanobacteria M. aeruginosa. This demonstrate that these phototrophs exhibit clear signatures in isotopomers during N2O production. Importantly, the method should now be implemented for field samples to determine the true significance and dynamics of N2O synthesis by microalgae in aquatic ecosystems.
A1 Strain and culture maintenance
Axenic Chlamydomonas reinhardtii 6145 was obtained from the Chlamydomonas resource center (Home – Chlamydomonas Resource Center (https://chlamycollection.org, last access: 4 December 2025)). Axenic Chlorella vulgaris UTEX 259 and Microcystis aeruginosa UTEX 2385 were both obtained from the culture collection of the University of Texas at Austin (https://utex.org/, last access: 4 December 2025). Pure cultures were maintained on 250 mL TAP (C. reinhardtii, (Plouviez et al., 2017), BG 11 (C. vulgaris, Guieysse et al., 2013) and low-phosphate minimal media (M. aeruginosa, Cliff et al., 2023) incubated at 25 °C (INFORS HT Multitron) under continuous illumination (20 µmol cm−2 s−1) with agitation (150 rotation per minutes, rpm) at a temperature of 25 °C and a CO2 supply (1 % vol:vol). Cultures thus incubated for 2 weeks were re-suspended on fresh media 50 % vol:vol.
A2 Cultivation and Bioassays
The three species were grown as described above for 7 d. Following the protocol described by Guieysse et al. (2013), on the day of the experiment, 15 mL aliquots were withdrawn from the cultures to measure the cell dry weight (DW). Then, 25 mL aliquots were centrifuged at 4400 rpm for 3.5 min. The supernatants were discarded, and the pellets were re-suspended in N-free medium. Twenty-five mL aliquots of these suspensions were transferred into 120 mL serum flasks and supplied 10 mM NaNO2. The flasks were immediately sealed with rubber septa and aluminium caps and incubated at 25 °C under continuous agitation (150 rpm) and darkness for 72 h. Unless otherwise stated, cultures were run in triplicates. All glassware and media were autoclaved prior to the experiments.
A3 GC Analysis
Gas samples (5 mL) were withdrawn from the flask headspace using a syringe equipped with a needle. The headspace N2O concentration in those samples was then quantified using gas chromatography (Shimadzu GC-2010, Shimadzu, Japan) as described by Fabisik et al. (2023).
A4 Gas collection and bag preparation
In line with (Gruber et al., 2022; Ding et al., 2025), we use aluminium-lined multi-layer foil gas sampling bags (3 L, Restek, https://www.restek.com/global/en/p/22950, last access: 4 December 2025). Sample bags were flushed 3 times with instrument grade N2 (i.e. purity level of at least 99.99 % N2). Each bag was then filled with 1 L of instrument grade N2. N2O gas sample withdrawn from the flasks' headspace were injected in the bag via the septa at the valve using a syringe and needle. Each bag had a final N2O concentration between 8 and 16 ppm. The volume injected in each bag was specific to each flask and based on the N2O amount measured by the GC (ranging from 2–80 mL for the denitrifier and the eukaryotic microalgal cultures, respectively), before the gas samples were couriered to the National Institute of Water and Atmospheric Research (NIWA) facility in Wellington for SP-N2O analysis.
A5 Cryogenic Extraction of N2O from gas Samples for Isotopic Analysis
A vacuum extraction line was built at NIWA to prepare the samples for SP-N2O analysis (Fig. A1). This was needed to (i) transfer the N2O into a natural air matrix to avoid air matrix artefacts, (ii) to remove H2O and CO2 as both species interfere with SP-N2O measurements in the analyser, and (iii) to adjust the N2O mole fraction to around 1 ppm to minimise N2O amount effects (Harris et al., 2020). A mass flow controller (0–300 mL min−1, Bronkhorst, The Netherlands) was used to control the flow rate of the sample gas and the N2O-free air. A first chemical trap containing magnesium perchlorate (Thermo Scientific, USA) and Ascarite (Sigma Aldrich, USA) was used to removed H2O and CO2. This is followed by two cryogenic traps made from double loops of stainless-steel tubing with outer diameters of inch (12.7 mm) (T1, large extraction trap) and inch (3.18 mm) (T2, small focus trap) that could be submerged in liquid nitrogen (LN2).
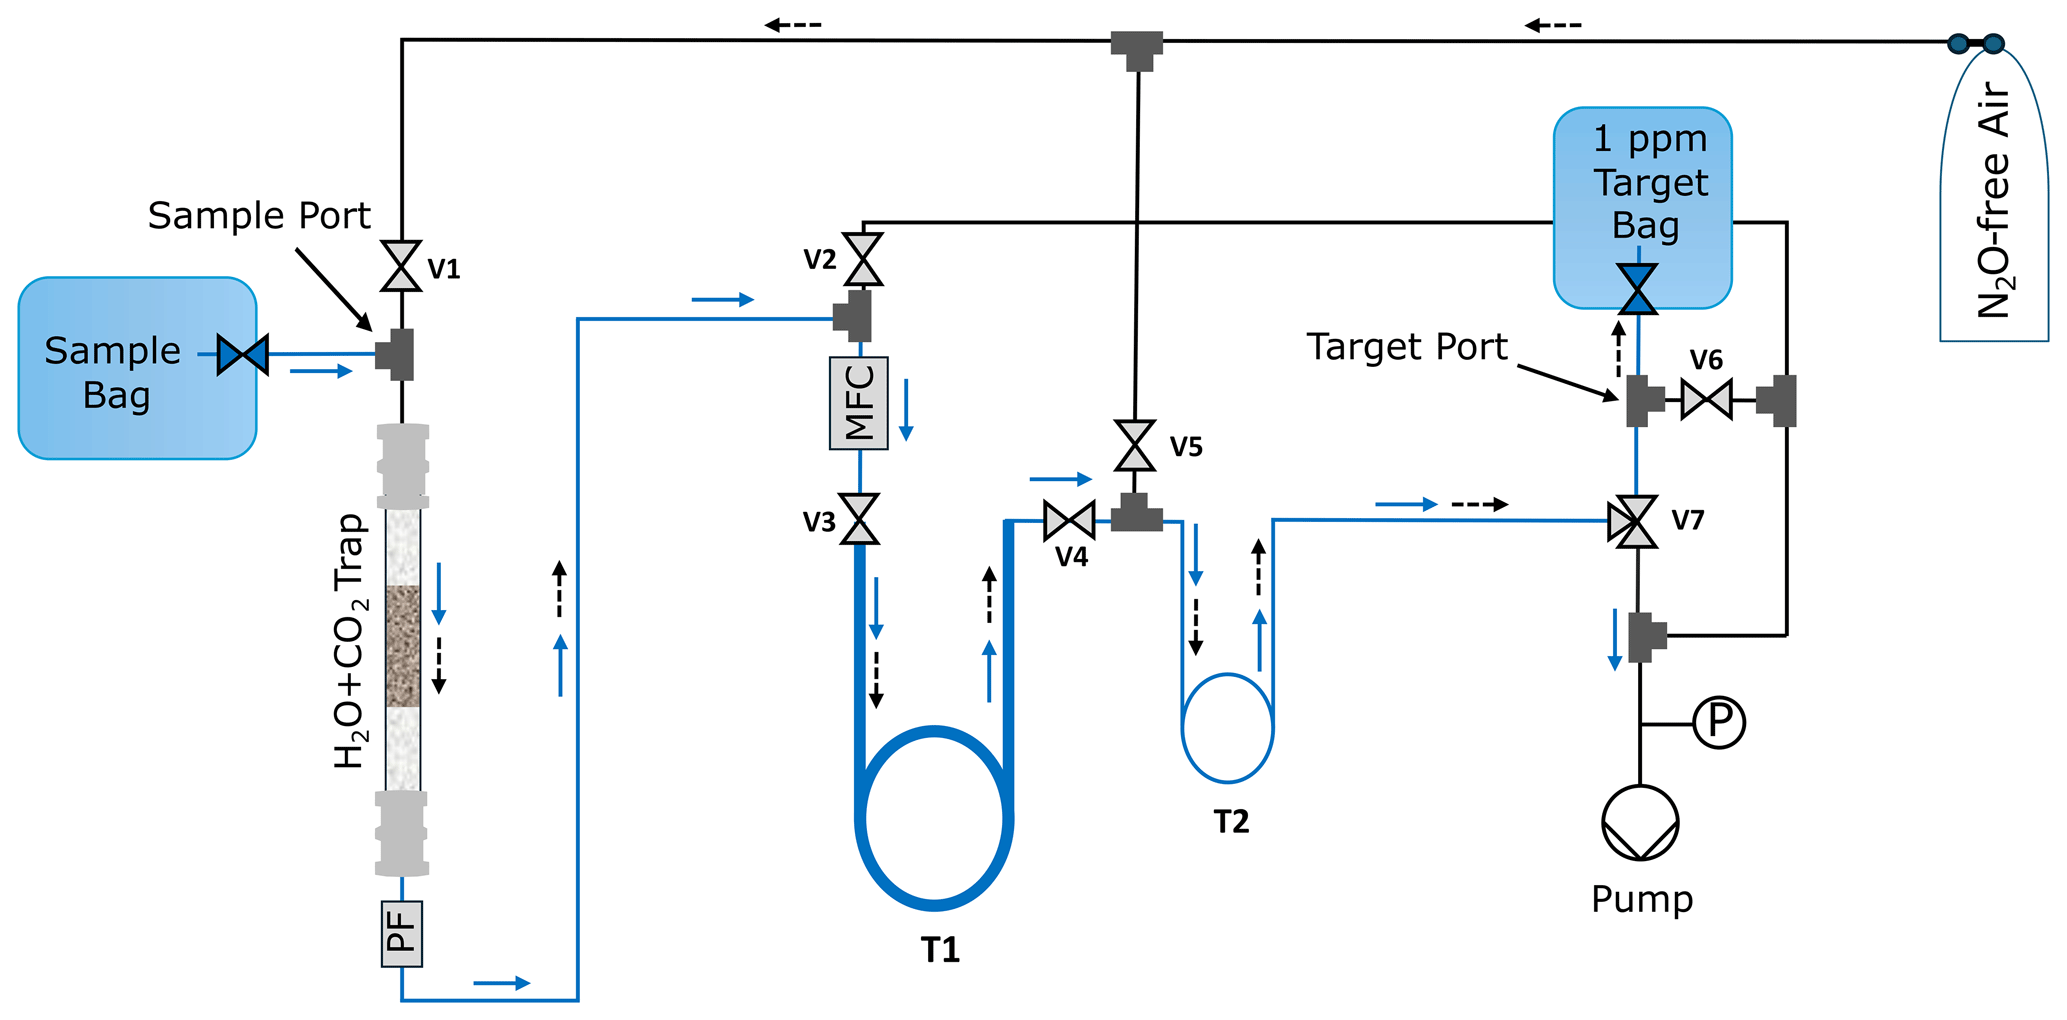
Figure A1Schematic of the N2O extraction line with sample and target bags. The flow pathways for the sample gas are indicated by solid blue arrows.
For each sample, the volume of N2O required to achieve a mixing ratio of 1 ppm in a 2500 mL mixing volume was calculated based on the measured sample bag mixing ratio. The gas sample was then extracted at a flow rate of 100 mL min−1 until the required sample amount was processed (solid blue arrows, Fig. A1). This facilitated the trapping of N2O molecules in the traps T1 and subsequently in T2, both of which were maintained in LN2. Subsequently, the volume of N2O-free air required to achieve a 1 ppm concentration was passed through traps T1 and T2 at room temperature at a flow rate of 300 mL min−1 for 8 min and 20 s, respectively, carrying the extracted N2O sample into the target bag.
A6 Isotopic analysis of N2O
A6.1 SP-N2O analyser and considerations of known analytical challenges
Site preference in N2O (SP-N2O) was measured using an optical analyser (model N2OIA-23e-EP , Los Gatos Research, USA), referred to as LGR throughout. LGR measures only major isotopologues and neither clumped isotopologues nor δ17O-N2O. This continuous-flow analyser operates at sample flow rates of 80 mL min−1, it has an optical cavity volume of ∼ 900 mL and operates at gas pressures around 57 mbar within the cavity. The LGR responds to pressure changes at the sample inlet port by gradually adjusting the cavity pressure with a time lag, causing a pressure-dependent bias in the reported SP-N2O and N2O mole fractions (Radu et al., 1998). Moreover, this instrument includes a significant N2O concentration bias, where reported isotope values can vary strongly with N2O mole fractions (Fig. S2, Supplement Sect. S3), following a non-linear function (Griffith, 2018; Harris et al., 2020). Consequently, differences in gas pressure within the cavity, the presence and amount of interferant gases and in the N2O mole fractions between the measurements of samples and reference gases, need to be carefully controlled and accounted for to achieve accurate isotope measurements of the samples (Harris et al., 2020). The following sub-sections describe the required steps to achieve accurate and reproducible isotope measurements using the LGR.
A6.2 Control of cavity pressure and interferants: Modified gas inlet and sample control system
To achieve accurate SP-N2O measurements a modified sample inlet system was installed inside the LGR (Fig. A2). This modification allowed changing of the LGR operation from continuous flow mode to a discrete mode by switching gas flows using solenoid valves (Series 9 and Series 99, Parker, USA). In discrete mode, the flow scheme includes a cylindrical stainless steel volume of 30 mL, which we refer to as the Mixing Volume (MV) (Fig. A2). Four solenoid valves are welded onto the MV to: (i) inject sample gases and N2O-free air into the MV, (ii) to inject the sample into the cavity of the LGR and iii) to connect a vacuum pump (model XDS 35i, Edwards, UK) for evacuation. This pump is also used to evacuate the analyser cavity to ∼ 0.02 mbar between samples via a solenoid valve with a large diameter orifice to ensure rapid evacuation ( inch (9.53 mm) orifice, A15 type, Parker, USA) installed at the cavity outlet. The MV was furthermore equipped with a pressure gauge (0–2.5 bar, 21Y model, Keller Pressure, Winterthur, Switzerland). A chemical trap with magnesium perchlorate (Thermo Scientific, USA) and Ascarite (Sigma Aldrich USA) is installed upstream of the sample gas port to remove both H2O and CO2, respectively, from samples (and reference gases) to below 5 ppm H2O and 0.5 ppm CO2 (Sperlich et al., 2022). A manifold of eight solenoid valves (V100, SMC, Japan) allowed injecting N2O-free air, two isotope reference gases for N2O, one quality control standard and up to four samples through the scrubber into the MV (Fig. A2). The sample inlet system is fully automated through a LabView interface (National Instruments, Austin, Texas, USA), combining gas control through scripted measurement sequences and the acquisition of all LGR and gas control data within a single output file. With this system, sample and reference gases can be injected into the MV at controlled pressures, achieving an average variation of 0.5 ± 0.3 mbar (1σ), resulting in an average magnitude of 0.6 ± 0.7 ‰ (1σ) for the pressure correction of reported SP-N2O values.
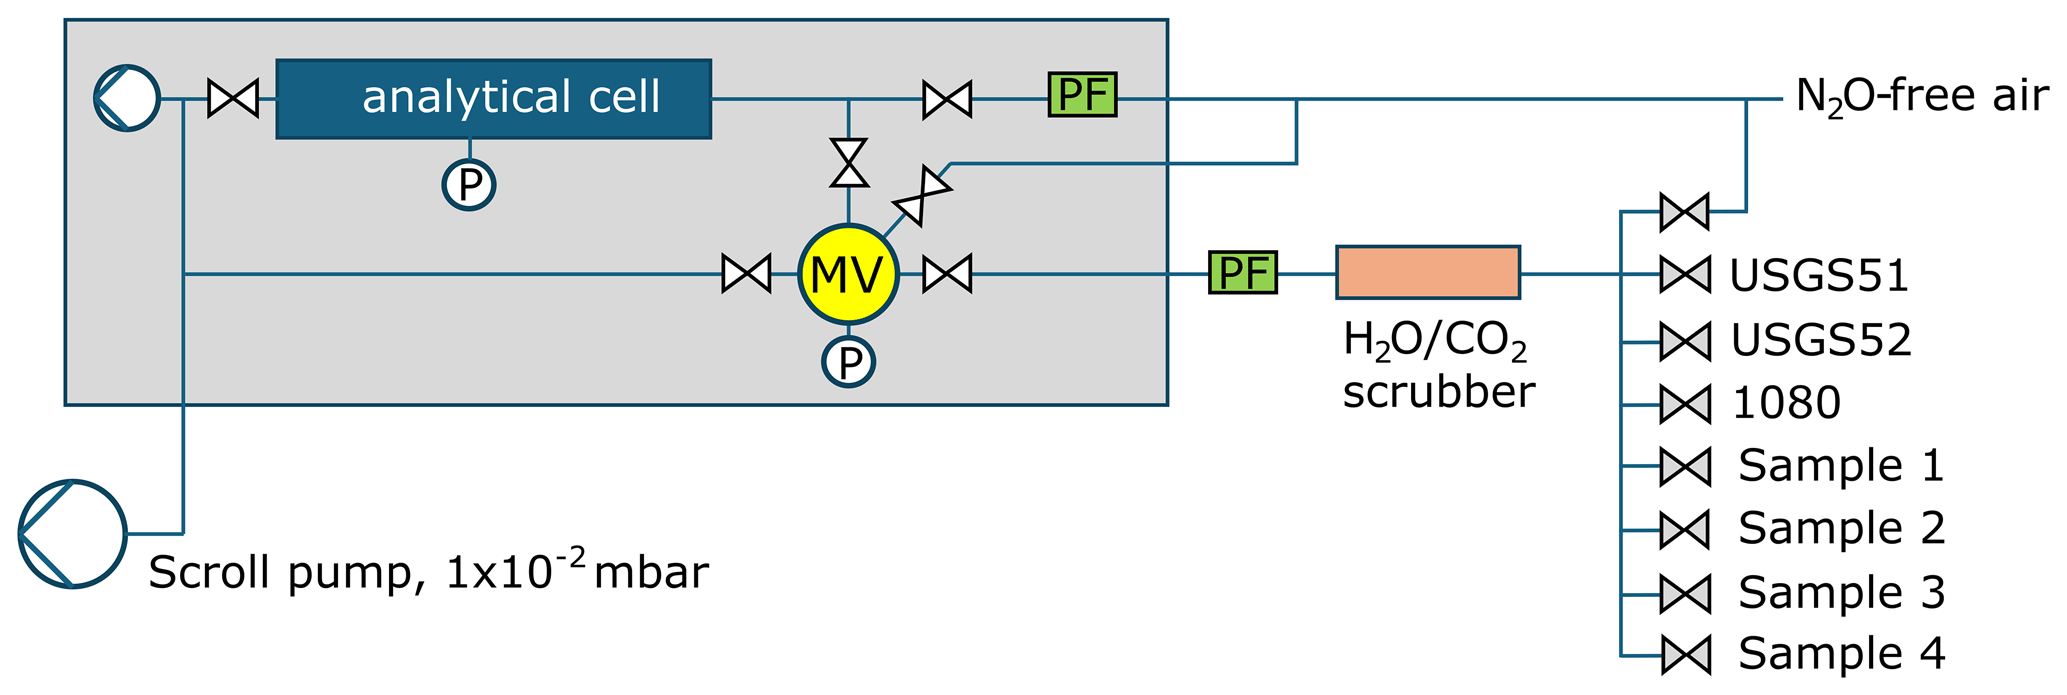
Figure A2Schematic of the LGR N2O isotopomer analyser (grey box), showing the installed mixing volume with pressure gauge and solenoid valves for gas handling and dilution. External additions include the scroll pump, as well as a particle filter and a CO2 scrubber to remove H2O and CO2 in gas samples supplied from the valve manifold.
The pressure correction was determined using four gas mixtures with N2O mole fractions of 380, 1080, 2100 and 3300 ppb. The effect of variable cell pressure on N2O mole fractions and all measured isotope species was linear across the relevant pressure range (Fig. S3, Supplement Sect. S3). However, the slope of that effect changed with the N2O mole fraction. Slopes of the pressure corrections for N2O and all isotopomer species were determined using polynomial fits (Fig. S3, Supplement Sect. S3).
A6.3 Gases used
Gases used for sample preparation or as standards are summarised in Table A1. At the time of publication, reference gases for N2O mole fractions exceeding the atmospheric range of ∼ 0.35 ppm were not available to our laboratory. Therefore, all N2O mole fractions reported in this study are raw data and only used for sample processing purposes. A working standard was prepared by filling a cylinder with clean, Southern Ocean baseline air with the addition of pure N2O to achieve a mole fraction of around 1080 ppb. Blocks of this working standard were implemented into each measurement sequence to monitor and correct for instrumental drift. We used “cryogenically purified air” (Praxair, California USA) with a certified N2O mole fraction blank of <1 ± 1 ppb as N2O-free air. N2O-free air is used to flush the analyser as well as for the dilution of sample and reference gases.

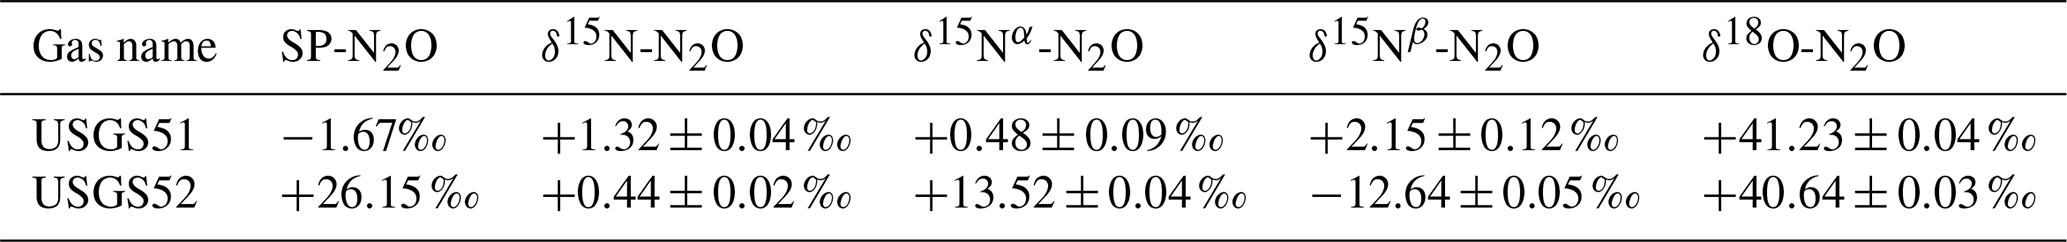
The instrument was calibrated for SP-N2O, δ15Nα-N2O, δ15Nβ-N2O, δ15Nbulk-N2O, and δ18O-N2O using USGS51 and USGS52 (Ostrom et al., 2018), purchased from the US Geological Survey and with isotope values shown in Table A2. Aliquots of both gases were transferred into 30 L Luxfer cylinders (Praxair, California USA) and diluted with N2O-free air to target mole fractions of 3.5 ppm. This resulted in two cylinders, one each with USGS51-in-air and USGS52-in-air mixtures at filling pressures of 40 bar, for which we applied the isotope values (Table A2) of the USGS51 and USGS52 certification (Ostrom et al., 2018).
Table A2Certified SP-N2O values for USGS51 and USGS52, adopted for the USGS51-in-air and USGS52-in-air reference gases (Ostrom et al., 2018) and used for value assignment of the reported measurements in a 2-point calibration for SP-N2O. Both δ15N-N2O and δ18O-N2O are determined in a 1-point calibration based on USGS51 only.
A6.4 Matching N2O amounts in samples and reference gas to minimise N2O amount correction
Following the extraction, purification and dilution, all samples were connected to the sample inlets on the LGR and tested for their N2O mole fraction first. N2O mole fraction values were used to calculate the dilution factor needed to match N2O mole fractions between each sample and each bracketing reference gas measurement. These dilution factors are incorporated into each measurement sequence to control valve switching times and target pressures during the injection of samples, reference gases and N2O-free air into the MV. For example, the target N2O mole fraction in the extracted samples was 1 ppm. With a N2O mole fraction of 3.5 ppm in the USGS51-in-air reference gas, the latter needed to be diluted with N2O-free air to match the mole fraction of the sample of 1 ppm. The system achieved average N2O mole fraction matches within 61 ± 42 ppb (1σ), resulting in an average correction of 1.4 ± 0.9 ‰ (1σ) for SP-N2O. While this strategy is technically cumbersome, it minimises the uncertainty of applying N2O amount corrections, which is non-linear, time-variable and found to have a magnitude between 5 ‰ and 25 ‰ when the mole fraction ranges from 0.45 to 1.5 ppm. Fig. S2 (Supplement Sect. S3) shows isotope values determined within each measurement sequence when determining the N2O amount effect. While the variability on a single day can be very small, this artefact shows considerable variability with time and therefore needs regular quantifying.
A6.5 Controlling N2O mole fraction bias and instrumental drift in measurement sequence and protocol
A schematic overview of the measurement sequences is shown in Supplement Sect. S4. Measurement sequences comprise of a series of measurement blocks of isotope reference gases, working standards and samples. Each gas sample was injected into the pre-evacuated cell of the LGR, before being locked in and measured for ten minutes before the cell was evacuated and flushed with N2O-free air in preparation for the consecutive analysis. Up to five blocks of the working standard (1080) are measured within each sequence to monitor instrumental drift. Following the first 1080 block, the N2O amount correction function is determined. For that, reference gases are diluted with N2O-free air inside the MV without changing their isotopic composition prior to their injection into the LGR. USGS51-in-air and USGS52-in-air are each analysed at five N2O mole fraction levels over a range of 0.33 to 1.5 ppm with five repetitions per N2O level. This is followed by measurements of up to four samples, each of which is bracketed by blocks of ten USGS51-in-air measurements at matching N2O mole fractions. The pathway to inject samples and reference gases includes further purification with a chemical scrubber and all steps of gas handling and analysis follow the principle of identical treatment (PIT) (Werner and Brand, 2001) as much as possible.
A6.6 Data processing
The LabView interface generates a data file including all raw data from the LGR as well as sample handling data and instrument performance data from the sample inlet with a time resolution of 1 Hz. Data processing starts with data reduction to generate averages for all output data. Next, all data are corrected for variation in cell pressure, following the experimentally determined, linear correction function. Thereafter, the pressure-corrected measurements of the N2O amount effect determination are assessed for analyser drift using the first three blocks of the 1080 ppb working standard. A correction is only applied when the drift effect is significant and exceeds twice the measurement reproducibility in SP-N2O (∼ 1 ‰). The next step normalises the isotope values of the samples relative to the bracketing USGS51-in-air measurements and applies the correction for N2O mole fraction differences. The final step applies the N2O mole fraction correction to the data from the N2O amount effect determination, resulting in fully corrected measurements of USGS51-in-air and USGS52-in-air, which are then used for a two-point calibration to the SP-N2O values of the samples. Because the range of δ15N and δ18O values covered by USGS51 and USGS52 is too small for a two-point calibration, we determined the δ15N-N2O and δ18O-N2O results from our samples based on a one-point calibration using USGS51-in-air.
Similar to Rohe et al. (2017) and Lewicka-Szczebak et al. (2017), bulk isotope values (δ15N-N2O and δ18O-N2O) are reported relative to the nitrite substrate (δ15N-NO) and incubation water (δ18O-H2O), respectively. During our study δ18O-H2O was estimated from local surface water δ18O-H2O composition, which ranges from −6 ‰ to −7 ‰ (Baisden et al., 2016; Whitehead and Booker, 2020; Yang et al., 2020). As all experiments were run using the same NaNO2 substrate, the δ15N-NO composition was estimated by applying the range of reported denitrifying NO to N2O enrichment factors (−12 ‰ (Wei et al., 2019) to −39 ‰ (Sutka et al., 2003)) to the δ15N-N2O composition measured from bacterial denitrification. This yielded a likely δ15N-NO range from +1.4 ‰ to +28.4‰. Accordingly, the reported variability in bulk isotope values from our study primarily reflects uncertainty in source values rather than measurement or environmental variability.
A6.7 Measurement reproducibility, accuracy and propagated uncertainty
For SP-N2O in each sample, we derived the total uncertainty (Utot) by propagating all contributing uncertainties as the square root of the sum of squares:
Where Usam, UREF_a, UREF_b and UREF_span represent the standard deviations (1σ) of the measurements of the samples, the two bracketing USGS51-in-air reference gases before (_a) and after (_b) the sample measurement, as well as the USGS52-in-air measurement used for the final isotope span correction for SP-N2O, respectively. is the factor of the span correction. Up-corr and represent the uncertainties of the correction for gas pressure variation in the cell as well as the N2O amount effect, which are calculated as the standard error of the mean of the residuals of each correction function. Uncertainties of δ15N and δ18O values are calculated in the same way, except they do not include the uncertainty of USGS52-in-air as a two-point calibration is not applied. Typical values of the propagated uncertainty (1σ) exceed the reproducibility by a factor of ∼ 2–3 (Fig. 1).
All the data from our study are presented numerically in the paper and in the Supplement. The data is also publicly available: https://doi.org/10.6084/m9.figshare.30644297 (Wells et al., 2025).
Supplement Sect. S1: Denitrifiers cultures; Supplement Sect. S2: Analytical blind test using isotope analysis to determine fractions of N2O from two biological sources in a gas mixture; Supplement Sect. S3: N2O and isotopomers measurements bias due to N2O amount and cell pressure dependence; Supplement Sect. S4: Measurements sequence followed. The supplement related to this article is available online at https://doi.org/10.5194/bg-23-497-2026-supplement.
MP and PS performed the investigation, data visualization and curation and were involved with the writing (original draft) and contributed to conceptualization, methodology and data curation, as well as visualization with NW, BG and TC. RP provided support with gas samples preparation and spectroscopy analyses. NW, BG, RP and TC were involved in the writing (review and editing) of the paper before submission. Finally, all authors except RP were involved with the funding acquisition.
The contact author has declared that none of the authors has any competing interests.
Publisher's note: Copernicus Publications remains neutral with regard to jurisdictional claims made in the text, published maps, institutional affiliations, or any other geographical representation in this paper. The authors bear the ultimate responsibility for providing appropriate place names. Views expressed in the text are those of the authors and do not necessarily reflect the views of the publisher.
We gratefully acknowledge invaluable support and discussions during the development of the SP-N2O instrument from Mike Harvey, Ross Martin, John McGregor and Colin Nankivell. The research was supported by Massey University, Lincoln University and NIWA. The Cawthron Institute is also acknowledged to support part of that research.
This research has been supported by the Massey – Lincoln and Agricultural Industry Trust (46524), the Royal Society Te Apārangi Marsden Fund (MFP-LIU2102) and NIWA's Strategic Science Investment Funding through the Understanding Atmospheric Composition and Change programme.
This paper was edited by Steven Bouillon and Sara Vicca and reviewed by two anonymous referees.
Baisden, W. T., Keller, E. D., Van Hale, R., Frew, R. D., and Wassenaar, L. I.: Precipitation isoscapes for New Zealand: enhanced temporal detail using precipitation-weighted daily climatology, Isotopes in Environmental and Health Studies, 52, 343–352, https://doi.org/10.1080/10256016.2016.1153472, 2016.
Bakken, L. R. and Frostegård, Å.: Sources and sinks for N2O, can microbiologist help to mitigate N2O emissions?, Environmental Microbiology, 19, 4801–4805, https://doi.org/10.1111/1462-2920.13978, 2017.
Barford, C., Montoya, J., Altabet, M., and Mitchell, R.: Steady-State Oxygen Isotope Effects of N2O Production in Paracoccus denitrificans, Microb. Ecol., 74, 507–509, https://doi.org/10.1007/s00248-017-0965-3, 2017.
Bellido-Pedraza, C. M., Calatrava, V., Sanz-Luque, E., Tejada-Jimenez, M., Llamas, A., Plouviez, M., Guieysse, B., Fernandez, E., and Galvan, A.: Chlamydomonas reinhardtii, an Algal Model in the Nitrogen Cycle, Plants (Basel), 9, https://doi.org/10.3390/plants9070903, 2020.
Burlacot, A., Richaud, P., Gosset, A., Li-Beisson, Y., and Peltier, G.: Algal photosynthesis converts nitric oxide into nitrous oxide, Proc. Natl. Acad. Sci. USA, 117, 2704–2709, https://doi.org/10.1073/pnas.1915276117, 2020.
Butterbach-Bahl, K., Baggs, E. M., Dannenmann, M., Kiese, R., and Zechmeister-Boltenstern, S.: Nitrous oxide emissions from soils: how well do we understand the processes and their controls?, Philos. Trans. R. Soc. Lond. B Biol. Sci., 368, 20130122, https://doi.org/10.1098/rstb.2013.0122, 2013.
Chang, B., Yan, Z., Ju, X., Song, X., Li, Y., Li, S., Fu, P., and Zhu-Barker, X.: Quantifying biological processes producing nitrous oxide in soil using a mechanistic model, Biogeochemistry, 159, 1–14, https://doi.org/10.1007/s10533-022-00912-0, 2022.
Cliff, A., Guieysse, B., Brown, N., Lockhart, P., Dubreucq, E., and Plouviez, M.: Polyphosphate synthesis is an evolutionarily ancient phosphorus storage strategy in microalgae, Algal Res., 73, https://doi.org/10.1016/j.algal.2023.103161, 2023.
DelSontro, T., Beaulieu, J. J., and Downing, J. A.: Greenhouse gas emissions from lakes and impoundments: upscaling in the face of global change, Limnol. Oceanogr. Lett., 3, 64–75, https://doi.org/10.1002/lol2.10073, 2019.
den Elzen, M. G. J., Dafnomilis, I., Nascimento, L., Beusen, A., Forsell, N., Gubbels, J., Harmsen, M., Hooijschuur, E., Araujo Gutierrez, Z., and Kuramochi, T.: Uncertainties around net-zero climate targets have major impact on greenhouse gas emissions projections, Ann. NY Acad. Sci., 1544, 209–222, https://doi.org/10.1111/nyas.15285, 2025.
Denk, T. R. A., Mohn, J., Decock, C., Lewicka-Szczebak, D., Harris, E., Butterbach-Bahl, K., Kiese, R., and Wolf, B.: The nitrogen cycle: A review of isotope effects and isotope modeling approaches, Soil Biology and Biochemistry, 105, 121–137, https://doi.org/10.1016/j.soilbio.2016.11.015, 2017.
Ding, W., Tsunogai, U., Huang, T., Sambuichi, T., Ruan, W., Ito, M., Xu, H., Kim, Y., and Nakagawa, F.: Triple oxygen isotope evidence for the pathway of nitrous oxide production in a forested soil with increased emission on rainy days, Biogeosciences, 22, 4333–4347, https://doi.org/10.5194/bg-22-4333-2025, 2025.
Fabisik, F., Guieysse, B., Procter, J., and Plouviez, M.: Nitrous oxide (N2O) synthesis by the freshwater cyanobacterium Microcystis aeruginosa, Biogeosciences, 20, 687–693, https://doi.org/10.5194/bg-20-687-2023, 2023.
Glibert, P. M., Middelburg, J. J., McClelland, J. W., and Jake Vander Zanden, M.: Stable isotope tracers: Enriching our perspectives and questions on sources, fates, rates, and pathways of major elements in aquatic systems, Limnol. Oceanogr., 64, 950–981, https://doi.org/10.1002/lno.11087, 2018.
Griffith, D. W. T.: Calibration of isotopologue-specific optical trace gas analysers: a practical guide, Atmos. Meas. Tech., 11, 6189–6201, https://doi.org/10.5194/amt-11-6189-2018, 2018.
Gruber, W., Magyar, P. M., Mitrovic, I., Zeyer, K., Vogel, M., von Kanel, L., Biolley, L., Werner, R. A., Morgenroth, E., Lehmann, M. F., Braun, D., Joss, A., and Mohn, J.: Tracing N2O formation in full-scale wastewater treatment with natural abundance isotopes indicates control by organic substrate and process settings, Water Res. X, 15, 100130, https://doi.org/10.1016/j.wroa.2022.100130, 2022.
Guieysse, B., Plouviez, M., Coilhac, M., and Cazali, L.: Nitrous Oxide (N2O) production in axenic Chlorella vulgaris microalgae cultures: evidence, putative pathways, and potential environmental impacts, Biogeosciences, 10, 6737–6746, https://doi.org/10.5194/bg-10-6737-2013, 2013.
Harris, S. J., Liisberg, J., Xia, L., Wei, J., Zeyer, K., Yu, L., Barthel, M., Wolf, B., Kelly, B. F. J., Cendón, D. I., Blunier, T., Six, J., and Mohn, J.: N2O isotopocule measurements using laser spectroscopy: analyzer characterization and intercomparison, Atmos. Meas. Tech., 13, 2797–2831, https://doi.org/10.5194/amt-13-2797-2020, 2020.
Hendriks, J., Oubrie, A., Castresana, J., Urbani, A., Gemeinhardt, S., and Saraste, M.: Nitric oxide reductases in bacteria. Biochim Biophys Acta – Bioenerg, 1459, 266–273, 2000.
Hou, Z., Zhou, Q., Xie, Y., Mo, F., Kang, W., and Wang, Q.: Potential contribution of chlorella vulgaris to carbon–nitrogen turnover in freshwater ecosystems after a great sandstorm event, Environ. Res., 234, 116569, https://doi.org/10.1016/j.envres.2023.116569, 2023.
IPCC: Climate Change 2013: The Physical Science Basis. Contribution of Working Group I to the Fifth Assessment Report of the Intergovernmental Panel on Climate Change, edited by: Stocker, T. F., Qin, D., Plattner, G.-K., Tignor, M., Allen, S. K., Boschung, J., Nauels, A., Xia, Y., Bex, V., and Midgley, P. M., Cambridge University Press, Cambridge, United Kingdom and New York, NY, USA, 1535 pp., https://www.ipcc.ch/report/ar5/wg1/ (last access: 13 January 2026), 2013.
Klaus, J. and McDonnell, J. J.: Hydrograph separation using stable isotopes: Review and evaluation, J. Hydrol., 505, 47–64, https://doi.org/10.1016/j.jhydrol.2013.09.006, 2013.
Klintzsch, T., Geisinger, H., Wieland, A., Langer, G., Nehrke, G., Bizic, M., Greule, M., Lenhart, K., Borsch, C., Schroll, M., and Keppler, F.: Stable Carbon Isotope Signature of Methane Released From Phytoplankton, Geophys. Res. Lett., 50, https://doi.org/10.1029/2023gl103317, 2023.
Leon-Palmero, E., Morales-Baquero, R., Thamdrup, B., Löscher, C., and Reche, I.: Sunlight drives the abiotic formation of nitrous oxide in fresh and marine waters, Science, 387, 1198–1203, https://doi.org/10.1126/science.adq0302, 2025.
Lewicka-Szczebak, D., Augustin, J., Giesemann, A., and Well, R.: Quantifying N2O reduction to N2 based on N2O isotopocules – validation with independent methods (helium incubation and 15N gas flux method), Biogeosciences, 14, 711–732, https://doi.org/10.5194/bg-14-711-2017, 2017.
Martin, T. S. and Casciotti, K. L.: Nitrogen and oxygen isotopic fractionation during microbial nitrite reduction, Limnol. Oceanogr., 61, 1134–1143, https://doi.org/10.1002/lno.10278, 2016.
McCue, M. D., Javal, M., Clusella-Trullas, S., Le Roux, J. J., Jackson, M. C., Ellis, A. G., Richardson, D. M., Valentine, A. J., Terblanche, J. S., and Freckleton, R.: Using stable isotope analysis to answer fundamental questions in invasion ecology: Progress and prospects, Methods Ecol. Evol., 11, 196–214, https://doi.org/10.1111/2041-210x.13327, 2019.
Ostrom, N. E. and Ostrom, P. H.: Mining the isotopic complexity of nitrous oxide: a review of challenges and opportunities, Biogeochemistry, 132, 359–372, https://doi.org/10.1007/s10533-017-0301-5, 2017.
Ostrom, N. E., Gandhi, H., Coplen, T. B., Toyoda, S., Böhlke, J. K., Brand, W. A., Casciotti, K. L., Dyckmans, J., Giesemann, A., Mohn, J., Well, R., Yu, L., and Yoshida, N.: Preliminary assessment of stable nitrogen and oxygen isotopic composition of USGS51 and USGS52 nitrous oxide reference gases and perspectives on calibration needs, Rapid Commun. Mass Spectrom., 32, 1207–1214, https://doi.org/10.1002/rcm.8157, 2018.
Park, S., Croteau, P., Boering, K. A., Etheridge, D. M., Ferretti, D., Fraser, P. J., Kim, K. R., Krummel, P. B., Langenfelds, R. L., van Ommen, T. D., Steele, L. P., and Trudinger, C. M.: Trends and seasonal cycles in the isotopic composition of nitrous oxide since 1940, Nat. Geosci., 5, 261–265, https://doi.org/10.1038/ngeo1421, 2012.
Plouviez, M. and Guieysse, B.: Nitrous oxide emissions during microalgae-based wastewater treatment: current state of the art and implication for greenhouse gases budgeting, Water Sci. Technol., 82, 1025–1030, https://doi.org/10.2166/wst.2020.304, 2020.
Plouviez, M., Wheeler, D., Shilton, A., Packer, M. A., McLenachan, P. A., Sanz-Luque, E., Ocana-Calahorro, F., Fernandez, E., and Guieysse, B.: The biosynthesis of nitrous oxide in the green alga Chlamydomonas reinhardtii, Plant J., 91, 45–56, https://doi.org/10.1111/tpj.13544, 2017.
Plouviez, M., Shilton, A., Packer, M. A., and Guieysse, B.: Nitrous oxide emissions from microalgae: potential pathways and significance, J. Appl. Phycol., 31, 1–8, https://doi.org/10.1007/s10811-018-1531-1, 2018.
Radu, M. M., Douglas, S. B., and Ronald, K. H.: A diode-laser absorption sensor system for combustion emission measurements, Meas. Sci. Technol., 9, 327, https://doi.org/10.1088/0957-0233/9/3/004, 1998.
Rohe, L., Well, R., and Lewicka-Szczebak, D.: Use of oxygen isotopes to differentiate between nitrous oxide produced by fungi or bacteria during denitrification, Rapid Commun. Mass Spectrom., 31, 1297–1312, https://doi.org/10.1002/rcm.7909, 2017.
Sasso, S., Stibor, H., Mittag, M., and Grossman, A. R.: From molecular manipulation of domesticated Chlamydomonas reinhardtii to survival in nature, Elife, 7, https://doi.org/10.7554/eLife.39233, 2018.
Shan, J., Sanford, R. A., Chee-Sanford, J., Ooi, S. K., Löffler, F. E., Konstantinidis, K. T., and Yang, W. H.: Beyond denitrification: The role of microbial diversity in controlling nitrous oxide reduction and soil nitrous oxide emissions, Glob. Chang. Biol., 27, 2669–2683, https://doi.org/10.1111/gcb.15545, 2021.
Sperlich, P., Brailsford, G. W., Moss, R. C., McGregor, J., Martin, R. J., Nichol, S., Mikaloff-Fletcher, S., Bukosa, B., Mandic, M., Schipper, C. I., Krummel, P., and Griffiths, A. D.: IRIS analyser assessment reveals sub-hourly variability of isotope ratios in carbon dioxide at Baring Head, New Zealand's atmospheric observatory in the Southern Ocean, Atmos. Meas. Tech., 15, 1631–1656, https://doi.org/10.5194/amt-15-1631-2022, 2022.
Stanton, C. L., Reinhard, C. T., Kasting, J. F., Ostrom, N. E., Haslun, J. A., Lyons, T. W., and Glass, J. B.: Nitrous oxide from chemodenitrification: A possible missing link in the Proterozoic greenhouse and the evolution of aerobic respiration, Geobiology, 16, 597–609, https://doi.org/10.1111/gbi.12311, 2018.
Stein, L. Y. and Klotz, M. G.: The nitrogen cycle, Curr. Biol., 26, R94–R98, https://doi.org/10.1016/j.cub.2015.12.021, 2016.
Sun, H., Yu, R., Lu, X., Lorke, A., Cao, Z., Liu, X., Li, X., Zhang, Z., and Cui, B.: N2O emissions fueled by eutrophication in a shallow lake, J. Enviro. Sci., 160, https://doi.org/10.1016/j.jes.2025.03.065, 2025.
Sutka, R. L., Ostrom, N. E., Ostrom, P. H., Gandhi, H., and Breznak, J. A.: Nitrogen isotopomer site preference of N2O produced by Nitrosomonas europaea and Methylococcus capsulatus Bath, Rapid Communications in Mass Spectrometry, 17, 738–745, https://doi.org/10.1002/rcm.968, 2003.
Teuma, L., Sanz-Luque, E., Guieysse, B., and Plouviez, M.: Are Microalgae New Players in Nitrous Oxide Emissions from Eutrophic Aquatic Environments?, Phycology, 3, 356–367, https://doi.org/10.3390/phycology3030023, 2023.
Tian, H., Lu, C., Ciais, P., Michalak, A. M., Canadell, J. G., Saikawa, E., Huntzinger, D. N., Gurney, K. R., Sitch, S., Zhang, B., Yang, J., Bousquet, P., Bruhwiler, L., Chen, G., Dlugokencky, E., Friedlingstein, P., Melillo, J., Pan, S., Poulter, B., Prinn, R., Saunois, M., Schwalm, C. R., and Wofsy, S. C.: The terrestrial biosphere as a net source of greenhouse gases to the atmosphere, Nature, 531, 225–228, https://doi.org/10.1038/nature16946, 2016.
Tian, H., Xu, R., Canadell, J. G., Thompson, R. L., Winiwarter, W., Suntharalingam, P., Davidson, E. A., Ciais, P., Jackson, R. B., Janssens-Maenhout, G., Prather, M. J., Regnier, P., Pan, N., Pan, S., Peters, G. P., Shi, H., Tubiello, F. N., Zaehle, S., Zhou, F., Arneth, A., Battaglia, G., Berthet, S., Bopp, L., Bouwman, A. F., Buitenhuis, E. T., Chang, J., Chipperfield, M. P., Dangal, S. R. S., Dlugokencky, E., Elkins, J. W., Eyre, B. D., Fu, B., Hall, B., Ito, A., Joos, F., Krummel, P. B., Landolfi, A., Laruelle, G. G., Lauerwald, R., Li, W., Lienert, S., Maavara, T., MacLeod, M., Millet, D. B., Olin, S., Patra, P. K., Prinn, R. G., Raymond, P. A., Ruiz, D. J., van der Werf, G. R., Vuichard, N., Wang, J., Weiss, R. F., Wells, K. C., Wilson, C., Yang, J., and Yao, Y.: A comprehensive quantification of global nitrous oxide sources and sinks, Nature, 586, 248–256, https://doi.org/10.1038/s41586-020-2780-0, 2020.
Timilsina, A., Oenema, O., Luo, J., Wang, Y., Dong, W., Pandey, B., Bizimana, F., Zhang, Q., Zhang, C., Yadav, R. K. P., Li, X., Liu, X., Liu, B., and Hu, C.: Plants are a natural source of nitrous oxide even in field conditions as explained by 15N site preference, Sci. Tot. Enviro., 805, 150262, https://doi.org/10.1016/j.scitotenv.2021.150262, 2022.
Wang, R. Z., Lonergan, Z. R., Wilbert, S. A., Eiler, J. M., and Newman, D. K.: Widespread detoxifying NO reductases impart a distinct isotopic fingerprint on N2O under anoxia, Proc. Natl. Acad. Sci. USA, 121, e2319960121, https://doi.org/10.1073/pnas.2319960121, 2024.
Wang, Y., Peng, Y., Lv, C., Xu, X., Meng, H., Zhou, Y., Wang, G., and Lu, Y.: Quantitative discrimination of algae multi-impacts on N2O emissions in eutrophic lakes: Implications for N2O budgets and mitigation, Water Res., 235, 119857, https://doi.org/10.1016/j.watres.2023.119857, 2023.
Webb, J. R., Hayes, N. M., Simpson, G. L., Leavitt, P. R., Baulch, H. M., and Finlay, K.: Widespread nitrous oxide undersaturation in farm waterbodies creates an unexpected greenhouse gas sink, Proc. Natl. Acad. Sci. USA, 116, 9814–9819, https://doi.org/10.1073/pnas.1820389116, 2019.
Wei, J., Ibraim, E., Brüggemann, N., Vereecken, H., and Mohn, J.: First real-time isotopic characterisation of N2O from chemodenitrification, Geochimica et Cosmochimica Acta, 267, 17–32, https://doi.org/10.1016/j.gca.2019.09.018, 2019.
Wells, N., Plouviez, M., and Sperlich, P.: N2O microalgae experiments, Figshare [data set], https://doi.org/10.6084/m9.figshare.30644297.v1, 2025.
Werner, R. A. and Brand, W. A.: Referencing strategies and techniques in stable isotope ratio analysis, Rapid Commun. Mass Spectrom., 15, 501–519, https://doi.org/10.1002/rcm.258, 2001.
Whitehead, A. L. and Booker, D. J.: NZ River Maps: An interactive online tool for mapping predicted freshwater variables across New Zealand, https://shiny.niwa.co.nz/nzrivermaps/ (last access: 4 December 2025), 2020.
Wu, D., Well, R., Cardenas, L. M., Fuss, R., Lewicka-Szczebak, D., Koster, J. R., Bruggemann, N., and Bol, R.: Quantifying N2O reduction to N2 during denitrification in soils via isotopic mapping approach: Model evaluation and uncertainty analysis, Environ. Res., 179, 108806, https://doi.org/10.1016/j.envres.2019.108806, 2019.
Yang, J., Dudley, B. D., Montgomery, K., and Hodgetts, W.: Characterizing spatial and temporal variation in 18O and 2H content of New Zealand river water for better understanding of hydrologic processes, Hydrological Processes, 34, 5474–5488, https://doi.org/10.1002/hyp.13962, 2020.
Yu, L., Harris, E., Lewicka-Szczebak, D., Barthel, M., Blomberg, M. R. A., Harris, S. J., Johnson, M. S., Lehmann, M. F., Liisberg, J., Müller, C., Ostrom, N. E., Six, J., Toyoda, S., Yoshida, N., and Mohn, J.: What can we learn from N2O isotope data? – Analytics, processes and modelling, Rapid Commun. Mass Spectrom., 34, e8858, https://doi.org/10.1002/rcm.8858, 2020.
Zhang, Y., Wang, J.-H., Zhang, J.-T., Chi, Z.-Y., Kong, F.-T., and Zhang, Q.: The long overlooked microalgal nitrous oxide emission: Characteristics, mechanisms, and influencing factors in microalgae-based wastewater treatment scenarios, Sci. Tot. Environ., 856, 159153, https://doi.org/10.1016/j.scitotenv.2022.159153, 2023.