
the Creative Commons Attribution 4.0 License.
the Creative Commons Attribution 4.0 License.
 | 23 Jul 2026
The timing of warming matters as much as its intensity for the annual carbon balance of a degraded raised bog
Nicolas Behrens
Klaus-Holger Knorr
Christoph Rückriem
Mana Gharun
Pristine peatlands function as natural carbon dioxide (CO2) sinks, but anthropogenic drainage turns them into sources of CO2, responsible for 2 %–5 % of global annual greenhouse gas (GHG) emissions. Complex interactions between vegetation, soil, climate, and hydrology produce highly variable CO2 budgets on different types of peatlands and between years. Abandoned drained peatlands are considered low-hanging fruits for rewetting due to expected high GHG emissions and low resistance to repurposing yet remain underrepresented in research. To close this gap in the literature, we measured 3 years (2023–2025) of CO2 and methane (CH4) fluxes alongside meteorological and hydrological conditions in a drained shrub-dominated ombrotrophic raised bog in northwest Germany, investigating carbon flux budgets and the main seasonal drivers of fluxes. Methane fluxes were negligible throughout, likely due to water tables consistently deeper than 15 cm. Annual CO2 budgets were highly variable: the site was a considerable source of CO2 in 2023 and 2025 (112.6 ± 14 and 47.6 ± 27.8 ) but a weak sink (−24.8 ± 15.1 g C m−2) in 2024. An anomalously warm spring in 2024 triggered an earlier onset of CO2 uptake and increased maximum CO2 uptake capacity from April to June. In contrast, warming later in the growing season increased CO2 emissions due to a stronger reaction of respiration than of photosynthesis to warming – highlighting how the timing of climate anomalies matters. Partitioning the effects of high air temperature (TA) and vapor pressure deficit (VPD) revealed that high VPD suppressed carbon fluxes in the first half of the growing season but not the second, while extreme TA did not limit gross primary production (GPP) or ecosystem respiration the way extreme VPD did. TA and solar radiation were the dominant daily flux drivers; water tables had marginal effects on daily or interannual carbon flux variability. Together, our results demonstrate that the timing of TA and VPD anomalies – mediated through vegetation responses – decisively shapes their impact on the carbon balance. These results will become increasingly relevant as climate extremes intensify with ongoing global warming.
- Article
(5075 KB) - Full-text XML
-
Supplement
(4241 KB) - BibTeX
- EndNote


Peatlands cover only 3 % of the Earth's land surface, but they are the largest terrestrial carbon storage with about 30 % of the global soil carbon, equivalent to an estimated 600 Gt C (Yu et al., 2010). Pristine peatlands are waterlogged and the resulting anoxic conditions limit microbial decomposition of the peat through thermodynamic, enzymatic, and transport related constraints (Limpens et al., 2008). Peat forming vegetation takes up carbon dioxide (CO2) through photosynthesis and due to slow and incomplete decomposition this carbon is stored as peat over millennia. This turns natural peatlands into net carbon sinks despite methane (CH4) emissions induced by the waterlogged, anoxic conditions (Ma et al., 2021). However, drainage of peatlands for peat extraction, forestry, or agriculture (Leifeld and Menichetti, 2018) results in the aeration of the peat column. This eases the constraints on microbial decomposition, leading to peat oxidation and carbon emissions in form of CO2. The resulting emissions are estimated to account for 2 %–5 % of annual anthropogenic greenhouse gas (GHG) emissions (Humpenöder et al., 2020; Leifeld and Menichetti, 2018; Ma et al., 2022), in countries with a large percentage of degraded peatlands such as Germany even up to 7 % (Umweltbundesamt, 2022), making it an integral part of the anthropogenic carbon footprint.
Carbon fluxes from peatlands are governed by a complex interplay of components, including microbial communities (Mäkiranta et al., 2009), enzyme activities (Pinsonneault et al., 2016), thermodynamic limitations (Blodau, 2011), peat quality (Nielsen et al., 2023) and both vegetation composition and their phenological cycle (Korrensalo et al., 2020; Peichl et al., 2018), all of which interact with changing climatic and hydrological conditions across years (Adkinson et al., 2011; Alekseychik et al., 2021; Drollinger et al., 2019; Olson et al., 2013). This complexity results in a high variability in carbon fluxes between different peatlands and across years with contrasting climatic or hydrological conditions. Given their crucial role in the carbon cycle, it is essential to accurately represent peatlands in landscape management and upscaling models. This in turn requires a robust understanding of the underlying drivers for the heterogeneous range of peatland ecosystems and under variable climatic conditions. While several studies have quantified carbon balances and derived driving mechanisms at actively managed sites (He and Roulet, 2023; Tiemeyer et al., 2016) or following rewetting interventions (Kalhori et al., 2024; Nugent et al., 2018; Satriawan et al., 2023), drained and unutilized peatlands remain a gap in the current literature. They represent the in-between state when active management has ceased but no restoration measures are yet in place. Such sites are not yet represented in the IPCC guidelines for emissions from wetlands (IPCC, 2014), and while they are included in the German national emission factors (Tiemeyer et al., 2020), the wide uncertainty interval of emissions (0.7 to 10.8 ) reflects the heterogeneity of carbon fluxes at sites in this category. The potentially substantial emissions due to the disturbance and relatively low resistance regarding the repurposing of such sites, in comparison for example to actively managed agricultural areas, make abandoned drained peatlands a low hanging fruit for climate mitigation measures (Guo et al., 2025).
The intensity of the drainage, often expressed through the average annual water table (WT), is widely considered to be the most important driver of annual CO2 emissions and was repeatedly used to infer CO2 budgets across peatlands and peatland types based on functional relationships of GHG-fluxes to WT (Evans et al., 2021; Koch et al., 2023; Tiemeyer et al., 2020). Site-scale studies repeatedly showed that dropping of the WT decisively controls net CO2 emissions (Aslan-Sungur et al., 2016; Drollinger et al., 2019; Laine et al., 2019; Li et al., 2021; Satriawan et al., 2023). This control is mostly attributed to increased ecosystem respiration (Reco) due to a deeper aeration of the peat column and higher microbial activity with rising air temperatures (TA) (Aslan-Sungur et al., 2016; Drollinger et al., 2019; Wilson et al., 2016). Additionally, at a lower WT peat respiration can become more sensitive to rising TA (Denager et al., 2026; Liu et al., 2024), creating a feedback between warming and drying. However, the relationship between WT fluctuations and Reco can break down when WT is consistently low (deeper than −20 cm), due to a limited response of pore space water saturation to further changes in WT and decreasing peat quality with depth (Lafleur et al., 2005b; Waddington et al., 2001). Microbial respiration may be directly limited through moisture constraints (Estop-Aragonés and Blodau, 2012; Mäkiranta et al., 2009). Further, a high relative contribution of autotrophic respiration to Reco, which can make up 50 % to 70 % in shrub- or sedge-dominated peatlands (Rankin et al., 2022, 2023), can lead to a reduced sensitivity of CO2 emissions to WT fluctuations (Juszczak et al., 2013; Lafleur et al., 2005b). As abandoned extraction sites and drained, degraded sites in many cases exhibit a consistently low WT and a predominance of rushes, shrubs and sedges, the inference of CO2 budgets based on simple transfer functions relying on singular predictors such as WT may lead to erroneous estimates and requires a more detailed analysis of underlying driving factors of CO2 budgets.
Besides the varying respiration rates, changes in net CO2 exchange are potentially driven by the variability in gross primary production (GPP) through interannual differences in phenology, TA, and incoming radiation (Drollinger et al., 2019; Järveoja et al., 2018; Peichl et al., 2018). Both the magnitude and the timing of climate anomalies may change phenological development, either enhancing or decreasing net CO2 uptake (Helbig et al., 2022; Helfter et al., 2015; Peichl et al., 2014). The light use efficiency, meaning the amount of carbon uptake per light received, correlates in peatlands with warmer TA and water availability, varying in strength with vegetation composition (Kross et al., 2016). Hot TA along with increased atmospheric dryness, expressed as vapor pressure deficit (VPD), may reduce GPP through a stomatal regulation feedback, employed to regulate water loss (Grossiord et al., 2020). While a large-scale analysis suggests that TA-driven increases in VPD do not substantially constrain biomass growth across northern peatlands (N. Chen et al., 2023), site-level studies on peatlands repeatedly report reductions in midday ecosystem CO2 uptake under high VPD (Aurela et al., 2007; Goodrich et al., 2015; Humphreys et al., 2006; Poczta et al., 2023). The magnitude of this response varies with vegetation composition: graminoids and sedges may exhibit a stronger stomatal sensitivity to high VPD than shrubs (Gobin et al., 2015), even independent of groundwater availability (Goodrich et al., 2015; Otieno et al., 2012; Speranskaya et al., 2024).
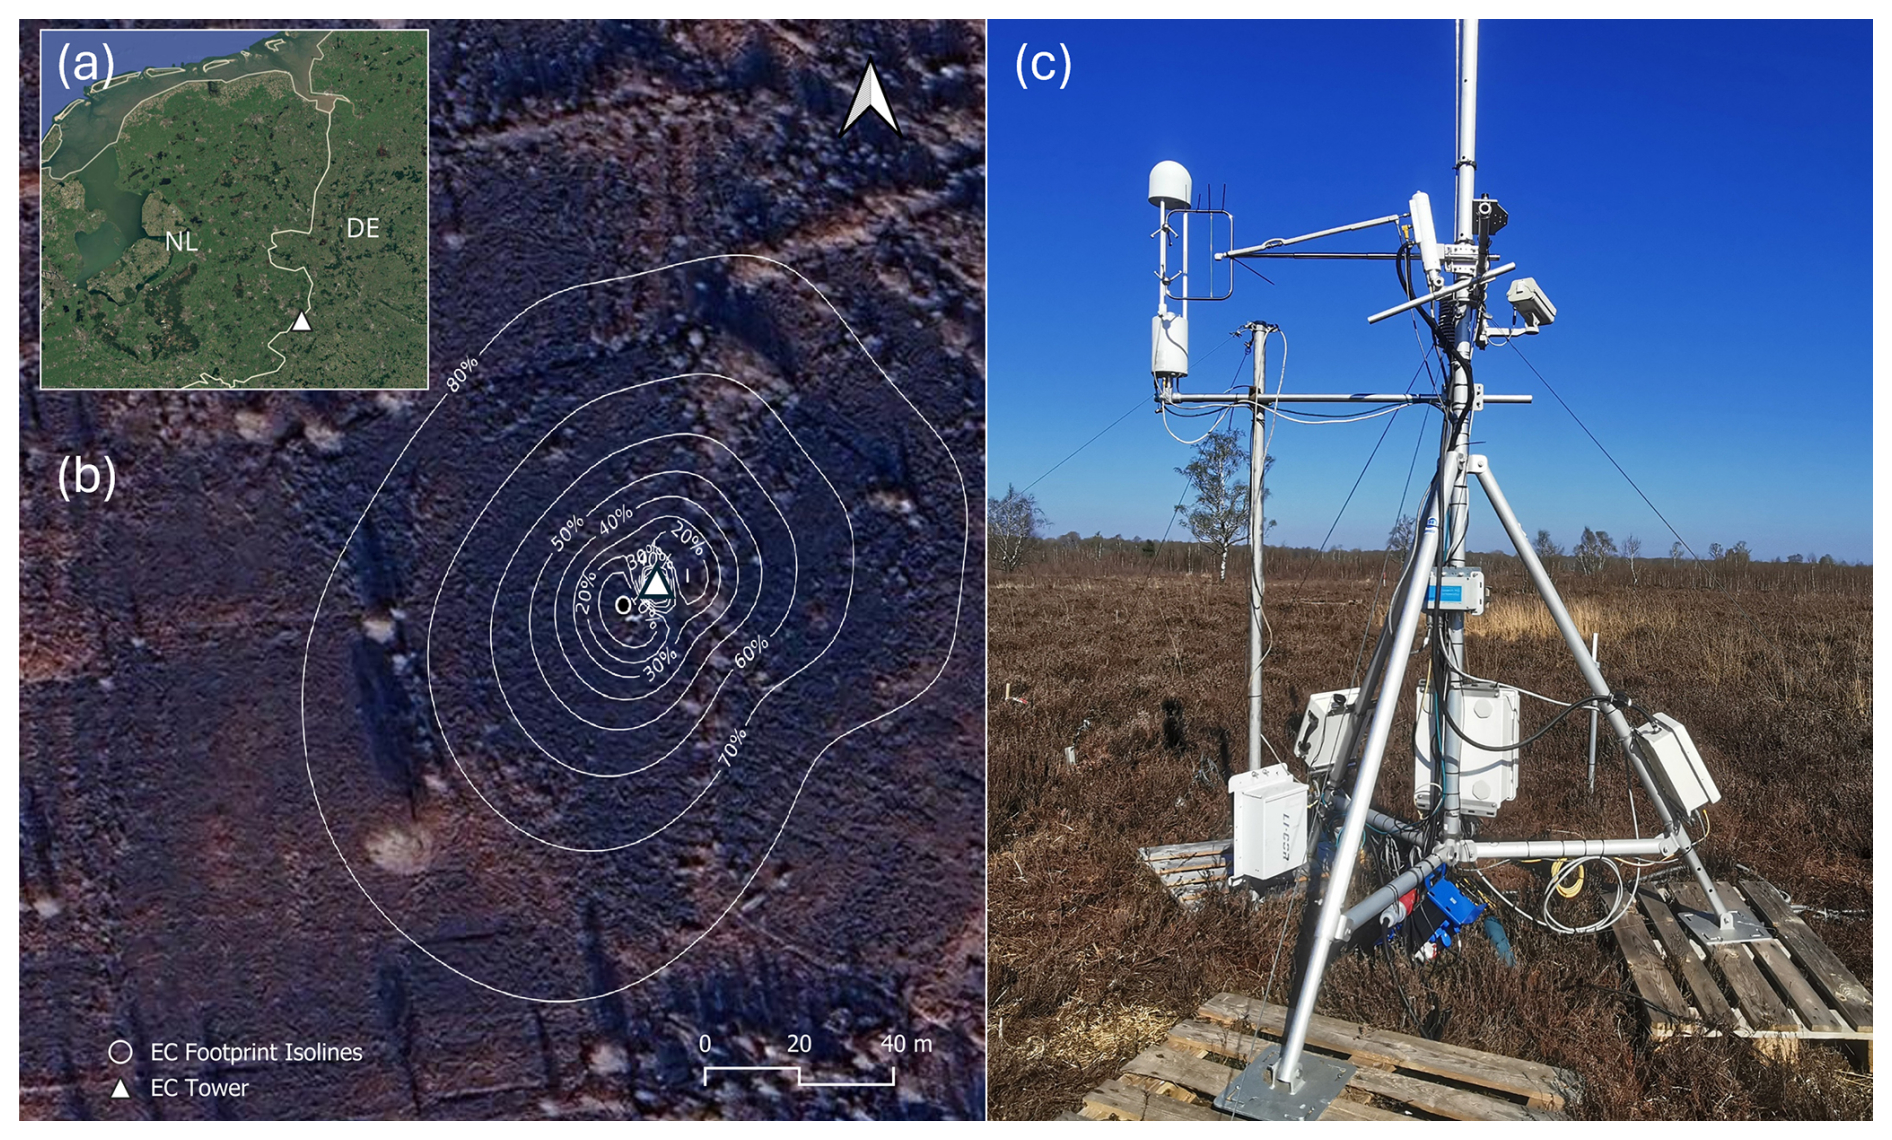
Figure 1(a) shows the location of the measurement site on the border between Germany and the Netherlands. The white lines in (b) are the isolines of gas flux contribution from the footprint of the eddy covariance (EC) tower. The footprint of the tower was estimated using a flux footprint model (Kljun et al., 2015). (c) shows the setup of the tower with its surrounding ericaceous vegetation as well as some individual Betula trees and a patch of Molinia caerulea in the background. Background on the left side: Imagery ©2025 NASA, Map data ©2025 Google.
To understand what drives carbon fluxes from abandoned drained bogs and to delineate the mitigation potential of restoration measures under a warming climate, both precise flux measurements and a rigorous analysis of their drivers are required. Yet the magnitude of carbon fluxes in abandoned, drained peatlands, and how they respond to interacting climatic and environmental pressures, remains poorly understood. This study addresses that gap through three objectives: (1) quantifying monthly and annual CO2 and CH4 dynamics to establish net carbon budgets for a drained and shrub-dominated raised bog across 3 years (2023–2025); (2) determining how climate and hydrology – air temperature, water table, vapour pressure deficit, and radiation – govern carbon fluxes under both normal and extreme conditions; and (3) disentangling the impact of climatic anomalies temporally, revealing how the timing of their occurrence shapes carbon fluxes and ecophysiological responses.
Using continuous measurements of CO2 and CH4 fluxes collected with the eddy covariance (EC) method, we quantify the relationships between ecosystem carbon exchange and key climate drivers. Seasonal transitions are identified to delineate phenological phases. We identify the main climatic drivers of carbon flux variability using anomaly regression analysis. Ecophysiological response functions are used to derive ecosystem functional parameters, including the temperature sensitivity of Reco (Q10) and the maximum photosynthetic uptake capacity (Pmax). Changes in these parameters are then used to assess potential shifts in the ecosystem–climate feedback. Finally, the effects of high TA and VPD on ecosystem carbon fluxes are evaluated across different stages of the growing season by isolating their respective influences using a targeted filtering procedure.
2.1 Site description
The study site is a degraded raised bog within the Amtsvenn-Hündfelder Moor, formerly used for peat extraction. The study area comprises approximately 600 ha along the German–Dutch border between Gronau and Ahaus in North Rhine-Westphalia, Germany (52.1756° N, 6.95486° E; Fig. 1). The EC tower at the site (DE-Amv) is an ICOS (Integrated Carbon Observation System) associate station implementing high quality standardized greenhouse gas flux observations (Gharun and Behrens, 2025). The long-term (2006–2025) mean annual temperature and precipitation are 10.8 °C and 791 mm, respectively, based on data from the Ahaus weather station operated by the German Meteorological Service (Deutscher Wetterdienst, DWD; station ID 7374).
In this degraded raised bog, peat cutting stopped in 1979, but drainage ditches remained open. Peat thickness (predominantly Sphagnum peat) at the site is roughly 4.3 m, with the upper 10–25 cm of peat being affected from degradation due to drainage, as reflected in lower C to N ratios (30–40), elevated N (1.5 %–2.0 %) and P (500–800 mg kg−1) content and increased degree of peat decomposition compared to the underlying pristine peat (Lemmens et al., 2026). In the investigated area the peat body was only cut on the outermost margins. Water is continuously lost from the raised peat block to the adjacent lower parts of the bog where peat extraction took place and through an open drainage ditch to the south of the site. A vegetation survey on five sampling points within the footprint was conducted in July 2022. The vegetation within the footprint is relatively homogeneous across directions. It is dominated by an almost closed canopy of dwarf shrubs with a coverage of 50 % to 75 % common heather (Calluna vulgaris), 25 % to 50 % cross-leaved heather (Erica tetralix) and individuals of Vaccinium oxycoccos and bog cranberry (Andromeda polifolia). Irregularly interspersed are patches of graminoids, mostly purple moor-grass (Molinia caerulea), with a cover of up to 25 % and higher coverage at the outer margins of the investigated area. Some heterogeneity is introduced along overgrown drainage ditches where individuals of downy birch (Betula pubescens) and silver birch (Betula pendula) occur, with smaller individuals scattered in the footprint (Fig. 1). However, these ditches stretch across the footprint in several directions and provide no separation of the footprint into different sectors. Typical peatland (Sphagnum spp.) mosses are barely present anymore, only a few individuals can be found in drainage ditches and outside of the tower footprint in low lying ponds. To control the encroachment of the woody vegetation the site is managed with light sheep grazing.
2.2 Meteorological measurements
Several ancillary climatic and edaphic variables were recorded at a frequency of one minute and aggregated to half-hourly means. TA and relative humidity (RH) were measured with a HMP155 temperature and humidity probe ((Vaisala Oyj, Vantaa, Finland). Precipitation (P) was measured with a non-heated rain gauge TR-525M (Texas Electronics Inc., Dallas, Texas, USA). Four radiation components–upward (SWOUT) and downward (SWIN) shortwave radiation, as well as upward (LWOUT) and downward (LWIN) longwave radiation–were measured using the CNR4 heated net radiometer (Kipp and Zonen B.V., Delft, the Netherlands). Soil variables were measured in two soil profiles at 5 cm depth. Soil water content (SWC) and soil temperature (TS) were measured with the Hydraprobe II (Stevens Water Monitoring Systems, Portland, Oregon, USA), secondary measurements of TS were conducted with LI-COR 7900–180 TS sensors (LI-COR Inc., Lincoln, Nebraska, USA). Soil heat flux (G) was measured with self-calibrating HFP01SC heat flux plates (Hukseflux Thermal Sensors B.V., Delft, The Netherlands).
All meteorological data was screened for faulty measurements. In a first step the resulting gaps were filled from a secondary meteorological tower 20 m from the EC tower, which provided measurements of TA, RH, P and SWC (with sensors in that order being: S-THB-M00x, S-RGB-M002, S-SMC-M005, all by Onset Hobo, Bourne, MA, USA). Remaining gaps in TA, RH and P were filled with data from the station Ahaus of the DWD (station ID: 7374), ca. 10 km from the station. Potential offsets between the data sources due to different sensors or measurement heights or depths were corrected using ordinary least squares regression (OLS). Global radiation was not available from any auxiliary tower, so final remaining gaps in SWIN were closed using machine learning, specifically with the XGBoost regression tree method (Chen and Guestrin, 2016), using the day-of-year, the hour of the day, TA, P and SWIN derived from the ERA5land (Muñoz-Sabater et al., 2021) dataset as predictors.
The water table was measured with a pressure transducer ca. 20 m from the tower (MX2001 connected to a RX3000 data logger, Onset Hobo, Bourne, MA, USA). A second WT logger (DWLR-PA logger, Prignitz Mikrosystemtechnik GmbH, Wittenberge, Germany) was installed ca. 50 m from the tower as part of the Moorbodenmonitoring (MoMoK) project by the Thünen Institute of Climate-Smart Agriculture (Frank et al., 2025). The MX2001 WT logger had several power outages and was moved in the beginning of 2025, resulting in data gaps and a non-continuous time series. The complementary DWLR-PA WT logger covered the period from 19 September 2023 until 5 March 2025. To create a full time series spanning from the beginning of 2023 until the end of 2025, the data measured with DWLR-PA was used as a reference, and the time spans before 19 September 2023 and after 5 March 2025 were inserted from the MX2001 data. To remove offsets due to the sensor positions, data from 2023 and 2025 from the MX2001 were individually fitted to the complementary WT data, with an ordinary least squares (OLS) regression (R2 = 0.91 for 2023 and R2 = 0.88 for 2025).
2.3 Eddy covariance measurements and flux data processing
An eddy covariance tower was installed in September 2022. The tower setup includes a LI-7200RS closed path infrared gas analyzer (LI-COR Inc., Lincoln, Nebraska, USA) and a Gill HS-50 anemometer (Gill Instruments Ltd., Lymington, Hampshire, UK). In December 2023 a LI-7700 open path CH4 analyser (LI-COR Inc., Lincoln, Nebraska, USA) was added to the setup. Gas concentrations and wind speeds were measured on a tripod at 2.77 m height and with a frequency of 10 Hz. The raw EC data was processed into half-hourly aggregates using the EddyPro software version 7.0.9 by LI-COR and adhering to best practices agreed on by the community (Sabbatini et al., 2018). Raw 10 Hz data were filtered for spikes, dropouts and absolute limits (Vickers and Mahrt, 1997). A filter was applied to remove CO2 measurements when the signal strength was below 80 % and CH4 measurements when the signal strength was below 10 % (McDermitt et al., 2011). Anemometer tilt was corrected using the double-rotation method (Wilczak et al., 2001). Time-lags between measurements of gas concentrations and wind components were accounted for using the automatic time lag optimization (Sabbatini et al., 2018). Spectral losses were corrected by deriving reference (co-)spectra for well-developed turbulent conditions and then correcting measurement spectra for high-pass and low-pass filtering effects (Fratini et al., 2012; Moncrieff et al., 2004). CH4 concentrations measured with the open-path analyser were corrected for density fluctuation using the WPL correction (Webb et al., 1980) and spectroscopic effects (McDermitt et al., 2011).
Since measurements were done at a low height (2.7 m) no profile measurements of gas fluxes were conducted. Storage fluxes were derived with the default single-point estimation implemented in EddyPro and added to the half-hourly CO2 flux to calculate the net ecosystem exchange (NEE). The fluxes were then filtered to remove outliers, periods with erratic behaviour potentially induced by faulty sensors and poorly developed turbulent conditions. As a first step all data points with a quality flag of 2 were removed from the dataset, following the quality flagging system with flags 0, 1 and 2 (Mauder and Foken, 2015). To remove outliers representing unrealistically high fluxes we determined the 99.9 % and 0.1 % quantiles of the highest quality fluxes (flag 0 based on the flags mentioned above) separately for day and night-time of CO2, CH4, the sensible heat flux H and the latent heat flux LE. Values above and below these thresholds were removed. Nightly conditions were determined using a threshold of less than 10 W m−2 SWIN. After removing fluxes above the absolute limits, remaining spikes were determined with a conservative approach, removing data points that are four standard-deviations above or below the mean of a running window of 30 d. Finally, data measured under poorly developed turbulent conditions (u∗-filtering) was filtered out with the R-package REddyProc V. 1.3.2 (Wutzler et al., 2018) using R version 4.5.2 (R Core Team, 2025). To estimate the range of possible u∗ thresholds, we generated 100 bootstrap resamples and derived the empirical distribution of the threshold. From this distribution, we extracted 37 evenly spaced quantiles between the 0.05 and 0.95 quantiles (in increments of 0.025). The final derived thresholds across bootstrap-derived quantiles ranged between 0.09 and 0.19 while the central estimate of the threshold for the years 2023, 2024 and 2025 were 0.10, 0.13 and 0.13. All further processing steps (gap filling and partitioning) were repeated for all the potential u∗-thresholds to allow an estimation of the uncertainty associated with the choice of the central threshold.
To derive annual budgets of fluxes the gaps resulting from the above-described steps needed to be filled. Deep ensembles of neural networks have been shown to yield good predictive performance as well as reliable estimates of the respective model uncertainties (Vekuri et al., 2025). We trained an ensemble of five neural networks (Lakshminarayanan et al., 2017) for each u∗-threshold to fill half-hourly CO2 and CH4 fluxes. The predictors used were TA, VPD, SWIN, WT and fuzzy variables derived from the hour and the month turned into sine and cosine waves. We followed a model setup previously shown to yield good flux predictions (Vekuri et al., 2025) using the Tensorflow library (Abadi et al., 2016). The models consist of two hidden layers with 50 nodes each and ReLU (Rectified Linear Unit) activations. Since flux errors approximately follow a Laplace distribution (Hollinger and Richardson, 2005) the loss function of the model was the Laplace negative log likelihood. The models are trained to predict the mean and the logarithm of the scale parameter of a Laplace distribution, yielding a mean prediction as well as the predictive uncertainty. Following (Vekuri et al., 2025) the models were initialized with random weights (He et al., 2015) using the Adam optimizer (Kingma and Ba, 2017). A randomly sampled subset corresponding to 10 % of the data was used as a validation set for early stopping with a patience of 20 epochs. The final gap filling uncertainty consists of the epistemic uncertainty, the uncertainty across the predicted means from the five model iterations, and the aleatoric uncertainty, the mean of the predicted Laplace scale parameters, added in quadrature. To test the performance of the gapfilling models for data gaps of different lengths (12 h, 1 d, 10 d, 20 d, 30 d) we randomly sampled 20 % of the data randomly in contiguous blocks of the respective length, making sure that each block contains at least 50 % of non-missing data. This data was withheld during model training and later used to calculate the R2 and root mean square error (RMSE). This procedure was repeated 10 times for each gap length. For this test we used NEE filtered with the annual central u∗ estimate.
Uncertainty of the annual CO2 balance was computed by adding in quadrature the aggregated uncertainties arising from random measurement errors (Finkelstein and Sims, 2001), u∗- threshold selection, quantified as the standard deviation of annual balances derived from gap-filled flux time series generated using alternative u∗ thresholds (Pastorello et al., 2020), and aleatoric and epistemic gapfilling model uncertainty (Vekuri et al., 2025).
Finally half-hourly filled CO2 was partitioned into the two components of gross primary production (GPP) and ecosystem respiration (Reco) using the night-time partitioning approach (Reichstein et al., 2005). Daily NEE, GPP and Reco were derived from the half-hourly data as daily averages. As a quality control we tested the energy balance closure (EBC) of the flux data. The energy balance is calculated according to Eq. (1).
It describes whether the measured fluxes of sensible (H) and latent (LE) heat flux together sum up to the total energy input into the ecosystem measured by the instrumentation minus the soil heat flux (G). The linear slope between the left and right side of Eq. (1) resembles the EBC and is used as a quality criterion of the fluxes (Foken, 2008). The footprint of the tower was estimated using a two-dimensional flux footprint model (Kljun et al., 2015).
2.4 Detection of seasonality
Seasonality is often derived from digital imagery or satellite products (Richardson et al., 2018). However, the camera installed at the site provided no reliable data in the first year due to a misconfiguration. We additionally tested the use of the MODIS normalized difference vegetation index (NDVI) product for deriving seasonality metrics (Didan, 2021). However, the analysis was subject to considerable uncertainty due to the 16 d temporal resolution and missing observations caused by cloud cover. We therefore derived the seasonality and dates of key phenological changes (start of season, SOS; peak of season, POS; end of season, EOS; length of season, LOS) based on the annual course of the GPP partitioned from NEE The change dates were detected using a fitted double logistic sigmoid function (Gonsamo et al., 2013):
where t represents the numeric index of the time series, L1 and L2 are the asymptotic amplitude, k1 and k2 are the parameters controlling the steepness (curvature) of the transitions and t0 and t1 are the inflection points to the early- and late-summer transitions in GPP. The change dates were determined by calculating the third derivative of Eq. (2). The date of the first local maximum and the last local minimum were taken as the start and end dates of the season. The peak of the season was determined as the date of the maximum of the fitted function. The seasons were then defined such that the non-growing season (NGS) was before and after the start and end of the growing season, early growing season (EGS) is between the start and the peak, and late growing season (LGS) between the peak and the end of the growing season. To comprehensibly visualize the derivatives together with the GPP we normalized both the mean daily GPP and double sigmoid as well as the derivatives to a range of zero to using Eq. (3)
where x is the whole time series, xi is the specific value at index i and is the normalized value. Uncertainty in phenological transition dates was estimated by bootstrapping model residuals. Residuals from the fitted double sigmoid model were resampled and added to the modelled seasonal cycle to generate 300 realizations of the GPP time series. For each realization, the model was refitted and SOS, POS, and EOS were recomputed. Confidence intervals were then derived from percentiles of the resulting distributions.
2.5 Calculation of anomalies
To compare the climate and fluxes between the 3 years, anomalies of daily mean fluxes and climate were calculated using a block-averaging method. Daily anomalies were calculated as the deviation of each daily data point from the mean of the daily data within a ± 3 d-of-year window across all 3 years. Such anomalies were calculated for NEE, GPP, Reco, TA, SWIN, WT and VPD and are in the following denoted as z with the respective variable as subscript, e.g. zNEE.
2.6 Driver Analysis
The drivers of gas fluxes at a daily timescale were analysed using forward stepwise multiple linear regression models (MLR) between the anomalies of daily fluxes and anomalies of environmental drivers. Few days have no data gaps, e.g. due to filtering of low turbulence conditions at night. Thus, when working on the daily timescale, some gapfilled data needs to be included to avoid excessive data loss and skewed filtering (skewed towards nighttime when turbulence is lower). To minimize the effect of gapfilling on the driver analysis we used a threshold of maximum 50 % gapfilled data per day. We tested the influence of the percentage by repeating the analysis for thresholds from 10 % to 80 %. The results are presented in Sect. S2 in the Supplement). As the potential drivers of the fluxes zSWIN, zTA, zVPD and zWT were included. Additionally, we added multiplicative interaction terms between all drivers as predictor candidates. Interaction terms are in the following denoted with a colon between two variables (e.g. zTA:zSWIN). We only included WT and not SWC as a predictor because there were several gaps in the time series of SWC due to sensor failures and WT and SWC are closely correlated. Similarly, the time series of TA was more complete than that of TA and TA and TS are correlated (Pearson R = 0.83), thus we only included TA as a predictor. To compare the relative influence of the drivers, all predictors were standardized to the range of zero to one before fitting the model. Separate models were trained for the targets zNEE, zReco and zGPP. Predictors were sequentially added to the model. First the predictor was checked for collinearity. If the variance inflation factor (VIF) was larger than five, the model did not improve in its Akaike Information Criterion (AIC) and the adjusted R2 did not improve at least by 0.05 the predictor was rejected. Since driver strengths are likely to change between the non-growing and through the growing season, e.g. due to phenological development, separate models were created for the different seasons (see Sect. 2.4). All models were built in Python version 3.7. MLR models were built using statsmodels version 0.14.6 (Seabold and Perktold, 2010). Preprocessing of the data made use of the scikit-learn package version 1.8 (Pedregosa et al., 2011). Each fitting was repeated on 1000 bootstrap-resampled datasets to derive confidence intervals of the coefficients.
2.7 Detecting physiological changes in Reco and GPP responses
Monthly changes in amounts of carbon fluxes may be caused by seasonal climatic changes while the underlying response functions remain the same. To assess whether the environmental response of GPP or Reco fundamentally changed across the years, we established monthly temperature- and light-response functions. From those we extracted the characteristic parameters temperature dependency of respiration Q10, the light-use efficiency α and the maximum CO2 uptake rate Pmax. Note that these functions were not used to derive partitioned data but only to detect changes in the ecosystem responses to light or temperature.
We derived Q10 by fitting an exponential Lloyd–Taylor model (Lloyd and Taylor, 1994) to night-time CO2 fluxes (NEEnight) with Eq. (4). NEEnight was used instead of the partitioned Reco because Reco was already modelled based on a TA response curve.
Rref is the baseline respiration rate at reference temperature, T0 the baseline temperature set to −46 °C, Tref the reference temperature (set to 10 °C) and E0 the activation energy parameter that determines the temperature dependency of the model. After the determination of E0, the temperature response parameter Q10, depicting the change of respiration with a 10 °C change in temperature, was calculated with Eq. (5).
To determine the light response of the ecosystem fluxes we fitted a Michaelis–Menten rectangular hyperbolic light-response model (Bao et al., 2019; Falge et al., 2001) to daytime net ecosystem productivity (NEP) using Eq. (6). NEP is the inverse of NEE, which places net CO2 uptake as positive values, making the positive relationship with increasing radiation more intuitive to interpret. Daytime periods were defined as those with incoming solar radiation of more than 10 W m−2.
α is the light-use efficiency (µmol J−1), the initial slope of the curve representing the efficiency of carbon taken up per quantum of light, respectively. Pmax is the maximum rate of CO2 uptake () and Rd () represents daytime ecosystem respiration.
2.8 Detecting the response of ecosystem carbon fluxes during high TA and VPD conditions
Detecting the effects of TA and VPD on carbon fluxes is complicated by their mutual correlation and co-variation with other drivers such as SWIN. We therefore employed a sequential filtering approach to isolate the effect of each variable while controlling for the others (Fig. S3 in the Supplement). Measured (non-gapfilled) half-hourly NEE and the respective partitioned data were first filtered for daytime conditions (SWIN > 10 W m−2) and then for near light-saturated GPP using the 80th percentile of SWIN (570 W m−2). Optimum conditions (VPDopt and TAopt) were determined using boundary line regression, in which GPP is grouped into 1 °C bins, 1 hPa bins, respectively, and separate regression lines are fit to percentiles from those bins (0.55–0.95, steps of 0.1), capturing the maximum GPP response envelope. VPDopt and TAopt were defined as the bin where the highest three consecutive percentile regressions reached their maximum (tolerance: ± 1 bin). Data were then filtered to retain only conditions above these optima, as these are the ranges where a potential impact of TA or VPD can be expected.
To evaluate the effect of high TA while controlling for VPD (and vice versa), data were filtered to a narrow window of the controlled variable, with the window size selected as the largest window showing no detectable correlation (p > 0.05) of the controlled variable with the flux (tested from 0.5 to 6.5 °C, hPa respectively; Fig. S4 in the Supplement). For the TA analysis, the VPD window was centred on the mean VPD of data with TA above the 50th percentile of TA > TAopt (window: ± 2.1 °C). For the VPD evaluation, TA was centred on the mean TA of data with VPD above the 90th percentile of VPD > VPDopt (window: ± 5 hPa; Fig. S4). The different percentiles were required to capture high conditions of the evaluated variable and enable the removal of the correlation with the controlled variable while capturing enough data for a regression analysis. Finally, OLS regressions (statsmodels v0.14.6; Seabold and Perktold, 2010) were used to quantify the effect of TA or VPD on Reco, GPP and NEP, with separate models for the early and late growing seasons (see Sect. 2.4).
3.1 Climate data and interannual variability
The additional meteorological data used to supplement the data measured at the EC tower completed the data with a high level of agreement. The R2 of the linear models between TA and RH from the secondary tower and and the data measured at the EC tower was more than 0.90. For TA from the nearby DWD station R2 was 0.96 and for RH 0.80. The R2 on test data of the model used to fill SWIN was 0.97.
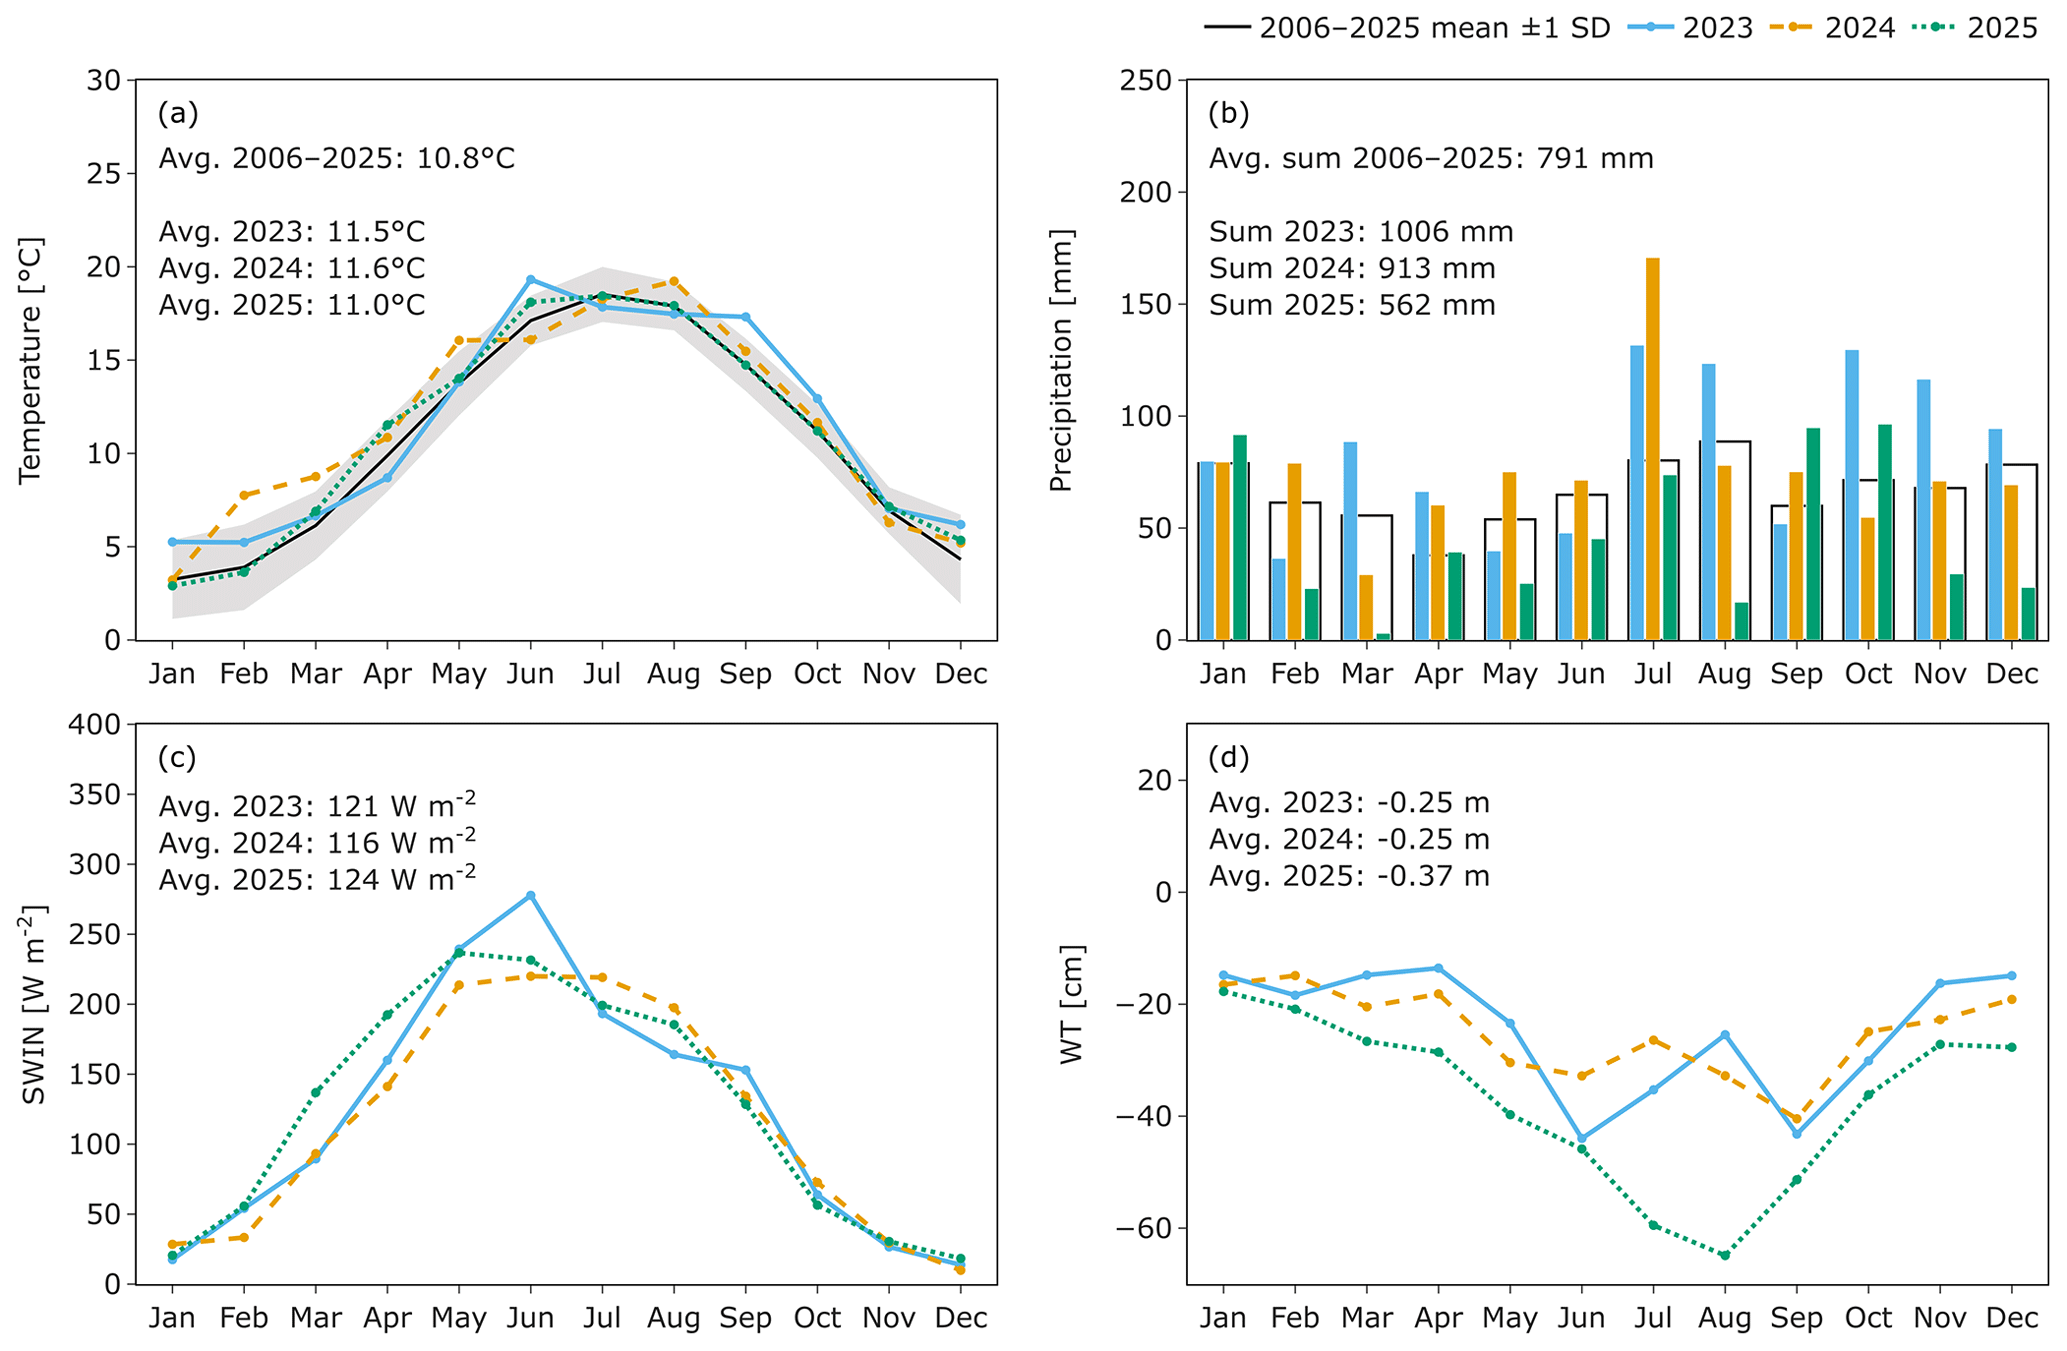
Figure 2Monthly mean values of air temperature (TA), water table (WT), shortwave incoming radiation (SWIN) and sums of monthly precipitation (P) across the three measurement years. The grey band in (a) and the black background bar in (b) show the mean monthly and annual TA and P from 2006 until 2025. For SWIN and WT no comparable long-term measurements are available from any nearby source. Annotations show the annual means of TA (a), SWIN (c) and WT (d), the annual sums of P (b) and the long-term annual averages of TA (a) and P (b).
Over the 3 years the mean annual TA stayed between 11.6 and 11.0 °C (Fig. 2a). Annual mean radiation was also in a close range between a maximum of 124 W m−2 in 2025 and a minimum in 2024 with 116 W m−2 (Fig. 2c). Both in 2023 and 2024 the site experienced exceptionally high amounts of precipitation with 1006 and 913 mm total rainfall (Fig. 2b), respectively, compared to a long-term average of 791 mm. Mean annual WT tracked annual precipitation, averaging −25 cm in the two wet years (2023 and 2024) and reaching its deepest level at −37 cm in the driest year, 2025 (Fig. 2d).
Comparing the individual months between the years revealed more striking meteorological differences. In 2024 the average TA in February, March and May was 7.7, 8.8 and 16.1 °C, making each of these months the warmest among the 3 years by a margin of at least 2 °C (Fig. 2a). In 2023 on the other hand the end of the growing season was the warmest among the 3 years by more than 1.5 °C at a mean of 17.3 and 12.9 °C in September and October. June 2023 was the warmest month of the 3 years with a mean monthly TA of 19.3 °C, 3.1 °C above the long-term average of 16.2 °C (Fig. 2a).
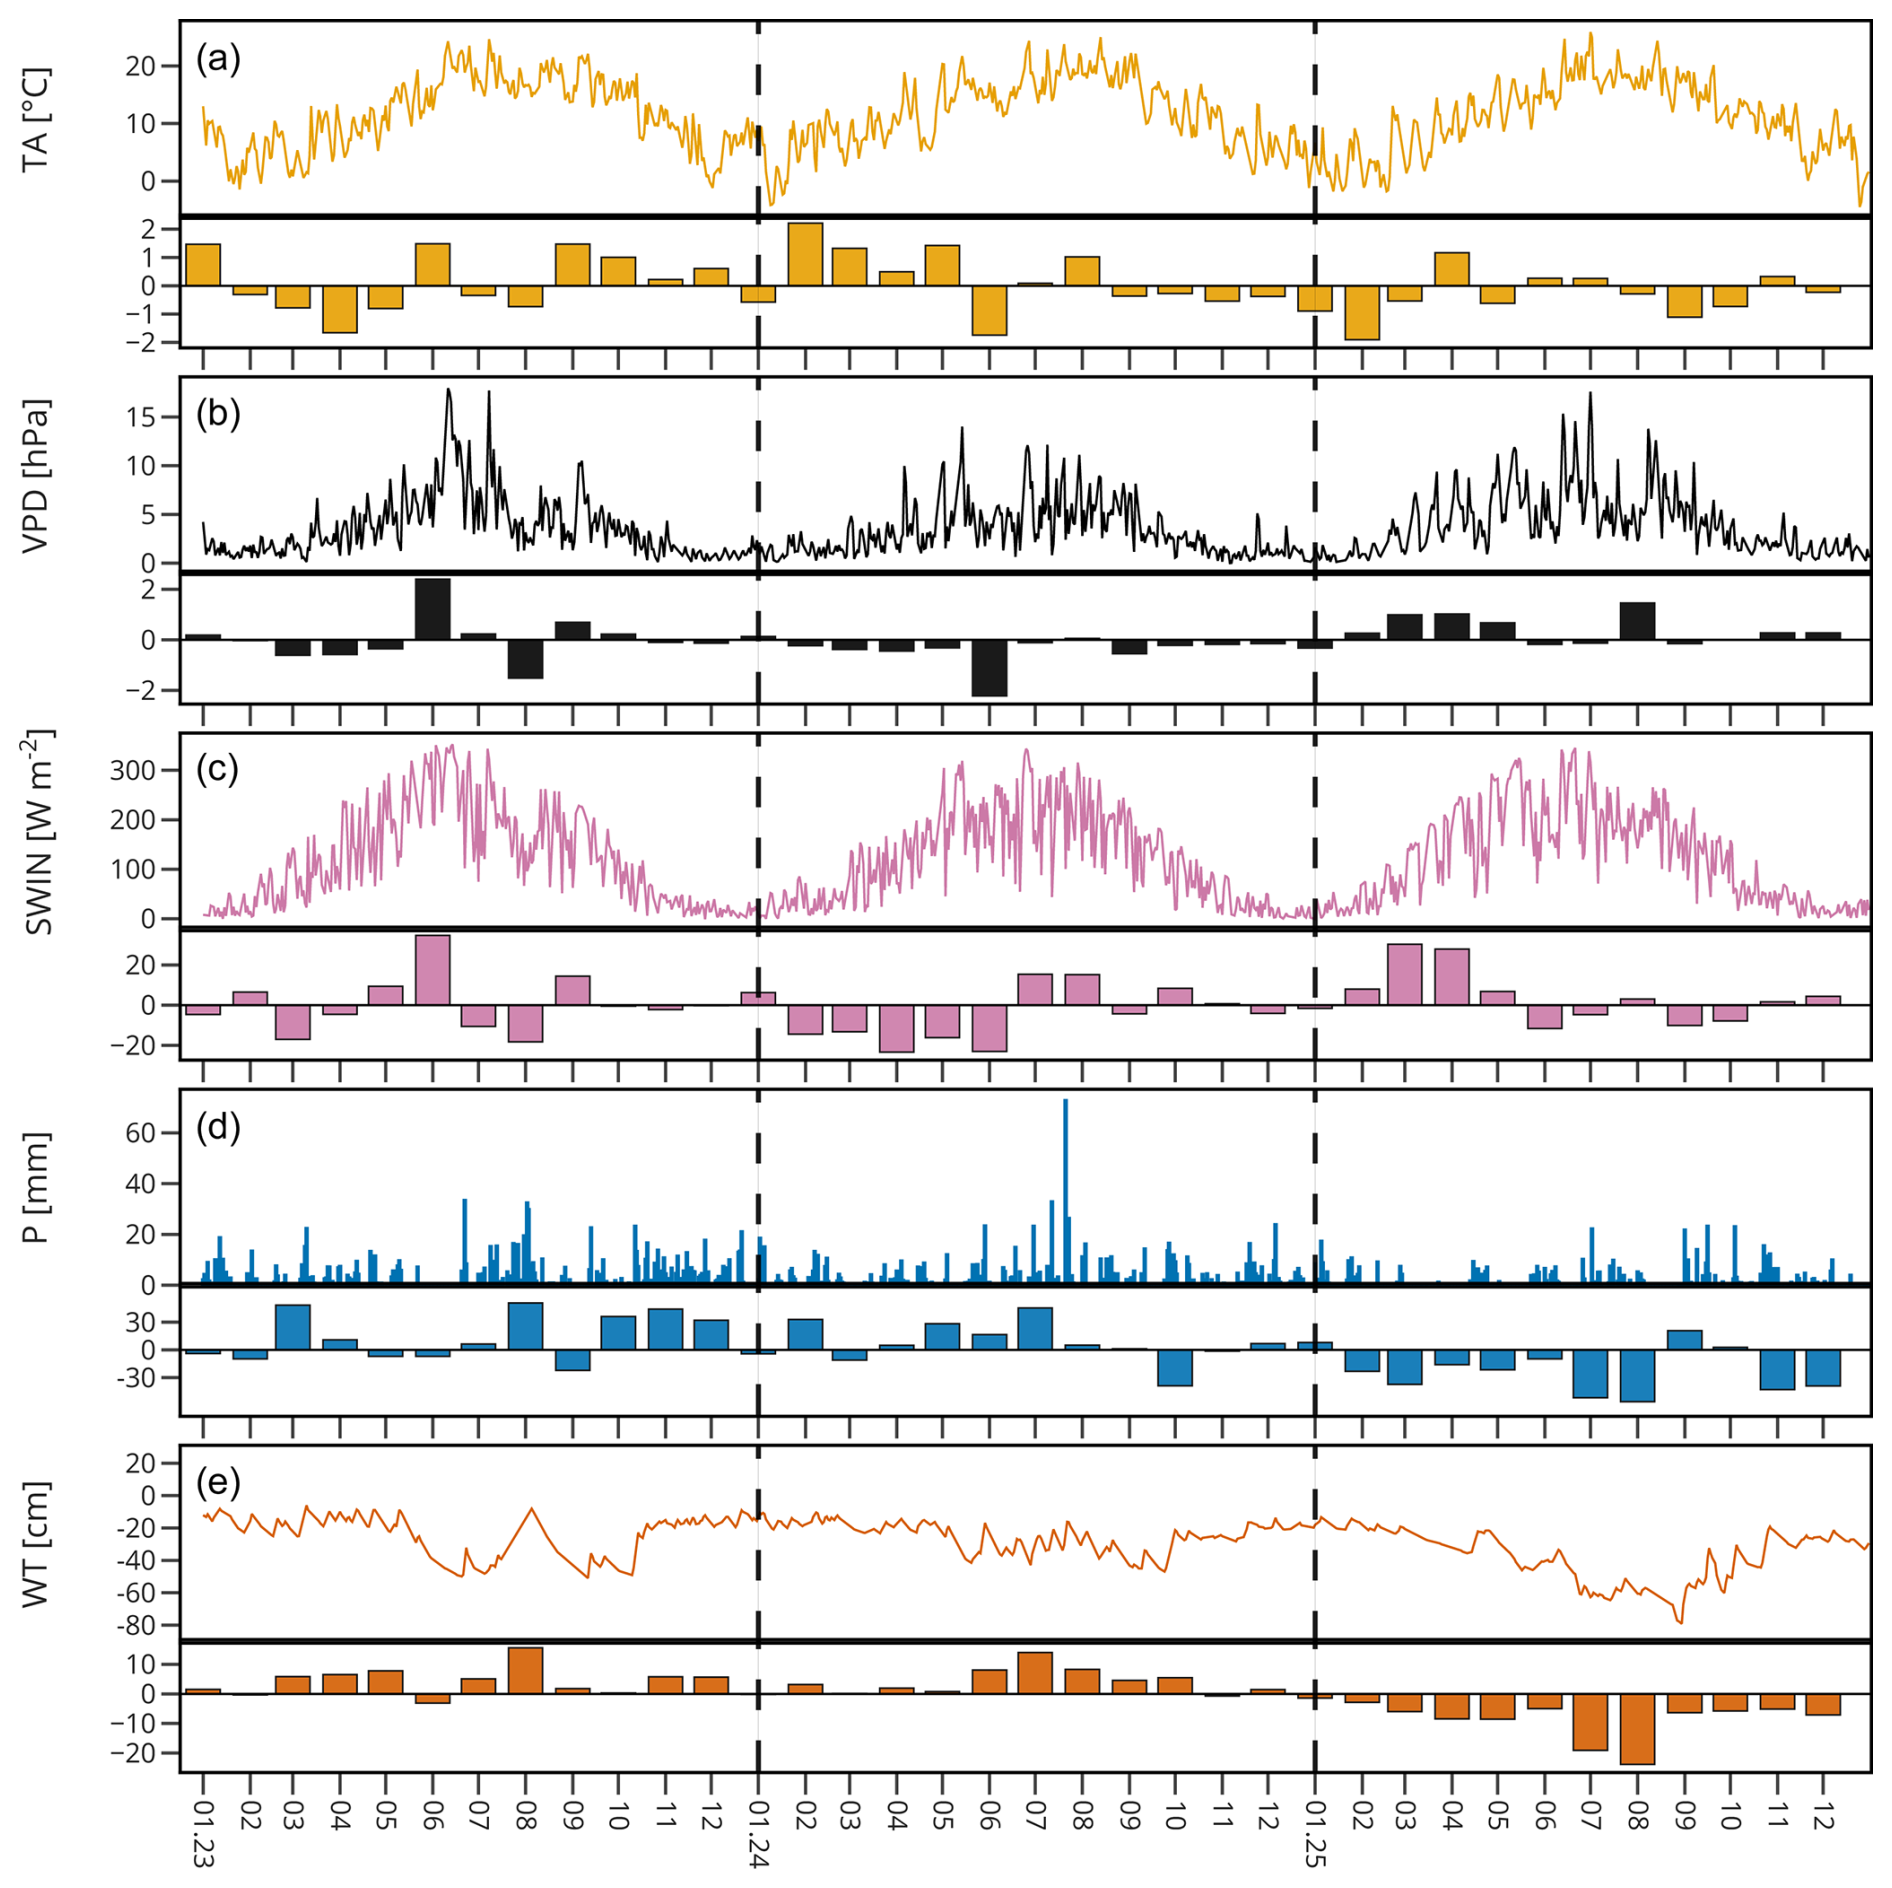
Figure 3Daily time series and monthly anomalies of climate and hydrology in the 3 years. Bar plots below each time series show the monthly anomalies as the deviation of that month's mean from the mean across all 3 years. WT data was partly derived from data provided by the Thünen Institute for Smart Agriculture as part of the Moorbodenmonitoring (MoMoK) project.
While annual cumulative rainfall was above average in both 2023 and 2024 (139 % and 126 % of the 20-year average; Fig. 2b), monthly distribution differed notably. In 2023, May and June were drier than usual (74 % and 51 % of average, while in 2024 March was the driest month (47 %) and July the wettest (171 mm; 220 % of average; Fig. 2b). The annual average WT in 2024 was similar to that in 2023. The lack of precipitation in May and June 2023 correlates with a sudden drop from −13.4 cm depth in April to −44 cm in June (Fig. 3d and e). In 2025 the year started with a precipitation deficit in March with only 3 mm, representing a 95 % reduction compared to the long-term average (Fig. 2b). The year 2025 was by far the driest among the 3 years, with March, May, June, and August all experiencing less than 50 % of the long-term average rainfall. Accordingly, the water table dropped earlier in 2025 and fell below −60 cm (Fig. 3e), resulting in a lower mean annual WT of −37 cm.
3.2 Quality of EC measurements
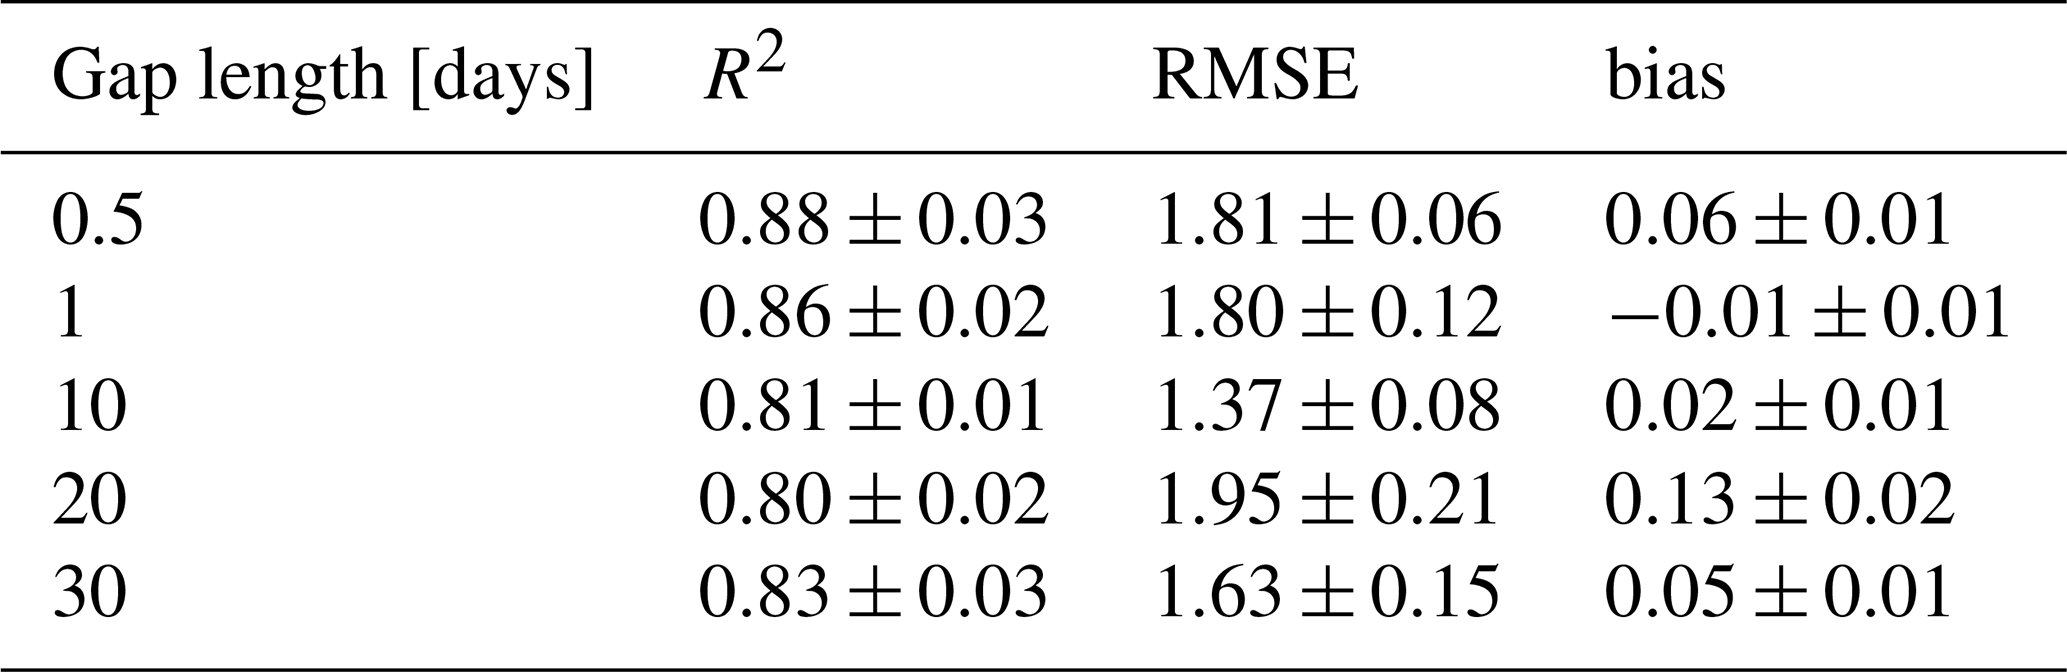
The EBC expressed as the slope between the sum of energy fluxes and the radiation budget minus the soil heat flux was 0.83 (Fig. S5 in the Supplement) for the 2023–2025 study period, which is slightly higher than the average closure of 0.8 found for the FLUXNET2015 dataset (Mauder et al., 2024). Due to filtering steps and gaps in the original data in total 29 % of CO2 flux datapoints were filtered out, 53 % of the night-time and 15 % of the day-time fluxes, respectively. Two events discontinued gas flux measurements in mid-summer, a lightning strike near the station in 9 July 2023 that broke the datalogger, as well as substantial damage caused by rodents on 30 June 2024 that led to a short-circuit, damaging controllers, gas analysers and soil sensors. The two incidents led to gaps of 19 and 29 d in 2023 and 2024, respectively. The ensemble neural networks filled gaps of lengths up to 30 d with an average R2 of at least 0.8 (Table 1) across ten repeated validation data samplings.
Table 1Performance of neural networks to fill gaps in CO2 fluxes of varying length. For each gap length 20 % of the data was sampled as consecutive blocks of the respective length with at least 50 % of available data in them, which was withheld during model training for independent validation.
For CH4 fluxes 58 % of datapoints were filtered out. Fluxes remained very low during the study period (Fig. S2 in the Supplement) with the 25th to 75th quantile ranging from −9.2 to 5.01 . The fluxes barely exceeded the uncertainty of the measurements, with the interquartile range of random measurement uncertainty alone ranging from 2.2 to 6.2 . Because the CH4 fluxes were so low and irregular no correlations with environmental or meteorological variables were found, preventing a reliable gapfilling (R2 was near zero for any tested method) and thus the calculation of an annual CH4 budget. Therefore, CH4 fluxes are not included in any mention of the sites carbon budget, and no driver analysis was conducted.
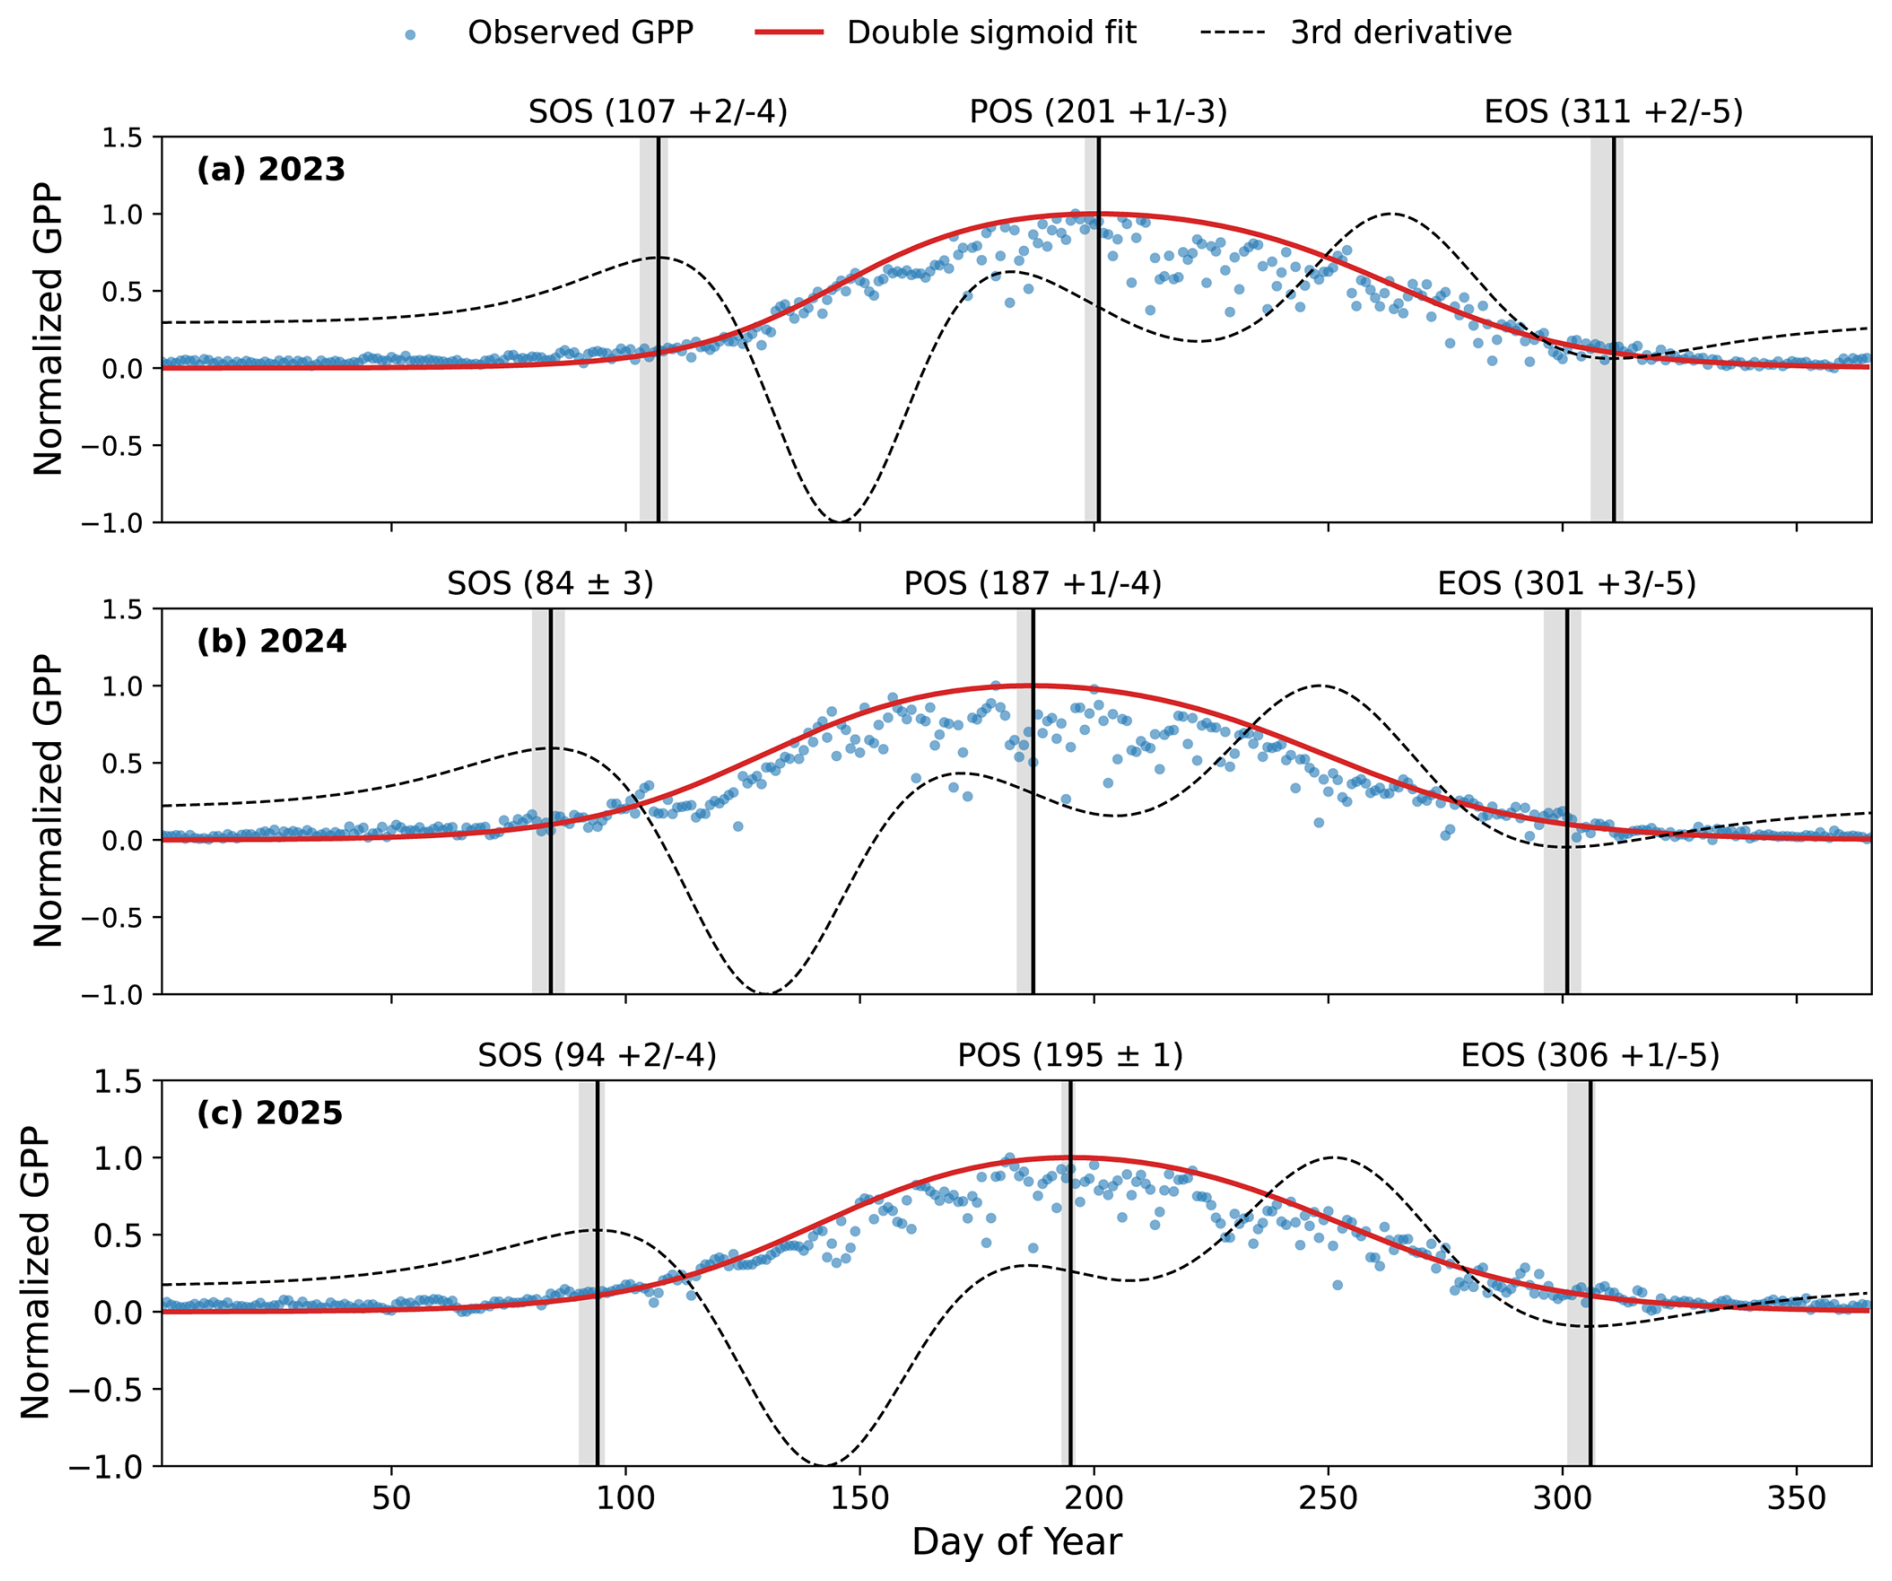
Figure 4Growing and non-growing seasons for the three study years. Blue dots show normalized daily mean GPP, red lines the fitted double-sigmoid curves, and dashed black lines their third derivatives. Vertical bars indicate seasonal transitions (DOY in brackets). Grey bands denote 95 % bootstrap confidence intervals.
3.3 Identification of vegetation growing season
The identification of the growing season revealed notable differences in timing of the start and end among the 3 years (Fig. 4). In 2024 the growing season started earliest, already on 25 March or day-of-year (DOY) 84 (Fig. 4b). In 2023 in comparison the growing season onset was detected 23 d later, on 17 April (Fig. 4a). The start of the growing season 2025 fell in between the other 2 years, 9 d after the onset in 2024 on DOY 94 (Fig. 4c). For each year the other seasonal transitions shifted along with the onset of the growing season. 2023 had the latest start of the growing season but also the latest peak at day 201 (20 July), 6 d later than in 2025, and the latest end of the growing season at DOY 311 (7 November), one week after the second latest in 2025 at DOY 306 (Fig. 4a). In 2024 the growing season started earliest, and it also ended earliest on DOY 301 on 27 October (Fig. 4b). Overall, growing season length was similar in 2024 and 2025 (217 and 212 d, respectively) and shorter in 2023 (204 d). The derived seasonal transitions were stable based on the residual bootstrapped confidence intervals. The maximum confidence interval ranged 8 d. Therefore, most transition points were significantly different across the years (all SOS and POS), only the confidence intervals of the EOS of 2023 and 2024 both overlapped with those of 2025 (Fig. 4).
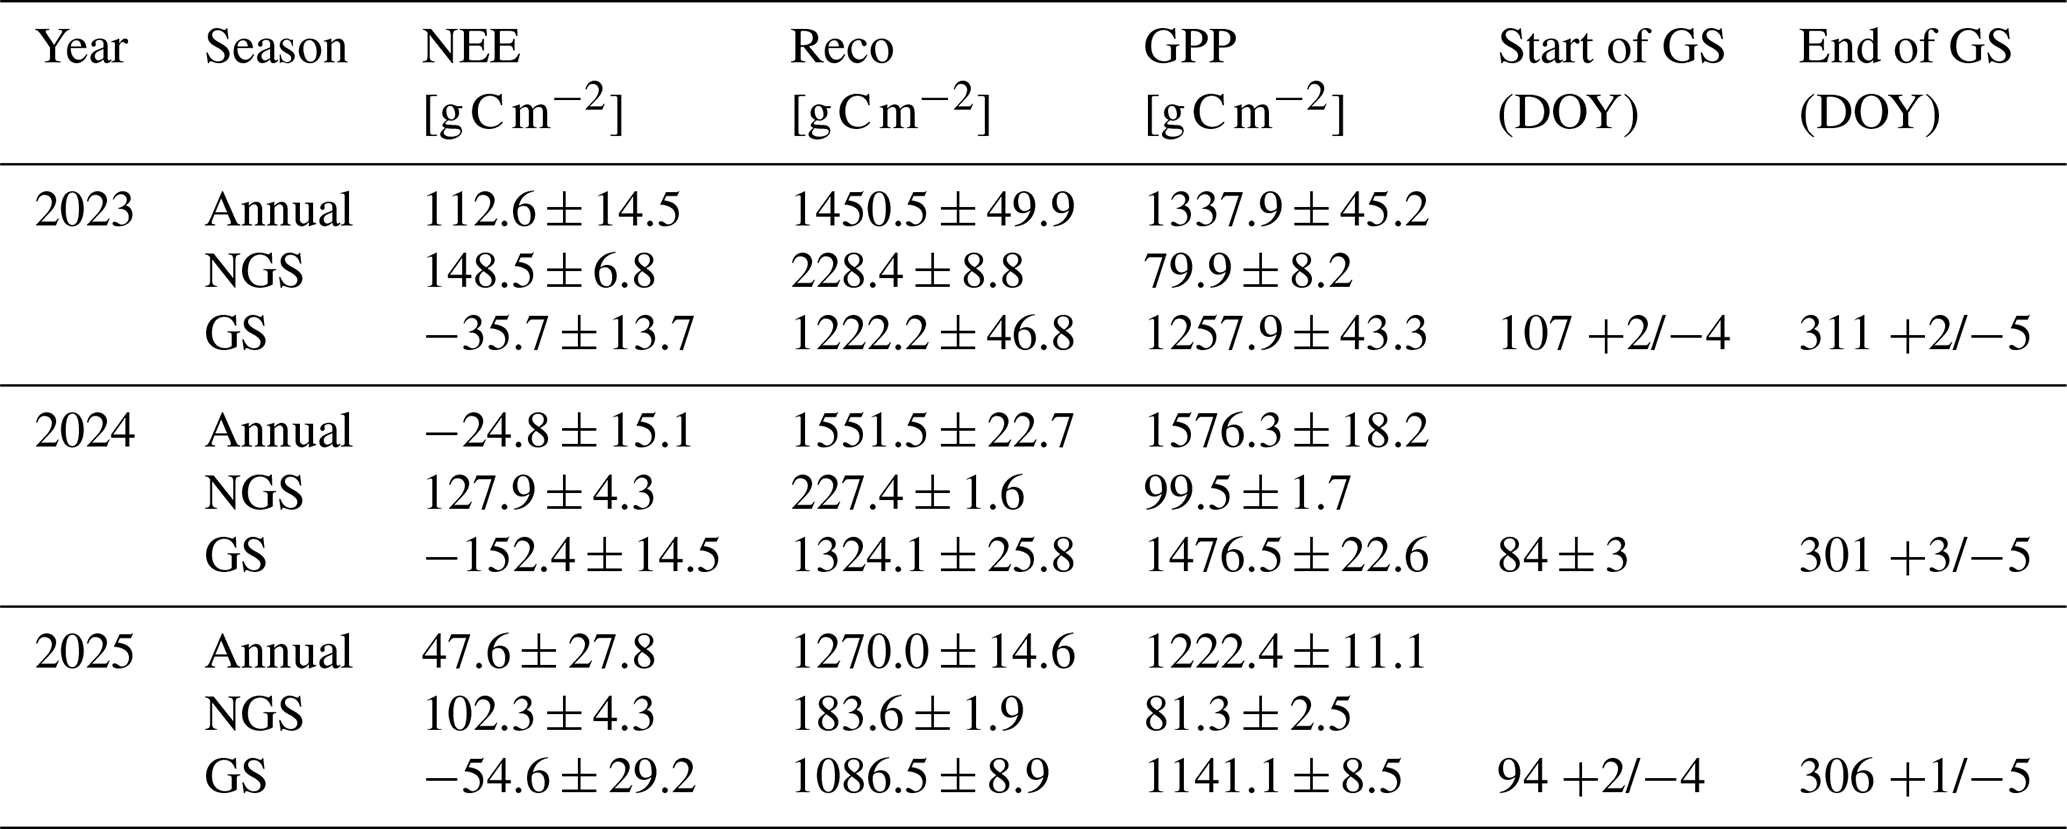
Table 2Annual and seasonal budgets of net ecosystem exchange of CO2 (NEE), ecosystem respiration (Reco) and gross primary production (GPP). Seasons are defined as the non-growing season (NGS) and the growing season (GS), including the early growing season (EGS) and late growing season (LGS) as described in Sect. 2.4. Start and end of the growing season for each year are shown together with the uncertainties based on bootstrapping of the modelled course of seasonality (see Methods, Fig. 4).
3.4 Annual, seasonal and monthly cumulative carbon fluxes
In the three measurement years the CO2 budgets switched from a net source in 2023 with 112.6 ± 14.5 g C m−2 to a weak CO2 sink in 2024 with −24.8 ± 15.1 g C m−2 (Table 2). In 2025 the site was a net CO2 source again with emissions of 47.6 ± 27.8 g C m−2 (Table 2). In 2024, where the ecosystem was a weak carbon sink, Reco was ca. 101 g C m−2 higher than in the previous year 2023. GPP however increased by 239 g C m−2 from 1337.9 ± 45.2 to 1576.3 ± 18.2 g C m−2, surpassing Reco. In 2025 both Reco and GPP were lower than in the previous years with 1270.0 ± 14.6 and 1222.4 ± 11.1 g C m−2.
The NGS was a CO2 source in all years, with relatively low interannual variability in NEE (max. difference of 46 g C m−2 between 2023 and 2025; Table 2). The growing season (GS) was a net CO2 sink in all years, with substantially higher interannual variability: NEE ranged from −152.4 ± 14.5 g C m−2 in 2024 to −35.7 ± 13.7 g C m−2 in 2023, a difference of 117 g C m−2. Reco and GPP were expectedly both higher in the GS than the NGS across all years. GS Reco ranged from 1086.5 ± 8.9 to 1324 ± 25.8 g C m−2, GPP ranged from 1141.1 ± 8.5 to 1476.5 ± 22.46 g C m−2, with both peaking in 2024. Interannual variability in GS carbon fluxes was higher than in the NGS, with Reco differing by up to 238 g C m−2 and GPP by up to 335 g C m−2 between 2024 and 2025. NGS Reco varied less, ranging from 183.6 ± 1.9 to 228.4 ± 8.8 g C m−2. Partitioning of Reco and GPP into seasonal sums showed low sensitivity to uncertainty in phenological transitions. Total sums for both the non-growing and growing season varied by less than 3 % between minimum and maximum growing season lengths based on the confidence intervals of the transitions (Fig. 4). NEE was more sensitive to uncertainty in growing season length. In 2023, the GS NEE increased by up to 17 % when integrating over the longest plausible growing season (DOY 103–313) compared to the best estimate (DOY 107–311), reflecting the inclusion of additional days with net CO2 emissions at the seasonal boundaries.
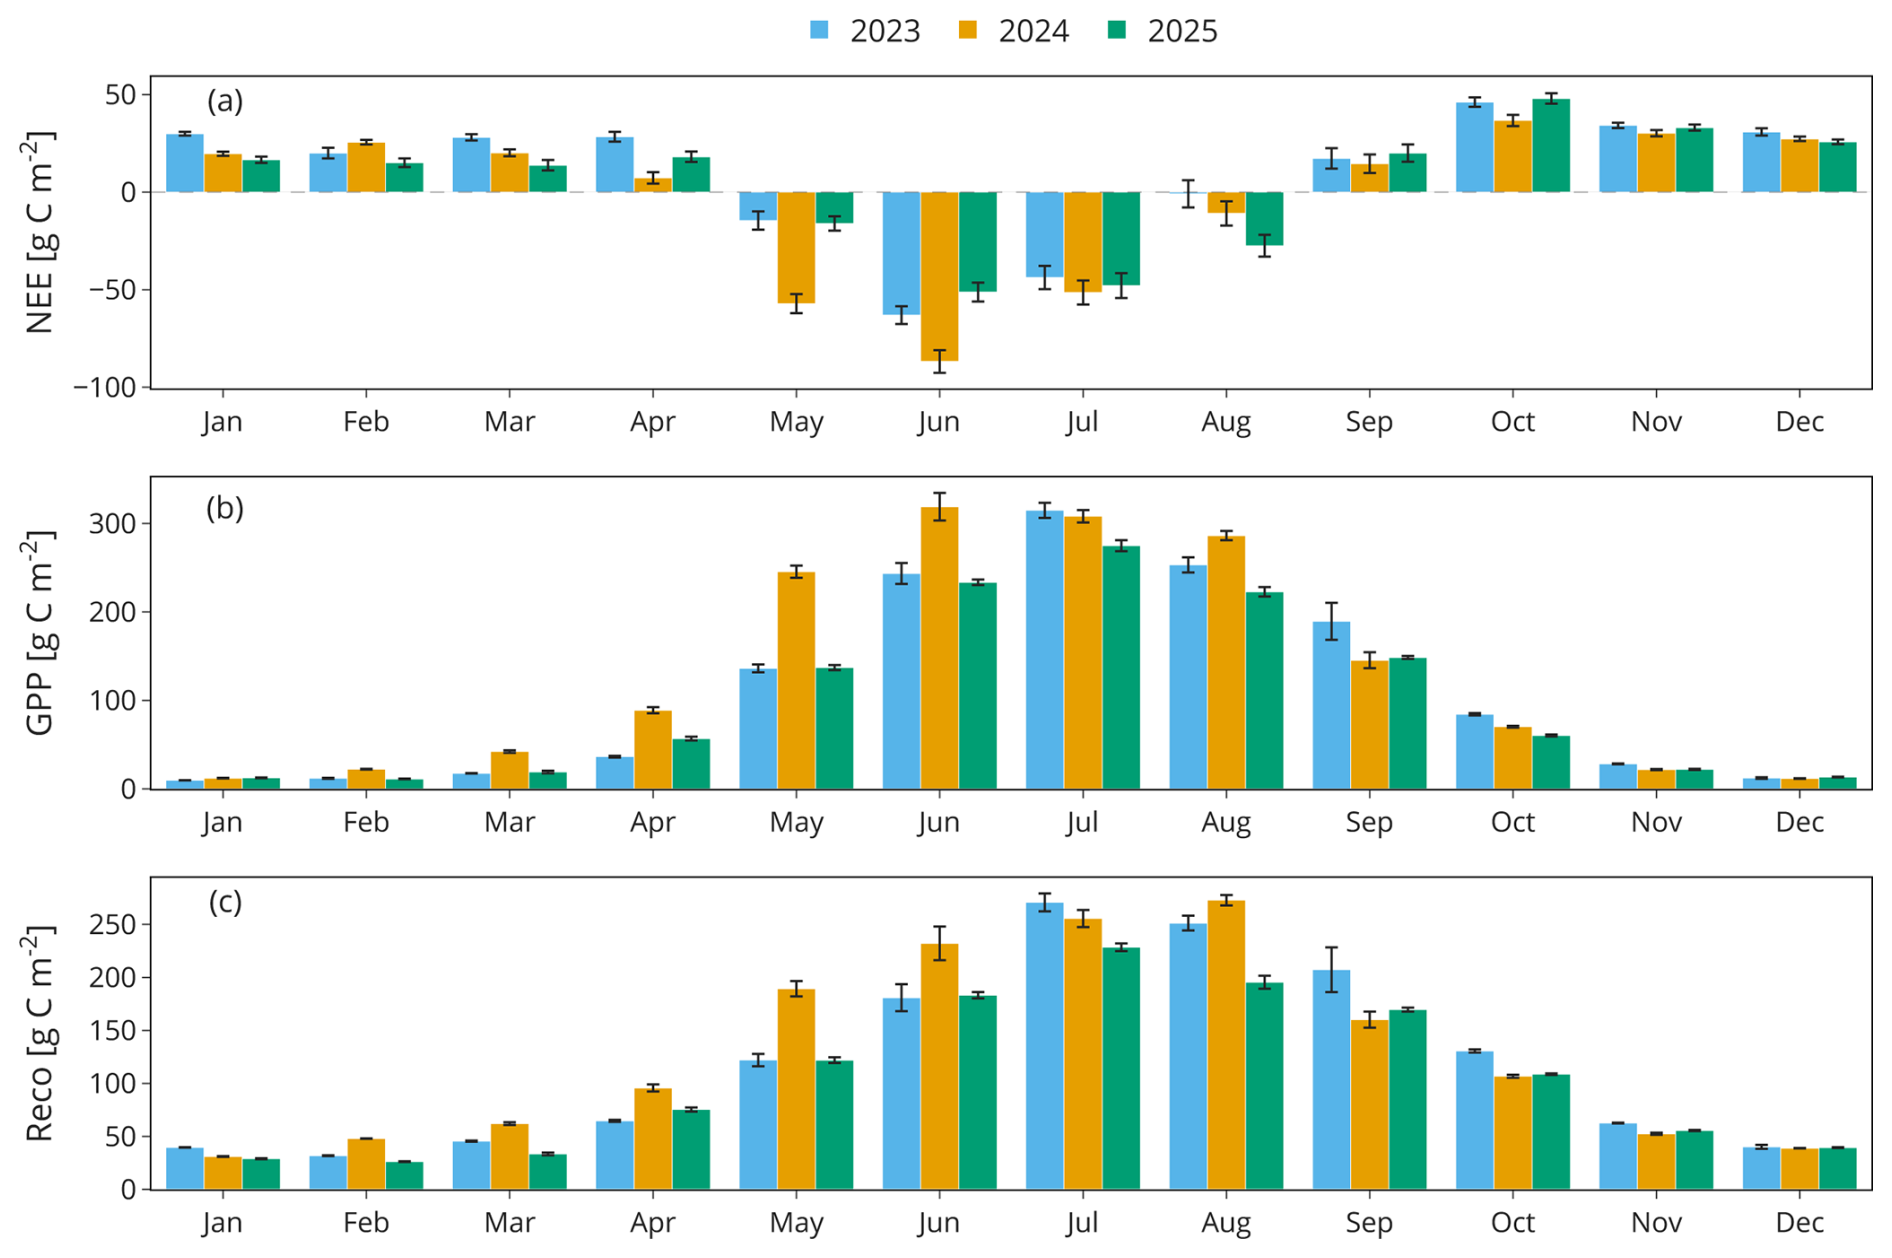
Figure 5Monthly sums of fluxes of NEE (a), GPP (b) and Reco (c). Error bars denote the 95 % CI of the monthly sum.
The monthly flux budgets reveal the decisive periods for the differences in the annual carbon budgets (Fig. 5). In 2024 CO2 uptake started earlier and was stronger compared to the other 2 years (Fig. 5a and b).
Both Reco and GPP were strongly increased in April to June 2024 compared to the other years (Fig. 5b and c), with GPP rising more than Reco. This led to reduced net emissions in April 2024 and a marked increase in net CO2 uptake in May and June 2024 (Fig. 5a).
The high total emissions of 2023 were accompanied by higher net emissions in March and April and lower net uptake in August than in the other years (Fig. 5a). From February to August, GPP and Reco were both largest in 2024, apart from July, where Reco and GPP were higher in 2023.
3.5 Driver analysis of daily flux anomalies per season
The multiple linear regression model performance varied considerably among seasons and target flux anomalies. In the non-growing season, the models for zReco and zNEE explained a large share of the variance (R2 = 0.67 and 0.82), while zGPP was poorly captured (R2 = 0.32), however this is expected as GPP is mostly absent in the NGS. The early growing season showed the lowest model performance across all seasons, with R2 ranging from 0.25 for zGPP to 0.41 for zNEE, thus daily climate anomalies alone explained a smaller share of flux variability during this period. In the LGS zNEE and zGPP were well explained (R2 = 0.76 and 0.63) and models for zReco showed moderate performance (R2 = 0.59). The chosen predictors, their signs and magnitudes of the effect sizes proved to be stable for a wide range of different thresholds of maximum allowed gapfilled data per day (see Sect. S2 and Fig. S1 in the Supplement for more details).
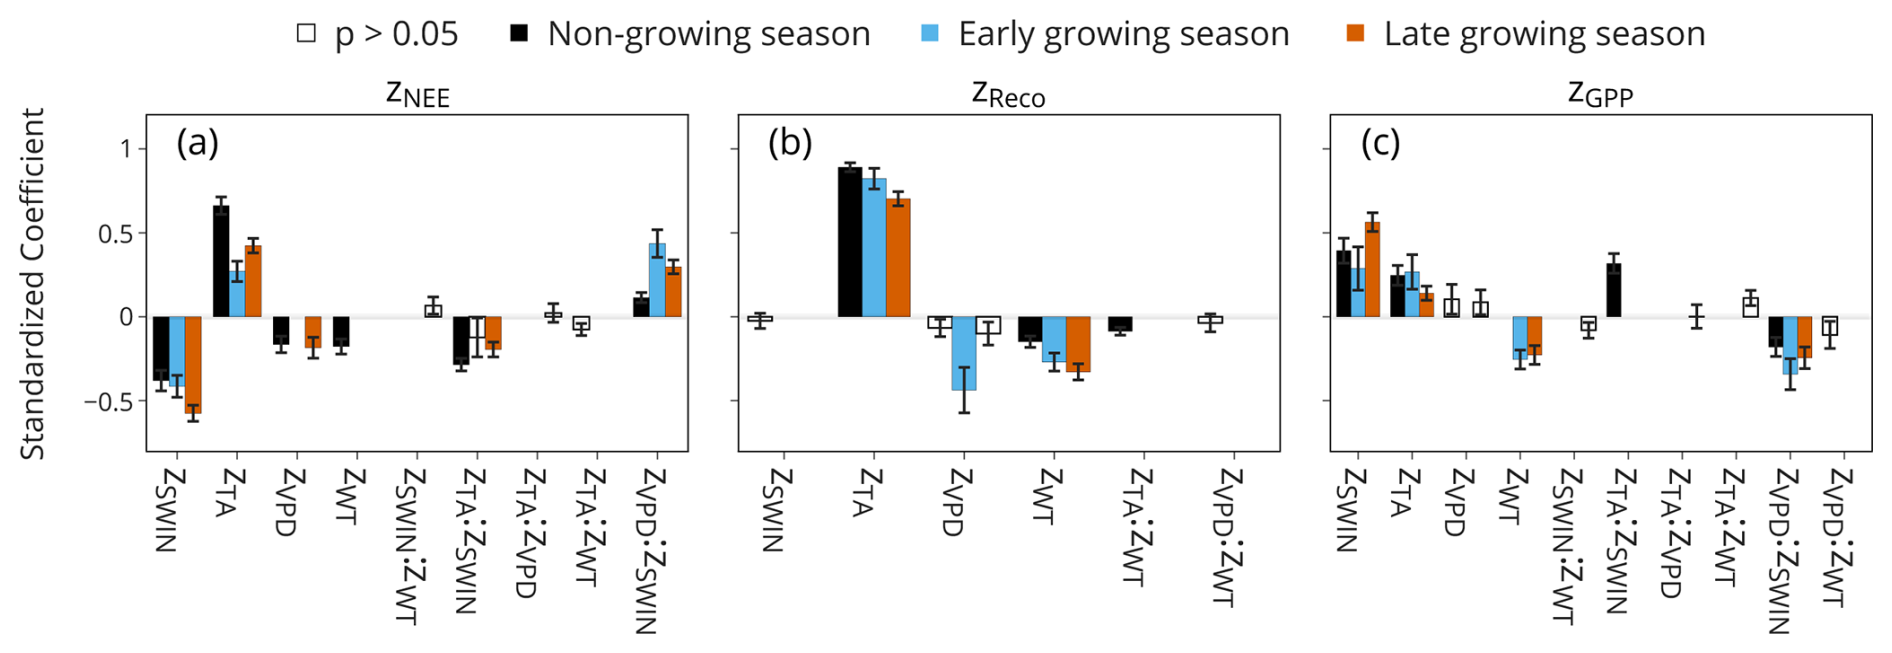
Figure 6Coefficients of stepwise-forward MLR models with anomalies of NEE (a), Reco (b) and GPP (c) as target variables and anomalies in climate and environmental ancillary variables as well as their interactions as predictors. Non-significant coefficients are shown in white with black borders (zVPD in the LGS in b). Note that WT gets more negative with dropping WT, therefore a negative coefficient represents an increasing effect on the flux.
The selected predictor variables varied for each flux between the seasons (Fig. 6). For zNEE the strongest driver of increasing emissions was zTA in the NGS and LGS, thus higher TA increased net CO2 emissions (Fig. 6a). Notably the effect of zTA was reduced in the EGS. During the EGS, the interaction of anomalies in VPD and SWIN instead emerged as the strongest driver of increased NEE (thus increased emissions or decreased CO2 uptake). In contrast, anomalies in incoming radiation (zSWIN) were the strongest driver of increased CO2 uptake across all seasons. Concurrent conditions of warm TA and high light availability (thus the interaction zTA:zSWIN) exerted a small uptake-enhancing effect in the NGS and LGS. zVPD and zWT had similarly small effects, with zVPD and zWT decreasing NEE in the LGS and NGS, respectively. Note that WT becomes more negative as the water table drops. A negative effect of zWT on NEE therefore implies that lower (deeper) water tables are associated with higher (more positive) NEE values. Similarly, negative effects of zWT on zReco and zGPP translate to an increase in Reco or GPP with dropping WT.
zReco was primarily controlled by zTA across all seasons, with warmer conditions consistently driving enhanced Reco (Fig. 6b). A secondary effect of zWT indicated that drier conditions also increased Reco, particularly during the growing season. Conversely, positive VPD anomalies suppressed Reco during the EGS. Remaining significant effects were very small across all seasons (coefficients <0.1).
Increased GPP was associated with increased SWIN, TA, and lower WT, alongside the interaction of zTA:zSWIN in the NGS (Fig. 6c). Increased incoming solar radiation (zSWIN) had the strongest positive effect on GPP in the LGS and a weaker effect in the EGS. The influence of zTA was weakest in the late growing season. The interaction of temperature and radiation zTA:zSWIN had a positive effect on GPP during during the NGS. Across all seasons, the interaction zVPD:zSWIN exerted a negative effect on GPP, with a stronger impact in the EGS than the LGS, suggesting a negative impact of VPD on CO2 uptake under light-saturated conditions.
3.6 Photosynthetic and Respiratory Controls on CO2 Exchange
Light-use efficiency α and Pmax showed a typical seasonal cycle with Pmax reaching up to 37 in June and July (Fig. 7). In April, May and June 2024 Pmax was strongly increased with 13, 26 and 38 (Fig. 7a) compared to an average of 5, 14 and 25 in the other 2 years. Further, the light-use efficiency in May 2024 was higher than in the other years with 0.11 µmol J−1 compared to 0.04 and 0.07 µmol J−1 in 2023 and 2025, respectively (Fig. 7a). From June to August 2024, the Q10 of respiration was higher than in the other 2 years, averaging 1.7 over the 3 months compared with 1.4, and reaching a maximum of 1.9 in June 2024 (Fig. 7c). In August 2025 both Pmax and the Q10 of respiration are notably lower than in the other 2 years with a Q10 of 1 compared to 1.2 and 1.6 and a Pmax of 26 compared to 34 in the other 2 years.
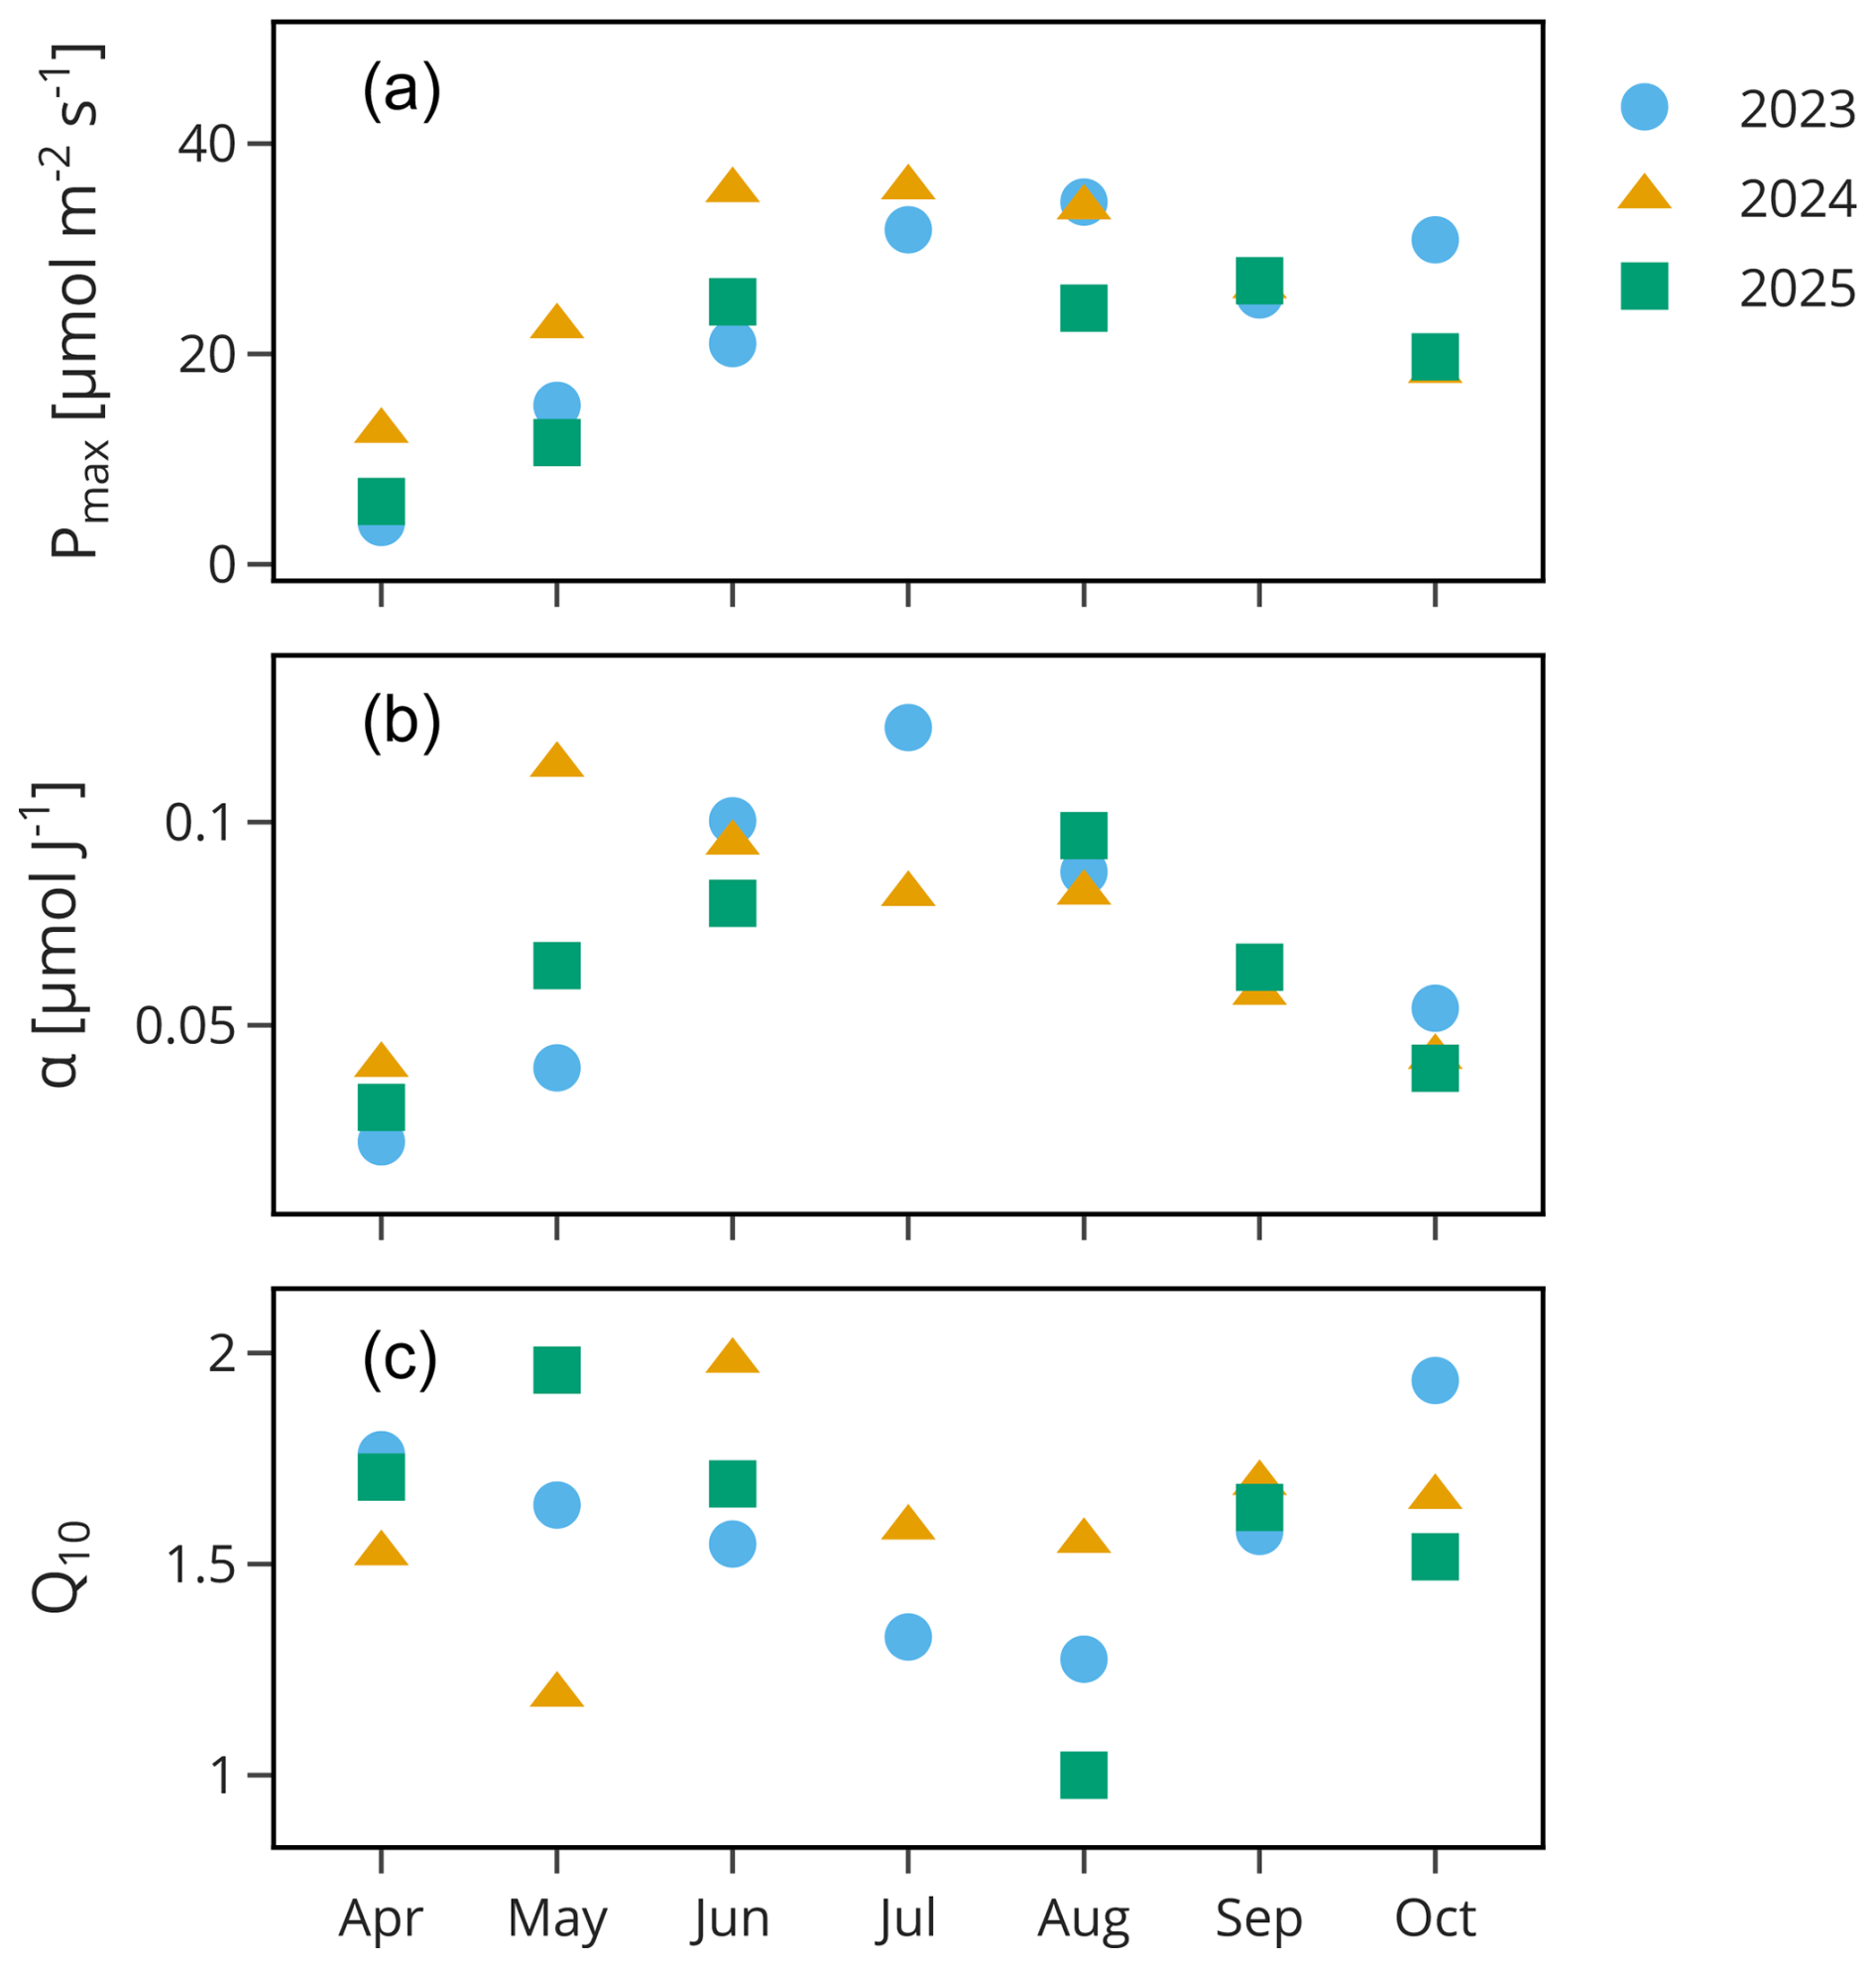
Figure 7Maximum photosynthetic uptake capacity Pmax (a) and light-use efficiency α (b) derived from light-response-curves for NEP as well as the temperature sensitivity of night-time NEE Q10 (c), derived from a Lloyd–Taylor model. Light-response and Lloyd–Taylor models are fit for each month in each year separately.
3.7 Ecosystem responses to elevated TA and VPD
The filtering successfully isolated the effects of TA and VPD. Correlations between fluxes and controlled variables did not exceed a Pearson correlation of 0.13 (Fig. S6 in the Supplement). Notably, the correlation of fluxes with SWC was negative (−0.18 to −0.42) both in the data controlled for VPD and the data controlled for TA (Fig. S6), depicting increasing carbon fluxes under reducing soil moisture in the filtered data. We found no correlation between SWC and VPD (see S1 in the Supplement).
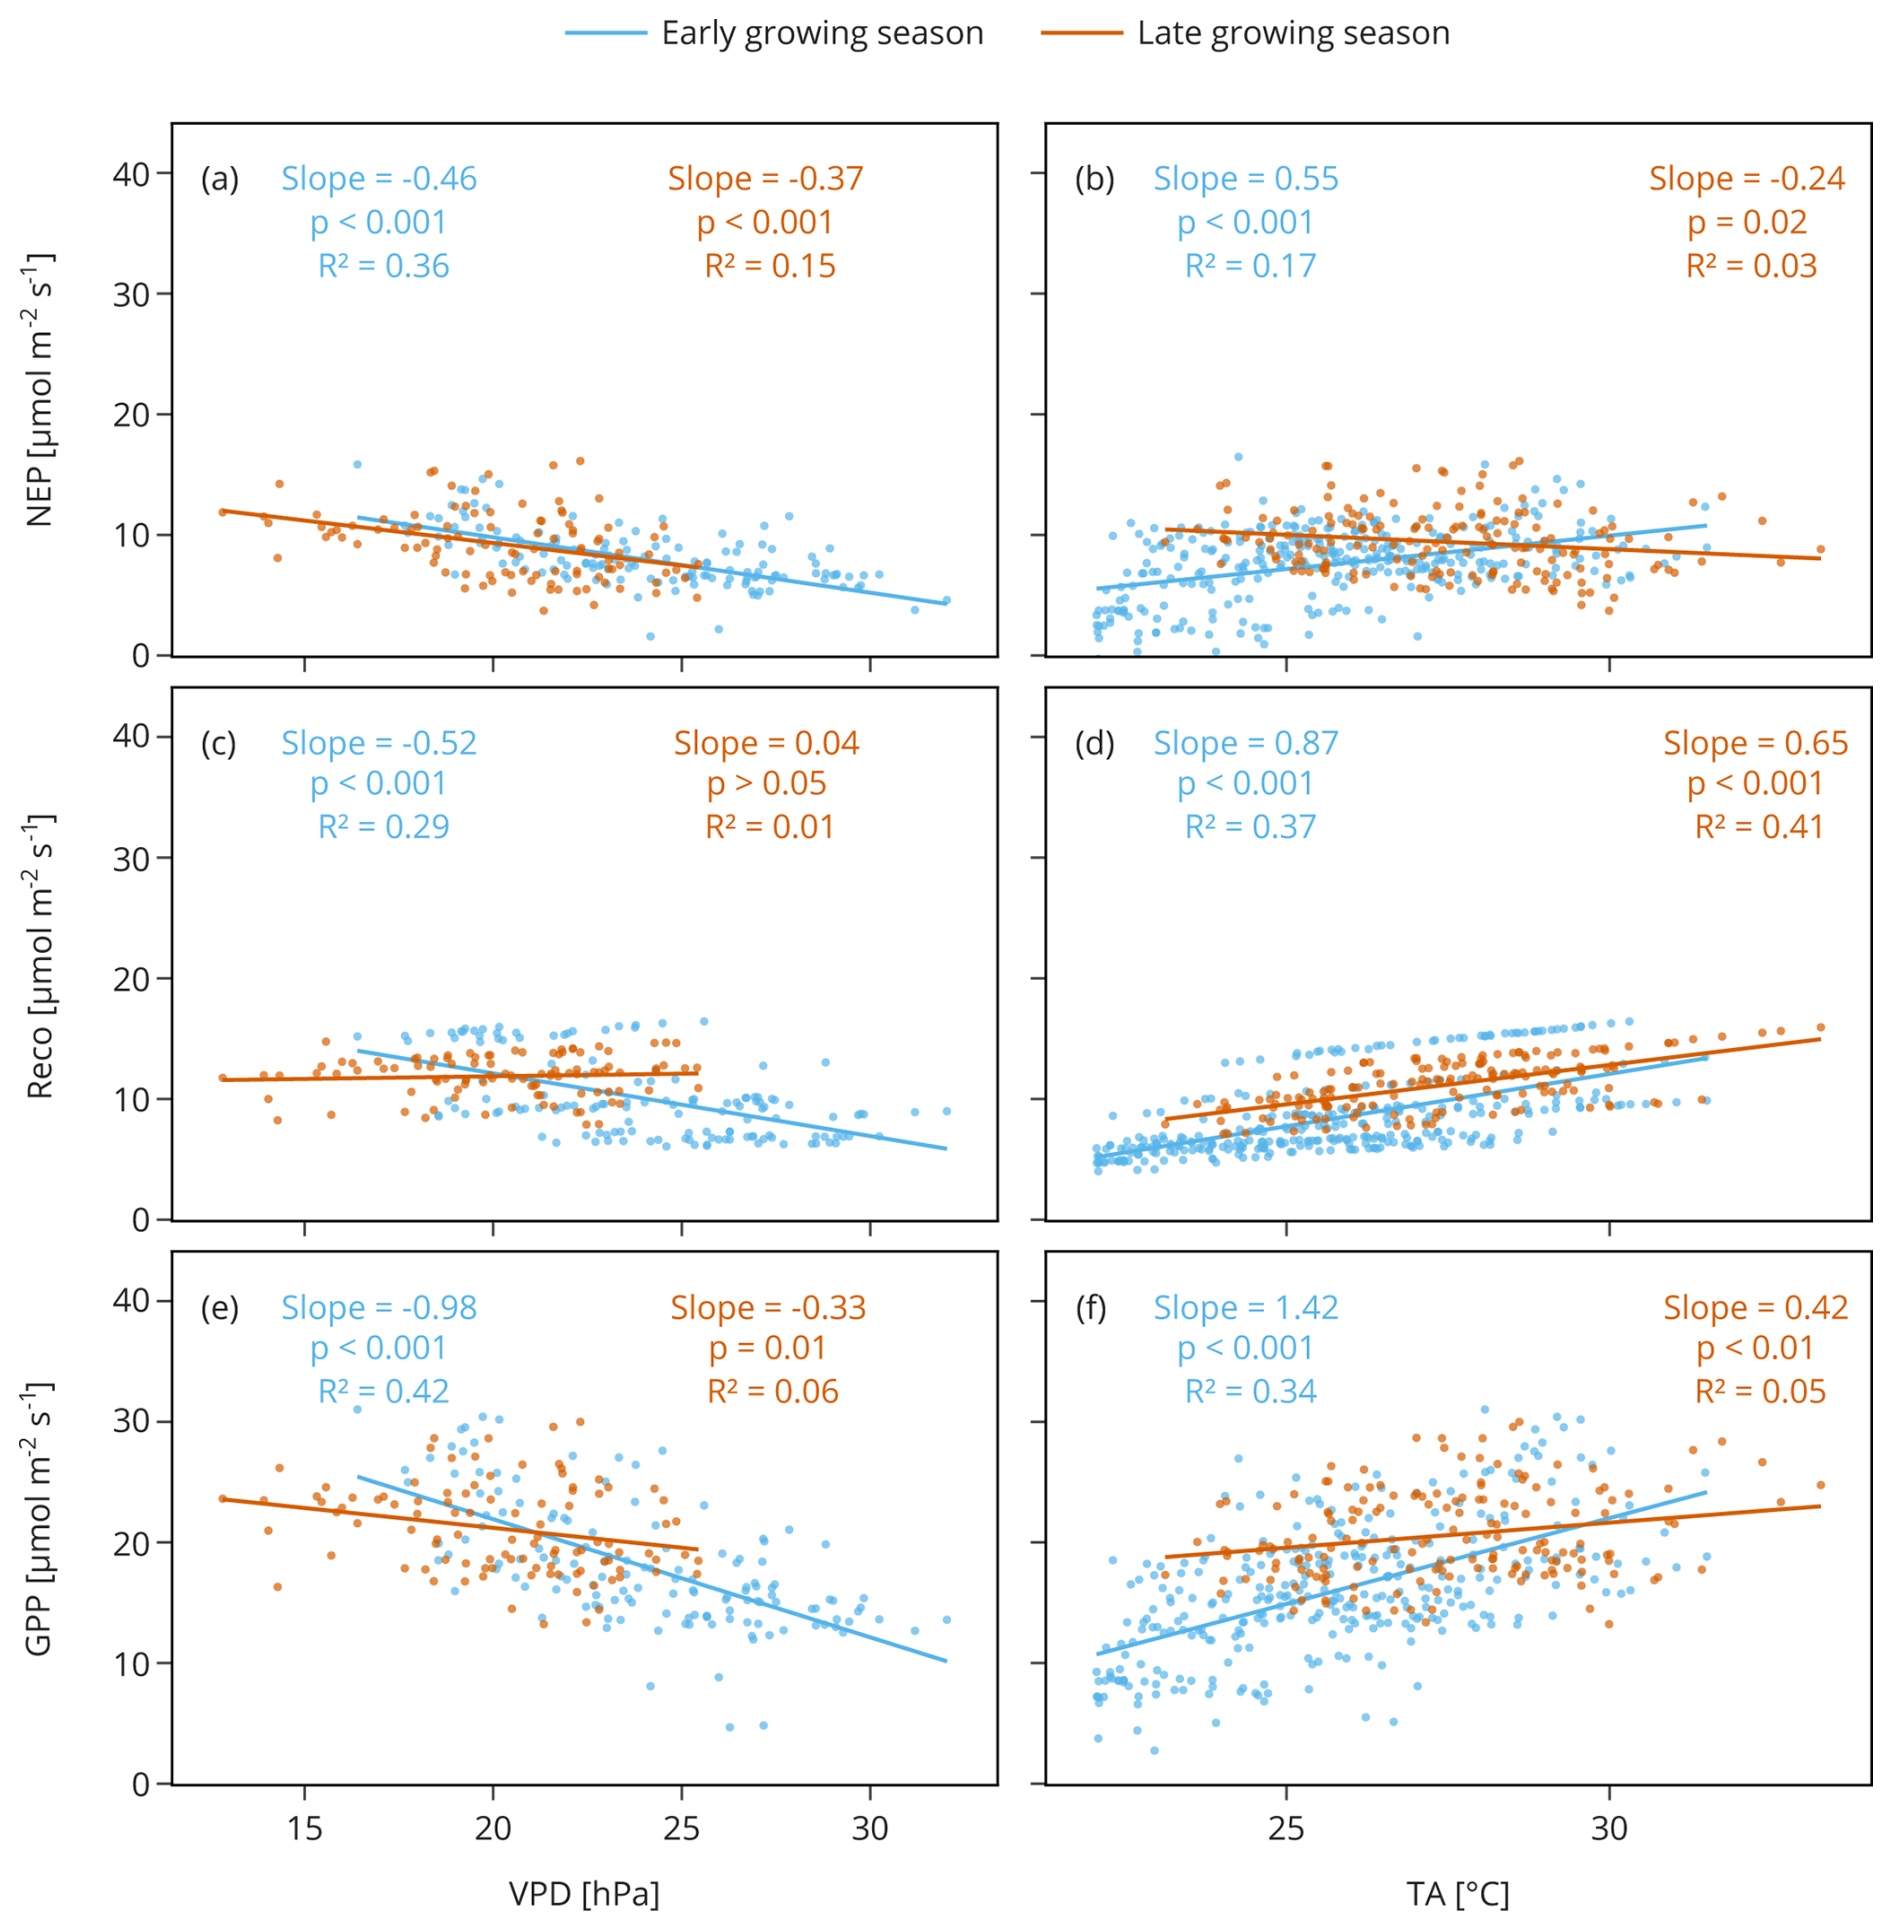
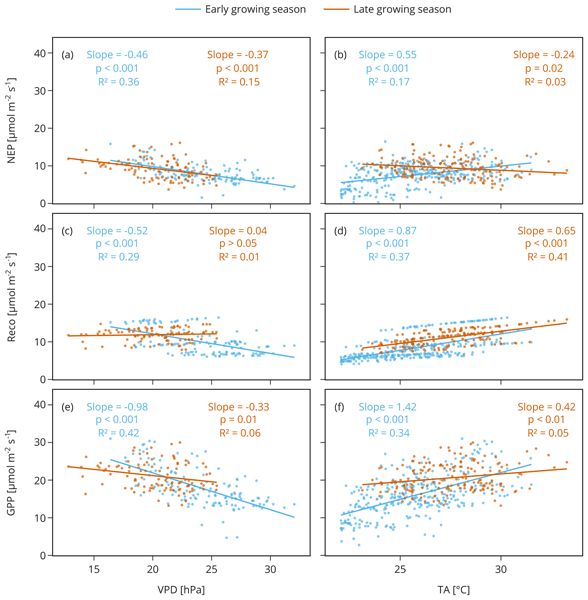
Figure 8Responses of half-hourly net ecosystem CO2 uptake (NEP), ecosystem respiration (Reco) and gross primary production (GPP) on high VPD (a, c, e) and TA (b, d, f) conditions. Data is filtered such that the respective effects of TA and VPD are isolated. Points and regression lines in blue depict the data from the early growing season (EGS), red is the data from the late growing season (LGS).
Throughout the growing season, even under highest encountered TA conditions warming was positively correlated with both GPP and Reco (Fig. 8d and f), but increased NEP in the EGS and decreased NEP in the LGS (Fig. 8b). In the EGS, GPP responded stronger to high TA than Reco (Fig. 8d and f), resulting in increasing net CO2 uptake (Fig. 8b). In contrast, in the LGS Reco increased stronger with TA than GPP (slopes of 0.65 and 0.42, Fig. 8d and f), leading to a decreasing net CO2 uptake (Fig. 8b).
Contrary to the TA response, VPD increasingly suppressed all fluxes in the EGS (Fig. 8a, c, and e). The decrease of GPP at high VPD during the EGS was almost twice as strong as the reduction in Reco with a slope of −0.98 (Fig. 8e) compared to −0.52 (Fig. 8c). In the LGS the responses changed markedly. Reco was not significantly correlated with VPD while GPP was still reduced but the effect was weaker than in the EGS with a slope of −0.33 (Fig. 8e). Together the reduction of GPP and the absent reduction of Reco in the LGS also resulted in a decrease in NEP similar to the EGS (slope of −0.37 compared to −0.46, Fig. 8a).
4.1 Annual and seasonal dynamics of carbon budgets
Annual CO2 budgets were variable, ranging from a net source of 112.6 ± 14 g C m−2 to a weak sink of −24.8 ± 15.1 g C m−2 (Table 2). These values fall between IPCC CO2 emission factors for rewetted temperate (−64 to 18 g C m−2) and extraction peatlands (110 to 420 g C m−2) (IPCC, 2014). According to the German CO2 emission inventory for wetlands, our study site with a WT persistently deeper than −20 cm and shrub-dominated vegetation, falls in the category of drained unutilized land, where emissions are estimated within the range of 70 to 1080 g C m−2 (Tiemeyer et al., 2020). With mean annual emissions of 45 g C m−2 the measured annual budgets confirmed a moderate but real contribution to global warming.
Past studies found that either the variability in Reco (Aslan-Sungur et al., 2016; Drollinger et al., 2019; Ueyama et al., 2014) or in GPP (Chivers et al., 2009; Li et al., 2021; Lund et al., 2010) controlled the annual variability of CO2 budgets. In the three measurement years the variability of NEE in the growing season was substantially higher than in the NGS (117 and 48 g C m−2 maximum difference; Table 2) and the differences in GPP were greater than those in Reco (335 and 238 g C m−2 maximum difference, respectively; Table 2). This highlights that the growing season vegetation activity played a pivotal role in shaping the interannual variability in CO2 fluxes.
Ranges of annual Reco and GPP at Amtsvenn (1270.0 ± 14.6 to 1551.5 ± 22.7 and 1222.4 ± 11.1 to 1576.3 ± 18.2 g C m−2, respectively) are high compared to other reported flux budgets from semi-natural bogs with shrubs in the footprint and similarly fluctuating water tables, where annual sums of GPP and Reco typically range between 600 and 800 g C m−2 (Humphreys et al., 2014; Hurkuck et al., 2016). The high GPP is likely attributable to the dense shrub canopy, as shrubs can sustain carbon uptake rates exceeding those of natural peatlands or even grasslands (Gyimah et al., 2020; Quin et al., 2015). Elevated Reco is consistent with the WT persistently below −15 cm, which promotes peat aeration and microbial decomposition (Ma et al., 2022; Swails et al., 2022). Additionally, Reco may be enhanced through vegetation activity. Root exudates released by ericaceous shrubs can increase CO2 emissions by increasing the microbial potential for cellulose and hemicellulose decomposition (Cai et al., 2024) and autotrophic respiration, which can make up more than 50 % of the total Reco in shrub dominated ecosystems (Rankin et al., 2023), increases with GPP (Waring et al., 1998). Finally, both Reco and GPP may be enhanced by the elevated nutrient availability in the upper peat layers (Lund et al., 2009).
Methane fluxes were low and did not exceed measurement uncertainty. CH4 emissions require anoxic, waterlogged soils (Evans et al., 2021; Frolking et al., 2011; Zhang et al., 2022) and approach zero when annual average WT is below 20 cm (Calabrese et al., 2021; Evans et al., 2021), which was almost always the case in the three measured years (Fig. 3e). Repeated drying-rewetting cycles can further suppress CH4 formation through regeneration of electron acceptors (Gao et al., 2019; Knorr et al., 2009). Although Molinia caerulea, which is present with up to 25 % cover, could act as a methane conductor (van den Berg et al., 2020; Buzacott et al., 2024; Leroy et al., 2017), shrub dominance and persistently deep water tables likely explain the absence of detectable CH4 emissions. In Amtsvenn, the peat below 30 cm depth contains low concentrations of inorganic alternative terminal electron acceptors (Lemmens et al., 2026), yet ombrotrophic peat typically contains redox active organic moieties, contributing considerable electron accepting capacities (Guth et al., 2023). Thus, a suppression of methane formation by alternative electron acceptors during the warm summer period may also occur. Although nitrogen and phosphorus concentrations are elevated in the upper 10–15 cm of the peat, the WT rarely reaches these layers. Moreover, when it does, low TA likely co-limits methane production.
Notably, for a full carbon balance the export of dissolved organic carbon (DOC) through the drainage ditches may present an additional pathway of C loss (Rosset et al., 2022). DOC measurements were not conducted during the three measurement years and are thus not included in the annual budgets.
4.2 Drivers of CO2 fluxes
4.2.1 The impact of climate and hydrology on CO2 fluxes
Net CO2 uptake and GPP were strongly controlled by zSWIN, which is expected as radiation is the primary driver of photosynthesis (Fig. 6a and c). Daily TA anomalies were a consistent driver of all CO2 flux components. TA increased daily Reco more than GPP (Fig. 6b and c), posing an explanation of the net emission-increasing effect (Fig. 6a). Reco is partitioned from NEE using a temperature response. While not precluding a steeper increase in partitioned GPP than Reco, it tightly couples Reco to TA (Reichstein et al., 2005). Other factors limiting Reco such as light-induced inhibition of respiration (Keenan et al., 2019) may not be detected, leading to an overestimation of Reco with increasing TA. Nevertheless, past studies do support decreased net uptake with rising TA through increased Reco especially in mid-summer (Aslan-Sungur et al., 2016; Drollinger et al., 2019; Poczta et al., 2023; Wilson et al., 2016). On the other hand, sustained warming can also promote CO2 uptake and growth of graminoids (Li et al., 2021; Oestmann et al., 2022) and shrubs (Walker et al., 2015). The interaction zTA:zSWIN reduced NEE in the NGS and LGS and increased GPP in the NGS (Fig. 6a), suggesting that under concurrently light-saturated and warm conditions net CO2 uptake was indeed enhanced. The effect in the NGS may be related to warm and sunny conditions at the seasonal transition to the GS, promoting CO2 uptake as seen in early 2024 (Fig. 5). While WT is widely accepted as the primary driver of CO2 emissions on the annual timescale and across sites (Evans et al., 2021; Ma et al., 2022; Tiemeyer et al., 2020), short-term anomalies in WT had little influence on in daily NEE (Fig. 6). On the daily scale both anomalies of GPP and Reco increased with lower WT, potentially cancelling each other out in their effect on zNEE (Fig. 6b and c). The relationship of WT and GPP suggests that GPP was not limited by the prevailing WT conditions. Previous studies found that at a WT above −50 cm shrubs are not limited by water availability (Farrick and Price, 2009; Lafleur et al., 2005a). This reported threshold of 50 cm fits to the observed reduction of Pmax (Fig. 7a) and lower GPP (Fig. 5b) in July and August 2025 compared to the other years after a prolonged period of low rainfall with resulting mean monthly WT lower than −50 cm. Notably both Reco and Q10 of respiration were suppressed during this period of low WT (Figs. 5c and 7c), pointing towards a strong coupling between vegetation activity and Reco, which could be provided through autotrophic respiration and the release of root exudates (Cai et al., 2024; de Vries and Caruso, 2016; Voigt et al., 2017). A concurrent direct moisture limitation of Reco may also cause the reduced Q10 (Estop-Aragonés and Blodau, 2012). Additionally, decades of drainage-induced peat decomposition – evidenced by ratios of 30–40 and enrichment of refractory moieties (Lemmens et al., 2026) – may have reduced oxygen diffusivity in the upper peat layers (Hamamoto et al., 2016), further constraining the effect of WT drawdown on decomposition at depth. In the year 2024 the WT remained closer to the surface throughout June and July (Fig. 2d) but Reco was not suppressed compared to the other 2 years, indicating that the WT of ca. −30 cm was not sufficiently high to reduce soil respiration or its effect was masked e.g. by increased autotrophic respiration.
VPD and its interaction with SWIN emerged as important drivers of CO2 fluxes. In contrast to the positive effect of zTA, the interaction term zVPD:zSWIN had a marked decreasing effect on GPP (Fig. 6c), which may indicate stomatal closure under high atmospheric dryness (Grossiord et al., 2020). As GPP is derived from partitioning, a true mechanistic interpretation of this response is difficult, as effects of other drivers than TA on Reco can feed back into the derived GPP. However, an emission-promoting effect of zVPD:zSWIN also occurred on anomalies in net CO2 fluxes (Fig. 6a). Although TA and VPD are coupled, they may affect CO2 fluxes independently. Under high TA, when moisture is not limiting, plants can cool their leaves by transpiring water, keeping their stomata open and continuing CO2 uptake (Michaletz et al., 2016). High VPD on the other hand can suppress GPP even irrespective of soil moisture (Fu et al., 2022; Schönbeck et al., 2022). The contrasting effects of zTA:zSWIN (increasing uptake) and zVPD:zSWIN (decreasing uptake) (Fig. 6a and c) suggest a diverging response of the vegetation to high TA and VPD, especially in interaction with light-saturation.
4.2.2 The effect of high VPD and TA conditions on sub-daily CO2 fluxes
Both GPP and Reco increased with rising TA under extreme warm conditions (Fig. 8d and f), which is clearly expected for Reco due to the underlying temperature model mentioned above. Temperature manipulation studies have shown that shrubs can benefit from warming and increase GPP (Munir et al., 2015; Ward et al., 2013), especially when the top peat layers become drier at the same time (Laine et al., 2019). A global synthesis of flux measurements and satellite-based indices found that on the ecosystem scale the optimum TA for GPP lies between 25 and 30 °C for temperate shrublands (Huang et al., 2019). Here we found no indication of a reduction of GPP up to conditions of 32 °C (Fig. 8f) . Whether rising TA under warmest conditions resulted in further increases or decreases in net CO2 uptake depended on the different rates of increase in GPP or Reco rather than a limitation of either one (Fig. 8b). Our results provide no evidence that elevated TA up to 32 °C alone limited GPP, e.g. through a stomatal closure in response to heat stress.
High VPD, in contrast to high TA, suppressed all carbon fluxes in the early growing season (Fig. 8a, c, and e). Studies on the site-scale found that shrub-dominated canopies tend to leave stomata open during high VPD, exhibiting a “water-spending” behaviour (Gobin et al., 2015; Speranskaya et al., 2024). However, a meta study on global flux data found that shrublands are expected to react with decreased evapotranspiration and stomatal closure to increased VPD (Massmann et al., 2019). The reduction of GPP under rising VPD observed here points towards constrained gas exchange due to stomatal closure (Grossiord et al., 2020; Novick et al., 2024). The presence of individuals of Betula trees and up to 25 % coverage of Molinia caerulea, which are known to react with stomatal closure to high VPD (Gobin et al., 2015; Osonubi and Davies, 1980; Otieno et al., 2012) likely contributed to the marked reaction of GPP to high VPD. Notably, in the EGS not only GPP but also Reco was suppressed under elevated VPD (Fig. 8c). This is surprising as through the coupling of TA and VPD, elevated VPD would be expected to increase Reco due to the underlying temperature driven partitioning. A VPD-driven reduction in Reco is, to our knowledge, undocumented in the literature. Given that autotrophic respiration may constitute a substantial fraction (> 50 %) of Reco in shrub-dominated ecosystems (Rankin et al., 2023), growth suppression may explain the observed decreasing Reco. The effect of high VPD could be confounded if soil water stress occurs at the same time (Wang et al., 2022). However, in the data used for the inference of the VPD effect the correlation of SWC and carbon fluxes was negative (Fig. S6), meaning that fluxes increased with lower SWC (see Appendix for details). This makes a constraint through soil water depletion unlikely.
4.3 Timing of climate anomalies determines their impact on annual CO2 budgets
Studies have produced varying results on whether climate warming increases or decreases net CO2 uptake in northern peatlands, suggesting both increasing emissions of CO2 and CH4 into the atmosphere with warming (Hanson et al., 2020; Helbig et al., 2022; Qiu et al., 2022) or enhanced net CO2 uptake, especially in boreal Sphagnum-dominated peatlands (Zhao et al., 2026). In this study annual budgets of both GPP and Reco were highest in the warmest year 2024 (Table 2, Fig. 2a). A warm spring in 2024 (∼ 2 °C above other years from March to May) triggered an earlier growing season onset (DOY 84 in 2024 and 107 in 2023, Fig. 4a and b) and a rapid GPP increase (Fig. 5b) despite lower radiation in 2024 (Fig. 3c), driving the site to become a weak CO2 sink. The higher GPP was accompanied by an increased Pmax of up to 85 % between April and June relative to the other years (Fig. 7a). Enhanced CO2 uptake following pre-growing season warming was previously found in both fens and bogs (Adkinson et al., 2011; Heiskanen et al., 2021; Helfter et al., 2015; Peichl et al., 2014). In contrast to a boreal fen where Pmax increased with a lag in mid-summer following a warm spring (Peichl et al., 2014), Pmax at Amtsvenn was immediately elevated at the onset of the growing season in April and May (Fig. 7a). This may reflect the capacity of the evergreen shrub canopy to respond quickly to warm conditions without the constraints of leaf development. This dynamic shift in the response of CO2 fluxes to climate likely contributed to the low performance of the MLR models for this period.
In contrast to the effect of the warm spring, during the warm autumn in September and October 2023 (Fig. 3a) the net CO2 budget was not significantly different from the other years (Fig. 5a) because both Reco and GPP were similarly enhanced (Fig. 5b and c). The partitioned influence of TA further confirmed the different responses of CO2 fluxes to high TA in the EGS and LGS. In spring warmer conditions enhanced net CO2 uptake by stimulating GPP more than Reco, while autumn warming reduced net CO2 uptake by increasing Reco more than GPP (Fig. 8b, d, and f). The CO2 flux response to high TA thus depended critically on seasonal timing, consistent with findings on the large scale across northern ecosystems (Barichivich et al., 2013; Helbig et al., 2022).
The impact of high VPD conditions also changed seasonally. Under rising VPD net CO2 uptake was similarly suppressed throughout the NGS and LGS (Fig. 8a), but the individual responses of GPP and Reco differed drastically between the seasons. GPP was suppressed almost three times stronger (slope of −0.98 compared to −0.33) in the EGS than in the LGS (Fig. 8e). Reco on the other hand decreased with rising VPD in the EGS (slope of −0.52, Fig. 8c), which is also resembled in the impact of daily VPD on daily Reco (Fig. 6c). VPD and was not significantly correlated to VPD in the LGS (Fig. 8c). The decrease in Reco with rising VPD in the EGS thus reduced the impact of decreasing GPP on the overall net CO2 balance and led to the similar response as in the LGS. To the best of our knowledge, there is no study showing such a divergent response of CO2 fluxes to high VPD conditions between early and late growing season periods controlled for concurrent changes in SWIN or TA. While seasonally varying TA impacts have received some attention (Bubier et al., 1998; Heiskanen et al., 2021; Helbig et al., 2022; Helfter et al., 2015) the seasonal trajectory of VPD impacts has not been systematically evaluated. A detailed analysis of the leaf- or plant-level mechanisms behind this divergence is beyond the scope of this study. It may however represent a process counteracting increased spring CO2 uptake under future warming – particularly as extreme VPD and TA events are projected to intensify (Intergovernmental Panel on Climate Change (IPCC), 2023; Shekhar et al., 2024) and rising VPD is expected to place greater pressure on plant water regulation (Li et al., 2025; Novick et al., 2016).
CO2 emissions from drained, vegetated peatlands can vary extremely across years, ranging from substantial net CO2 sources to weak sinks under specific climatic conditions. Analysing CO2 fluxes and their climatic drivers over 3 years revealed that seasonal timing of climate anomalies, rather than their magnitude alone, impacted the annual carbon balance. A prolonged warm spring in 2024 accelerated growing season onset and drove a rapid CO2 uptake, overcompensating the co-occurring increase in Reco. This sensitivity to spring warming, combined with the absence of detectable CH4 emissions under persistently deep water tables, highlights how site-specific vegetation and hydrological conditions can modulate the response of annual carbon balances to warming in ways not captured by broad emission factor categories. Seasonal timing also governs the influence of other drivers: the negative effect of VPD on GPP in the early in the growing season was three times stronger than in the late growing season. That TA and VPD acted in opposition – warming advancing and amplifying carbon uptake while elevated VPD suppressed it – reveals how season-specific climate can produce different ecosystem responses. These findings warrant further research into how the seasonal timing of TA and VPD extremes shape carbon flux dynamics and how their seasonal occurrence will evolve under ongoing climate change.
While this study spans 3 years, the period captured substantial inter-annual variability, providing valuable insight into peatland responses to the climate. Continued observations over longer timescales would further strengthen the assessment of whether the observed patterns – particularly the spring warming response and the seasonal divergence in VPD effects – represent persistent characteristics of this ecosystem. We encourage combining complementary observations, such as biomass sampling, leaf-level conductance measurements, and root dynamics, with gas flux measurements in peatland ecosystems, to provide additional insight into the ecophysiological mechanisms underlying the observed gas fluxes. Such integrated approaches, applied across longer records and a broader range of peatland types and vegetation communities, would further enhance our understanding of the drivers of seasonal carbon dynamics.
Code will be made available upon request.
Amtsvenn is an ICOS associated site with the site code DE-Amv. The flux data and ancillary meteorological data are therefore accessible via the ICOS Data Portal at https://meta.icos-cp.eu/resources/stations/ES_DE-Amv, last access: 1 July 2026.
The supplement related to this article is available online at https://doi.org/10.5194/bg-23-5071-2026-supplement.
NB collected, processed, post-processed and curated all used data, conceptualized and conducted the analysis and wrote the original draft of the paper. MG acquired the funding, conceptualized and supervised the project and advised in developing the methodology and during the analysis. KHK provided resources in the form of meteorological, hydrological and peat chemical data. All authors reviewed and edited the manuscript.
The contact author has declared that none of the authors has any competing interests.
Publisher's note: Copernicus Publications remains neutral with regard to jurisdictional claims made in the text, published maps, institutional affiliations, or any other geographical representation in this paper. The authors bear the ultimate responsibility for providing appropriate place names. Views expressed in the text are those of the authors and do not necessarily reflect the views of the publisher.
We thank Simon Hofert and Andreas Malkus for their technical support in the field, Carsten Schaller for scientific and technical insights and Denise Rupprecht for providing vegetation survey data. We extend our gratitude to the “Moorbodenmonitoring” project conducted by the Thünen Institute for Climate Smart Agriculture for providing us with their ground water table depth data, extending our own time series. AI tools (ChatGPT-4o, Sonnet 4.6) were used to generate basic templates of visualizations which were completed and customized manually. All outputs were critically reviewed by the authors to ensure accuracy and integrity.
NB was funded by the University of Münster Startup fund of the Junior Professorship for MG and EU-LIFE project CrossBorderBog. KHK acknowledges funding from 2020–2021 Biodiversa+ and Water JPI joint call for research projects, under the BiodivRestore ERA-NET Cofund (grant no. 101003777), with the EU and the funding organisations DFG (Germany), FWF (Austria), NCN (Poland; proposal no. 2021/03/Y/ST10/00093) and the Ministry of LNV (the Netherlands).
This paper was edited by Ivonne Trebs and reviewed by three anonymous referees.
Abadi, M., Barham, P., Chen, J., Chen, Z., Davis, A., Dean, J., Devin, M., Ghemawat, S., Irving, G., Isard, M., Kudlur, M., Levenberg, J., Monga, R., Moore, S., Murray, D. G., Steiner, B., Tucker, P., Vasudevan, V., Warden, P., Wicke, M., Yu, Y., and Zheng, X.: TensorFlow: A System for Large-Scale Machine Learning, in: 12th USENIX Symposium on Operating Systems Design and Implementation (OSDI 16), 265–283, 2016.
Adkinson, A. C., Syed, K. H., and Flanagan, L. B.: Contrasting responses of growing season ecosystem CO2 exchange to variation in temperature and water table depth in two peatlands in northern Alberta, Canada, J. Geophys. Res.-Biogeo., 116, https://doi.org/10.1029/2010JG001512, 2011.
Alekseychik, P., Korrensalo, A., Mammarella, I., Launiainen, S., Tuittila, E.-S., Korpela, I., and Vesala, T.: Carbon balance of a Finnish bog: temporal variability and limiting factors based on 6 years of eddy-covariance data, Biogeosciences, 18, 4681–4704, https://doi.org/10.5194/bg-18-4681-2021, 2021.
Aslan-Sungur, G., Lee, X., Evrendilek, F., and Karakaya, N.: Large interannual variability in net ecosystem carbon dioxide exchange of a disturbed temperate peatland, Sci. Total Environ., 554–555, 192–202, https://doi.org/10.1016/j.scitotenv.2016.02.153, 2016.
Aurela, M., Riutta, T., Laurila, T., Tuovinen, J.-P., Vesala, T., Tuittila, E.-S., Rinne, J., Haapanala, S., and Laine, J.: CO2 exchange of a sedge fen in southern Finland – the impact of a drought period, Tellus B, 59, 826, https://doi.org/10.1111/j.1600-0889.2007.00309.x, 2007.
Bao, X., Li, Z., and Xie, F.: Environmental influences on light response parameters of net carbon exchange in two rotation croplands on the North China Plain, Sci. Rep., 9, 18702, https://doi.org/10.1038/s41598-019-55340-2, 2019.
Barichivich, J., Briffa, K. R., Myneni, R. B., Osborn, T. J., Melvin, T. M., Ciais, P., Piao, S., and Tucker, C.: Large-scale variations in the vegetation growing season and annual cycle of atmospheric CO2 at high northern latitudes from 1950 to 2011, Glob. Change Biol., 19, 3167–3183, https://doi.org/10.1111/gcb.12283, 2013.
Blodau, C.: Thermodynamic Control on Terminal Electron Transfer and Methanogenesis, in: ACS Symposium Series, vol. 1071, edited by: Tratnyek, P. G., Grundl, T. J., and Haderlein, S. B., American Chemical Society, Washington, DC, 65–83, https://doi.org/10.1021/bk-2011-1071.ch004, 2011.
Bubier, J. L., Crill, P. M., Moore, T. R., Savage, K., and Varner, R. K.: Seasonal patterns and controls on net ecosystem CO2 exchange in a boreal peatland complex, Global Biogeochem. Cy., 12, 703–714, https://doi.org/10.1029/98GB02426, 1998.
Buzacott, A. J. V., Kruijt, B., Bataille, L., van Giersbergen, Q., Heuts, T. S., Fritz, C., Nouta, R., Erkens, G., Boonman, J., van den Berg, M., van Huissteden, J., and van der Velde, Y.: Drivers and Annual Totals of Methane Emissions From Dutch Peatlands, Glob. Change Biol., 30, e17590, https://doi.org/10.1111/gcb.17590, 2024.
Cai, Y., Yu, X., Zou, Y., Ding, S., and Min, Y.: Shrubification of herbaceous peatlands modulates root exudates, increasing rhizosphere soil CO2 emissions while decreasing CH4 emissions, CATENA, 245, 108282, https://doi.org/10.1016/j.catena.2024.108282, 2024.
Calabrese, S., Garcia, A., Wilmoth, J. L., Zhang, X., and Porporato, A.: Critical inundation level for methane emissions from wetlands, Environ. Res. Lett., 16, 044038, https://doi.org/10.1088/1748-9326/abedea, 2021.
Chen, N., Zhang, Y., Yuan, F., Song, C., Xu, M., Wang, Q., Hao, G., Bao, T., Zuo, Y., Liu, J., Zhang, T., Song, Y., Sun, L., Guo, Y., Zhang, H., Ma, G., Du, Y., Xu, X., and Wang, X.: Warming-induced vapor pressure deficit suppression of vegetation growth diminished in northern peatlands, Nat. Commun., 14, 7885, https://doi.org/10.1038/s41467-023-42932-w, 2023.
Chen, T. and Guestrin, C.: XGBoost: A Scalable Tree Boosting System, in: Proceedings of the 22nd ACM SIGKDD International Conference on Knowledge Discovery and Data Mining, 785–794, https://doi.org/10.1145/2939672.2939785, 2016.
Chivers, M. R., Turetsky, M. R., Waddington, J. M., Harden, J. W., and McGuire, A. D.: Effects of Experimental Water Table and Temperature Manipulations on Ecosystem CO2 Fluxes in an Alaskan Rich Fen, Ecosystems, 12, 1329–1342, https://doi.org/10.1007/s10021-009-9292-y, 2009.
Denager, T., Christiansen, J. R., Schneider, R. J. M., Langen, P., Quistgaard, T., and Stisen, S.: Combined water table and temperature dynamics control CO2 emission estimates from drained peatlands under rewetting and climate change scenarios, Biogeosciences, 23, 441–462, https://doi.org/10.5194/bg-23-441-2026, 2026.
de Vries, F. T. and Caruso, T.: Eating from the same plate? Revisiting the role of labile carbon inputs in the soil food web, Soil Biol. Biochem., 102, 4–9, https://doi.org/10.1016/j.soilbio.2016.06.023, 2016.
Didan, K.: MODIS/Terra Vegetation Indices 16-Day L3 Global 250m SIN Grid V061, NASA EOSDIS Land Processes DAAC [data set], https://doi.org/10.5067/MODIS/MOD13Q1.061, 2021.
Drollinger, S., Maier, A., and Glatzel, S.: Interannual and seasonal variability in carbon dioxide and methane fluxes of a pine peat bog in the Eastern Alps, Austria, Agr. Forest Meteorol., 275, 69–78, https://doi.org/10.1016/j.agrformet.2019.05.015, 2019.
Estop-Aragonés, C. and Blodau, C.: Effects of experimental drying intensity and duration on respiration and methane production recovery in fen peat incubations, Soil Biol. Biochem., 47, 1–9, https://doi.org/10.1016/j.soilbio.2011.12.008, 2012.
Evans, C. D., Peacock, M., Baird, A. J., Artz, R. R. E., Burden, A., Callaghan, N., Chapman, P. J., Cooper, H. M., Coyle, M., Craig, E., Cumming, A., Dixon, S., Gauci, V., Grayson, R. P., Helfter, C., Heppell, C. M., Holden, J., Jones, D. L., Kaduk, J., Levy, P., Matthews, R., McNamara, N. P., Misselbrook, T., Oakley, S., Page, S. E., Rayment, M., Ridley, L. M., Stanley, K. M., Williamson, J. L., Worrall, F., and Morrison, R.: Overriding water table control on managed peatland greenhouse gas emissions, Nature, 593, 548–552, https://doi.org/10.1038/s41586-021-03523-1, 2021.
Falge, E., Baldocchi, D., Olson, R., Anthoni, P., Aubinet, M., Bernhofer, C., Burba, G., Ceulemans, R., Clement, R., Dolman, H., Granier, A., Gross, P., Grünwald, T., Hollinger, D., Jensen, N.-O., Katul, G., Keronen, P., Kowalski, A., Lai, C. T., Law, B. E., Meyers, T., Moncrieff, J., Moors, E., Munger, J. W., Pilegaard, K., Rannik, Ü., Rebmann, C., Suyker, A., Tenhunen, J., Tu, K., Verma, S., Vesala, T., Wilson, K., and Wofsy, S.: Gap filling strategies for defensible annual sums of net ecosystem exchange, Agr. Forest Meteorol., 107, 43–69, https://doi.org/10.1016/S0168-1923(00)00225-2, 2001.
Farrick, K. K. and Price, J. S.: Ericaceous shrubs on abandoned block-cut peatlands: implications for soil water availability and Sphagnum restoration, Ecohydrology, 2, 530–540, https://doi.org/10.1002/eco.77, 2009.
Finkelstein, P. L. and Sims, P. F.: Sampling error in eddy correlation flux measurements, J. Geophys. Res.-Atmos., 106, 3503–3509, https://doi.org/10.1029/2000JD900731, 2001.
Foken, T.: The Energy Balance Closure Problem: An Overview, Ecol. Appl., 18, 1351–1367, https://doi.org/10.1890/06-0922.1, 2008.
Frank, S., Dettmann, U., Piayda, A., Seidel, R., Amiri, E., Bamberger, S., Heidkamp, A., Heller, S., Holzträger, S., Kuwert, M., Lakeberg, S., Laqua, S., Minke, M., Nagel, S., Oehmke, W., Schemschat, B., Simon, C., Wittnebel, M., Wywias, H., and Tiemeyer, B.: Bericht zum Aufbau eines deutschlandweiten Moorbodenmonitorings für den Klimaschutz, Johann Heinrich von Thünen Institut, DE, 186 pp., https://doi.org/10.3220/253-2025-181, 2025.
Fratini, G., Ibrom, A., Arriga, N., Burba, G., and Papale, D.: Relative humidity effects on water vapour fluxes measured with closed-path eddy-covariance systems with short sampling lines, Agr. Forest Meteorol., 165, 53–63, https://doi.org/10.1016/j.agrformet.2012.05.018, 2012.
Frolking, S., Talbot, J., Jones, M. C., Treat, C. C., Kauffman, J. B., Tuittila, E.-S., and Roulet, N.: Peatlands in the Earth's 21st century climate system, Environ. Rev., 19, 371–396, https://doi.org/10.1139/a11-014, 2011.
Fu, Z., Ciais, P., Prentice, I. C., Gentine, P., Makowski, D., Bastos, A., Luo, X., Green, J. K., Stoy, P. C., Yang, H., and Hajima, T.: Atmospheric dryness reduces photosynthesis along a large range of soil water deficits, Nat. Commun., 13, 989, https://doi.org/10.1038/s41467-022-28652-7, 2022.
Gao, C., Sander, M., Agethen, S., and Knorr, K.-H.: Electron accepting capacity of dissolved and particulate organic matter control CO2 and CH4 formation in peat soils, Geochim. Cosmochim. Ac., 245, 266–277, https://doi.org/10.1016/j.gca.2018.11.004, 2019.
Gharun, M. and Behrens, N.: ETC L2 Fluxes from Amtsvenn, 2022-12-31–2025-12-31, ICOS RI, https://hdl.handle.net/11676/-8i5yGn2p2sPhZXn7qR_Ia_K (last access: 1 July 2026), 2026.
Gobin, R., Korboulewsky, N., Dumas, Y., and Balandier, P.: Transpiration of four common understorey plant species according to drought intensity in temperate forests, Ann. For. Sci., 72, https://doi.org/10.1007/s13595-015-0510-9, 2015.
Gonsamo, A., Chen, J. M., and D’Odorico, P.: Deriving land surface phenology indicators from CO2 eddy covariance measurements, Ecol. Indic., 29, 203–207, https://doi.org/10.1016/j.ecolind.2012.12.026, 2013.
Goodrich, J. P., Campbell, D. I., Clearwater, M. J., Rutledge, S., and Schipper, L. A.: High vapor pressure deficit constrains GPP and the light response of NEE at a Southern Hemisphere bog, Agr. Forest Meteorol., 203, 54–63, https://doi.org/10.1016/j.agrformet.2015.01.001, 2015.
Grossiord, C., Buckley, T. N., Cernusak, L. A., Novick, K. A., Poulter, B., Siegwolf, R. T. W., Sperry, J. S., and McDowell, N. G.: Plant responses to rising vapor pressure deficit, New Phytol., 226, 1550–1566, https://doi.org/10.1111/nph.16485, 2020.
Guo, H., Cui, S., Nielsen, C. K., Tang, L., Pugliese, L., and Wu, S.: Harnessing the Low-Hanging Fruits: Rewetting Unmanaged Marginal Organic Soils to Achieve Maximal Greenhouse Gas Reduction, Environ. Sci. Technol., 59, 6521–6533, https://doi.org/10.1021/acs.est.4c12572, 2025.
Guth, P., Gao, C., and Knorr, K.-H.: Electron Accepting Capacities of a Wide Variety of Peat Materials From Around the Globe Similarly Explain CO2 and CH4 Formation, Global Biogeochem. Cy., 37, e2022GB007459, https://doi.org/10.1029/2022GB007459, 2023.
Gyimah, A., Wu, J., Scott, R., and Gong, Y.: Agricultural drainage increases the photosynthetic capacity of boreal peatlands, Agr. Ecosyst. Environ., 300, 106984, https://doi.org/10.1016/j.agee.2020.106984, 2020.
Hamamoto, S., Dissanayaka, S. H., Kawamoto, K., Nagata, O., Komtatsu, T., and Moldrup, P.: Transport properties and pore-network structure in variably-saturated Sphagnum peat soil, Eur. J. Soil Sci., 67, 121–131, https://doi.org/10.1111/ejss.12312, 2016.
Hanson, P. J., Griffiths, N. A., Iversen, C. M., Norby, R. J., Sebestyen, S. D., Phillips, J. R., Chanton, J. P., Kolka, R. K., Malhotra, A., Oleheiser, K. C., Warren, J. M., Shi, X., Yang, X., Mao, J., and Ricciuto, D. M.: Rapid Net Carbon Loss From a Whole-Ecosystem Warmed Peatland, AGU Adv., 1, e2020AV000163, https://doi.org/10.1029/2020AV000163, 2020.
He, H. and Roulet, N. T.: Improved estimates of carbon dioxide emissions from drained peatlands support a reduction in emission factor, Commun. Earth Environ., 4, 436, https://doi.org/10.1038/s43247-023-01091-y, 2023.
He, K., Zhang, X., Ren, S., and Sun, J.: Delving Deep into Rectifiers: Surpassing Human-Level Performance on ImageNet Classification, in: 2015 IEEE International Conference on Computer Vision (ICCV), 1026–1034, https://doi.org/10.1109/ICCV.2015.123, 2015.
Heiskanen, L., Tuovinen, J.-P., Räsänen, A., Virtanen, T., Juutinen, S., Lohila, A., Penttilä, T., Linkosalmi, M., Mikola, J., Laurila, T., and Aurela, M.: Carbon dioxide and methane exchange of a patterned subarctic fen during two contrasting growing seasons, Biogeosciences, 18, 873–896, https://doi.org/10.5194/bg-18-873-2021, 2021.
Helbig, M., Živković, T., Alekseychik, P., Aurela, M., El-Madany, T. S., Euskirchen, E. S., Flanagan, L. B., Griffis, T. J., Hanson, P. J., Hattakka, J., Helfter, C., Hirano, T., Humphreys, E. R., Kiely, G., Kolka, R. K., Laurila, T., Leahy, P. G., Lohila, A., Mammarella, I., Nilsson, M. B., Panov, A., Parmentier, F. J. W., Peichl, M., Rinne, J., Roman, D. T., Sonnentag, O., Tuittila, E.-S., Ueyama, M., Vesala, T., Vestin, P., Weldon, S., Weslien, P., and Zaehle, S.: Warming response of peatland CO2 sink is sensitive to seasonality in warming trends, Nat. Clim. Change, 12, 743–749, https://doi.org/10.1038/s41558-022-01428-z, 2022.
Helfter, C., Campbell, C., Dinsmore, K. J., Drewer, J., Coyle, M., Anderson, M., Skiba, U., Nemitz, E., Billett, M. F., and Sutton, M. A.: Drivers of long-term variability in CO2 net ecosystem exchange in a temperate peatland, Biogeosciences, 12, 1799–1811, https://doi.org/10.5194/bg-12-1799-2015, 2015.
Hollinger, D. Y. and Richardson, A. D.: Uncertainty in eddy covariance measurements and its application to physiological models, Tree Physiol., 25, 873–885, https://doi.org/10.1093/treephys/25.7.873, 2005.
Huang, M., Piao, S., Ciais, P., Peñuelas, J., Wang, X., Keenan, T. F., Peng, S., Berry, J. A., Wang, K., Mao, J., Alkama, R., Cescatti, A., Cuntz, M., De Deurwaerder, H., Gao, M., He, Y., Liu, Y., Luo, Y., Myneni, R. B., Niu, S., Shi, X., Yuan, W., Verbeeck, H., Wang, T., Wu, J., and Janssens, I. A.: Air temperature optima of vegetation productivity across global biomes, Nat. Ecol. Evol., 3, 772–779, https://doi.org/10.1038/s41559-019-0838-x, 2019.
Humpenöder, F., Karstens, K., Lotze-Campen, H., Leifeld, J., Menichetti, L., Barthelmes, A., and Popp, A.: Peatland protection and restoration are key for climate change mitigation, Environ. Res. Lett., 15, 104093, https://doi.org/10.1088/1748-9326/abae2a, 2020.
Humphreys, E. R., Lafleur, P. M., Flanagan, L. B., Hedstrom, N., Syed, K. H., Glenn, A. J., and Granger, R.: Summer carbon dioxide and water vapor fluxes across a range of northern peatlands, J. Geophys. Res.-Biogeo., 111, https://doi.org/10.1029/2005JG000111, 2006.
Humphreys, E. R., Charron, C., Brown, M., and Jones, R.: Two Bogs in the Canadian Hudson Bay Lowlands and a Temperate Bog Reveal Similar Annual Net Ecosystem Exchange of CO2, Arct. Antarct. Alp. Res., 46, 103–113, https://doi.org/10.1657/1938-4246.46.1.103, 2014.
Hurkuck, M., Brümmer, C., and Kutsch, W. L.: Near-neutral carbon dioxide balance at a seminatural, temperate bog ecosystem, J. Geophys. Res.-Biogeo., 121, 370–384, https://doi.org/10.1002/2015JG003195, 2016.
Intergovernmental Panel on Climate Change (IPCC): Climate Change 2022 – Impacts, Adaptation and Vulnerability: Working Group II Contribution to the Sixth Assessment Report of the Intergovernmental Panel on Climate Change, Cambridge University Press, Cambridge, https://doi.org/10.1017/9781009325844, 2023.
IPCC: 2013 Supplement to the 2006 IPCC Guidelines for National Greenhouse Gas Inventories: Wetlands, edited by: Hiraishi, T., Krug, T., Tanabe, K., Srivastava, N., Baasansuren, J., Fukuda, M., and Troxler, T. G., IPCC, Switzerland, 2014.
Järveoja, J., Nilsson, M. B., Gažovič, M., Crill, P. M., and Peichl, M.: Partitioning of the net CO2 exchange using an automated chamber system reveals plant phenology as key control of production and respiration fluxes in a boreal peatland, Glob. Change Biol., 24, 3436–3451, https://doi.org/10.1111/gcb.14292, 2018.
Juszczak, R., Humphreys, E., Acosta, M., Michalak-Galczewska, M., Kayzer, D., and Olejnik, J.: Ecosystem respiration in a heterogeneous temperate peatland and its sensitivity to peat temperature and water table depth, Plant Soil, 366, 505–520, https://doi.org/10.1007/s11104-012-1441-y, 2013.
Kalhori, A., Wille, C., Gottschalk, P., Li, Z., Hashemi, J., Kemper, K., and Sachs, T.: Temporally dynamic carbon dioxide and methane emission factors for rewetted peatlands, Commun. Earth Environ., 5, 1–11, https://doi.org/10.1038/s43247-024-01226-9, 2024.
Keenan, T. F., Migliavacca, M., Papale, D., Baldocchi, D., Reichstein, M., Torn, M., and Wutzler, T.: Widespread inhibition of daytime ecosystem respiration, Nat. Ecol. Evol., 3, 407–415, https://doi.org/10.1038/s41559-019-0809-2, 2019.
Kingma, D. P. and Ba, J.: Adam: A Method for Stochastic Optimization, https://doi.org/10.48550/arXiv.1412.6980, 2017.
Kljun, N., Calanca, P., Rotach, M. W., and Schmid, H. P.: A simple two-dimensional parameterisation for Flux Footprint Prediction (FFP), Geosci. Model Dev., 8, 3695–3713, https://doi.org/10.5194/gmd-8-3695-2015, 2015.
Knorr, K.-H., Lischeid, G., and Blodau, C.: Dynamics of redox processes in a minerotrophic fen exposed to a water table manipulation, Geoderma, 153, 379–392, https://doi.org/10.1016/j.geoderma.2009.08.023, 2009.
Koch, J., Elsgaard, L., Greve, M. H., Gyldenkærne, S., Hermansen, C., Levin, G., Wu, S., and Stisen, S.: Water-table-driven greenhouse gas emission estimates guide peatland restoration at national scale, Biogeosciences, 20, 2387–2403, https://doi.org/10.5194/bg-20-2387-2023, 2023.
Korrensalo, A., Mehtätalo, L., Alekseychik, P., Uljas, S., Mammarella, I., Vesala, T., and Tuittila, E.-S.: Varying Vegetation Composition, Respiration and Photosynthesis Decrease Temporal Variability of the CO2 Sink in a Boreal Bog, Ecosystems, 23, 842–858, https://doi.org/10.1007/s10021-019-00434-1, 2020.
Kross, A., Seaquist, J. W., and Roulet, N. T.: Light use efficiency of peatlands: Variability and suitability for modeling ecosystem production, Remote Sens. Environ., 183, 239–249, https://doi.org/10.1016/j.rse.2016.05.004, 2016.
Lafleur, P. M., Hember, R. A., Admiral, S. W., and Roulet, N. T.: Annual and seasonal variability in evapotranspiration and water table at a shrub-covered bog in southern Ontario, Canada, Hydrol. Process., 19, 3533–3550, https://doi.org/10.1002/hyp.5842, 2005a.
Lafleur, P. M., Moore, T. R., Roulet, N. T., and Frolking, S.: Ecosystem Respiration in a Cool Temperate Bog Depends on Peat Temperature But Not Water Table, Ecosystems, 8, 619–629, https://doi.org/10.1007/s10021-003-0131-2, 2005b.
Laine, A. M., Mäkiranta, P., Laiho, R., Mehtätalo, L., Penttilä, T., Korrensalo, A., Minkkinen, K., Fritze, H., and Tuittila, E.-S.: Warming impacts on boreal fen CO2 exchange under wet and dry conditions, Glob. Change Biol., 25, 1995–2008, https://doi.org/10.1111/gcb.14617, 2019.
Lakshminarayanan, B., Pritzel, A., and Blundell, C.: Simple and scalable predictive uncertainty estimation using deep ensembles, in: Proceedings of the 31st International Conference on Neural Information Processing Systems, Long Beach, California, USA, 6405–6416, 2017.
Leifeld, J. and Menichetti, L.: The underappreciated potential of peatlands in global climate change mitigation strategies, Nat. Commun., 9, 1071, https://doi.org/10.1038/s41467-018-03406-6, 2018.
Lemmens, M., Teickner, H., Lamentowicz, M., Thomas, C. L., Glatzel, S., Gałka, M., Draga, M., and Knorr, K.-H.: Multi-proxy high-resolution geochemical analysis reveals ecological baselines and evaluates potential restoration trajectories in European ombrotrophic peatlands, Ecol. Indic., 183, 114648, https://doi.org/10.1016/j.ecolind.2026.114648, 2026.
Leroy, F., Gogo, S., Guimbaud, C., Bernard-Jannin, L., Hu, Z., and Laggoun-Défarge, F.: Vegetation composition controls temperature sensitivity of CO2 and CH4 emissions and DOC concentration in peatlands, Soil Biol. Biochem., 107, 164–167, https://doi.org/10.1016/j.soilbio.2017.01.005, 2017.
Li, C., Zhang, D., Zhang, S., Wen, Y., Wang, W., Chen, Y., and Peng, J.: Atmospheric Vapor Pressure Deficit Outweighs Soil Moisture Deficit in Controlling Global Ecosystem Water Use Efficiency, J. Geophys. Res.-Biogeo., 130, e2024JG008605, https://doi.org/10.1029/2024JG008605, 2025.
Li, Q., Gogo, S., Leroy, F., Guimbaud, C., and Laggoun-Défarge, F.: Response of Peatland CO2 and CH4 Fluxes to Experimental Warming and the Carbon Balance, Front. Earth Sci., 9, https://doi.org/10.3389/feart.2021.631368, 2021.
Limpens, J., Berendse, F., Blodau, C., Canadell, J. G., Freeman, C., Holden, J., Roulet, N., Rydin, H., and Schaepman-Strub, G.: Peatlands and the carbon cycle: from local processes to global implications – a synthesis, Biogeosciences, 5, 1475–1491, https://doi.org/10.5194/bg-5-1475-2008, 2008.
Liu, H., Rezanezhad, F., Zhao, Y., He, H., Van Cappellen, P., and Lennartz, B.: The apparent temperature sensitivity (Q10) of peat soil respiration: A synthesis study, Geoderma, 443, 116844, https://doi.org/10.1016/j.geoderma.2024.116844, 2024.
Lloyd, J. and Taylor, J. A.: On the Temperature Dependence of Soil Respiration, Funct. Ecol., 8, 315–323, https://doi.org/10.2307/2389824, 1994.
Lund, M., Christensen, T. R., Mastepanov, M., Lindroth, A., and Ström, L.: Effects of N and P fertilization on the greenhouse gas exchange in two northern peatlands with contrasting N deposition rates, Biogeosciences, 6, 2135–2144, https://doi.org/10.5194/bg-6-2135-2009, 2009.
Lund, M., Lafleur, P. M., Roulet, N. T., Lindroth, A., Christensen, T. R., Aurela, M., Chojnicki, B. H., Flanagan, L. B., Humphreys, E. R., Laurila, T., Oechel, W. C., Olejnik, J., Rinne, J., Schubert, P., and Nilsson, M. B.: Variability in exchange of CO2 across 12 northern peatland and tundra sites, Glob. Change Biol., 16, 2436–2448, https://doi.org/10.1111/j.1365-2486.2009.02104.x, 2010.
Ma, L., Zhu, G., Chen, B., Zhang, K., Niu, S., Wang, J., Ciais, P., and Zuo, H.: A globally robust relationship between water table decline, subsidence rate, and carbon release from peatlands, Commun. Earth Environ., 3, 1–14, https://doi.org/10.1038/s43247-022-00590-8, 2022.
Ma, S., Worden, J. R., Bloom, A. A., Zhang, Y., Poulter, B., Cusworth, D. H., Yin, Y., Pandey, S., Maasakkers, J. D., Lu, X., Shen, L., Sheng, J., Frankenberg, C., Miller, C. E., and Jacob, D. J.: Satellite Constraints on the Latitudinal Distribution and Temperature Sensitivity of Wetland Methane Emissions, AGU Adv., 2, e2021AV000408, https://doi.org/10.1029/2021AV000408, 2021.
Mäkiranta, P., Laiho, R., Fritze, H., Hytönen, J., Laine, J., and Minkkinen, K.: Indirect regulation of heterotrophic peat soil respiration by water level via microbial community structure and temperature sensitivity, Soil Biol. Biochem., 41, 695–703, https://doi.org/10.1016/j.soilbio.2009.01.004, 2009.
Massmann, A., Gentine, P., and Lin, C.: When Does Vapor Pressure Deficit Drive or Reduce Evapotranspiration?, J. Adv. Model. Earth Sy., 11, 3305–3320, https://doi.org/10.1029/2019MS001790, 2019.
Mauder, M. and Foken, T.: Documentation and Instruction Manual of the Eddy-Covariance Software Package TK3, Arbeitsergebnisse Univ. Bayreuth Abt Mikrometeorologie ISSN 1614-8916, 2015.
Mauder, M., Jung, M., Stoy, P., Nelson, J., and Wanner, L.: Energy balance closure at FLUXNET sites revisited, Agr. Forest Meteorol., 358, 110235, https://doi.org/10.1016/j.agrformet.2024.110235, 2024.
McDermitt, D., Burba, G., Xu, L., Anderson, T., Komissarov, A., Riensche, B., Schedlbauer, J., Starr, G., Zona, D., Oechel, W., Oberbauer, S., and Hastings, S.: A new low-power, open-path instrument for measuring methane flux by eddy covariance, Appl. Phys. B, 102, 391–405, https://doi.org/10.1007/s00340-010-4307-0, 2011.
Michaletz, S. T., Weiser, M. D., McDowell, N. G., Zhou, J., Kaspari, M., Helliker, B. R., and Enquist, B. J.: The energetic and carbon economic origins of leaf thermoregulation, Nat. Plants, 2, 16129, https://doi.org/10.1038/nplants.2016.129, 2016.
Moncrieff, J., Clement, R., Finnigan, J., and Meyers, T.: Averaging, Detrending, and Filtering of Eddy Covariance Time Series, in: Handbook of Micrometeorology: A Guide for Surface Flux Measurement and Analysis, edited by: Lee, X., Massman, W., and Law, B., Springer Netherlands, Dordrecht, 7–31, https://doi.org/10.1007/1-4020-2265-4_2, 2004.
Munir, T. M., Perkins, M., Kaing, E., and Strack, M.: Carbon dioxide flux and net primary production of a boreal treed bog: Responses to warming and water-table-lowering simulations of climate change, Biogeosciences, 12, 1091–1111, https://doi.org/10.5194/bg-12-1091-2015, 2015.
Muñoz-Sabater, J., Dutra, E., Agustí-Panareda, A., Albergel, C., Arduini, G., Balsamo, G., Boussetta, S., Choulga, M., Harrigan, S., Hersbach, H., Martens, B., Miralles, D. G., Piles, M., Rodríguez-Fernández, N. J., Zsoter, E., Buontempo, C., and Thépaut, J.-N.: ERA5-Land: a state-of-the-art global reanalysis dataset for land applications, Earth Syst. Sci. Data, 13, 4349–4383, https://doi.org/10.5194/essd-13-4349-2021, 2021.
Nielsen, C. K., Elsgaard, L., Jørgensen, U., and Lærke, P. E.: Soil greenhouse gas emissions from drained and rewetted agricultural bare peat mesocosms are linked to geochemistry, Sci. Total Environ., 896, 165083, https://doi.org/10.1016/j.scitotenv.2023.165083, 2023.
Novick, K. A., Ficklin, D. L., Stoy, P. C., Williams, C. A., Bohrer, G., Oishi, A. C., Papuga, S. A., Blanken, P. D., Noormets, A., Sulman, B. N., Scott, R. L., Wang, L., and Phillips, R. P.: The increasing importance of atmospheric demand for ecosystem water and carbon fluxes, Nat. Clim. Change, 6, 1023–1027, https://doi.org/10.1038/nclimate3114, 2016.
Novick, K. A., Ficklin, D. L., Grossiord, C., Konings, A. G., Martínez-Vilalta, J., Sadok, W., Trugman, A. T., Williams, A. P., Wright, A. J., Abatzoglou, J. T., Dannenberg, M. P., Gentine, P., Guan, K., Johnston, M. R., Lowman, L. E. L., Moore, D. J. P., and McDowell, N. G.: The impacts of rising vapour pressure deficit in natural and managed ecosystems, Plant Cell Environ., 47, 3561–3589, https://doi.org/10.1111/pce.14846, 2024.
Nugent, K. A., Strachan, I. B., Strack, M., Roulet, N. T., and Rochefort, L.: Multi-year net ecosystem carbon balance of a restored peatland reveals a return to carbon sink, Glob. Change Biol., 24, 5751–5768, https://doi.org/10.1111/gcb.14449, 2018.
Oestmann, J., Dettmann, U., Düvel, D., and Tiemeyer, B.: Experimental warming increased greenhouse gas emissions of a near-natural peatland and Sphagnum farming sites, Plant Soil, 480, 85–104, https://doi.org/10.1007/s11104-022-05561-8, 2022.
Olson, D. M., Griffis, T. J., Noormets, A., Kolka, R., and Chen, J.: Interannual, seasonal, and retrospective analysis of the methane and carbon dioxide budgets of a temperate peatland, J. Geophys. Res.-Biogeo., 118, 226–238, https://doi.org/10.1002/jgrg.20031, 2013.
Osonubi, O. and Davies, W. J.: The influence of plant water stress on stomatal control of gas exchange at different levels of atmospheric humidity, Oecologia, 46, 1–6, https://doi.org/10.1007/BF00346957, 1980.
Otieno, D., Lindner, S., Muhr, J., and Borken, W.: Sensitivity of Peatland Herbaceous Vegetation to Vapor Pressure Deficit Influences Net Ecosystem CO2 Exchange, Wetlands, 32, 895–905, https://doi.org/10.1007/s13157-012-0322-8, 2012.
Pastorello, G., Trotta, C., Canfora, E., Chu, H., Christianson, D., Cheah, Y.-W., Poindexter, C., Chen, J., Elbashandy, A., Humphrey, M., Isaac, P., Polidori, D., Reichstein, M., Ribeca, A., van Ingen, C., Vuichard, N., Zhang, L., Amiro, B., Ammann, C., Arain, M. A., Ardö, J., Arkebauer, T., Arndt, S. K., Arriga, N., Aubinet, M., Aurela, M., Baldocchi, D., Barr, A., Beamesderfer, E., Marchesini, L. B., Bergeron, O., Beringer, J., Bernhofer, C., Berveiller, D., Billesbach, D., Black, T. A., Blanken, P. D., Bohrer, G., Boike, J., Bolstad, P. V., Bonal, D., Bonnefond, J.-M., Bowling, D. R., Bracho, R., Brodeur, J., Brümmer, C., Buchmann, N., Burban, B., Burns, S. P., Buysse, P., Cale, P., Cavagna, M., Cellier, P., Chen, S., Chini, I., Christensen, T. R., Cleverly, J., Collalti, A., Consalvo, C., Cook, B. D., Cook, D., Coursolle, C., Cremonese, E., Curtis, P. S., D'Andrea, E., da Rocha, H., Dai, X., Davis, K. J., Cinti, B. D., Grandcourt, A. de, Ligne, A. D., De Oliveira, R. C., Delpierre, N., Desai, A. R., Di Bella, C. M., Tommasi, P. di, Dolman, H., Domingo, F., Dong, G., Dore, S., Duce, P., Dufrêne, E., Dunn, A., Dušek, J., Eamus, D., Eichelmann, U., ElKhidir, H. A. M., Eugster, W., Ewenz, C. M., Ewers, B., Famulari, D., Fares, S., Feigenwinter, I., Feitz, A., Fensholt, R., Filippa, G., Fischer, M., Frank, J., Galvagno, M., et al.: The FLUXNET2015 dataset and the ONEFlux processing pipeline for eddy covariance data, Sci. Data, 7, 225, https://doi.org/10.1038/s41597-020-0534-3, 2020.
Pedregosa, F., Varoquaux, G., Gramfort, A., Michel, V., Thirion, B., Grisel, O., Blondel, M., Prettenhofer, P., Weiss, R., Dubourg, V., Vanderplas, J., Passos, A., Cournapeau, D., Brucher, M., Perrot, M., and Duchesnay, E.: Scikit-learn: Machine Learning in Python, J. Mach. Learn. Res., 12, 2825–2830, 2011.
Peichl, M., Öquist, M., Ottosson Löfvenius, M., Ilstedt, U., Sagerfors, J., Grelle, A., Lindroth, A., and Nilsson, M. B.: A 12-year record reveals pre-growing season temperature and water table level threshold effects on the net carbon dioxide exchange in a boreal fen, Environ. Res. Lett., 9, 055006, https://doi.org/10.1088/1748-9326/9/5/055006, 2014.
Peichl, M., Gažovič, M., Vermeij, I., de Goede, E., Sonnentag, O., Limpens, J., and Nilsson, M. B.: Peatland vegetation composition and phenology drive the seasonal trajectory of maximum gross primary production, Sci. Rep., 8, 8012, https://doi.org/10.1038/s41598-018-26147-4, 2018.
Pinsonneault, A. J., Moore, T. R., and Roulet, N. T.: Effects of long-term fertilization on peat stoichiometry and associated microbial enzyme activity in an ombrotrophic bog, Biogeochemistry, 129, 149–164, 2016.
Poczta, P., Urbaniak, M., Sachs, T., Harenda, K. M., Klarzyńska, A., Juszczak, R., Schüttemeyer, D., Czernecki, B., Kryszak, A., and Chojnicki, B. H.: A multi-year study of ecosystem production and its relation to biophysical factors over a temperate peatland, Agr. Forest Meteorol., 338, 109529, https://doi.org/10.1016/j.agrformet.2023.109529, 2023.
Qiu, C., Ciais, P., Zhu, D., Guenet, B., Chang, J., Chaudhary, N., Kleinen, T., Li, X., Müller, J., Xi, Y., Zhang, W., Ballantyne, A., Brewer, S. C., Brovkin, V., Charman, D. J., Gustafson, A., Gallego-Sala, A. V., Gasser, T., Holden, J., Joos, F., Kwon, M. J., Lauerwald, R., Miller, P. A., Peng, S., Page, S., Smith, B., Stocker, B. D., Sannel, A. B. K., Salmon, E., Schurgers, G., Shurpali, N. J., Wårlind, D., and Westermann, S.: A strong mitigation scenario maintains climate neutrality of northern peatlands, One Earth, 5, 86–97, https://doi.org/10.1016/j.oneear.2021.12.008, 2022.
Quin, S. L. O., Artz, R. R. E., Coupar, A. M., and Woodin, S. J.: Calluna vulgaris-dominated upland heathland sequesters more CO2 annually than grass-dominated upland heathland, Sci. Total Environ., 505, 740–747, https://doi.org/10.1016/j.scitotenv.2014.10.037, 2015.
Rankin, T. E., Roulet, N. T., and Moore, T. R.: Controls on autotrophic and heterotrophic respiration in an ombrotrophic bog, Biogeosciences, 19, 3285–3303, https://doi.org/10.5194/bg-19-3285-2022, 2022.
Rankin, T., Roulet, N., Humphreys, E., Peichl, M., and Järveoja, J.: Partitioning autotrophic and heterotrophic respiration in an ombrotrophic bog, Front. Earth Sci., 11, https://doi.org/10.3389/feart.2023.1263418, 2023.
R Core Team: R: A anguage and Environment for Statistical Computing, R Foundation for Statistical Computing, Vienna, Austria, 2025.
Reichstein, M., Falge, E., Baldocchi, D., Papale, D., Aubinet, M., Berbigier, P., Bernhofer, C., Buchmann, N., Gilmanov, T., Granier, A., Grunwald, T., Havrankova, K., Ilvesniemi, H., Janous, D., Knohl, A., Laurila, T., Lohila, A., Loustau, D., Matteucci, G., Meyers, T., Miglietta, F., Ourcival, J.-M., Pumpanen, J., Rambal, S., Rotenberg, E., Sanz, M., Tenhunen, J., Seufert, G., Vaccari, F., Vesala, T., Yakir, D., and Valentini, R.: On the separation of net ecosystem exchange into assimilation and ecosystem respiration: review and improved algorithm, Glob. Change Biol., 11, 1424–1439, https://doi.org/10.1111/j.1365-2486.2005.001002.x, 2005.
Richardson, A. D., Hufkens, K., Milliman, T., and Frolking, S.: Intercomparison of phenological transition dates derived from the PhenoCam Dataset V1.0 and MODIS satellite remote sensing, Sci. Rep., 8, 5679, https://doi.org/10.1038/s41598-018-23804-6, 2018.
Rosset, T., Binet, S., Rigal, F., and Gandois, L.: Peatland Dissolved Organic Carbon Export to Surface Waters: Global Significance and Effects of Anthropogenic Disturbance, Geophys. Res. Lett., 49, e2021GL096616, https://doi.org/10.1029/2021GL096616, 2022.
Sabbatini, S., Mammarella, I., Arriga, N., Fratini, G., Graf, A., Hörtnagl, L., Ibrom, A., Longdoz, B., Mauder, M., Merbold, L., Metzger, S., Montagnani, L., Pitacco, A., Rebmann, C., Sedlák, P., Šigut, L., Vitale, D., and Papale, D.: Eddy covariance raw data processing for CO2 and energy fluxes calculation at ICOS ecosystem stations, Int. Agrophys., 32, 495–515, https://doi.org/10.1515/intag-2017-0043, 2018.
Satriawan, T. W., Nyberg, M., Lee, S.-C., Christen, A., Black, T. A., Johnson, M. S., Nesic, Z., Merkens, M., and Knox, S. H.: Interannual variability of carbon dioxide (CO2) and methane (CH4) fluxes in a rewetted temperate bog, Agr. Forest Meteorol., 342, 109696, https://doi.org/10.1016/j.agrformet.2023.109696, 2023.
Schönbeck, L. C., Schuler, P., Lehmann, M. M., Mas, E., Mekarni, L., Pivovaroff, A. L., Turberg, P., and Grossiord, C.: Increasing temperature and vapour pressure deficit lead to hydraulic damages in the absence of soil drought, Plant Cell Environ., 45, 3275–3289, https://doi.org/10.1111/pce.14425, 2022.
Seabold, S. and Perktold, J.: Statsmodels: Econometric and Statistical Modeling with Python, Python in Science Conference, 92–96, https://doi.org/10.25080/Majora-92bf1922-011, 2010.
Shekhar, A., Buchmann, N., Humphrey, V., and Gharun, M.: More than three-fold increase in compound soil and air dryness across Europe by the end of 21st century, Weather Clim. Extrem., 44, 100666, https://doi.org/10.1016/j.wace.2024.100666, 2024.
Speranskaya, L., Campbell, D. I., Lafleur, P. M., and Humphreys, E. R.: Peatland evaporation across hemispheres: contrasting controls and sensitivity to climate warming driven by plant functional types, Biogeosciences, 21, 1173–1190, https://doi.org/10.5194/bg-21-1173-2024, 2024.
Swails, E. E., Ardón, M., Krauss, K. W., Peralta, A. L., Emanuel, R. E., Helton, A. M., Morse, J. L., Gutenberg, L., Cormier, N., Shoch, D., Settlemyer, S., Soderholm, E., Boutin, B. P., Peoples, C., and Ward, S.: Response of soil respiration to changes in soil temperature and water table level in drained and restored peatlands of the southeastern United States, Carbon Balance Manag., 17, 18, https://doi.org/10.1186/s13021-022-00219-5, 2022.
Tiemeyer, B., Albiac Borraz, E., Augustin, J., Bechtold, M., Beetz, S., Beyer, C., Drösler, M., Ebli, M., Eickenscheidt, T., Fiedler, S., Förster, C., Freibauer, A., Giebels, M., Glatzel, S., Heinichen, J., Hoffmann, M., Höper, H., Jurasinski, G., Leiber-Sauheitl, K., Peichl-Brak, M., Roßkopf, N., Sommer, M., and Zeitz, J.: High emissions of greenhouse gases from grasslands on peat and other organic soils, Glob. Change Biol., 22, 4134–4149, https://doi.org/10.1111/gcb.13303, 2016.
Tiemeyer, B., Freibauer, A., Borraz, E. A., Augustin, J., Bechtold, M., Beetz, S., Beyer, C., Ebli, M., Eickenscheidt, T., Fiedler, S., Förster, C., Gensior, A., Giebels, M., Glatzel, S., Heinichen, J., Hoffmann, M., Höper, H., Jurasinski, G., Laggner, A., Leiber-Sauheitl, K., Peichl-Brak, M., and Drösler, M.: A new methodology for organic soils in national greenhouse gas inventories: Data synthesis, derivation and application, Ecol. Indic., 109, 105838, https://doi.org/10.1016/j.ecolind.2019.105838, 2020.
Ueyama, M., Iwata, H., and Harazono, Y.: Autumn warming reduces the CO2 sink of a black spruce forest in interior Alaska based on a nine-year eddy covariance measurement, Glob. Change Biol., 20, 1161–1173, https://doi.org/10.1111/gcb.12434, 2014.
Umweltbundesamt: Submission under the United Nations Framework Convention on Climate Change and the Kyoto Protocol 2022, Umweltbundesamt, 2022.
van den Berg, M., van den Elzen, E., Ingwersen, J., Kosten, S., Lamers, L. P. M., and Streck, T.: Contribution of plant-induced pressurized flow to CH4 emission from a Phragmites fen, Sci. Rep., 10, 12304, https://doi.org/10.1038/s41598-020-69034-7, 2020.
Vekuri, H., Tuovinen, J.-P., Kulmala, L., Aurela, M., Thum, T., Liski, J., and Lohila, A.: Improved uncertainty estimates for eddy covariance-based carbon dioxide balances using deep ensembles for gap-filling, Agr. Forest Meteorol., 371, 110558, https://doi.org/10.1016/j.agrformet.2025.110558, 2025.
Vickers, D. and Mahrt, L.: Quality Control and Flux Sampling Problems for Tower and Aircraft Data, J. Atmos. Ocean. Tech., 14, 512–526, https://doi.org/10.1175/1520-0426(1997)014%3C0512:QCAFSP%3E2.0.CO;2, 1997.
Voigt, C., Lamprecht, R. E., Marushchak, M. E., Lind, S. E., Novakovskiy, A., Aurela, M., Martikainen, P. J., and Biasi, C.: Warming of subarctic tundra increases emissions of all three important greenhouse gases – carbon dioxide, methane, and nitrous oxide, Glob. Change Biol., 23, 3121–3138, https://doi.org/10.1111/gcb.13563, 2017.
Waddington, J. M., Rotenberg, P. A., and Warren, F. J.: Peat CO2 production in a natural and cutover peatland: Implications for restoration, Biogeochemistry, 54, 115–130, https://doi.org/10.1023/A:1010617207537, 2001.
Walker, T. N., Ward, S. E., Ostle, N. J., and Bardgett, R. D.: Contrasting growth responses of dominant peatland plants to warming and vegetation composition, Oecologia, 178, 141–151, https://doi.org/10.1007/s00442-015-3254-1, 2015.
Wang, H., Yan, S., Ciais, P., Wigneron, J.-P., Liu, L., Li, Y., Fu, Z., Ma, H., Liang, Z., Wei, F., Wang, Y., and Li, S.: Exploring complex water stress-gross primary production relationships: Impact of climatic drivers, main effects, and interactive effects, Glob. Change Biol., 28, 4110–4123, https://doi.org/10.1111/gcb.16201, 2022.
Ward, S. E., Ostle, N. J., Oakley, S., Quirk, H., Henrys, P. A., and Bardgett, R. D.: Warming effects on greenhouse gas fluxes in peatlands are modulated by vegetation composition, Ecol. Lett., 16, 1285–1293, https://doi.org/10.1111/ele.12167, 2013.
Waring, R. H., Landsberg, J. J., and Williams, M.: Net primary production of forests: a constant fraction of gross primary production?, Tree Physiol., 18, 129–134, https://doi.org/10.1093/treephys/18.2.129, 1998.
Webb, E. K., Pearman, G. I., and Leuning, R.: Correction of flux measurements for density effects due to heat and water vapour transfer, Q. J. Roy. Meteor. Soc., 106, 85–100, https://doi.org/10.1002/qj.49710644707, 1980.
Wilczak, J. M., Oncley, S. P., and Stage, S. A.: Sonic Anemometer Tilt Correction Algorithms, Bound.-Lay. Meteorol., 99, 127–150, https://doi.org/10.1023/A:1018966204465, 2001.
Wilson, D., Farrell, C. A., Fallon, D., Moser, G., Müller, C., and Renou-Wilson, F.: Multiyear greenhouse gas balances at a rewetted temperate peatland, Glob. Change Biol., 22, 4080–4095, https://doi.org/10.1111/gcb.13325, 2016.
Wutzler, T., Lucas-Moffat, A., Migliavacca, M., Knauer, J., Sickel, K., Šigut, L., Menzer, O., and Reichstein, M.: Basic and extensible post-processing of eddy covariance flux data with REddyProc, Biogeosciences, 15, 5015–5030, https://doi.org/10.5194/bg-15-5015-2018, 2018.
Yu, Z., Loisel, J., Brosseau, D. P., Beilman, D. W., and Hunt, S. J.: Global peatland dynamics since the Last Glacial Maximum, Geophys. Res. Lett., 37, L13402, https://doi.org/10.1029/2010GL043584, 2010.
Zhang, W., Hu, Z., Audet, J., Davidson, T. A., Kang, E., Kang, X., Li, Y., Zhang, X., and Wang, J.: Effects of water table level and nitrogen deposition on methane and nitrous oxide emissions in an alpine peatland, Biogeosciences, 19, 5187–5197, https://doi.org/10.5194/bg-19-5187-2022, 2022.
Zhao, Y., Feng, X., Pihlatie, M., Putkinen, A., Männikkö, M., Wang, H., Liu, C., Aurela, M., and Li, X.: Warming enhances soil carbon accumulation in boreal Sphagnum peatlands, Nat. Ecol. Evol., https://doi.org/10.1038/s41559-026-02982-x, 2026.