
the Creative Commons Attribution 4.0 License.
the Creative Commons Attribution 4.0 License.
 | 24 Jul 2026
Assessing methane emissions from an offshore marine aggregate extraction site near Sylt, Eastern North Sea
Martina Schmidt
Ingeborg Bussmann
Sarah J. E. Reith
Annika Palzer
Cedric Couret
Frank Keppler
Daniela Polag
Lasse Sander
Moritz Schroll
Julia B. Wietzel
Coastal regions are estimated to contribute with up to 1 % to the global atmospheric methane (CH4) budget. However, these emissions remain highly uncertain due to strong spatial and temporal variability. Anthropogenic activities in coastal waters, such as sand mining and beach nourishment, have not yet been investigated or included in the calculation of the resulting greenhouse gas emissions. Since 1984, regular beach nourishment has been carried out every summer on the west coast of the island of Sylt (North Sea, Germany). During this process, dredging vessels extract a mixture of sand and water from the seabed of a spatially confined area (Westerland II), situated approximately 8 km off the coast and deposit the material on the western beach and foreshore of Sylt. High resolution measurements of CH4 in ambient air at the coastal atmospheric station Westerland (Sylt, Germany) show CH4 spikes of up to 400 ppb above background concentrations. These spikes occurred mainly during summer season, during low tide and under westerly wind conditions (from the sand dredging area).
To investigate the origin of the observed atmospheric CH4 spikes, combined in-situ measurements of dissolved and atmospheric CH4 together with water sampling, were performed on board the research vessel RV Mya II (AWI, Alfred-Wegener-Institute) along a coastal transect from Sylt to the Westerland II dredging site. In the vicinity of the dredging site, elevated CH4 concentrations were detected both in ambient air (400–500 ppb above background reaching up to 2450 ppb) and in surface and bottom waters (69–90 nmol L−1). This resulted in a mean diffusive flux of 45 ± 47 µmol m−2 d−1 with a maximum value of 340 µmol m−2 d−1 in the dredging area, in contrast to a diffusive flux of 3.0 ± 3.6 µmol m−2 d−1 during the transit. Our observations demonstrate significantly higher CH4 concentrations and fluxes in both the atmosphere and the water column above the sand dredging site, compared to the areas outside the dredging activities. Furthermore, the isotopic composition of dissolved CH4 within the dredging site, characterized by more negative stable carbon and hydrogen isotope values, point to a microbial source of the excess CH4.
- Article
(4952 KB) - Full-text XML
- BibTeX
- EndNote


Atmospheric methane (CH4) is the second most important anthropogenic greenhouse gas after carbon dioxide (CO2) (IPCC, 2023). Global long-term measurements show that the increase rate of the atmospheric CH4 mole fraction has accelerated since 2007 after a stable period between 1999 and 2006 (Lan et al., 2021, 2024). In addition to global flask sampling programs (Lan et al., 2024), in situ measurement of atmospheric CH4 have been performed since the 1980s at background stations of the AGAGE (Advanced Global Atmospheric Gases Experiment) network (Simmonds et al., 1996; Cunnold et al., 2002) and at continental sites such as Schauinsland in the Black Forest, Germany (Schmidt et al., 1996), and more recently, within the European ICOS (Integrated Carbon Observation System) network (Heiskanen et al., 2022).
Since the 2010s, advances in measurement technology have made it easier to accurately measure the CH4 mole fraction at remote stations and with higher resolution. These data, with temporal resolution of 1–3 s, help to learn more about the local CO2 and CH4 sources, although the data are usually averaged from minute to hourly values. In recent years, the use of such high-resolution data has demonstrated that even remote background stations on mountains such as the Jungfraujoch, Pic du Midi and Zugspitze can be influenced by local pollution (Affolter et al., 2021; El Yazidi et al., 2018; Hoheisel et al., 2023). At the Pic du Midi station, a local sewage treatment plant near the ambient air inlet causes local CH4 peaks (El Yazidi et al., 2018), and the CO2 levels at the Jungfraujoch station show anthropogenic influences from the breathing of visitors and tourists (Affolter et al., 2021). At the Zugspitze/Schneefernerhaus station, high-resolution CO2 and CO time series have identified local pollution events caused by snow blowers and snow groomers, and these events were successfully identified through station management procedures (Hoheisel et al., 2023). Therefore, these high-resolution measurements also provide an opportunity to become aware of local processes and to better quantify local sources.
At the atmospheric station Westerland (Sylt, Germany) long-term in situ measurements of CO2 and CH4 mole fractions are performed by the German Environment Agency (UBA – Umweltbundesamt). The station joined the atmospheric network ICOS in 2021. The measured air is often influenced by air masses from the German mainland and also from the North Sea, with the North Sea sector corresponding to the background air, without direct influences from local or regional pollution. In summer 2022, CH4 spikes were observed in the high-resolution atmospheric station data from the background (North Sea) sector.
In the southern North Sea, dissolved CH4 primarily originates from autochthonous methanogenesis in sediments (Yin et al., 2019) and is subsequently transferred into the water column. Additional CH4 sources include emissions from tidal flats (Røy et al., 2008; Wu et al., 2015) and inputs from rivers (Upstill-Goddard and Barnes, 2016). Recent warm summers in northern Europe have intensified sedimentary methanogenesis, leading to higher dissolved CH4 concentrations (Borges et al., 2019). Spatially and temporally resolved surveys between the German North Sea coast and the island of Helgoland (60 km offshore) from 2019 to 2020, revealed a high variability in dissolved CH4, ranging from 20 ± 17 nmol L−1 in June 2019 to 231 ± 343 nmol L−1 in September 2019 (Bussmann et al., 2021, 2024). At such elevated dissolved CH4 concentrations in the coastal North Sea (equilibrium ∼ 2–3 nmol L−1), the resulting diffusive flux is predominantly directed from the sea to the atmosphere.
Mobile measurements near the atmospheric monitoring station Westerland and on the beach showed that the measured CH4 spikes originate from the North Sea and are likely related to sand dredging activity for beach nourishment carried out as part of coastal protection. Beach nourishment has been carried out regularly on the west coast of the island of Sylt since 1984. Between April and October, dredging vessels extract a mixture of sand, water, and other unconsolidated sediment fractions from the seafloor of a concession area (Westerland II), located 8 km offshore of the island. Westerland II has been in operation since 1983, and an approximate volume of 56 million m3 of sand has been extracted for beach nourishment (LKN.SH, 2022). In 2022 alone, approximately 1 million m3 of sand were dredged from this area. From Westerland II, the extracted aggregates are transported to the beach and foreshore on the west coast of Sylt (LKN.SH, 2022). On a broader scale, marine aggregate extraction in the European North Sea is estimated to roughly 100 000 kt yr−1, corresponding to about 62.5 million m3 yr−1, and is used for construction, land reclamation, and beach nourishment (Porz et al., 2026). This topic of marine aggregate extraction is relevant throughout Europe and can be regarded as a use of marine resources of increasing relevance for the future (e.g., BSH, 2021)
The aim of this study is to investigate the potential CH4 emissions of sand dredging activities. Continuous measurements of atmospheric and dissolved CH4 were conducted on board the research vessel Mya II (AWI) along a transect from Sylt to the Westerland II dredging site. In addition, water samples collected at different depths were analyzed for dissolved CH4 concentrations and stable isotope ratios (δ13C-CH4 and δ2H-CH4,), to identify the origin and processes controlling CH4 production and emission in the dredging area.
2.1 Study area
The island of Sylt is located on the eastern seaboard of the North Sea (Germany) and is a wave-exposed, moraine-cored barrier island that borders on a shallow coastal shelf with a water depth of between 10–20 m. Coastal erosion of the sandy beaches along the western shoreline of Sylt led to the adoption of a beach nourishment strategy in 1972 that aims to compensate for the loss of sediment by replenishing aggregates extracted from an offshore resource (MEKUN.SH, 2022). Since the beginning of the measures, a total volume of 56.9 million m3 of sediment has been nourished to the beaches of Sylt (LKN.SH, 2022). The source area itself is located approximately 8 km offshore of the island, where unconsolidated sand and gravel deposits of Pleistocene age are found and have been extracted here since 1983 (Tremmler, 1994). The area is referred to as Westerland II and has a size of approximately 9 km2 and is divided into subsections, each of which has been in use for several years until the targeted resource is exploited and the use is abandoned subsequently. The extraction of aggregates results in the formation of large depressions and large-scale features with diameters of several hundreds of meters across and depths of up to 20 m deep. The extraction is conducted by hopper-dredgers that pump sediment through a suction pipe, thereby creating a pattern of connecting craters on the seafloor. The infill of the depressions is a slow process, and the features remain detectable for decades after their use has been abandoned. Their presence entails a local change in the sedimentary regime and hence a shift in local habitat conditions (Mielck et al., 2019, 2021). A study by Figge et al. (2002) described that the sedimentary infill of the abandoned holes is mostly deposited from the suspension load of the water column. As a result, the seafloor in the depressions is mostly combined of marine muds, whereas the surrounding undisturbed seafloor offshore Sylt is primarily composed of medium and coarse sands (Zeiler et al., 2000; Mielck et al., 2015). Part of the relevance of this study stems from the fact that a much larger extraction site, Westerland III, was defined, which was taken in use in summer 2024 (LKN.SH, 2024). Figure 1 presents a map illustrating the location of the island, the ICOS station, and the dredging area.
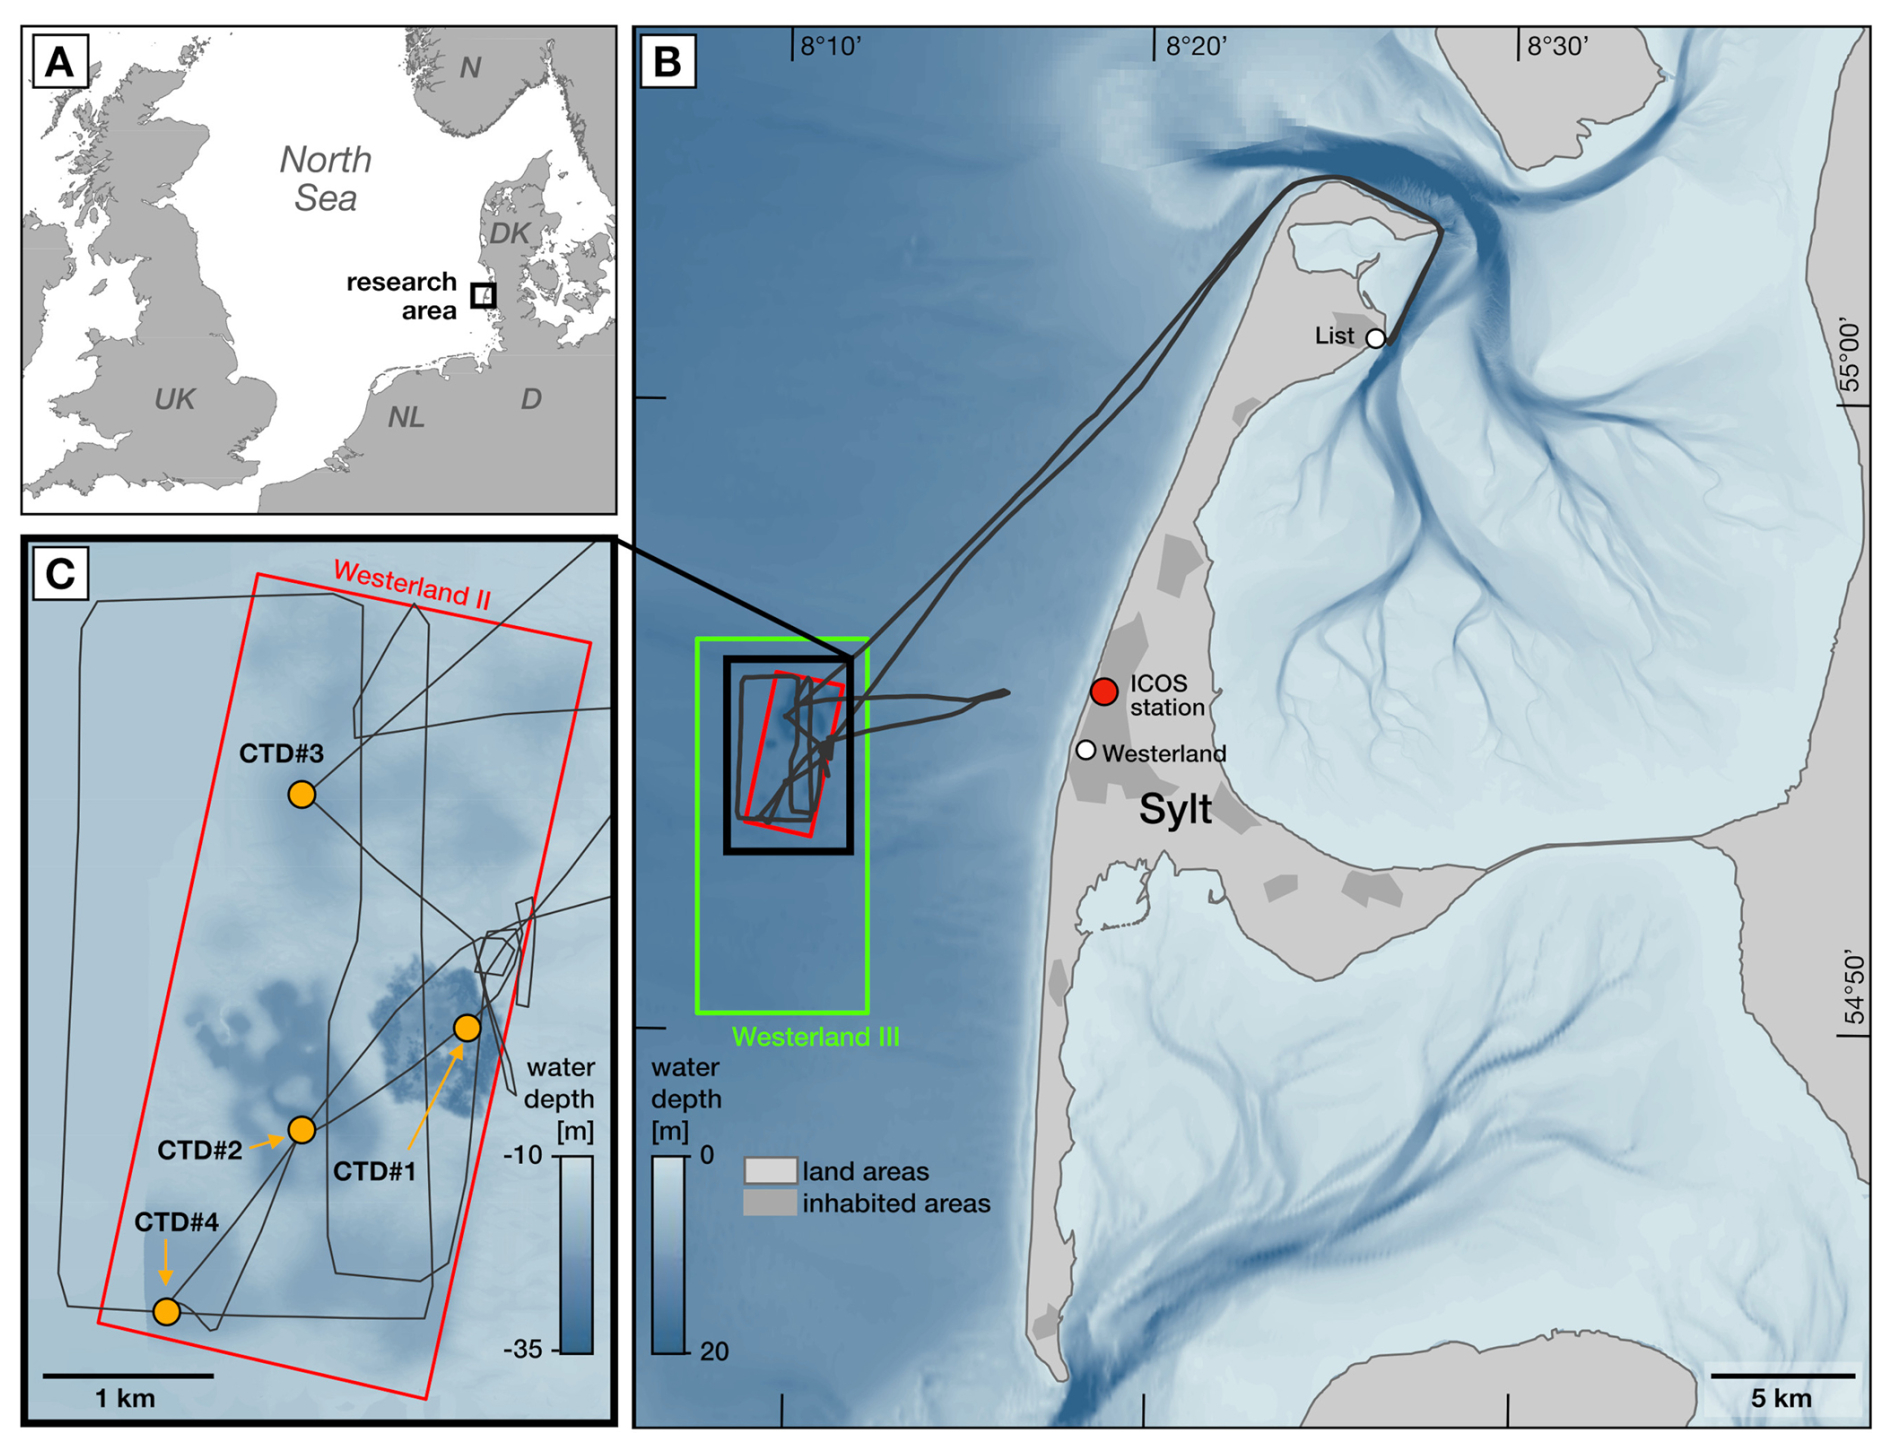
Figure 1Map. (A) Location of the research area (B) Overview map of the aggregate extraction site offshore Sylt island. The ICOS atmospheric measurement station Westerland is marked with a red dot. (C) Detail map of the bathymetry and survey transects (black lines) of the study area at the active sand extraction site Westerland II (red rectangle), orange dots were stations for water sampling and CTD-casts to measure temperature and salinity profiles. Bathymetric information is based on different sources (BSH, German Federal Maritime and Hydrographic Agency, 2025; DGM-W, 2020) and own measurements.
2.2 Instrumental setup for the atmospheric CH4 measurement
2.2.1 In-situ measurements at ICOS atmospheric station Westerland (WES)
The ICOS atmospheric station Westerland (WES) (54°55′ N/8°18′ E and 12 m above NN) is located between the towns of Westerland and Wennigstedt (10 500 inhabitants) on the west coast of the island of Sylt (German North Sea) (Fig. 1). It is one of the longest operating stations of the German Environment Agency (UBA). The station has been measuring atmospheric CO2 since 1972 (Levin et al., 1995) and CH4 since 2009. The station is located near the beach and receives continental and maritime air masses. In July 2021, Westerland station became part of the Integrated Carbon Observation System (ICOS) network, and the measurement setup was upgraded to follow the highly standardized ICOS measurement procedure (Yver-Kwok et al., 2021), including calibration strategy and central data processing. The CO2 and CH4 mole fractions are measured continuously using a cavity ring down spectrometer (CRDS, G2301, Picarro, Santa Clara, CA, USA). The air inlet is located on a mast at 14 m a.g.l. Ambient air is dried with a Nafion dryer (D-070-144S-2, Perma Pure, USA) prior to analysis. Four calibration gases and two target gases for quality control are measured periodically. All calibration gases are filled and calibrated in the ICOS-Flask and Calibration Laboratory (FCL) in Jena. The raw data of the CO2 and CH4 measurements are available with a resolution of 3 s and are averaged to calibrated minute and hourly averages during the data processing. Meteorological parameters such as wind speed and direction (Ultrasonic Anemometer, Thies, Germany) temperature (Hygro-Thermo Transmitter, Thies, Germany) and pressure (Barometer module, Thies, Germany) are also measured at a temporal resolution of minutes.
2.2.2 Mobile atmospheric measurement on board of RV Mya II and on Sylt island
The atmospheric CH4 and CO2 mole fractions were measured on board of RV Mya II, at the beach nourishment site in List, and in the surroundings of the atmospheric monitoring station Westerland using an Optical Feedback-Cavity Enhanced Absorption Spectroscopy (OF-CEAS) trace gas analyser (LI-7810, LI-COR, Lincoln, USA). This instrument was calibrated using a one-point calibration that was determined from regular measurements of a calibration gas (Wietzel and Schmidt, 2023; Wietzel et al., 2025). Two inlet lines (“ Teflon) were installed to measure ambient air – one at the mast, approximately 8 m above sea level, and the other using a handheld line positioned directly overboard near the water surface. A three-way valve was used to switch between the two lines. The different lengths of the inlet lines resulted in delay times of 42 and 32 s, respectively, which were determined by exposing the inlet to a small CO2 pulse (breath test). The data were later corrected for this delay time during the data treatment and calibration process. For measurements conducted in the vicinity of the Westerland station and at the nourishment site, the instrument was carried in a backpack. It was used to determine CH4 concentrations in ambient air via a 3 m long Teflon tube or in soil air using a static chamber.
In addition to the in-situ measurements with a 1 Hz temporal resolution, ambient air was sampled in nine 3 L tedlar bags with a polypropylene valve (Restek Corporation, Centre County, PA, USA) for later δ13C-CH4 analysis in the laboratory using a cavity ring-down spectroscopy (CRDS) analyser (G2201-i, Picarro, Santa Clara, CA, USA) as described by Hoheisel et al. (2019). Throughout the cruise, the position was tracked with two GPS systems (BasicAirData, Google Commerce Ltd. and Garmin 64s, Garmin Ltd.).
2.3 In-situ measurements of dissolved CH4 in the water column
Surface water was provided by the ship's water supply into an overflowing bucket, from which the water was pumped to the setup described below. Dissolved CH4 concentrations were determined using a dissolved gas extraction unit coupled to a laser-based Greenhouse Gas Analyzer (GGA; Los Gatos Research, USA). Methane was extracted from the water via a hydrophobic membrane and hydrocarbon-free carrier gas on the other side of the membrane (water flow 1 L min−1, nitrogen at 0.5 L min−1). The carrier gas containing the extracted CH4 was subsequently directed to the GGA for analysis. The time lag between water intake and corresponding signal detection was determined in the laboratory by switching the inlet between aerated freshwater and saltwater. All data were corrected accordingly. To convert the relative concentrations (ppm) reported by the GGA to absolute concentrations (nmol L−1), discrete water samples were collected during the day (Bussmann et al., 2024). The CH4 concentration in these samples was analyzed by gas chromatography following Magen et al. (2014). A correlation between the methane concentration of the water samples and the simultaneous GGA readings was used to convert all GGA measurements into concentrations of dissolved methane. To test the lower sensitivity of the setup, aerated freshwater with an equilibrium concentration of 2.9 nM was measured in the laboratory, and the instrument readings gave a concentration of 2.3 ± 0.3 nM.
Calculation of the diffusive methane flux
The overall gas exchange across an air–water interface was determined according to Wanninkhof et al. (2009) as:
where F denotes the gas flux per unit area (mmol m−2 d−1), cm is the measured CH4 concentration in surface waters. Cequ represents the equilibrium concentration with the atmosphere and was calculated based on the equation from Wiesenburg and Guinasso (1979) with the respective water temperature and salinity. For the atmospheric CH4 concentration data, we used the measurements onboard as described in Sect. 2.2.2.
The gas exchange coefficient (k) is a function of water near-surface turbulence, which in marine and estuarine environments is mainly driven by wind speed (U10). The gas exchange velocity k600 was calculated using the parameterization for coastal seas from Nightingale et al. (2000):
The wind-speed-based k600 parameterization from Nightingale et al. (2000) was applied in this study, primarily due to its widespread utilisation and its representation of a compromise between relationships that have a very strong or a very weak wind-speed dependence (Yang et al., 2019). Wind data were obtained from the ship's meteorological system.
The calculated k600 (for CO2 at 20 °C) was converted to kCH4, and the Schmidt number (Sc) was adjusted for the measured water temperature and salinity according to Wanninkhof, 2014 (Eq. 4). The Schmidt number (Sc) describes the gas transfer velocity and is gas and temperature specific. It offers the means to determine the gas transfer velocity for different soluble gases over a range of temperatures.
2.4 Water sampling and discrete measurements
Water samples were either taken from the ship's water supply for surface water or with a 5 L Niskin bottle from the bottom water. Attached to the Niskin bottle was a CTD (CTD60M, Sea & Sun Technology, Germany), a sensor to measure conductivity, temperature and depth, to measure salinity, temperature and dissolved oxygen profiles. The extraction of dissolved CH4 was carried out using the headspace method (Magen et al., 2014). Surface water samples were collected at 11 locations along the transect, and depth profiles were obtained at 4 locations: location #1 at 3 depths and locations #2–#4 at 2 depths each. At all sampling locations and depths, three 1 L glass bottles (Schott, Germany) were filled to the brim with seawater. Each glass bottle was used to obtain one gas sample for the measurement of CH4 concentration, δ13C-CH4, and δ2H-CH4 values (n=1). Surface samples were collected via a tap connected to the shipboard pump system (no filters or desalinators), while depth profile samples were filled directly from the Niskin bottle. After sampling, the glass bottles were sealed with plastic screw-on lids containing two septum ports. Care was taken to ensure that the bottles were overflown at least 3 times the bottle volume before capping to prevent the extraction of dissolved gases during filling. The remaining air was displaced by inserting a hypodermic needle (0.8 × 40 mm; BD MicrolanceTM, USA) into one port and another needle attached to a syringe filled with seawater into the other port. Then 40 mL of synthetic air (Air Liquide, Germany) from a 2.5 L stainless-steel canister was transferred into the glass bottles as headspace. An equilibrium between dissolved and gaseous CH4 was established after the glass bottle was shaken vigorously for 2 min. The headspace gas was then extracted using a 60 mL plastic syringe (BD Luer-LokTM, USA) and transferred into 12 mL pre-evacuated Exetainers® (Labco, UK).
2.4.1 Measurement of dissolved CH4 concentration in discrete samples
A gas chromatograph (GC 2030, Shimadzu, Japan) equipped with a flame ionization detector (FID) was used to measure the concentration of CH4 from the seawater headspace samples. Surface water samples were analyzed as single replicates (n=1), whereas samples from below the water surface were measured in triplicate (n=3). For the measurement, approx. 8 mL of sample gas was taken from each Exetainer® and injected into the GC via a 2 mL sample loop. The GC was equipped with a TG-BOND Alumina capillary column with a film thickness of 10 µm, an internal diameter of 0.53 mm, and a length of 50 m (Shimadzu, Japan). To account for instrument drift and to calibrate the sample measurements, multiple calibration gases (with a concentration ranging from 0.3 to 16.1 ppm) were measured each before and after the sample measurements. In addition, the CH4 concentration of the stainless-steel canister filled with synthetic air, which was used during the headspace extraction, was measured and subtracted from the CH4 concentration of the samples.
2.4.2 Measurement of the stable carbon and hydrogen isotope values of dissolved CH4
In this study, the stable isotope composition of CH4 is given in the conventional δ-notation, which represents the relative difference of the and ratios compared to the Vienna-Peedee Belemnite (VPDB) and Vienna-Standard Mean Ocean Water (VSMOW) standards, respectively. For the measurement of δ13C-CH4 (precision < 0.3 ‰) and δ2H-CH4 (precision < 3 ‰) values in the seawater samples a DeltaPlus XL isotope ratio mass spectrometer (Thermo Fisher Scientific, USA) coupled to a HP 6890N GC (Agilent Technologies, USA) and a cryogenic pre-concentration unit was used. For a more detailed description of this method, we refer to Einzmann et al. (2022). δ13C-CH4 and δ2H-CH4 values of dissolved CH4 in water samples were analyzed as single replicates (n=1).
3.1 Meteorological conditions before and during the RV Mya II transects in July 2023
During our campaign (3–7 July 2023), we experienced a rather unusual weather situation for summer. Storm Poly, an extremely strong European storm, hit the United Kingdom, Benelux and Germany between 4 and 6 July 2023. With wind gusts of up to 146 km h−1, it was one of the strongest summer storms ever recorded in the Netherlands (EUMETSAT, 2023). In Germany, a first peak was reached around noon (5 July 2023) in the area of East Frisia. In the evening, a second wind maximum developed from the coast of Lower Saxony towards the west coast of Schleswig-Holstein, with values sometimes slightly higher than at noon and in the afternoon (DWD, 2023), with wind gusts of up to 109 km h−1 measured. At the ICOS stations Westerland and Helgoland, the highest wind speeds of 18 m s−1 (64 km h−1) and 31 m s−1 (111 km h−1) (see Fig. A1), respectively, were recorded in the evening and at noon on 5 July. Figure 2 shows the wind roses recorded at Westerland station during the storm on 5 July 2023 (two days before our measurements) and onboard of RV Mya II during the measurements in the North Sea on 7 July 2023. On 5 July, the wind direction changed from southeast to a westerly direction with a clearly higher wind speed of up to 18 m s−1.
On 6 July, the weather situation gradually calmed down, allowing a cruise with the RV Mya II to be carried out on 7 July 2023 from 08:00 to 16:00 local summer time (06:00–14:00 UTC). The mean wind speed was 3.6 m s−1 from southwesterly direction.
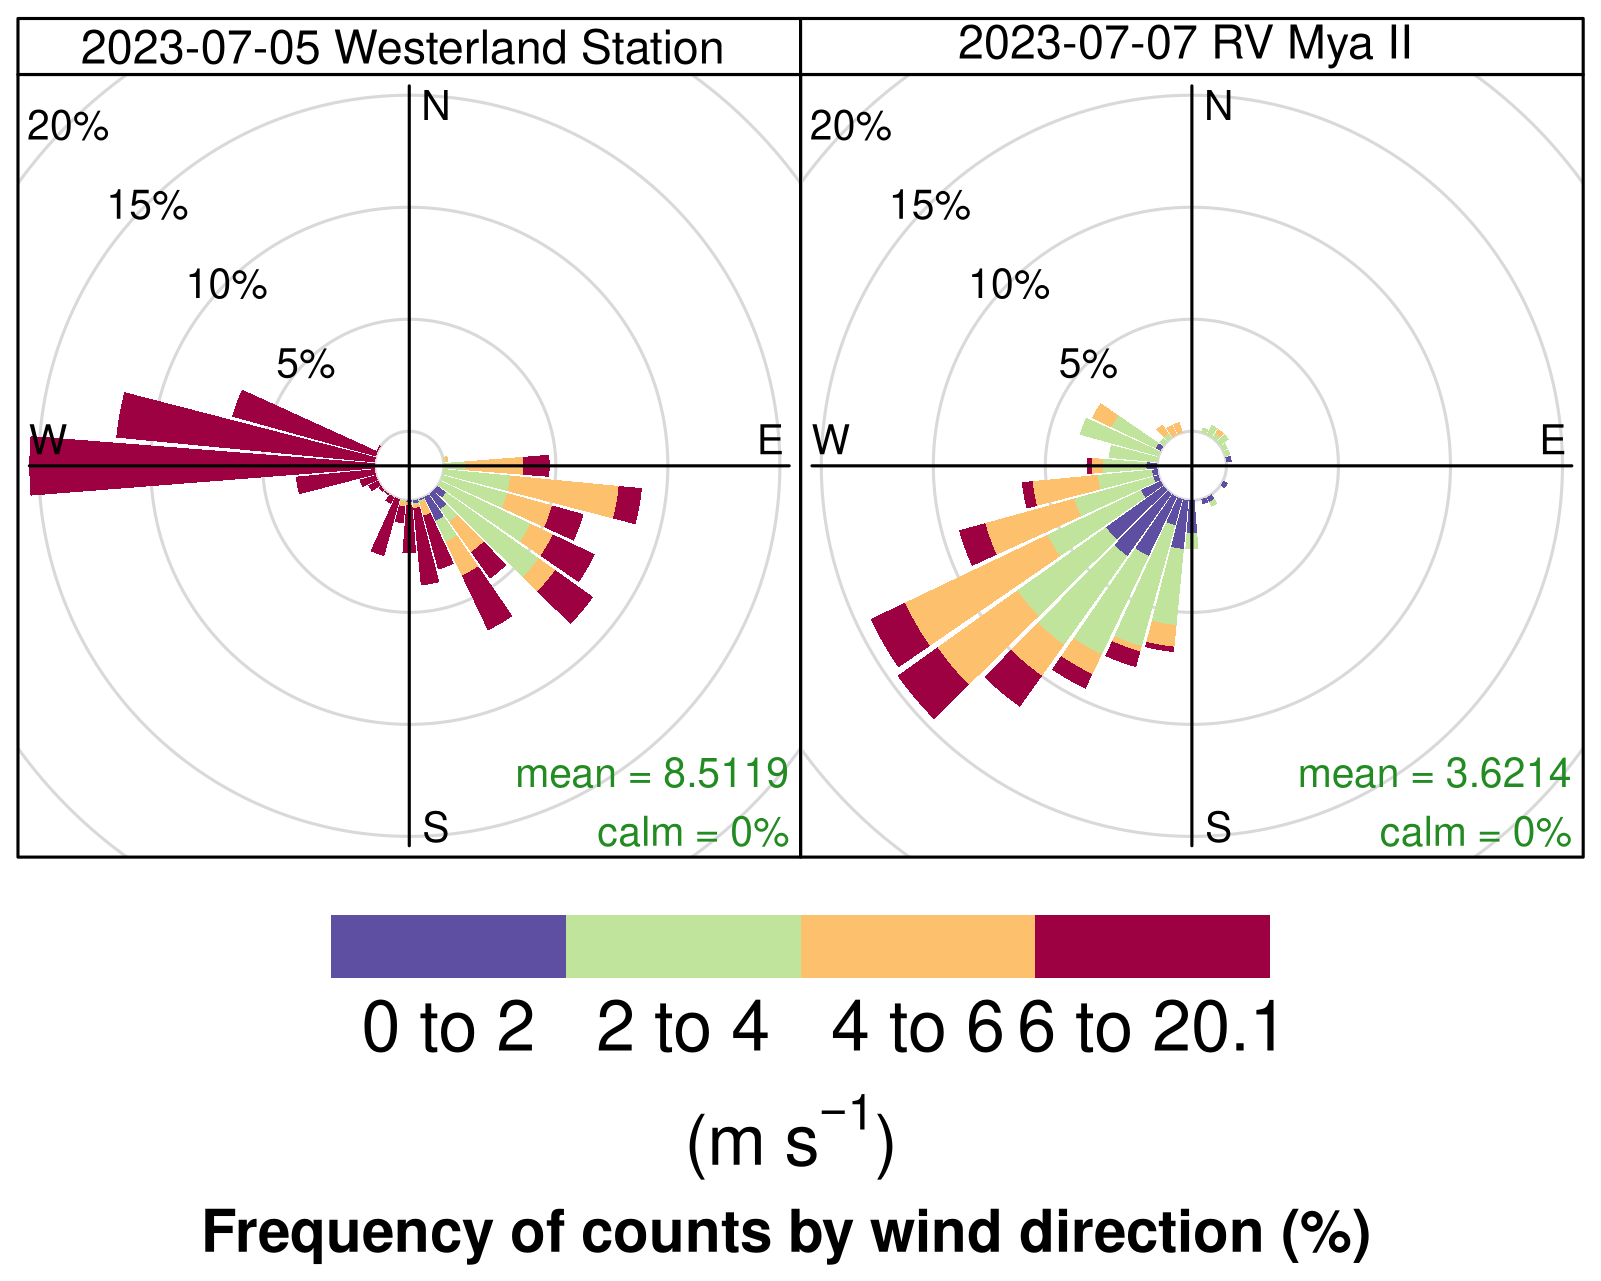
Figure 2Wind data from Westerland station for the day when the storm was strongest (5 July 2023) and for the day of the measurement campaign on board the RV Mya II (7 July 2023).
3.2 Atmospheric CH4 measurements at the ICOS station Westerland
Since joining the ICOS atmospheric network, quality control of atmospheric measurements at the Westerland station is not only performed on the hourly averaged calibrated CH4 and CO2 values but also on the high-frequency raw data with a temporal resolution of a few seconds. Only through the inspection of these high-resolution data was it possible to identify episodic CH4 enhancements. Both the raw data and the one-minute averaged CH4 measurements at Westerland atmospheric station show CH4 spikes of up to 300 ppb in individual episodes. As these CH4 spikes occurred repeatedly during the summer of 2022, the data were analyzed in more detail, and possible correlations with other parameters were investigated. Figure 3 shows the minute-averaged CH4 and CO2 mole fractions over 4 d in July 2022, one year before the measurement campaign. The CH4 mole fraction varies between 1950 and 2140 ppb with peaks of up to 160 ppb, while CO2 varies between 415 and 421 ppm with no short-term peaks. In contrast to air masses transported from the mainland, where CH4 and CO2 are always well correlated, the observed spikes in Fig. 3 occur only in CH4. The wind came from the marine sector between 240 and 350° (clean air sector) with high wind speeds between 6 and 14 m s−1. Clearly visible are the periodic CH4 peaks, which occur mainly at low tide (shaded in light yellow).
A systematic analysis of the high-frequency CH4 data from 2022 revealed several consistent characteristics. CH4 spikes occurred predominantly during the summer months, under winds from the marine clean air sector (240–350°), and during low tide. In addition, the CH4 spikes showed no correlations with CO2. Figure A2 presents a histogram of the number of days with CH4 spikes per month in 2022, indicating that most spikes occurred in June, July, and August, some in May and October, and very few in January and March. However, it is also possible that no CH4 peaks occurred under the above-mentioned conditions. To investigate the cause of the periodic CH4 peaks, mobile measurements were carried out near the station and on the beach. As no elevated CH4 concentrations were found, a very local source of CH4 near the atmospheric station Westerland or on the beach could be ruled out. Subsequently, wind direction, distance from the station and peak shape were then used to identify dredging activities in the North Sea in the nearby Westerland II dredging area as a possible cause.
A comparison with sand dredger activity data showed that in June 2022, when dredging operations paused for two days, the CH4 peaks continued to follow the usual tidal pattern (see Fig. A3), indicating that the emissions are not exclusively associated with the active extraction process but may also be influenced by the characteristics of the young seafloor depressions created by dredging. However, confirming this hypothesis required ship-based measurements.
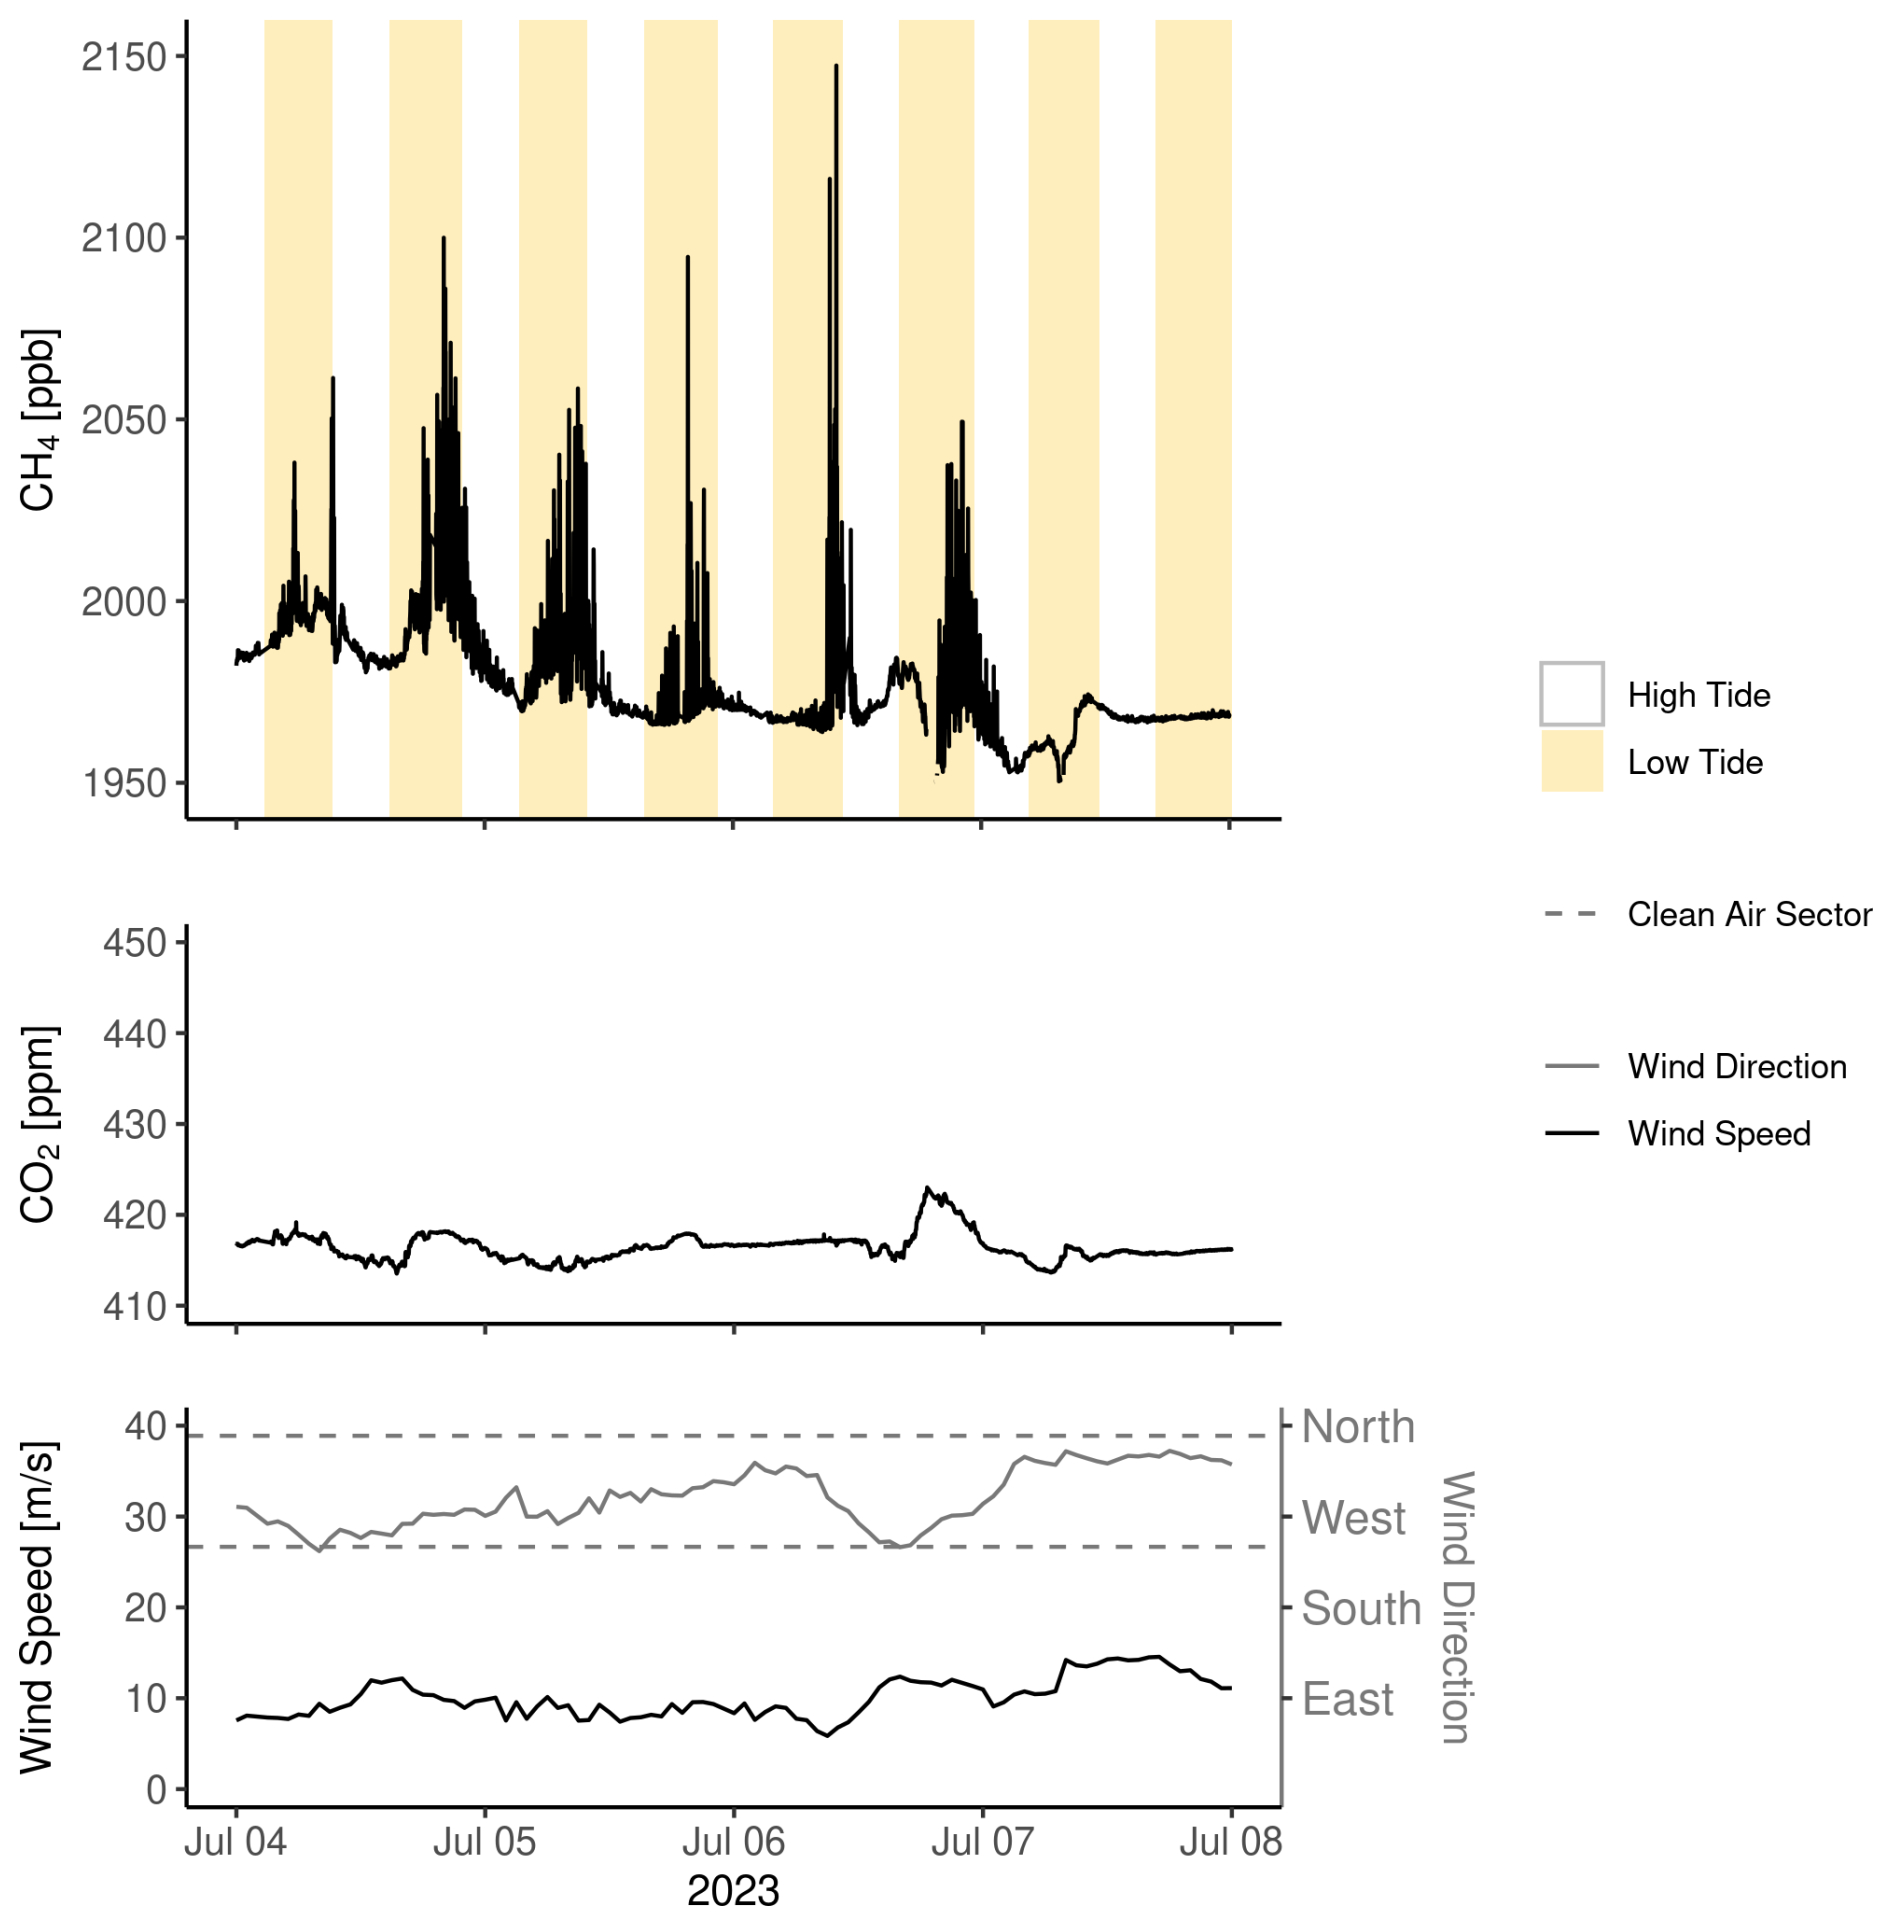
Figure 3(a) CH4 mole fractions of a typical summer period (4 to 8 July 2022). The periods of low tides are shaded in light yellow. (b) CO2 mole fraction during the same 4 d (c) corresponding wind speed (black) and wind direction (grey). The clean air sector (240–350°) is marked with two dashed horizontal lines.
Figure 4 shows the CH4 and CO2 mole fractions at Westerland station before and during the measurement campaign in July 2023. On 5 July, an air mass originating from the mainland (easterly wind) reached the station, leading to simultaneous increases in CH4 and CO2 mole fractions with values up to 2100 ppb and 445 ppm, respectively. The good correlation between CH4 and CO2 in air masses transported from the mainland can be seen. In the evening of 5th July and in the morning of the 6 July, one day before the shipboard measurement on RV Mya II, storm Poly hit the German Bight with hourly mean wind speeds of up to 17.5 m s−1. In contrast, on 4 July, only one very small CH4 peak of 15 ppb was detected from the clean air sector. However, this CH4 spike was relatively small compared to other CH4 spikes detected in July 2022 (Fig. 3). On the day following the storm, no distinct CH4 spikes were observed from the clean air sector, as winds were predominantly from the south-southwest (SSW) rather than from the dredging area to the west, and wind speeds remained very low.
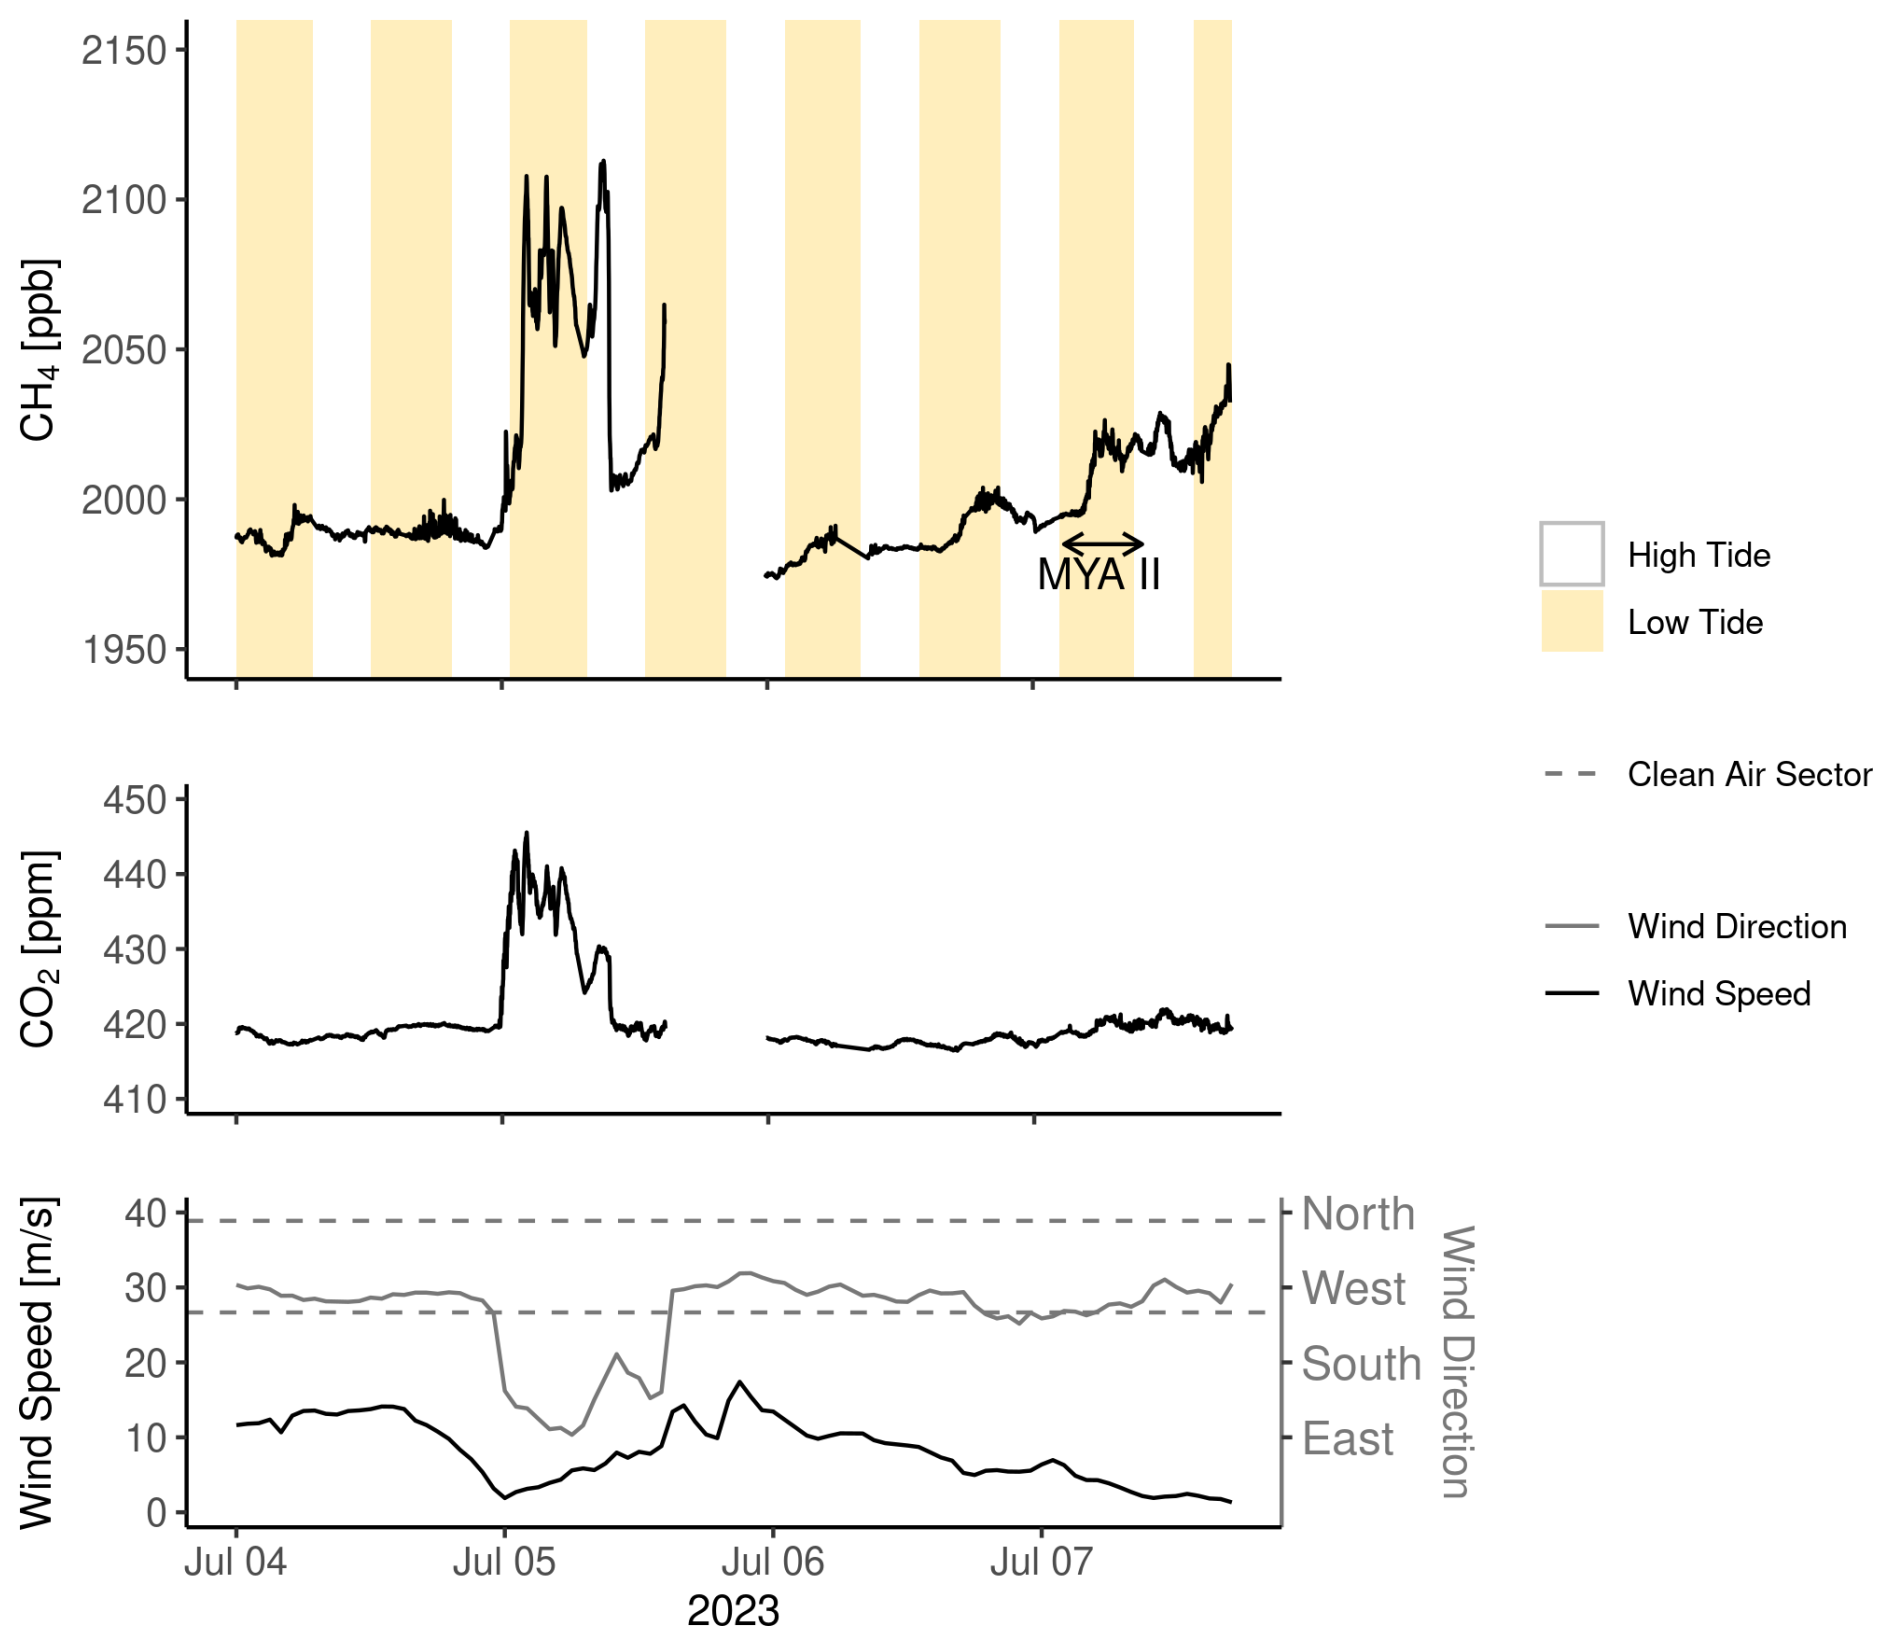
Figure 4(a) CH4 mole fractions at Westerland station during the measurement campaign (4 to 7 July 2023). The periods of low tide are shaded in light yellow. The RV Mya II campaign is indicated with a horizontal arrow. (b) CO2 mole fractions at Westerland station during the same summer period. (c) Corresponding wind speed (black) and wind direction (grey). The clean air sector (240–350°) is marked with two dashed horizontal lines.
3.3 Atmospheric CH4 measurements onboard RV Mya II in July 2023
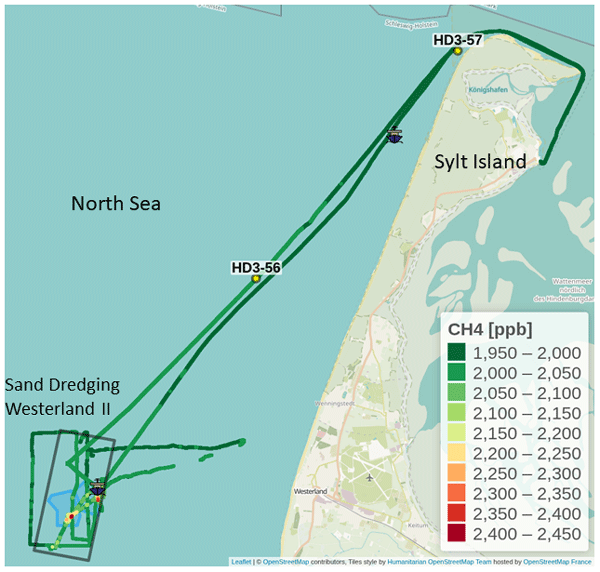
Figure 5 shows the shipboard transect of RV Mya II as a function of the atmospheric CH4 mole fraction. The dark gray rectangle marks the Westerland II sand extraction area with sectors 1b and 1a (blue), which have been dredged since 2017 and from 2010 to 2017, respectively. During the campaign on 7 July, a mean wind speed of 3.6 m s−1 from southwesterly direction was measured at the ICOS station Westerland. The two ship symbols indicate the coordinates of the dredging ship during the ship campaign, in the north during beach nourishment, and in the southwest during dredging. The hand-held sampling line was used once during the first transect from dredging area 1b to 1a (the northern direct transect in Fig. 5b) and a second time during the transect above the mud track from the actively dredging hopper dredger (south of the ship in Fig. 5b). An additional figure showing when the different sampling lines were used is included in the Appendix (Fig. A4).
The highest atmospheric CH4 concentrations of up to 2450 ppb were measured directly in the areas where dredging is currently taking place or has taken place in recent years. The lowest CH4 mole fraction of 1990 ppb was measured north-east of the dredging area. This shows a CH4 excess of more than 450 ppb above the dredged holes. The highest CH4 mole fractions were found directly with the hand inlet above a plume of advected suspended sediment from the hopper-dredger (Fig. 5b south of the hopper-dredger).
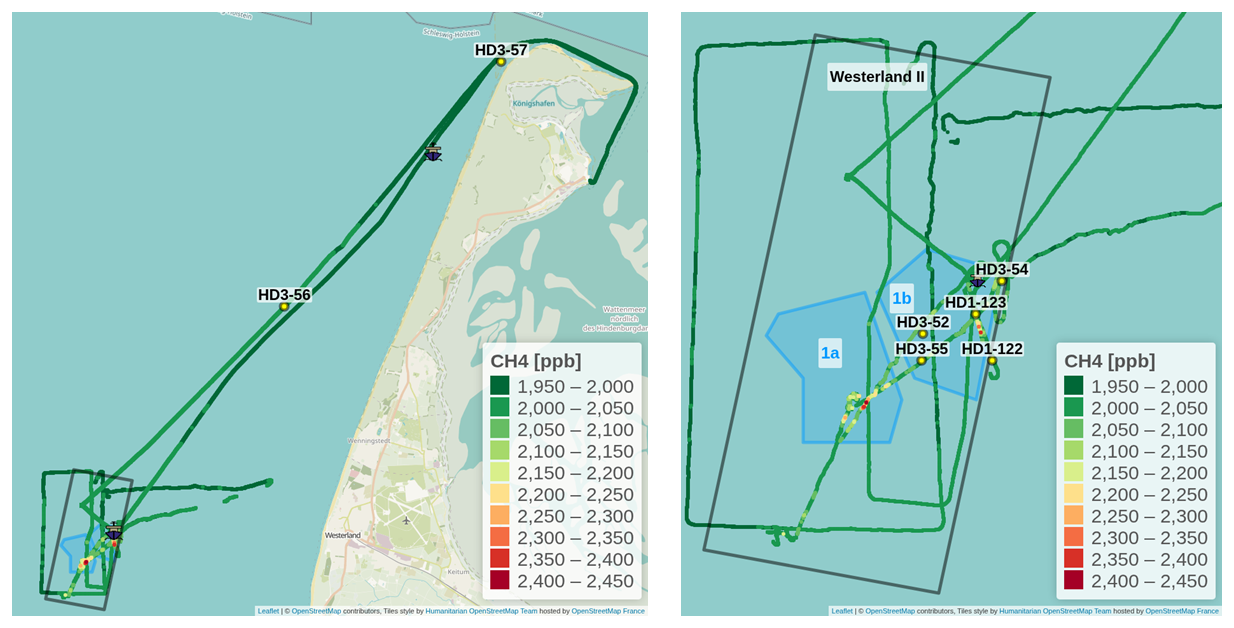
Figure 5(a) Vessel track of the RV Mya II with measured CH4 mole fractions; the ship symbol marks the position of the hopper-dredger Thor R. (b) A close up to the designated dredging areas Westerland II, 1a and 1b are depicted in dark gray and blue (right side). The seven sampling locations for atmospheric air isotope analyses are indicated together with their sample numbers (see Sect. 3.6 for further details). The maps were created with the Leaflet package for R (https://leafletjs.com/, last access: 24 June 2026) using the OpenStreeMap basemap with tiles from Humanitarian OpenStreetMap Team (© OpenStreetMap contributors, https://www.openstreetmap.org/copyright (last access: 24 June 2026), Tiles style by Humanitarian OpenStreetMap Team, https://www.hotosm.org/en/, last access: 24 June 2026 hosted by OpenStreetMap France, https://www.openstreetmap.fr/, last access: 24 June 2026).
This suspended sediment was clearly visible from the RV Mya II and two transects were conducted along this track. During the first transect, the CH4 mole fractions were measured with the inlet line attached to the mast. The mean mole fraction there was (2041 ± 4) ppb. The second transect contains mole fractions measured directly above the suspended sediment with the hand-held sampling line. Here, a mean CH4 mole fraction of (2104 ± 7) ppb was measured. This shows that the spikes in CH4 mole fractions at the Westerland station are most likely caused by offshore dredging activities.
3.4 Dissolved CH4 concentrations in surface seawater
Low surface water concentrations of dissolved CH4 were observed during the transit from the port to the Westerland II area with 5.6 ± 3.7 nmol L−1. In the Westerland II area higher concentrations were observed with 59.1 ± 21.3 nmol L−1 on average and up to 90 nmol L−1 (Fig. 6). At four stations bottom water was sampled (see Fig. 1). In the bottom water dissolved CH4 was enriched, especially at locations #1 and #2 with 111 ± 12 nmol L−1, while at the control station #4 only 24 ± 4 nmol L−1 were observed. Due to the strong storm during the previous days, the CTD-profile revealed a completely mixed water column (Fig. A5).
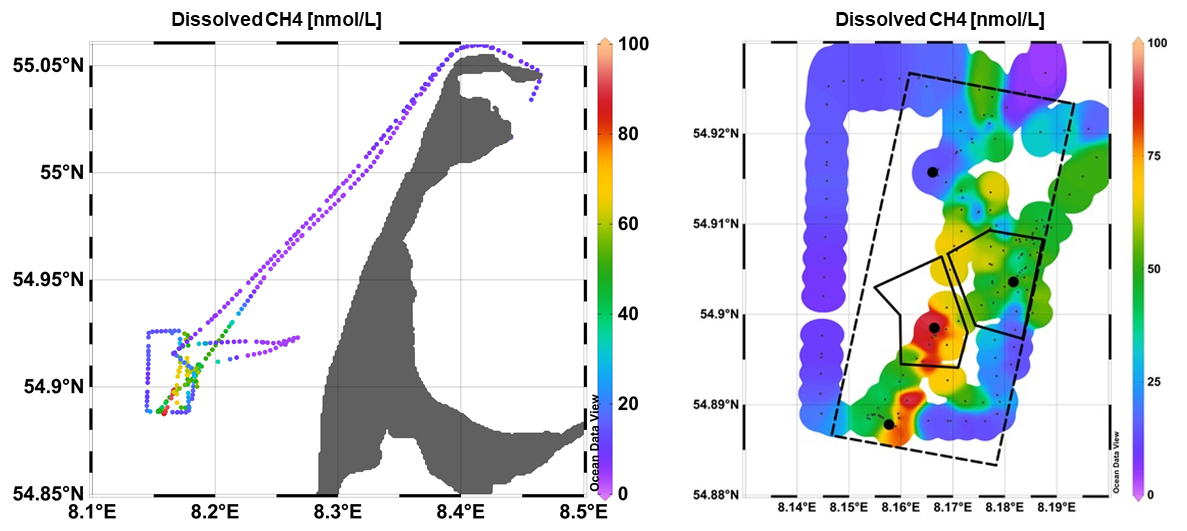
Figure 6Dissolved CH4 concentrations in surface seawater with a close up for the Westerland II-area (right side). The dots in the close up indicate the stations from Fig. 1 (Schlitzer, Reiner, Ocean Data View, https://odv.awi.de (last access: 11 March 2026).
The diffusive CH4 flux from the sea into the atmosphere is shown in Fig. 7. As the wind was rather calm on 7 July 2023, the CH4 fluxes during the transit course were also very low (3.0 ± 3.6 µmol m−2 d−1). In contrast, in the Westerland II dredging area the diffusive flux was with 45.4 ± 47.9 µmol m−2 d−1 much higher, but also very patchy. Only a few locations (4 %) had CH4 fluxes larger than 100 µmol m−2 d−1 with maximal values of 340 µmol m−2 d−1. For the whole Westerland II dredging area this results in a diffusive CH4 flux of 427 mol d−1.
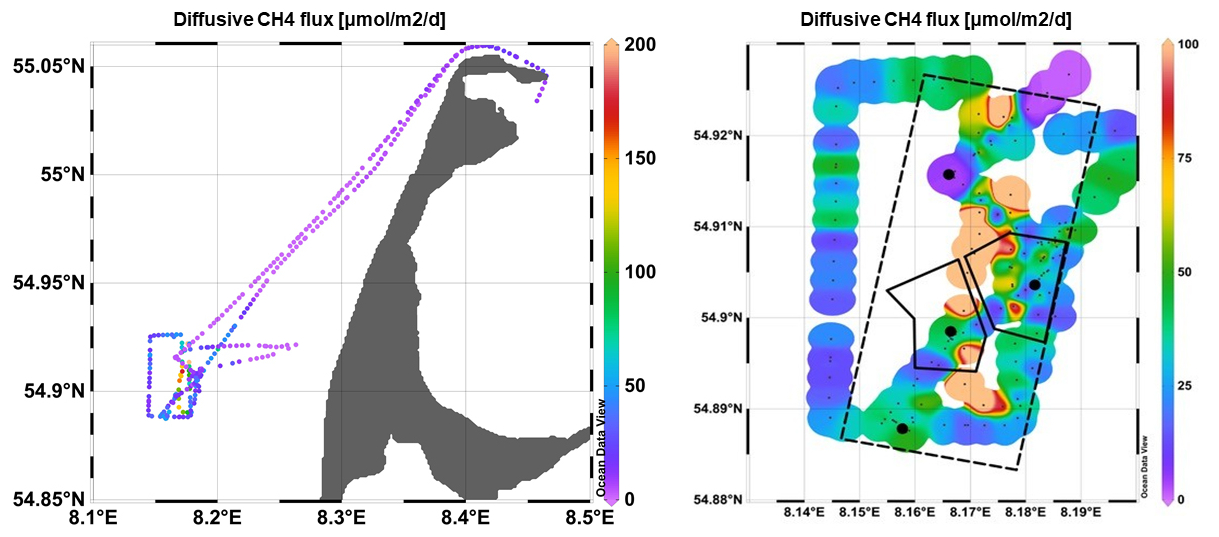
Figure 7Diffusive CH4 fluxes from surface seawater with a close up for the Westerland II -area (right side). The dots in the close up indicate the stations from Fig. 1 (Schlitzer, Reiner, Ocean Data View, https://odv.awi.de, 2024).
3.5 δ13C-CH4 and δ2H-CH4 values from surface seawater and bottom water
In addition to the dissolved CH4 concentrations, the δ13C-CH4 and δ2H-CH4 values were determined for all samples. Figure 8 shows the δ13C-CH4 and δ2H-CH4 values from surface seawater samples for the North Sea transit area (samples #9–#11) and from the Westerland II area (samples #1–#8). The δ13C-CH4 values of samples collected in the North Sea transit area varied between −49.4 ‰ and −51.3 ‰ with an average of −50.2 ± 0.9 ‰. The surface water samples within the Westerland II area showed more negative δ13C-CH4 values between −65.6 ‰ and −67.6 ‰ with an average of −66.9 ± 1.2 ‰. Only sample #5 deviated from the other Westerland II samples with a δ13C-CH4 of −42.4 ‰.
In comparison, δ2H-CH4 values from the North Sea were −242 ‰ and −304 ‰ for samples #9 and #10, respectively. In the Westerland II area, δ2H-CH4 values ranged between −199 ‰ and −227 ‰ with an average of −222 ± 9 ‰. Thus, the δ2H-CH4 values from Westerland II were more positive compared to the North Sea samples.
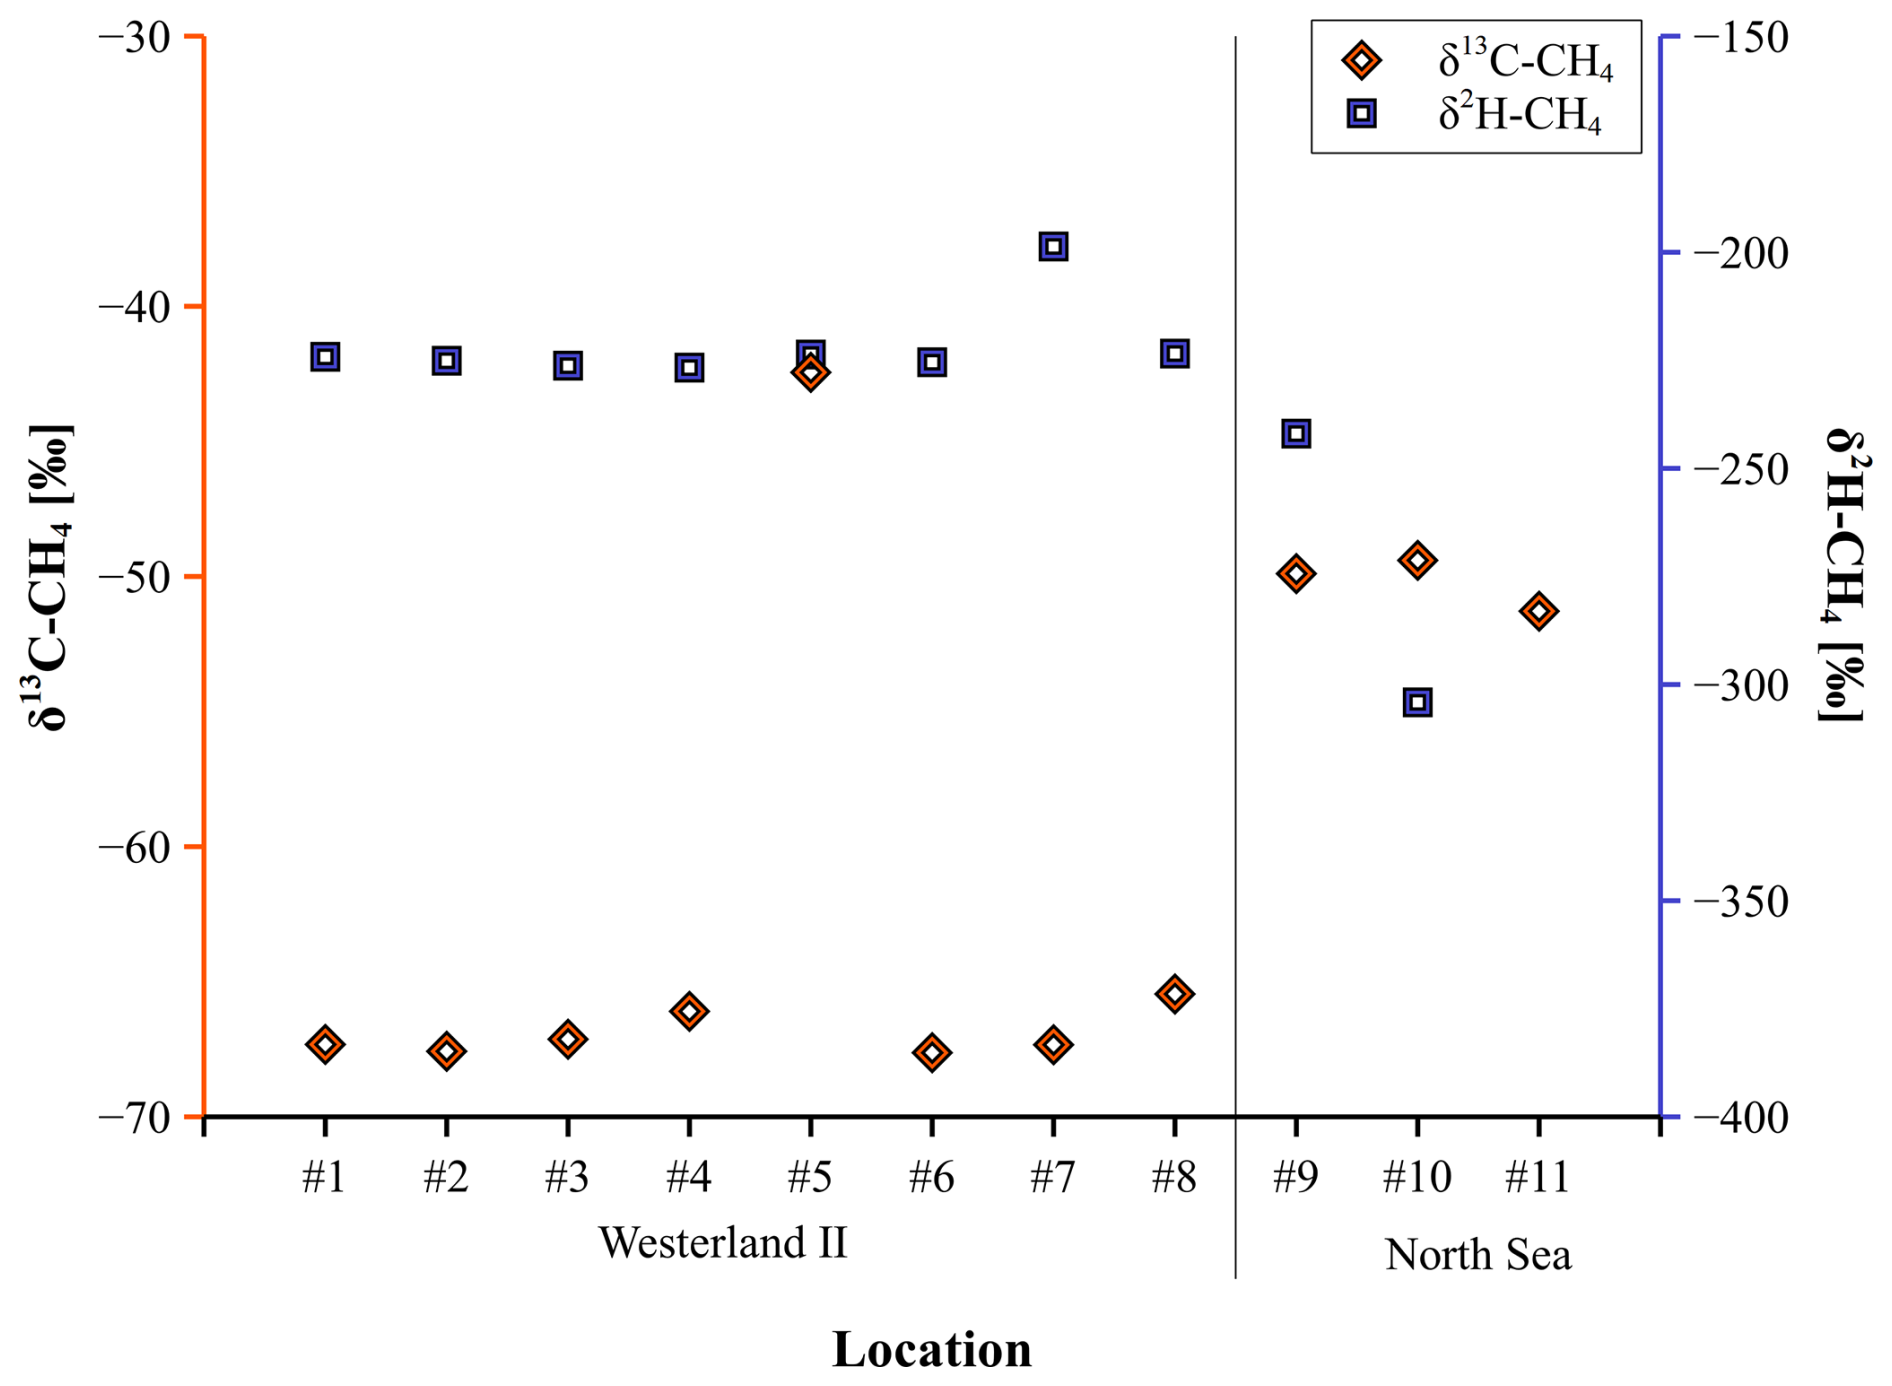
Figure 8δ13C-CH4 and δ2H-CH4 values from surface water layers sampled from spots located within the Westerland II dredging area (samples #1–#8) and outside the Westerland II area in the North Sea off the west coast of Sylt (samples #9–#11). δ13C-CH4 and δ2H-CH4 values of dissolved CH4 in water samples were analyzed as single replicates (n=1).
At four different locations within the Westerland II area (#1–#4), bottom water was sampled alongside surface water. Figure 9 shows CH4 concentrations as well as δ13C-CH4 and δ2H-CH4 values from surface and bottom water layers. A change in CH4 concentrations and stable isotope values with depth was observed in three of the investigated profiles, except for location #3, where CH4 concentrations and its stable isotope composition were similar in surface and bottom water at a depth of 27 m. At locations #1 and #2 an increase in CH4 concentrations from 58 nmol L−1 in the surface water layer to 122 ± 11 nmol L−1 at 18 m depth as well as 102 ± 5 nmol at 18.7 m (location #1) and to 110 ± 9 nmol L−1 at 24.2 m depth (location #2) was observed. At location #1, δ13C-CH4 values slightly shifted towards more negative values with increasing depth from −67.3 ‰ to −69.4 ‰, while δ2H-CH4 values slightly became more positive from −224 ‰ in the surface water layer to −215 ‰ at 18 m depth. In contrast, at location #3 the isotopic values did not show any major changes with increasing depth. A decrease in CH4 concentration with increasing depth can be observed for location #4 with 51 nmol L−1 in surface water layers and 24 ± 4 nmol L−1 at 19.6 m depth. While the δ13C-CH4 values showed no measurable changes with increasing depth, the δ2H-CH4 values shifted towards more positive values from −227 ‰ in the surface water layer to −195 ‰ at 19.6 m depth.
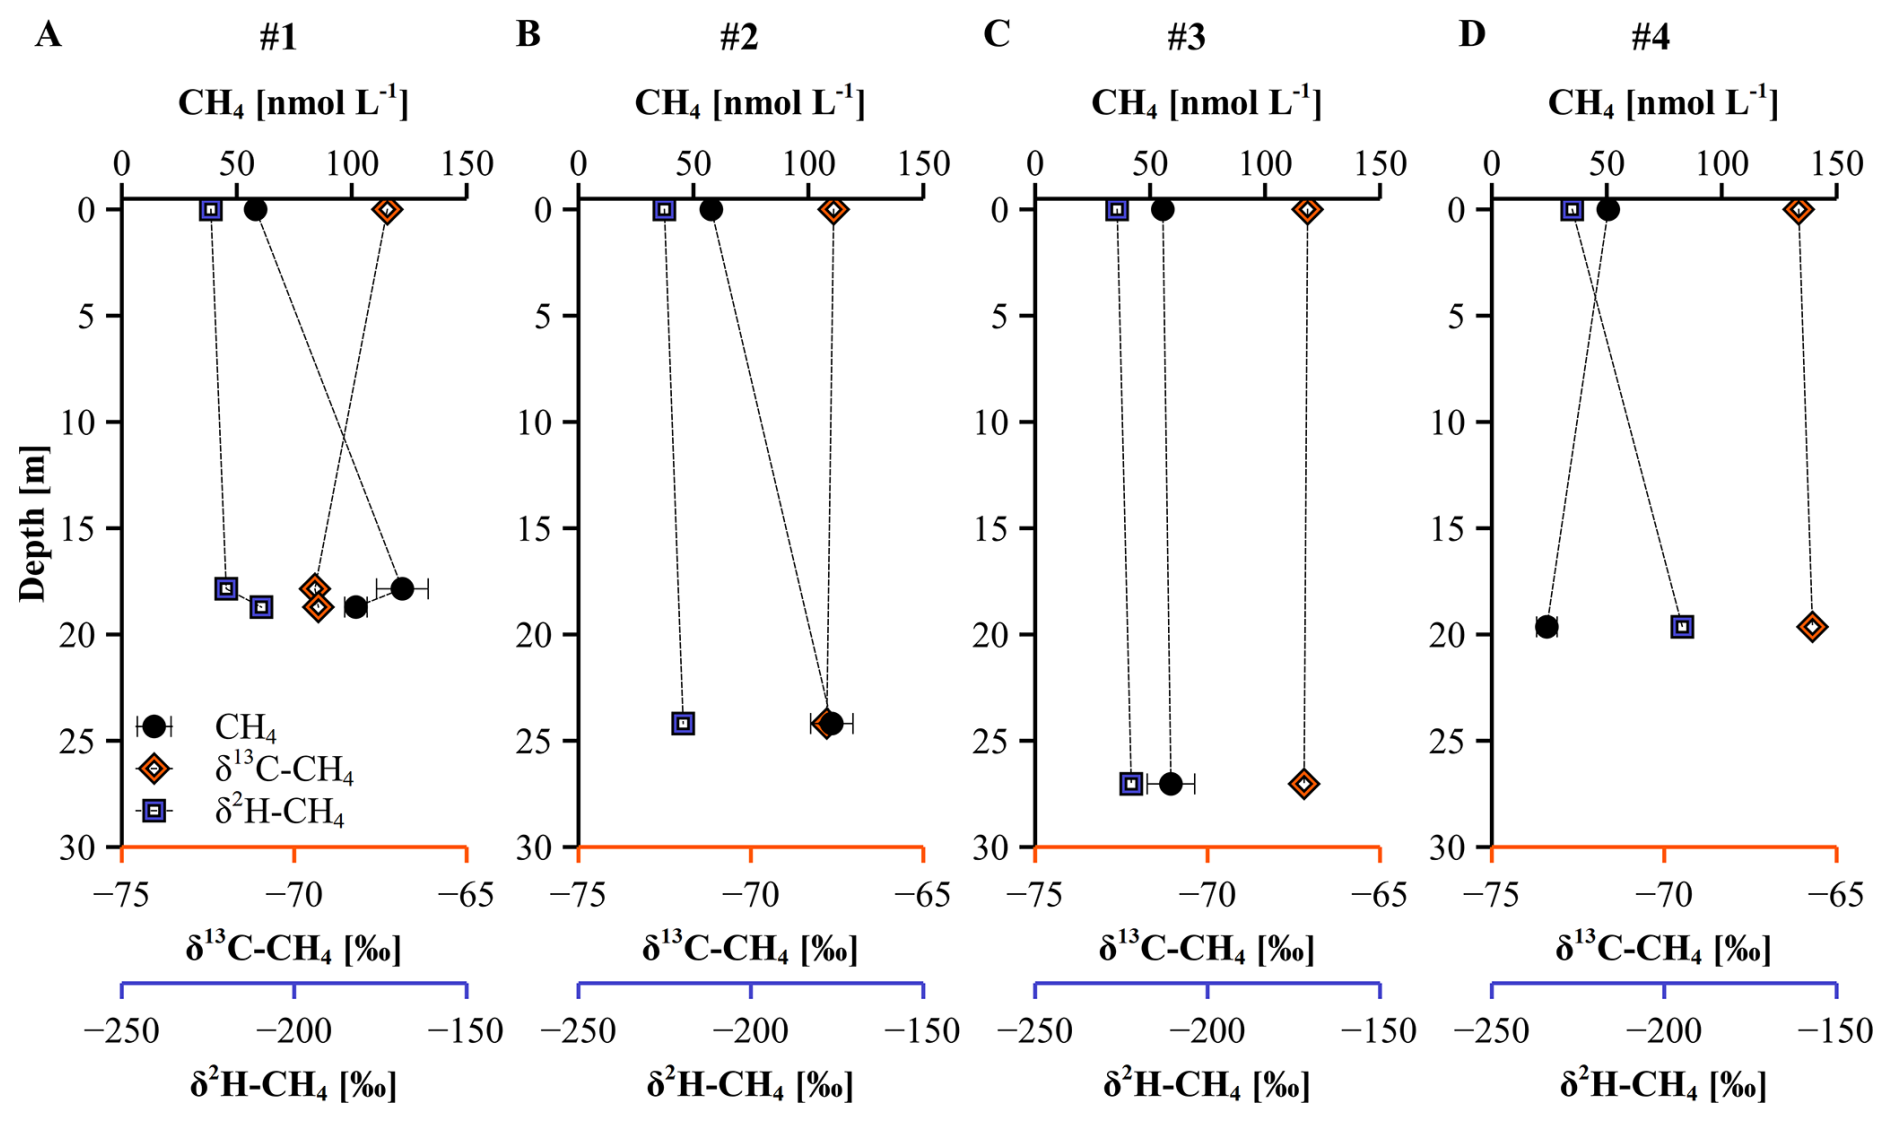
Figure 9CH4 concentrations as well as δ13C-CH4 and δ2H-CH4 values from surface and seafloor water layers sampled from spots located within the Westerland II dredging area. Surface water samples were analyzed as single replicates (n=1), whereas samples from below the water surface were measured in triplicate (n=3). Error bars show the standard deviation of the triplicate measurements.
3.6 Isotope results from atmospheric CH4 in air samples
To further investigate the specific characteristics and origin of the CH4 peaks measured in the air above the sand dredging area, seven 3 L sample bags were filled with atmospheric air during the RV Mya II cruise. Figure 10 shows the in situ atmospheric CH4 measurements (black) together with the colored data points of the bag samples. The vertical bars indicate the sampling periods. Bag HD3-52 was sampled during the transect from dredging area 1b to dredging area 1a using the hand-held line. Bags HD3-55 and HD3-54 were filled above the dredging area 1b using the mast-mounted sampling line. During the transect across the mud track generated by the actively dredging hopper dredge, two additional sampling bags were filled. The first sample (HD1-122) was collected using the mast-mounted sampling line. During a second transect, HD1-123 was taken directly over the mud track with the hand-held sampling tube. Bags HD3-56 and HD3-57 were sampled outside the dredging area and therefore represent background samples. The CH4 mole fraction of the sampled air varied between 1978 and 2085 ppb, and the δ13C-CH4 values varied between −47.5 ‰ for background samples and −48.7 ‰ above the dredging area.
The CH4 and δ13C-CH4 measurements for these seven sample bags were used to calculate the isotopic source signature using the Keeling plot method (Hoheisel et al., 2019; Hoheisel and Schmidt, 2024). In Fig. 10 (right panel), the linear regression between δ13C-CH4 and was calculated using a York fit (York et al., 2004). The isotopic source signature for δ13C-CH4 was determined to be −66 ± 6 ‰. This fits well with CH4 samples extracted from the sampled surface seawater above the dredging area with a mean isotopic signature of −66.9 ± 1.2 ‰ (see Sect. 3.5) and can be clearly distinguished from North Sea natural gas with a mean isotopic signature of −34 ‰ (Lowry et al., 2001).
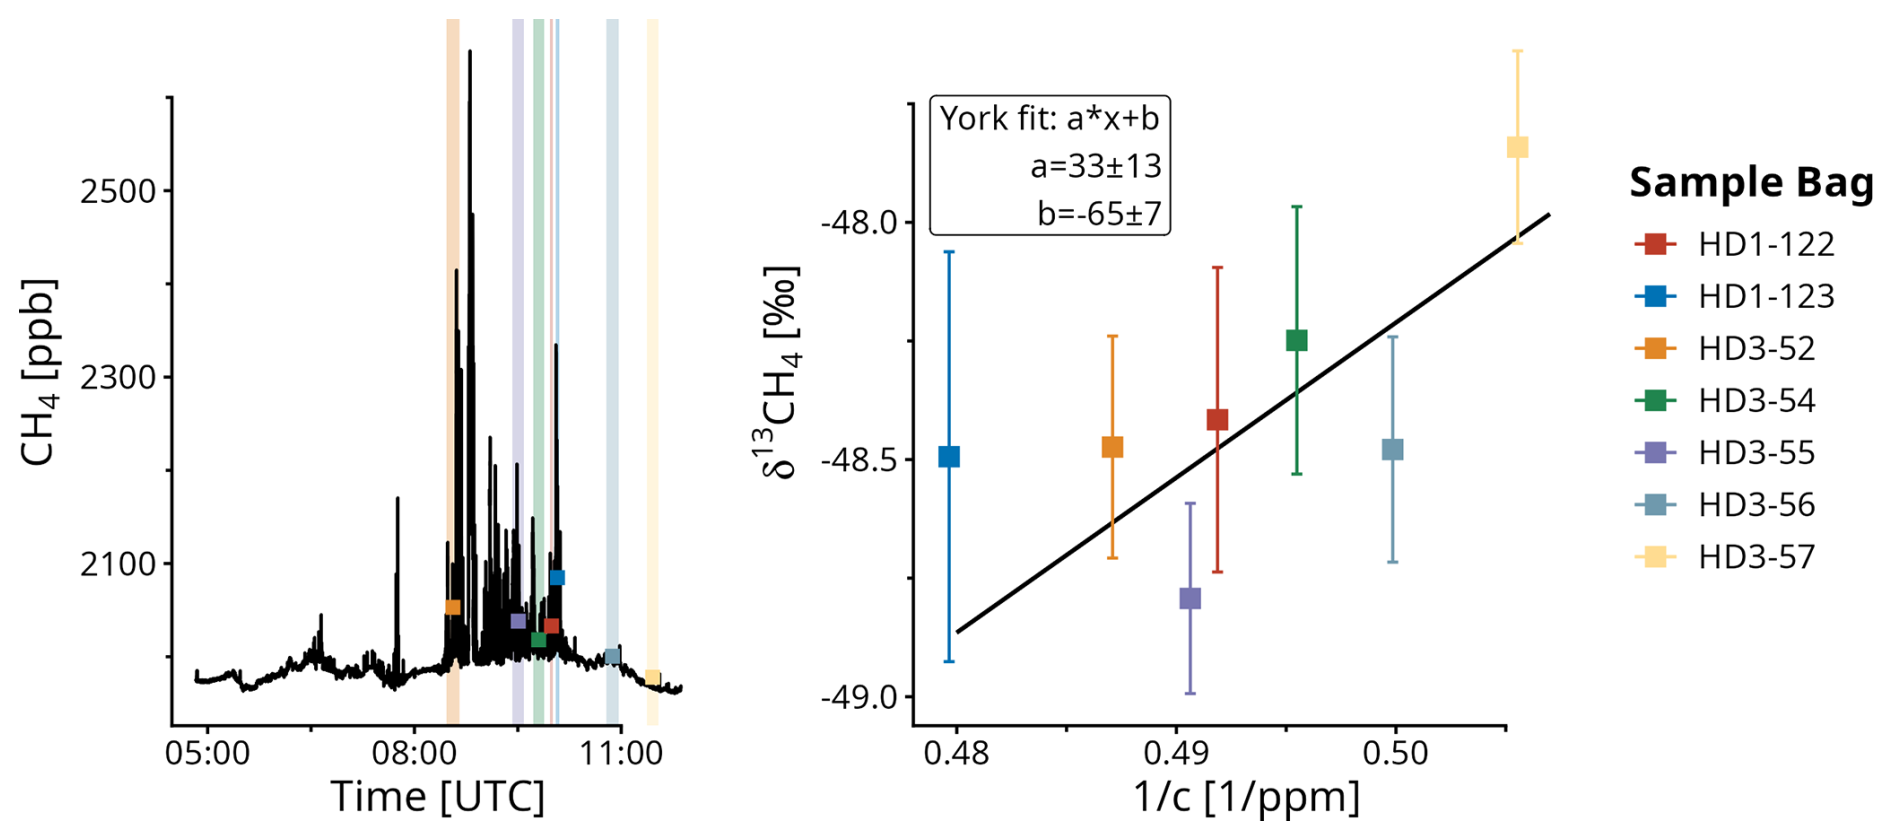
Figure 10Atmospheric CH4 mole fraction and bag samples for δ13C-CH4 analysis (left) and Keeling plot of atmospheric bag samples (right). The intercept of −66 ‰ corresponds to the isotopic source signature for δ13C-CH4.
4.1 Atmospheric CH4
Our starting point for the atmospheric and seawater measurements aboard RV Mya II are the periodically recurring CH4 peaks at Westerland atmospheric monitoring station, which were particularly pronounced during the summer months of 2022, one year before our campaign. The occurrence of these peaks during marine clean air conditions (wind from the west) calls for a more precise understanding of the origin of these CH4 peaks. Investigations in the vicinity of the station with mobile CH4 measurements have ruled out the possibility of a local natural or anthropogenic CH4 emitter between the station and the North Sea.
In addition, the tidal dependence of the peaks, only occurring at low tide, indicates that the origin of the CH4 peaks is within the North Sea. The peak shape and strength of the CH4 peaks also identify a locally concentrated emitter, i.e., a point source rather than a larger area source. The sand dredging activities in the Westerland II area, which take place in the summer months, are exactly in the wind direction that produces these CH4 peaks in the atmospheric time series of the atmospheric monitoring station Westerland. In July 2023, it was also possible to determine whether the sand dredging activities alone were responsible for the CH4 peaks or whether the beach nourishment also contributed. Atmospheric and soil chamber CH4 measurements in the vicinity of the sand nourishment area at the beach in List (Sylt West Coast) did not show a significant CH4 enhancement and are therefore not the origin of the CH4 spikes at the Westerland atmospheric station.
During the cruise with RV Mya II in July 2023, the hopper dredger Thor R was extracting sand from the seabed and depositing the sand within its hull. Elevated atmospheric CH4 concentrations were observed while circling around the vessel. The two highest atmospheric CH4 concentrations of up to 2450 ppb were measured directly in the Westerland II dredging regions 1b and 1a, where dredging was currently taking place or has taken place in recent years. The highest CH4 mole fractions were found directly at the hand inlet above a plume of suspended sediment from the hopper-dredger.
The atmospheric measurements on board RV Mya II already showed that the origin of the measured CH4 peaks is located in the Westerland II area and originates from the sand dredging activities. In 2023, CH4 spikes at the atmospheric station Westerland showed only modest enhancement, with up to 50 ppb during westerly winds, significantly lower than in 2022, when enhancements of up to 300 ppb were measured. In addition, storm Poly passed through the area just one day prior to the measurement campaign. Therefore, we did not expect very large CH4 enhancements over the dredging area during our campaign. On the 4, 6 and 7 July, shortly before and after the storm Poly, only CH4 spikes with enhancements of 11 ppb or even less than 5 ppb were monitored in the atmospheric air masses from the clean air sector. The effect of a storm on atmospheric and dissolved methane concentrations can be described in two ways. On the one hand, sediment resuspension caused by increased bottom stress from wind and waves could increase the release of methane from sediments. On the other hand, a storm can substantially increase the gas transfer velocity, thereby increasing the diffusive flux of methane out of the water. The overall effect on the atmospheric methane concentration varies depending on water depth and sediment structure. As we only observed minor enhancements, we assume that the effect of sediment resuspension was negligible.
Using a simple Gaussian plume model READY (Rolph et al., 2017), the dispersion of different CH4 fluxes in the Westerland II sand dredging area was used to calculate possible CH4 peaks at the Westerland monitoring station. With an averaged CH4 flux of 427 mol d−1 over the dredging area and the wind speed and direction measured during the campaign on 7 July 2023, only CH4 peaks of 0.15 ppb would be expected at the atmospheric station Westerland at a distance of 7 km from the dredging area. This is consistent with our atmospheric measurements at the Westerland station, which show no major peaks on the 4, 6 and 7 July 2023. For larger CH4 peaks with an enhancement of more than 15 ppb, the CH4 flux in the Westerland sand dredging area would have to be up to 45 000 mol CH4 d−1 during low tide. These temporal differences should be analyzed in more detail in a future study.
4.2 Dredging activities in the North Sea
The dredging of marine aggregates is a common practice across Europe and in the North Sea, but the distribution of active extraction sites and concession areas is far from uniform (EMODnet, 2024; Staudt et al., 2021). In the context of the German EEZ (exclusive economic zone) of the North Sea, the investigated site offshore Sylt is fairly unique and presents the only major and currently active site in the area (Schultze and Nehls, 2017). In other countries, such as Denmark or the Netherlands, similar activities do occur and are more widespread but differ in spatial distribution and intensity and require in all cases an assessment of source properties and environmental considerations (e.g., Nørgaard-Pedersen et al., 2022; van Dalfsen et al., 2000).
Studies on the influence of dredging on greenhouse gas (GHG) emissions, especially CH4 are rather ambiguous: dredging activity can reduce GHG emissions, such as in shallow lakes and watercourses (Slamet et al., 2020; Nijman et al., 2022), probably due to the removal of organic material from these systems. However, fine-grained sediments with high organic matter contents are known to be an emitter of GHG (Slamet et al., 2020; Müller et al., 2025). Currently, not much is known about the influence of dredging on GHG emissions from marine or coastal environments.
4.3 Dissolved CH4 concentration
Another source of the observed atmospheric peaks of CH4 could be related to processes within the water column. Direct investigation of CH4 concentrations within the water column revealed elevated bottom water concentrations of up to 111 nmol L−1, 2 times higher than surface water CH4 concentrations. These elevated values were restricted to the locations within the Westerland II area. Higher CH4 concentrations in bottom water were mirrored by elevated surface water concentrations of 59.1 ± 21.3 nmol L−1 (versus 5.6 ± 3.7 nmol L−1 in the transit area). With the same method dissolved CH4 concentrations have been measured in the area south of our study area. For a better comparison, only marine water samples with a salinity > 30 were used, and the riverine influence was excluded from these studies. Average dissolved CH4 concentrations ranged from 12 nmol L−1 in June 2019, 26 ± 33 nmol L−1 in September 2019 and 42 ± 63 nmol L1 in September 2020 (Bussmann et al., 2024, 2022). Thus, our CH4 concentration data from the dredging area Westerland II are within the range of the more southern areas of the North Sea, while our background concentrations were much lower, close to the equilibrium concentration of dissolved CH4 at atmospheric mixing ratios. This may be due to strong outgassing from the storm of the previous days.
In the dredging area, Westerland II, the diffusive flux from the sea into the atmosphere was approximately 15 times higher than in the surrounding area. However, the distribution of the diffusive flux was also very patchy. A general pattern between the diffusive flux and the atmospheric concentration with similarly high values in the dredging area can be found (Fig. A3). Nevertheless, a direct correlation between the diffusive flux and the atmospheric concentration is not possible on the small scale of meters due to different velocities of mixing in the atmosphere and surface water. In addition, after the heavy storm the previous days, the CH4 inventory in the water column has to be build up again.
4.4 Origin of dissolved and atmospheric CH4
At the moment it is not clear what the origin of the increased dissolved CH4 is. It could be released from the sediment by resuspension through the sucking activities of the dredging ship. Another possibility is that the created depressions at the bottom are filled up with fine sediment characterized by a higher organic matter ratio. The degradation of organic material of this sediment could lead to increased methanogenesis in these areas. High CH4 concentrations in these deposited sediments could then be released into the overlying water, resulting in the observed enrichment of CH4 in the bottom water. If very high CH4 concentrations are reached, the oversaturation may trigger ebullition, allowing CH4 to escape directly into the atmosphere with minimal interaction, such as consumption by methanotrophic bacteria in the water column (DelSontro et al., 2015; McGinnis et al., 2006). Further investigations on the CH4 distribution within the sediments could clarify this discussion.
The isotope values of CH4 in surface water between the North Sea transit and the Westerland II area differ significantly. δ13C-CH4-values from the Westerland II area were 17 ‰ more depleted in 13C-CH4 compared to the North Sea transit, while δ2H-CH4-values showed a shift towards more 2H enriched values of 20 ‰ and 83 ‰, respectively. This difference indicates CH4 contributions from different CH4 sources in the two areas. Dual isotope plots according to Whiticar (2020) were used to further constrain possible sources or pathways of CH4 formation (Fig. 11). In the marine environment, the most common sources of CH4 are either thermogenic CH4 formation or microbial methanogenesis by methanogenic archaea (Judd, 2004). The isotopic composition of microbial CH4 depends on the active methanogenic population forming CH4 either by hydrogenotrophic, acetoclastic or methylotrophic methanogenesis (Whiticar, 1999; Conrad, 2009). The δ13C- and δ2H-CH4-values of thermogenic CH4 are generally less negative than those of microbial CH4 depending on the source (e.g., Whiticar, 1999).
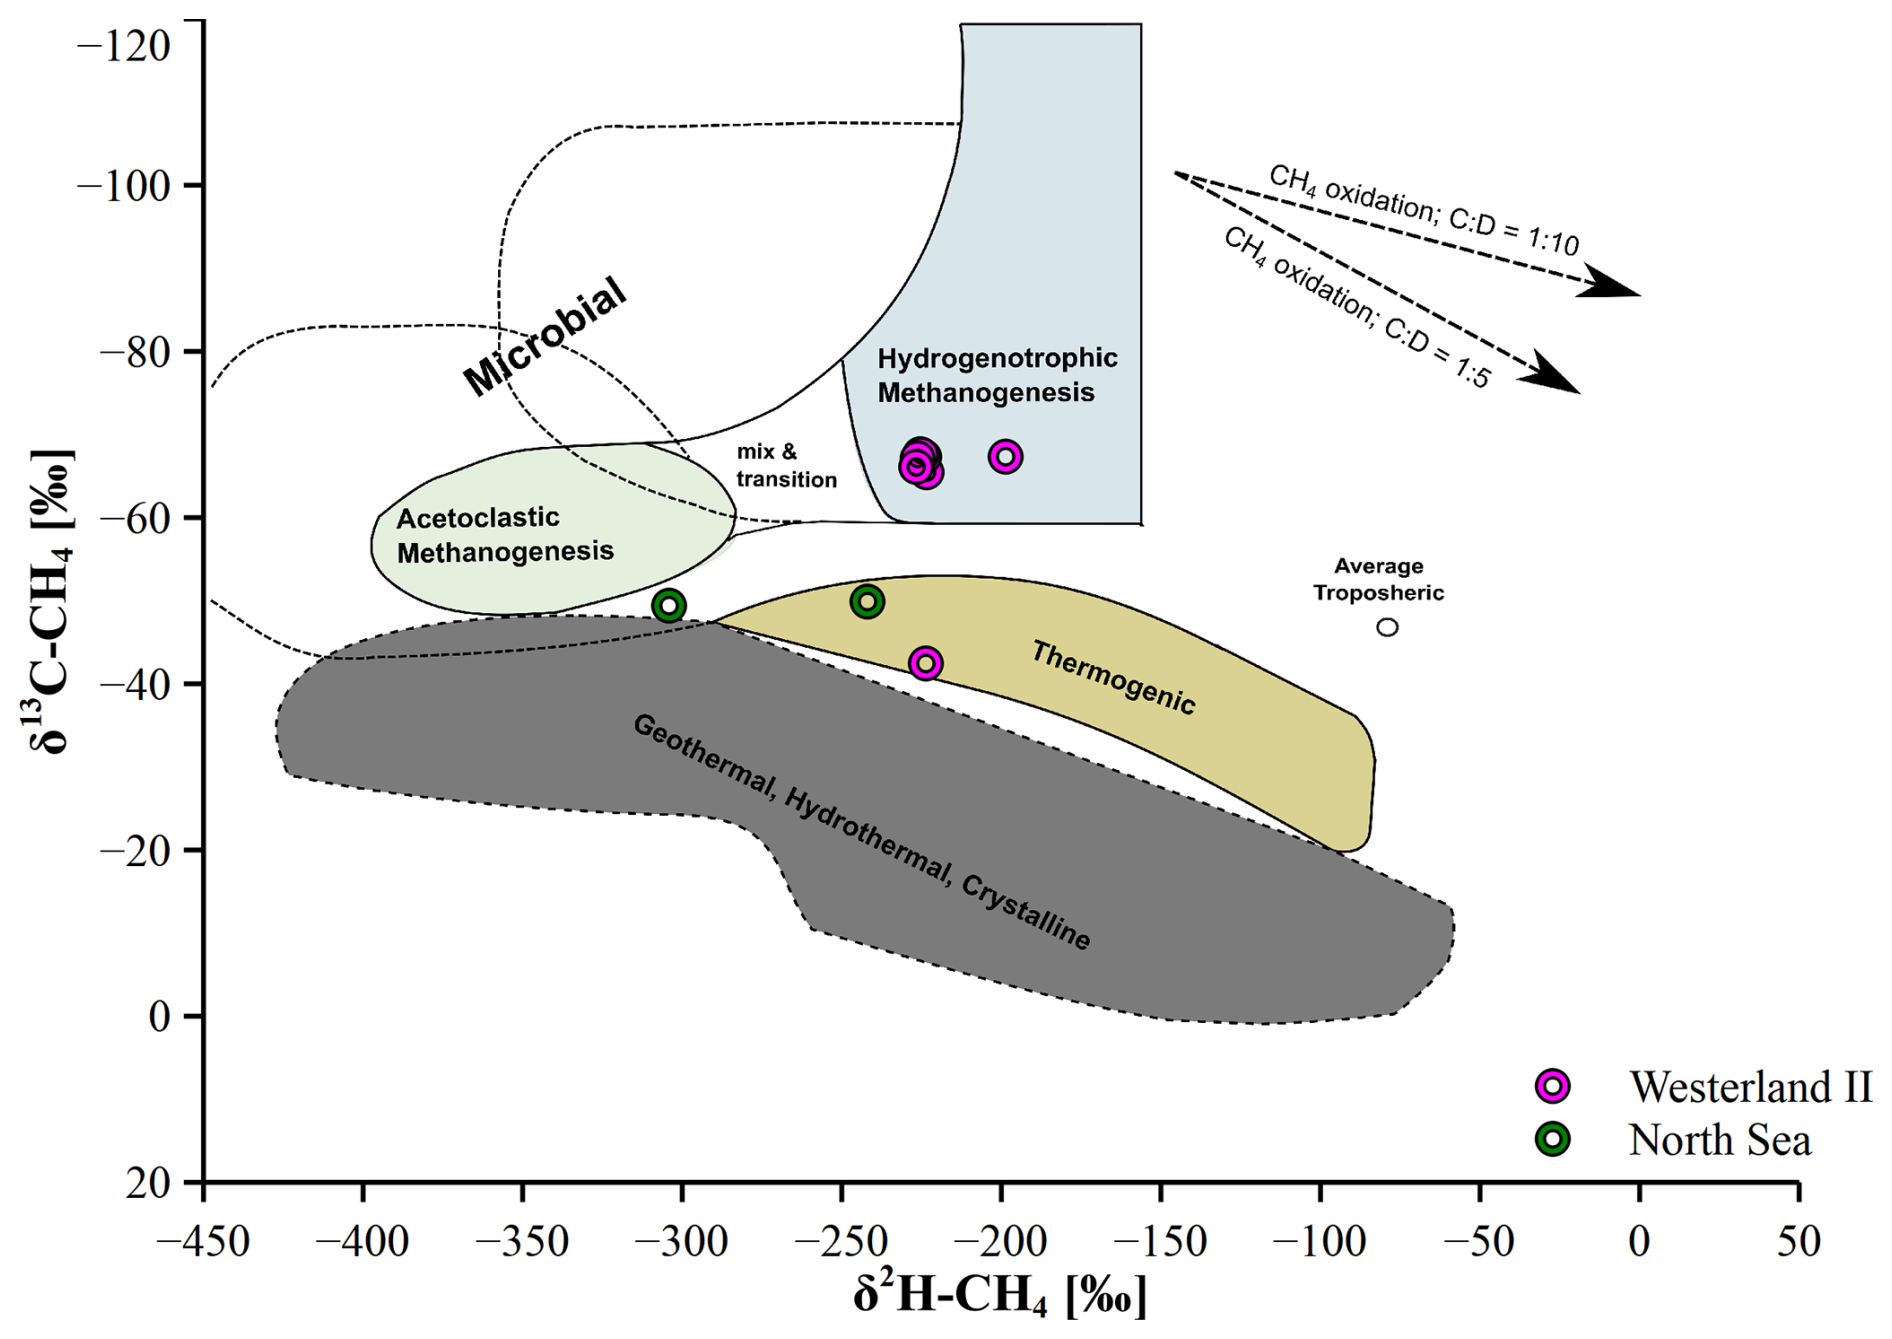
Figure 112-dimensional isotope plot of dissolved CH4 data from the Westerland II and North Sea area. Coloured areas show the classification of CH4 sources based on its stable isotope composition modified after Whiticar (2020). Dotted arrows indicate different trajectories of ratios of 13C and 2H (C:D) enrichment during CH4 oxidation.
Our data, based on stable isotope composition (Fig. 11), indicates that dissolved CH4 in the Westerland II area is of microbial origin, likely formed by hydrogenotrophic methanogenesis. Site #5, located at the edge of the area, is an exception with more positive δ13C-CH4 values, though δ2H-CH4 values remain unaffected. In contrast, stable isotope values from the North Sea transit samples do not clearly indicate a specific CH4 source, possibly due to aerobic CH4 oxidation and/or a mix of different sources.
Mau et al. (2017) observed δ13C-CH4 values ranging from −60.1 ‰ to −23.4 ‰ in seepage along the Svalbard continental margin, attributing the variability to mixing with background CH4 or aerobic microbial oxidation. In our study, ocean currents likely have little effect due to the small-scale observation area. The δ13C-CH4 enrichment in the North Sea may reflect microbial CH4 consumption, preferentially degrading 12C-CH4. CH4 oxidation in the North Sea is limited by concentration and nutrients (Hackbusch et al., 2019). Further studies should explore if dredging or benthic methanotroph inoculation (Schmale et al., 2015) could increase CH4 oxidation rates.
The more positive δ13C-CH4 values in the North Sea could also be due to another source. Klintzsch et al. (2023) found that phytoplankton, including marine algae and cyanobacteria, produce CH4 with δ13C-CH4 values ranging from −50 ‰ to −20 ‰, differing from classical methanogenesis by methanogens. However, algal blooms were observed only on the surface in the Westerland II area, excluding phytoplankton as a substantial CH4 source. Therefore, CH4 oxidation is the most probable cause for the North Sea sites. The δ2H-CH4 values generally exhibit greater variability due to kinetic fractionation effects associated with CH4 production and oxidation. This could explain the large discrepancy between the δ2H-CH4 values of site #9 and #10 outside the Westerland II area compared to the less negative δ2H-CH4 values within this area, though a larger sample size should be targeted in future studies for more robust comparisons between the two areas.
The surface and bottom water profiles of dissolved CH4 concentrations and stable isotopes (Fig. 9) provide key insights into the origin of increased CH4 concentrations in the Westerland II area. At location #4, CH4 concentrations decreased with depth while δ13C-CH4 and δ2H-CH4 values changed towards more positive values. This pattern may reflect several processes. While CH4 oxidation could contribute to the isotopic enrichment of the residual CH4 pool, mixing or exchange with water masses influenced by different CH4 sources and thus characterized by different isotopic values of CH4 or a higher degree of prior CH4 oxidation may equally explain the observed concentration and isotopic gradients. At locations #1 and #2, CH4 concentrations nearly doubled at the bottom, but stable isotopes remained unchanged, indicating methanogenic CH4, likely from dredging or diffusion at the sediment-water interface. A similar pattern was observed at location #3, though recent dredging and the storm Poly may have evenly distributed the CH4 throughout the water column.
This study investigates the role of sand dredging activities and associated changes to the seafloor environment in the North Sea in the North Sea for the local production of CH4. During summer 2022, an unusually high number of large CH4 spikes were observed at the atmospheric station Westerland (Sylt) under westerly wind conditions, whereas in 2023, only a few smaller CH4 spikes were detected. In the course of the ship campaign only very low CH4 spikes (1–5 ppb) or none at all, were measured on land at the atmospheric station Westerland, despite prevailing westerly wind. This suggests that the observed atmospheric CH4 enhancements in the dredging area of up to 450 ppb CH4 correspond to rather low values. Such atmospheric measurements in combination with an atmospheric transport model can be used to assess the year-to-year variation of CH4 emissions from the dredging area.
The calculated CH4 flux for the region is 45.4 ± 47.9 µmol m−2 d−1, with a maximum of 340 µmol m−2 d−1, totaling approximately 427 mol d−1 for the entire area. While this flux corresponds with the smaller peaks measured at the Westerland atmospheric station, it cannot explain the significantly larger peaks observed in summer 2022. Additionally, a severe storm prior to our cruise likely led to considerable degassing throughout the area, reinforcing the idea that dredging serves as a concentrated point source of dissolved CH4.
Isotope analyses of CH4 dissolved in surface water and from atmospheric sampling indicate that the elevated CH4 levels in the Westerland dredging area have a microbial origin. Therefore, we exclude the possibility of a thermogenic CH4 source from natural gas extraction.
Based on our observations, there is a clear spatial correlation and conceptual connection between the measured local increase in CH4 and the dredging activities, but further investigation will be necessary to precisely identify the acting processes of methanogenesis and the pathways of methane release from the sediment. To fully assess the temporal dynamics and potential magnitude of CH4 emissions from dredging areas, continued monitoring is essential. Planned follow-up will provide valuable insight into the relationship between dredging, environmental conditions, and CH4 release. Due to the frequency of dredging operations and their potential impact on regional GHG budgets, more investigations are necessary to improve our understanding on the importance and magnitude of anthropogenic CH4 sources in coastal environments.
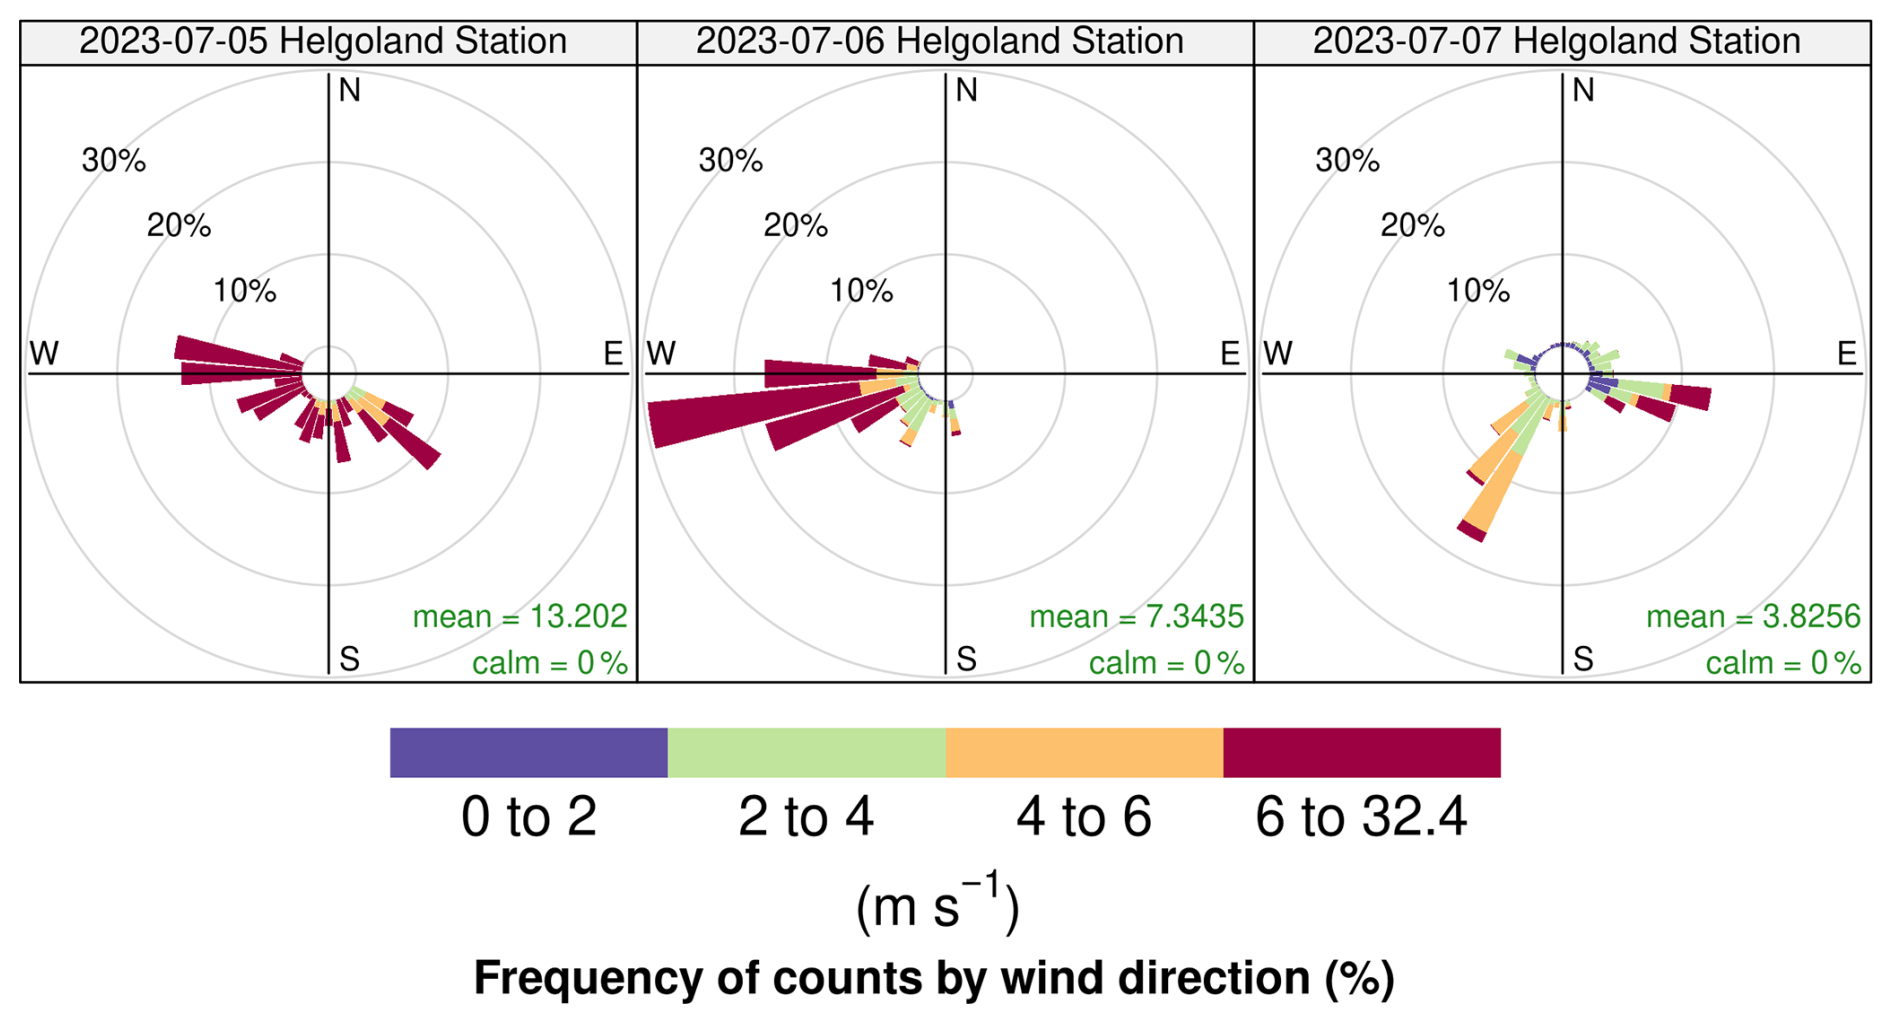
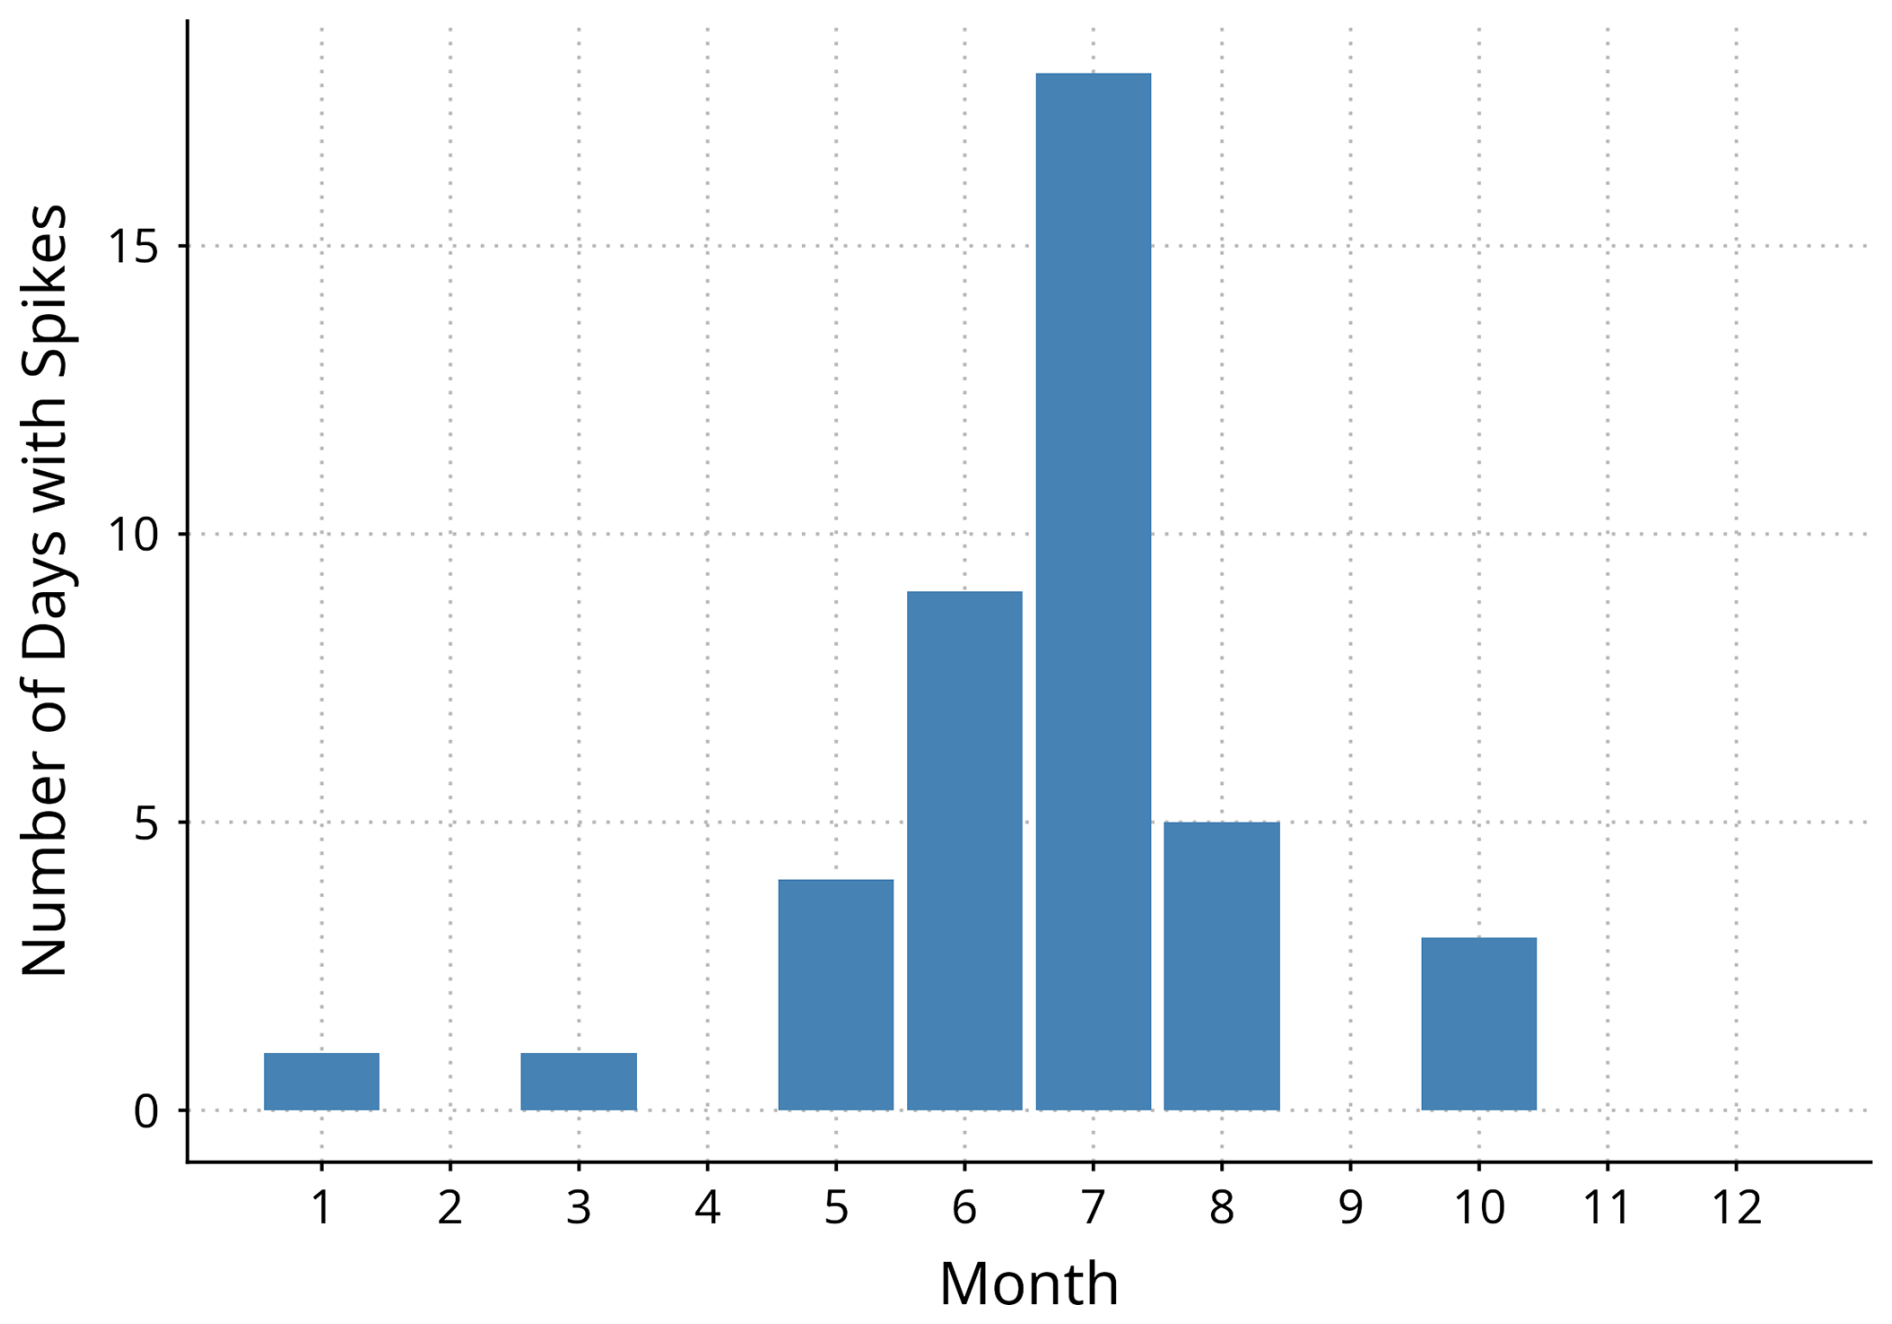
Figure A2Histogram of number of days with CH4 spikes at Westerland station per month in 2022.
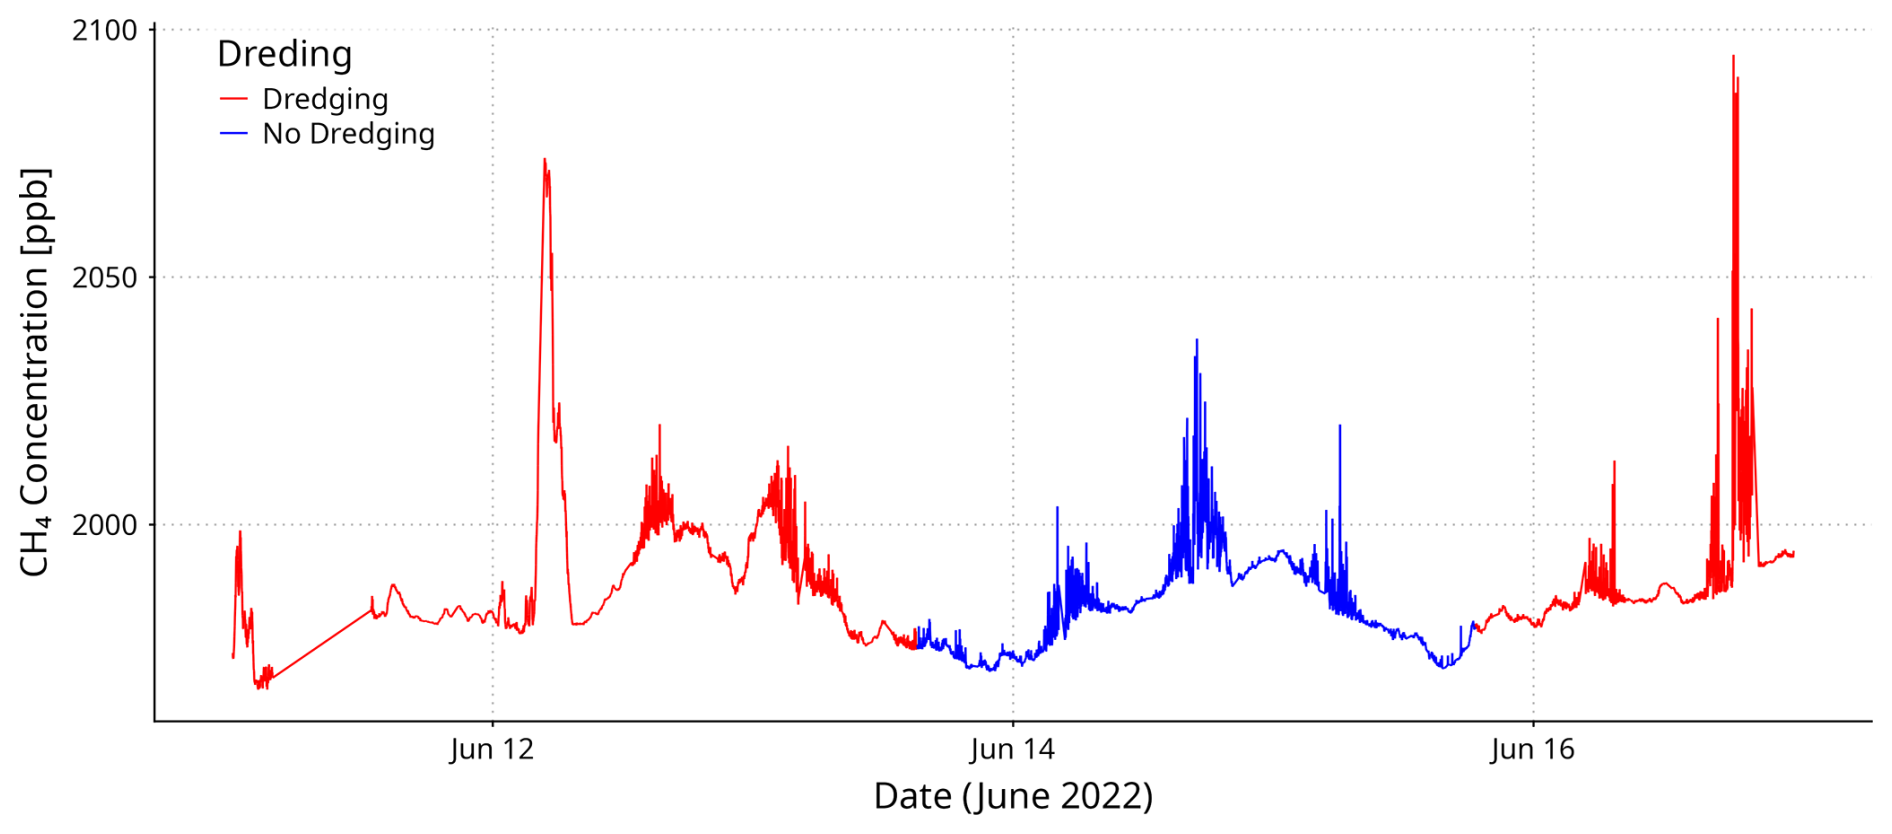
Figure A3CH4 mole fractions of a typical summer period (10th to 17 June 2022). Between 13 and 15 June the when dredging operations paused for two days (blue), the CH4 peaks continued to follow the usual tidal pattern.
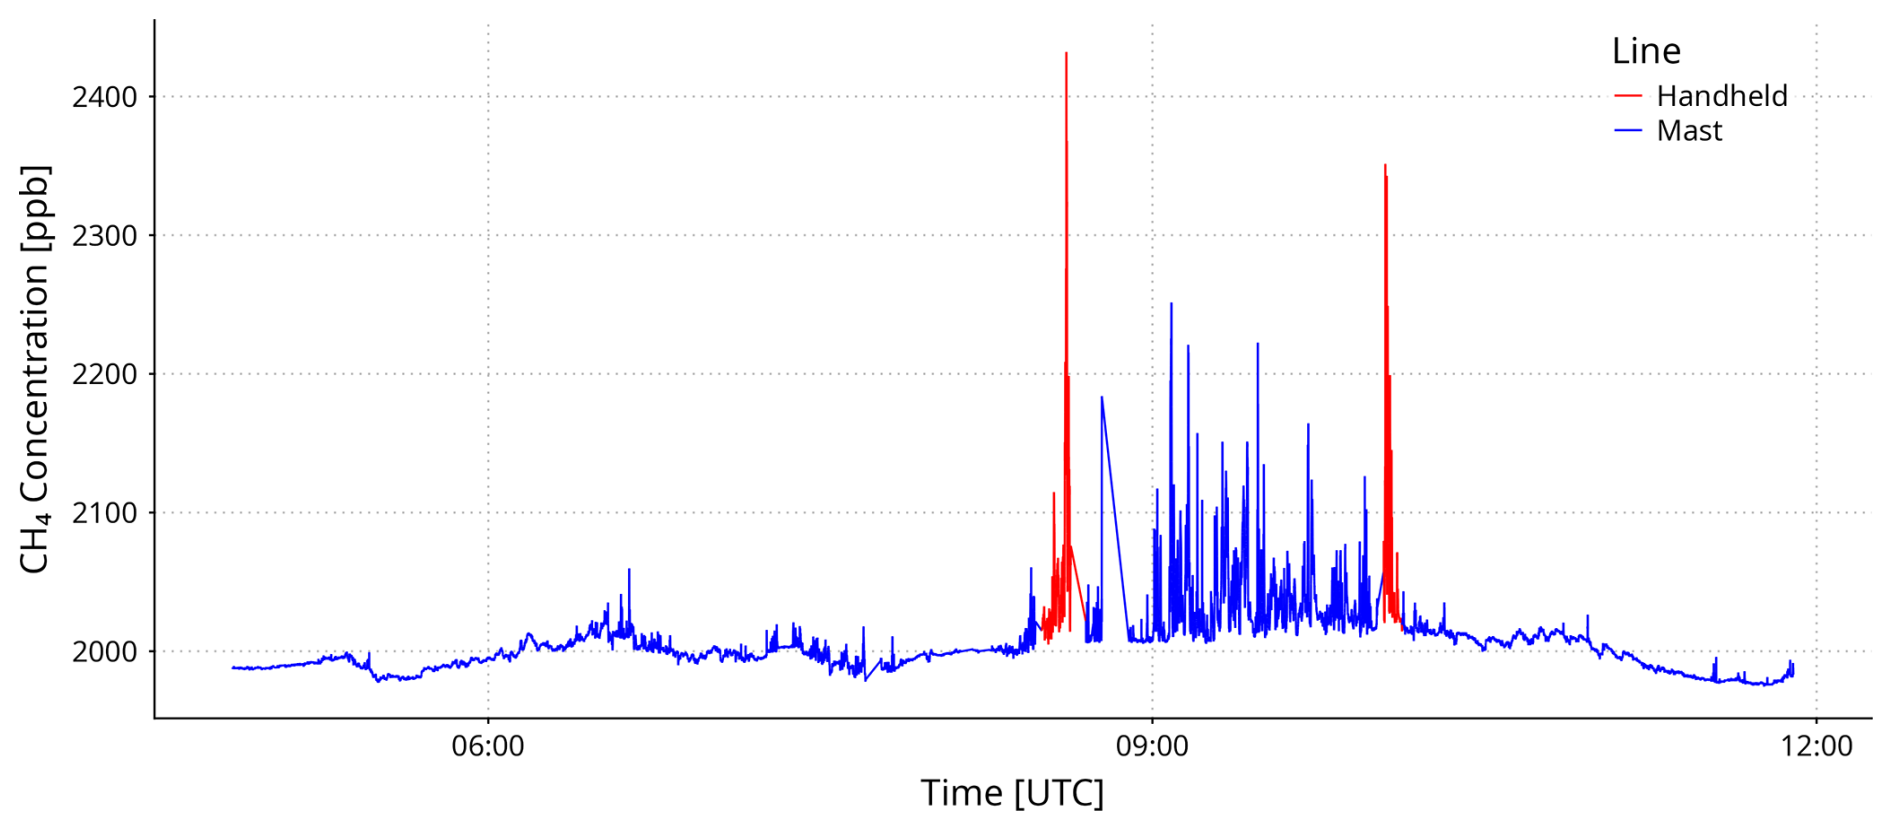
Figure A4Time series of atmospheric measurements onboard of Mya II. The blue line indicates the sampling height on the top of the mast and the red line measurements with the hand-held close to the sea level.
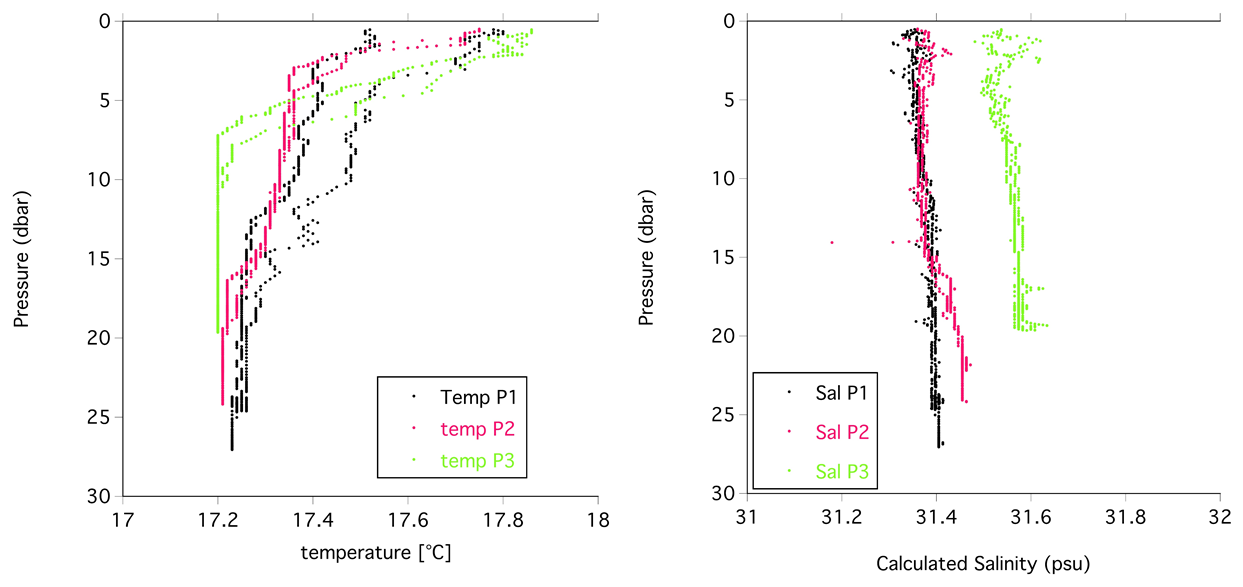
Figure A5CTD profile showing the temperature and the salinity during the RV Mya II campaign.
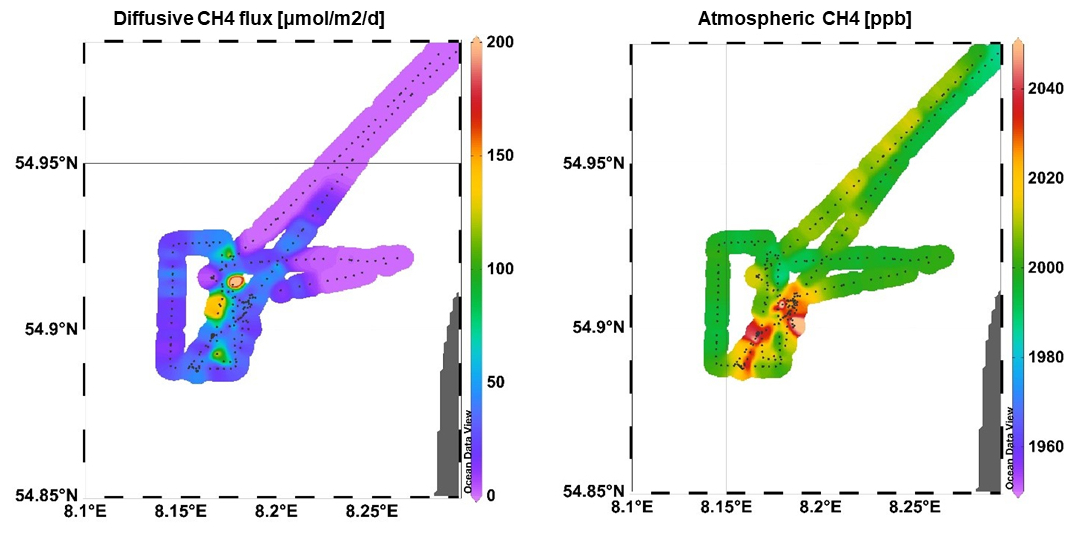
Figure A6Comparison of diffusive CH4 flux and the atmospheric CH4 concentration during RV Mya II campaign (Schlitzer, Reiner, Ocean Data View, https://odv.awi.de, 2024).
Atmospheric CH4 data from the Westerland monitoring station are available through the ICOS Carbon Portal Database (Couret and Schmidt, 2026): https://hdl.handle.net/11676/FfF9lAK8yXSH1Bqa7r2Acpbu.
Atmospheric CH4 measurements collected during the MYA II campaign (7 July 2023), bag-sample measurements for atmospheric δ13C-CH4 analysis, and the data underlying Figs. 8, 9, and 11 are available via HeiDATA (Schmidt et al., 2026): https://doi.org/10.11588/DATA/SEQZGB.
Measurements of dissolved CH4 in the water column collected during the MYA II campaign (7 July 2023) are available through PANGAEA (Bussmann, 2026): https://doi.org/10.1594/PANGAEA.995741.
MaS, IB, LS and FK designed the study, and planned the cruises. IB carried out the in-situ measurements of dissolved CH4 in the water column and the corresponding data analysis and interpretation. MoS and AP collected the samples in the field. AP conducted the laboratory analyses and, together with FK, DP, and MoS, analyzed the data. SJER and JBW carried out the atmospheric CH4 measurements onboard RV Mya II. CC is responsible for the atmospheric CH4 measurements at Westerland station. SJER performed the data analysis of Westerland station data. MaS prepared the manuscript with contributions from all co-authors.
The contact author has declared that none of the authors has any competing interests.
Publisher's note: Copernicus Publications remains neutral with regard to jurisdictional claims made in the text, published maps, institutional affiliations, or any other geographical representation in this paper. The authors bear the ultimate responsibility for providing appropriate place names. Views expressed in the text are those of the authors and do not necessarily reflect the views of the publisher.
We would like to thank to the crew of RV Mya II for their assistance during the cruise as well as Norbert Frank and Till Gonser (IUP Heidelberg University) for helping on-board.
The measuring campaigns at Westerland station, and their analysis were funded by the Project 167847 with the German Environment Agency (UBA).
This paper was edited by Mark Lever and reviewed by two anonymous referees.
Affolter, S., Schibig, M., Berhanu, T., Bukowiecki, N., Steinbacher, M., Nyfeler, P., Hervo, M., Lauper, J., and Leuenberger, M.: Assessing local CO2 contamination revealed by two near-by high altitude records at Jungfraujoch, Switzerland, Environ. Res. Lett., 16, https://doi.org/10.1088/1748-9326/abe74a, 2021.
Borges, A. V., Royer, C., Martin, J. L., Champenois, W., and Gypens, N.: Response of marine methane dissolved concentrations and emissions in the Southern North Sea to the European 2018 heatwave, Cont. Shelf Res., 190, https://doi.org/10.1016/j.csr.2019.104004, 2019.
BSH: Umweltbericht zum Raumordnungsplan für die deutsche ausschließliche Wirtschaftszone in der Nordsee, https://www.bsh.de/DE/THEMEN/Offshore/Meeresraumplanung/Raumordnungsplan_2021/_Anlagen/Downloads/Umweltbericht_Nordsee_Endfassung.pdf;jsessionid=8C5252FD9F31DE012EF764EB3A08A156.live21304?__blob=publicationFile&v=6 (last access: 30 October 2024), 2021.
BSH, German Federal Maritime and Hydrographic Agency: Meeresboden DGM, http://www.geoseaportal.de/, last access: 12 September 2025.
Bussmann, I.: Dissolved methane concentration and diffusive flux near Sylt, North Sea in summer 2023, PANGAEA [data set], https://doi.org/10.1594/PANGAEA.995741, 2026.
Bussmann, I., Brix, H., Flöser, G., Ködel, U., and Fischer, P.: Detailed Patterns of Methane Distribution in the German Bight, Front. Mar. Sci., 8, https://doi.org/10.3389/fmars.2021.728308, 2021.
Bussmann, I., Koedel, U., Schüze, C., Kamjunke, N., and Koschorreck, M.: Spatial Variability and Hotspots of Methane Concentrations in a Large Temperate River, Front. Env. Sci.-Switz., 10, 833936, https://doi.org/10.3389/fenvs.2022.833936, 2022.
Bussmann, I., Achterberg, E. P., Brix, H., Brüggemann, N., Flöser, G., Schütze, C., and Fischer, P.: Influence of wind strength and direction on diffusive methane fluxes and atmospheric methane concentrations above the North Sea, Biogeosciences, 21, 3819–3838, https://doi.org/10.5194/bg-21-3819-2024, 2024.
Conrad, R.: The global methane cycle: recent advances in understanding the microbial processes involved, Env. Microbiol. Rep., 1, 285–292, https://doi.org/10.1111/j.1758-2229.2009.00038.x, 2009.
Couret, C. and Schmidt, M.: ICOS ATC CH4 Release from Westerland (14.0 m), 2021-07-23–2026-03-31, ICOS RI, https://hdl.handle.net/11676/FfF9lAK8yXSH1Bqa7r2Acpbu, last access: 29 June 2026.
Cunnold, D. M., Steele, L. P., Fraser, P. J., Simmonds, P. G., Prinn, R. G., Weiss, R. F., Porter, L. W., O'Doherty, S., Langenfelds, R. L., Krummel, P. B., Wang, H. J., Emmons, L., Tie, X. X., and Dlugokencky, E. J.: In situ measurements of atmospheric methane at GAGE/AGAGE sites during 1985-2000 and resulting source inferences, J. Geophys. Res.-Atmos., 107, 4225, https://doi.org/10.1029/2001jd001226, 2002.
DelSontro, T., McGinnis, D. F., Wehrli, B., and Ostrovsky, I.: Size Does Matter: Importance of Large Bubbles and Small-Scale Hot Spots for Methane Transport, Environ. Sci. Technol., 49, 1268–1276, https://doi.org/10.1021/es5054286, 2015.
DGM-W: 2020 Wattenmeer Schleswig-Holstein, https://www.kuestendaten.de (last access: 12 September 2025), 2020.
DWD: Bilanz zu Sturmtief “POLY”: https://www.dwd.de/DE/wetter/thema_des_tages/2023/7/6.html (last access: 11 October 2024), 2023.
Einzmann, T., Schroll, M., Kleint, J. F., Greule, M., and Keppler, F.: Application of concentration and 2-dimensional stable isotope measurements of methane to constrain sources and sinks in a seasonally stratified freshwater lake, Front. Env. Sci.-Switz., 10, 865862, https://doi.org/10.3389/fenvs.2022.865862, 2022.
El Yazidi, A., Ramonet, M., Ciais, P., Broquet, G., Pison, I., Abbaris, A., Brunner, D., Conil, S., Delmotte, M., Gheusi, F., Guerin, F., Hazan, L., Kachroudi, N., Kouvarakis, G., Mihalopoulos, N., Rivier, L., and Serça, D.: Identification of spikes associated with local sources in continuous time series of atmospheric CO, CO2 and CH4, Atmos. Meas. Tech., 11, 1599–1614, https://doi.org/10.5194/amt-11-1599-2018, 2018.
EMODnet: EMODnet Human Activities – Aggregate Extraction, https://emodnet.ec.europa.eu/en/human-activities (last access: 15 July 2026), 2024.
EUMETSAT: Storm Poly, https://user.eumetsat.int/resources/case-studies/storm-poly (last access: 11 October 2024), 2023.
Figge, K., Zeiler, M., Griewatsch, K., Mittelstaedt, E., Klein, H., Schwarzer, K., and Diesing, M.: Regenerierung von Materialentnahmestellen in Nord- und Ostsee. Abschlussbericht, KFKI-Projekt, FKZ 03KIS008, Bundesamt für Seeschifffahrt und Hydrographie (BSH), 94, 2002.
Hackbusch, S., Wichels, A., and Bussman, I.: Abundance, activity and diversity of methanotrophic bacteria in the Elbe Estuary and southern North Sea, Aquat. Microb. Ecol., 83, 35–48, https://doi.org/10.3354/ame01899, 2019.
Heiskanen, J., Brümmer, C., Buchmann, N., Calfapietra, C., Chen, H. L., Gielen, B., Gkritzalis, T., Hammer, S., Hartman, S., Herbst, M., Janssens, I. A., Jordan, A., Juurola, E., Karstens, U., Kasurinen, V., Kruijt, B., Lankreijer, H., Levin, I., Linderson, M. L., Loustau, D., Merbold, L., Myhre, C. L., Papale, D., Pavelka, M., Pilegaard, K., Ramonet, M., Rebmann, C., Rinne, J., Rivier, L., Saltikoff, E., Sanders, R., Steinbacher, M., Steinhoff, T., Watson, A., Vermeulen, A. T., Vesa, A. T., Vítková, G., and Kutsch, W.: The Integrated Carbon Observation System in Europe, B. Am. Meteorol. Soc., 103, E855–E872, https://doi.org/10.1175/Bams-D-19-0364.1, 2022.
Hoheisel, A. and Schmidt, M.: Six years of continuous carbon isotope composition measurements of methane in Heidelberg (Germany) – a study of source contributions and comparison to emission inventories, Atmos. Chem. Phys., 24, 2951–2969, https://doi.org/10.5194/acp-24-2951-2024, 2024.
Hoheisel, A., Yeman, C., Dinger, F., Eckhardt, H., and Schmidt, M.: An improved method for mobile characterisation of δ13CH4 source signatures and its application in Germany, Atmos. Meas. Tech., 12, 1123–1139, https://doi.org/10.5194/amt-12-1123-2019, 2019.
Hoheisel, A., Couret, C., Hellack, B., and Schmidt, M.: Comparison of atmospheric CO, CO2 and CH4 measurements at the Schneefernerhaus and the mountain ridge at Zugspitze, Atmos. Meas. Tech., 16, 2399–2413, https://doi.org/10.5194/amt-16-2399-2023, 2023.
IPCC: Climate Change 2021 – The Physical Science Basis: Working Group I Contribution to the Sixth Assessment Report of the Intergovernmental Panel on Climate Change, Cambridge University Press, Cambridge, https://doi.org/10.1017/9781009157896, 2023.
Judd, A. G.: Natural seabed gas seeps as sources of atmospheric methane, Environ. Geol., 46, 988–996, https://doi.org/10.1007/s00254-004-1083-3, 2004.
Klintzsch, T., Geisinger, H., Wieland, A., Langer, G., Nehrke, G., Bizic, M., Greule, M., Lenhart, K., Borsch, C., Schroll, M., and Keppler, F.: Stable Carbon Isotope Signature of Methane Released From Phytoplankton, Geophys. Res. Lett., 50, https://doi.org/10.1029/2023gl103317, 2023.
Lan, X., Nisbet, E. G., Dlugokencky, E. J., and Michel, S. E.: What do we know about the global methane budget? Results from four decades of atmospheric CH4 observations and the way forward, Philos. T. R. Soc. A, 379, 20200440, https://doi.org/10.1098/rsta.2020.0440, 2021.
Lan, X., Thoning, K. W. and Dlugokencky, E. J.: Trends in globally-averaged CH4, N2O, and SF6, NOAA Global Monitoring Laboratory measurements [data set], https://doi.org/10.15138/P8XG-AA10, 2024.
Levin, I., Graul, R., and Trivett, N. B. A.: Long-Term Observations of Atmospheric CO2 and Carbon Isotopes at Continental Sites in Germany, Tellus B, 47, 23–34, https://doi.org/10.1034/j.1600-0889.47.issue1.4.x, 1995.
LKN.SH: Küstenschutz auf Sylt Sandaufspülungen 2022, https://www.schleswig-holstein.de/DE/landesregierung/ministerien-behoerden/LKN/Service/Downloads/faltblattKuestenschutzSyltSand2022.pdf?blob=publicationFile&v=1 (last access: 7 October 2024), 2022.
LKN.SH: Sandaufspülungen 2024, https://www.schleswig-holstein.de/DE/fachinhalte/K/kuestenschutz_fachplaene/2_Sylt/3_bishKuestenschutz/Downloads/Flyer_Aufspuelungen_Sylt_2024.pdf?blob=publicationFile&v=1 (last access: 30 September 2025), 2024.
Lowry, D., Holmes, C. W., Rata, N. D., O'Brien, P., and Nisbet, E. G.: London methane emissions: Use of diurnal changes in concentration and δ13C fo identify urban sources and verify inventories, J. Geophys. Res.-Atmos., 106, 7427–7448, https://doi.org/10.1029/2000jd900601, 2001.
Magen, C., Lapham, L. L., Pohlman, J. W., Marshall, K., Bosman, S., Casso, M., and Chanton, J. P.: A simple headspace equilibration method for measuring dissolved methane, Limnol. Oceanogr.-Meth., 12, 637–650, https://doi.org/10.4319/lom.2014.12.637, 2014.
Mau, S., Römer, M., Torres, M. E., Bussmann, I., Pape, T., Damm, E., Geprägs, P., Wintersteller, P., Hsu, C. W., Loher, M., and Bohrmann, G.: Widespread methane seepage along the continental margin off Svalbard – from Bjornoya to Kongsfjorden, Sci. Rep.-UK, 7, 42997, https://doi.org/10.1038/srep42997, 2017.
McGinnis, D. F., Greinert, J., Artemov, Y., Beaubien, S. E., and Wüest, A.: Fate of rising methane bubbles in stratified waters:: How much methane reaches the atmosphere?, J. Geophys. Res.-Oceans, 111, C09007, https://doi.org/10.1029/2005jc003183, 2006.
MEKUN.SH: Generalplan Küstenschutz des Landes Schleswig-Holstein – Fortschreibung 2022, Ministerium für Energiewende, Landwirtschaft, Umwelt, Natur und Digitalisierung des Landes Schleswig-Holstein, Kiel, Germany, 112 pp., https://www.schleswig-holstein.de/DE (last access: 30 September 2025), 2022.
Mielck, F., Holler, P., Bürk, D., and Hass, H. C.: Interannual variability of sorted bedforms in the coastal German Bight (SE North Sea), Cont. Shelf Res., 111, 31–41, https://doi.org/10.1016/j.csr.2015.10.016, 2015.
Mielck, F., Hass, H. C., Michaelis, R., Sander, L., Papenmeier, S., and Wiltshire, K. H.: Morphological changes due to marine aggregate extraction for beach nourishment in the German Bight (SE North Sea), Geo.-Mar. Lett., 39, 47–58, https://doi.org/10.1007/s00367-018-0556-4, 2019.
Mielck, F., Michaelis, R., Hass, H. C., Hertel, S., Ganal, C., and Armonies, W.: Persistent effects of sand extraction on habitats and associated benthic communities in the German Bight, Biogeosciences, 18, 3565–3577, https://doi.org/10.5194/bg-18-3565-2021, 2021.
Müller, D., Liu, B., Geibert, W., Holtappels, M., Sander, L., Miramontes, E., Taubner, H., Henkel, S., Hinrichs, K.-U., Bethke, D., Dohrmann, I., and Kasten, S.: Depositional controls and budget of organic carbon burial in fine-grained sediments of the North Sea – the Helgoland Mud Area as a natural laboratory, Biogeosciences, 22, 2541–2567, https://doi.org/10.5194/bg-22-2541-2025, 2025.
Nightingale, P. D., Malin, G., Law, C. S., Watson, A. J., Liss, P. S., Liddicoat, M. I., Boutin, J., and Upstill-Goddard, R. C.: In situ evaluation of air-sea gas exchange parameterizations using novel conservative and volatile tracers, Global Biogeochem. Cy., 14, 373–387, https://doi.org/10.1029/1999gb900091, 2000.
Nijman, T. P. A., Lemmens, M., Lurling, M., Kosten, S., Welte, C., and Veraart, A. J.: Phosphorus control and dredging decrease methane emissions from shallow lakes, Sci. Total Environ., 847, 157584, https://doi.org/10.1016/j.scitotenv.2022.157584, 2022.
Nørgaard-Pedersen, N. B., Ole , Pérez, L. F., Haase, E., and Rödel, L. G.: Investigations of sand resources for the Danish North Sea energy island, Aggregate mapping for the Danish Energy Agency, GEUS. Danmarks og Grønlands Geologiske Undersøgelse Rapport Vol. 2022 No. 27, https://doi.org/10.22008/gpub/34662, 2022.
Porz, L., Chen, J. Y., Yilmaz, R., Kuhlmann, J., Zhang, W. Y., and Schrum, C.: Dredging and dumping impact coastal fluxes of sediment and organic carbon, Nat. Commun., 17, 216, https://doi.org/10.1038/s41467-025-68105-5, 2026.
Rolph, G., Stein, A., and Stunder, B.: Real-time Environmental Applications and Display sYstem: READY, Environ. Modell. Softw., 95, 210–228, https://doi.org/10.1016/j.envsoft.2017.06.025, 2017.
Røy, H., Lee, J. S., Jansen, S., and de Beer, D.: Tide-driven deep pore-water flow in intertidal sand flats, Limnol. Oceanogr., 53, 1521–1530, https://doi.org/10.4319/lo.2008.53.4.1521, 2008.
Schmale, O., Leifer, I., Deimling, J. S. V., Stolle, C., Krause, S., Kiesslich, K., Frahm, A., and Treude, T.: Bubble Transport Mechanism: Indications for a gas bubble-mediated inoculation of benthic methanotrophs into the water column, Cont. Shelf Res., 103, 70–78, https://doi.org/10.1016/j.csr.2015.04.022, 2015.
Schmidt, M., Graul, R., Sartorius, H., and Levin, I.: Carbon dioxide and methane in continental Europe: A climatology, and (222)Radon-based emission estimates, Tellus B, 48, 457–473, https://doi.org/10.1034/j.1600-0889.1994.t01-2-00002.x-i1, 1996.
Schmidt, M., Reith, S. J. E., Wietzel, J. B., Palzer, A., Keppler, F., Polag, D., and Schroll, M.: Assessing methane emissions from an offshore marine aggregate extraction site near Sylt, Eastern North Sea, V1, heiDATA [data set], https://doi.org/10.11588/DATA/SEQZGB, 2026.
Schultze, M., and Nehls, G.: Wadden Sea Quality Status Report: Extraction and dredging, Common Wadden Sea Secretariat, Zenodo, https://doi.org/10.5281/zenodo.15225922, 2017.
Simmonds, P. G., Derwent, R. G., McCulloch, A., O'Doherty, S., and Gaudry, A.: Long-term trends in concentrations of halocarbons and radiatively active trace gases in atlantic and european air masses monitored at mace head, Ireland from 1987–1994, Atmos. Environ., 30, 4041–4063, https://doi.org/10.1016/1352-2310(96)00055-6, 1996.
Slamet, N. S., Dargusch, P., Aziz, A. A., and Wadley, D.: Mangrove vulnerability and potential carbon stock loss from land reclamation in Jakarta Bay, Indonesia, Ocean Coast. Manage., 195, 105283, https://doi.org/10.1016/j.ocecoaman.2020.105283, 2020.
Staudt, F., Gijsman, R., Ganal, C., Mielck, F., Wolbring, J., Hass, H. C., Goseberg, N., Schüttrumpf, H., Schlurmann, T., and Schimmels, S.: The sustainability of beach nourishments: a review of nourishment and environmental monitoring practice, J. Coast. Conserv., 25, 34, https://doi.org/10.1007/s11852-021-00801-y, 2021.
Tremmler, H.: Gutachten des Geologischen Landesamtes Schleswig-Holstein über den Aufbau des tieferen Untergrundes im Hinblick auf die Gewinnung von Spülsand im Umfeld der Insel Sylt, Geologisches Landesamt Schleswig-Holstein, Kiel, Germany, 36, 1994.
Upstill-Goddard, R. C. and Barnes, J.: Methane emissions from UK estuaries: Re-evaluating the estuarine source of tropospheric methane from Europe, Mar. Chem., 180, 14–23, https://doi.org/10.1016/j.marchem.2016.01.010, 2016.
van Dalfsen, J. A., Essink, K., Madsen, H. T., Birklund, J., Romero, J., and Manzanera, M.: Differential response of macrozoobenthos to marine sand extraction in the North Sea and the Western Mediterranean, Ices J. Mar. Sci., 57, 1439–1445, https://doi.org/10.1006/jmsc.2000.0919, 2000.
Wanninkhof, R.: Relationship between wind speed and gas exchange over the ocean revisited, Limnol. Oceanogr.-Meth., 12, 351–362, https://doi.org/10.4319/lom.2014.12.351, 2014.
Wanninkhof, R., Asher, W. E., Ho, D. T., Sweeney, C., and McGillis, W. R.: Advances in Quantifying Air-Sea Gas Exchange and Environmental Forcing, Annu. Rev. Mar. Sci., 1, 213–244, https://doi.org/10.1146/annurev.marine.010908.163742, 2009.
Whiticar, M. J.: Carbon and hydrogen isotope systematics of bacterial formation and oxidation of methane, Chem. Geol., 161, 291–314, https://doi.org/10.1016/s0009-2541(99)00092-3, 1999.
Whiticar, M. J.: The Biogeochemical Methane Cycle, in: Hydrocarbons, Oils and Lipids: Diversity, Origin, Chemistry and Fate, edited by: Wilkes, H., Springer International Publishing, Cham, 669–746, https://doi.org/10.1007/978-3-319-90569-3_5, 2020.
Wiesenburg, D. A. and Guinasso, N. L.: Equilibrium Solubilities of Methane, Carbon-Monoxide, and Hydrogen in Water and Sea-Water, J. Chem. Eng. Data, 24, 356–360, https://doi.org/10.1021/je60083a006, 1979.
Wietzel, J. B. and Schmidt, M.: Methane emission mapping and quantification in two medium-sized cities in Germany: Heidelberg and Schwetzingen, Atmospheric Environment: X, 20, 100228, https://doi.org/10.1016/j.aeaoa.2023.100228, 2023.
Wu, C. S., Roy, H., and de Beer, D.: Methanogenesis in sediments of an intertidal sand flat in the Wadden Sea, Estuar. Coast. Shelf S., 164, 39–45, https://doi.org/10.1016/j.ecss.2015.06.031, 2015.
Wietzel, J. B., Korben, P., Hoheisel, A., and Schmidt, M.: Best practices and uncertainties in CH4 emission quantification: employing mobile measurements and Gaussian plume modelling at a biogas plant, Atmos. Meas. Tech., 18, 4631–4645, https://doi.org/10.5194/amt-18-4631-2025, 2025.
Yang, M., Bell, T. G., Brown, I. J., Fishwick, J. R., Kitidis, V., Nightingale, P. D., Rees, A. P., and Smyth, T. J.: Insights from year-long measurements of air–water CH4 and CO2 exchange in a coastal environment, Biogeosciences, 16, 961–978, https://doi.org/10.5194/bg-16-961-2019, 2019.
Yin, X., Wu, W., Maeke, M., Richter-Heitmann, T., Kulkarni, A. C., Oni, O. E., Wendt, J., Elvert, M., and Friedrich, M. W.: CO2 conversion to methane and biomass in obligate methylotrophic methanogens in marine sediments, ISME J., 13, 2107–2119, https://doi.org/10.1038/s41396-019-0425-9, 2019.
York, D., Evensen, N. M., Martínez, M. L., and De Basabe Delgado, J.: Unified equations for the slope, intercept, and standard errors of the best straight line, Am. J. Phys., 72, 367–375, https://doi.org/10.1119/1.1632486, 2004.
Yver-Kwok, C., Philippon, C., Bergamaschi, P., Biermann, T., Calzolari, F., Chen, H., Conil, S., Cristofanelli, P., Delmotte, M., Hatakka, J., Heliasz, M., Hermansen, O., Komínková, K., Kubistin, D., Kumps, N., Laurent, O., Laurila, T., Lehner, I., Levula, J., Lindauer, M., Lopez, M., Mammarella, I., Manca, G., Marklund, P., Metzger, J.-M., Mölder, M., Platt, S. M., Ramonet, M., Rivier, L., Scheeren, B., Sha, M. K., Smith, P., Steinbacher, M., Vítková, G., and Wyss, S.: Evaluation and optimization of ICOS atmosphere station data as part of the labeling process, Atmos. Meas. Tech., 14, 89–116, https://doi.org/10.5194/amt-14-89-2021, 2021.
Zeiler, M., Schulz-Ohlberg, J., and Figge, K.: Mobile sand deposits and shoreface sediment dynamics in the inner German Bight (North Sea), Mar. Geol., 170, 363–380, https://doi.org/10.1016/S0025-3227(00)00089-X, 2000.