
the Creative Commons Attribution 4.0 License.
the Creative Commons Attribution 4.0 License.
 | 04 Aug 2026
Selective accumulation of dissolved organic matter in the sea surface microlayer: integrated multi-spectral CDOM and FDOM characterization and a novel FDOM/CDOM index at a Mediterranean coastal site
Eleni Tzempelikou
Christina Zeri
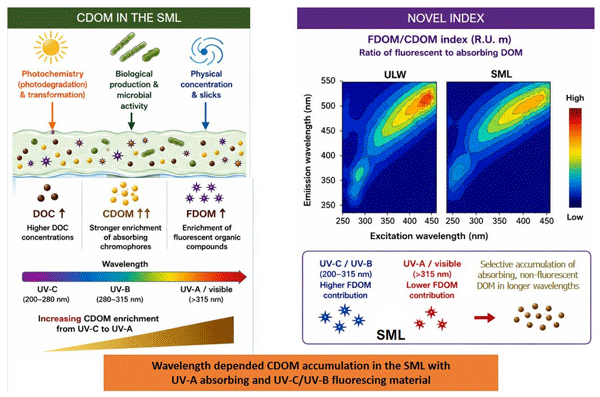
The aims of this work are: (i) To understand potential transformations and dynamics within the broad chromophoric dissolved organic matter (CDOM) pool in the sea surface microlayer (SML) and the underlying water (ULW) at a Mediterranean coastal site using high-resolution (biweekly, one-year) temporal data and by applying established absorbance indices across multiple spectral regions along with the novel fluorescent dissolved organic matter (FDOM) to CDOM, FDOM/CDOM index. (ii) To evaluate the relative contributions of in situ processes, upward flux from the ULW, and atmospheric (rainwater) inputs in the shaping of the dissolved organic matter (DOM) and CDOM pools in the SML. Twenty-two paired SML–ULW samples and fourteen rainwater samples were analyzed for dissolved organic carbon (DOC), UV–visible (250–700 nm) absorption spectra, and 3D fluorescence excitation emission matrices (EEMs). The SML was consistently enriched in DOC, CDOM, and FDOM relative to the ULW throughout the study. Enrichment factors (EFs) for long-wavelength absorption coefficients (a300, a370) exceeded 5 indicating a preferential accumulation of high molecular, aromatic absorbing DOM. Relationships between DOC, a300 and the spectral slope (S275−295) indicated that specific processes in the SML modulate the abundance and optical quality of DOM beyond bulk DOC quantity. Photodegradation was apparent in both layers, though more pronounced in the ULW. In the SML, photodegradation effects appeared to be partially counterbalanced by in situ production or aggregation of hydrophobic, optically active, higher-molecular-weight material. Parallel Factor Analysis (PARAFAC) identified four FDOM components: two humic-like (A–C, A–M) and two protein-like (T, B). Terrestrial humic-like (A–C) and tryptophan-like (T) fluorophores were dominant and strongly enriched in the SML (EF >4). However, humic-like and tryptophan-like components exhibited SML enrichment linked to both a300 absorption and layer, while tyrosine – like component was enriched independently of layer effects and mainly reflected a300 fluctuations. By introducing a new FDOM/CDOM index, a decoupling between fluorescent and non-fluorescent chromophoric organic fractions was revealed: the SML exhibited higher fluorescence in the UV-C/UV-B excitation regions (A, B, T peaks) but lower fluorescence in the UV-A/near-visible excitation region (C peak), suggesting selective accumulation of absorbing but non-fluorescent CDOM in longer wavelengths. Potential drivers of this decoupling include biological transformations, rapid microlayer reorganization, and atmospheric inputs. Rainwater showed DOC concentrations and absorption features comparable to the SML but distinct fluorescence characteristics. PARAFAC modeling of rainwater did not resolve the tryptophan-like fluorophore and revealed blue-shifted humic-like components, consistent with photochemically aged, low molecular weight DOM of mixed marine–terrestrial origin. Overall, the results indicate that wavelength-dependent enrichment of CDOM and FDOM in the SML is primarily driven by photodegradation, biological activity, rapid molecular reorganization, and atmospheric deposition, rather than upward DOM flux from the ULW.
- Article
(2221 KB) - Full-text XML
-
Supplement
(614 KB) - BibTeX
- EndNote


The sea surface microlayer (SML) is the boundary interface between the ocean and the atmosphere. Having a thickness of less than 1 mm, it ubiquitously covers the ocean surface. The formation and persistence of the SML have historically been linked to wind speed (Liss and Duce, 1997). However, recent studies show that this relationship is not straightforward, as enrichment can occur even at wind speeds above 10 m s−1, mainly due to increased bubble fluxes that return surfactants to the SML (Sabbaghzadeh et al., 2017, 2024). Beyond wind effects, other factors – including solar radiation, which drives photochemical and microbial processes; biological activity, which produces and modifies surface-active substances; and atmospheric deposition – play critical roles in determining the composition and persistence of the SML (Upstill-Goddard, 2006; Wurl and Holmes, 2008; Cunliffe et al., 2013; Engel et al., 2017; Stolle et al., 2020). These physical, chemical, and biological interactions collectively define the dynamic nature of the SML and its influence on air–sea gas exchange processes. (Liss and Duce, 1997; Pereira et al., 2016, 2018). The SML is characterized by a high content of amphiphilic, surface-active compounds such as carbohydrates, proteins, lipids, and humic substances, as well as particulate organic matter and a diverse community of autotrophic and heterotrophic microorganisms (Hunter, 1981; Cunliffe et al., 2009, 2013). The enrichment of dissolved organic matter (DOM) in the SML is a complex process (Mustaffa et al., 2018), influenced by the continuous supply of organic material from the underlying seawater through biological activity and selective scavenging mechanisms (Liss and Duce, 1997; Obernosterer et al., 2008; Pereira et al., 2016; Penezić et al., 2022). Additional sources of organic matter include terrestrial and atmospheric inputs, as well as in situ production and release by primary producers and bacteria (Hardy, 1982; Wurl and Obbard, 2005; Wurl et al., 2009; Stolle et al., 2010; Ebling and Landing, 2017). Chlorophyll a (chl a) is widely used as a proxy for phytoplankton biomass and primary productivity and is closely linked to the production and transformation of DOM in surface waters. Phytoplankton blooms have been identified as important drivers of DOM enrichment in SML, with phytoplankton-derived organic matter fueling microbial activity and influencing biogeochemical cycling at the air–sea interface (Wurl et al., 2016; Bibi et al., 2025). Chromophoric dissolved organic matter (CDOM) represents the fraction of DOM capable of absorbing light in the ultraviolet (UV) and visible regions. A subset of CDOM, known as fluorescent dissolved organic matter (FDOM), can additionally emit light upon excitation in these spectral ranges. In marine environments, CDOM and FDOM are produced in situ following the same mechanisms as bulk DOM (Rochelle-Newall and Fisher, 2002; Nelson et al., 2004; Lonborg et al., 2009; Ortega-Retuerta et al., 2009; Romera-Castillo et al., 2010; Osburn et al., 2012). Enrichment of CDOM and FDOM in the SML relative to the underlying water (ULW) has been reported in several studies (Obernosterer et al., 2008; Mustaffa et al., 2017, 2018). Both CDOM and FDOM consist of large, complex molecules rich in unsaturated bonds and aromatic moieties, structural features that impart hydrophobic properties favouring accumulation within the SML. In coastal regions, terrestrial inputs can contribute substantially to the overall CDOM pool (Opsahl and Benner, 1998; Blough and Del Vechio, 2002), while intense photochemical processes at the sea surface can significantly modify its composition. Interaction with sunlight can lead to CDOM (or FDOM) mineralization and removal or to the breakdown and formation of less complex organic compounds that are more susceptible to bacterial transformation and degradation (Miller and Zepp, 1995; Gao and Zepp, 1998; Moran et al., 2000; Vahatalo and Wetzel, 2004; Zhang et al., 2013; Helms et al., 2013; Logozzo et al., 2021). Spatially, CDOM distribution within the SML is often patchy, with elevated concentrations occurring in slicks and other surface accumulations (Wurl et al., 2009; Mustaffa et al., 2017) while significant correlation has been found between CDOM and surfactant activity (Rickard et al., 2022). Despite its ecological and biogeochemical importance, CDOM dynamics in the SML remain insufficiently explored, particularly under the distinct physical and chemical conditions characteristic of this boundary layer.
CDOM and particularly FDOM optical properties have proven to be a valuable tool for investigating the chemical composition, sources and transformation state of DOM (Stedmon et al., 2007; Hansen et al., 2016; Pitta et al., 2017). Fluorescence techniques are more sensitive than absorption spectroscopy, and fluorescence spectra provide greater detail and more information on the chemical characteristics of FDOM (Coble, 2007). Several indices based solely on FDOM properties, such as the humification, biological and fluorescence indices (HIX, BIX, FI), or on absorbance and DOC parameters, including a(λ), spectral slope (S), and SUVA254, are widely used to assess the quality of absorbing or fluorescent material separately (Weishaar et al., 2003; Helms et al., 2008; Huguet et al., 2009). Here, we introduce a new index, the FDOM/CDOM index, which links these two pools (CDOM and FDOM) and provides integrated insights into the chemical structure of optically active DOM as a whole.
The aims of this work are: (i) To understand potential transformations and dynamics within the broad CDOM pool in the sea surface microlayer (SML) and the underlying water (ULW) at a Mediterranean coastal site using high-resolution (biweekly, one-year) temporal data, and by applying established absorbance indices across multiple spectral regions and the novel FDOM/CDOM index. (ii) To evaluate the relative contributions of in situ processes, upward flux from the ULW, and atmospheric (rainwater) inputs in the shaping of the DOM and CDOM pools in the SML.
2.1 Study area and sampling strategy
The sampling site is located in the south-east Saronikos Gulf about 1 km from the coast in the eastern Mediterranean (Fig. 1). Due to its proximity to the coast the site is affected by urban runoff while only a small urban stream outflows in the area. Two phytoplanktonic blooms in the spring and autumn-early winter are characteristic for the area (Kitsiou and Karydis, 2000; Zervoudaki et al., 2022).
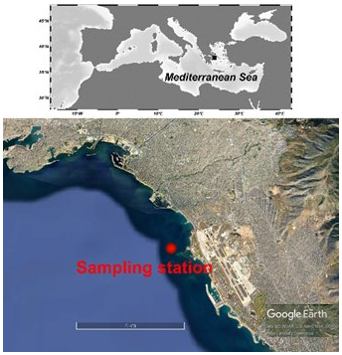
Figure 1Study area, the red dot marks the sampling site in the Saronikos Gulf (Base imagery from Google Earth, Map data © Google).
The study covered an annual cycle from June 2016 to June 2017. During this period data for wet precipitation (mm) and solar radiation from the National Observatory of Athens (http://www.meteo.gr, last access: 28 July 2026) and Saharan dust episodes and deposition (µg m−3) from Skiron Forecasting system (https://forecast.uoa.gr/en/forecast-maps/skiron, last access: 28 July 2026) were gathered. Saharan dust events were also confirmed via the EOSDIS Worldview (https://worldview.earthdata.nasa.gov/, last access: 28 July 2026) (Fig. 2a).
Seawater samplings were performed almost twice per month under low wind speed conditions (<3.5 m s−1). Seawater temperature (T) and salinity (S) were recorded in situ using a CTD (Seabird electronics, Bellevue, WA, USA) instrument. Wind speed was recorded with a portable anemometer Benetech GM816. Samples were collected from SML and from 1 m depth representing the ULW, in total 22 pairs. SML was sampled following the glass plate technique (Harvey and Burzell, 1972) yielding a microlayer thickness of 50±10 µm (Zhang et al., 2003) (Table S1 in the Supplement). A 30×30 cm glass plate sampler with a width of 4 mm was used. Samples from the ULW were collected using a Niskin sampling bottle. Samples for DOC and CDOM and FDOM analysis were collected in amber glass containers with teflon caps while samples for chl a determination in HDPE containers. All samples were refrigerated and immediately transported to the laboratory, where they were filtered through 0.22 µm polycarbonate filters previously rinsed with Milli-Q water. Filtered samples for DOC analysis were kept in precombusted (450 °C, 12 h) glass ampoules, acidified with HCl 2N at pH ∼2, sealed and stored at ∼4 °C until analysis. Filtered samples for absorption and fluorescence analysis were kept in amber glass bottles with teflon caps and stored at ∼4 °C until analysis. The glass containers used during sampling and for the storage of CDOM and FDOM samples were previously acid cleaned (10 % () diluted HCl, 12 h) and rinsed thoroughly with Milli-Q water. Filters for chl a determination were preserved frozen (−20 °C) in the dark until analysis.
For the period December 2016 to May 2017 rainwater samples were collected (14 samplings), via a simple system made with a Nalgene bottle connected to a HDPE funnel for wet deposition (Azimi et al., 2003) situated on the roof of a building at the coast of the study site. This was an open system, so it is assumed it was affected by dry deposition passively collected when not raining. Details on the study site and sampling procedure are described in Tzempelikou et al. (2025).
2.2 Chlorophyll a (chl a)
Chl a was determined according to the Holm-Hansen et al. (1965) method using fluorescence detection in a TURNER fluorometer model TD 700. An initial sample volume equal to 500 mL was filtered for SML and 1.5 L for ULW. The lower filtration volumes used for the SML were due to sampling constrains associated with the glass plate technique. Laboratory tests evaluating different filtration volumes showed no significant differences in chl a concentrations.
2.3 Dissolved Organic Carbon (DOC) analysis
The determination of DOC (mg L−1) in the samples was performed using a Shimadzu TOC-L organic carbon analyzer following the High Temperature Catalytic Oxidation, HTCO. The system was standardized prior analysis using a potassium hydrogen phthalate standard solution series. Each sample was injected 3 to 5 times and DOC concentration was estimated as the average value of three replicates that yielded standard deviation <2 %. Analytical precision and accuracy were tested daily prior and at the end of the analysis using Deep Atlantic Seawater Reference Material provided by the DOC-CRM program (University of Miami – Dennis A. Hansell). The certified value of the reference material is 0.480–0.528 mg L−1 (Batch 19 Lot 10-19) and the measured values (n=22) during the analysis of the samples were between 0.478–0.530 mg L−1 indicating that no drift correction was necessary.
2.4 Absorption analysis
Absorption analysis was performed following the IOCCG protocol (Mannino et al., 2019). Samples for absorption determination were allowed to reach room temperature before analysis. Absorption spectra were obtained between 250 and 700 nm at 1 nm increments using a dual beam UV-visible spectrophotometer (Perkin Elmer, Lambda 25) equipped with 5 cm quartz cells and referenced to Milli-Q water. A blank scan (Milli-Q) was measured frequently to assure the stability of the instrument and it was also subtracted from each sample spectra for baseline correction. The average absorbance between 680–700 nm was subtracted from each sample in order to correct for the residual scattering by fine particles or colloidal material present in the sample. Absorption units were converted to absorption coefficients through the relationship:
where a(λ) is the absorption coefficient (m−1) at wavelength λ, A(λ) is the absorbance at the certain wavelength and l is the light path length in meters.
Absorption coefficient at 300 or 350 nm wavelength is commonly used for the representation of bulk CDOM quantity. In this study, absorption coefficient at 300 nm was selected as a more reliable proxy, since absorption at 350 nm was strongly attenuated, particularly in ULW samples. However, 3 more wavelengths (265, 280, 370 nm) were used in order to investigate whether there are differences in CDOM profiles in the different regions of the spectrum between the SML and ULW. The wavelengths selected provide a good coverage of the spectrum and correspond to excitation wavelengths inducing maximum fluorescence intensities of the samples (see Sect. 2.5). Wavelength 265 nm falls in the UV-C region, wavelength 280 nm is the border between UV-C and UV-B region, wavelength 300 nm belongs to the UV-B region while wavelength 370 nm falls in the UV-A region and it is also close to the visible light preserving though high absorption values. No wavelength of the visible region (>400 nm) was chosen due to the low absorption values especially in the ULW.
Spectral slope of the narrow region 275–295, S275−295 (nm−1) of the spectra was calculated using linear regression of the log-transformed spectra. This is a useful indicator of the molecular weight and source composition of CDOM and can be determined with high precision, even in highly photobleached open-ocean environments (Helms et al., 2008). Consequently, it is often favored over other spectral slope indices. Photodegradation processes typically lead to a reduction in DOM molecular weight, resulting in elevated S275−295 slope values, whereas microbial transformation generally decreases this spectral slope through the production of higher-molecular-weight organic compounds that exhibit strong absorption in longer wavelengths (Helms at al., 2008; Fichot and Benner, 2012; Ortega-Retuerta et al., 2009).
2.5 Fluorescence Analysis
Fluorescence was measured using a Horiba Aqualog-UV-800 spectrofluorometer equipped with a 150 W ozone-free xenon arc-lamp and a 1 cm quartz cell. Excitation–Emission Matrices (EEMs) were obtained between 240 and 450 nm (5 nm increments) for excitation and between 250 and 800 nm (∼ 0.6 nm increments) for emission. The integration time of the measurement was adjusted according to the fluorescence intensity in the SML and ULW samples. A blank EEM (Milli-Q water) was measured daily and subtracted from each sample in order to correct Raman and Rayleigh scattering. All EEMs were corrected for inner filter effect following the Aqualog Operations Manual and were normalized to Raman Units (R.U.) using the Raman scatter emission peak of Milli-Q (Lawaetz and Stedmon, 2009) obtained after the measurement of each sample.
The collected EEMs were further analyzed using Parallel Factor Analysis (PARAFAC). PARAFAC was performed following Murphy et al. (2013) using MATLAB R2015a and the “drEEM toolbox”. Prior modeling, the emission region between 550 and 800 nm was removed since no significant CDOM fluorescence signal was detected. The subtraction of Milli-Q water from the EEMs did not remove sufficiently the Rayleigh and Raman scatter peaks and thus both first and second order Rayleigh and Raman scatter bands were interpolated using the “smootheem” function of the drEEM package. All EEMs were then normalized to their total signal to tackle the large concentration gradients that were observed between the SML and ULW. The model was run five times with random initial values and model validation was carried out through split half analysis using four splits yielding six different combinations and it was repeated five times (S4C6T5). The convergence criterion was 10−6. Visual inspection of the residuals was also implemented along with split half analysis to assure randomness of residuals (Pitta and Zeri, 2021). PARAFAC analysis was performed on the seawater EEMs (pairs of samples (n=22) from the SML and ULW). An additional PARAFAC model was conducted for the rainwater EEMs (n=14). Spectral characteristics of the components resolved by the seawater and rain water models are given in Table S2.
2.6 FDOM/CDOM index
For the calculation of the FDOM/CDOM index discussed in Sect. 3.5 numerical fluorescence intensity values were extracted from scattering corrected EEMs using the “smootheem” function of the drEEM package. Fluorescence intensity (Iij) at each excitation wavelength (Exi) was normalized by the corresponding absorption coefficient (ai) derived from absorption measurements. This normalization was applied across all emission wavelengths (Emj), yielding the ratio i.e., the FDOM/CDOM (R.U.m) index, in the form of a 3-dimensional matrix spanning excitation wavelengths of 250–450 nm and emission wavelengths of 260–550 nm (Suppl Fig. S1). To obtain mean FDOM/CDOM index for each layer, the FDOM/CDOM matrices of all samples were grouped separately for the SML and ULW. For each dataset the average (n=22) ratio matrix was calculated and plotted. All analyses were conducted in MATLAB R2015a using in-house functions (Pitta and Zeri, 2021).
2.7 Enrichment factor (EF)
The Enrichment Factor, EF, of the various measured parameters in the SML is calculated as the ratio of the measured values in the SML to the measured values in the ULW:
where CSML is the concentration of any parameter in the SML and CULW its corresponding concentration in the ULW. EF values >1 indicate enrichment in the SML, while EF values <1 indicate depletion.
2.8 Statistical analysis
The variability of the measured parameters between SML and ULW was evaluated using the Mann–Whitney U test, as the data did not meet the assumptions required for parametric analysis. For the same reason, deviations of enrichment factors from unity were assessed using the one-sample Wilcoxon signed-rank test. Generalized linear models (GLMs) were applied to examine relationships between the response variables (a300, spectral slope and PARAFAC component intensities) and predictors (DOC, a300 and layer). A Gamma error distribution with a log link function was selected because the response variables were continuous, positive and exhibited right-skewed distributions, making this framework more appropriate than Gaussian linear models. GLMs were preferred over simple linear regression because they allow the simultaneous evaluation of continuous predictors (i.e., DOC, a300) and a categorical factor (layer), as well as their interaction terms, thereby explicitly testing whether the strength or direction of relationships differed between layers. Model adequacy was assessed for all selected models using standardized deviance residuals and Cook's distance, which are summarized in the Supplement. Diagnostic plots were evaluated for all selected models; however, for simplicity, only the diagnostic plots for the most complex selected model are presented in the Supplement. Spearman rank correlation analysis was additionally applied to assess monotonic relationships among variables.
All analyses were conducted using IBM SPSS Statistics, Version 20.0.
3.1 Environmental and physicochemical conditions
Figure 2a presents the timing and intensity of rain and dust events recorded between 2016 and 2017, illustrating that the study site was influenced by both wet and dry atmospheric deposition. Over the 376 d observation period, Saharan dust was detected on 103 d (27 %), comprising 77 dry dust pulses and 26 dusty rain events, while dust-free rainfall occurred on 31 d (8 %). Solar irradiance exhibited pronounced seasonality, peaking in summer–autumn (600–900 W m−2) and reaching minima during winter (130–500 W m−2). Seawater temperature (T) varied between 17 and 26 °C from June 2016 to January 2017, dropped to ∼14 °C in February–March 2017, and increased again to 17 °C by May. Salinity remained relatively stable (38.06–39.61 psu) throughout the study period (Table S1 in the Supplement).
Chl a concentrations in the SML and ULW are shown in Fig. 2b. Values ranged from 0.21 to 0.88 µg L−1 (average = 0.51 µg L−1) in the SML and from 0.13 to 0.83 µg L−1 (average = 0.44 µg L−1) in the ULW, consistent with the region's meso-oligotrophic character. No significant difference was detected between layers (Mann-Whitney U test, p>0.05), and SML enrichment was weak (EF = 1.2±0.3) with considerable variability and several samples showing no enrichment (EF <1). The annual chl a distribution revealed an unexpected for the region summer peak in July 2016 followed by a secondary maximum in autumn, indicative of an autumn bloom. Thereafter, concentrations declined in winter and increased again in early spring. It should be noted that chl a was determined using a finer filter (0.22 µm instead of the standard ∼0.7 µm GF/F), likely capturing smaller phytoplankton cells and yielding marginally higher values (Tzempelikou et al., 2025). Moreover, the occurrence of multiple Saharan dust pulses during our study period is expected to enhance primary production, consistent with observations in the Mediterranean ecosystem (Astrahan et al., 2016; Gallisai et al., 2014).
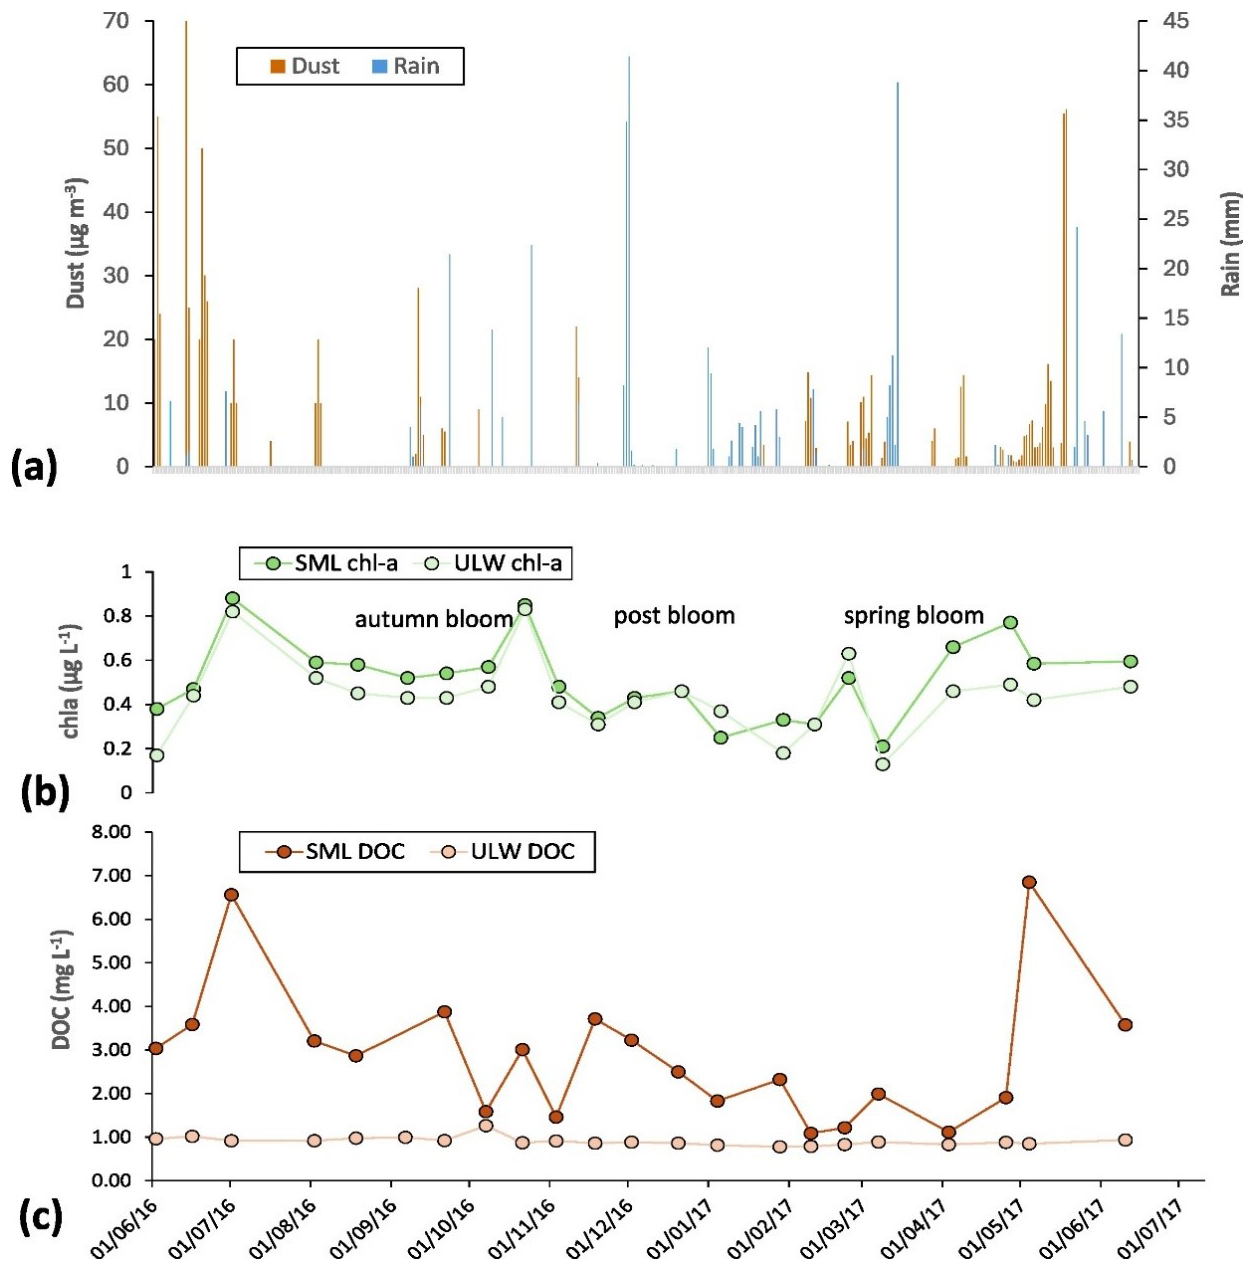
Figure 2Monthly variation of (a) Saharan dust (µg m−3) and rain (mm) deposition during the whole study period, (b) chl a (µg L−1) and (c) DOC (mg L−1) measured during the 22 samplings. (a) Dust is given in orange and rain in blue (b, c) dark dots correspond to SML concentrations and light colored to ULW ones.
The environmental conditions during our samplings (low wind speed, <3.5 m s−1) and elevated chl a (>0.13 µg L−1) favored pronounced SML formation, as evidenced macroscopically by apparent surface slicks in 12 of the 22 samplings (Table S1). Whenever slicks were present, SML samples were collected directly from the slicks. These gel-like surface slicks are formed primarily by surfactants, are rich in hydrophobic organic matter and can host microorganisms and particles forming a distinct ecosystem in the SML compared to the ULW (Zäncker et al., 2017; Wurl et al., 2016). Indeed, accumulation of phytoplankton exudates such as gel-like transparent exopolymer particles (TEPs) has been recorded for the area during the same period (Tzempelikou et al., 2025).
3.2 Dissolved organic carbon in the SML and ULW
Annual variability of DOC concentrations in the SML and ULW is shown in Fig. 2c. In the SML, DOC ranged from 1.09 to 6.85 mg L−1, with an average concentration of 2.48 mg L−1, significantly higher than that in the ULW (average: 0.91 mg L−1; range: 0.78–1.26 mg L−1; Mann-Whitney U test, p=0.001) while the enrichment factor (EF = 2.7±1.0; Wilcoxon signed-rank test, p=0.001; Fig. 3a) confirms substantial accumulation of DOM components in the SML. DOC enrichment in the SML has been previously reported (Chen et al., 2016, 2022; van Pinxteren et al., 2017), yet is not a consistent feature across marine environments with some studies observing no significant (Obernosterer et al., 2008) or weak enrichment (Wurl and Holmes, 2008; van Pinxteren et al., 2012; Stolle et al., 2020; Barthelmeß and Engel, 2022). Two exceptionally high DOC values observed in the SML (1 July 2016 and 4 May 2017, apparent slicks) were not reflected in the ULW, suggesting episodic enrichment events. No significant relationships were observed between chl a and either DOC concentrations or DOC enrichment factors indicating that a direct linkage between primary production and DOC dynamics or accumulation in the SML is not evident in this study. Weak or absent relationship between chl a and DOC concentrations or SML enrichment has been previously reported (Chen et al., 2013; van Pinxteren et al., 2017) despite phytoplankton blooms being recognized as important drivers for DOC accumulation in the SML (Wurl et al., 2016; Bibi et al., 2025). Moreover, no significant relationship was observed between DOC in the two layers (r2=0.028, p=0.492), indicating a clear decoupling and suggesting that DOC in the ULW does not exert a measurable influence on DOC in the SML (Fig. 3a). This observation contrasts with previous studies in which a strong correlation was reported between the DOC in the SML and the ULW indicating that upward transport of material plays a dominant role in the composition of the SML in DOM (Chen et al., 2013, 2016, 2022; Engel and Galgani, 2016; Engel et al., 2018).
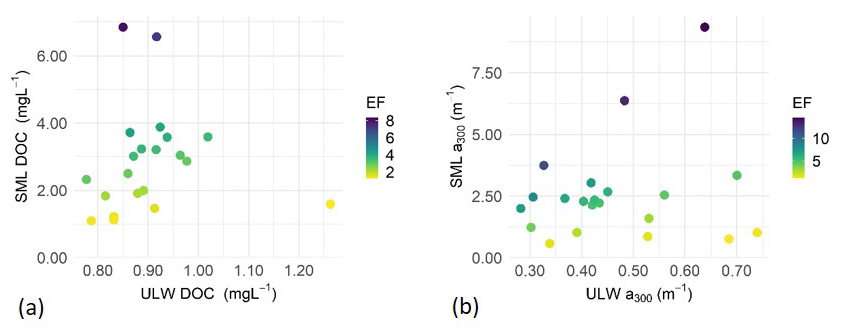
Figure 3Correlation graphs between the SML (y axis) and ULW (x axis) of (a) DOC (mg L−1); (b) absorption coefficient a300 (m−1). The z axis illustrates the enrichment factors.
3.3 CDOM dynamics within the DOM pool in SML and ULW
The distribution of the absorption coefficients at 300 nm, a300 (m−1) in the SML and ULW is presented in Fig. 3b, (see Table S3 for wavelengths 265, 280, 370 nm). In the SML, a300 ranged from 0.569 to 9.347 m−1, with an average of 2.565 m−1. The distribution of a300 (m−1) closely mirrored the one of DOC, displaying maxima on 1 July 2016 and 4 May 2017. As observed in the case of DOC, a300 values in the ULW were significantly lower (Mann-Whitney U Test, p=0.001), and the high SML peaks were not reflected in the ULW. The lack of any significant relationship between a300 in the two layers (Fig. 3b) suggests that CDOM either originates from different sources and/or undergoes distinct processes, highlighting the additional roles of in situ photochemical or biological transformations and/or direct atmospheric inputs to the optically active DOM pool. Penezić et al. (2022) reported lack of CDOM correlation between the SML and ULW even with similar absorption coefficient values in the two layers. Contrary, other studies (Galgani and Engel, 2016; Yang et al., 2022) reported strong correlation of CDOM between the SML and ULW implying a connection of CDOM in the two layers. Enrichment factors (EFs) of a(λ) were consistently and significantly greater than unity (Wilcoxon signed-rank test, p<0.05), confirming systematic enrichment of CDOM in the SML as observed in previous works (Obernosterer et al., 2008; Wurl et al., 2009; Pereira et al., 2016; Mustaffa et al., 2017; Rickard et al., 2022; Xu et al., 2025). Moreover, EFs increased progressively from the UV-C (a265) (EF = 3.6) to the UV-A/near-visible regions (a370) (EF = 7.4) (Table S4), indicating wavelength-dependent accumulation of chromophoric material at the surface. Higher CDOM absorption in longer wavelengths in the SML compared to the ULW have been reported in previous studies. Pereira et al. (2016), reported higher absorption at 365 nm over 250 nm in the SML in the North East UK coast while Yang et al. (2022) reported higher EFs in longer wavelengths in the eastern marginal seas of China. UV-A/near-visible chromophores are disproportionately enriched at the surface relative to UV-B and UV-C, highlighting a compositional differentiation of CDOM in the SML with higher contribution of HMW DOM compared to the underlying water.
Spectral slope values S275−295 in the SML ranged from 0.015 to 0.034 nm−1with an average of 0.025 nm−1. In the ULW, S275−295 values were considerably (Mann-Whitney U test, p=0.001) higher than those in the SML fluctuating between 0.026–0.039 nm−1 with an average of 0.033 nm−1.
Table 1Model selection results for generalized linear models (GLMs) used to assess the effects of DOC, CDOM absorption coefficient at 300 nm (a300), water layer (SML, ULW), and their interactions on a300, slope S275−295 and PARAFAC component intensities. Akaike's Information Criterion (AIC) values and the significance (p values) for each term are given for every tested model. Selected models are indicated in bold. Wald χ2 statistics are reported only for predictors in the selected models.
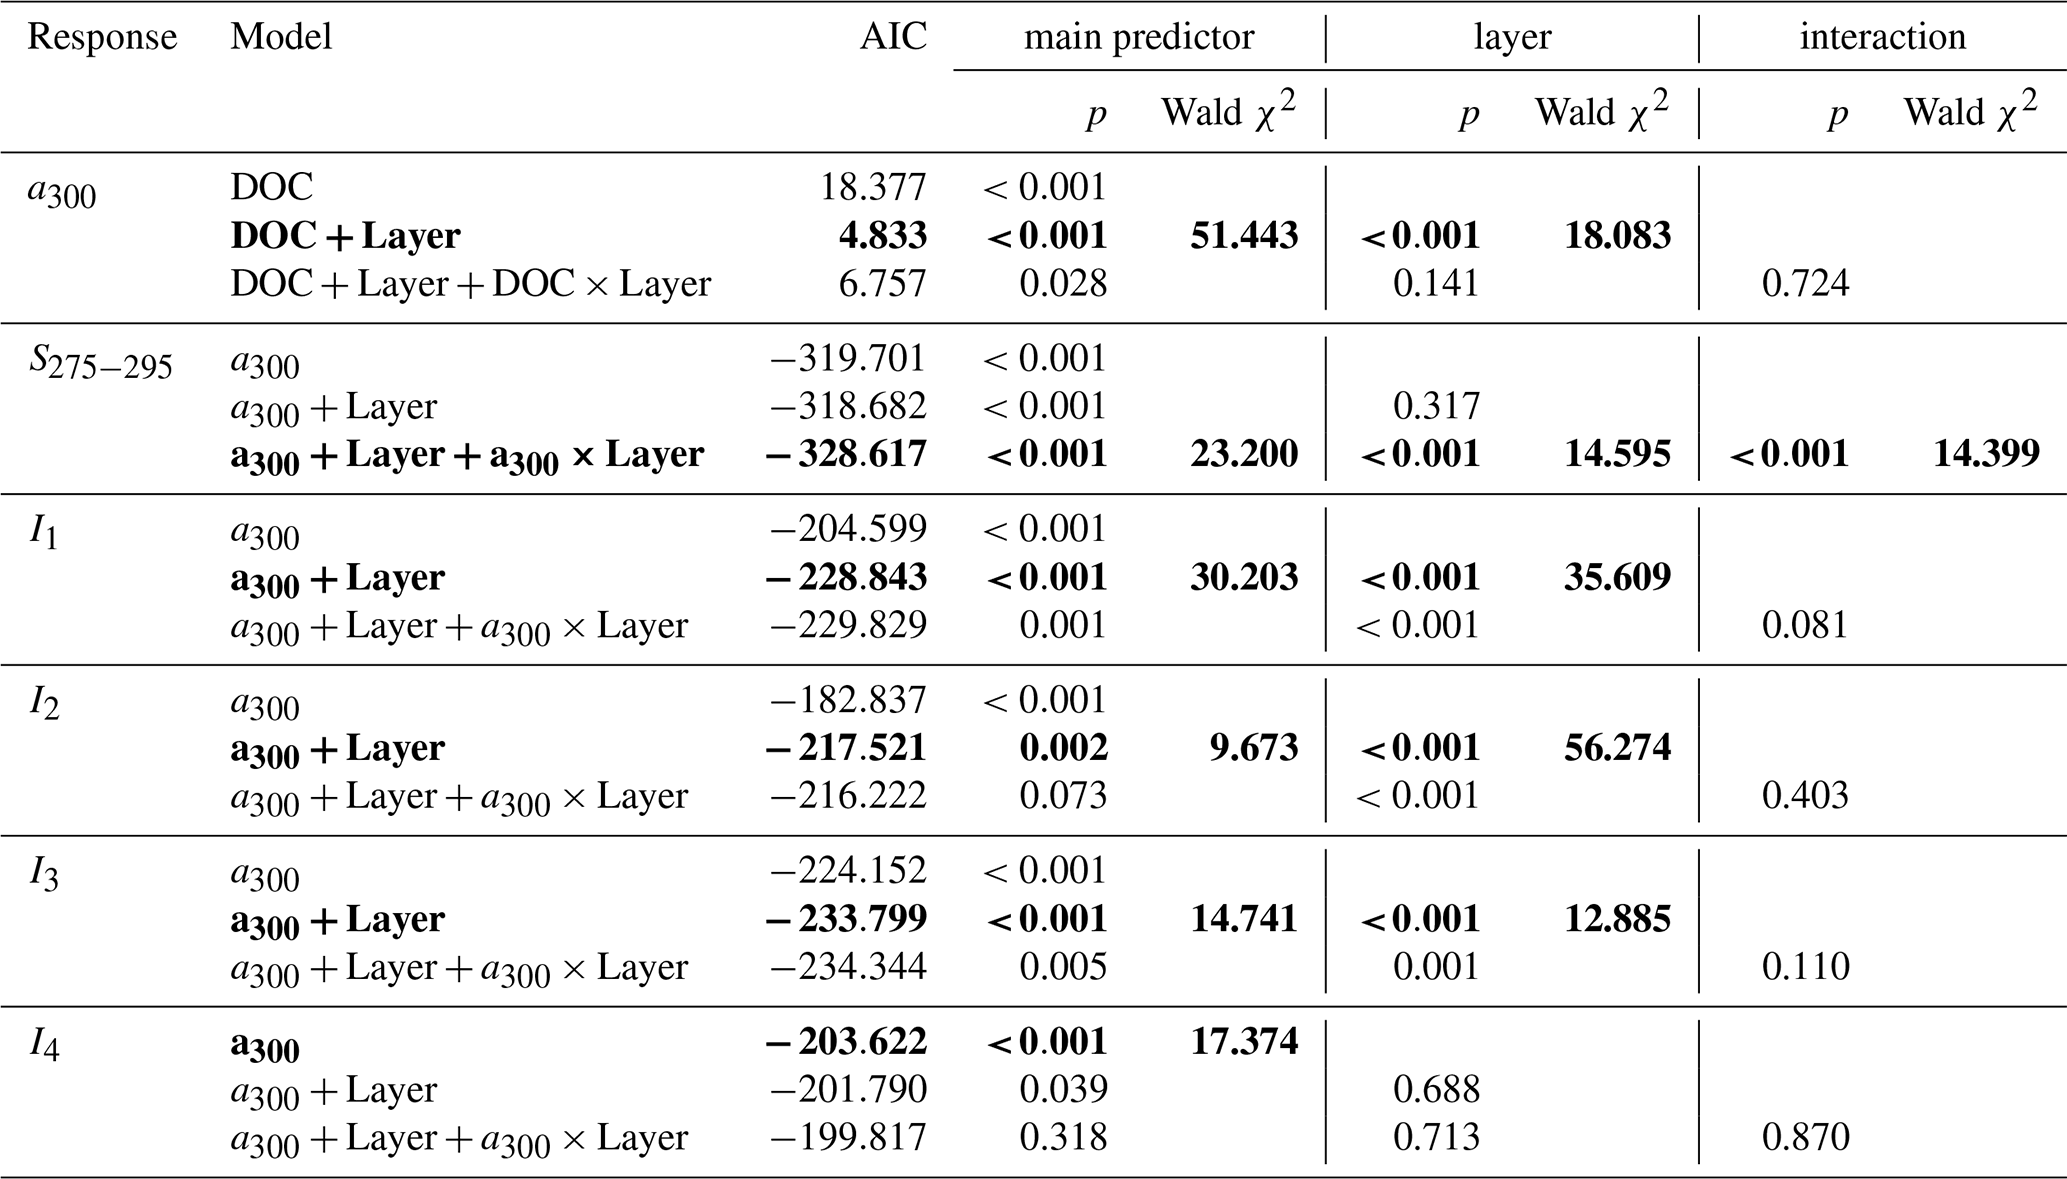
To investigate potential drivers on CDOM dynamics, generalized linear models assuming a Gamma error distribution and a log-link function were applied. Candidate models were compared using Akaike's Information Criterion (AIC) and when competing models differed by less than two AIC units, the most parsimonious model was retained. The results of model selection are presented in Table 1, together with the p values associated with each predictor. Wald χ2 statistics are reported only for predictors retained in the selected models (shown in bold), allowing assessment of the relative statistical support for each term within the final model. Parameter estimates, standard errors, Wald χ2 statistics, and intercept terms for all the selected models are provided in Table S5. Model diagnostics supported the adequacy of the selected models, although in some cases a small number of observations exhibited elevated residuals or influence values. Examination of Cook's distance indicated that these observations did not materially affect model interpretation (Table S6 and Fig. S2).
Model selection identified the additive model including DOC and water layer as the most parsimonious explanation of variability in CDOM absorption at 300 nm (a300). The inclusion of water layer substantially improved model performance relative to the DOC-only model (AIC = 18.377), resulting in a marked decrease in AIC (4.833). Although the interaction model showed comparable fit (AIC = 6.757) the interaction term was not significant (p=0.724) and therefore was not retained. Within the selected model, both DOC (Wald χ2=51.443, p<0.001) and water layer (Wald χ2=18.083, p<0.001) were significant predictors of a300. These results indicate that higher a300 values in the SML are associated both with elevated DOC concentrations and with an additional layer effect. Thus, the differences in a300 between the two layers cannot be explained solely by differences in DOC concentration and processes associated with the SML seem to contribute to enhanced CDOM absorption.
To further explore CDOM qualitative relationships, we conducted GLMs between spectral slope (S275−295) and a300 as predictor alongside layer. Model selection strongly supported the interaction model including a300, water layer and their interaction as the most parsimonious explanation of variability in spectral slope S275−295. The interaction model yielded a substantially lower AIC (−328.617) than both the a300-only model (AIC = −319.701) and the additive model including a300 and layer (AIC = −318.682), indicating that inclusion of both layer and the interaction term markedly improved model performance. Within the selected model, a300 (Wald χ2=23.200, p<0.001), water layer (Wald χ2=14.595, p<0.001) and the interaction between a300 and layer (Wald χ2=14.399, p<0.001) were all significant predictors of spectral slope. The significant interaction indicated that the relationship between a300 and spectral slope differed between the SML and the ULW. Thus, changes in spectral slope are associated with variations in a300, but the nature of this relationship depends on the water layer considered. To facilitate interpretation of the significant interaction between a300 and water layer, model predictions from the selected GLM are shown in Fig. 4 together with the observed values.
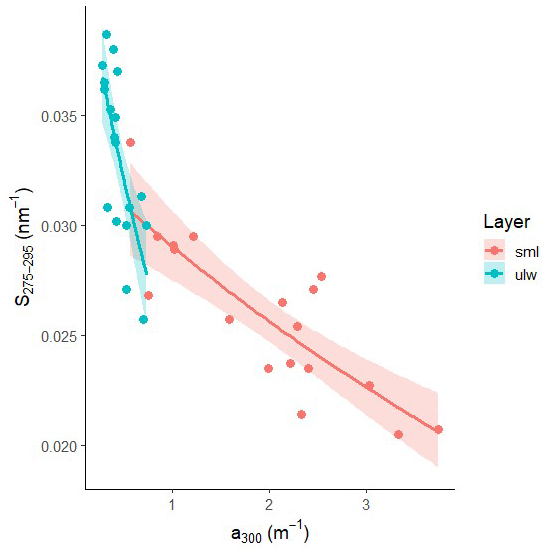
Figure 4Predicted relationships between spectral slope (S275−295) and absorption coefficient at 300 nm (a300) based on the selected Gamma generalized linear model with log link. Points represent observed values, solid lines represent model predictions, and shaded areas indicate 95 % confidence intervals. Predictions are shown only within the observed range of a300 values for each layer.
The predicted relationships reveal a negative association between a300 and spectral slope in both the SML and the ULW. However, the slopes of the fitted relationships differ between layers, consistent with the significant interaction term retained in the model. In particular, the decrease in S275−295 with increasing a300 was more pronounced (steeper slope) in the ULW than in the SML, indicating that changes in CDOM absorption were associated with different responses of spectral slope in the two layers. The close agreement between observed and predicted values further supports the suitability of the selected model.
The negative relationship between spectral slope and absorption coefficients revealed by GLM has been previously reported (Chin et al., 1994; Weishaar et al., 2003; Helms et al., 2008; Tzortziou et al., 2011). This relationship is commonly used to interpret changes in CDOM resulting from photodegradation processes in surface waters (Helms et al., 2008; Fichot and Benner, 2012). The relationship tends to be linear within a compositionally uniform DOM source (Helms et al., 2008; Twardowski and Donaghay, 2001) while it becomes nonlinear (often exponential) across natural gradients encompassing a wide range of CDOM concentrations or mixed sources (e.g., riverine and marine), due to the coexistence of DOM with differing molecular compositions and reactivities (Fichot and Benner, 2012; Nelson and Siegel, 2013). Thus, the less steep slope in the SML (Fig. 4) suggests that other processes taking place there probably compensate for the effect of photodegradation. Previous studies have also reported persistent CDOM concentrations in the SML hindering photodegradation effect (Obernosterer et al., 2008; Wurl et al., 2009; Xu et al., 2025). Particularly, Xu et al. (2025) reported 16 % loss in a350 in the SML compared to 30 % loss in a350 in surface waters. Possible explanations for the less profound photodegradation of CDOM in the SML compared to the ULW are the continuous reorganization of the amphiphilic DOM in the SML (Wurl et al., 2009; Mustaffa et al., 2017, Penezić et al., 2022). Rickard et al. 2022, suggested the production of relatively low molecular weight surfactants through CDOM photodegradation in surface waters. On the other hand, biological in-situ production of optically active material in the UV-A/near-visible region in the SML is also possible. Galgani and Engel (2016) have observed a decrease in spectral slope in the SML due to the abundance of bacterial and phytoplankton cells in parallel to elevated gelatinous material (Coomassie particles and TEPs), thus corroborating to SML specific processes leading to the production of higher molecular weight CDOM.
Taken together, the GLM analyses indicate that both DOC concentration and water layer contribute to variability in CDOM absorption at 300 nm, with the SML exhibiting enhanced CDOM absorption beyond the expected from DOC concentration alone. Moreover, the relationship between CDOM absorption and spectral slope differed between SML and ULW, as shown by the significant interaction between a300 and water layer. Overall, these findings suggest that processes operating within the SML influence not only the abundance of CDOM but also its qualitative characteristics, resulting in layer-specific differences in DOM quality.
As previously noted, absorption was noticeably higher in the SML on 1 July 2016 and 4 May 2017, following the trends observed in DOC concentrations. Alongside these elevated absorption values, the SML spectra exhibited two distinct bands at approximately 330 and 360 nm, features that were absent in the respective spectra in the ULW (Fig. 5).
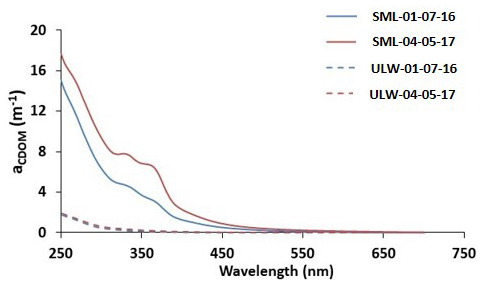
Figure 5CDOM absorption spectra in the SML (solid lines) and ULW (dashed lines) on 1 July 2016 (blue) and 4 May 2017 (red). Spectral bands with maxima at 330, 360 nm are indicative of MAA absorption.
Tilstone et al. (2010) reported pronounced UV absorption bands at 300–340 nm, coinciding with elevated concentrations of mycosporine-like amino acids (MAAs), particularly during surface slicks. These high MAAs levels were linked to coastal phytoplankton blooms and associated exudation, which protect cells from solar irradiance and tend to accumulate in the SML. Similarly, Sabbaghzadeh et al. (2024) observed sporadic UV absorption bands across an Atlantic-wide survey, attributing them also to in situ MAAs production by phytoplankton and bacteria in environments exposed to high-UV radiation. During both sampling events (1 July 2016 and 4 May 2017), surface slicks were clearly observed. Solar irradiance reached some of its annual maximum values (approximately 800 and 750 W m−2, respectively), while consecutive Saharan dust episodes (30 and 40 µg m−3, of dust flux respectively) occurred concurrently. These conditions favoured intense phytoplankton activity as reflected by the elevated chl a concentrations (0.88 and 0.58 µg L−1, respectively) and corroborate to the release of MAAs into the consolidated SML, contributing to the UV absorption features observed in the CDOM spectra of Fig. 5. Although distinct spectral signatures of MAAs were not discernible during the remaining samplings, their occurrence provides clear evidence of biological processes within the SML that influence CDOM dynamics.
3.4 FDOM composition in the SML and ULW resolved by PARAFAC modelling
In Fig. 6 the components resolved by the PARAFAC model on SML and ULW EEMs are shown. Hereafter C1, C2, C3 and C4 will refer to the components and I1, I2, I3 and I4 to the respective fluorescence modelled intensities in the SML and ULW samples.
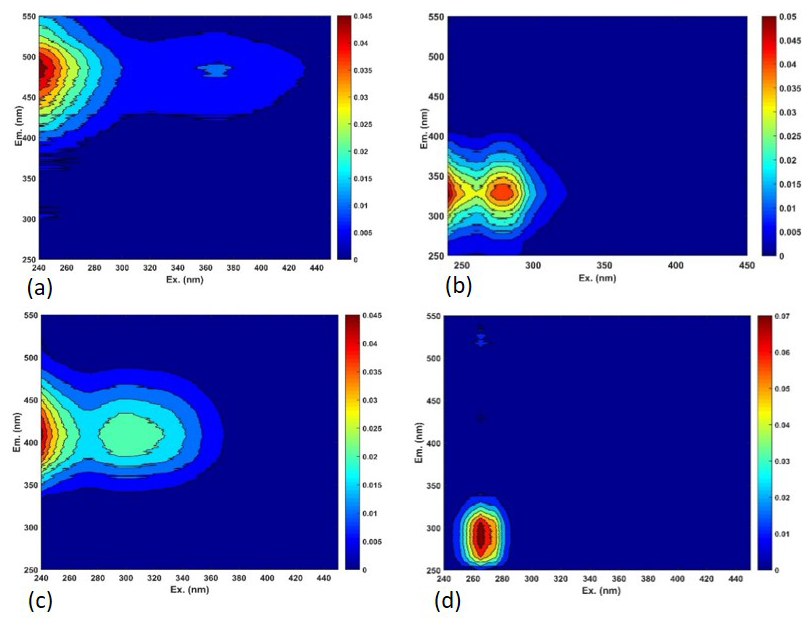
Figure 6The four components resolved in the SML and ULW by the seawater PARAFAC model, (a) Component C1, peaks A–C, (b) Component C2, peak T, (c) Component C3, peaks A–M, (d) Component C4, peak B.
Component C1 presented two excitation maxima at 240 and 370 nm and a single emission maximum at 485 nm that resembles peaks A and C described by Coble et al. (1990, 1998). Peak A (ex/em 240/485 nm) has been associated with aromatic highly conjugated humic material origin (McKnight et al., 2001), while peak C (ex/em 370/485 nm) reflects more mature, condensed aromatic humics also of terrestrial origin. The fact that peak C presents longer excitation wavelength compared to peak A implies that the organic substances that fluoresce in the region of peak C are of relatively higher molecular weight and aromaticity compared to the substances that fluoresce in the region of peak A (McKnight et al, 2001). Component C2 presented excitation maxima at 240 and 280 nm and emission maximum at 325 nm and is associated with peak T (Coble et al., 1998). The spectral characteristics of component C2 indicate proteinaceous material that resembles tryptophan amino acid (Coble, 1996; Coble et al., 1998), indicative of autochthonous biological production in aquatic systems. The third component, C3 showed two excitation maxima at 240 and 295 nm and a single emission maximum at 415 nm. These two peaks resemble peaks A and M respectively. In this case peak A (ex/em 240/415 nm) is resolved in shorter wavelengths. Peak M (ex/em 295/415 nm) is indicative of low molecular weight, low aromatic humic substances predominately associated with in situ bacterial humification processes, while there are also references attributing to peak M terrestrial or riverine origin especially in estuaries and coastal environments (Stedmon and Markager, 2005; Fellman et al., 2010; Catala et al., 2013). A common feature for PARAFAC modelling of FDOM in aquatic systems is that peak A may be deconvoluted in several components. This likely reflects the fact that the fluorescence associated with the humic-like peaks A, C, and M originates from aromatic chromophores that differ in their degree of conjugation, oxidation state, and source. Moreover, in coastal environments, dissolved organic matter is often enriched in lignin-derived compounds, originating from terrestrial plant material. Lignin exhibits strong UV absorption around 280 nm, which closely aligns with the excitation wavelength of fluorescence peak A, and fluoresces in the 420–470 nm range, overlapping with the emission regions of both fluorescence peaks A and C (Del Vecchio and Blough, 2004). Component C4 shows a single excitation and emission maximum at ex/em 265/296 nm similar to the maximum of peak B (Coble et al. 1998). Peak B is representative of proteinaceous material that resembles tyrosine amino acids. This organic material is associated to bacterial degradation processes in contrast to the proteinaceous peak T which is associated with primary production processes. All four components have been previously reported in the SML in the Mediterranean Sea and the global ocean (Galgani and Engel 2016; Pitta et al., 2017; Martínez-Pérez et al., 2019; Drozdowska et al., 2018). In marine environments, humic-like fluorescent components are generally more susceptible to photodegradation than protein-like components. Several studies have shown that exposure to solar radiation leads to a marked decrease in the intensity of humic-like peaks (A, C, M), while the protein-like peaks (T, B) are comparatively less affected (Retelletti Brogi et al., 2020; Romera-Castillo et al., 2011; Zhang et al., 2013). Among the humic-like components, peak C typically exhibits the greatest sensitivity to photobleaching, followed by peak A (Helms et al., 2013; Retelletti Brogi et al., 2020).
3.5 FDOM dynamics within the CDOM pool in the SML and ULW
As illustrated from y axes in Fig. 7 and Table S7, in the SML, components C1 (peak A–C) and C2 (peak T) exhibited higher fluorescence intensities (I1: 0.033–0.398 R.U. and I2: 0.038–0.429 R.U.,) than components C3 (peak A–M) (I3: 0.016–1.249 R.U.) and C4 (peak B) (I4: 0.001–0.196 R.U.) consistent with their order of deconvolution by the PARAFAC model. Moreover, fluorescence intensities show roughly equal contributions of the humic-like C1 (average 30.6 %) and tryptophan- like C2 (average 31.7 %) to the FDOM pool. Component C3 (peak A–M) had the highest average fluorescence intensity (0.122 R.U.) and the widest range; however, this was largely due to an extreme value recorded on 1 July 2016 (Fig. 7c). Excluding this extreme value, C3 intensities remained considerably lower than those of C1 and C2 contributing on average 21.1 % to the total FDOM. Component C4 (peak B) displayed the lowest values with only 14.8 % contribution to total FDOM. The two samplings on 1 July 2016 and 4 May 2017, which exhibited high DOC and a(λ) absorption values in the SML, also demonstrated exceptionally strong fluorescence intensities across all four PARAFAC components (2.5, 4.6, 18 and 2.8 times higher than the average of I1, I2, I3 and I4 respectively). Other than that, no clear seasonal trend was observed in any of the four PARAFAC components in the SML. Likewise, in the ULW, the four components showed little seasonal variation, peaking during autumn bloom on 7 October 2016 (Table S7).
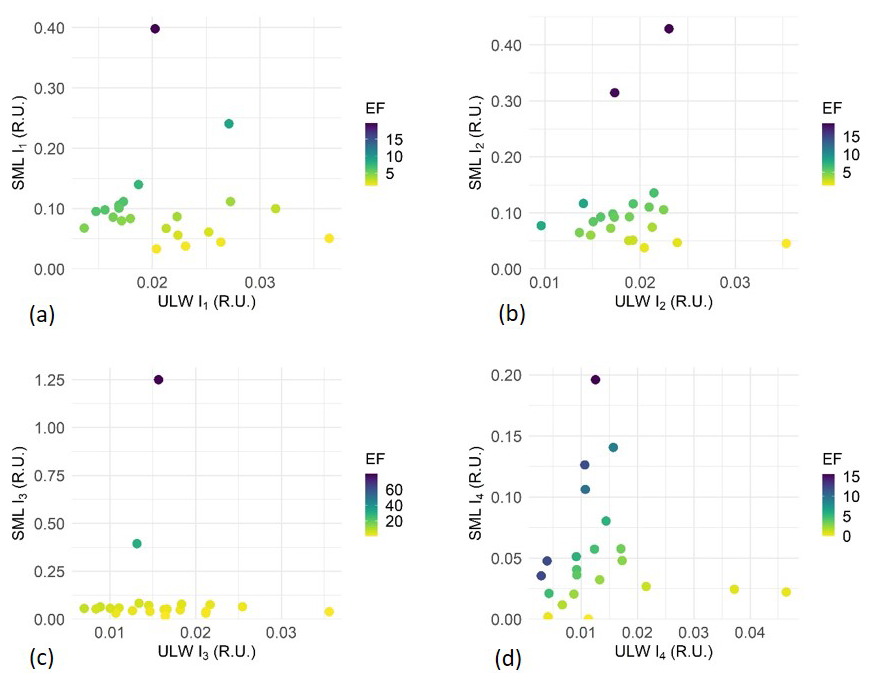
Figure 7Correlation graphs between the SML (y axis) and ULW (x axis) of PARAFAC maximum fluorescence intensities (R.U.) of (a) I1; (b) I2; (c) I3; (d) I4. The z axis illustrates the enrichment factors.
The lack of correlation of the PARAFAC intensities I1−4 between the SML and ULW (Spearman, p>0.05), denotes a decoupling of processes acting upon FDOM in the two water layers (Fig. 7). As with DOC and CDOM, the SML is found enriched in FDOM with most of the EFs fluctuating well above 1 (Wilcoxon test, p<0.05 in all cases) (Fig. 7, Table S4). In particular, the humic like fluorophores (peak A–C) and the tryptophan like one (peak T) were the most enriched in the SML (average EF: 4.2 and 4.5 respectively). Significant enrichment of aromatic amino acids in the SML has been previously documented (Galgani and Engel, 2016; Engel et al., 2018) and has been attributed both to their amphiphilic nature and to in situ production within the SML. Moreover, Yang et al. (2022), reported clearly higher EFs of the tryptophan-like peak in the SML compared to the humic-like and tyrosine-like peaks, indicating a greater contribution of marine autochthonous DOM in the SML relative to the ULW. In our study, the FDOM enrichment within the SML appears to be more evenly distributed between humic DOM and proteinaceous DOM, indicating a relatively balanced influence of terrestrial and autochthonous inputs. Miranda et al. (2018) reported enrichment of the humic-like C fraction in the SML, which followed the pattern of solar radiation. This enrichment was attributed to photolysis of DOM compounds and enhanced microbial activity, leading to reprocessing of photodegraded DOM into FDOM and thus suggesting that humic-like FDOM can be produced in-situ in the SML under the influence of solar radiation.
Separate GLMs (Table 1) were fitted for each fluorescent component identified by PARAFAC, with a300 and layer included as predictors. Model selection revealed consistent influence of both CDOM absorption and water layer on the intensities of components C1, C2 and C3. For all three components, the additive model including a300 and layer was retained, indicating that inclusion of water layer substantially improved model performance relative to models including a300 alone, whereas interaction terms were not supported. Within the selected models, both a300 (Wald χ2=30.203, 9.673 and 14.741 for I1, I2 and I3 respectively) and water layer (Wald χ2=35.609, 56.274 and 12.885 for I1, I2 and I3 respectively) were significant predictors. These results indicate that the intensities of I1–I3 varied with CDOM abundance and differed between the SML and the ULW, while the relationship between component intensity and a300 remained consistent across layers. In contrast, variation in I4 was best explained by a300 alone, with no support for layer or interaction effects. Within the selected model, a300 was a significant predictor of I4 (Wald χ2=17.374, p<0.001), indicating that changes in this component were associated with CDOM absorption but did not differ systematically between water layers. Together these results suggest that the humic-like components C1 and C3 along with the tryptophan-like component C2 exhibit layer-specific enrichment patterns that mirror changes in CDOM absorption, whereas tyrosine-like component C4 appears to respond primarily to variations in CDOM abundance irrespective of water layer.
As described previously, PARAFAC modelling resolved the terrestrial humic-like fluorophore (peak A) into two components – C1 (peak A–C) and C3 (peak A–M) – reflecting overlapping emission regions typical of marine samples. However, this separation makes it difficult to directly assess the relationship between FDOM and CDOM compounds across the full spectral range. To investigate the relative contribution of FDOM to the bulk CDOM, we calculated the FDOM to CDOM index (FDOM/CDOM, R.U. m) as described in Sect. 2.6 (Fig. S1). The average ratios for all SML and ULW samples are presented in the plots of Fig. 8. This approach provides qualitative insight on the relative importance of the fluorescent to absorbing chromophores present in the two water layers.
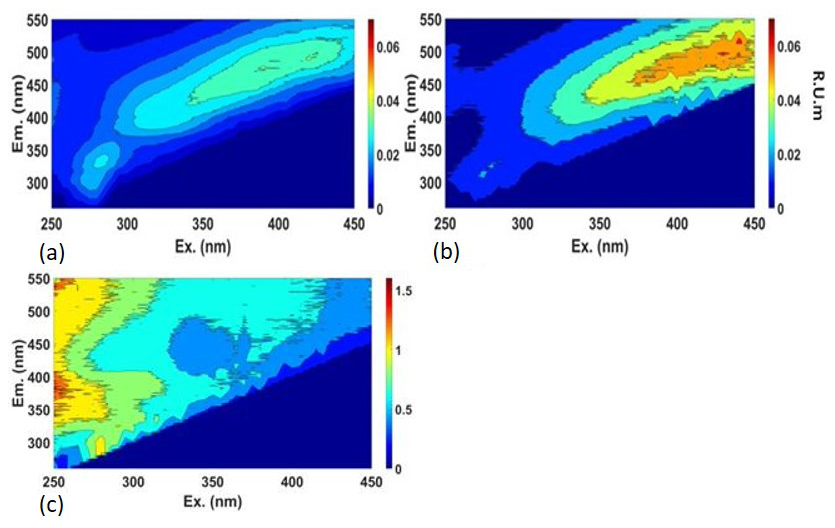
Figure 8The FDOM/CDOM index (R.U. m) in the (a) SML, (b) ULW, (c) the ratio (FDOM/CDOM)sml (FDOM/CDOM)ulw. (a, b) Depletion of the fluorescence intensity excited in the UV-A/near-visible range is apparent in the SML relative to the ULW. (c) Higher contribution of FDOM excited at short wavelength (UV-C/UV-B) to CDOM is apparent in the SML.
Figure 8a, b show that FDOM/CDOM index values are elevated at longer excitation wavelengths (>350 nm) relative to shorter wavelengths in both the SML and ULW, indicating a relatively higher contribution of UV-A/near-visible FDOM to bulk CDOM compared to UV-B and UV-C FDOM. Between layers, the SML is less enriched in UV-A/near-visible FDOM compared to CDOM, likely reflecting the higher CDOM content in the SML at these wavelengths, as discussed previously based on CDOM indices. CDOM enrichment factors (EFs) increased more than threefold from the UV-C to the UV-A region, consistent with selective enrichment of chromophores absorbing at the UV-A/near-visible light (Table S4). It appears that within the SML, the humic-like FDOM fraction of CDOM is more susceptible to photodegradation than the corresponding humic CDOM fraction, and/or that humic CDOM is produced at a higher rate than humic FDOM. Photodegradation of terrigenous DOM, leads to the formation of lower molecular weight, less complex DOM with altered optical characteristics (Opsahl and Benner, 1998; Opsahl and Zepp, 2001; Obernosterer and Benner, 2004), while contrary plankton-derived DOM (mostly protein-like and low molecular weight substances) presents minimal photochemical alteration (Obernosterer and Benner, 2004). Previous studies have also demonstrated that FDOM exhibits stronger photodegradation at longer excitation wavelengths than at shorter ones (Helms et al., 2013; Gonsior et al., 2013). Particularly, Helms et al. (2013) observed that irradiation caused the emission maxima of humic-like peaks A and C to shift toward shorter wavelengths, with the greater shift occurring for peak C, while its excitation maximum shifted toward longer wavelengths. These findings, explain the more intense FDOM photodegradation in long wavelengths in the SML, in contrast to CDOM. Moreover, the SML may be influenced by atmospheric inputs of water-soluble organic carbon (WSOC) with distinct optical signatures. For example, nitro-aromatic compounds present in atmospheric WSOC exhibit strong absorption at 300–500 nm (Huang et al., 2021; Lin et al., 2017) but show minimal fluorescence likely due to the significant reduction in the electron density of the benzene ring by the nitro group (Chen et al., 2020; Cao et al., 2023). Due to the hydrophobic nature of these aromatic compounds forming amphiphilic organic molecules, they are expected to preferentially accumulate in the SML. Overall, the various sources and complex DOM transformation processes occurring in the SML appear to promote a more pronounced accumulation of absorbing but not fluorescent CDOM at longer wavelengths.
In the UV-B and UV-C excitation regions, where humic-like peak A and protein-like peaks T and B are observed in the EEMs, the FDOM/CDOM index is relatively low in both layers, suggesting that highly absorbing material dominates over fluorescent material in this spectral range in both layers. To examine differences between the SML and ULW in the low-wavelength excitation region, we calculated the ratio (FDOM/CDOM)sml (FDOM/CDOM)ulw (Fig. 8c). This analysis revealed that the SML has a relatively higher FDOM fraction at UV-C and UV-B excitation wavelengths, indicating that the proportion of highly aromatic, terrestrial humic material and freshly produced protein-like material is greater in the SML than in the ULW. Terrestrial humics and lignin degradation products absorbing at the short UV-B and UV-C regions can be small sized allochthonous molecules, resistant to photodegradation and are expected to enter the coastal environments either via land runoff or via the atmosphere. (Hernes and Benner, 2003; Chen and Jaffé, 2014).
The preferential enrichment of nitrogen organic compounds, mostly amino-acids, in the SML is documented for diverse coastal and open waters (Liss and Duce, 1997; Kuznetsova and Lee, 2002; Kuznetsova et al., 2004; van Pinxteren et al., 2012; Cunliffe et al., 2013; Chen et al., 2022). It is documented that amino acid enrichment in the SML is likely facilitated by other factors rather than excess in situ production (Kuznetsova and Lee, 2002; Kuznetsova et al., 2004). Within the FDOM pool in particular, the accumulation of amino acid like fluorophores (peaks T and B) has been attributed to microbial release by photoprotection mechanisms and/or cell lysis (Galgani and Engel, 2016; Yang et al., 2022). Our study provides indication of episodic MAAs production in the SML. Increased bacterial production in the SML compared to the ULW has been reported in the Mediterranean Sea under the influence of dry atmospheric deposition (Astrahan et al., 2016). As already stated, several dust events occurred during the sampling period, likely stimulating bacterial activity and the subsequent production of amino acid -like compounds in the SML.
Overall, the SML and ULW display distinct FDOM to CDOM profiles. The SML exhibits a higher fluorescent fraction in the UV-C and UV-B excitation regions (protein-like peaks and peak A) but a lower fraction in the UV-A/near-visible range (peak C) compared to the ULW. Based on CDOM and FDOM indices, the SML appears enriched in high molecular weight, non-fluorescent optically active organic compounds, together with low molecular weight fluorescent material of terrestrial and amino acid–like origin. This pattern suggests that the SML acts as a selective accumulation layer, concentrating photoreactive and surface-active DOM fractions, while bulk UV-A fluorescent material is comparatively diluted, reflecting differential contributions of in situ production, atmospheric deposition, and selective photochemical or biological transformations.
3.6 Influence of Wet Deposition on SML Enrichment
Rain events are significant sources of dissolved organic carbon in surface seawater as it was estimated that they contribute about 90×1012 g C yr−1 (Willey et al., 2000). Rainwater can be exceptionally rich in CDOM (Kieber et al., 2006) while increased DOM concentrations in the SML during rain events have been reported (Wurl and Obbard 2005; Lim et al., 2007; Ribas-Ribas et al., 2017). Several sources contribute to water soluble organic carbon (WSOC) forms in the atmosphere, such as biomass burning, fossil fuel combustion, wind driven soil particulates, including Saharan dust, volatile organic compounds over urban areas, and sea spray over coastal and marine sites (Mladenov et al., 2011; Miyazaki et al., 2018). Studies on the optical properties of WSOC in the atmosphere have shown an overall similarity with the fluorophores of organic molecules found in the marine environment, i.e., humic-like and protein-like substances, yet with distinct differences in their spectral position (Wu et al., 2021, and references therein).
Given the coastal location of the rainwater sampler near an urban area and the prevailing meteorological conditions, the collected samples are expected to reflect contributions from multiple sources. The objective of the CDOM and FDOM analysis in rainwater was to investigate potential linkages between the optical signatures of rainwater and those observed in the SML.
DOC ranged from 0.60 to 6.27 mg L−1 (average 2.49 mg L−1). Absorption coefficients at 300 nm (a300) varied between 0.931 and 8.070 m−1 (average 3.395 m−1), while the spectral slope S275−295 exhibited a narrow range 0.021–0.030 nm−1 (average 0.024 nm−1) (Table S8). Rainwater DOM was highly enriched in optically active material, with a strong coupling observed between DOC and a300 (r2=0.878, p=0.001). Compared to the SML, rainwater exhibited comparable DOC concentrations, slightly higher a300 values, and similar average spectral slope S275−295, though with a narrower range. PARAFAC analysis of the rainwater EEMs resolved three fluorescent components (R1, R2, and R3) (Table S2, Fig. 9). Component R1, with excitation maxima at 240 and 290 nm and an emission maximum at 394 nm, corresponds to peaks A and M and is analogous to seawater component C3, albeit slightly blue-shifted in emission, suggesting smaller molecular weight. This component was dominant with fluorescence intensities I1 ranging from 0.108 to 1.09 R.U (Table S8). Component R2 exhibited excitation maxima at 245 and 335 nm and an emission maximum at 456 nm, representing peaks A and C, and was similarly blue-shifted in emission relative to seawater component C1. These spectral shifts indicate differences in the composition of aromatic, high–molecular-weight humic substances between seawater and rainwater. Intensities of component R2 ranged from 0.025 to 0.389 R.U. Component R3, with excitation maxima at 240 and 270 nm and an emission maximum at 299 nm, corresponds to peak B, whose spectral characteristics closely match those observed in seawater. I3 fluorescence intensities fluctuated in levels comparable to those of I2, from 0.056 to 0.457 R.U., indicating an equal contribution of components R2 (peak A–C) and R3 (peak B) in rainwater FDOM. All identified rainwater components have been previously reported in studies of CDOM in precipitation (Müller et al., 2008; Santos et al., 2012; Yang et al., 2019). Notably, peak T, resolved in seawater, was not resolved in the rainwater PARAFAC model.
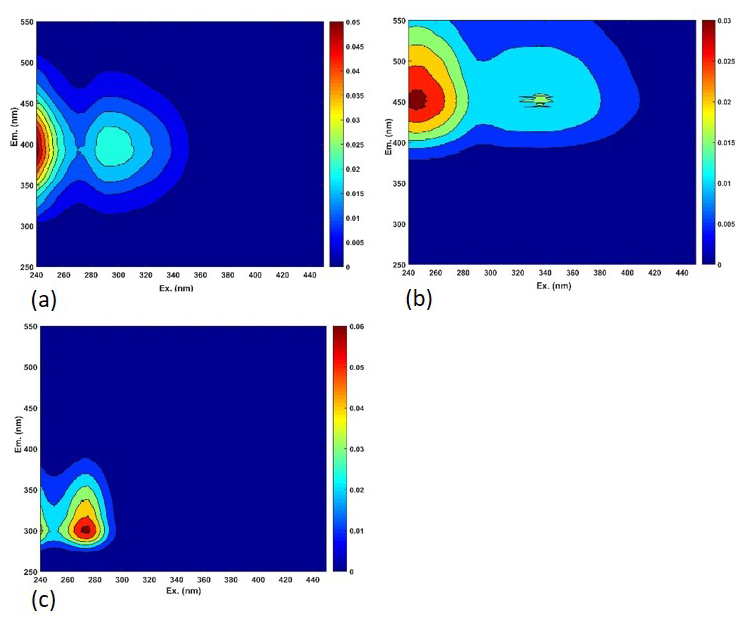
Figure 9The three components resolved by the rainwater PARAFAC model, (a) Component R1, peaks A–M, (b) Component R2, peaks A–C, (c) Component R3, peak B.
The predominance of humic-like fluorophores over protein-like ones in marine aerosols has been reported by Miyazaki et al. (2018), particularly within the spectral range of peak M fluorophores (Ex/Em = 300/400 nm). These authors suggest that during the transfer of DOC to the atmosphere, protein-like compounds undergo substantial decomposition and/or there is preferential formation of humic-like substances in atmospheric aerosols. They also propose that the absence of protein-like fluorophores in sea spray may result from the strong association of these molecules with gel-like exopolymer colloids. Based on laboratory oxidation studies of atmospheric organic carbon, Fan et al. (2019) reported that various oxidation pathways – beyond simple photodegradation – affect atmospheric WSOC, including reactions with hydroxyl radicals (-OH), ozone (O3), and nitrogen oxides (NOx). In particular, tryptophan-like fluorophores were found to be highly susceptible to -OH oxidation, leading to their transformation into humic-like and tyrosine-like compounds. Moreover, several works on atmospheric humic-like substances provide evidence that during atmospheric transport degradation processes (photo- and oxidative ones) generate low molecular weight molecules, and of more aliphatic nature (Wu et al., 2021, and references therein).
Consistent with these findings, our data show a clear predominance of humic-like peaks A and M (component R1) in rainwater samples, the absence of tryptophan-like fluorophores among the PARAFAC components, and blue shifted FDOM components R1 (peak A–M) and R2 (peak A–C). These features suggest: (i) a significant contribution of marine aerosols to rainwater over our study area, and (ii) effective photodegradation and oxidation processes leading to the depletion of tryptophan-like fluorophores and the formation of relatively low-molecular-weight, humic-like compounds. The optical signatures of the rainwater samples further indicate that wet deposition contributes to the CDOM and FDOM pools in the SML primarily through degraded, humic-like components of terrestrial origin (peaks A and C) and tyrosine-like amino acids. At the same time, the prevalence of marine humic-like fluorescence (peak M) points to an efficient recirculation of marine FDOM through sea spray derived marine aerosols. In parallel, the similarities in a300 and spectral slope values S275−295 with the SML suggest that high molecular weight, light-absorbing but non-fluorescent compounds are present in both rainwater and the SML.
This study demonstrates that the sea surface microlayer (SML) functions as a highly dynamic biogeochemical boundary characterized by the selective accumulation and transformation of dissolved organic matter. Although the SML was consistently enriched in DOC, CDOM, and FDOM relative to the ULW, the absence of clear coupling between the two layers indicates that upward transport alone cannot explain DOM enrichment in the SML. Instead, the optical and compositional signatures point to the dominance of in situ processes and atmospheric inputs in shaping microlayer DOM.
DOC, CDOM and spectral slope relationships suggest that processes operating within the SML influence not only the abundance of CDOM but also its qualitative characteristics, resulting in layer-specific differences in DOM quality. Additionally, the investigation of absorption coefficients in various wavelengths covering the UV-C, UV-B, UV-A and near-visible regions of the spectrum, revealed information that could not be discerned through the investigation of absorption at a single wavelength, i.e., 300 nm. A preferential enrichment of higher-molecular-weight, aromatic compounds was observed. This together with the weaker photodegradation signal compared to the ULW, support the view that photochemical alteration is partially counterbalanced by rapid biological production, aggregation, and molecular reorganization at the air–sea interface.
Fluorescence analyses further indicate that the accumulated DOM reflects mixed sources. The concurrent enrichment of humic-like and protein-like components suggests a balanced contribution from terrestrial inputs and marine autochthonous production, while the distinct relationships between fluorescent fractions and CDOM highlight compositional differentiation within the microlayer. The application of the novel FDOM/CDOM index which covers the whole absorption/emission spectrum provided an additional dimension for resolving compositional variability, offering a sensitive optical metric for detecting shifts in bulk CDOM quality and transformation processes at the air–sea interface. The CDOM and FDOM analyses highlight that integrating optical indices spanning different spectral regions – such as absorption coefficients at multiple wavelengths, spectral slope, and the FDOM/CDOM index – provides comprehensive insights into CDOM–FDOM dynamics and interactions.
Rainwater signatures reinforce the importance of atmospheric deposition as an additional pathway supplying optically altered, humic-like material to the SML, emphasizing the tight connectivity between atmospheric processes and surface ocean biogeochemistry.
Overall, these findings underscore that the SML is not merely an enriched extension of the underlying water but a distinct reactive environment where photochemical, biological, and atmospheric processes interact to regulate DOM composition. Given the central role of surface-active organic matter in air–sea exchange, such transformations may have important implications for carbon cycling and climate-relevant processes.
Detailed data are provided in the Supplement of this work.
The supplement related to this article is available online at https://doi.org/10.5194/bg-23-5377-2026-supplement.
Writing (original draft preparation) EP, CZ; Investigation EP, ET; Formal Analysis EP, CZ; Writing (review and editing) EP, CZ, ET; Conceptualization CZ, ET, EP.
The contact author has declared that none of the authors has any competing interests.
Publisher's note: Copernicus Publications remains neutral with regard to jurisdictional claims made in the text, published maps, institutional affiliations, or any other geographical representation in this paper. The authors bear the ultimate responsibility for providing appropriate place names. Views expressed in the text are those of the authors and do not necessarily reflect the views of the publisher.
This article is part of the special issue “Biogeochemical processes and Air–sea exchange in the Sea-Surface microlayer (BG/OS inter-journal SI)”. It is not associated with a conference.
We wish to thank K. Fostiropoulos and T. Zoulias for the help in the fieldwork and A. Konstantinopoulou for chl a analysis. English language has been revised using AI. ChatGPT free online tool. ChatGPT was also used for the preparation of the key figure.
This work has been supported by the National Monitoring Programme for the Implementation of WFD in Greece (MIS 5001676, Ministry for the Environment and Energy).
This paper was edited by Peter S. Liss and reviewed by Philippa Rickard and one anonymous referee.
Astrahan, P., Herut, B., Paytan, A., and Rahav, E.: The Impact of Dry Atmospheric Deposition on the Sea-Surface Microlayer in the SE Mediterranean Sea: An Experimental Approach, Front. Mar. Sci., 3, 222, https://doi.org/10.3389/fmars.2016.00222, 2016.
Azimi, S., Ludwig, A., Thévenot, D. R., and Colin, J.-L.: Trace metal determination in total atmospheric deposition in rural and urban areas, Sci. Total Environ., 308, 247–256, https://doi.org/10.1016/S0048-9697(02)00678-2, 2003.
Barthelmeß, T. and Engel, A.: How biogenic polymers control surfactant dynamics in the surface microlayer: insights from a coastal Baltic Sea study, Biogeosciences, 19, 4965–4992, https://doi.org/10.5194/bg-19-4965-2022, 2022.
Bibi, R., Ribas-Ribas, M., Jaeger, L., Lehners, C., Gassen, L., Cortés-Espinoza, E. F., Wollschläger, J., Thölen, C., Waska, H., Zöbelein, J., Brinkhoff, T., Athale, I., Röttgers, R., Novak, M., Engel, A., Barthelmeß, T., Karnatz, J., Reinthaler, T., Spriahailo, D., Friedrichs, G., Schäfer, F. A., and Wurl, O.: Biogeochemical dynamics of the sea-surface microlayer in a multidisciplinary mesocosm study, Biogeosciences, 22, 7563–7589, https://doi.org/10.5194/bg-22-7563-2025, 2025.
Blough, N. L. and Del Vecchio, R.: Chromophoric DOM in coastal environment, in: Biogeochemistry of marine dissolved organic matter, edited by: Hansell, D. A. and Carlson, C. A., Academic, 509–546, https://doi.org/10.1016/B978-012323841-2/50012-9, 2002.
Cao, T., Li, M., Xu, C., Song, J., Fan, X., Li, J., Jia, W., and Peng, P.: Technical note: Chemical composition and source identification of fluorescent components in atmospheric water-soluble brown carbon by excitation–emission matrix spectroscopy with parallel factor analysis – potential limitations and applications, Atmos. Chem. Phys., 23, 2613–2625, https://doi.org/10.5194/acp-23-2613-2023, 2023.
Catala, T. S., Mladenov, N., Echevarria, F., and Reche, I.: Positive trends between salinity and chromophoric and fluorescent dissolved organic matter in a seasonally inverse estuary, Estuar. Coast. Shelf Sci., 133, 206–216, https://doi.org/10.1016/j.ecss.2013.08.030, 2013.
Chen, M. and Jaffé, R.: Photo- and bio-reactivity patterns of dissolved organic matter from biomass and soil leachates and surface waters in a subtropical wetland, Water Res., 61, 181–190, https://doi.org/10.1016/j.watres.2014.03.075, 2014.
Chen, Q., Li, J., Hua, X., Jiang, X., Mu, Z., Wang, M., Wang, J., Shan, M., Yang, X., Fan, X., Song, J., Wang, Y., Guan, D., and Du, L.: Identification of species and sources of atmospheric chromophores by fluorescence excitation-emission matrix with parallel factor analysis, Sci. Total Environ., 718, 137322, https://doi.org/10.1016/j.scitotenv.2020.137322, 2020.
Chen, Y., Yang, G. P, Wu, G. W., Gao, X. C., and Xia, Q. Y.: Concentration and characterization of dissolved organic matter in the surface microlayer and subsurface water of the Bohai Sea, Cont. Shelf Res., 52, 97–107, https://doi.org/10.1016/j.csr.2012.11.007, 2013.
Chen, Y., Yang, G. P., Xia, Q. Y., and Wu, G. W.: Enrichment and characterization of dissolved organic matter in the surface microlayer and subsurface water of the South Yellow Sea, Mar. Chem., 182, 1–13, https://doi.org/10.1016/j.marchem.2016.04.001, 2016.
Chen, Y., Zhang, N., Hu, C., Chen, R., and Yang, G.–P.: Controls on the distribution, enrichment, and degradation of dissolved organic matter in the sea surface microlayer of the Yellow Sea and East China Sea, J. Geophys. Res.-Oceans, 127, https://doi.org/10.1029/2022JC019122, 2022.
Chin, Y. P., Aiken, G., and OLoughlin, E.: Molecular‐weight, polydispersity, and spectroscopic properties of aquatic humic substances, Environ. Sci. Technol., 28, 1853–1858, https://doi.org/10.1021/es00060a015, 1994.
Coble, P. G.: Characterization of marine and terrestrial DOM in seawater using excitation emis5699 sion matrix spectroscopy, Mar. Chem., 51, 325–346, https://doi.org/10.1016/0304-4203(95)00062-3, 1996.
Coble, P. G.: Marine optical biogeochemistry: the chemistry of ocean color, Chem. Rev., 107, 402–418, https://doi.org/10.1021/cr050350, 2007.
Coble, P. G., Green, S. A., Blough, N. V., and Gagosian, R. B.: Characterisation of dissolved organic matter in the Black Sea by fluorescence spectroscopy, Nature, 348, 432–435, https://doi.org/10.1038/348432a0, 1990.
Coble, P. G., Del Castillo, C. E., and Avril, B.: Distribution and optical properties of CDOM in the Arabian Sea during the 1995 southwest monsoon, Deep-Sea Res. Pt. II, 45, 2195–2223, https://doi.org/10.1016/S0967-0645(98)00068-X, 1998.
Cunliffe, M., Salter, M., Mann, P. J., Whiteley, A. S., Upstill-Goddard, R. C., and Murrell, J. C.: Dissolved organic carbon and bacterial populations in the gelatinous surface microlayer of a Norwegian fjord mesocosm, FEMS Microbiol. Lett., 299, 248–254, https://doi.org/10.1111/j.1574-6968.2009.01751.x, 2009.
Cunliffe, M., Engel, A., Frka, S., Gašparović, B., Guitart, C., Murrell, J. C., Salter, M., Stolle, C., Upstill-Goddard, R., and Wurl, O.: Sea surface microlayers: A unified physicochemical and biological perspective of the air–ocean interface, Prog. Oceanogr., 109, 104–116, https://doi.org/10.1016/j.pocean.2012.08.004, 2013.
Del Vecchio, R. and Blough, N. V.: On the origin of the optical properties of humic substances, Environ. Sci. Technol., 38, 3885–3891, https://doi.org/10.1021/es049912h, 2004.
Drozdowska, V., Kowalczuk, P., Konik, M., and Dzierzbicka-Glowacka, L.: Study on Different Fractions of Organic Molecules in the Baltic Sea Surface Microlayer by Spectrophoto- and Spectrofluorimetric Methods, Front. Mar. Sci. 5, 456, https://doi.org/10.3389/fmars.2018.00456, 2018.
Ebling, A. and Landing, W. M.: Trace elements in the sea surface microlayer: rapid responses to changes in aerosol deposition, Elementa: Sci. Anthropocene, 5, 42, https://doi.org/10.1525/elementa.237, 2017.
Engel, A. and Galgani, L.: The organic sea-surface microlayer in the upwelling region off the coast of Peru and potential implications for air–sea exchange processes, Biogeosciences, 13, 989–1007, https://doi.org/10.5194/bg-13-989-2016, 2016.
Engel, A., Bange, H. W., Cunliffe, M., Burrows, S. M., Friedrichs, G., Galgani, L., Herrmann, H., Hertkorn, N., Johnson, M., Liss, P. S., Quinn, P. K., Schartau, M., Soloviev, A., Stolle, C., Upstill-Goddard, R. C., van Pinxteren, M., and Zäncker, B.: The Ocean's Vital Skin: Toward an Integrated Understanding of the Sea Surface Microlayer, Front. Mar. Sci. 4, 165, https://doi.org/10.3389/fmars.2017.00165, 2017.
Engel, A., Sperling, M., Sun, C., Grosse, J., and Friedrichs, G.: Organic matter in the surface microlayer: Insights from a wind wave channel experiment, Front. Mar. Sci., 5, 182, https://doi.org/10.3389/fmars.2018.00182, 2018.
Fan, X., Yu, X., Wang, Y., Xiao, X., Li, F., Xie, Y., Wei, S., Song, J., and Peng, P.: The aging behaviors of chromophoric biomass burning brown carbon during dark aqueous hydroxyl radical oxidation processes in laboratory studies, Atmos. Environ., 213, 391–400, https://doi.org/10.1016/j.atmosenv.2019.116909, 2019.
Fellman, J. B., Hood, E., and Spencer, R. G. M.: Fluorescence spectroscopy opens new windows into dissolved organic matter dynamics in freshwater ecosystems: A review, Limnol., Oceanogr., 55, 2452–2462, https://doi.org/10.4319/lo.2010.55.6.2452, 2010.
Fichot, C. G. and Benner, R.: A novel method to estimate DOC concentrations from CDOM absorption coefficients in coastal waters, Geophy. Res. Lett., 38, https://doi.org/10.1029/2010GL046152, 2012.
Galgani, L. and Engel, A.: Changes in optical characteristics of surface microlayers hint to photochemically and microbially mediated DOM turnover in the upwelling region off the coast of Peru, Biogeosciences, 13, 2453–2473, https://doi.org/10.5194/bg-13-2453-2016, 2016.
Gallisai, R., Peters, F., Volpe, G., Basart, S., and Baldasano, J. M.: Saharan Dust Deposition May Affect Phytoplankton Growth in the Mediterranean Sea at Ecological Time Scales, PLoS ONE, 9, https://doi.org/10.1371/journal.pone.0110762, 2014
Gao, H. and Zepp, R. G.: Factors influencing photoreactions of dissolved organic matter in a coastal river of the Southeastern United States, Environ. Sci. Technol., 32, 2940–2946, https://doi.org/10.1021/es9803660, 1998.
Gonsior, M., Schmitt-Kopplin, P., and Bastviken, D.: Depth-dependent molecular composition and photo-reactivity of dissolved organic matter in a boreal lake under winter and summer conditions, Biogeosciences, 10, 6945–6956, https://doi.org/10.5194/bg-10-6945-2013, 2013.
Hansen, A. M., Kraus, T. E. C., Pellerin, B. A., Fleck, J. A., Downing, B. D., and Bergamaschi, B. A.: Optical properties of dissolved organic matter (DOM): Effects of biological and photolytic degradation, Limnol. Oceanogr., 61, 1015–1032, https://doi.org/10.1002/lno.10270, 2016.
Hardy, J. T.: The sea surface microlayer: Biology, chemistry and anthropogenic enrichment, Prog. Oceanogr., 11, 307–328, https://doi.org/10.1016/0079-6611(82)90001-5, 1982.
Harvey, G. W. and Burzell, L. A.: A Simple Microlayer Method for Small Samples, Limnol. Oceanogr., 11, 608–614, https://doi.org/10.4319/lo.1966.11.4.0608, 1972.
Helms, J. R., Stubbins, A., Ritchie, J. D., Minor, E. C., Kieber, D. J., and Mopper, K.: Absorption spectral slopes and slope ratios as indicators of molecular weight, source, and photobleaching of chromophoric dissolved organic matter, Limnol. Oceanogr., 53, 955–969, https://doi.org/10.4319/lo.2008.53.3.0955, 2008.
Helms, J. R., Stubbins, A., Perdue, E. M., Green, N. W., Chen, H., and Mopper, K.: Photochemical bleaching of oceanic dissolved organic matter and its effect on absorption spectral slope and fluorescence, Mar. Chem., 155, 81–91, https://doi.org/10.1016/j.marchem.2013.05.015, 2013.
Hernes, P. J. and Benner, R.: Photochemical and microbial degradation of dissolved lignin phenols: Implications for the fate of terrigenous dissolved organic matter in marine environments, J. Geophys. Res.-Oceans, 108, 3291, https://doi.org/10.1029/2002JC001421, 2003.
Holm-Hansen, O., Lorenzen, C. J., Holmes, R. W., and Strickland, J. D. H.: Fluorometric determination of chlorophyll, Journal de Conseil, 30, 3–15, https://doi.org/10.1093/icesjms/30.1.3, 1965.
Huang, R.-J., Yang, L., Shen, J., Yuan, W., Gong, Y., Ni, H., Duan, J., Yan, J., Huang, H., You, Q., and Li, Y. J.: Chromophoric Fingerprinting of Brown Carbon from Residential Biomass Burning, Environ. Sci. Technol. Lett., 9, 102–111, https://doi.org/10.1021/acs.estlett.1c00837, 2021.
Huguet, A., Vacher, L., Relexans, S., Saubusse, S., Froidefond, J. M., and Parlanti, E.: Properties of fluorescent dissolved organic matter in the Gironde Estuary, Org. Geochem., 40, 706–719, https://doi.org/10.1016/j.orggeochem.2009.03.002, 2009.
Hunter, K. A.: Processes affecting particulate trace metals in the sea surface microlayer, Mar. Chem., 9, 49–70, https://doi.org/10.1016/0304-4203(80)90006-7, 1981.
Kieber, R. J., Whitehead, R. F., Reid, S. N., Willey, J. D., and Seaton, P. J.: Chromophoric dissolved organic matter (CDOM) in rainwater, Southeastern North Carolina, USA, J. Atmos. Chem., 54, 21–41, https://doi.org/10.1007/s10874-005-9008-4, 2006.
Kitsiou, D. and Karydis, M.: Categorical mapping of marine eutrophication based on ecological indices, Sci. Total Environ., 255, 113–127, https://doi.org/10.1016/s0048-9697(00)00457-5, 2000.
Kuznetsova, M. and Lee, C.: Dissolved free and combined amino acids in nearshore seawater, sea surface microlayers and foams: influence of extracellular hydrolysis, Aquat. Sci., 64, 252–268, https://doi.org/10.1007/s00027-002-8070-0, 2002.
Kuznetsova, M., Lee, C., Aller, J., and Frew, N.: Enrichment of amino acids in the sea surface microlayer at coastal and open ocean sites in the North Atlantic Ocean, Limnol. Oceanogr., 49, 1605–1619, https://doi.org/10.4319/lo.2004.49.5.1605, 2004.
Lawaetz, A. J. and Stedmon, C. A.: Fluorescence intensity calibration using the Raman scatter peak of water, Appl. Spectrosc., 63, 936–940, https://doi.org/10.1366/000370209788964548, 2009.
Lim, L., Wurl, O., Karuppiah, S., and Obbard, J. P.: Atmospheric wet deposition of PAHs to the sea-surface microlayer, Mar. Pollut. Bull., 54, 1212–1219, https://doi.org/10.1016/j.marpolbul.2007.03.023, 2007.
Lin, P., Bluvshtein, N., Rudich, Y., Nizkorodov, S. A., Laskin, J., and Laskin, A.: Molecular Chemistry of Atmospheric Brown Carbon Inferred from a Nationwide Biomass Burning Event, Environ. Sci. Technol., 51, 11561–11570, https://doi.org/10.1021/acs.est.7b02276, 2017.
Liss, P. S. and Duce, R. A. (Eds.): The sea surface and global change, Cambridge University Press, 519 pp., ISBN 9780511525025, https://doi.org/10.1017/CBO9780511525025, 1997.
Lonborg, C., Davidson, K., and Alvarez-Salgado, X. A.: Bioavailability and bacterial degradation rates of dissolved organic matter in a temperate coastal area during an annual cycle, Mar. Chem., 113, 219–226, https://doi.org/10.1016/j.marchem.2009.02.003, 2009.
Logozzo, L., Tzortziou, M., Neale, P., and Clark, B. J.: Photochemical andmicrobial degradation of chromophoricdissolved organic matter exportedfrom tidal marshes, J. Geophys. Res.-Biogeo., 126, https://doi.org/10.1029/2020JG005744, 2021.
Mannino, A., Novak, M. G., Nelson, N. B., Belz, M., Berthon, J.-F., Blough, N. V., Boss, E., Bricaud, A., Chaves, J., Del Castillo, C., Del Vecchio, R., D'Sa, E. J., Freeman, S., Matsuoka, A., Miller, R. L., Neeley, A. R., Röttgers, R., Tzortziou, M., and Werdell, P. J.: Measurement protocol of absorption by chromophoric dissolved organic matter (CDOM) and other dissolved materials, in: Inherent Optical Property Measurements and Protocols: Absorption Coefficient, edited by: Mannino, A. and Novak, M. G., IOCCG Ocean Optics and Biogeochemistry Protocols for Satellite Ocean Colour Sensor Validation, Volume 1.0, IOCCG, Dartmouth, NS, Canada, https://doi.org/10.25607/OBP-119, 2019.
Martínez-Pérez, A. M., Catalá, T. S., Nieto-Cid, M., Otero, J., Álvarez, M., Emelianov, M., Reche, I., Álvarez-Salgado, X. A., and Arístegui, J.: Dissolved organic matter (DOM) in the open Mediterranean Sea. II: Basin-wide distribution and drivers of fluorescent DOM, Prog. Oceanogr., 170, 93–106, https://doi.org/10.1016/j.pocean.2018.10.019, 2019.
McKnight, D. M., Boyer, E. W., Westerhoff, P. K., Doran, P. T., Thomas Kulbe, T., and Andersen, D. T.: Spectrofluorometric characterization of dissolved organic matter for indication of precursor organic material and aromaticity, Limnol. Oceanogr., 46, 38–48, https://doi.org/10.4319/lo.2001.46.1.0038, 2001.
Miller, W. L. and Zepp, R. G.: Photochemical production of dissolved inorganic carbon from terrestrial organic matter: significance to the oceanic organic carbon cycle, Geophys. Res. Lett., 22, 417–420, https://doi.org/10.1029/94GL03344, 1995.
Miranda, M. L., Mustaffa, N. I. H, Robinson, T. B., Stolle, C., Ribas-Ribas, M., Wurl, O., and Zielinski, O.: Influence of solar radiation on biogeochemical parameters and fluorescent dissolved organic matter (FDOM) in the sea surface microlayer of the southern coastal North Sea, Elementa, 6, 15, https://doi.org/10.1525/elementa.278, 2018.
Miyazaki, Y., Yamashita, Y., Kawana, K., Tachibana, E., Kagami, S., Mochida, M., Suzuki, K., and Nishioka, J.: Chemical transfer of dissolved organic matter from surface seawater to sea-spray water-soluble organic aerosol in the marine atmosphere, Sci. Rep., 8, 14861, https://doi.org/10.1038/s41598-018-32864-7, 2018.
Mladenov, N., Sommaruga, R., MoralesBaquero, R., Laurion, I., Camarero, L., Diéguez, M.C., Camacho, A., Delgado, A., Torres, O., Chen, Z., Felip, M., and Reche, I.: Dust inputs and bacteria influence dissolved organic matter in clear alpine lakes, Nat. Commun., 2, 405, https://doi.org/10.1038/ncomms1411, 2011.
Moran, M. A., Sheldeon, W. M., and Zepp, R. G.: Carbon loss and optical property changes during long term photochemical and biological degradation of estuarine dissolved organic matter, Limnol. Oceanogr., 45, 1254–1264, https://doi.org/10.4319/lo.2000.45.6.1254, 2000.
Müller, C. L., Baker, A., Hutchinson, R., Fairchild, I. J., and Kidd, C.: Analysis of rainwater dissolved organic carbon compounds using fluorescence spectrophotometry, Atmos. Environ., 42, 8036–8045, https://doi.org/10.1016/j.atmosenv.2008.06.042, 2008.
Murphy, K., Stedmon, C. A., Graeber, D., and Bro, R.: Fluorescence spectroscopy and multi-way techniques, PARAFAC, Anal. Methods, 5, https://doi.org/10.1039/c3ay41160e, 2013.
Mustaffa, N. I. H., Ribas-Ribas, M., and Wurl, O.: High-resolution variability of the enrichment of fluorescence dissolved organic carbon in the sea surface microlayer of an upwelling region, Elementa-Sci. Anthrop., 5, 242, https://doi.org/10.1525/elementa.242, 2017.
Mustaffa, N. I. H., Badewien, T. H., Ribas-Ribas, M., and Wurl, O.: High-resolution observations on enrichment processes in the sea-surface microlayer, Sci. Rep., 8, 13122, https://doi.org/10.1038/s41598-018-31465-8, 2018.
Nelson, N. B. and Siegel, D. A.: The global distribution and dynamics of chromophoric dissolved organic matter, Ann. Rev. Mar. Sci., 5, 447–476, https://doi.org/10.1146/annurev-marine-120710-100751, 2013.
Nelson, N. B., Carlson, C. A., and Steinberg, D. K.: Production of chromophoric dissolved organic matter by Sargasso Sea microbes, Mar. Chem., 89, 273–287, https://doi.org/10.1016/j.marchem.2004.02.017, 2004.
Obernosterer, I. and Benner, R.: Competition between biological and photochemical processes in the mineralisation of dissolved organic carbon, Limnol. Oceanogr., 49, 117–124, https://doi.org/10.4319/lo.2004.49.1.0117, 2004.
Obernosterer, I., Catala, P., Lami, R., Caparros, J., Ras, J., Bricaud, A., Dupuy, C., van Wambeke, F., and Lebaron, P.: Biochemical characteristics and bacterial community structure of the sea surface microlayer in the South Pacific Ocean, Biogeosciences, 5, 693–705, https://doi.org/10.5194/bg-5-693-2008, 2008.
Opsahl, S. and Benner, R.: Photochemical reactivity of dissolved lignin in river and ocean waters, Limnol. Oceanogr., 43, 1297–1304, https://doi.org/10.4319/lo.1998.43.6.1297, 1998.
Opsahl, S. P. and Zepp, R. G.: Photochemically-induced alteration of stable carbon isotope ratios (δ13C) in terrigenous dissolved organic carbon, Geophys. Res. Lett., 28, 2417–2420, https://doi.org/10.1029/2000GL012686, 2001.
Ortega-Retuerta, E., Frazer, T. K., Duarte, C. M., Ruiz-Halpern, S., Tovar-Sanchez, A., Arrieta, J. M., and Reche, I.: Biogeneration of chromophoric dissolved organic matter by bacteria and krill in the Southern Ocean, Limnol. Oceanogr., 54, 1941–1950, 2009.
Osburn, C. L., Handsel, L. T., Mikan, M. P., Paerl, H. W., and Montgomery, M. T.: Fluorescence tracking of dissolved and particulate organic matter quality in a river-dominated estuary, Environ. Sci. Technol., 46, 8628–8636, https://doi.org/10.1021/es3007723, 2012.
Penezić, A., Drozdowska, V., Novak, T., Gašparović, B.: Distribution and characterization of organic matter within the sea surface microlayer in the Gulf of Gdańsk, Oceanologia, 4, 631–650, https://doi.org/10.1016/j.oceano.2022.05.003, 2022.
Pereira, R., Schneider-Zapp, K., and Upstill-Goddard, R. C.: Surfactant control of gas transfer velocity along an offshore coastal transect: results from a laboratory gas exchange tank, Biogeosciences, 13, 3981–3989, https://doi.org/10.5194/bg-13-3981-2016, 2016.
Pereira, R., Ashton, I., Sabbaghzadeh, B., Shutler, J. D., and Upstill-Goddard, R. C.: Reduced air–sea CO2 exchange in the Atlantic Ocean due to biological surfactants, Nat. Geosci., 11, 492–496, https://doi.org/10.1038/s41561-018-0136-2, 2018.
Pitta, E. and Zeri, C.: The impact of combining data sets of fluorescence excitation-emission matrices of dissolved organic matter from various aquatic sources on the information retrieved by PARAFAC modelling, Spectrochim. Acta A Mol. Biomol. Spectrosc., 258, 119800, https://doi.org/10.1016/j.saa.2021.119800, 2021.
Pitta, E., Zeri, C., Tzortziou, M., Mousdis, G., and Scoullos, M.: Seasonal variations in dissolved organic matter composition using absorbance and fluorescence spectroscopy in the Dardanelles Straits - North Aegean Sea mixing zone, Cont. Shelf Res., 149, 82–95, https://doi.org/10.1016/j.csr.2016.07.013, 2017.
Retelletti Brogi, S., Charrière, B., Gonnelli, M., Vaultier, F., Sempéré, R., Vestri, S., and Santinelli, C.: Effect of UV and Visible Radiation on Optical Properties of Chromophoric Dissolved Organic Matter Released by Emiliania huxleyi, J. Mar. Sci. Eng., 8, 888, https://doi.org/10.3390/jmse8110888, 2020.
Ribas-Ribas, M., Mustaffa, N. I. H., Rahlff, J., Stolle, C., and Wurl, O.: Sea Surface Scanner (S3): A catamaran for high-resolution measuremnets of biochemical properties of the sea surface microlayer, J. Atmos. Ocean. Tech., 34, 1433–1448, https://doi.org/10.1175/JTECH-D-17-0017.1, 2017.
Rickard, P. C., Uher, G., and Upstill-Goddard, R.: Photo-reactivity of surfactants in the sea-surface microlayer and subsurface water of the Tyne estuary, UK, Geophys, Res. Lett., 49, https://doi.org/10.1029/2021GL095469, 2022.
Rochelle-Newall, E. J. and Fisher, T. R.: Production of chromophoric dissolved organic matter fluorescence in marine and estuarine environments: an investigation into the role of phytoplankton, Mar. Chem., 77, 7–21, https://doi.org/10.1016/S0304-4203(01)00072-X, 2002.
Romera-Castillo, C., Sarmento, H., Álvarez-Salgado, X. A., Gasol J. M., and Marrase, C.: Production of chromophoric dissolved organic matter by marine phytoplankton, Limnol. Oceanogr., 55, 446–454, https://doi.org/10.4319/lo.2010.55.1.0446, 2010.
Romera-Castillo, C., Nieto-Cis, M., Castro, C. G., Marrase, C., Largier, J., Barton, E. D., and Alvarez-Salgado, X. A.: Fluorescence: absorption coefficient ratio – tracing photochemical and microbial degradation processes affecting coloured dissolved organic matter in a coastal system, Mar. Chem., 125, 26–38, https://doi.org/10.1016/j.marchem.2011.02.001, 2011.
Sabbaghzadeh, B., Upstill-Goddard, R. C., Beale, R., Pereira, R., and Nightingale, P. D.: The Atlantic Ocean surface microlayer from 50° N to 50° S is ubiquitously enriched in surfactants at wind speed up to 13 m s−1, Geophys. Res. Lett., 44, 2852–2858, https://doi.org/10.1002/2017GL072988, 2017.
Sabbaghzadeh, B., Uher, G., and Upstill-Goddard, R.: Dynamics of chromophoric dissolved organic matter in the Atlantic Ocean: unravelling province-dependent relationships, optical complexity, and environmental influences, Front. Mar. Sci., 11, https://doi.org/10.3389/fmars.2024.1432133, 2024.
Santos, P. S. M., Santos, E. B. H., and Duarte, A. C.: First spectroscopic study on the structural features of dissolved organic matter isolated from rainwater in different seasons, Sci. Total Environ., 426, 172–179, https://doi.org/10.1016/j.scitotenv.2012.03.023, 2012.
Stedmon, C. A. and Markager, S.: Tracing the production and degradation of autochthonous fractions of dissolved organic matter by fluorescence analysis, Limnol. Oceanogr., 50, 1415–1426, https://doi.org/10.4319/lo.2005.50.5.1415, 2005.
Stedmon, C. A., Thomas, D. N., Granskog, M. A., Kaartokallio, H., Papadimitriou, S., and Kuosa, H.: Characteristics of dissolved organic matter in Baltic coastal sea ice: Allochthonous or Autochthonous origins?, Environ. Sci. Technol., 41, 7273–7279, https://doi.org/10.1021/es071210f, 2007.
Stolle, C., Nagel, K., Labrenz, M., and Jürgens, K.: Succession of the sea-surface microlayer in the coastal Baltic Sea under natural and experimentally induced low-wind conditions, Biogeosciences, 7, 2975–2988, https://doi.org/10.5194/bg-7-2975-2010, 2010.
Stolle, C., Ribas-Ribas, M., Badewien, T. H., Barnes, J., Carpenter, L. J., Chance, R., Damgaard, L. R., Quesada, A. M. D., Engel, A., Frka, S., Galgani, L., Gašparović, B., Gerriets, M., Mustaffa, N. I. H., Herrmann, H., Kallajoki, L., Pereira, R., Radach, F., Revsbech, N. P., Rickard, P., Saint, A., Salter, M., Striebel, M., Triesch, N., Uher, G., Upstill-Goddard, R. C., van Pinxteren, M., Zäncker, B., Zieger, P., and Wur, O.: The Milan Campaign: Studying diel light effects on the air-sea interface, B. Am. Meteorol. Soc., 101, 146–166, https://doi.org/10.1175/BAMS-D-17-0329.2, 2020.
Tilstone, G. H., Airs, R. L., Vicente, V. M., Widdicombe, C., and Llewellyn, C.: High concentrations of mycosporine-like amino acids and colored dissolved organic matter in the sea surface microlayer off the Iberian Peninsula, Limnol. Oceanogr., 55, 1835–1850, https://doi.org/10.4319/lo.2010.55.5.1835, 2010.
Twardowski, M. S. and Donaghay, P. L.: Separating in situ and terrigenous sources of absorption by dissolved materials in coastal waters, J. Geophys. Res., 106, 2545–2560, https://doi.org/10.1029/1999JC000039, 2001.
Tzempelikou, E., Zeri, C., Pitta, E., Assimakopoulou, G., Pavlidou, A., and Rousselaki, E.: Temporal dynamics of transparent exopolymer particles in surface waters and sea surface microlayer in the coastal Eastern Mediterranean Sea, Reg. Stud. Mar. Sci., 85, https://doi.org/10.1016/j.rsma.2025.104163, 2025.
Tzortziou, M., Neale, P. J., Megonigal, J. P., Pow, C. L., and Butterworth, M.: Spatial gradients in dissolved carbon due to tidal marsh outwelling into a Chesapeake Bay estuary, Mar. Ecol. Prog. Ser., 426, 41–56, https://doi.org/10.3354/meps09017, 2011.
Upstill-Goddard, R. C.: Air–sea gas exchange in the coastal zone, Estuar. Coast. Shelf Sci., 70, 388–404, https://doi.org/10.1016/j.ecss.2006.05.043, 2006.
Vahatalo, A. V. and Wetzel, R. G.: Photochemical and microbial decomposition of chromophoric dissolved organic matter during long (months–years) exposures, Mar. Chem., 89, 313–326, https://doi.org/10.1016/j.marchem.2004.03.010, 2004.
van Pinxteren, M., Mav E., Herrmann, H., and Herrmann, H.: Chemical characterization of dissolved organic compounds from coastal sea surface microlayers (Baltic Sea, Germany), Environ. Sci. Technol., 46, 10455–10462, https://doi.org/10.1021/es204492b, 2012.
van Pinxteren, M., Barthel, S., Fomba, K. W., Muller, K., von Tumpling, W., and Herrmann, H.: The influence of environmental drivers on the enrichment of organic carbon in the sea surface microlayer and in submicron aerosol particles – measurements from the Atlantic Ocean, Elementa, 5, 35, https://doi.org/10.1525/elementa.225, 2017.
Weishaar, J. L., Aiken, G. R., Bergamaschi, B. A., Fram, M. S., Fujii, R., and Mopper, K.: Evaluation of Specific Ultraviolet Absorbance as an Indicator of the Chemical Composition and Reactivity of Dissolved Organic Carbon, Environ. Sci. Technol., 37, 4702–4708, https://doi.org/10.1021/es030360x, 2003.
Willey, J. D., Kieber, R. J., Eyman, M. S., and Avery Jr., G. B.: Rainwater dissolved organic carbon: concentrations and global flux, Glob. Biogeochem. Cycles, 14, 139–148, https://doi.org/10.1029/1999GB900036, 2000.
Wu, G., Fu, P., Ram, K., Song, J., Chen, Q., Kawamura, K., Wan, X., Kang, S., Wang, X., Laskin, A., and Cong, Z.: Fluorescence characteristics of water-soluble organic carbon in atmospheric aerosol, Environ. Pollut., 268, 115906, https://doi.org/10.1016/j.envpol.2020.115906, 2021.
Wurl, O. and Holmes, M.: The gelatinous nature of the sea-surface microlayer, Mar. Chem., 110, 89–97, https://doi.org/10.1016/j.marchem.2008.02.009, 2008.
Wurl, O. and Obbard, J. P.: A review of pollutants in the sea-surface microlayer (SML): a unique habitat for marine organisms, Mar. Pollut. Bull., 48, 1016–1030, https://doi.org/10.1016/j.marpolbul.2004.03.016, 2005.
Wurl, O., Miller, L., Röttgers, R., and Vagle, S.: The distribution and fate of surface-active substances in the sea-surface microlayer and water column, Mar. Chem., 115, 1–9, https://doi.org/10.1016/j.marchem.2009.04.007, 2009.
Wurl, O., Stolle, C., Van Thuoc, C., The Thu, P., and Mari, X.: Biofilm-like properties of the sea surface and predicted effects on air-sea CO2 exchange, Prog. Oceanogr., 144, 15–24, https://doi.org/10.1016/j.pocean.2016.03.002, 2016.
Xu, G. B., Yan, S. B., Wang, J., Xu, F., Ji, X., Ni, J., Liu, Z., and Yang, G. P.: Carbon monoxide cycling in the marginal sea: A case of the yellow sea and the east China sea, Mar. Environ. Res., 210, 107328, https://doi.org/10.1016/j.marenvres.2025.107328, 2025.
Yang, L., Chen, W., Zhuang, W.-E., Cheng, Q., Li, W., Wang, H., Guo, W., Chen-Tung Arthur Chen, and Liu, M.: Characterization and bioavailability of rainwater dissolved organic matter at the southeast coast of China using absorption spectroscopy and fluorescence EEM-PARAFAC, Mar. Chem., 210, 11–22, https://doi.org/10.1016/j.ecss.2018.11.002, 2019.
Yang, L., Zhang, J., Engel, A., and Yang, G.-P.: Spatio-temporal distribution, photoreactivity and environmental control of dissolved organic matter in the sea-surface microlayer of the eastern marginal seas of China, Biogeosciences, 19, 5251–5268, https://doi.org/10.5194/bg-19-5251-2022, 2022.
Zäncker, B., Bracher, A., Röttgers, R., and Engel, A.: Variations of the Organic Matter Composition in the Sea Surface Microlayer: A Comparison between Open Ocean, Coastal, and Upwelling Sites Off the Peruvian Coast, Front. Microbiol., 8, 2369, https://doi.org/10.3389/fmicb.2017.02369, 2017.
Zervoudaki, S., Siokou, I., Krasakopoulou, E., Kontoyiannis, H., Pavlidou, A., Assimakopoulou, G., Katsiaras, N., Reizopoulou, S., Karageorgis, A. P., Kaberi, H., Lardi, P. I., Gerakaris, V., Tsiamis, K., Salomidi, M., Zeri, C., Pitta, E., Strogyloudi, E., Parinos, C., Hatzianestis, I., Christou, E. D., Zoulias, T., Sakavara, A., Pagou, K., Zenetos, A., Panayotidis, P., and Simboura, N.: Biogeochemical Characteristics in the Saronikos Gulf (Aegean Sea, Eastern Mediterranean), in: The Aegean Sea Environment: Anthropogenic Presence and Impact, edited by: Anagnostou, C. L., Kostianoy, A. G., Mariolakos, I. D., Panayotidis, P., Soilemezidou, M., and Tsaltas G., Hdb Environ. Chem., Springer, 142, 511–568, https://doi.org/10.1007/698_2022_898, 2022.
Zhang, Y., Liu, X., Osburn, C. L., Wang, M., Qin, B., and Zhou, Y.: Photobleaching response of different sources of chromophoric dissolved organic matter exposed to natural solar radiation using absorption and excitation-emission matrix spectra, PLoS One, 8, e77515, https://doi.org/10.1371/journal.pone.0077515, 2013.
Zhang, Z., Cai, W., Liu, L., Liu, C., and Chen, F.: Direct determination of thickness of sea surface microlayer using a pH microelectrode at original location, Sc. China Ser. B-Chem, 46, 339–351, https://doi.org/10.1360/02yb0192, 2003.