
the Creative Commons Attribution 4.0 License.
the Creative Commons Attribution 4.0 License.
 | 07 Aug 2026

Improved model predictions of carbon and water fluxes by including drought legacy effects
Yitong Yao
Yi Yin
Jeffrey D. Wood
Christian Frankenberg
Besides simultaneous influences, droughts have lasting impacts on vegetation by impairing hydraulic and photosynthetic capacities, known as the drought legacy effects. The ignorance of legacy effects in numerical simulations, such as lagged xylem recovery, may lead to significant model-observation discrepancies. However, the limited temporal resolution of most observational data makes it challenging to capture the physiological dynamics necessary to improve model accuracy. Here, we investigated the recovery of carbon flux (represented by gross primary productivity, GPP) and water flux (represented by evapotranspiration, ET) following a severe drought in 2012, using half-hourly eddy-covariance flux observations and weekly predawn leaf water potential measurements from a temperate forest in the Central US. We implemented both optimality-based and empirical stomatal models within a land surface model, testing three drought recovery scenarios for each: no recovery, full recovery, and partial recovery of xylem hydraulic conductance and photosynthetic capacity. Before and during the drought, all stomatal models performed similarly for GPP and ET. Post-drought, assuming no recovery led to underestimated ET; assuming full recovery led to overestimated GPP; and assuming partial recovery improved both, indicating persistent biochemical limitations after drought. The observed carbon-water decoupling during and after the event further points to non-stomatal constraints on photosynthesis and unequal stress on carbon and water fluxes. Our work highlights the need to account for delayed recovery of xylem hydraulics and photosynthetic capacity when modeling drought legacy effects. Further research to mechanistically represent dynamic recovery processes, particularly their duration and magnitude, is essential for improving the modeling of global carbon and water fluxes.
- Article
(1193 KB) - Full-text XML
-
Supplement
(1678 KB) - BibTeX
- EndNote


Plants are exposed to increasing frequency and severity of extreme events under climate change, such as heatwaves and droughts (Piao et al., 2019; Xu et al., 2019). During droughts, reduced precipitation and higher evaporation demand driven by rising air temperature usually lead to further depletion of soil moisture (Bastos et al., 2020; Wolf et al., 2016). Although plants partially close their stomata to protect their hydraulic systems from excessive damage (Sperry et al., 2017; Wang et al., 2020), they often suffer irreversible hydraulic impairment due to xylem cavitation. As a result, even after meteorological drought conditions are alleviated, persistent hydraulic damage limits water transport to leaves and a downregulation of photosynthesis capacity may persist (Müller and Bahn, 2022). The reduced photosynthetic capacity during and after drought conditions, caused by insufficient water supply, further delays recovery to pre-drought functionality. This lagged recovery, often referred to as the drought legacy effect, has been documented in drought-induced tree mortality (Matusick et al., 2018), carbon fluxes (Haberstroh et al., 2025), and tree ring growth (Anderegg et al., 2015). Vegetation models, however, often fail to accurately capture drought responses and legacy effects (Anderegg et al., 2015), as they typically oversimplify plant hydraulic processes and stomatal behavior, neglecting the persistent damage to hydraulic and photosynthetic systems. Quantifying the magnitude and timing of hydraulic impairment and recovery is therefore essential particularly for local scale modeling and important also for large-scale land surface and Earth system models to better represent the global carbon cycle.
Typical model simulations simplify the complexity and diversity of ecosystems by using plant functional type (PFT)-specific parameters to represent ecosystem responses. These models are often constrained by ecosystem-level measurements, which reflect the average of potentially divergent responses within the system. To simulate the effects of drought on CO2 assimilation and transpiration loss, models often use a scaling factor (β) ranging from 0 to 1, to attenuate photosynthesis and/or stomatal conductance. Empirical stomatal models like the Ball-Berry model (Ball et al., 1987), Medlyn model (Medlyn et al., 2011), and Leuning model (Leuning, 1995), typically include a semi-empirical stomatal slope parameter g1, which reflects the efficiency of carbon gain relative to water cost. The accuracy of these models largely depends on the representation of water stress impacts on photosynthesis. Drought responses in photosynthesis are driven by both stomatal and non-stomatal limitations as shown through observations and model studies (Drake et al., 2017; Egea et al., 2011). However, the relative importance of these two components varies across studies (Gourlez de la Motte et al., 2020; Keenan et al., 2009, 2010; Reichstein et al., 2003; Zhou et al., 2015, 2013), and depends on the intensity and duration of water stress (Niinemets and Keenan, 2014). These limitations can be incorporated into models by either reducing the well-watered maximum carboxylation rate (Vcmax) to account for biochemical constraints (Kennedy et al., 2019) or adjusting the stomatal slope parameter (g1) to represent biophysical limitations (De Kauwe et al., 2015).
After drought events, the scaling factor β is often assumed to return to 1 as soil water refills (Fang and Gentine, 2024). Many terrestrial ecosystem models presume that this recovery is both immediate and complete, leading to the full restoration of carboxylation efficiency, stomatal conductance, and associated carbon and water fluxes. However, this assumption is likely invalid, as many studies have documented persistent drought legacy effects lasting from subseasonal to multi-year time scales (Anderegg et al., 2015; Kannenberg et al., 2020; Wu et al., 2018). These effects have been observed through carbon flux measurements (Yu et al., 2022), tree ring width analysis (Anderegg et al., 2015), and vegetation greenness indices (Wu et al., 2018) using both field observations and satellite data. This evidence highlights a critical limitation in the full recovery assumption commonly employed in models. Despite advancements in our understanding of plant physiological responses to drought, there remains a substantial knowledge gap regarding the key factors driving drought legacy effects and their underlying mechanisms. Addressing this gap is essential for improving the accuracy of ecosystem models in representing post-drought recovery processes.
A potential explanation for drought legacy effects is the incomplete recovery of hydraulic conductance, even after soil moisture has refilled, which limits upward water transport to the canopy (Kannenberg et al., 2020). This residual stress can propagate into biochemistry (Vcmax) and impose limitations on intrinsic water use efficiency through g1. However, the incomplete recovery of hydraulic conductance, Vcmax, or g1 has not been explicitly incorporated into most process-based models. Traditionally, water stress in models is represented as a nonlinear function of soil moisture content. Recent advancements in modeling the soil-plant-atmosphere continuum have improved the representation of plant water stress (Eller et al., 2020; Kennedy et al., 2019; Wang et al., 2021; Xu et al., 2016; Yao et al., 2022). These advancements incorporate vertically-resolved water pressure profiles and hydraulic traits through vulnerability curves, enabling the simulation of dynamic hydraulic conductance over time. In this context, imposing limits on hydraulic conductance offers a practical way to represent the incomplete recovery of hydraulic function after soil moisture refilling. These limits reflect the “stress history” experienced by plants, which can be inferred from observational data. Although drought legacy effects have been observed across a variety of metrics and time scales (Anderegg et al., 2015; Yu et al., 2022), higher temporal resolution data often provides better opportunities for model-data assimilation compared to coarser datasets. By integrating high-resolution observational carbon and water flux data with improved modeling frameworks, we can better understand the dominant controls on ecosystem-level drought legacy effects and their long-term impacts on ecosystem functioning.
In the summer of 2012, the Central US experienced a severe drought that rapidly developed and intensified over less than two months (Basara et al., 2019). This study focuses on the Missouri Ozark AmeriFlux (MOFLUX) eddy-covariance site located at the epicenter of the drought, providing an ideal setting to investigate drought effects. Using a land surface model (Climate Modeling Alliance, CliMA, Wang et al., 2021) and flux observations from the MOFLUX site, we aim to test the model's performance by incorporating drought legacy effects assimilated from observations. Our study was driven by three main objectives:
-
simulating the drought response using the CliMA land surface model.
-
identifying the relative strength of biochemical and stomatal factors in limiting carbon and water fluxes after the drought.
-
diagnostically integrating legacy effects to test model performance under different recovery scenarios.
To assess the generalizability of the modeling framework, we extended the analysis by conducting simulations for five additional sites affected by the 2012 drought. The findings of our research will contribute to a better understanding of recovery processes and the factors driving drought legacy effects, enabling more accurate identification of where and how to apply stress factors in models.
2.1 US-MOz site
The MOFLUX eddy-covariance flux tower (AmeriFlux ID: US-MOz) is located in the Central US (latitude: 38.7441, longitude: −92.2000), and characterized by a warm, humid and continental climate zone. The mean annual temperature is 13 °C and the mean annual precipitation is 1,140 mm. Important tree species in the area are white oak (Quercus alba), black oak (Q. velutina), sugar maple (Acer saccharum), shagbark hickory (Carya ovata), and eastern redcedar (Juniperus virginiana) (Gu et al., 2015). We used half-hourly measurements of evapotranspiration (ET), as well as net ecosystem carbon dioxide exchange (NEE) from which gross primary productivity (GPP) was inferred using the night-time partitioning method. The processing of carbon and water fluxes data used here follows the standardized AmeriFlux pipelines (Gu et al., 2016). Site-level leaf area index (LAI) was extracted using the GriddingMachine package (Wang et al., 2022) from MODIS (MODerate resolution Imaging Spectroradiometer) LAI products (Yuan et al., 2011). Predawn leaf water potential (Ψleaf,pd) measurements were initiated in 2004 and were carried out weekly to bi-weekly.
The 2012 drought is one of the most extensive drought events over the Central US on record, with rapid development and pronounced area encompassed by persistent dryness and warm temperatures. Specifically, the drought peaked in July, when nearly 64 % of the area experienced at least moderate drought. Wood et al. (2023) divided the 2012 growing season into four stages: peak flux (DOY 125–150), flash stress (DOY 160–180), wilted (DOY 185–240), and recovery (DOY 255–270). We slightly modified these period definitions to eliminate any gaps between them, defining the stages as follows: peak flux (DOY 125–150), flash stress (DOY 150–180), wilted (DOY 180–240), and recovery (DOY 240–280).
2.2 Other flux sites used for model validation
We conducted model simulations at several flux-tower sites that experienced the 2012 drought, including US-MMS, US-GLE, US-UMB, US-NR1, and US-UMd. The US-MMS site is located in Morgan-Monroe State Forest, Indiana, within a temperate deciduous broadleaf forest dominated by a maple–beech–oak–hickory transition community representing secondary successional stands approximately 60–80 years old (Novick and Phillips, 2022). The US-GLE site is located in northern Michigan and consists of a mixed forest composed of aspen, maple, pine, and northern hardwood species (Frank et al., 2022). The US-UMB site, also located in northern lower Michigan, is an aspen-dominated northern hardwood forest (Classen et al., 2023). The US-NR1 site is located in the Rocky Mountains of Colorado within a subalpine evergreen needleleaf forest dominated by Abies lasiocarpa, Picea engelmannii, and Pinus contorta (Blanken et al., 2026). The US-UMd site, located in northern lower Michigan, represents a temperate deciduous broadleaf forest (Gough et al., 2024).
2.3 Vegetation module of CliMA Land
We used the vegetation module of the land surface model developed within the Climate Modeling Alliance (CliMA) (Wang et al., 2021, 2023). The model's performance has been validated in terms of carbon and water fluxes, as well as solar-induced chlorophyll fluorescence (Braghiere et al., 2021; Wang et al., 2021, 2023). The model adopts a modular structure, allowing flexible combinations of radiative transfer schemes (broadband or hyperspectral), photosynthesis models, stomatal models, and plant hydraulic representations.
We ran CliMA Land in hyperspectral mode for radiative transfer with a vertically resolved canopy, each layer of which is further split into sunlit and shaded fractions based on uniform leaf inclination and azimuthal distributions (Wang and Frankenberg, 2022; Zhao et al., 2019). At each time step, sunlit fractions and absorbed photosynthetically active radiation (APAR) are calculated, and leaf-level photosynthesis is solved by coupling the diffusion model with the Farquhar model (Farquhar et al., 1980) (Eq. 1). LAI is prescribed from 8 d MODIS observations and linearly interpolated to daily values, thereby capturing seasonal phenology and structural changes during the 2012 drought (Fig. S1 in the Supplement). Soil respiration is modeled using the Arrhenius equation with parameterized temperature sensitivity of soil respiration.
where Vcmax is the maximum rate of Rubisco activity and Km is the Michaelis-Menten coefficient for Rubisco kinetics. Γ∗ is the CO2 compensation point in the absence of dark respiration and Rd is the dark respiration rate. Ca is ambient CO2 concentration. Ci is the intercellular CO2 concentration. The model details of stomatal conductance (gs) can be found in Sect. 2.4.
Canopy transpiration is computed using the diffusion model as Eq. (2).
LAIi is the leaf area index of ith layer. D is leaf-to-air vapour pressure deficit. 1.6 is the unitless relative diffusivity of water vapor with respect to CO2.
The hydraulic system is represented as a vertically solved soil-plant-atmosphere continuum, including two root layers and 19 canopy layers. A fixed root : stem : leaf resistance ratio of is assumed (Sperry et al., 2017). Leaf water potential (Ψleaf) is updated following Darcy's law based on vertical water flow and hydraulic conductance (Eq. 3).
F is transpiration-driven vertical water flow and Ki is hydraulic conductance of each segment. Ψsoil is soil water potential.
Wood capacitance and water storage dynamics were not included. Our model does not simulate soil evaporation and re-evaporation of rainfall interception, so we used a fixed ratio (0.67, falling in range reported in Fatichi and Pappas, 2017) to link the modeled plant transpiration to ET observation. We also tested varying T/ET ratio with observation-based partitioned transpiration (Zhou et al., 2016).
2.4 Stomatal conductance models and water stress formulation
The CliMA Land model incorporates several stomatal optimality models (e.g., Eller et al., 2020; Sperry et al., 2017; Wang et al., 2020) and three empirical stomatal models: Medlyn (Medlyn et al., 2011), Ball-Berry (Ball et al., 1987) and Leuning models (Leuning, 1995). In this study, we used the Medlyn stomatal model and an optimality stomatal model (Wang et al., 2021). In empirical formulations, drought responses are introduced through a water stress factor β. Two pathways of stress propagation are considered. The first one operates by adjusting parameters of the empirical stomatal models, such as the slope parameter (g1) (Eq. 4). The second pathway involves the modulation of photosynthetic capacity through down-regulation of Vcmax (Eq. 5), which also reduces stomatal conductance as photosynthesis is reduced. A schematic is shown in Fig. 1.
where D is leaf-to-air vapour pressure deficit. g0 and g1 are empirical parameters.
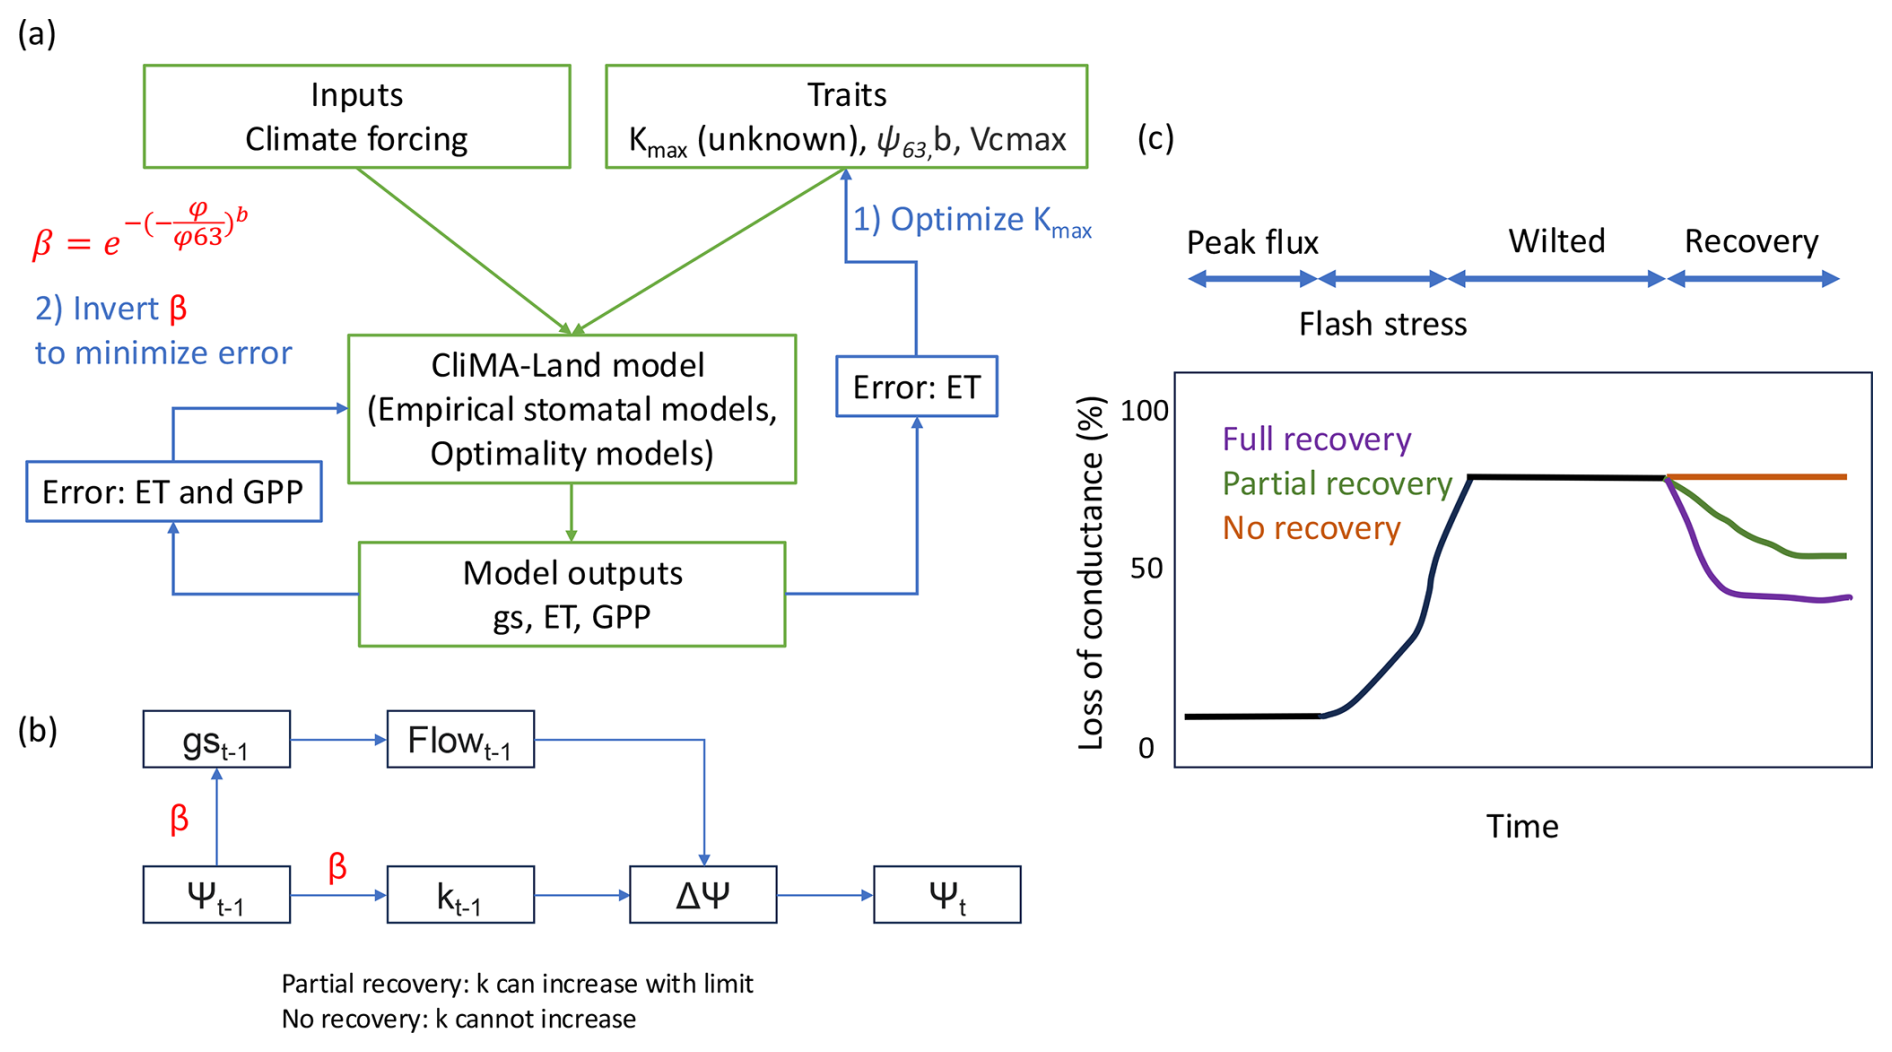
Figure 1Schematic of the modeling framework. Abbreviations: gs, stomatal conductance; ET, evapotranspiration; GPP, gross primary productivity; Ψ63: the water potential when 63 % of hydraulic conductance is lost, b: shape parameter in Weibull function; Kmax, maximum hydraulic conductance. (a) Workflow of simulations and data constraints. (b) Conceptual updating of leaf water potential (Ψ); in empirical stomatal models, β is applied either to g1 or to Vcmax to represent water-stress effects, and β also scales hydraulic conductance (), thereby affecting Ψ. (c) Time series of percentage loss of hydraulic conductance under the three recovery scenarios (full, partial, no recovery).
For the optimality-based model, stomatal conductance maximizes the difference between leaf-level carbon gain and hydraulic risk, with risk represented through leaf hydraulics and their coupling to photosynthesis (Eq. 6).
where E is the leaf-level transpiration rate, and Ecrit is the critical transpiration rate at which the leaf xylem hydraulic conductance decreases to 0.1 % of the maximum value (namely at 99.9 % loss of hydraulic conductance). Anet is the net photosynthesis rate. β does not directly scale stomatal conductance; instead, it is applied to hydraulic conductance, thereby influencing transpiration-driven water flow.
2.5 Model parameters
We utilized vegetation traits such as the vulnerability curve (VC), Vcmax at 25 °C, semi-empirical slope parameter (g1) that characterizes the efficiency of carbon gain relative to water cost, and maximum hydraulic conductance (Kmax), from published references wherever possible. The well-watered Vcmax value was obtained from curves measurements made at the site in May 2012, when the plants had not been hit by the severe water stress and Ψleaf,pd was close to 0 MPa (Gu et al., 2010). We took the average of the extracted Vcmax from these measurements (65.8±18.8 ). We used the “fitaci” function in package “plantecophys” version 1.4-6 (Duursma, 2015) to derive the fitted Vcmax at 25 °C. The root mean squared error from fitting is between 0.48–2.68 . We used g1 value for deciduous broadleaf forests from De Kauwe et al. (2015).
For the VC of white oak, we used the sigmoid format parameters from Benson et al. (2022) and transformed it to Weibull function format, which better fits the observations. VC was used to compute the stress factor β (Eq. 7). Ψ63 indicates the xylem pressure at ∼63 % loss of conductivity, and b is the shape parameter (Neufeld et al., 1992). This β formula is the same for stomatal and non-stomatal limitations.
where MPa, b=2.52.
We did not find measurements for Kmax, therefore, this parameter was fitted by minimizing the error of ET between the model simulations and eddy-covariance observations over the pre-recovery periods (Eq. 8). Different Kmax values were obtained depending on the chosen stomatal models, the location of β, and recovery assumptions (Table S1 in the Supplement). We also optimized Kmax over longer pre-drought periods, extending to earlier years, which revealed notable inter-annual variability. For instance, in years with less water stress, such as 2010, the optimized Kmax was significantly higher (2.81 mol m−2 s−1 MPa−1) compared to 2012, a drought year (0.89 mol m−2 s−1 MPa−1). Consequently, we optimized Kmax using 2012 data alone.
Subscripts of “obs” and “mod” denote the flux observation and modeled term. The operator ∑ takes the sum of the absolute difference between flux observation and model output. The operator “SD” takes the standard deviation of flux observation.
2.6 Hydraulic conductance recovery scenarios
Three scenarios are considered regarding the recovery of hydraulic conductance for each stomatal model setup, including optimality, Medlyn-Vcmax, and Medlyn-g1. In total, the “partial recovery scenario” falls between the “full recovery scenario” and the “no recovery scenario” (Fig. 1c).
-
Full recovery scenario (FR): Hydraulic conductance can either increase or decrease and the shape of the vulnerability curve remains constant, i.e. is not affected by the previous severe water stress condition. In other words, the water potential and hydraulic conductance can be updated without specific boundaries (Eq. 9). Only transient (or immediate) responses are considered.
KFR(t) is updated according to the water stress factor β (Eq. 9).
ψ(t) is leaf water potential at time t. KFR(t) is hydraulic conductance under FR at time t.
-
Partial recovery scenario (PR): In reality, the full recovery of the hydraulic system may not necessarily occur due to irreversible processes such as a broken hydraulic transport system (e.g., embolism). Recovery can vary depending on the time scale; for instance, the construction of new xylem over time may facilitate greater recovery, while immediate recovery following a drought may be limited. The extent of potential plant recovery can be inferred from the response of carbon and water fluxes to post-drought climate conditions by applying a similar concept of optimizing ecosystem models through assimilating eddy-covariance measurements in Wolf et al. (2006). By minimizing the difference between modeled and observed carbon and water fluxes, we diagnostically derived the water stress time series and updated modeled leaf water potential at each time step. β is estimated by minimizing the model-observation mismatch (Eq. 10). KPR(t) is then updated using the inverted β (Eq. 11).
KPR(t) is hydraulic conductance under PR at time t.
In empirical stomatal models, β serves as an integrated proxy for the recovery state of both hydraulic and biochemical or stomatal processes, and their dynamics jointly contribute to the simulated drought legacy effects. Comparing Medlyn-Vcmax and Medlyn-g1 configurations reveals which process, biochemical or nonbiochemical, better explains the recovery of carbon and water fluxes.
-
No recovery scenario (NR): Hydraulic conductance can't increase (recover) over time. During severe water stress events, hydraulic conductance decreases due to a drop in water potential. Subsequently, during the post-drought period, hydraulic conductance cannot increase or return to its pre-drought state. KNR(t) is constrained to be non-increasing (Eqs. 12–13). When drought causes ψ(t) to become more negative, instantaneous hydraulic conductance Kinst drops and KNR drops. After drought, ψ(t) becomes less negative and Kinst increases. However, the minimum operator in Eq. (13) prevents recovery of KNR.
where KNR(t) is hydraulic conductance under NR at time t.
All three recovery scenarios share the same initial condition corresponding to the pre-drought state (Eq. 14).
where t0 represents time before recovery.
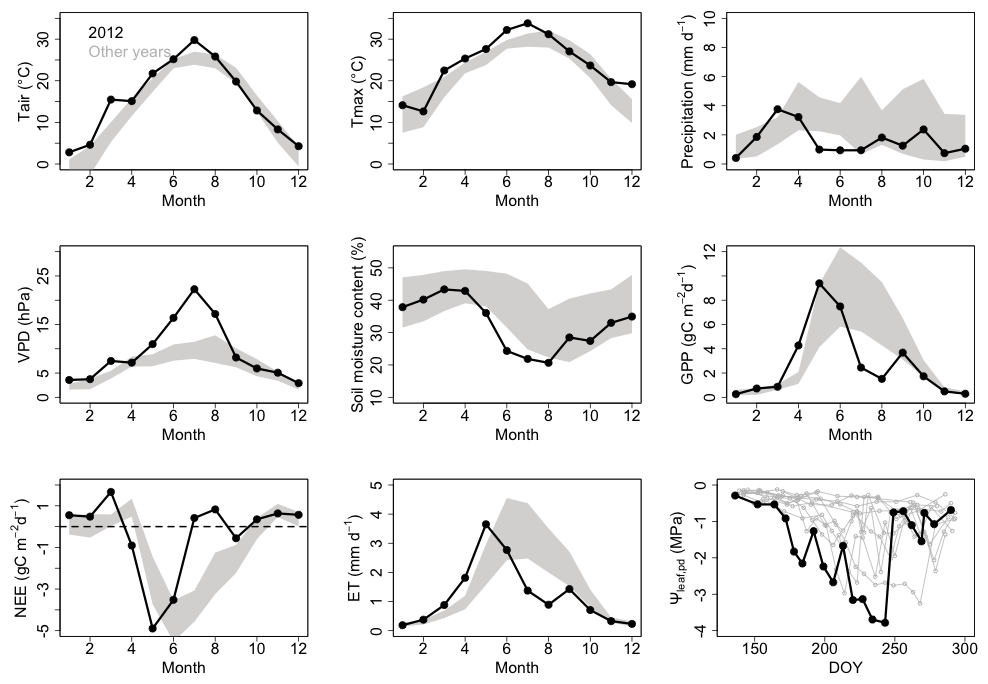
Figure 2Drought response of meteorology, ecosystem fluxes, and plant water status. Time series of monthly mean air temperature (Tair), monthly maximum air temperature (Tmax), monthly mean precipitation rate, vapor pressure deficit (VPD), near-surface soil moisture, GPP, NEE, ET, and community predawn leaf water potential (Ψleaf,pd). The 2012 event is shown as a bold black line; the 2004–2019 record (excluding 2012) appears as gray shading indicating mean ±1σ.
3.1 2012 drought conditions
In 2012, the Central US experienced a severe drought that impacted various climatological variables, carbon and water fluxes as shown in Fig. 2 for the MOFLUX site. During the earlier growing season, the air temperature exceeded records from other years, and precipitation reached the upper limit of recorded range. These conditions resulted in an overshoot (or peak flux) detected in the fluxes of GPP and ET. However, in the summer months of June and July, the monthly mean and maximum air temperature were 3 °C higher than those of other years spanning from 2007 to 2019, while summer precipitation only reached 30 % of normal levels. Furthermore, the vapour pressure deficit (VPD) in July was almost double that of other years. Periodic measurements of community Ψleaf,pd also showed extremely negative values as low as −4 MPa near the end of August, which was a rare occurrence. This meteorological drought led to a significant reduction in LAI, GPP, NEE and ET in the middle of 2012 (Figs. 2, S1). However, in September, soil water levels began to replenish, and carbon and water fluxes gradually started to recover. While climatological stress eased at that time, fluxes only reached the lower end of the expected range from multi-year records.
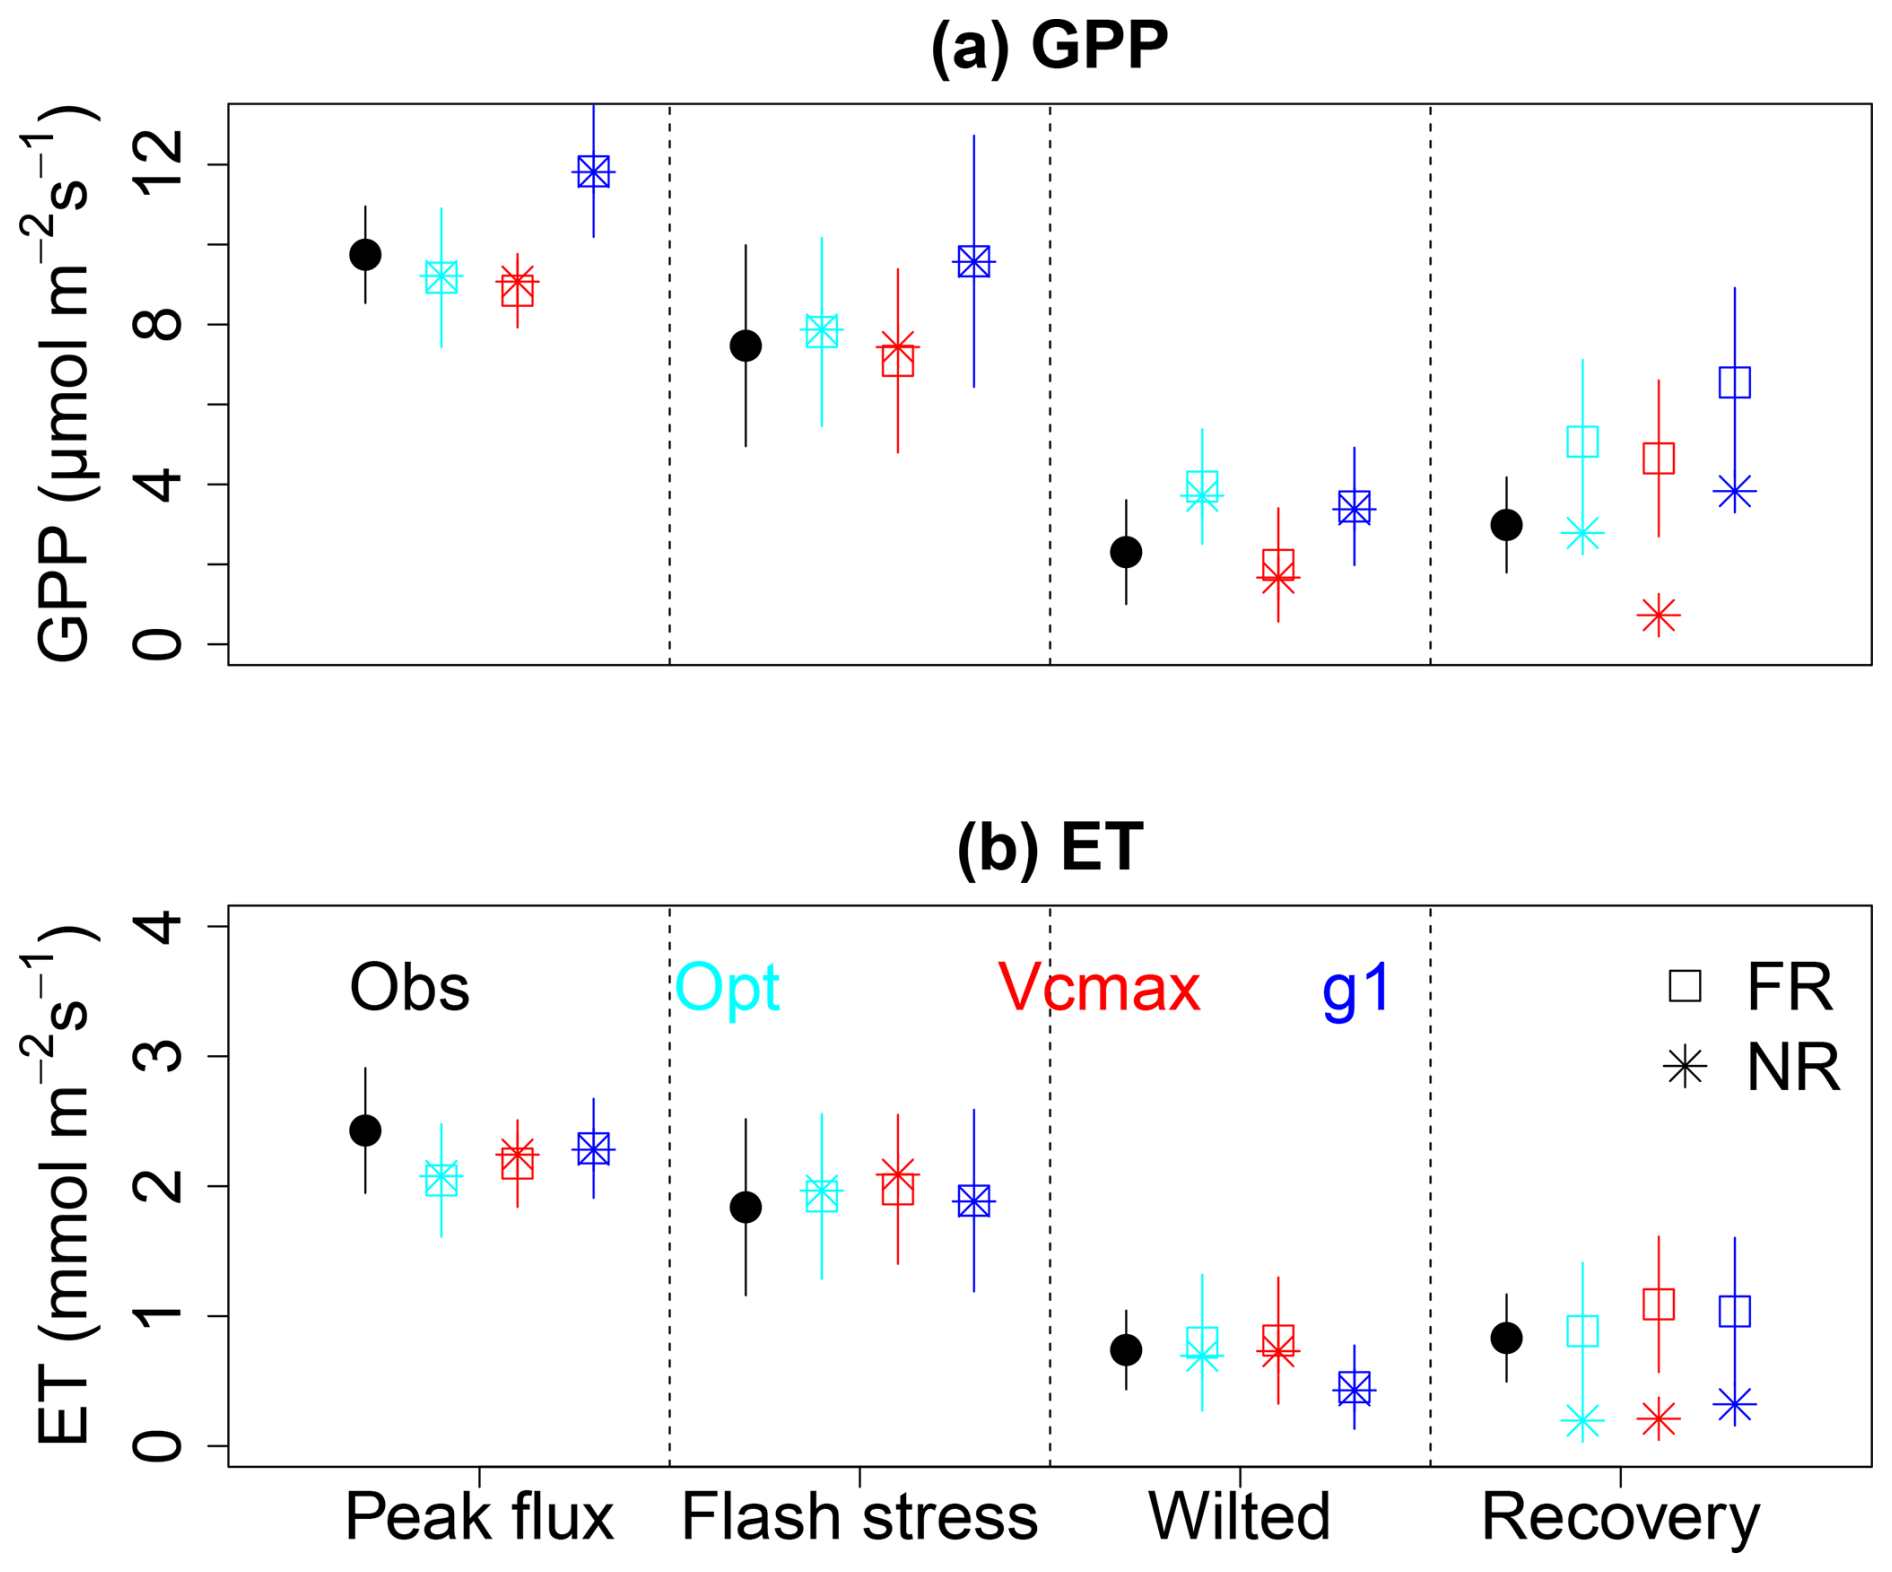
Figure 3Model performance for GPP and ET across four periods in 2012. Curves show the optimality-based stomatal model (cyan) and the Medlyn model with the water-stress factor applied to Vcmax (red) or to g1 (blue). FR, full recovery; NR, no recovery. Error bars indicate variability within each period.
3.2 Model performance
All tested stomatal schemes from CliMA Land demonstrated their ability to capture seasonal variations in carbon and water fluxes during the growing season of 2012 under the assumption of full recovery (Figs. 3, S2). Prior to the recovery period, model simulations performed similarly (Fig. 3). The performance of the optimality model and empirical stomatal models did not show distinct differences when incorporating a stress factor calculated from the loss of hydraulic conductance. Using the Medlyn stomatal model, we observed no significant differences in modeled ET between simulations where the stress factor was applied to Vcmax and g1 over the entire growing season (Wilcoxon rank test: P=0.13). However, applying the stress factor to g1 produced a higher GPP simulation compared to applying the stress factor to Vcmax (Wilcoxon rank test: P<0.001). Additionally, simulations using the stress factor on Vcmax exhibited lower RMSE for GPP at the daily scale compared to those applying the stress factor to g1 (1.40 vs. 2.67 ).
Analyzing different time periods, GPP simulations showed higher RMSE during the recovery period compared to the peak, flash stress, and wilted periods, when the stress factor was applied to Vcmax (Fig. S3). During the recovery period, applying the stress factor to g1 resulted in a larger positive bias in GPP simulations relative to observations. For ET, simulations showed comparable lower biases when applying the stress factor to either Vcmax or g1 across all time periods, with no significant differences between ET simulations and flux observations over the entire growing season (Wilcoxon rank test: P>0.10).
Overall, under the full recovery assumption, model simulations tended to overestimate carbon fluxes after the drought event, especially when the stress factor was applied to g1, while accurately capturing ET dynamics (Fig. 3). In contrast, under the no-recovery assumption, modeled GPP aligned more closely with observations during the recovery period when using the optimality-based stomatal model and the Medlyn-g1 setup, though ET simulations showed an underestimation (Fig. 3). These comparisons between full and no-recovery scenarios highlight a lagged recovery process, underscoring the need to incorporate delayed recovery mechanisms in modeling carbon and water fluxes. Using the hydraulic trait parameters of Acer produced similar modeling outcomes (Fig. S4), although the underestimation of photosynthesis was relatively smaller.
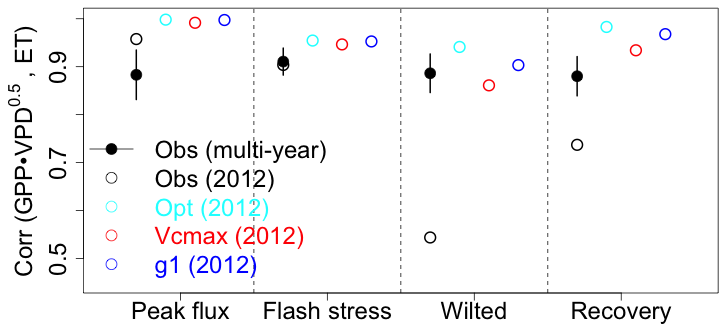
Figure 4Carbon–water coupling strength across drought stages. Pearson correlation between daily GPP⋅VPD0.5 and ET across four periods (peak, flash-stress, wilted, recovery). Points show flux-tower observations (black) and model simulations: optimality-based stomatal model (cyan) and Medlyn with the water-stress factor applied to Vcmax (red) or g1 (blue). Correlations are computed from daily values and averaged within each period. Error bars on observations denote interannual variability; the multi-year mean is calculated over 2004–2019 excluding 2012.
3.3 Delayed recovery of carbon fluxes
The delayed recovery of carbon fluxes relative to water fluxes suggests a lagged response driven by either stomatal or biochemical limitations. To identify the presence of non-stomatal limitations in the eddy-covariance data, we computed the daily correlation between GPP and ET (Fig. 4). Our findings indicate that this correlation coefficient, representing the strength of carbon-water coupling, was relatively high during the peak flux and flash stress periods, suggesting a tightly coupled carbon and water cycle. However, during the wilted period, this correlation dropped significantly to 0.54 (compared to a multi-year average of 0.89). During the recovery period, the correlation rose to around 0.74 – higher than in the wilted period but still below the multi-year average. The weaker GPP-ET coupling derived from flux observations indicates the emergence of non-stomatal limitations during drought, which can persist into the recovery phase. In contrast, model simulations tend to overestimate this coupling, likely because GPP and transpiration are tightly linked through stomatal conductance.
Given the persistence of non-stomatal limitations after drought, we investigated whether our model could capture this lagged recovery behavior by imposing additional non-stomatal limitations. It should be noted that the water stress is derived from loss of hydraulic conductance in our modeling framework, and further applied to either Vcmax or g1, such legacy effect includes also the delayed recovery of hydraulic conductance.
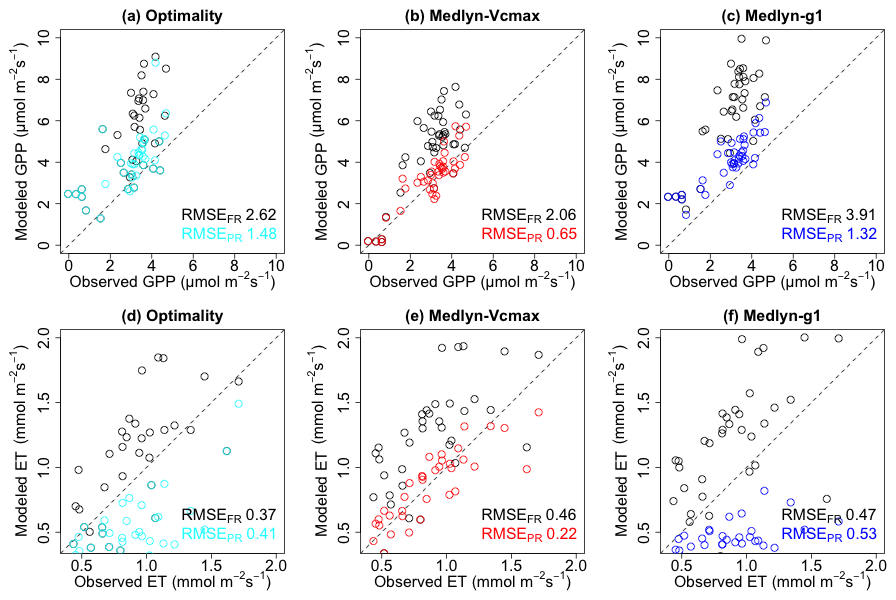
Figure 5Improvement in model performance after accounting for drought legacy effects (recovery period only). Scatterplots compare RMSE under the partial-recovery scenario (RMSEPR) against the full-recovery baseline (RMSEFR) for GPP and ET. Symbols denote simulations assuming full recovery (black circles) and partial recovery using the optimality-based model (cyan) or the Medlyn model with the water-stress factor applied to Vcmax (red) or g1 (blue). RMSEs are computed against flux observations; lower values indicate better fit.
We found that introducing a partial recovery setup with a fixed bound is inadequate to capture the post-drought responses of carbon and water fluxes, necessitating the data assimilation of using observations as constraint (Figs. S5, S6). After assimilating flux observations as constraints, we observed a slower alleviation of water stress compared to the full recovery assumption and a similarly delayed increase in carbon fluxes (Figs. S7, S8). When comparing improvements in RMSE for GPP and ET between the model simulation and flux observation (shown as “PR” relative to “FR”), we found that incorporating lagged recovery of Vcmax enhanced model performance for both carbon and water fluxes (Fig. 5). In contrast, applying the stress factor to g1 reduced RMSE for carbon fluxes but introduced a greater ET bias, revealing that this model setup fails to yield consistent improvements for both fluxes. These contrasting performances can be explained by the representations in the two model setups. Applying β to Vcmax represents a biochemical limitation, directly reducing photosynthetic capacity and indirectly constraining stomatal conductance via reduced assimilation. This leads to a stronger and more persistent reduction in GPP, with comparatively weaker impacts on transpiration. In contrast, applying β to g1 represents a non-biochemical (stomatal) limitation, directly reducing stomatal conductance and CO? diffusion, thereby suppressing transpiration and secondarily reducing photosynthesis. As a result, when model performance of transpiration is similar between the two setups, as in the FR scenario, where transpiration is used to constrain Kmax, photosynthesis simulated by the Medlyn-g1 tends to be slightly higher than that from the Medlyn-Vcmax configuration (Fig. 5b, c). Similarly, under the PR scenario, reducing the overestimation of carbon fluxes is accompanied by an underestimation of transpiration (Fig. 5c, f). In the optimality-based stomatal model, β acts on hydraulic conductance only, and thus affects stomatal conductance indirectly, resulting in a response similar to the Medlyn-g1 formulation and a comparable underestimation of transpiration. Overall, the flux data and our modeling experiments suggest that an impairment in Vcmax delays the recovery of carbon fluxes, with the recovery process spanning days to weeks rather than occurring immediately. This finding highlights the crucial role of biochemical limitations in shaping the post-drought recovery trajectory of terrestrial ecosystems and the asymmetric recoveries of GPP and ET. Instead of relying solely on a fixed ratio, we applied the ET partitioning approach of Zhou et al. (2016) to directly compare modeled transpiration with observation-based partitioned transpiration. This method allows the ratio to vary dynamically. We find that using either a fixed ratio or observation-based partitioned transpiration does not affect our conclusions, namely, that biochemical limitations delay the recovery of both carbon and water fluxes (Figs. S9, S10).
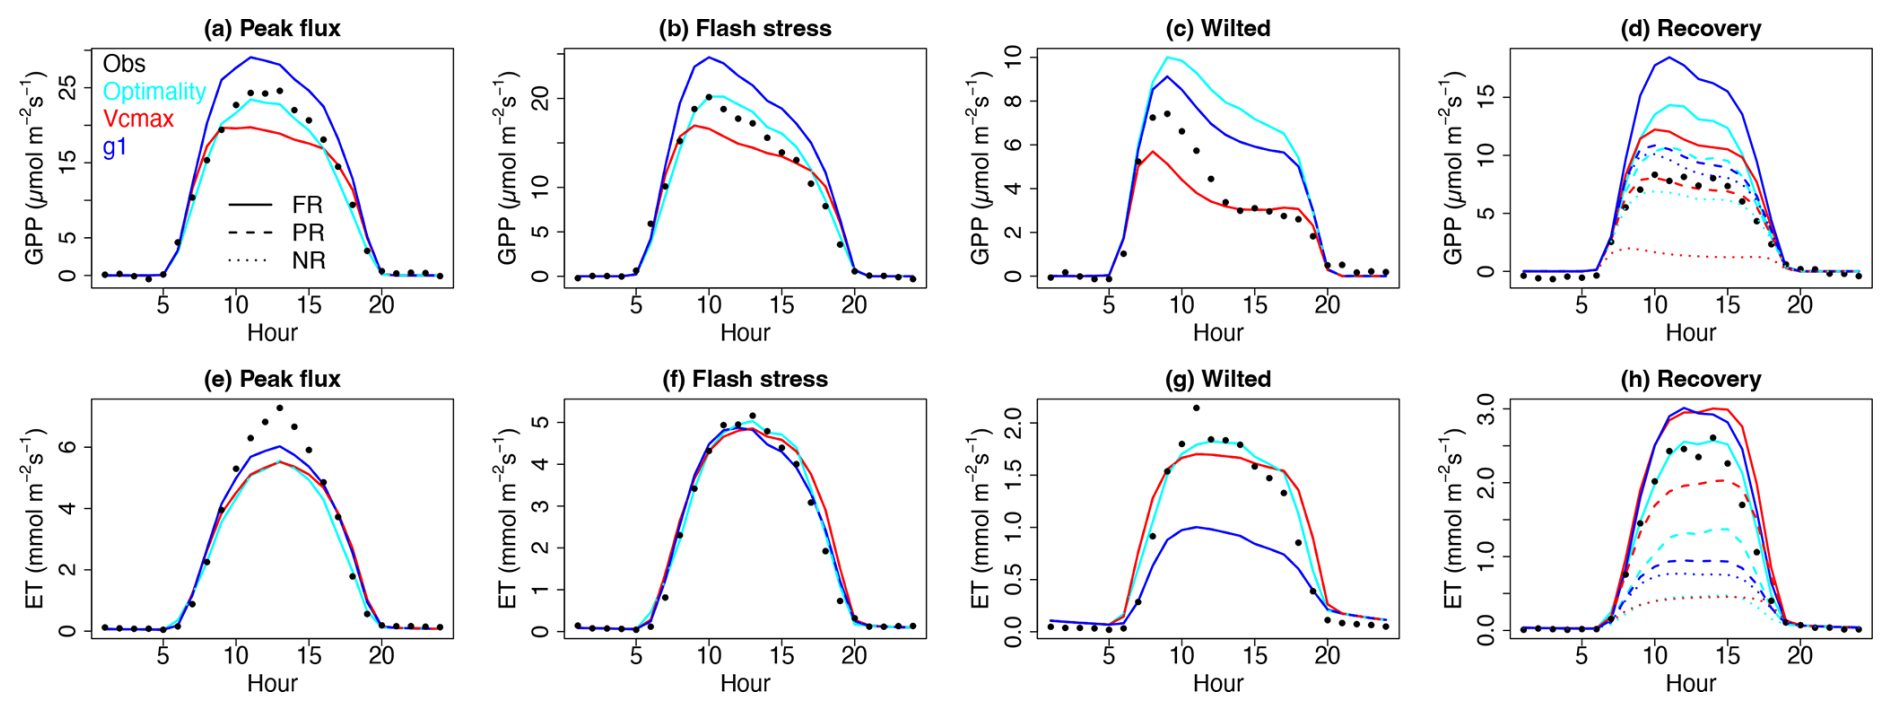
Figure 6Diurnal cycles of GPP and ET across drought stages. Panels show (a–d) GPP and (e–h) ET for Peak flux, Flash stress, Wilted, and Recovery. Curves compare the optimality-based stomatal model (cyan) and the Medlyn model with the water-stress factor applied to Vcmax (red) or g1 (blue). Scenario keys: FR, full recovery; PR, partial recovery; NR, no recovery.
When analyzing the diurnal cycle, the model simulations successfully captured the overall shape of the diurnal changes in carbon and water fluxes (Fig. 6). During the peak flux period, both carbon and water fluxes reached their maximum values at noon. As conditions transitioned into the flash stress period, the peak flux shifted earlier to around 10:00 am (LT). With increasing water stress, the peak flux occurred even earlier in the morning. During the recovery periods, the diurnal shape became flatter, with the peak value returning to around noon and remaining relatively stable between 10:00 am and 03:00 pm. Under the full recovery assumption, the model predicted GPP at noon to be twice as high as observed when the stress factor was applied directly to g1, while applying the stress factor to Vcmax led to a 35 % overestimation relative to observations during the 10:00 am to 02:00 pm window. However, the partial recovery approach helped reduce the model-observation bias, particularly during daytime hours. Model simulations using both the optimality-based stomatal model and empirical stomatal models with the stress factor applied to Vcmax exhibited less bias across the four time periods.
It is important to note, however, that modeled peak ET around noon during the recovery periods was slightly dampened. From a modeling perspective, a decrease in Vcmax reduces carbon assimilation, which in turn suppresses stomatal conductance and transpiration. Thus, the stress applied to Vcmax effectively encompasses lumped effects from changes in Rubisco enzyme content (or activation) and environmental stress. The slightly weaker ET performance could also be due to potential shifts in the ratio between periods, highlighting the need for further exploration of inconsistent drought recovery in carbon and water fluxes. Since typically increases under dry conditions (Nie et al., 2021), we tested the model by increasing during the wilted and recovery periods and recalibrated it accordingly. This recalibration required slightly higher Kmax values to align with the elevated during the drought. Nevertheless, this adjustment does not alter our conclusion: the delayed recovery of carbon fluxes can be effectively addressed by incorporating biochemical limitations, thereby reducing the model-observation gap.
This study examines the recovery of ecosystem carbon and water fluxes following the extreme drought in the Central US in 2012, using in-situ eddy-covariance flux measurements and the land surface model CliMA. Our findings show that CliMA accurately captured ecosystem behavior during the peak flux, flash stress, and wilted periods (Fig. 3). However, during the recovery period, the model tended to overestimate carbon fluxes when assuming a complete recovery of hydraulic conductance immediately after water stress subsided. This indicates that despite the resumption of water fluxes, lingering stomatal or non-stomatal limitations may impede the recovery of carbon fluxes. Our findings align with the analysis by He et al. (2018), which found that GPP takes longer to recover than ET. The quick recovery behavior of ET should be treated with caution as it contains both plant transpiration and soil evaporation, with the latter recovering rapidly after rewetting and potentially masking the slower recovery of transpiration. Supporting this interpretation, observation-based partitioned transpiration shows an intermediate recovery between the simulated full- and no-recovery scenarios, consistent with the presence of drought legacy effects in plant water use. In contrast, this pattern is less apparent in ET, suggesting that enhanced soil evaporation following rainfall may compensate for reduced transpiration and obscure the persistence of vegetation drought legacy. However, unlike He et al. (2018), who attributed the recovery of carbon and water fluxes primarily to canopy conductance, our findings indicate that introducing a progressive biochemical recovery mechanism into empirical stomatal conductance models improves model performance for both carbon and water fluxes. Specifically, we conceptualized the post-drought flux response as a composite of transient and lagged responses to environmental conditions. In this framework, the “full recovery” scenario considers only transient responses, while the “partial recovery” scenario accounts for lagged responses as well. This approach involves constructing a transient baseline for the post-drought period and quantifying deviations from the ecosystem's actual response, thereby capturing the legacy effects. Our methodology is similar to the legacy detection framework used by Yu et al. (2022), which uses a machine learning model to separate transient and lagged responses, with the residuals representing the lagged component. Based on our tests of legacy detection methods, this study underscores the significance of Vcmax impairment in shaping delayed recovery of carbon fluxes, with hydraulic stress being jointly considered in drought legacy effect. The importance of Vcmax downregulation has been noted in previous studies, such as Yang et al. (2019), which demonstrated that imposing only hydraulic limitations can capture drought responses but often in a physically unrealistic manner. Other studies have also proposed adjustments to Vcmax that incorporate climate effects, yielding a better model-observation agreement (Galmés et al., 2013; Gimeno et al., 2019). Therefore, accurately modeling vegetation responses to drought requires explicitly incorporating and quantifying both stomatal and non-stomatal constraints.
While our findings highlight the significant role of lagged responses of Vcmax at the MOFLUX site, this does not imply that this phenomenon fully explains all post-drought behaviors. Model simulations at another site, US-MMS, similarly showed marked declines in both carbon and water fluxes during the drought, along with overestimations of GPP and ET in the post-drought period (Fig. S11). Under the partial recovery scenario, applying the β factor to either Vcmax or g1 improved the model performance in reducing these overestimations (Fig. S12). Additionally, simulations at four other sites affected by the 2012 drought successfully reproduced the seasonal dynamics of carbon and water fluxes without notable overestimations (Figs. S13, S14). These results suggest that challenges remain in parameterized stomatal and non-stomatal limitations, as the dominant limitation may vary depending on environmental conditions. The choice of whether to prioritize Vcmax or g1 should depend on the severity and duration of drought stress, underscoring the need for flexible, context-specific modeling approaches. Short-term mild drought events may not significantly impair Rubisco activity, with stomatal closure serving as the primary limitation and non-stomatal effects playing a minor role (Wilson et al., 2000). Under prolonged drought conditions, both stomatal and non-stomatal limitations likely work together to regulate physiological responses (Galmés et al., 2007). For example, observations at the MOFLUX site revealed carbon-water decoupling during drought and recovery periods, implying the important role of biochemical limitations in regulating these processes. Stomatal limitations are observed across a wide range of soil moisture levels, while non-stomatal limitations become more prominent under moderate to extreme water deficits (Drake et al., 2017). Reductions in the stomatal slope parameter often precede reductions in Vcmax, although Rubisco content may increase under prolonged drought due to acclimation (Zhou et al., 2018). Similarly, Flexas et al. (2006) noted a strong connection between stomatal conductance and Vcmax, with Rubisco activity declining only when stomatal conductance drops below a critical threshold. The transition between these two types of limitations could depend on factors such as leaf position and water content (Song et al., 2020), while Drake et al. (2017) argued that these limitations often act concurrently rather than in distinct phases. As decreased Rubisco activity can hinder rapid recovery even after rehydration (Varone et al., 2012), understanding the thresholds beyond which non-stomatal limitations dominate requires further sensitivity experiments to mechanistically unravel the interconnected dynamics of carbon and water fluxes during recovery from extreme climate events.
Although the model simulation in this study parameterized a single set of plant hydraulics parameters based on the site's dominant tree species of oak, known for its drought-resistant characteristics, we recognize that drought responses can vary significantly among tree species with diverse hydraulic regulation strategies (Drake et al., 2017; Zhou et al., 2014). For instance, Rehschuh and Ruehr (2022) observed no necessary connection between hydraulic impairment and lagged photosynthetic recovery in Scots pine. Xeric tree species, on the other hand, tend to experience more negative leaf water potentials at which photosynthetic efficiency declines sharply (Zhou et al., 2014). Species-specific differences also emerge in the relative contributions of stomatal and biochemical limitations (Zhou et al., 2015). These findings underscore the need to extend our analysis framework to encompass a broader range of tree species, considering variations in life stage, the drought timing, intensity, and duration of stress period, as well as species-specific resistance and resilience to drought.
Our findings emphasize the significance of accounting for drought-induced damage to Vcmax and its subsequent delayed impacts on carbon and water fluxes. This study represents a preliminary application of our modeling framework at a representative eddy-covariance site impacted by the 2012 mega drought, aimed at identifying lagged responses in carbon and water flux as well as stomatal and non-stomatal limitations. Our analysis revealed that, beyond the transient responses of carbon flux, a lagged biochemical recovery helps bridge the model-observation gap. This site-level research lays the groundwork for potential regional expansions to delve further into the factors influencing drought recovery and to validate the generalizability of the identified responses. The present framework should therefore be viewed as a diagnostic tool for identifying drought recovery processes at observation-rich sites. Extending it to regional and global applications will require predictive relationships between inferred recovery characteristics and observable ecosystem properties, rather than prescribing a universal recovery limit. For example, key recovery characteristics, such as the time required for the release of accumulated water deficit and the upper bound of hydraulic conductance recovery, can be inferred from flux tower data. These features can subsequently be linked to commonly available environmental variables using nonlinear regression or machine-learning approaches, enabling their prediction across broader spatial domains without eddy-covariance coverage. To enhance predictions of ecosystem resilience to future climate challenges, further studies should evaluate the asynchronous responses of biochemical and stomatal limitations to drought and explore their underlying drivers. A critical implication of our research is that most current Earth system models lack the inclusion of this vital mechanism. As a result, their projections of carbon sequestration may be overly optimistic, raising concerns about the reliability of these models in informing mitigation policies. By incorporating these crucial processes into Earth system models, we can develop more reliable projections and help make informed decisions to effectively address the climate change challenges. Additionally, considering the potential asynchronous recovery rates of carbon and water fluxes will provide valuable insights into the possible carbon-water decoupling behavior during extreme events (De Kauwe et al., 2019; Krich et al., 2022).
To reduce the long-term impacts of drought legacy effects on forest ecosystems, management strategies should focus on enhancing resilience and adaptive capacity. Selective thinning can lessen competition for water, enabling surviving trees to recover more effectively after drought. Increasing species diversity – particularly through the inclusion of drought-tolerant and deep-rooted species – can help buffer stands against future water stress. Regular monitoring of physiological indicators, such as canopy water content and stomatal conductance, can reveal delayed drought responses and guide timely interventions. Integrating drought legacy effects into forest growth models will be critical for sustaining carbon sequestration and maintaining ecosystem services under a changing climate.
In this study, we conducted a comprehensive investigation of the drought response during the 2012 drought in the Central US, utilizing in-situ eddy-covariance flux measurements and the CliMA model. Our drought response simulations showed that assuming full recovery of hydraulic conductance leads to an overestimation of carbon flux recovery. To address this limitation, we introduced a progressive biochemical recovery process into the model diagnostically, accounting for both delayed hydraulic recovery and impairment of Rubisco activity. This modification led to enhanced model performance in simulating both carbon and water fluxes, offering more accurate representation of the ecosystem's recovery dynamics. The implications of this finding are particularly relevant in the context of increasing frequency and intensity of extreme climate events. Ignoring legacy effects and relying on overly optimistic estimations of future land carbon uptake could be misleading, emphasizing the need for more in-depth studies on understanding ecosystem resilience to extreme climate events.
CliMA Land model code can be accessed at https://github.com/CliMA/Land (last access: 1 June 2025) and archived at https://doi.org/10.5281/zenodo.21831824 (Yao and Wang, 2026).
Ecosystem flux data for US-MOz is downloaded from https://ameriflux.lbl.gov (last access: 1 October 2025). Predawn leaf water potential measurement at Ozark site can be downloaded from https://doi.org/10.3334/CDIAC/ORNLSFA.004 (Pallardy et al., 2018).
The supplement related to this article is available online at https://doi.org/10.5194/bg-23-5461-2026-supplement.
YY and YW conceived the initial idea. YY performed the analysis, conducted the model experiments and wrote the manuscript. All authors read and approved the final manuscript.
The contact author has declared that none of the authors has any competing interests.
Publisher's note: Copernicus Publications remains neutral with regard to jurisdictional claims made in the text, published maps, institutional affiliations, or any other geographical representation in this paper. The authors bear the ultimate responsibility for providing appropriate place names. Views expressed in the text are those of the authors and do not necessarily reflect the views of the publisher.
This research has been supported by the National Aeronautics and Space Administration (grant no. 80NSSC21K1712).
This paper was edited by Mirco Migliavacca and reviewed by Xin Yu and one anonymous referee.
Anderegg, W. R. L., Schwalm, C., Biondi, F., Camarero, J. J., Koch, G., Litvak, M., Ogle, K., Shaw, J. D., Shevliakova, E., Williams, A. P., Wolf, A., Ziaco, E., and Pacala, S.: FOREST ECOLOGY. Pervasive drought legacies in forest ecosystems and their implications for carbon cycle models, Science, 349, 528–532, https://doi.org/10.1126/science.aab1833, 2015.
Ball, J. T., Woodrow, I. E., and Berry, J. A.: A model predicting stomatal conductance and its contribution to the control of photosynthesis under different environmental conditions, in: Progress in Photosynthesis Research, Springer Netherlands, Dordrecht, 221–224, https://doi.org/10.1007/978-94-017-0519-6_48, 1987.
Basara, J. B., Christian, J. I., Wakefield, R. A., Otkin, J. A., Hunt, E. H., and Brown, D. P.: The evolution, propagation, and spread of flash drought in the Central United States during 2012, Environ. Res. Lett., 14, 084025, https://doi.org/10.1088/1748-9326/ab2cc0, 2019.
Bastos, A., Ciais, P., Friedlingstein, P., Sitch, S., Pongratz, J., Fan, L., Wigneron, J. P., Weber, U., Reichstein, M., Fu, Z., Anthoni, P., Arneth, A., Haverd, V., Jain, A. K., Joetzjer, E., Knauer, J., Lienert, S., Loughran, T., McGuire, P. C., Tian, H., Viovy, N., and Zaehle, S.: Direct and seasonal legacy effects of the 2018 heat wave and drought on European ecosystem productivity, Sci. Adv., 6, eaba2724, https://doi.org/10.1126/sciadv.aba2724, 2020.
Benson, M. C., Miniat, C. F., Oishi, A. C., Denham, S. O., Domec, J.-C., Johnson, D. M., Missik, J. E., Phillips, R. P., Wood, J. D., and Novick, K. A.: The xylem of anisohydric Quercus alba L. is more vulnerable to embolism than isohydric codominants, Plant Cell Environ., 45, 329–346, https://doi.org/10.1111/pce.14244, 2022.
Blanken, P. D., Monson, R. K., Burns, S. P., Bowling, D. R., Turnipseed, A. A., and Knowles, J. F.: AmeriFlux FLUXNET-1F US-NR1 Niwot Ridge Forest (LTER NWT1), Ver. v1.3_r1, AmeriFlux AMP [data set], https://doi.org/10.17190/AMF/1871141, 2026.
Braghiere, R. K., Wang, Y., Doughty, R., Sousa, D., Magney, T., Widlowski, J.-L., Longo, M., Bloom, A. A., Worden, J., Gentine, P., and Frankenberg, C.: Accounting for canopy structure improves hyperspectral radiative transfer and sun-induced chlorophyll fluorescence representations in a new generation Earth System model, Remote Sens. Environ., 261, 112497, https://doi.org/10.1016/j.rse.2021.112497, 2021.
Classen, A., Gough, C., Bohrer, G., Lenters, J., and Curtis, P.: AmeriFlux FLUXNET-1F US-UMB Univ. of Mich. Biological Station, Ver. 3-5, AmeriFlux AMP [data set], https://doi.org/10.17190/AMF/2204882, 2023.
De Kauwe, M. G., Kala, J., Lin, Y.-S., Pitman, A. J., Medlyn, B. E., Duursma, R. A., Abramowitz, G., Wang, Y.-P., and Miralles, D. G.: A test of an optimal stomatal conductance scheme within the CABLE land surface model, Geosci. Model Dev., 8, 431–452, https://doi.org/10.5194/gmd-8-431-2015, 2015.
De Kauwe, M. G., Medlyn, B. E., Pitman, A. J., Drake, J. E., Ukkola, A., Griebel, A., Pendall, E., Prober, S., and Roderick, M.: Examining the evidence for decoupling between photosynthesis and transpiration during heat extremes, Biogeosciences, 16, 903–916, https://doi.org/10.5194/bg-16-903-2019, 2019.
Drake, J. E., Power, S. A., Duursma, R. A., Medlyn, B. E., Aspinwall, M. J., Choat, B., Creek, D., Eamus, D., Maier, C., Pfautsch, S., Smith, R. A., Tjoelker, M. G., and Tissue, D. T.: Stomatal and non-stomatal limitations of photosynthesis for four tree species under drought: A comparison of model formulations, Agric. For. Meteorol., 247, 454–466, https://doi.org/10.1016/j.agrformet.2017.08.026, 2017.
Duursma, R. A.: Plantecophys–an R package for analysing and modelling leaf gas exchange data, PLoS One, 10, e0143346, https://doi.org/10.1371/journal.pone.0143346, 2015.
Egea, G., Verhoef, A., and Vidale, P. L.: Towards an improved and more flexible representation of water stress in coupled photosynthesis–stomatal conductance models, Agric. For. Meteorol., 151, 1370–1384, https://doi.org/10.1016/j.agrformet.2011.05.019, 2011.
Eller, C. B., Rowland, L., Mencuccini, M., Rosas, T., Williams, K., Harper, A., Medlyn, B. E., Wagner, Y., Klein, T., Teodoro, G. S., Oliveira, R. S., Matos, I. S., Rosado, B. H. P., Fuchs, K., Wohlfahrt, G., Montagnani, L., Meir, P., Sitch, S., and Cox, P. M.: Stomatal optimization based on xylem hydraulics (SOX) improves land surface model simulation of vegetation responses to climate, New Phytol., 226, 1622–1637, https://doi.org/10.1111/nph.16419, 2020.
Fang, J. and Gentine, P.: Exploring optimal complexity for water stress representation in terrestrial carbon models: A hybrid-machine learning model approach, J. Adv. Model. Earth Syst., 16, https://doi.org/10.1029/2024ms004308, 2024.
Farquhar, G. D., von Caemmerer, S., and Berry, J. A.: A biochemical model of photosynthetic CO2 assimilation in leaves of C3 species, Planta, 149, 78–90, https://doi.org/10.1007/BF00386231, 1980.
Fatichi, S. and Pappas, C.: Constrained variability of modeled T:ET ratio across biomes: Transpiration:Evapotranspiration Ratio, Geophys. Res. Lett., 44, 6795–6803, https://doi.org/10.1002/2017GL074041, 2017.
Flexas, J., Ribas-Carbó, M., Bota, J., Galmés, J., Henkle, M., Martínez-Cañellas, S., and Medrano, H.: Decreased Rubisco activity during water stress is not induced by decreased relative water content but related to conditions of low stomatal conductance and chloroplast CO2 concentration, New Phytol., 172, 73–82, https://doi.org/10.1111/j.1469-8137.2006.01794.x, 2006.
Frank, J., Valentine, G., and Massman, B.: AmeriFlux FLUXNET-1F US-GLE GLEES, Ver. 3-5, AmeriFlux AMP [data set], https://doi.org/10.17190/AMF/1871136, 2022.
Galmés, J., Medrano, H., and Flexas, J.: Photosynthetic limitations in response to water stress and recovery in Mediterranean plants with different growth forms, New Phytol., 175, 81–93, https://doi.org/10.1111/j.1469-8137.2007.02087.x, 2007.
Galmés, J., Aranjuelo, I., Medrano, H., and Flexas, J.: Variation in Rubisco content and activity under variable climatic factors, Photosynth. Res., 117, 73–90, https://doi.org/10.1007/s11120-013-9861-y, 2013.
Gimeno, T. E., Saavedra, N., Ogée, J., Medlyn, B. E., and Wingate, L.: A novel optimization approach incorporating non-stomatal limitations predicts stomatal behaviour in species from six plant functional types, J. Exp. Bot., 70, 1639–1651, https://doi.org/10.1093/jxb/erz020, 2019.
Gough, C., Bohrer, G., and Curtis, P.: AmeriFlux FLUXNET-1F US-UMd UMBS Disturbance, Ver. 4-6, AmeriFlux AMP [data set], https://doi.org/10.17190/AMF/1881597, 2024.
Gourlez de la Motte, L., Beauclaire, Q., Heinesch, B., Cuntz, M., Foltýnová, L., Šigut, L., Kowalska, N., Manca, G., Ballarin, I. G., Vincke, C., Roland, M., Ibrom, A., Lousteau, D., Siebicke, L., Neiryink, J., and Longdoz, B.: Non-stomatal processes reduce gross primary productivity in temperate forest ecosystems during severe edaphic drought, Philos. T. R. Soc. Lond. B, 375, 20190527, https://doi.org/10.1098/rstb.2019.0527, 2020.
Gu, L., Pallardy, S. G., Tu, K., Law, B. E., and Wullschleger, S. D.: Reliable estimation of biochemical parameters from C3 leaf photosynthesis-intercellular carbon dioxide response curves: Estimating FvCB model parameters, Plant Cell Environ., 33, 1852–1874, https://doi.org/10.1111/j.1365-3040.2010.02192.x, 2010.
Gu, L., Pallardy, S. G., Hosman, K. P., and Sun, Y.: Drought-influenced mortality of tree species with different predawn leaf water dynamics in a decade-long study of a central US forest, Biogeosciences, 12, 2831–2845, https://doi.org/10.5194/bg-12-2831-2015, 2015.
Gu, L., Pallardy, S. G., Yang, B., Hosman, K. P., Mao, J., Ricciuto, D., Shi, X., and Sun, Y.: Testing a land model in ecosystem functional space via a comparison of observed and modeled ecosystem flux responses to precipitation regimes and associated stresses in a Central U.S. forest: Test Model in Ecosystem Functional Space, J. Geophys. Res.-Biogeo., 121, 1884–1902, https://doi.org/10.1002/2015JG003302, 2016.
Haberstroh, S., Christen, A., Sulzer, M., Scarpa, F., and Werner, C. Recurrent hot droughts cause persistent legacy effects in a temperate Scots Pine forest, Plant Biology, 28, https://doi.org/10.1111/plb.70066, 2025.
He, B., Liu, J., Guo, L., Wu, X., Xie, X., Zhang, Y., Chen, C., Zhong, Z., and Chen, Z.: Recovery of ecosystem carbon and energy fluxes from the 2003 drought in Europe and the 2012 drought in the United States, Geophys. Res. Lett., 45, 4879–4888, https://doi.org/10.1029/2018GL077518, 2018.
Kannenberg, S. A., Schwalm, C. R., and Anderegg, W. R. L.: Ghosts of the past: how drought legacy effects shape forest functioning and carbon cycling, Ecol. Lett., 23, 891–901, https://doi.org/10.1111/ele.13485, 2020.
Keenan, T., García, R., Friend, A. D., Zaehle, S., Gracia, C., and Sabate, S.: Improved understanding of drought controls on seasonal variation in Mediterranean forest canopy CO2 and water fluxes through combined in situ measurements and ecosystem modelling, Biogeosciences, 6, 1423–1444, https://doi.org/10.5194/bg-6-1423-2009, 2009.
Keenan, T., Sabate, S., and Gracia, C.: Soil water stress and coupled photosynthesis–conductance models: Bridging the gap between conflicting reports on the relative roles of stomatal, mesophyll conductance and biochemical limitations to photosynthesis, Agric. For. Meteorol., 150, 443–453, https://doi.org/10.1016/j.agrformet.2010.01.008, 2010.
Kennedy, D., Swenson, S., Oleson, K. W., Lawrence, D. M., Fisher, R., da Costa, A. C. L., and Gentine, P.: Implementing Plant Hydraulics in the Community Land Model, Version 5, J. Adv. Model. Earth Sy., 11, 485–513, https://doi.org/10.1029/2018MS001500, 2019.
Krich, C., Mahecha, M. D., Migliavacca, M., De Kauwe, M. G., Griebel, A., Runge, J., and Miralles, D. G.: Decoupling between ecosystem photosynthesis and transpiration: a last resort against overheating, Environ. Res. Lett., 17, 044013, https://doi.org/10.1088/1748-9326/ac583e, 2022.
Leuning, R.: A critical appraisal of a combined stomatal-photosynthesis model for C3 plants, Plant Cell Environ., 18, 339–355, https://doi.org/10.1111/j.1365-3040.1995.tb00370.x, 1995.
Matusick, G., Ruthrof, K. X., Kala, J., Brouwers, N. C., Breshears, D. D., and Hardy, G. E. S. J.: Chronic historical drought legacy exacerbates tree mortality and crown dieback during acute heatwave-compounded drought, Environ. Res. Lett., 13, 095002, https://doi.org/10.1088/1748-9326/aad8cb, 2018.
Medlyn, B. E., Duursma, R. A., Eamus, D., Ellsworth, D. S., Prentice, I. C., Barton, C. V. M., Crous, K. Y., de Angelis, P., Freeman, M., and Wingate, L.: Reconciling the optimal and empirical approaches to modelling stomatal conductance: RECONCILING OPTIMAL AND EMPIRICAL STOMATAL MODELS, Glob. Chang. Biol., 17, 2134–2144, https://doi.org/10.1111/j.1365-2486.2010.02375.x, 2011.
Müller, L. M. and Bahn, M.: Drought legacies and ecosystem responses to subsequent drought, Glob. Chang. Biol., 28, 5086–5103, https://doi.org/10.1111/gcb.16270, 2022.
Neufeld, H. S., Grantz, D. A., Meinzer, F. C., Goldstein, G., Crisosto, G. M., and Crisosto, C.: Genotypic variability in vulnerability of leaf xylem to cavitation in water-stressed and well-irrigated sugarcane, Plant Physiol., 100, 1020–1028, https://doi.org/10.1104/pp.100.2.1020, 1992.
Nie, C., Huang, Y., Zhang, S., Yang, Y., Zhou, S., Lin, C., and Wang, G.: Effects of soil water content on forest ecosystem water use efficiency through changes in transpiration/evapotranspiration ratio, Agric. For. Meteorol., 308–309, 108605, https://doi.org/10.1016/j.agrformet.2021.108605, 2021.
Niinemets, Ü. and Keenan, T.: Photosynthetic responses to stress in Mediterranean evergreens: Mechanisms and models, Environ. Exp. Bot., 103, 24–41, https://doi.org/10.1016/j.envexpbot.2013.11.008, 2014.
Novick, K. and Phillips, R.: AmeriFlux FLUXNET-1F US-MMS Morgan Monroe State Forest [data set], https://doi.org/10.17190/AMF/1854369, 2022.
Pallardy, S. G., Gu, L., Wood, J. D., Hosman, K. P., and Sun, Y.: Predawn Leaf Water Potential of Oak-Hickory Forest at Missouri Ozark (MOFLUX) Site: 2004–2021, ORNL Terrestrial Ecosystem Science SFA, ESS-DIVE repository [data set], https://doi.org/10.3334/CDIAC/ORNLSFA.004, 2018.
Piao, S., Zhang, X., Chen, A., Liu, Q., Lian, X., Wang, X., Peng, S., and Wu, X.: The impacts of climate extremes on the terrestrial carbon cycle: A review, Sci. China Earth Sci., 62, 1551–1563, https://doi.org/10.1007/s11430-018-9363-5, 2019.
Rehschuh, R. and Ruehr, N. K.: Diverging responses of water and carbon relations during and after heat and hot drought stress in Pinus sylvestris, Tree Physiol., 42, 1532–1548, https://doi.org/10.1093/treephys/tpab141, 2022.
Reichstein, M., Tenhunen, J., Roupsard, O., Ourcival, J.-M., Rambal, S., Miglietta, F., Peressotti, A., Pecchiari, M., Tirone, G., and Valentini, R.: Inverse modeling of seasonal drought effects on canopy CO2/H2O exchange in three Mediterranean ecosystems, J. Geophys. Res., 108, https://doi.org/10.1029/2003jd003430, 2003.
Song, X., Zhou, G., He, Q., and Zhou, H.: Stomatal limitations to photosynthesis and their critical Water conditions in different growth stages of maize under water stress, Agric. Water Manag., 241, 106330, https://doi.org/10.1016/j.agwat.2020.106330, 2020.
Sperry, J. S., Venturas, M. D., Anderegg, W. R. L., Mencuccini, M., Mackay, D. S., Wang, Y., and Love, D. M.: Predicting stomatal responses to the environment from the optimization of photosynthetic gain and hydraulic cost, Plant Cell Environ., 40, 816–830, https://doi.org/10.1111/pce.12852, 2017.
Varone, L., Ribas-Carbo, M., Cardona, C., Gallé, A., Medrano, H., Gratani, L., and Flexas, J.: Stomatal and non-stomatal limitations to photosynthesis in seedlings and saplings of Mediterranean species pre-conditioned and aged in nurseries: Different response to water stress, Environ. Exp. Bot., 75, 235–247, https://doi.org/10.1016/j.envexpbot.2011.07.007, 2012.
Wang, Y. and Frankenberg, C.: On the impact of canopy model complexity on simulated carbon, water, and solar-induced chlorophyll fluorescence fluxes, Biogeosciences, 19, 29–45, https://doi.org/10.5194/bg-19-29-2022, 2022.
Wang, Y., Sperry, J. S., Anderegg, W. R. L., Venturas, M. D., and Trugman, A. T.: A theoretical and empirical assessment of stomatal optimization modeling, New Phytol., 227, 311–325, https://doi.org/10.1111/nph.16572, 2020.
Wang, Y., Köhler, P., He, L., Doughty, R., Braghiere, R. K., Wood, J. D., and Frankenberg, C.: Testing stomatal models at the stand level in deciduous angiosperm and evergreen gymnosperm forests using CliMA Land (v0.1), Geosci. Model Dev., 14, 6741–6763, https://doi.org/10.5194/gmd-14-6741-2021, 2021.
Wang, Y., Köhler, P., Braghiere, R. K., Longo, M., Doughty, R., Bloom, A. A., and Frankenberg, C.: GriddingMachine, a database and software for Earth system modeling at global and regional scales, Sci. Data, 9, 258, https://doi.org/10.1038/s41597-022-01346-x, 2022.
Wang, Y., Braghiere, R. K., Longo, M., Norton, A. J., Köhler, P., Doughty, R., Yin, Y., Bloom, A. A., and Frankenberg, C.: Modeling global vegetation gross primary productivity, transpiration and hyperspectral canopy radiative transfer simultaneously using a next generation land surface model – CliMA land, J. Adv. Model. Earth Syst., 15, https://doi.org/10.1029/2021ms002964, 2023.
Wilson, K. B., Baldocchi, D. D., and Hanson, P. J.: Quantifying stomatal and non-stomatal limitations to carbon assimilation resulting from leaf aging and drought in mature deciduous tree species, Tree Physiol., 20, 787–797, https://doi.org/10.1093/treephys/20.12.787, 2000.
Wolf, A., Akshalov, K., Saliendra, N., Johnson, D. A., and Laca, E. A.: Inverse estimation of Vcmax, leaf area index, and the Ball-Berry parameter from carbon and energy fluxes, J. Geophys. Res., 111, https://doi.org/10.1029/2005jd005927, 2006.
Wolf, S., Keenan, T. F., Fisher, J. B., Baldocchi, D. D., Desai, A. R., Richardson, A. D., Scott, R. L., Law, B. E., Litvak, M. E., Brunsell, N. A., Peters, W., and van der Laan-Luijkx, I. T.: Warm spring reduced carbon cycle impact of the 2012 US summer drought, P. Natl. Acad. Sci. USA, 113, 5880–5885, https://doi.org/10.1073/pnas.1519620113, 2016.
Wood, J. D., Gu, L., Hanson, P. J., Frankenberg, C., and Sack, L.: The ecosystem wilting point defines drought response and recovery of a Quercus-Carya forest, Glob. Chang. Biol., 29, 2015–2029, https://doi.org/10.1111/gcb.16582, 2023.
Wu, X., Liu, H., Li, X., Ciais, P., Babst, F., Guo, W., Zhang, C., Magliulo, V., Pavelka, M., Liu, S., Huang, Y., Wang, P., Shi, C., and Ma, Y.: Differentiating drought legacy effects on vegetation growth over the temperate Northern Hemisphere, Glob. Chang. Biol., 24, 504–516, https://doi.org/10.1111/gcb.13920, 2018.
Xu, C., McDowell, N. G., Fisher, R. A., Wei, L., Sevanto, S., Christoffersen, B. O., Weng, E., and Middleton, R. S.: Increasing impacts of extreme droughts on vegetation productivity under climate change, Nat. Clim. Chang., 9, 948–953, https://doi.org/10.1038/s41558-019-0630-6, 2019.
Xu, X., Medvigy, D., Powers, J. S., Becknell, J. M., and Guan, K.: Diversity in plant hydraulic traits explains seasonal and inter-annual variations of vegetation dynamics in seasonally dry tropical forests, New Phytol., 212, 80–95, https://doi.org/10.1111/nph.14009, 2016.
Yang, J., Duursma, R. A., De Kauwe, M. G., Kumarathunge, D., Jiang, M., Mahmud, K., Gimeno, T. E., Crous, K. Y., Ellsworth, D. S., Peters, J., Choat, B., Eamus, D., and Medlyn, B. E.: Incorporating non-stomatal limitation improves the performance of leaf and canopy models at high vapour pressure deficit, Tree Physiol., 39, 1961–1974, https://doi.org/10.1093/treephys/tpz103, 2019.
Yao, Y. and Wang, Y.: Improved model predictions of carbon and water fluxes by including drought legacy effects, Zenodo [code], https://doi.org/10.5281/zenodo.21831824, 2026.
Yao, Y., Joetzjer, E., Ciais, P., Viovy, N., Cresto Aleina, F., Chave, J., Sack, L., Bartlett, M., Meir, P., Fisher, R., and Luyssaert, S.: Forest fluxes and mortality response to drought: model description (ORCHIDEE-CAN-NHA r7236) and evaluation at the Caxiuanã drought experiment, Geosci. Model Dev., 15, 7809–7833, https://doi.org/10.5194/gmd-15-7809-2022, 2022.
Yu, X., Orth, R., Reichstein, M., Bahn, M., Klosterhalfen, A., Knohl, A., Koebsch, F., Migliavacca, M., Mund, M., Nelson, J. A., Stocker, B. D., Walther, S., and Bastos, A.: Contrasting drought legacy effects on gross primary productivity in a mixed versus pure beech forest, Biogeosciences, 19, 4315–4329, https://doi.org/10.5194/bg-19-4315-2022, 2022.
Yuan, H., Dai, Y., Xiao, Z., Ji, D., and Shangguan, W.: Reprocessing the MODIS Leaf Area Index products for land surface and climate modelling, Remote Sens. Environ., 115, 1171–1187, https://doi.org/10.1016/j.rse.2011.01.001, 2011.
Zhao, K., Ryu, Y., Hu, T., Garcia, M., Li, Y., Liu, Z., Londo, A., and Wang, C.: How to better estimate leaf area index and leaf angle distribution from digital hemispherical photography? Switching to a binary nonlinear regression paradigm, Methods Ecol. Evol., 10, 1864–1874, https://doi.org/10.1111/2041-210X.13273, 2019.
Zhou, L., Wang, S., Chi, Y., Li, Q., Huang, K., and Yu, Q.: Responses of photosynthetic parameters to drought in subtropical forest ecosystem of China, Sci. Rep., 5, 18254, https://doi.org/10.1038/srep18254, 2015.
Zhou, S., Duursma, R. A., Medlyn, B. E., Kelly, J. W. G., and Prentice, I. C.: How should we model plant responses to drought? An analysis of stomatal and non-stomatal responses to water stress, Agric. For. Meteorol., 182–183, 204–214, https://doi.org/10.1016/j.agrformet.2013.05.009, 2013.
Zhou, S., Medlyn, B., Sabaté, S., Sperlich, D., and Prentice, I. C.: Short-term water stress impacts on stomatal, mesophyll and biochemical limitations to photosynthesis differ consistently among tree species from contrasting climates, Tree Physiol., 34, 1035–1046, https://doi.org/10.1093/treephys/tpu072, 2014.
Zhou, S., Yu, B., Zhang, Y., Huang, Y., and Wang, G.: Partitioning evapotranspiration based on the concept of underlying water use efficiency, Water Resour. Res., 52, 1160–1175, https://doi.org/10.1002/2015WR017766, 2016.
Zhou, S.-X., Prentice, I. C., and Medlyn, B. E.: Bridging drought experiment and modeling: Representing the differential sensitivities of leaf gas exchange to drought, Front. Plant Sci., 9, 1965, https://doi.org/10.3389/fpls.2018.01965, 2018.