
the Creative Commons Attribution 4.0 License.
the Creative Commons Attribution 4.0 License.
 | 17 Aug 2026
The impact of NaOH, CaO, and [Ca2+] + [HCO3−] additions on PIC and POC formation in Los Angeles Harbor Waters
Devan L. Roper
Ria Agrawal
Esther J. Lim
Nick E. Rollins
William M. Berelson
Negative CO2 emission technologies such as ocean alkalinity enhancement, in tandem with emissions reduction are necessary to keep the climate system below a critical tipping point. While the biogeochemical consequences of alkalinity enhancement remain poorly constrained, field deployment is accelerating in the commercial sector, leaving questions of ecosystem impact in the wake. In this study we conduct alkalinity perturbation experiments to capture the resultant impact to the organic carbon and calcium carbonate pools. We quantify shifts in dissolved/particulate inorganic and organic carbon after the addition of three alkalinity sources – NaOH, CaO, and CaCl2 + NaHCO3 (to simulate accelerated weathering of limestone). These experiments are conducted with coastal sea water with enhancements of ∼ 500 and ∼ 1000 µmol kg−1 alkalinity, and incubated in situ, to elucidate the impact over 0–4 d. 13C isotope spikes were added to trace carbon partitioning throughout the experiment, and a few bottle experiments were completely isolated from the light via bottle shading to assess impacts on non-photosynthesizers. Despite a wide range in the initial ambient particulate carbon (both organic and inorganic) there was no statistically significant calcium carbonate precipitation or change in the organic carbon partitioning after a perturbation of ∼ 500 µmol kg−1 alkalinity in the form of NaOH, CaO or CaCl2 + NaHCO3. An increase of alkalinity by ∼ 1000 µmol kg−1 after CaO addition resulted in a statistically significant decrease of particulate organic carbon and dissolved oxygen relative to the control. To understand how a decrease in the particulate organic carbon may impact downstream trophic transfers, future studies should resolve the observed changes in particulate organic carbon by characterizing biomass within various particle class sizes with further filtration, microscopy, flow cytometry, and `omics analyses.
- Article
(3892 KB) - Full-text XML
- BibTeX
- EndNote


To mitigate the impact of excess atmospheric carbon dioxide (CO2), humans need to reduce CO2 emissions and remove CO2 from the atmosphere. According to the Intergovermental Panel on Climate Change, global efforts to reduce greenhouse gas emissions are still not on track to avoid surpassing the 1.5 °C threshold of temperature increase by the end of the century (de Coninck et al., 2018; UNFCC, 2022). Since reducing CO2 emissions may not be sufficient to meet the 2015 Paris Agreement Goals (National Academies of Sciences, Engineering, and Medicine, 2022), strategies for marine Carbon Dioxide Removal (mCDR) are being investigated to aid in the uptake and storage of CO2. The Earth has balanced its own carbon storage and acidity on geological timescales (i.e., 100–1000 ka) through mineral weathering and mineral precipitation (Berner et al., 1983; Berner and Berner, 1997; Holland, 1978; Penman et al., 2020; Walker et al., 1981). While there may be more than enough calcium carbonate (CaCO3) in ocean sediments to neutralize all anthropogenic CO2 (Archer, 1996; Sulpis et al., 2018), this recovery could take >10 000 years (Zachos et al., 2005) given slow dissolution kinetics and ocean mixing rates. Ocean Alkalinity Enhancement (OAE) is a mCDR method that can potentially speed up the process of oceanic CO2 uptake for human relevant timescales. A thorough assessment of the scientific background and considerations for various forms of OAE has been presented in Renforth and Henderson (2017). The proposed risks and co-benefits of increasing surface ocean alkalinity based on different deployment strategies have been theorized in Bach et al. (2019).
There are still many technical challenges to overcome before OAE can be scaled to remove gigatons of CO2 (Eisaman et al., 2023; Renforth, 2025). The impacts of different alkaline feedstocks and concentrations on ocean chemistry and the ecosystem are yet to be completely understood. The successful long-term sequestration of CO2 relies on many factors – the rate of air-sea gas exchange, the loss of alkalinity to re-precipitation of carbonate minerals or even the loss of an unequilibrated plume as it subducts below the surface (Lunstrum et al., 2026). Increasing alkalinity could change the cycling of inorganic carbon in the ocean by increasing the likelihood of CaCO3 precipitation or decreasing natural CaCO3 dissolution and thereby affecting the associated organic carbon cycling pumps (Bach, 2024; Falkowski et al., 2000; Ridgwell and Zeebe, 2005; Riebesell et al., 2000; Zondervan et al., 2001). Limiting secondary precipitation of CaCO3 is important for OAE because there is release of CO2from the precipitation of CaCO3 (Eq. 1) – which reduces the efficiency of OAE.
Another potential outcome of OAE is for organic matter to be ballasted to the deep ocean by aggregating on newly formed particulate inorganic carbon (PIC) (Riebesell et al., 2009). The natural global production of particulate organic carbon (POC) is known to be 4–10 times higher than PIC production (Barker et al., 2006); although this ratio is highly variable in time and space (Berelson et al., 2007; Dunne et al., 2007). Renforth and Henderson, (2017) hypothesized that if the POC production remains higher than PIC production even under OAE, then the CO2 emissions from CaCO3 production by marine calcifiers could be offset. This highlights the need for us to assess whether enhanced calcification after OAE will contribute to CO2 production or if it might further sequester organic carbon by enhancing POC production or by aggregating and ballasting POC via enhanced PIC (Bach et al., 2019).
Given the variety of compounds available to increase alkalinity (Renforth and Henderson, 2017), their composition and deployment style will determine the magnitude of change in Omega (Ω = the saturation state) and likelihood of CaCO3 precipitation. This applies to both the near field impacts at the point of injection and the far field impacts after the alkalinity has been dispersed. Hereafter, we shall reference Ω in terms of Ωaragonite as this is the morphotype that precipitates more readily in present-day seawater (Morse et al., 2007). Many studies have observed increased carbonate mineral precipitation, as demonstrated by the loss of alkalinity (TA) and dissolved inorganic carbon (DIC) after the addition of sodium hydroxide (NaOH), quicklime/slaked lime (), and even sodium carbonate (Na2CO3). Precipitation was observed in both short term (<5 d) (Hartmann et al., 2023; Hashim et al., 2025; Moras et al., 2022; Subhas et al., 2022), and longer term (∼ 20 d) perturbation experiments at a range of mineral saturation states (Moras et al., 2022, 2024; Paul et al., 2025; Ringham et al., 2024; Suitner et al., 2024). Yet, OAE experiments conducted with cultures of coccolithophores have noted no change to calcification rates after additions of calcium and bicarbonate ([Ca2+] + ) (Gately et al., 2023). The experimental conditions of observed CaCO3 precipitation will be discussed to provide further context to the results presented in this study.
The examples of existing perturbation experiments come from natural waters around Spain, North Pacific, North Atlantic gyres, and Australian coastal waters. To this rapidly growing body of research, we present the changes of organic and inorganic carbon inventory and partioning during 4 d OAE experiments conducted using coastal California waters from Los Angeles (LA) Harbor. The waters offshore from Los Angeles are richly characterized by decades of regional studies (https://dornsife.usc.edu/spot/publications-and-projects/, https://calcofi.org/publications/peer-reviewed-publications/, last access: 5 March 2026). Yet waters from within LA Harbor contain blends of offshore ecosystems modified by nearshore processes. In our study, we use three different approaches to elevate Ωaragonite by: (i) increasing pH (using two different bases) and (ii) adding [Ca2+] + to simulate accelerated weathering of limestone. In constraining the resultant changes to the amount of PIC, POC and DOC production, we conduct a carbon budget analysis that helps define how alkalinity may change the natural cycling of organic and inorganic carbon.
2.1 Study area
With the exception of some short-term experiments conducted on Santa Catalina Island at the USC Dornsife Wrigley Marine Science Center (33°26′40.52′′ N, 118°28′47.787′′ W), all other experiments were conducted with water collected from ∼ 1 m depth in Los Angeles Harbor, at AltaSea Marine Center (33°43′33.64′′ N, 118°16′11.999′′ W). This region exchanges seawater with the Southern California Bight, which is a part of the California Current System. The microbial community structure in the Port of Los Angeles in the summer is dominated by diatoms, pico-eukaryotes, and heterotrophic bacteria. Dinoflagellates, Synechococcus, and photosynthetic nanoplankton are in less abundance. In the fall, the carbon biomass shifts to the following in order of abundance: Bacteria > Picoeukaryotes > Synechococcus > Diatoms ∼ Nanoplankton > Dinoflagellates; these proportionally decrease in the winter when Diatoms become the dominant species again (Bialonski et al., 2016; Caron et al., 2017; Connell et al., 2017). Regardless of the season, the carbon biomass is higher in the Port compared to the costal San Pedro Ocean Time series station (∼ 17 km offshore) or in the marine protected area near Santa Catalina Island (∼ 45 km offshore) (Connell et al., 2017).
Alkalinity perturbation experiments were conducted in 5 L Thermo Scientific Nalgene PETG bottles (total volume is ∼ 6 L with no headspace) suspended 1 m below the water surface off a dock at AltaSea Marine Center. Surface seawater conditions (temperature and sunlight exposure) during each experiment are recorded in Table 1. Temperature (°C) and Light Intensity (lux) were measured with HOBO™ Temperature and Light Loggers, and the lux was converted to photosynthetic photon flux density (µmol photons m−2 s−1) by multiplying lux with the standard conversion factor of sunlight (0.0185). Salinity of the control waters from all experiments were roughly 35 ± 0.5 ppt; salinity was measured with a refractometer.
Table 1Ambient sea surface conditions during each experimental deployment.
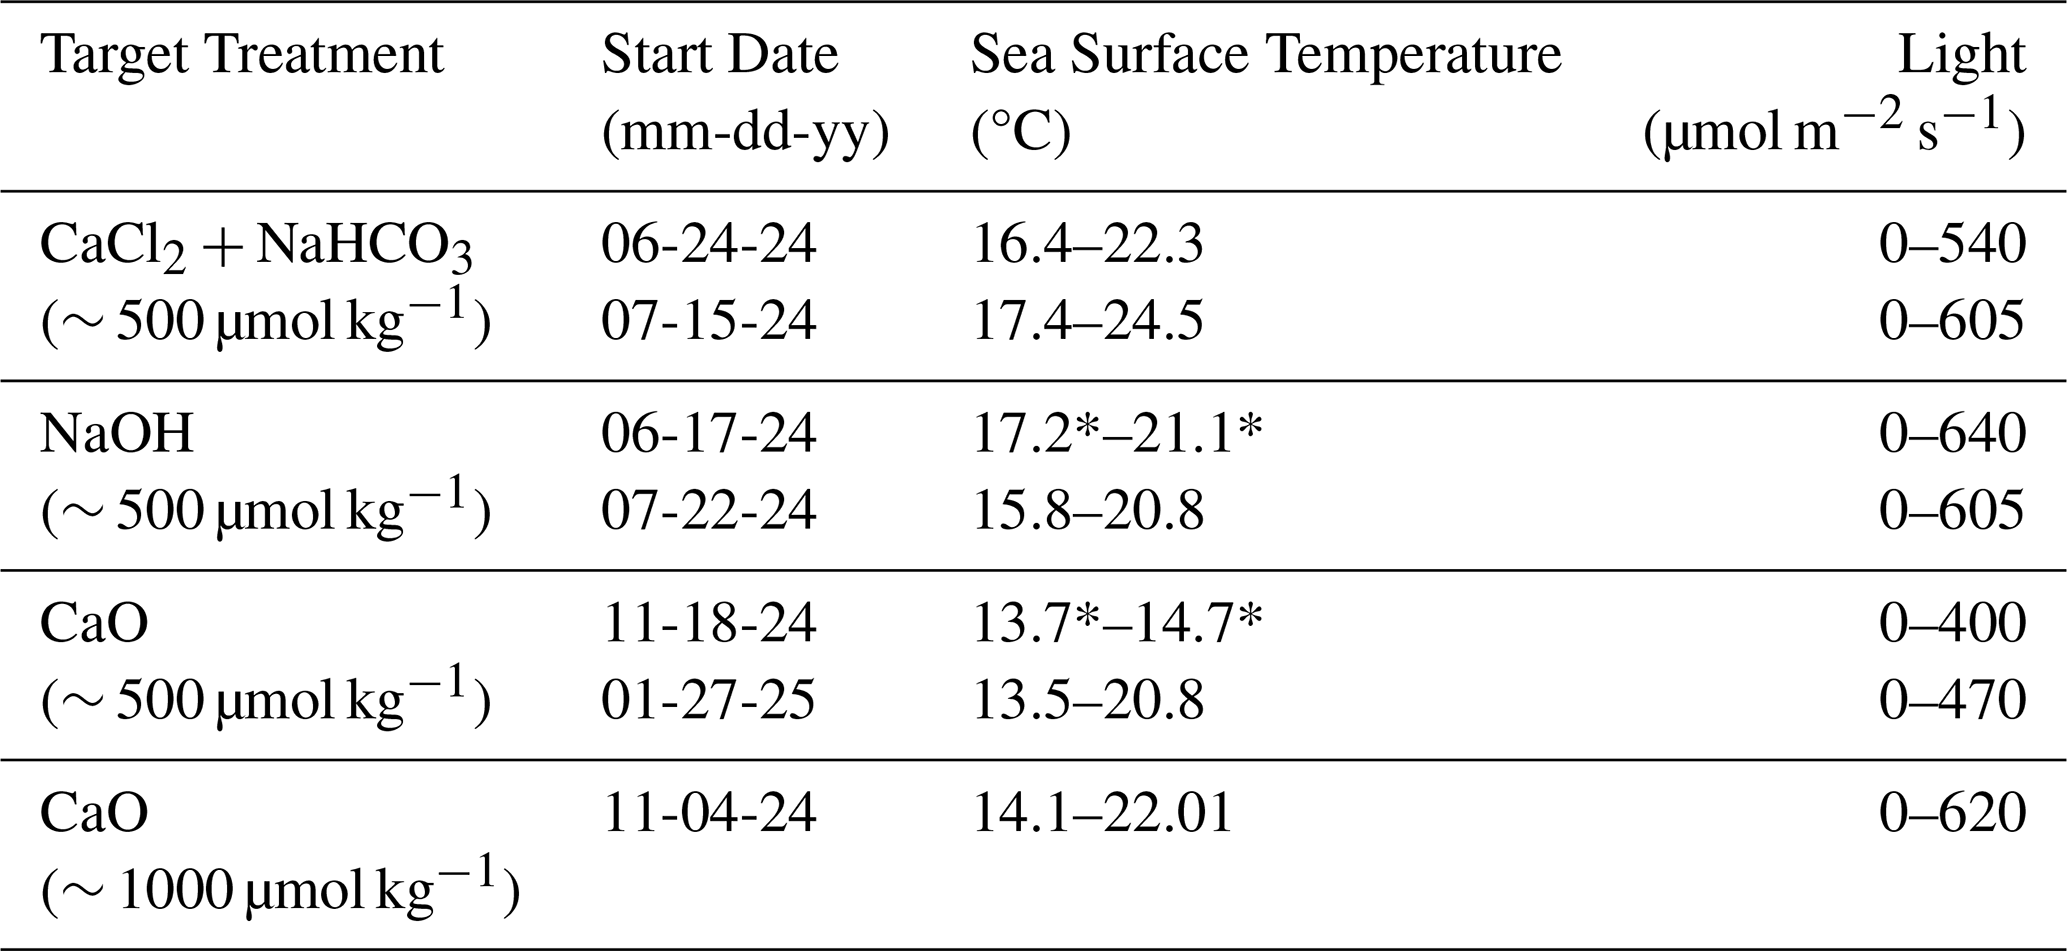
* Data taken from NOAA Tides & Currents from Station #9410840 Santa Monica, CA. All other data measured from the AltaSea dock side water at ∼ 1 m water depth.
2.2 Alkalinity types
In this study we induce an alkalinity perturbation that simulates two different methods of OAE at two target enrichments, (1) Base Addition: where a strong base is delivered to the surface of the ocean and is intended to increase oceanic uptake of atmospheric CO2 by disrupting the pH balance. To simulate this, we use two common bases, NaOH (J. T. Baker, New Jersey. ACS Grade, Lot. No.: 99057), and CaO (Sigma-Aldrich, Missouri. Reagent Grade, Batch No.: MKCS6828). The other method considered here is (2) accelerated weathering of limestone (AWL) (Dong et al., 2025; Kheshgi, 1995; Rau and Caldeira, 1999) where atmospheric CO2 and water are pumped through a limestone reactor to neutralize the CO2. The outflow water is enriched in the byproducts of this reaction (Eq. 2) – Ca2+ and ions. In this method the CO2 is neutralized before it enters the seawater, as opposed to being neutralized in-situ during air-sea gas exchange with the base addition method. We mimic AWL with the addition of Calcium Chloride (CaCl2, Sigma-Aldrich, Missouri. Assay ≥97 %, Batch No.: SLCL2754) and Sodium Bicarbonate (NaHCO3, Sigma-Aldrich, Missouri. ACS Grade, Batch No.: SLCM3421) with a molar ratio of 1:2 for (Eq. 3).
To achieve specific dosages/concentrations, the alkalinity needed to be fully dissolved, thus we avoided introducing any particles into the incubations. Also, aqueous alkalinity delivery is currently considered a favorable delivery method for OAE projects (Cai and Jiao, 2022; Savoie et al., 2025). To compare our results with other published regional studies (Bach et al., 2024; Ferderer et al., 2022; Kousoulas et al., 2025; Subhas et al., 2022) and evaluate impacts above current instrument detection limits (See Sect. 3.1.1), we chose target enrichments of ∼ 500 and ∼ 1000 µmol kg−1. We created dissolved stock solutions of each alkalinity type (NaOH, CaO, CaCl2, NaHCO3) with minimal exposure to the atmosphere. A solid salt or base was precisely weighed, transferred to a pre-weighed volumetric flask, the flask was filled with Milli-Q water, and no headspace remained. After all solids were dissolved, the solution was siphoned through a 0.2 µm GF/F filter into an evacuated gas impermeable foil bag (Supelco, Pennsylvania) for storage. We took subsamples for TA and DIC from the stock foil bags during preparation and while dosing in the field (measurement details in Sect. 2.5) to back-calculate the final concentrations of the stock solutions. The target dosages, the predicted changes calculated through a dilution equation, and the actual measured changes in TA within bottle replicates (n=3) are reported in Table 2. Alkalinity was measured with an open-system Gran titration method at 25 °C (details in Lunstrum and Berelson, 2022; Subhas et al., 2015) and no precipitation was observed in the storage containers (stored at 4 °C until analysis). As the solubility of CaO in water is less than that of the other chemicals used in this study, a larger volume of a weaker CaO stock was required to make the alkalinity additions. Hence, an immediate drop in DIC (by <2 %) due to the expected dilution by the stock solution is observed in all CaO experiments.
To increase the sensitivity of our measurements for the carbon budget analysis, we added 1–2 mL of a 13C tracer in the form of NaH13CO3 (Sigma Aldrich, Missouri. CAS No.: 87081-58-1, Assay = 99 %, Lot No.: MBBC0208V) to all controls and treatments in five experiments: 15, 22 July, 4, 18 November 2024, and 27 January 2025. The tracer solution (∼ 0.015 M) was prepared similarly to the stock solutions discussed above. The tracer changed the alkalinity by <5 µmol kg−1 but increased the δ13DIC signal to 80 ‰–200 ‰ (precise start values are included in the associated dataset (Wani et al., 2026)).
Table 2Summary of alkalinity additions.
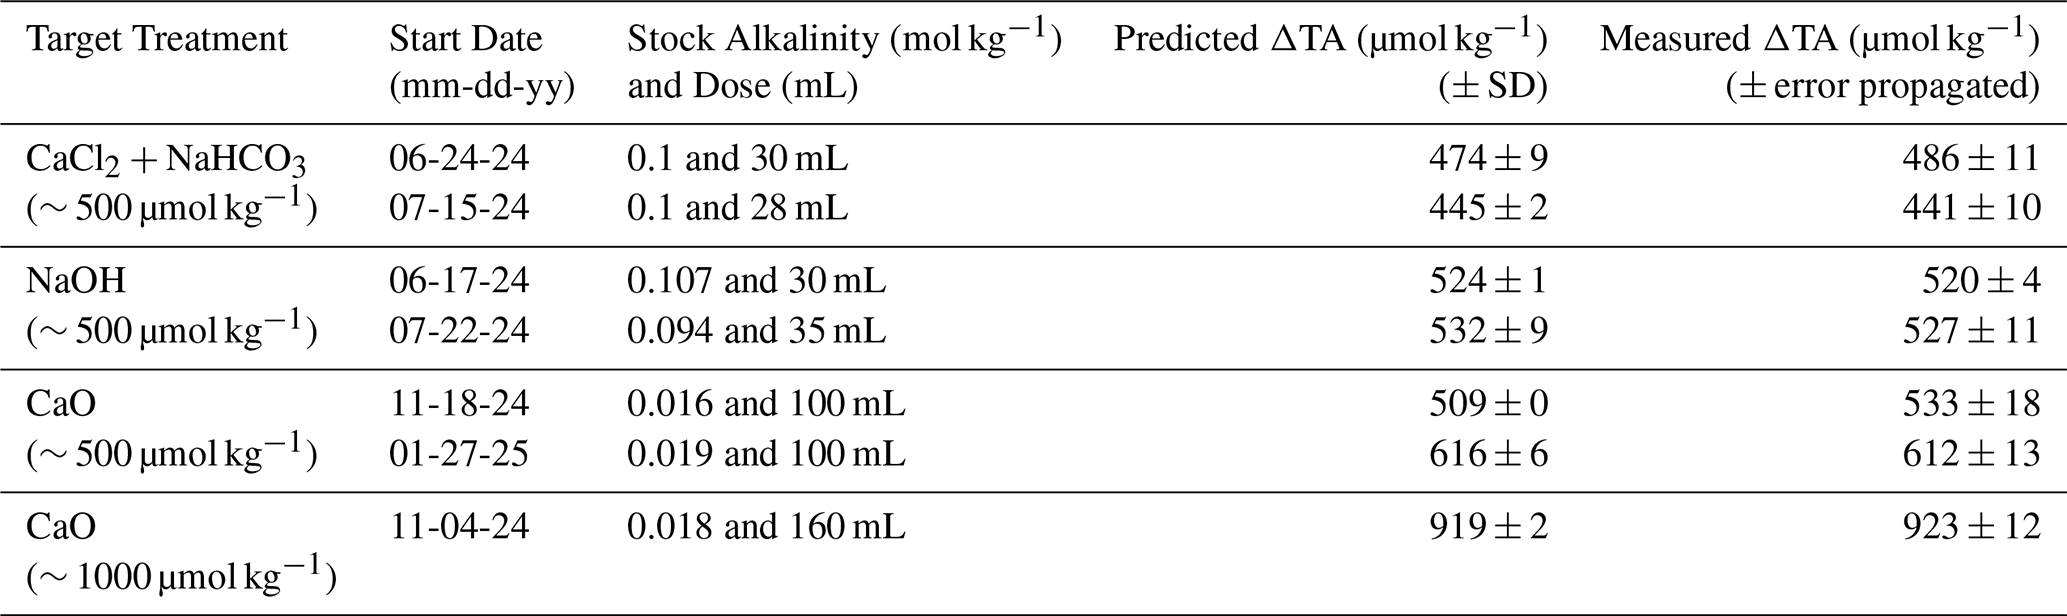
Predicted error comes from the standard deviation of the seawater volume in n=3 bottles. Measured error comes from the standard deviation of the replicate bottles and the error was propagated after values were corrected with a certified reference material (Dickson Seawater).
2.3 Experimental set up
There is long standing discourse on whether bottle experiments mimic natural conditions enough to be useful to answer questions of “ecosystem impact” (Daehler and Strong, 1996; Fraser and Keddy, 1997; Giesy, 1980; Ives et al., 1996; Lawton et al., 1993; Stachowski-Haberkorn et al., 2008). There are many experimental design factors that can influence the community assemblage, such as: material used for the structure, microcosm volume, filling mechanism, mixing, replication, carbonate chemistry, exclusion of larger organisms, and wall surface growth (Riebesell et al., 2010). In perturbation experiments conducted with small volume microcosms (<10 L) it is recommended to limit the timescale of study to days-weeks if the goal is to understand the impact of the perturbation on microbial or plankton assemblages (Parsons, 1982; Riebesell et al., 2010). The purpose is to limit unwanted effects such as biofouling on the walls of the enclosure, nutrient limitation, excess grazing or changes due to lack of predators – these are commonly referred to as “bottle effects”. Our aim was to compare multiple alkalinity sources; thus we opted for a replication method that incorporated sacrificial bottle timepoints over the span of four days (Iglesias-Rodríguez et al., 2023). We maintained a closed system experiment (with no headspace) to constrain the carbon budget by eliminating gas exchange as a potential variable for this study. This can be an analog for water that may temporarily lose contact with the atmosphere, e.g. when waters mix deeper into surface ocean or for times when gas exchange is minimal.
We collected seawater for each experimental treatment by pumping from 1 m below the surface from a dock at AltaSea, in the Los Angeles Harbor. The water passed through a 250 µm mesh (to remove large grazers) (Carter et al., 2005; de la Broise and Palenik, 2007) and 22 bottles were filled in a “round robin” manner to promote homogeneity between bottles filled at different times (filling occurred in <20 min). Once all bottles were full, with no headspace, half were randomly selected to receive a dosage of alkalinity (NaOH, CaO, or CaCl2 + NaHCO3). Bottles were opened, 50–150 mL of seawater was removed; stock water was pulled out of the stock solution foil bags into volumetric syringes and then pushed through 0.2 µm PES syringe filters into the bottles. Any remaining headspace was once again filled with seawater; bottles were sealed and then inverted five times before being tied to the dock. All treatment bottles were given a dose of alkalinity on Day 0, some were immediately sampled, others left in the water column to experience natural changes in temperature and light conditions until their sampling day. Only one treatment experiment was conducted per week; hence, we can only compare each alkalinity type to its respective control (no addition of alkalinity). Sampling occurred on days 0, 2, and 4 with three bottle replicates per time point. We also filled and added alkalinity to 2 bottles that were incubated devoid of light as well as 2 dark controls (wrapped in black tape, See Fig. 1). Results and discussion of all dark bottle experiments appear in the Appendix A.
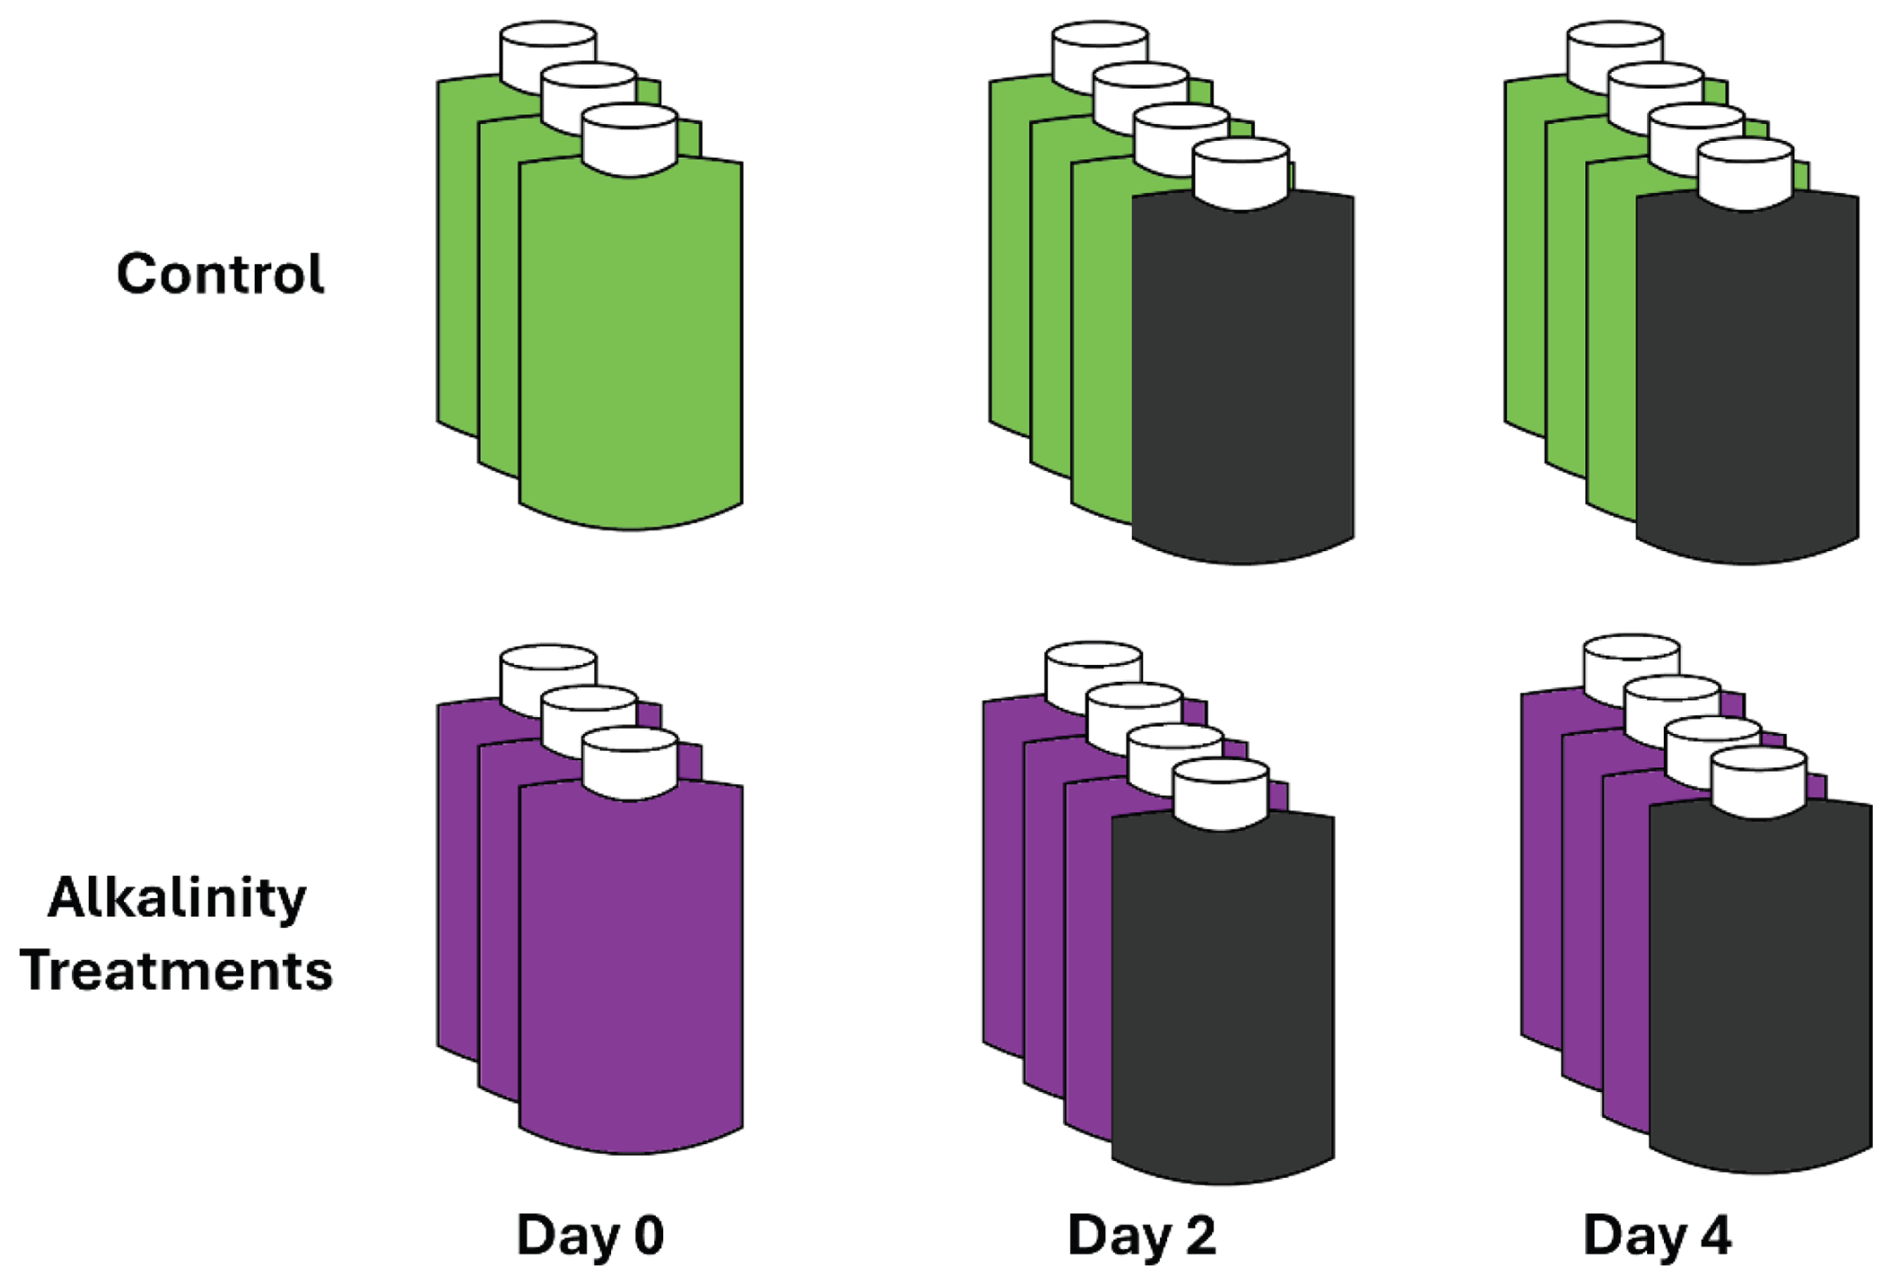
Figure 1Experimental set-up. Triplicate bottles shown for each timepoint. Controls are shown in green, alkalinity amended bottles shown in purple, and bottles with light restriction are shown in black.
2.4 Sample processing
Bottles pulled out of the ocean were transported back to the lab (on ice) on their sampling day and weighed to track water that was used for sub-sampling. Bottles were gently inverted 5 times and then opened to measure temperature (°C) with a probe and dissolved oxygen (µmol kg−1) with PreSens Optical Oxygen Sensor Spots that were attached to each bottle. The oxygen measurements were corrected to the mean temperature recorded by the in situ HOBO™ Loggers. To avoid sampling from the surface layer of water in contact with the air, a ∼ 6 inch piece of Tygon® F-4040-A attached to a 50 mL syringe via a one-way valve was inserted into bottom of the sample bottle. The first 15 mL of sample water was used to rinse the syringe, filter and needle that would be used to collect carbonate chemistry samples, ensuring no bubbles entered the sample storage containers as recommended by standard operating procedures (Dickson et al., 2007). Through subsequent sampling, 250 mL of sample water was filtered through a 25 mm 0.7 µm glass fiber filter (Whatmann GF/F) (∼ 15 min per bottle for filtration and subsampling). A portion of the filtrate was collected for 5 mL duplicates of DIC (injected into septum-top of pre-evacuated exetainers), alkalinity (15 mL Falcon tubes with no headspace), nutrients (15 mL with no headspace), dissolved organic carbon – DOC (40 mL pre-combusted amber glass septa vials), and 50 mL for archival purposes. We note that there could be some contamination in DOC samples because we used Tygon® to pull the sample into the syringe (Dickson et al., 2007); however, this would affect the controls and treatments in the same manner. The GF/F filter was wrapped in aluminum foil and placed in a freezer (−20 °C) for later Chl a analysis (< a month) (using a Turner Trilogy Fluorometer and the EPA SOP LG405.v11 for “Chlorophyll-A Non-Acidification Method” (U.S. EPA, 2021)). One liter was filtered for future genomic analyses not discussed in this paper, on Supor 0.2 µm 47 mm PES filters, and stored at −80 °C. The remaining (4.5 L) seawater was filtered (detailed in Sect. 2.5.2) for particulate organic and inorganic carbon.
2.5 Measurements for carbon budget
A carbon budget for each bottle was created by assessing the total concentration of carbon in the dissolved and particulate pools. Carbonate system parameters were derived from TA and DIC measurements (discussed below) using CO2Sys.v3 (Pierrot et al., 2021) (Parameters: pH Scale = Total Scale, CO2 Constants = (Dickson and Millero, 1987), KSO4 = (Dickson, 1990), KF = (Perez and Fraga, 1987), Boron = (Lee et al., 2010)). Ωaragonite values for treatments with added Ca2+ (CaO & [Ca2+] + [] Experiments) were calculated by multiplying the [CO] output from CO2Sys and [Ca2+] accounting for the increased Ca2+. All calculations use for Aragonite in seawater ( = 10−6.19). All other Ωaragonite values derived from CO2Sys scale [Ca2+] to salinity.
2.6 Dissolved carbon phases
Samples for Dissolved Inorganic Carbon (DIC) were collected in pre-evacuated 12 mL borosilicate glass Labco Exetainers® and immediately placed at 4 °C for storage until analysis (<1 week). For analysis, samples were acidified with 2 mL of 10 % H3PO4 (Spectrum Chemicals, Gardena, California) and the evolved CO2 was analyzed by a Picarro G2121-i Cavity Ring Down Spectrometer (as detailed in Subhas et al., 2015). Optical grade calcite, with a known 13C value (2.47 ‰) was used to create an eight-point standard curve (ppmCO2 per mg of CaCO3) for each run and a certified reference material (CRM-Batch 214) generated by Andrew Dickson's Lab at SIO, UCSD was used to correct all the final DIC concentrations (4 CRM replicates included per run). The total CO2 standard curve produced with the Automate Sample Delivery System + Picarro CRDS had an R2 = 0.9999 ± 0.0001 and slope variability = 1.5 % for all runs in this dataset. Replicate CRM samples provided a measure of precision, ±20 µmol kg−1. The isotopic values of replicate standards were within ±0.2 ‰.
Samples for Dissolved Organic Carbon (DOC) were collected in 40 mL pre-combusted amber glass vials, acidified to 0.1 % with concentrated hydrochloric acid (ACS grade, Supelco, Massachusetts), and placed in cold storage (4 °C) until analysis. The samples were run on a Shimadzu TOC-L Analyzer (NPOC method; Injection volume = 150 µL; No. of Injections: Best 4 of 5; Max Variance of Replicates: 2.00 %). Within a run the standard curve had an R2 = 0.9998 ± 0.0002, between runs the reproducibility of the slope had 16.5 % error. Samples were initially purged with CO2-free compressed air to remove inorganic carbon, combusted in a furnace via catalytic oxidation, and the generated CO2 was measured by an infrared gas analysis. Standards for organic carbon were made with Oxalic Acid (dried at 70 °C for 2 h), and CRMs from the Hansell Lab (University of Miami, RSMAS) were used to correct final concentrations (DSR Batch 22 Lot # 10–22) with a replicate precision of ±10 µmol kg−1.
2.7 Particulate carbon phases
Roughly 4.5 L of seawater was filtered on 1–2 filters (0.7 µm 47 mm Whatman GF/F) for particulate inorganic carbon (PIC) and particulate organic carbon (POC) analyses. After filtration, ∼ 10 mL of buffered DI water (NaOH added to Milli-Q, pH 9) was used to rinse any residual seawater, and then filters were placed in the oven to dry overnight (60 °C). Filters were hole punched (diameter = duplicates of 6–12.5 mm); the hole punched fractions (2 %–8 % of total filtered area) were wrapped in tin foil capsules (9 × 5 mm) for combustion in a CosTech Elemental Analyzer – which is connected to the Picarro for CO2 and analysis. This analysis of Total Carbon had a reproducibility of ±1 %. The remaining fraction of the filters were rolled and placed into Labco Exetainers® – these samples were acidified with 5 mL 10 % H3PO4and the evolved CO2 measured similarly to DIC described above. Particulate Organic Carbon (POC) was calculated by subtracting the PIC (µgC L−1) concentration from the Total Carbon (µgC L−1) calculated for the whole filtered area.
2.8 Data visualization and statistical analysis
Statistical analysis and data visualization was conducted in R and R Studio version 4.5.1. Means and standard deviations for each treatment by time point were generated using the data_summary function. Triplicate values were averaged, but data points that were found outside of three standard deviations from the mean were flagged as outliers and not included in the statistical analysis (Pukelsheim, 1994). The dataset was analyzed with two statistical approaches: (i) To test whether the effect of alkalinity addition had a statistically significant impact on PIC, POC, DOC and Chl a over time, we used a linear model with an interaction term and assessed if the p-value on the interaction term (i.e., the difference between the slopes of the control and the treatment) was statistically significant (significance threshold α = 0.05) (results summarized Table 5). (ii) Since the previous method assumes linear relationships and normally distributed data (which may apply to some but not all variables) we also used a nonparametric two-way ANOVA (Analysis of Variance) – Scheirer Ray Hare test – to assess the impact of alkalinity addition on the Control and Treatment groups (significance threshold α = 0.05) (results summarized in Table 6). The implications of these tests and any statistically significant responses are summarized in the context of ecological variability in the Results and Discussion sections.
3.1 Short term impacts of alkalinity additions with high dilution
We intended to recreate an alkalinity impact condition that resembles high dilution of AWL after a few hours; an example outflow of alkalinity from a shipping vessel fitted with an AWL reactor would be about 3000–5000 µmol kg−1 (Dong et al., 2025). As the ship's wake would dilute the outflow, we chose to dilute a stock (∼ 4754 µmol kg−1) by different proportion; 1:150 (40 mL of stock), 1:300 (20 mL of stock), and 1:600 (10 mL of stock) (Table 3) based on dilution calculations presented by Dong et al. (2025) (inspired by Caserini et al., 2021; Chou, 1996). These incubations that lasted 3 h were conducted on Santa Catalina Island.
As seen in Table 3, additions at what could be realistic deployment concentrations after several hours of mixing result in changes that are extremely close to replicate error and instrument measurement error. The control seawater had an alkalinity = 2223 ± 6 µmol kg−1, DIC = 2015 ± 21 µmol kg−1, Ωaragonite = 2.41 ± 0.02, pCO2 = 536 ± 4 µatm, PIC = 7.1 ± 0.2 µg L−1, and POC = 68.4 ± 7.7 µg L−1. In the least diluted sample, the seawater alkalinity changes from 2223 ± 6 µmol kg−1 to 2233 ± 5 µmol kg−1 (the expected increase would be 2248 µmol kg−1) but there is no statistically significant impact on the concentrations of PIC or POC (p>0.05). Since we saw no impact on PIC or POC at such small changes in alkalinity, and these additions were at the lower limit of our measurement capabilities, we focused the rest of the paper on experiments that perturb the alkalinity by larger amounts (25 %–50 %) and for longer durations (2–4 d).
Table 3Summary of low concentration alkalinity amendments.

The treatments are shown as dilution ratios. Expected TA and DIC have been calculated by only assuming [HCO] has increased. The reported error is standard deviations between triplicate bottles (n=3).
3.2 Impacts of higher alkalinity amendments after 0–4 d
All the experiments with a 25 %–50 % alkalinity amendment above the control seawater were conducted with water collected and incubated at AltaSea in LA Harbor. Table 4 summarizes the concentrations of PIC, POC, Chl a, DOC, Ωaragonite values of the control seawater on Day 0, and the change in Ωaragonite values after treatment.
Table 4Initial concentrations of biogeochemical parameters at Day 0 (Control) of 4 d experiments.
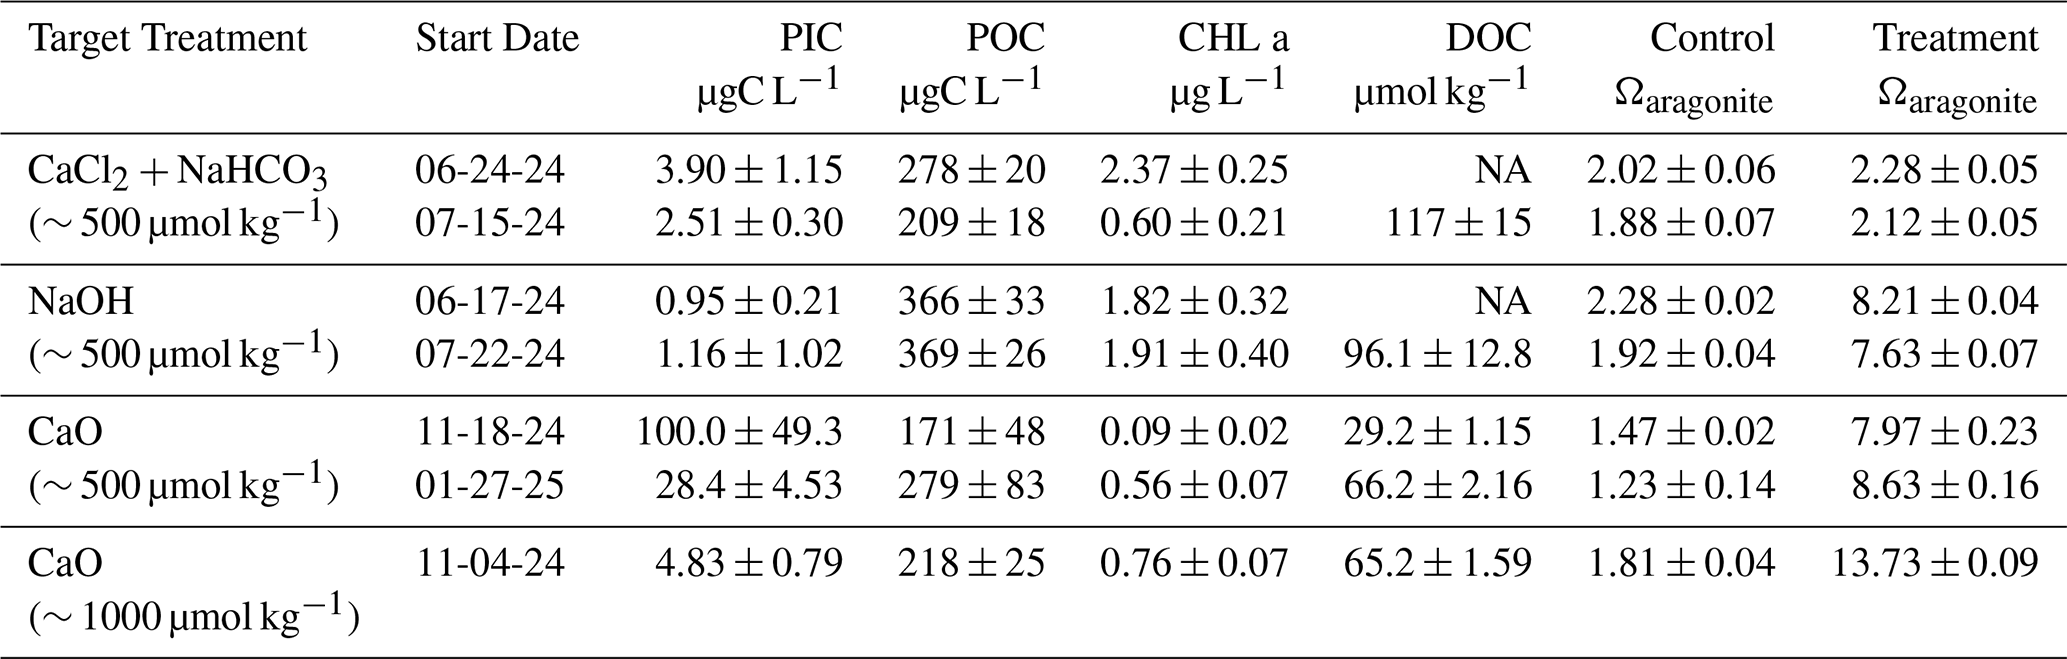
NA written where there is no data available.
3.2.1 [Ca2+] + [] additions: alkalinity enhancement ∼ 500 µmol kg−1
We performed two [Ca2+] + [] addition experiments on 24 June and 15 July 2024 which each lasted four days. Alkalinity added in the form of increases both alkalinity and DIC in a 1:1 ratio – hence, the change in pH relative to the Control is minimal for this treatment (Fig. 2). Over the incubation period, this treatment resulted in no statistically significant difference in the production of PIC (p>0.05, ANOVA and Linear Regression method, see Tables 5 and 6), the Ωaragonite only increased by 0.2 units in both experiments (Table 4). Chl a shows that changes in concentration over time were similar in both the control and the treatment (Fig. 2). The [Ca2+] + [] addition experiments intentionally showed the largest increase within DIC pool compared to all other alkalinity enhancements. There was a concurrent increase in both organic carbon pools of POC and DOC, but it was not statistically dissimilar from the changes within the control condition (p> 0.05, ANOVA and Linear Regression method). The partitioning of carbon between the inorganic and organic pools is further discussed in Sect. 3.4.2 Carbon Partitioning.
3.2.2 NaOH addition: alkalinity enhancement ∼ 500 µmol kg−1
NaOH additions occurred on 17 June and 22 July 2024. The addition of NaOH increases alkalinity but not DIC which results in a large change in Ωaragonite from ∼ 2 to 8.21 ± 0.04 (17 June 2024; pHT increases 0.63) and 7.63 ± 0.07 (22 July 2024; pHT increases 0.71). When compared to the control conditions, the changes in PIC, POC, DOC, and Chl a in the treatment conditions are also not statistically significant (Fig. 3) via either of two statistical analyses (p>0.05, ANOVA and Linear Regression methods). As with the [Ca2+] + [] additions, there are certain points in time where the controls diverge from the treatments, but there are no consistent trends across multiple variables (i.e., no indication that one group (control/treatment) is consistently higher/lower through time).
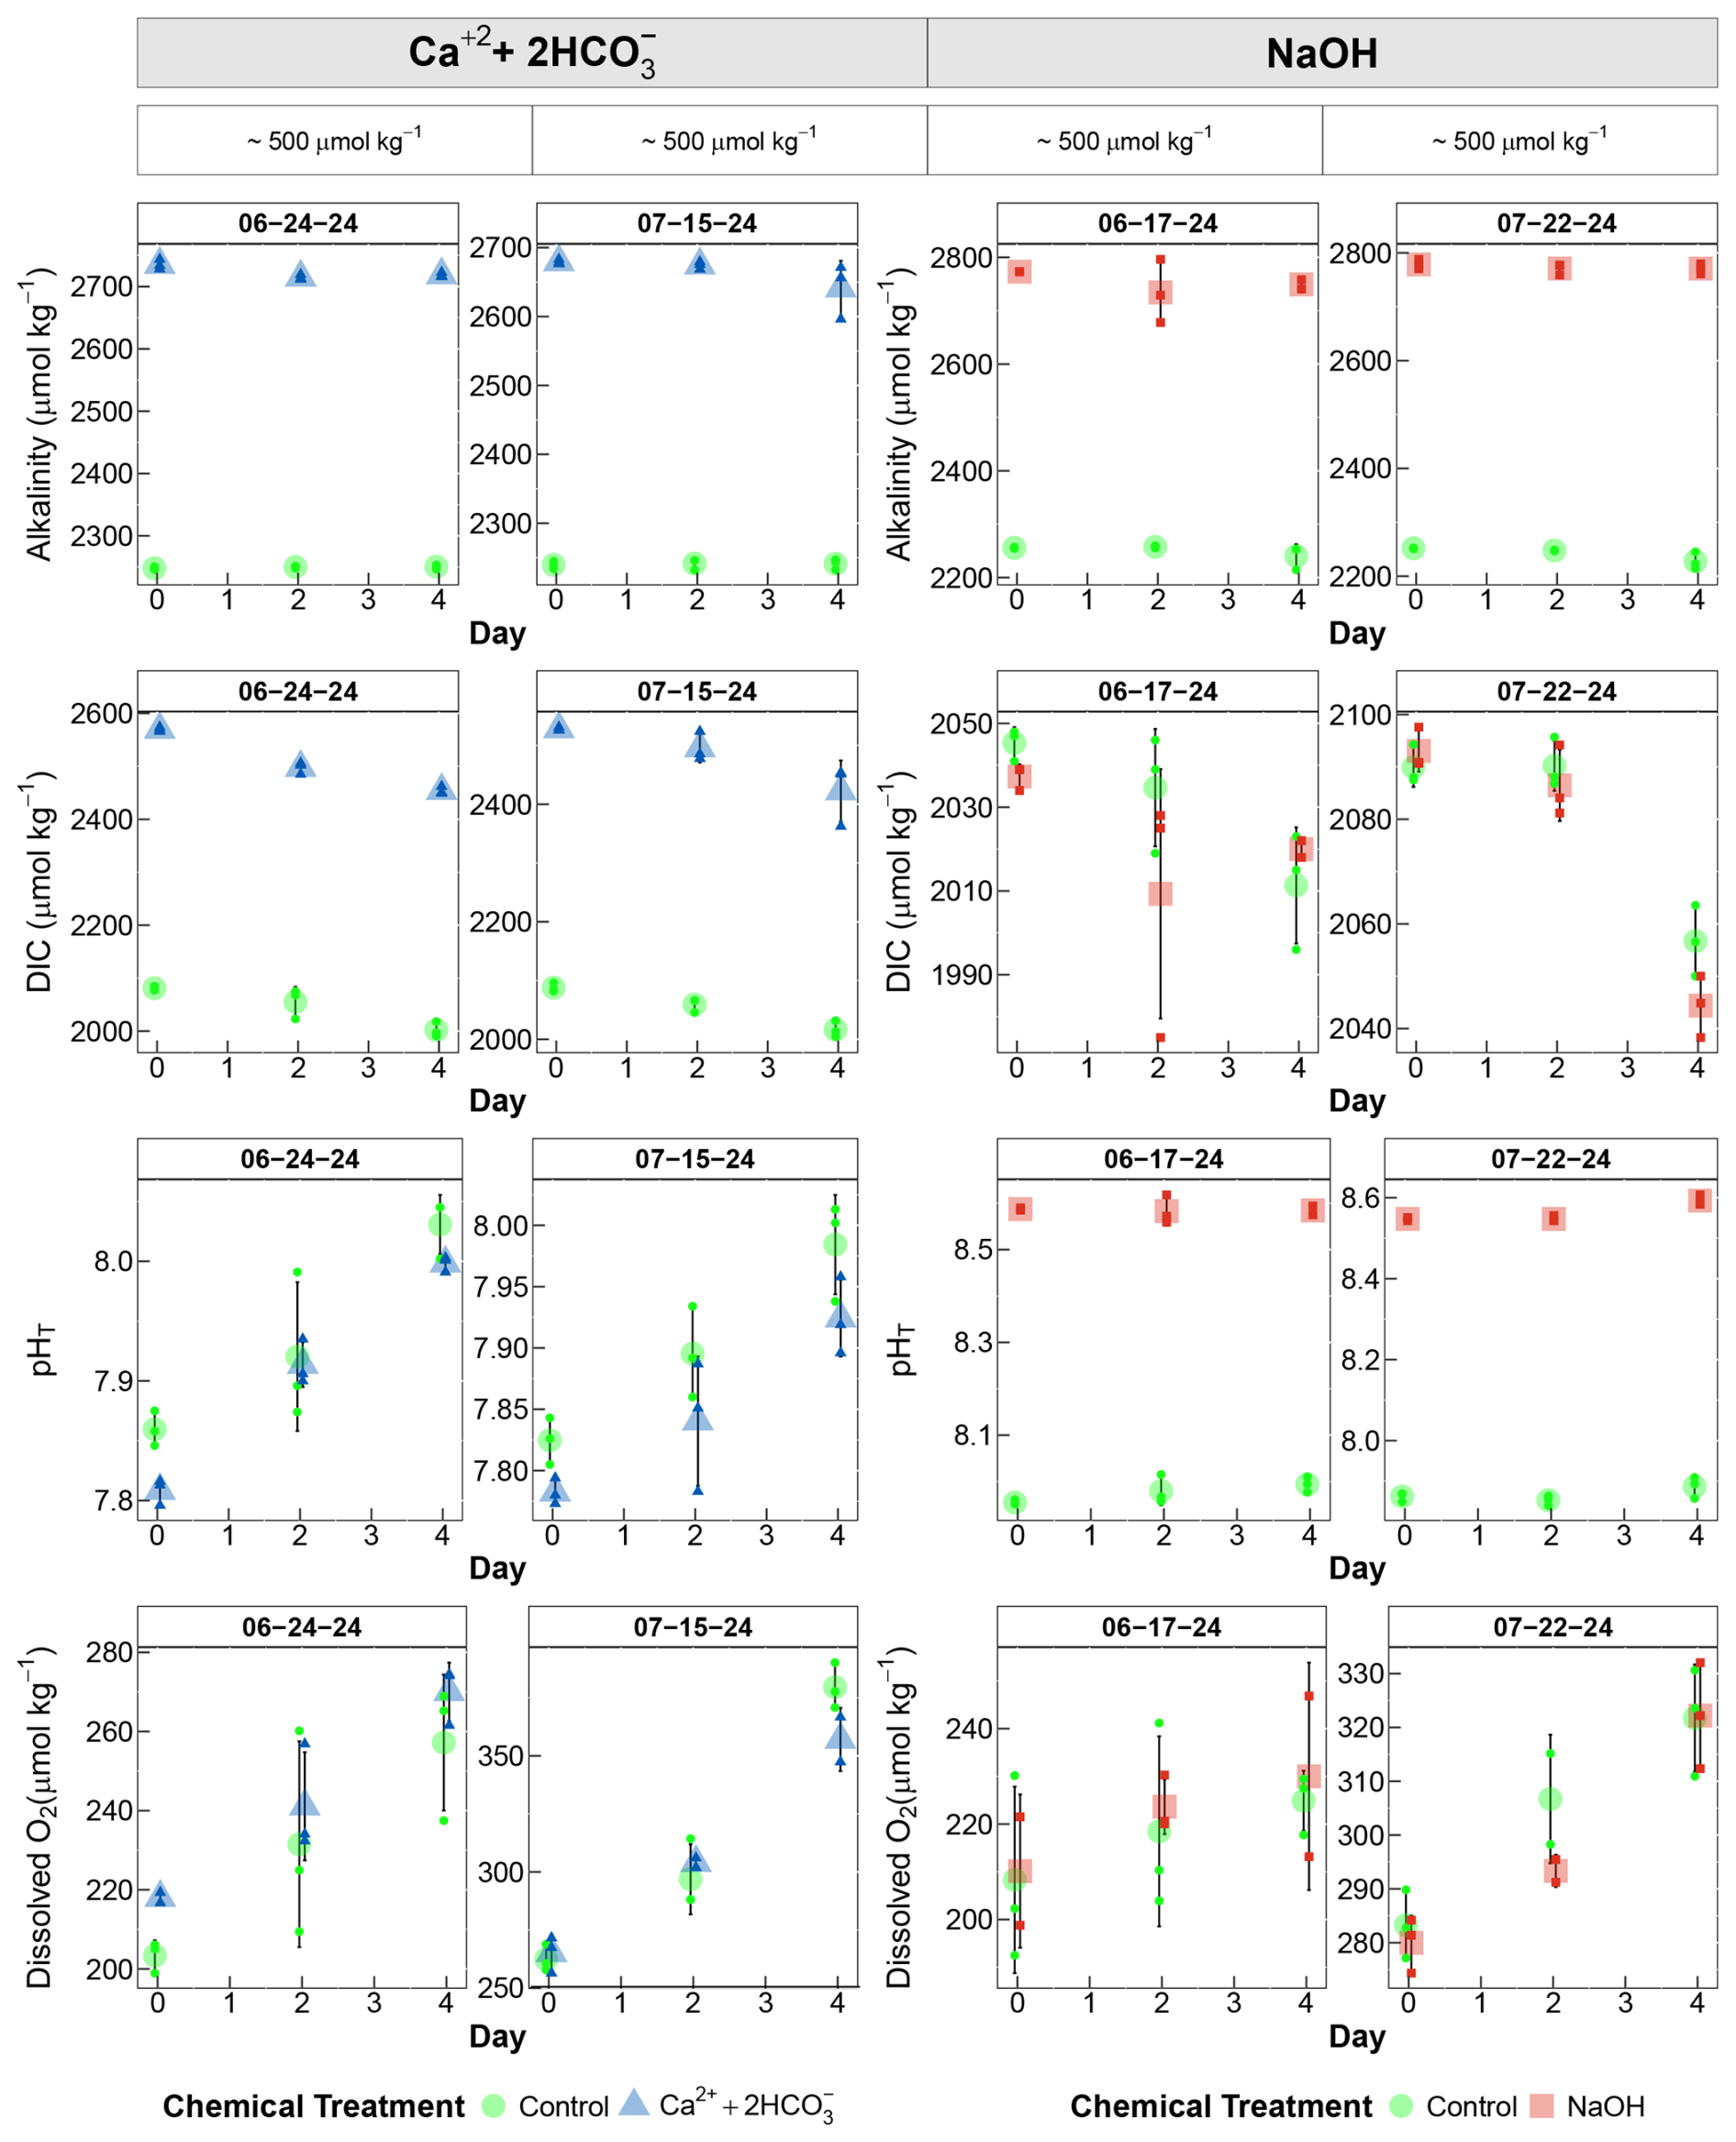
Figure 2Water chemistry from (NaOH and [Ca2+] + [HCO]) amendment experiments. Panels are grouped by the alkalinity treatment they received: Controls (green), NaOH (red) and CaCl2 + NaHCO3 (blue). The start date of the experiment is listed for reference to differentiate between duplicate experiments. The four variables displayed here are measured Alkalinity (µmol kg−1), measured Dissolved Inorganic Carbon (DIC, µmol kg−1), pHT (Total Scale) calculated from CO2Sys.v3, and Dissolved Oxygen (O2, µmol kg−1). Each plot shows the average of the treatment per timepoint (n=3), and the error bars are the standard deviation between the triplicate bottles. Smaller symbols show individual bottles.
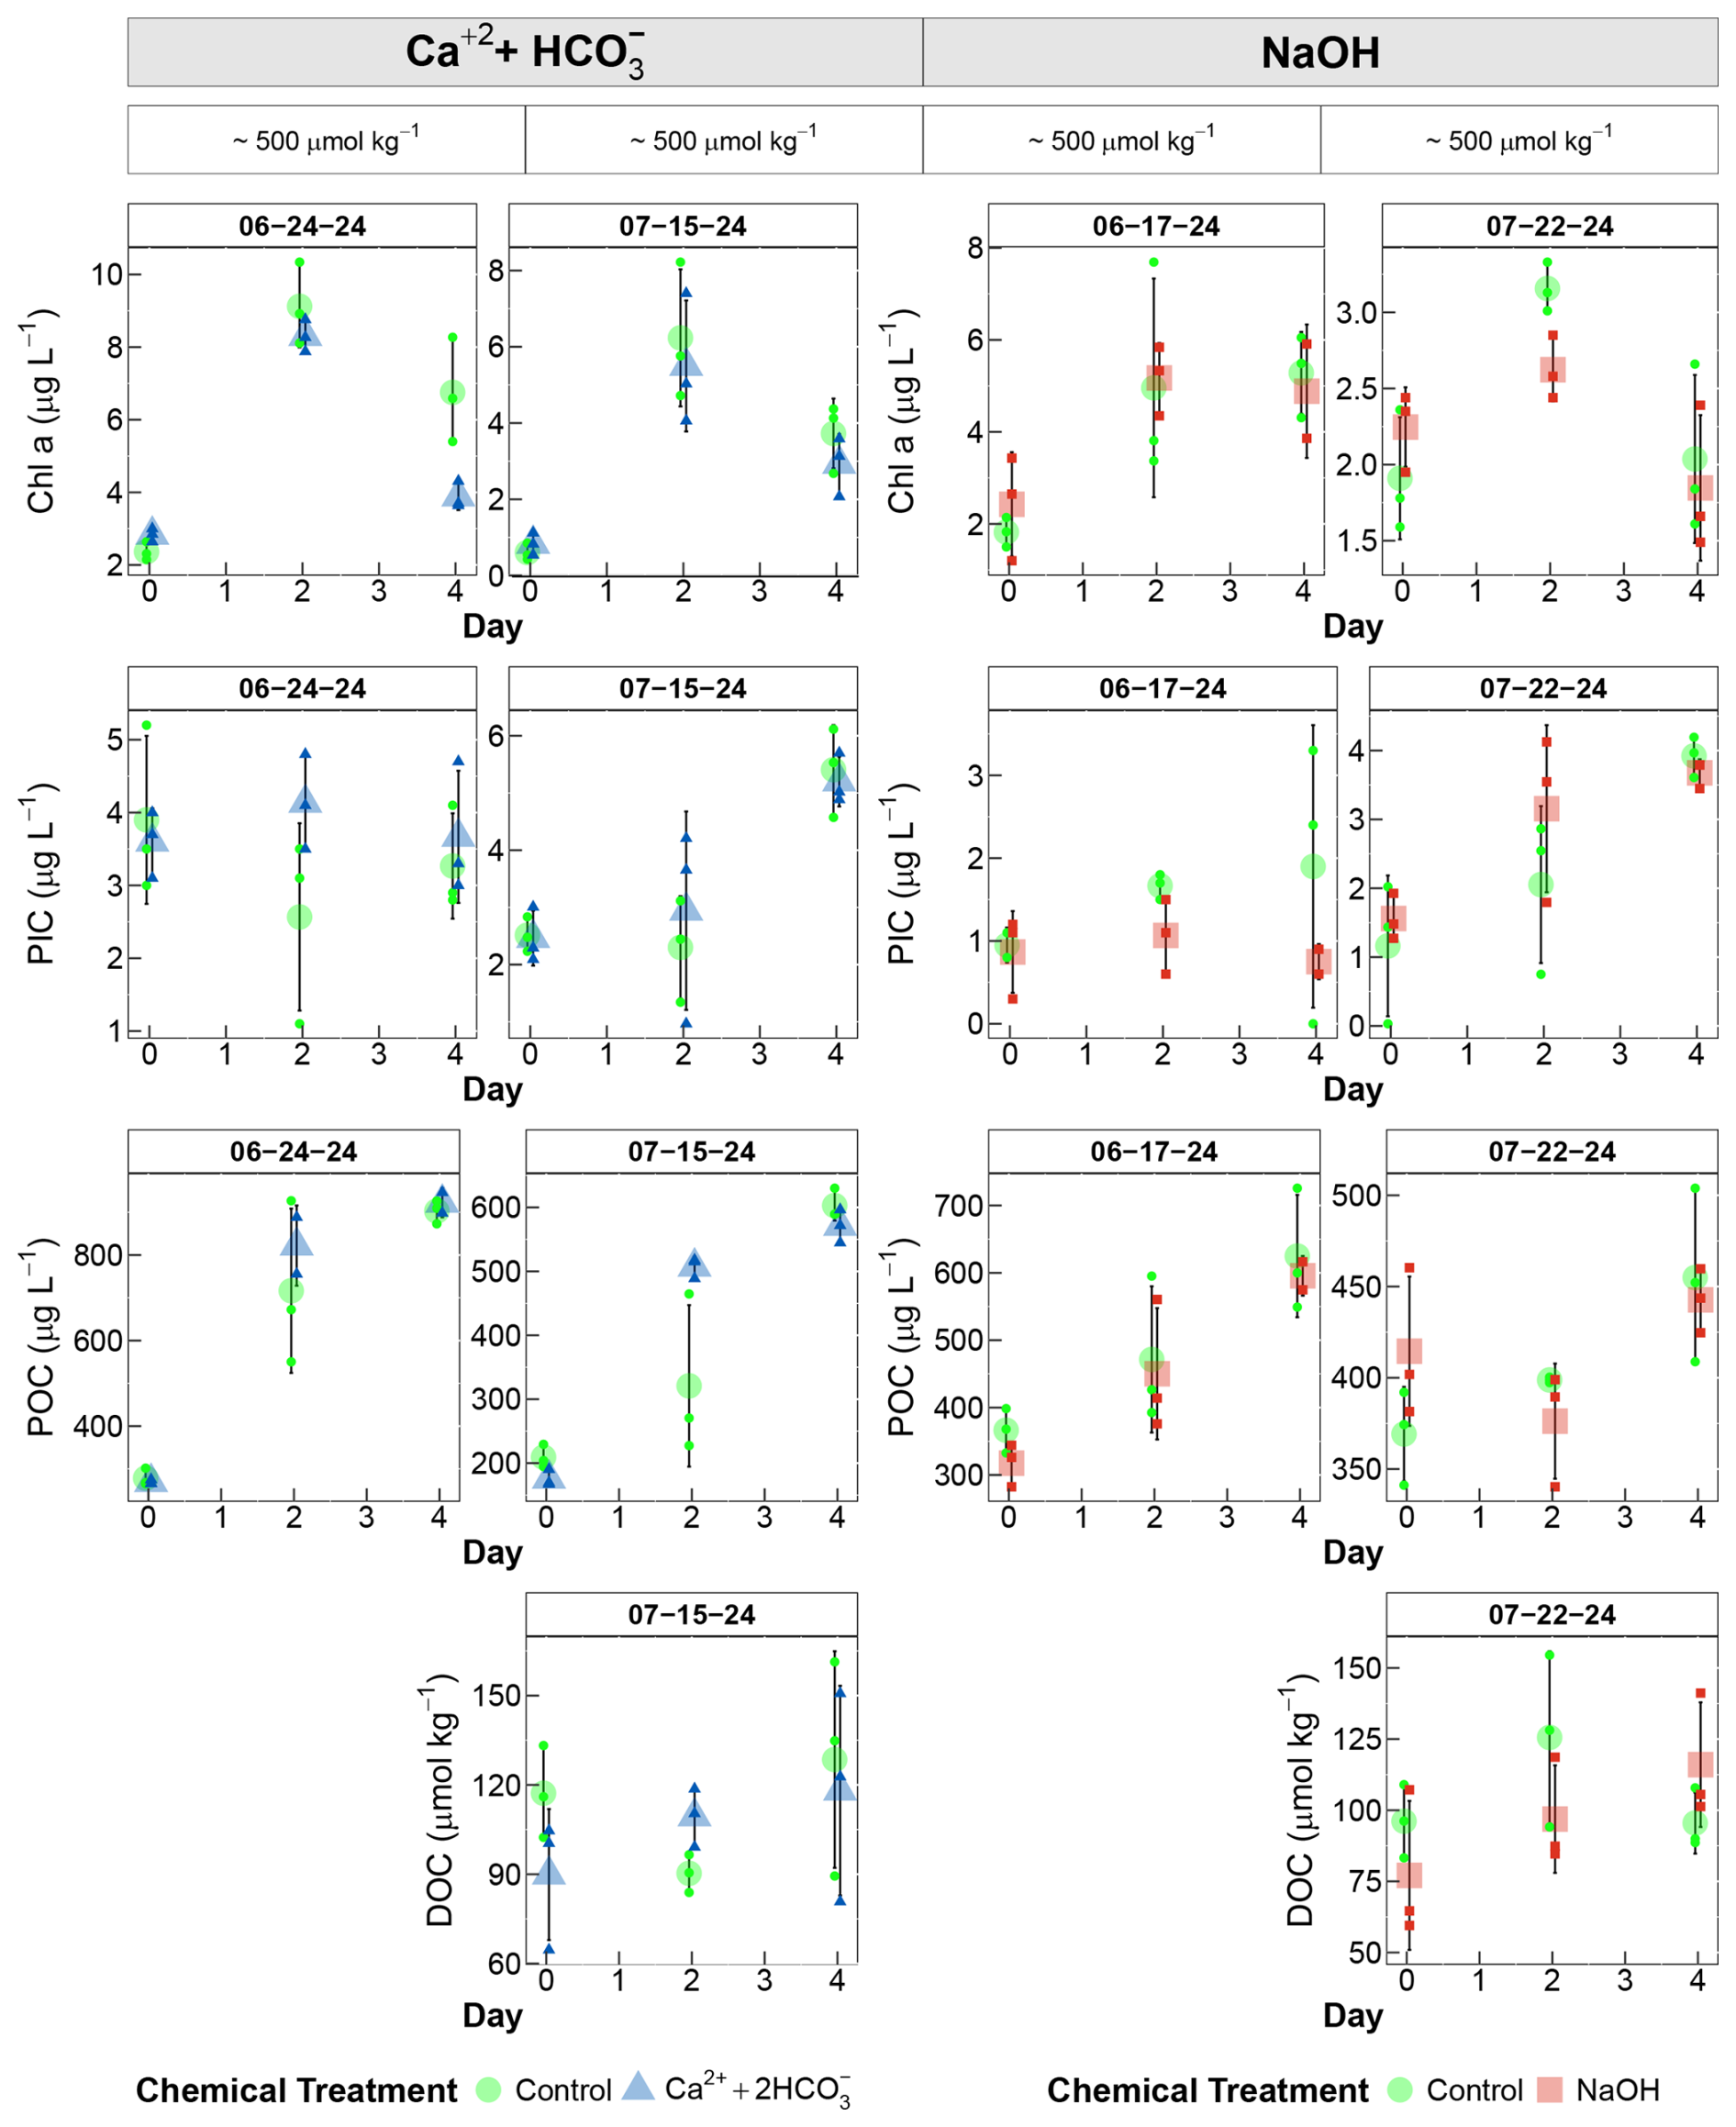
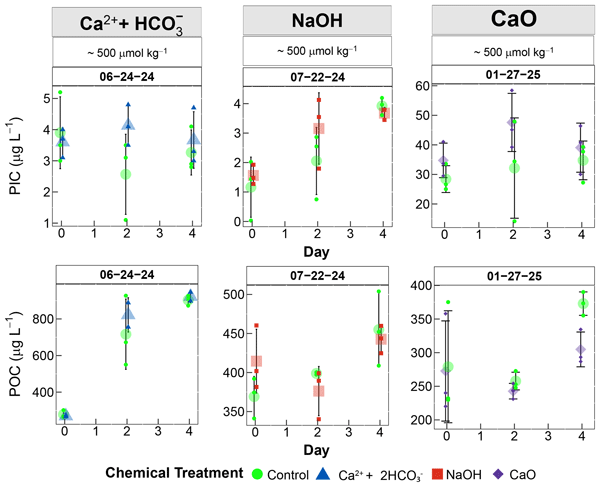
Figure 3Four day timeseries of biogeochemical response to different alkalinity enhancements. Smaller symbols show individual bottles; larger symbols show the mean. Error bars are the standard deviation between replicates (n=3). The start date of the experiment and the amount of alkalinity added are included as headers for reference. The variables displayed are Chlorophyll a (Chl a, µg L−1), Particulate Inorganic Carbon (PIC, µg L−1), Particulate Organic Carbon (POC, µg L−1), and Dissolved Organic Carbon (DOC, µmol kg−1).
3.3 CaO additions
3.3.1 CaO addition: alkalinity enhancement ∼ 1000 µmol kg−1 (4 November 2024)
We raised the Ωaragonite value, with CaO addition, above the threshold for spontaneous precipitation of CaCO3 in seawater (Ωaragonite>12, Ωcalcite>19 (Marion et al., 2009; Morse and He, 1993)) according to the references cited. Increasing TA by ∼ 1000 µmol kg−1 (measured ΔTA = 923 ± 12 µmol kg−1) raised the Ωaragonite from 1.81 ± 0.04 to 13.73 ± 0.09 and pHT was raised from 7.85 ± 0.01 to 8.91 ± 0.01 (error is standard deviation between replicate bottles). Yet in these incubations, we see no statistically significant increase in PIC either immediately after CaO addition or throughout the 4 d experiment (p>0.05, nonparametric ANOVA and linear analysis, Tables 5 and 6). We also see no statistically significant divergence between the Control bottles and CaO bottles in DOC or Chl a. However, the O2 and POC trends are statistically different than the Control after CaO addition (p<0.05 with linear analysis, Table 5). This is the only experiment where we see a statistically significant impact of CaO addition with a 95 % confidence interval. There is production of O2 = 70 ± 20 µmol kg−1 over 4 d in the Control, compared to no change in measured O2 in the CaO treatment. In the Control, the POC production increases by 180 ± 35 µgC L−1 (∼ 15 ± 3 µmol kg−1) compared to only a 70 ± 40 µgC L−1 (∼ 5.8 ± 3.6 µmol kg−1) increase in the treated waters. Further implications of these parameters are discussed in Sect. 4.2.2.
3.3.2 CaO addition: alkalinity enhancement ∼ 500 µmol kg−1 with higher ambient PIC (18 November 2024)
We conducted two CaO addition experiments to enhance alkalinity by ∼ 500 µmol kg−1, similar to the amount of enhanced alkalinity in the [Ca2+] + [] and NaOH treatments. In the 18 November 2024 experiment, PIC concentrations in the harbor water were ∼ 20 times higher than the ambient PIC (5 ± 5 µgC L−1) of the experiments described above (Figs. 3 and 5). We used this opportunity as an analog to study an alkalinity addition with greater suspended solids – i.e., greater nucleation sites for secondary precipitation. The CaO addition raised pHT from 7.75 ± 0.01 to 8.57 ± 0.01, and Ωaragonite from 1.47 ± 0.02 to 7.97 ± 0.23. We saw no increase in PIC formation in the treatment compared to the control. Instead, we observed a loss of PIC occurring over time in both the control and treated bottles. Chl a, DOC, and dissolved O2 show no statistically significant changes over time from the alkalinity addition; POC in the Control samples is higher than the treatment (Fig. 5), however, Day 0 variability negates any statistically significant impact.
3.3.3 CaO addition: alkalinity enhancement ∼ 500 µmol kg−1 (27 January 2025)
We replicated the previous experiment with the goal to capture a lower ambient PIC signal, but in this experiment the average starting PIC was 6–10 times the normal background (30–50 µgC L−1 compared to ∼ 5 µgC L−1). Upon CaO addition the system experienced a pHT increase of 0.95 units (pHfinal = 8.63 ± 0.01), and Ωaragonite increased from 1.23 ± 0.14 to 8.63 ± 0.16. While there were samples in which the values of PIC concentration in the treatment samples averaged higher than the Controls, the overall 4 d trends are not statistically significant. The Control averages 1 µg L−1 Chl a higher than the treatment and almost 100 µgC L−1 POC higher than the treatment by Day 4. Yet, due to high variability between bottles, the differences in POC and DOC between the controls and treatment are not statistically different when tested with nonparametric ANOVA or linear analysis. Of note, the differences in Chl a overtime are statistically significant when analyzed with a linear regression analysis and a more lenient threshold for significance (Table 5, p=0.08, α = 0.1) but are not significant with a nonparametric ANOVA.
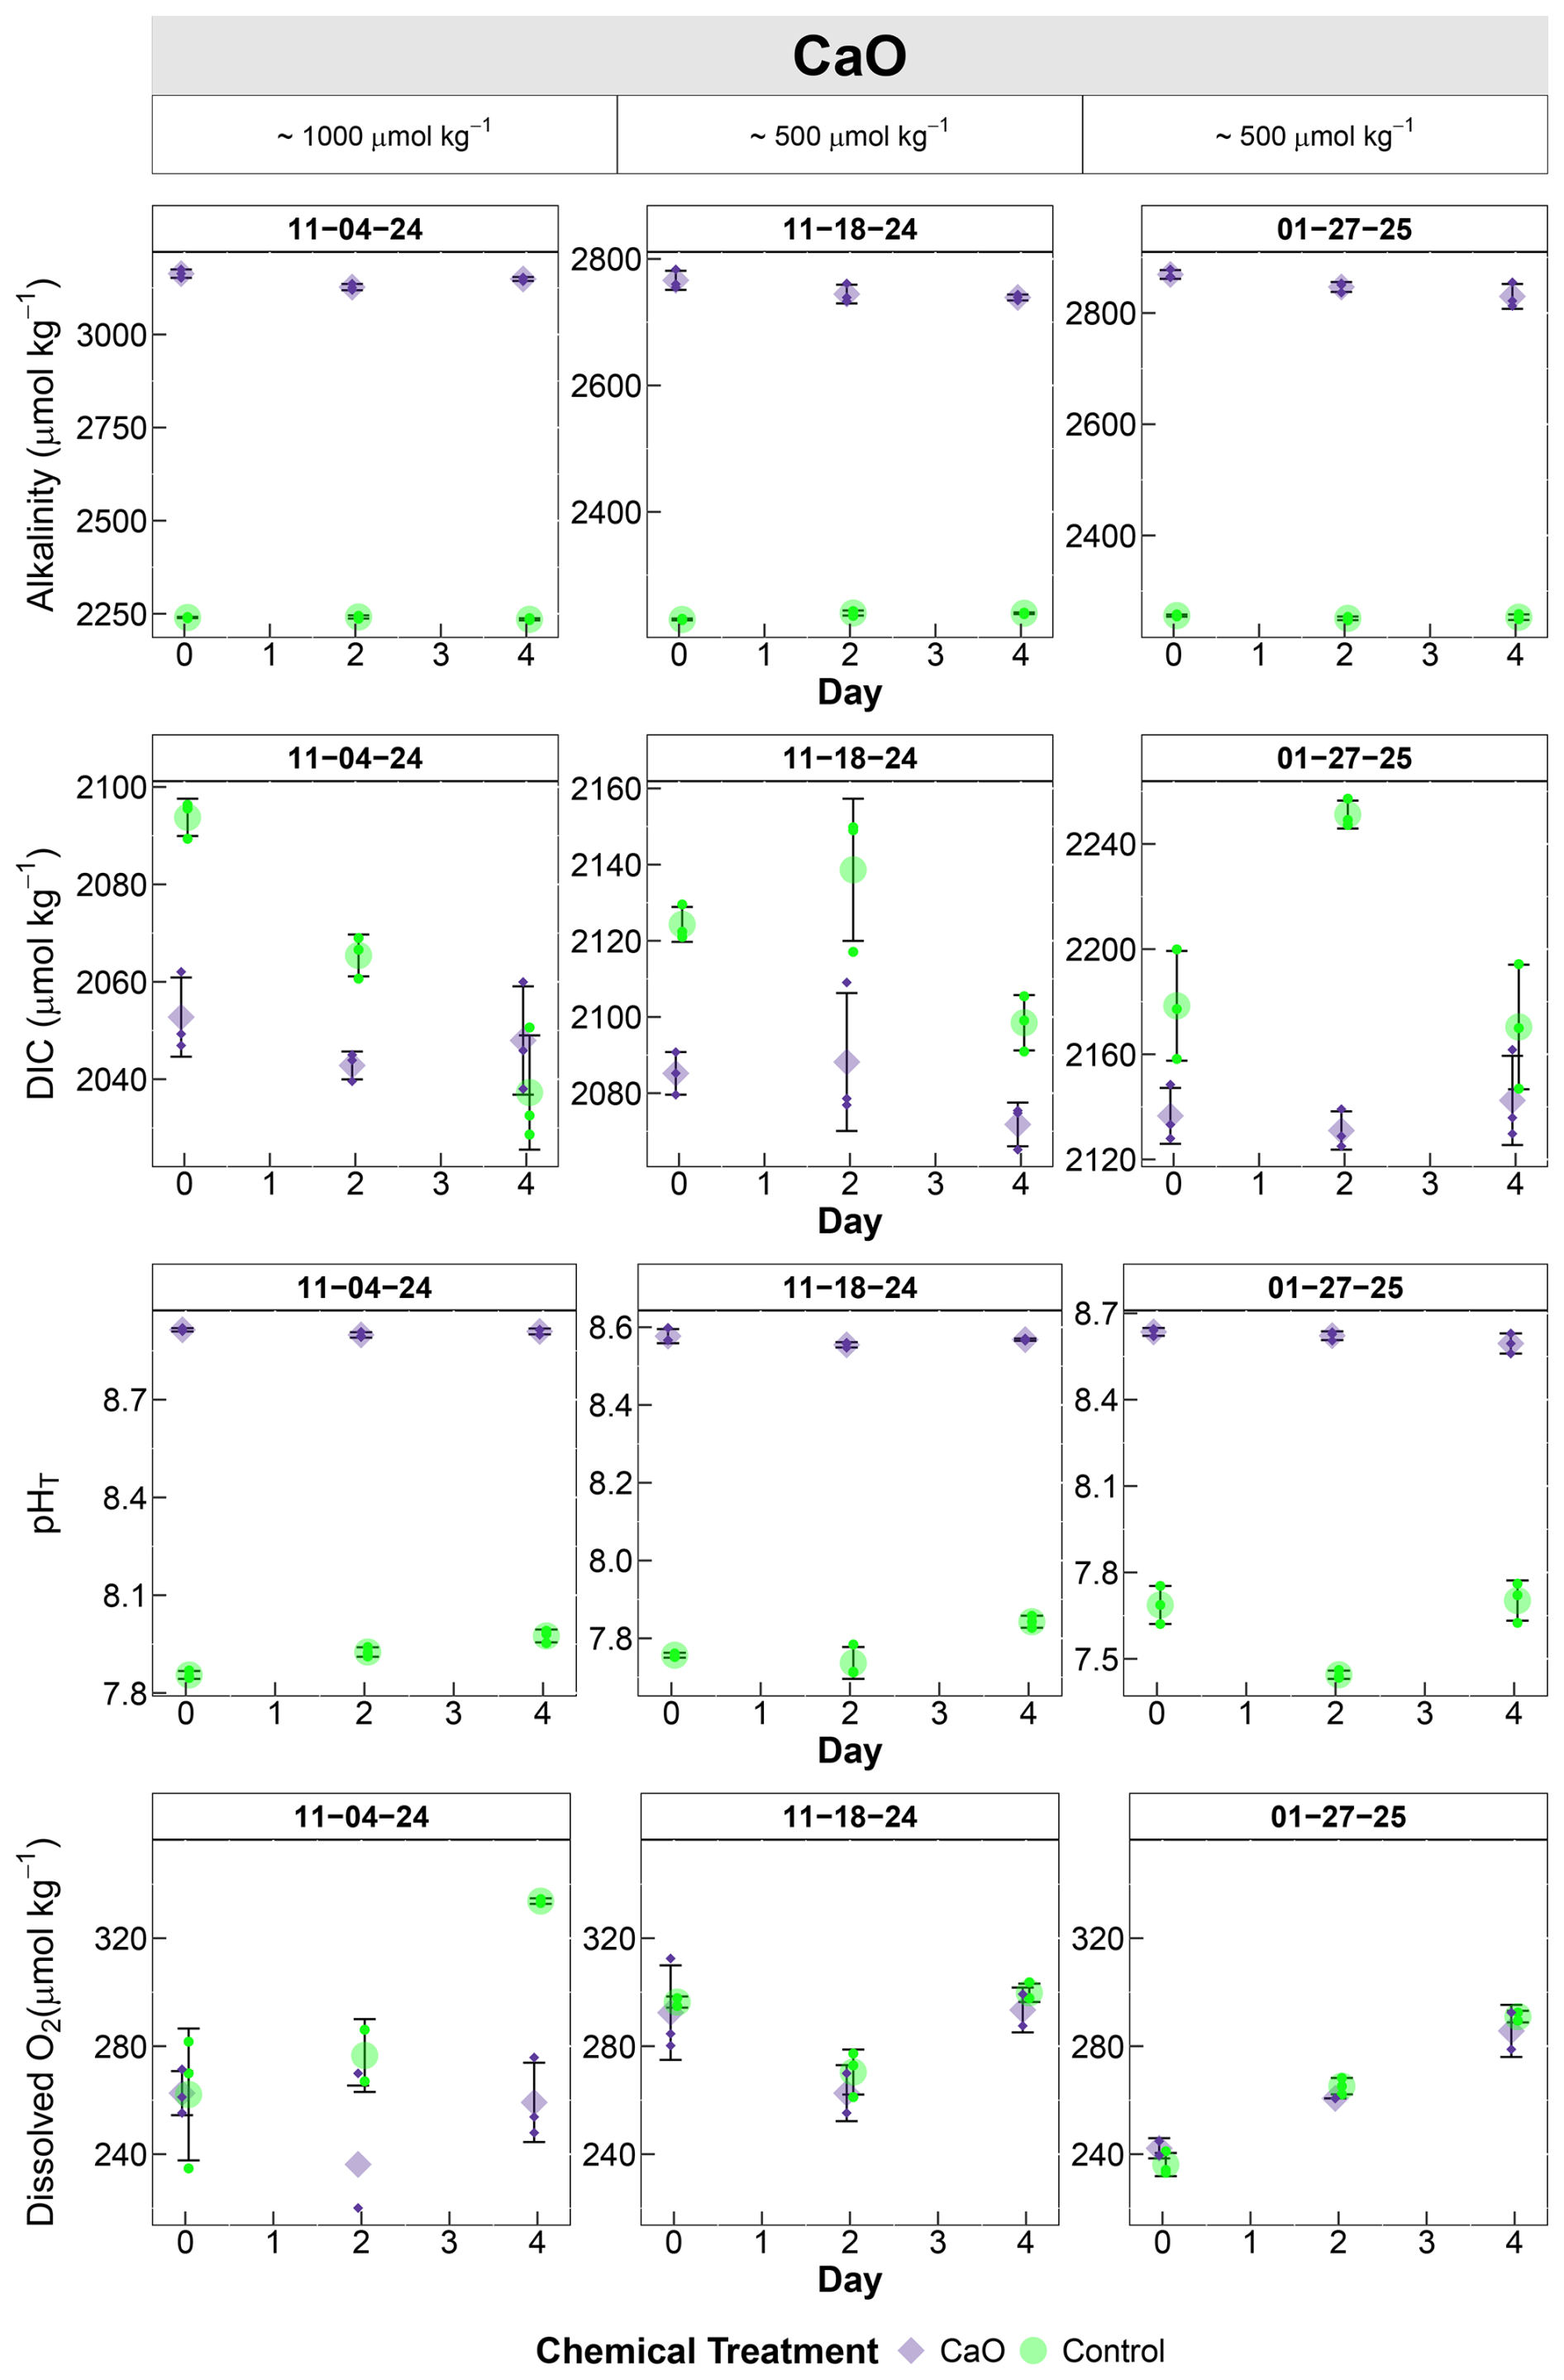
Figure 4Water chemistry from (CaO) amendment experiments. Panels are grouped by the alkalinity treatment they received: Controls (green) and CaO (purple). The start date of the experiment is listed for reference to differentiate between duplicate experiments. The four variables displayed here are measured Alkalinity (µmol kg−1), measured Dissolved Inorganic Carbon (DIC, µmol kg−1), pHT (Total Scale) calculated from CO2Sys.v3, and Dissolved Oxygen (O2, µmol kg−1). Each plot shows the average of the treatment per timepoint (n=3), and the error bars are the standard deviation between the triplicate bottles. Smaller symbols show individual bottles.
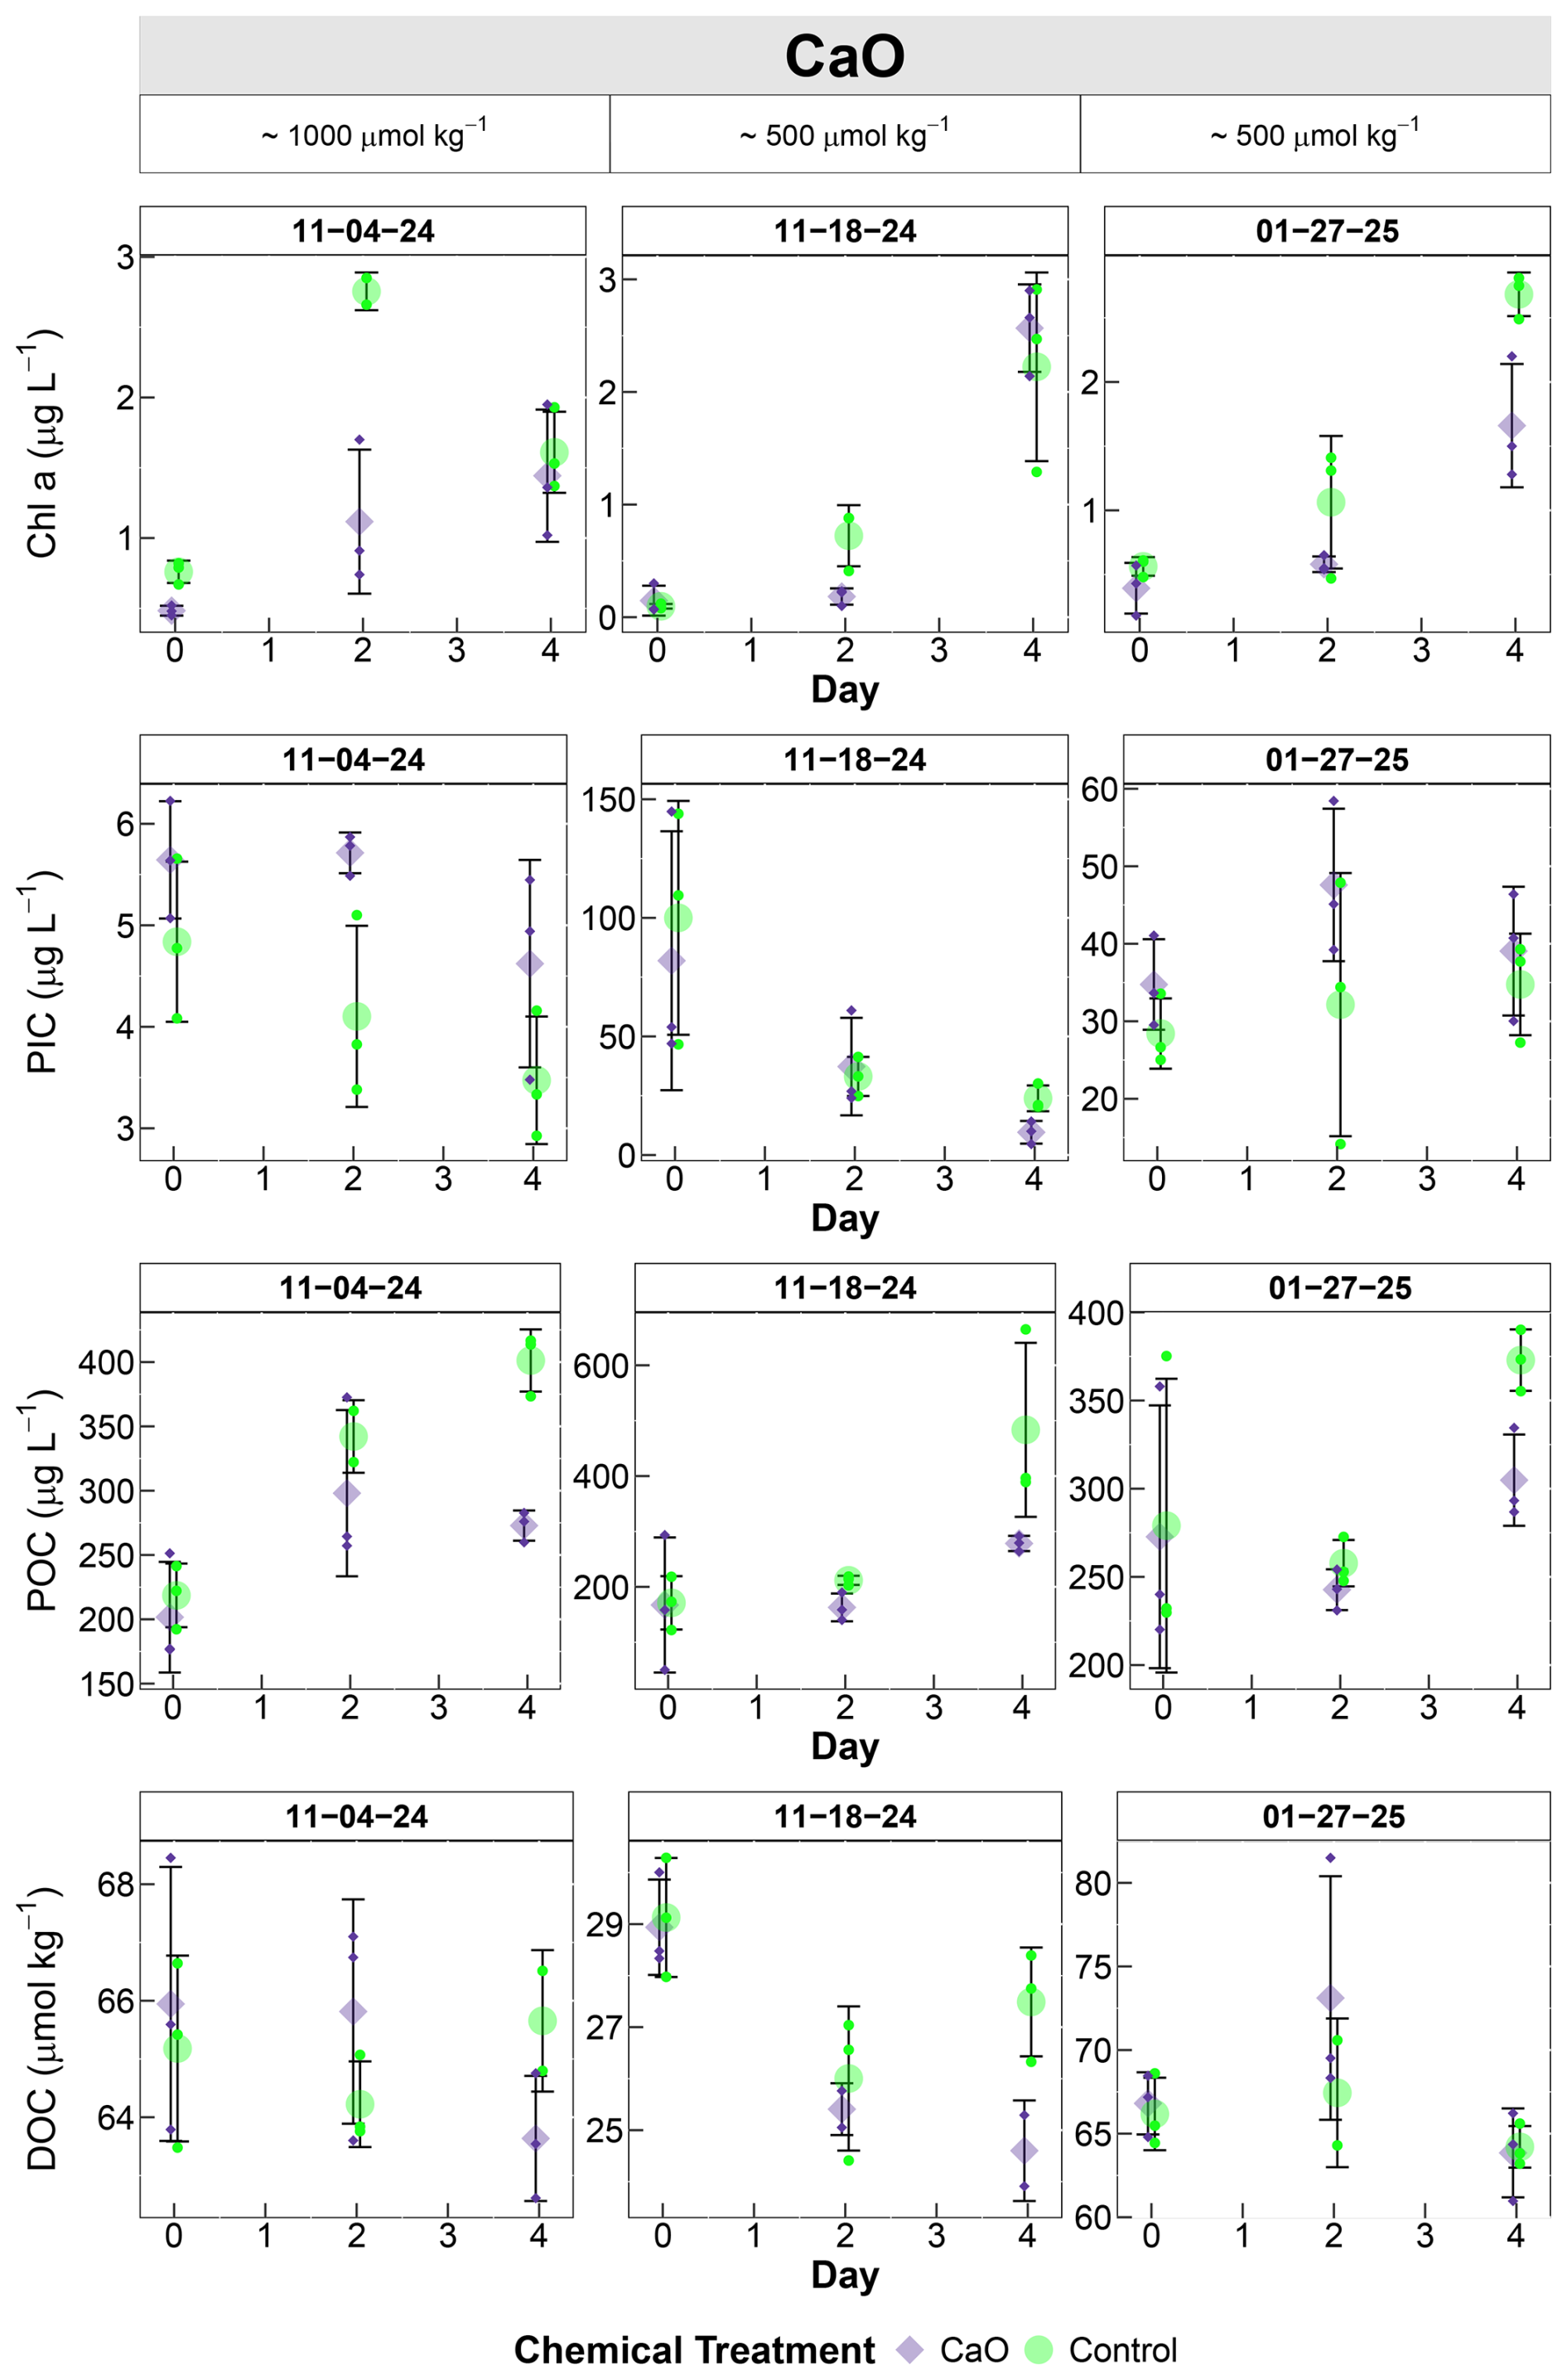
Figure 5Four day timeseries of biogeochemical response to different alkalinity enhancements. Smaller symbols show individual bottles, large symbol shows mean. Error bars are the standard deviation between replicates (n=3). The start date of the experiment and the amount of alkalinity added are included as headers for reference. The variables displayed are Chlorophyll a (Chl a, µg L−1), Particulate Inorganic Carbon (PIC, µg L−1), Particulate Organic Carbon (POC, µg L−1), and Dissolved Organic Carbon (DOC, µmol kg−1).
Table 5Summary of linear model analysis by experiment.
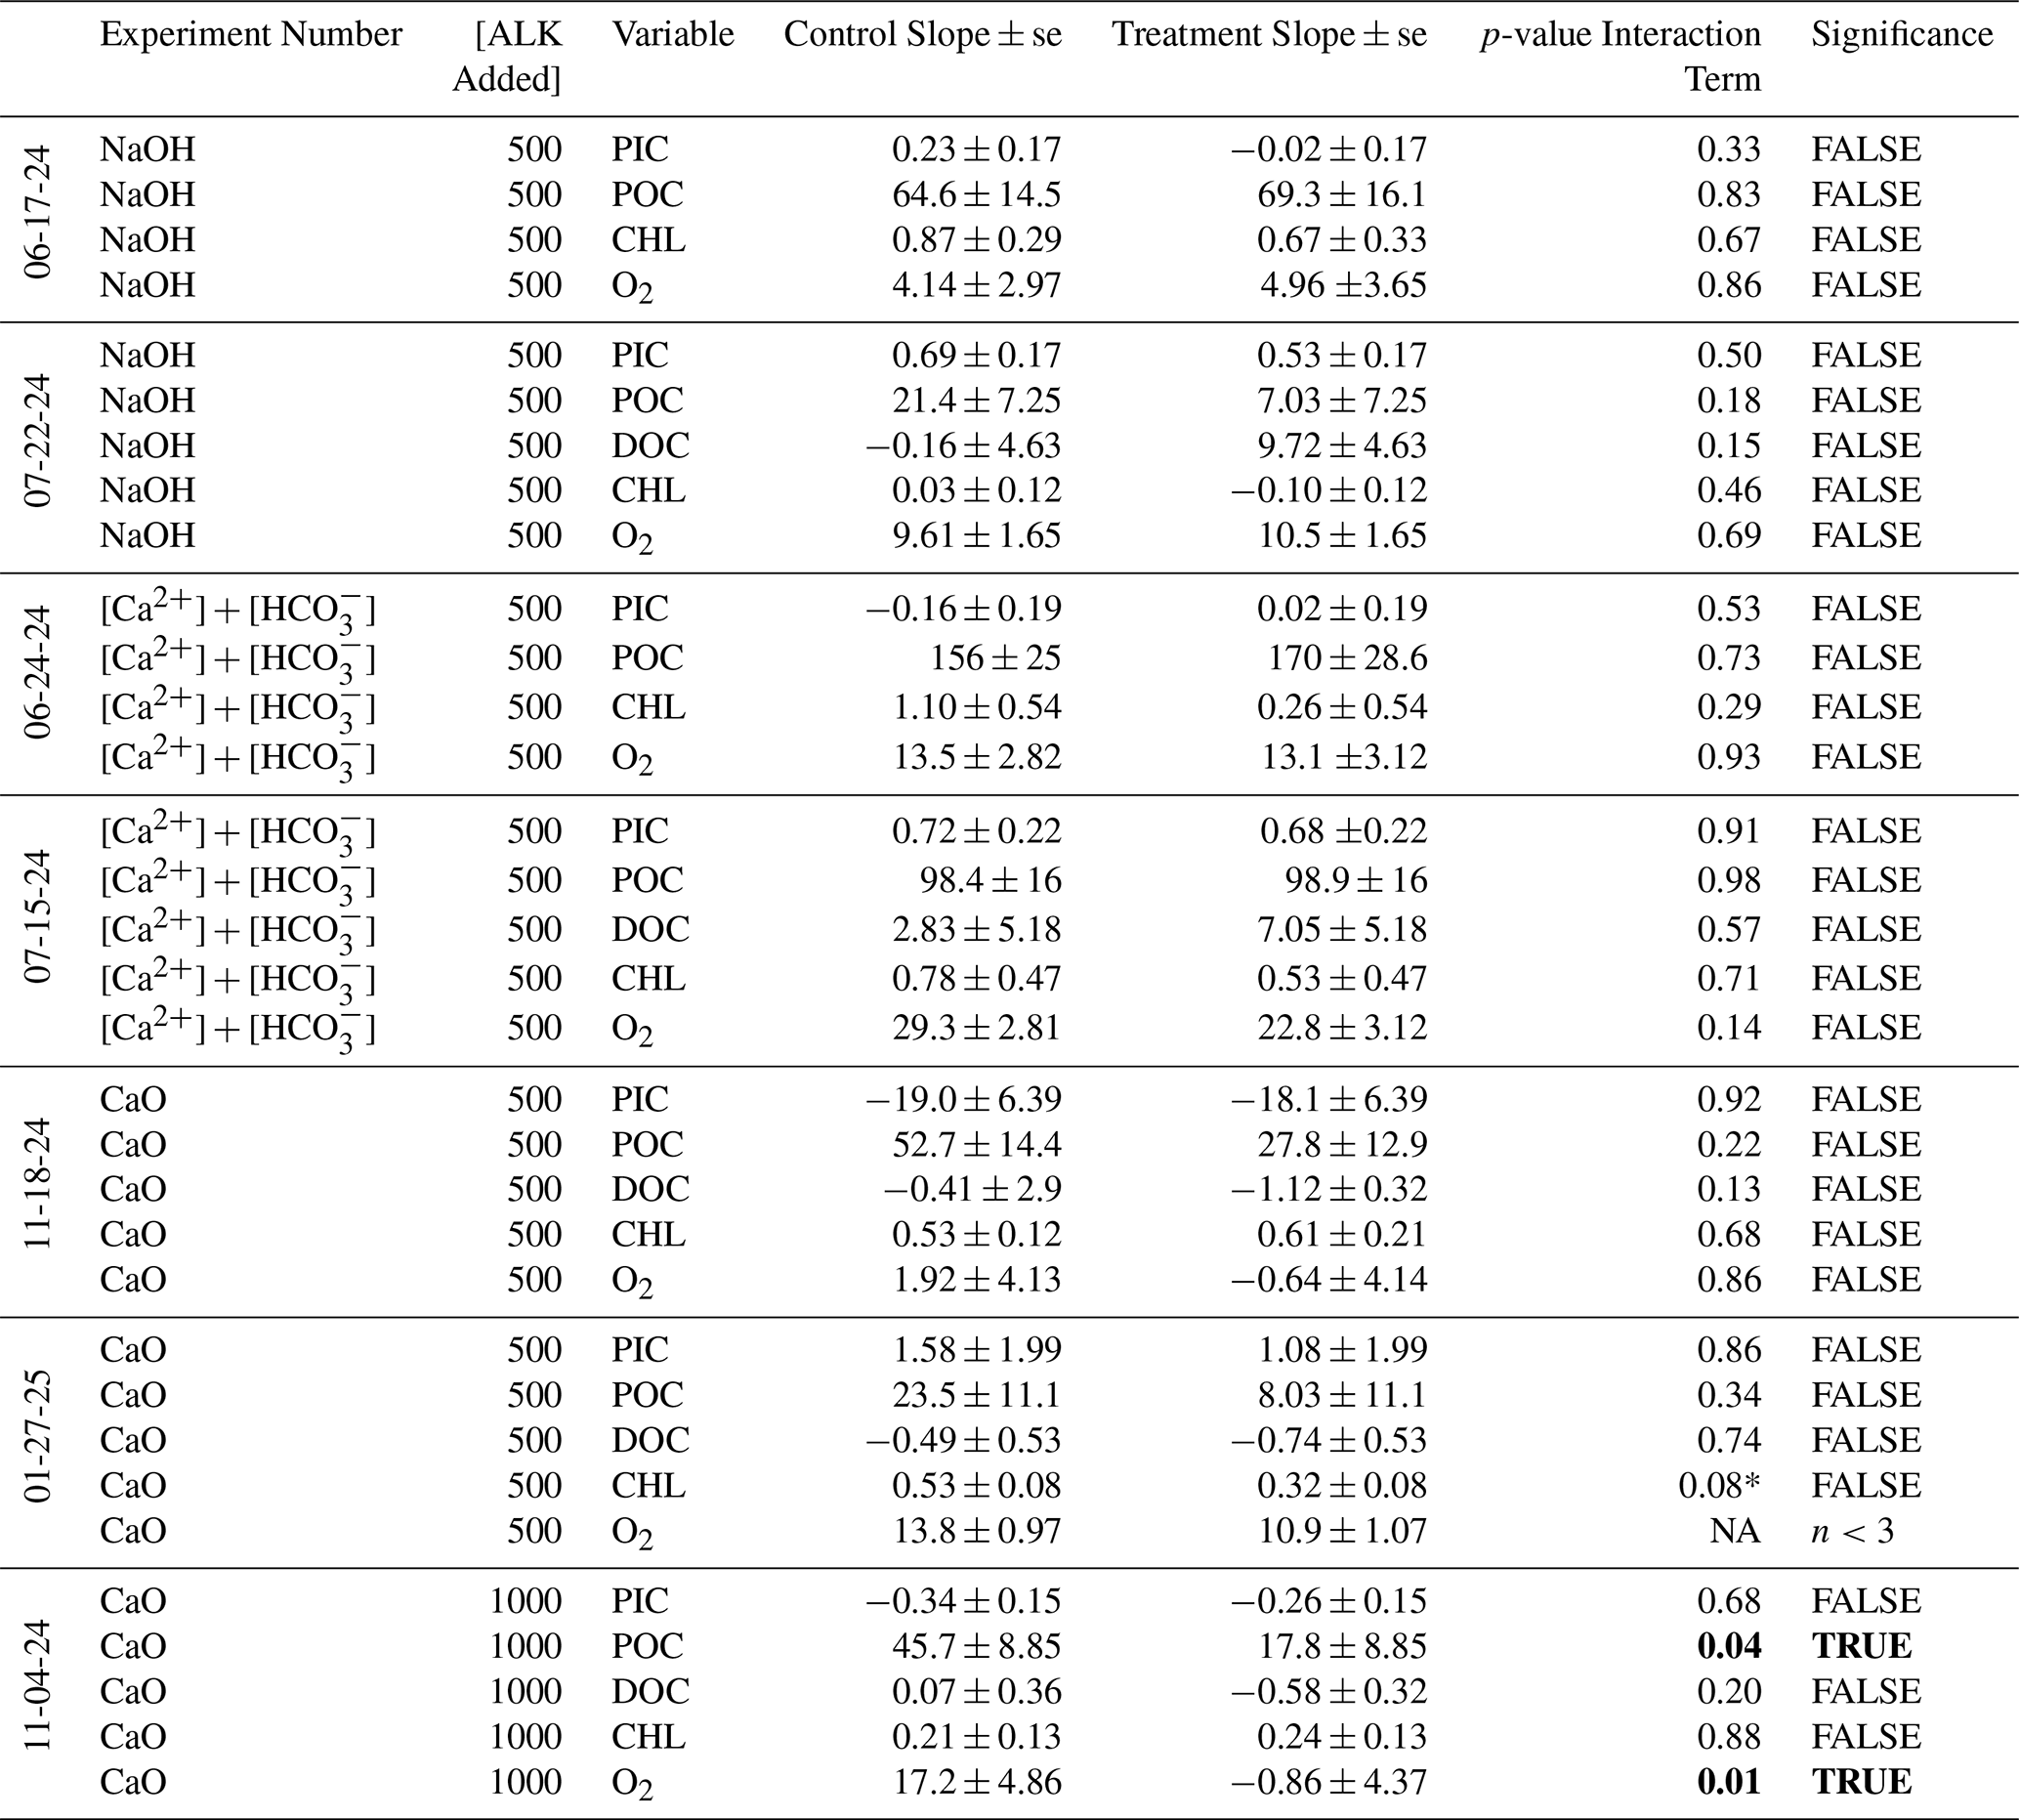
Table shows the slope ± the standard error around the slope of the Control and Treatment groups by the variable being analyzed. The p-value is shown, and the test result indicating statistical significance is shown when p<0.05. The * marks a relaxed significance threshold (α = 0.1). TRUE OR FALSE indicates whether the interaction is statistically significant or not. Bold for emphasis. NA written where there are less than three data points per time point for control and treatment.
Table 6Summary of two-way non-parametric Analysis of Variance (ANOVA) by experiment.
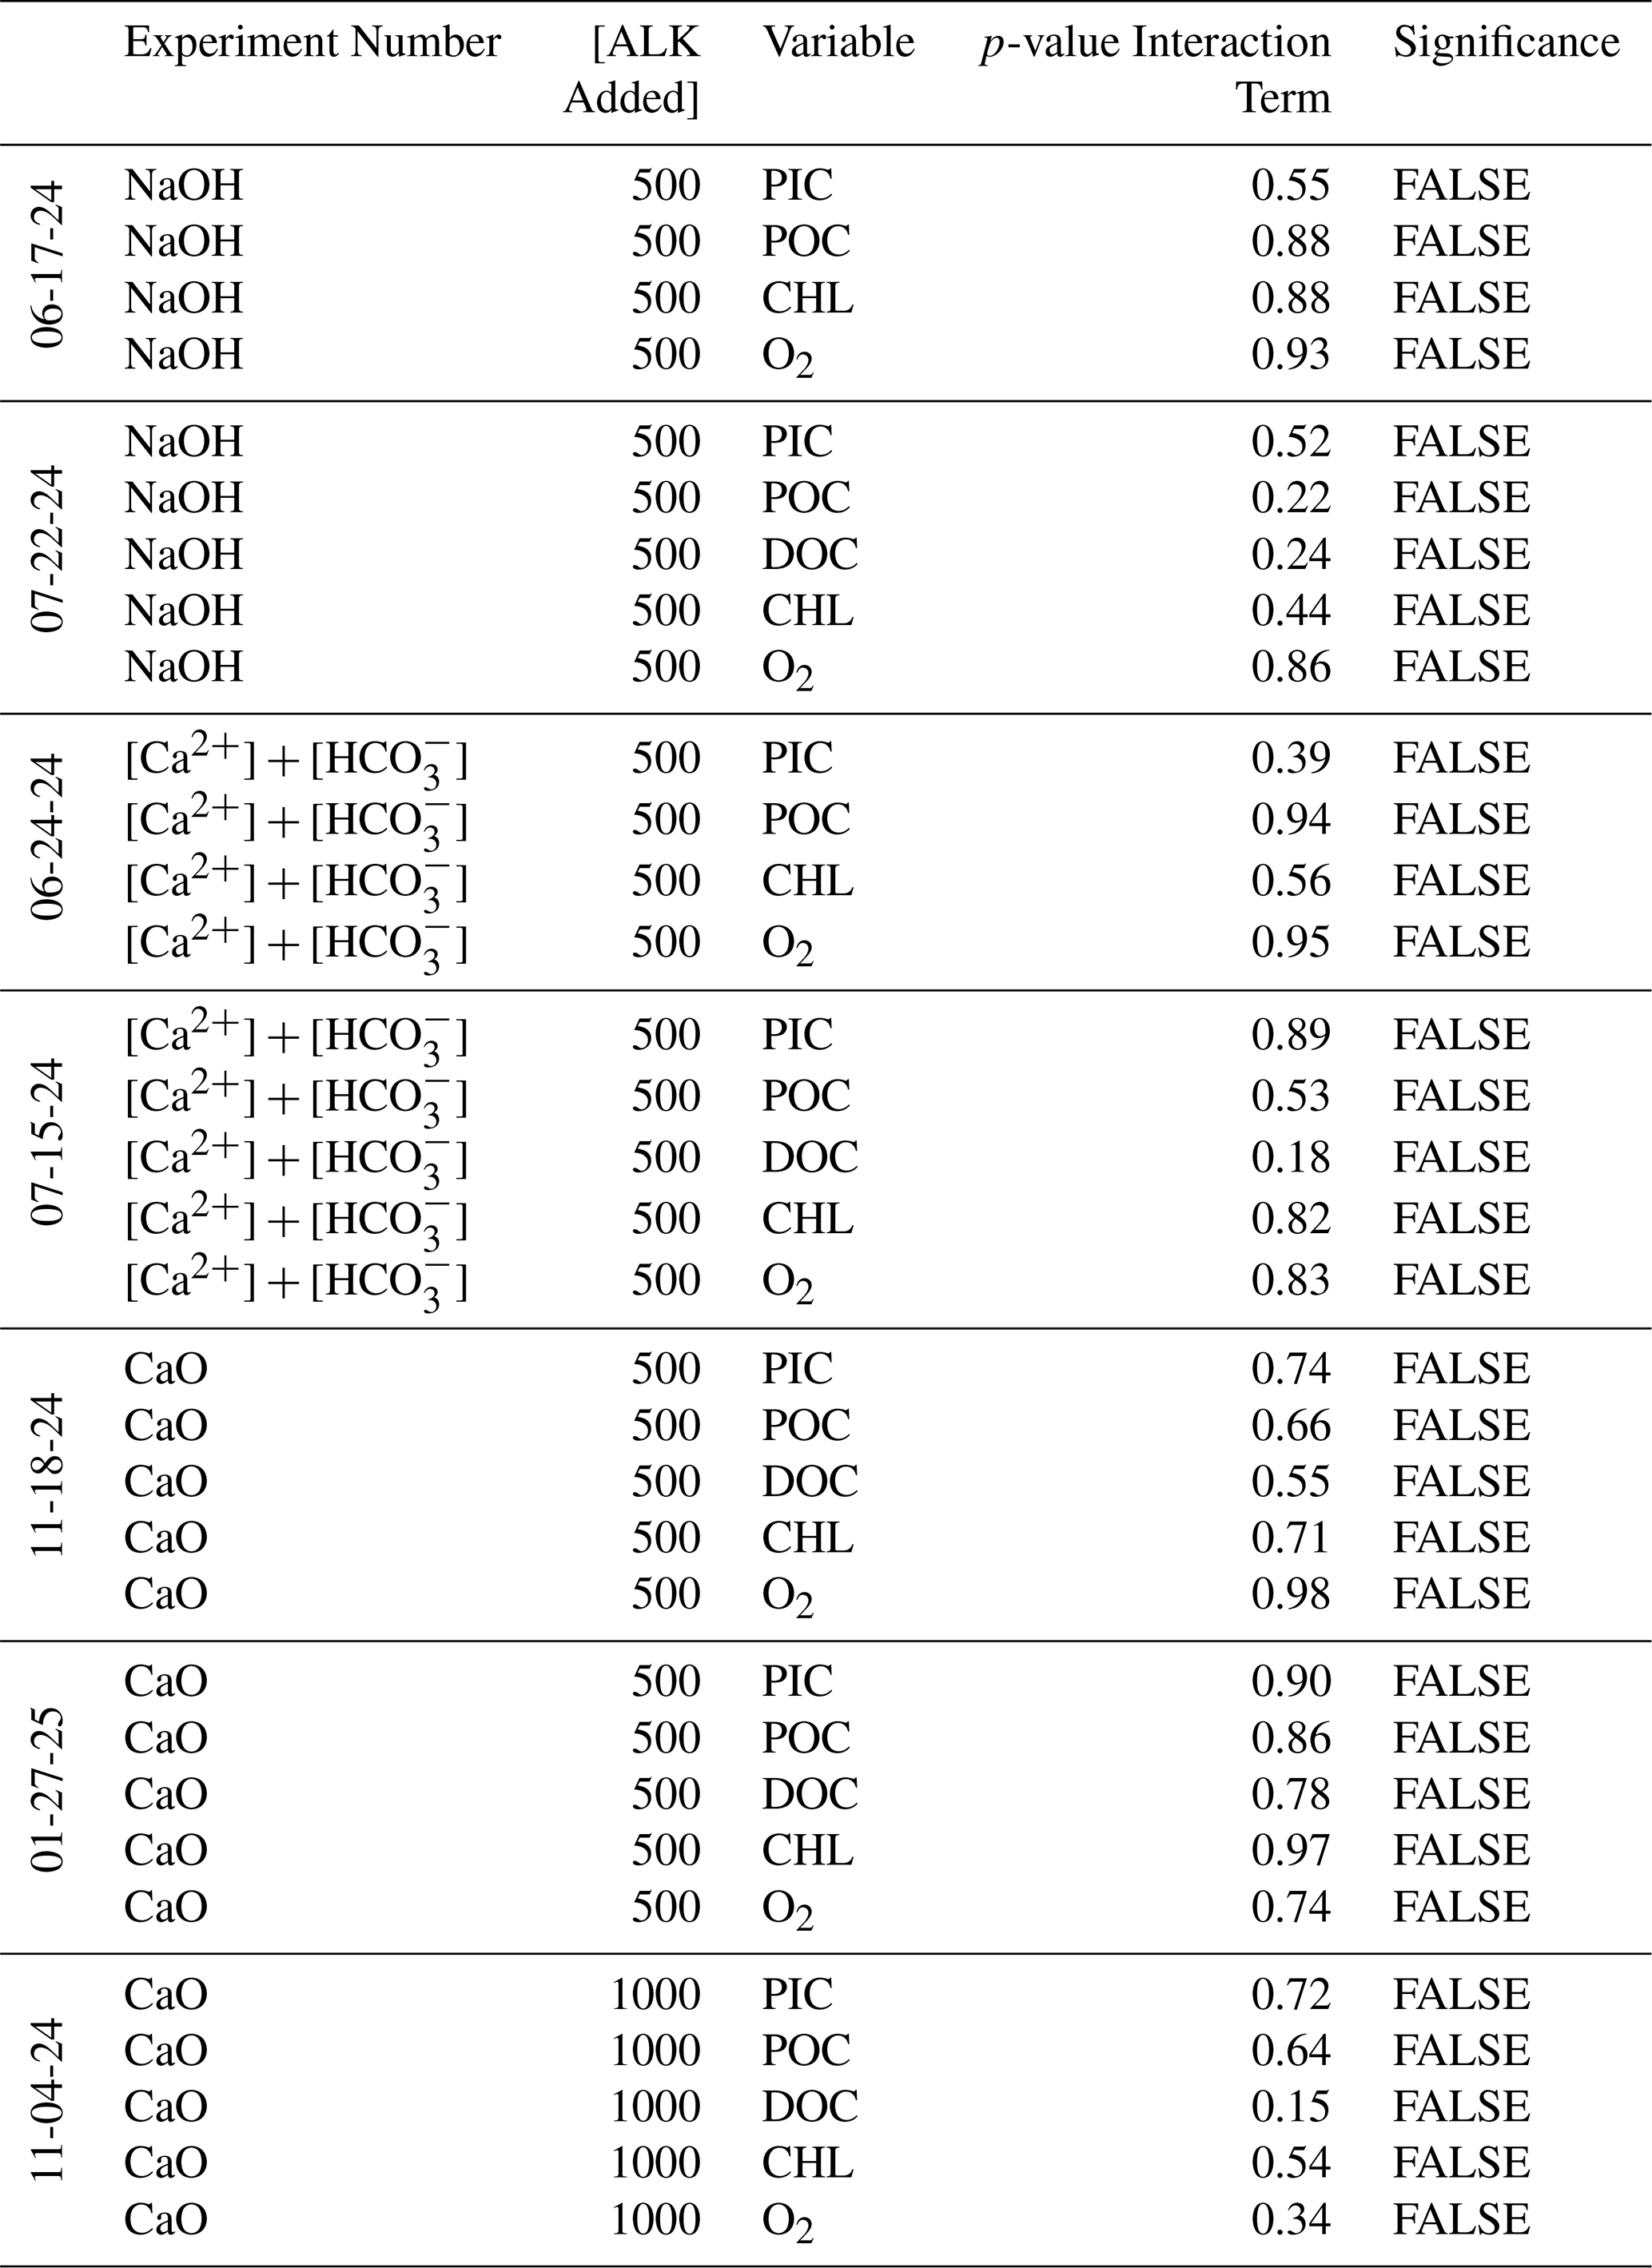
The Scheirer Ray Hare test is used for this analysis. The interaction between treatment (Control vs. Treatment) condition and time on PIC, POC, Chl a, DOC, and dissolved O2 is summarized by the p-value. TRUE indicates whether the interaction is statistically significant with an (α = 0.05), FALSE shows an insignificant impact on the measured “Variable” column.
3.4 Carbon budgets
3.4.1 Carbon isotopes to verify estimates of respiration
Organic carbon is subject to net increases due to production and decreases attributed to respiration. We added a 13C isotope spike to controls and treatment bottles to assess if an alkalinity addition would change organic matter remineralization; the remineralized organic matter would add unspiked DIC into a spiked DIC pool. The isotope addition increased DIC by <5 µmol kg−1, the starting isotopic δ13DIC varied by bottle. Hence to compare across various days and treatments, we divided the measured δ13DIC value from each bottle by the average δ13DIC on Day 0 Control or Treatment value. An increase in organic matter remineralization would make the pool of δ13DIC lighter. The effect of treatment on δ13DIC was tested with a two-factor ANOVA where the variables “Experiment Day” and “Treatment” were taken as factors. The interaction of these factors results in a p>0.05 for all experiments. Hence, there were no consistent and sustained changes in the δ13DIC pool of the treatment bottles when compared to the control bottles (Fig. 6). There was also no decrease in the δ13DIC values due to invasion of CO2 even in the base addition experiments, because there was no headspace in the bottles, i.e. this isotope tracer demonstrated that a closed system was maintained.
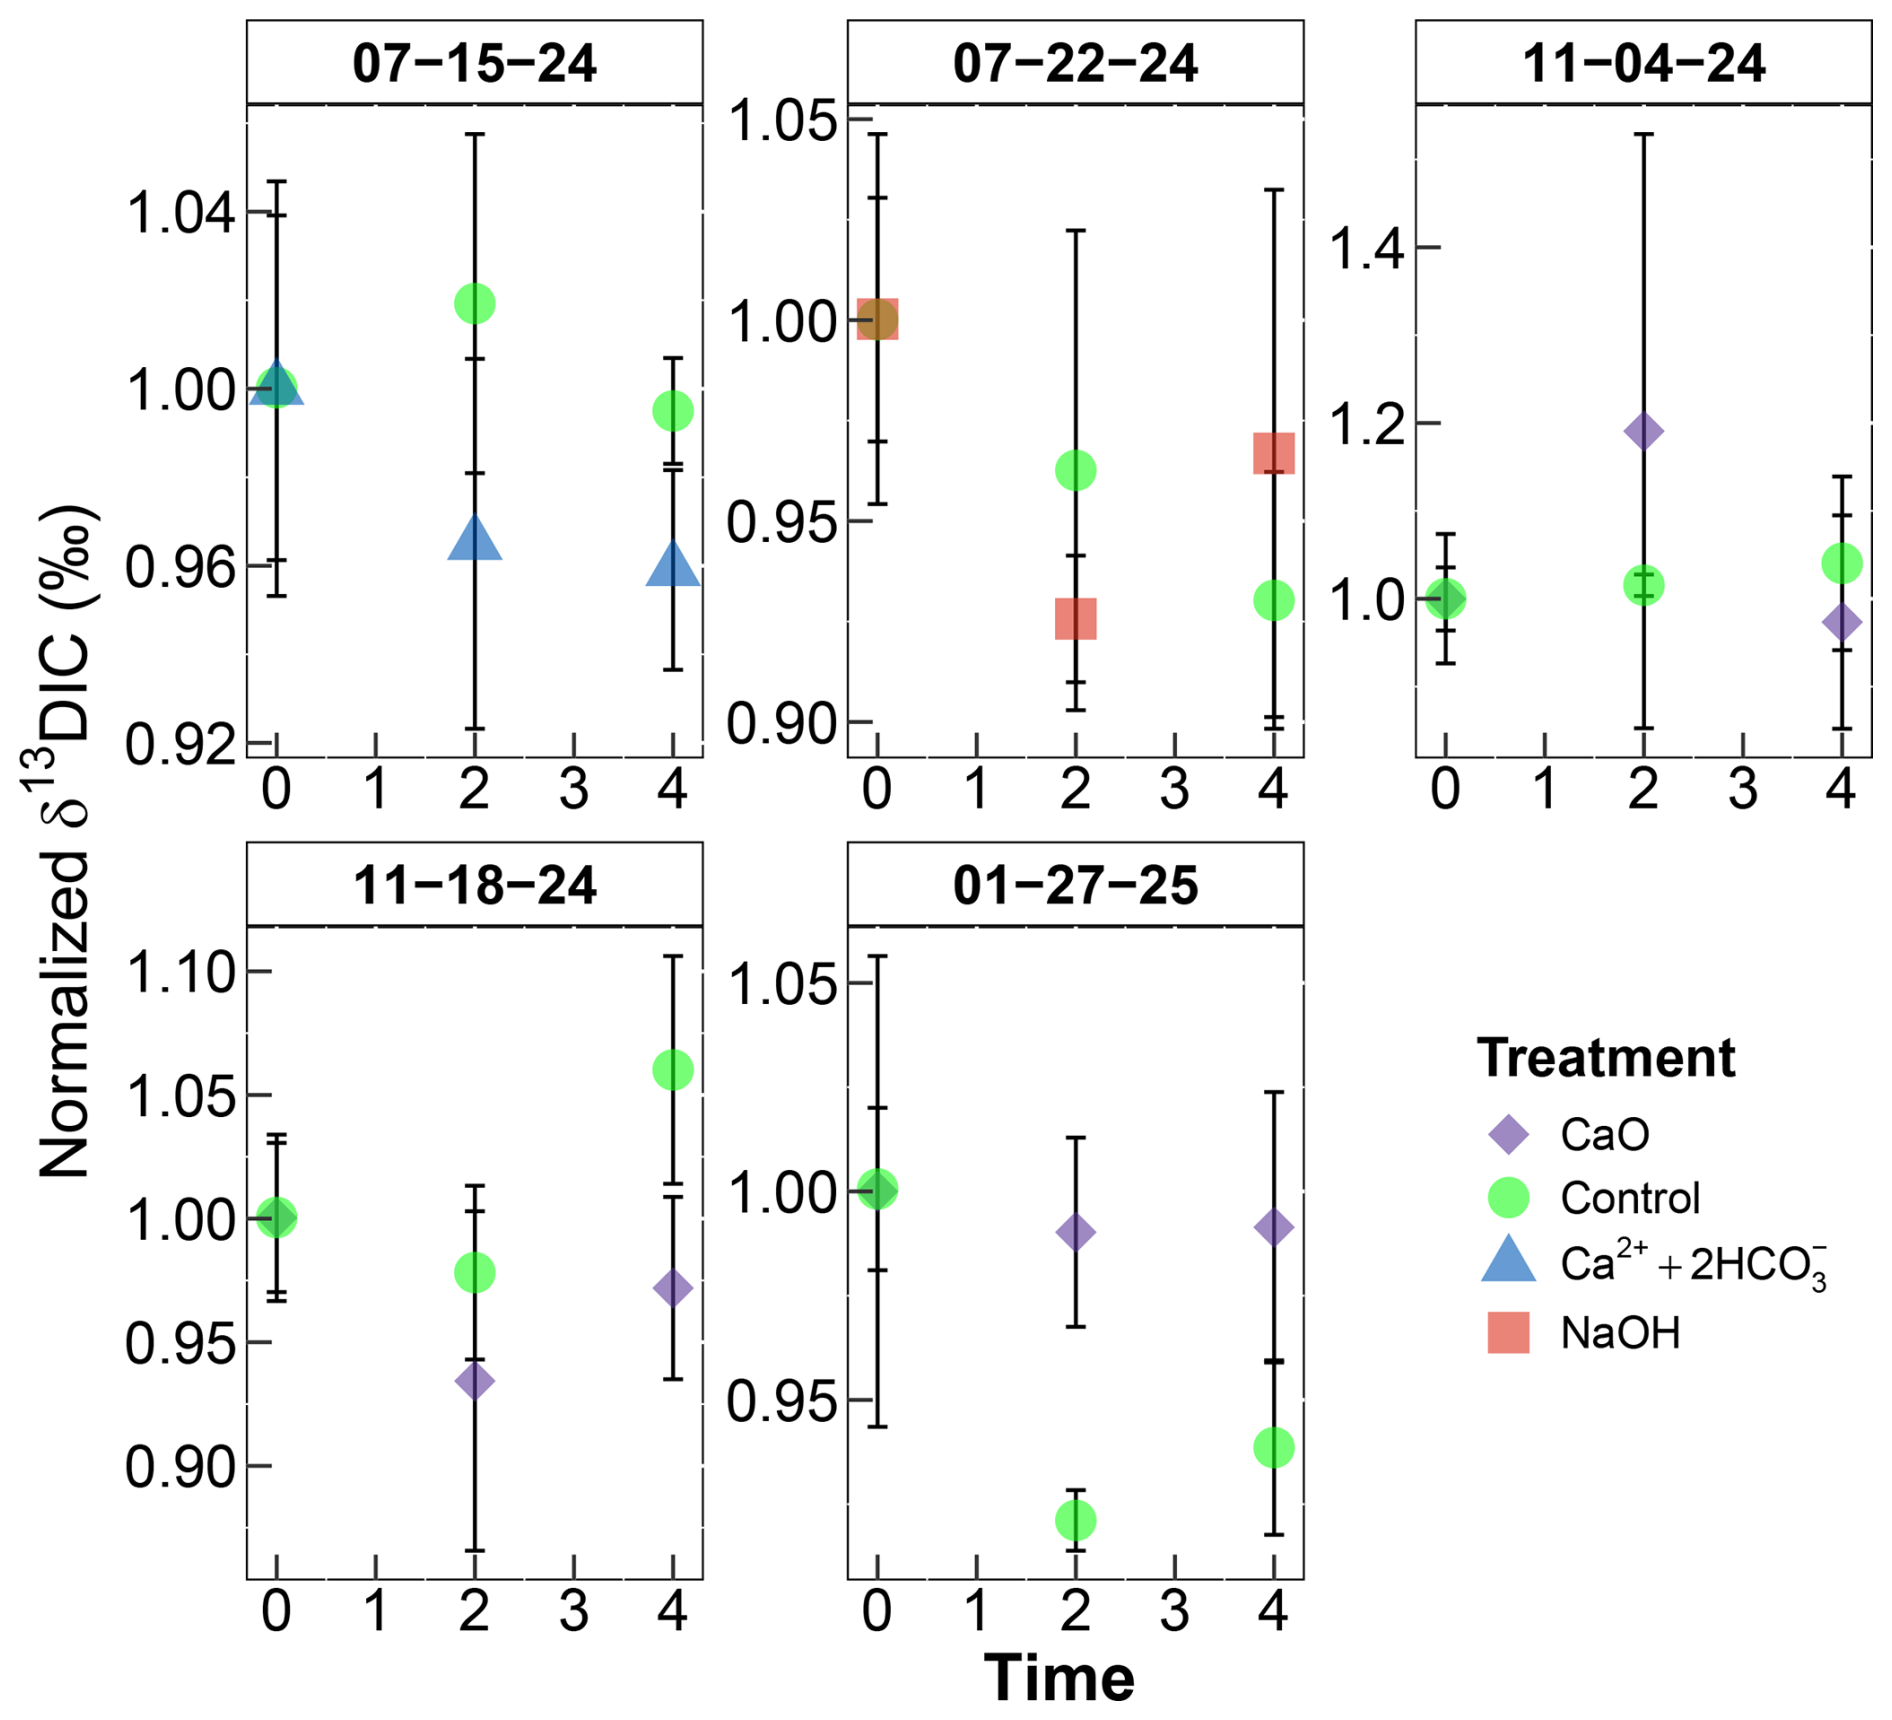
Figure 6Normalized seawater (DIC) δ13C ‰ over time in all experiments. Panel (15 July 2024) +500 µmol kg−1 CaCl2 + NaHCO3, (22 July 2024) +500 µmol kg−1 NaOH, (4 November 2024) +1000 µmol kg−1 CaO, (18 November 2024) +500 µmol kg−1 CaO with higher ambient PIC, and (27 January 2025) +500 µmol kg−1 CaO. Each data point has an n=3, and error bars are the standard deviation of the averaged values. Data was “normalized” by dividing each measured value with the initial starting δ13C value of the DIC on Day 0.
3.4.2 Carbon partitioning
The purpose of conducting closed system experiments was to better understand and constrain the partitioning of carbon between various pools after increasing the amount of alkalinity. Here we present the distribution of carbon in various pools (DIC, DOC, PIC, POC) and track the movement of carbon over the span of four days (Fig. 7). These distributions are generated from the mean measured values of triplicate bottles at each time point. In our experiments, ∼ 95 % of the carbon exists as DIC, ∼ 3.5 % is stored as DOC, ∼ 1.2 % is found in the POC pool, and <0.1 % in the PIC pool. The non-DIC pool is highly variable across the “Day 0” starting conditions of all experiments (summarized in Table 4). In many experiments, the addition of alkalinity does not change carbon distribution relative to the controls (Fig. 7). The decrease in %DIC (Panel a and b, Fig. 7) is matched by an increase of either %POC or %DOC, which is expected from photosynthesis and organic matter cycling.
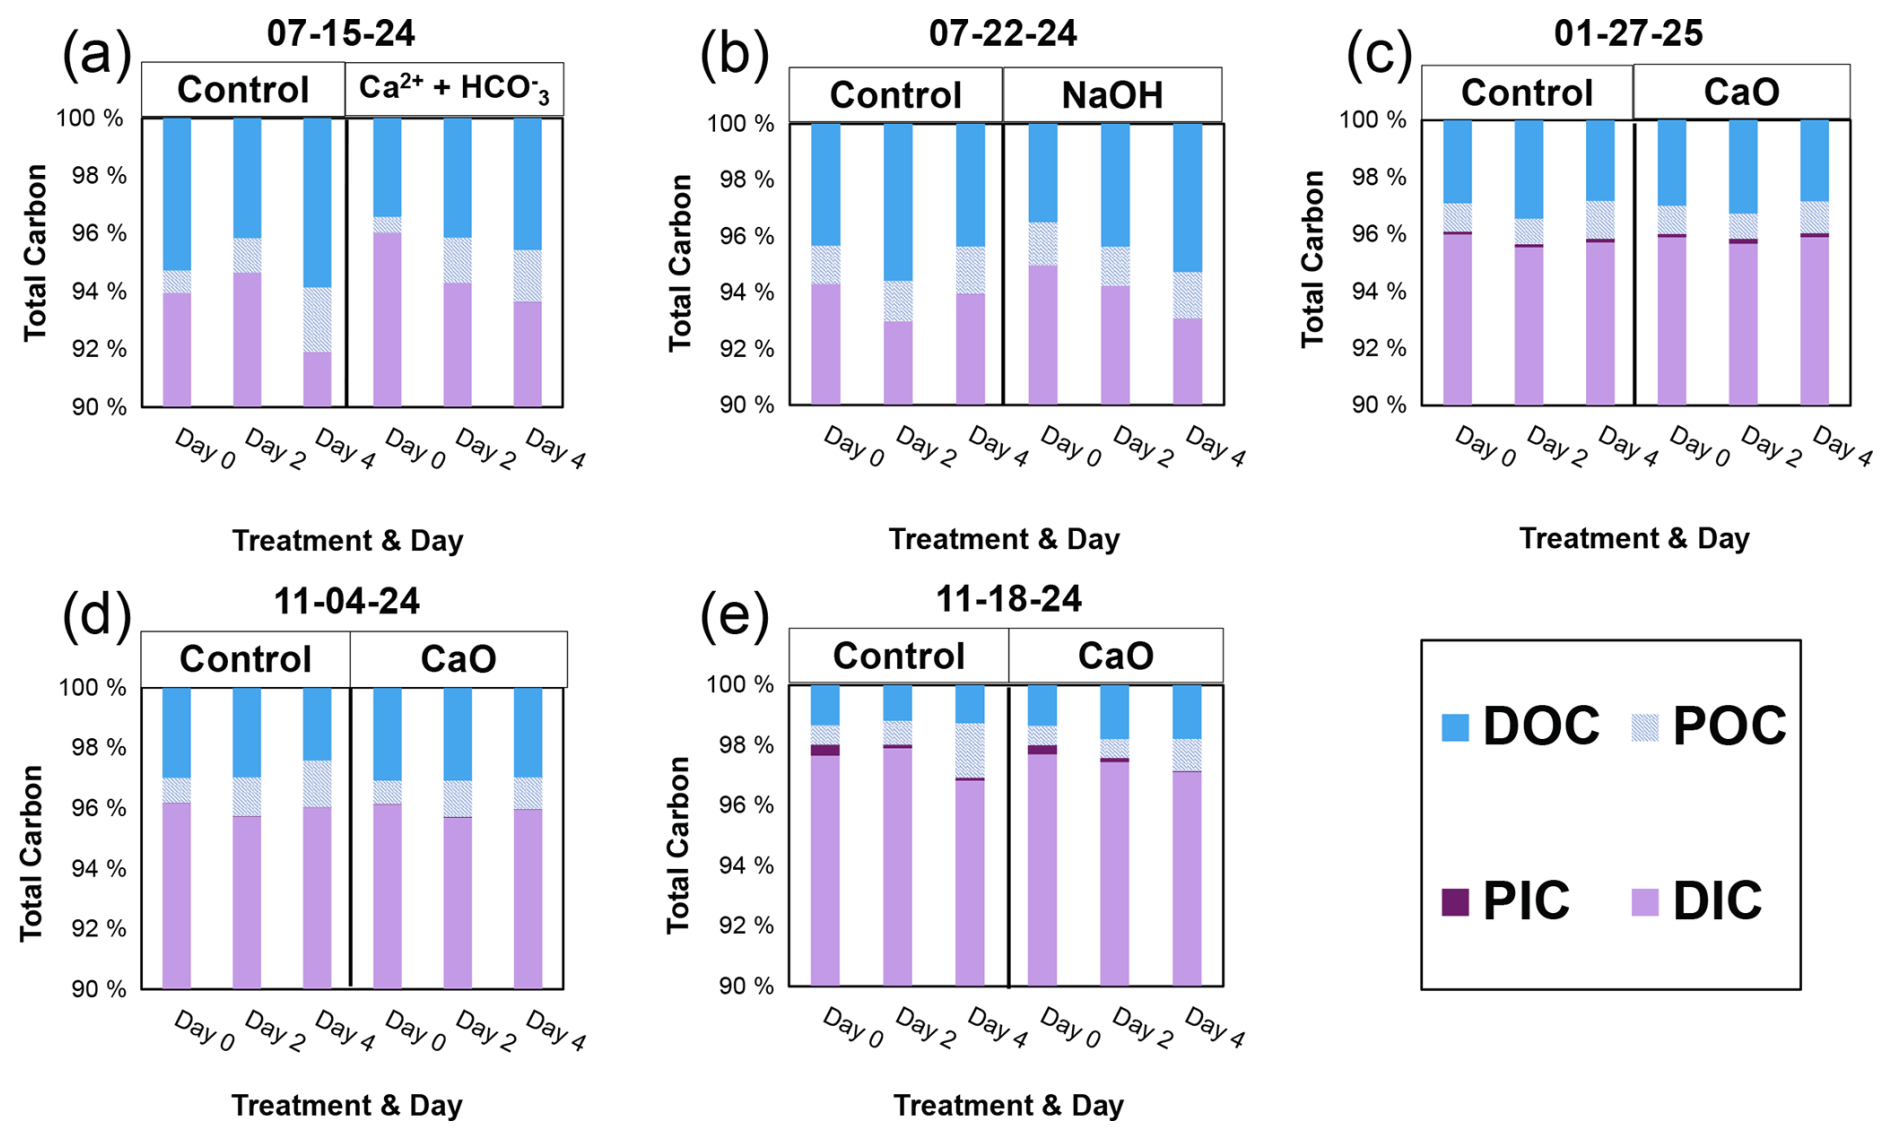
Figure 7Total carbon budget for all experiments. Panel (a) +500 µmol kg−1 CaCl2 + NaHCO3, (b) +500 µmol kg−1 NaOH, (c) +500 µmol kg−1 CaO, (d) + 1000 µmol kg−1 CaO, and (e) +500 µmol kg−1 CaO with higher (ambient) particles of inorganic carbon. Bar plots are an average of 3 bottles per timepoint. Plots show changes in distribution of carbon over the duration of the experiment between treatments and controls. The total amount of C will always = 100 %.
We can use a mass-balance approach to check if the carbon pools change over time. For example, one assumption may be that decline in DIC is compensated by increase in POC. In this case, one would expect a 1:1 relationship between ΔDIC and ΔPOC (Fig. 8a). However, the [Ca2+] + treatments fall furthest from this line, which means these experiments show a deficit of POC production relative to DIC drawdown.
To account for DIC lost through other processes, we considered the formation of CaCO3 as a DIC sink, assuming 1 mole of PIC growth is equivalent to 1 mole of DIC consumed. Our data indicate that the DIC lost to the precipitation of CaCO3 is <1 µmol kg−1 over the span of 4 d; this is a trivial amount. We also considered CO2 loss from the permeability of the PETG bottles. Assuming that CO2 permeability for PETG is 125 cc-mil inch−2 d−1, wall thickness = 0.76 mm, surface area ∼ 300 inch2 and the ΔpCO2 gradient between water inside the bottle vs. outside in the ocean = 300 µatm, the maximum amount of CO2 that could diffuse out of the bottle would be 3 µmol kg−1 d−1. Therefore, only ∼ 13 µmol kg−1 DIC could potentially be lost to CaCO3 precipitation or diffusion through the bottles' walls, and the 50–100 µmol kg−1 decrease in DIC in Fig. 8a must result from production of POC and DOC.
As an additional test of carbon partitioning, we can check to see whether these experiments fall within Redfield stoichiometries by comparing the total drawdown of DIC with the change in dissolved oxygen (Fig. 8b). A range of DIC:O2 ratios are considered. The [Ca2+] + experiments and one of their controls fall furthest from the range of Redfield ratios. The same [Ca2+] + experiments that show a deficit in POC also show a deficit in dissolved oxygen which would be expected if DIC consumption were producing DOC if the POC was being remineralized.
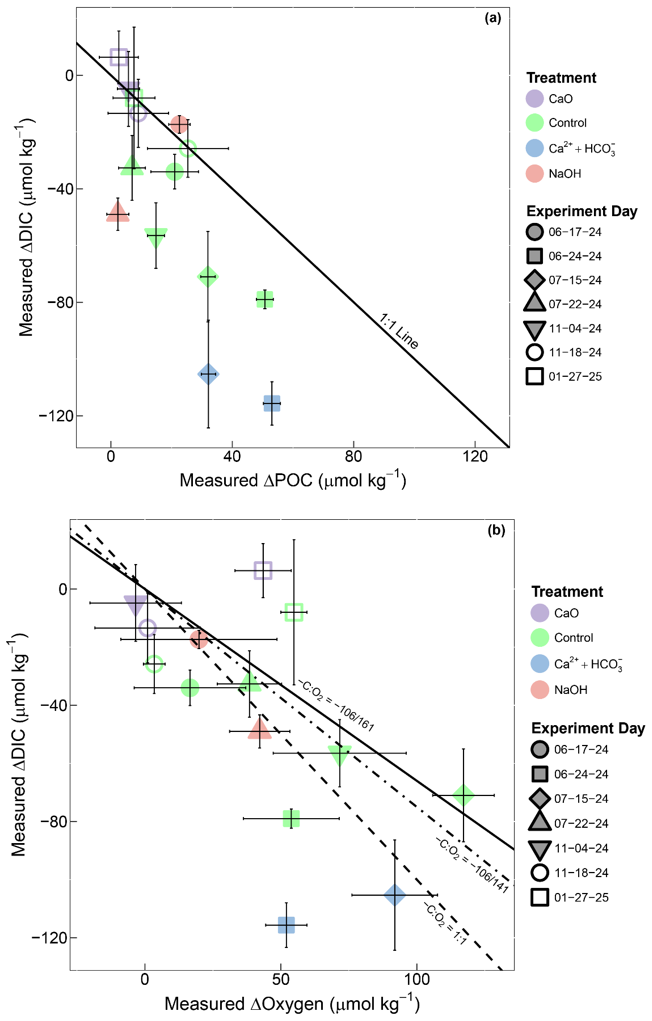
Figure 8Comparison of stoichiometric changes in DIC, Dissolved O2, and POC in terms of the Redfield ratio. (a) Cross plot of measured decrease of DIC versus the measured increase of POC; solid line is the 1:1 line. Points that fall below the 1:1 line are thought to have increased DOC. (b) Cross plot of measured decrease of DIC versus measured production of dissolved oxygen. Plotted lines show the slopes of various Redfield Ratios: solid line ( = ), dot-dash line ( = ), and dashed line ( = i.e. a 1:1 ratio) (Anderson, 1995). All points in (a) and (b) have a n=3, and the delta is calculated as the difference between the average of Day 0 and Day 4 bottle values. Error bars are propagated standard deviations of averaged values used to generate the delta values.
If alkalinity is added to the ocean, we would need to know the effects of different minerals/alkalinity sources – i.e., to test if one produces more rapid changes to the ocean ecosystem than another. Thus, we conducted standardized experiments with different feedstocks that raised alkalinity by similar thresholds (∼ 500 and ∼ 1000 µmol kg−1). OAE functions on the principle of raising pH which will promote uptake of atmospheric CO2. One of the simulations we tested was the addition of [Ca2+] + [] which represents the products of accelerated weathering of limestone (Dong et al., 2025) yet does not drastically raise pH like NaOH or CaO addition. CaO addition increases both pH and the [Ca2+], hence the resultant change in Ωaragonite is slightly higher than the change in Ωaragonite after NaOH addition. Here we discuss how these different regimes influenced abiotic effects such as precipitation of minerals and biotic effects such as organic matter cycling.
4.1 The absence of secondary CaCO3 precipitation
The likelihood of observing mineral precipitation after OAE is controlled by several factors including supersaturation of the seawater with respect to a particular mineral, nucleation sites, temperature, time, and even interference from catalytic or inhibitor ions (Berner, 1975; Marion et al., 2009; Moras et al., 2024; Morse et al., 2007; Morse and He, 1993; Mucci and Morse, 1983; Naviaux et al., 2019; Nguyen Dang et al., 2017; Suitner et al., 2026). Here we summarize similar studies that used NaOH, NaHCO3, and CaO to find the minimum thresholds for precipitation of CaCO3 after OAE (detailed experimental conditions are included in Tables B1 and B2 in Appendix B).
Several other studies that conducted similar manipulations of alkalinity additions to natural seawater (initial Ωaragonite=1–3) have reported no observed precipitation of CaCO3 (Hartmann et al., 2023; Moras et al., 2022; Ringham et al., 2024; Suitner et al., 2024). Of these, experiments conducted with NaHCO3 + Na2CO3or NaOHhave shown stable seawater alkalinity up to Ωaragonite≈15–19 for at least four days and longer (∼ 20 d) in closed systems (Hartmann et al., 2023; Moras et al., 2022; Suitner et al., 2024). In an open system that was allowed to equilibrate with atmospheric CO2, no precipitation was observed after NaOH addition up to Ωaragonite≈27 for at least 20 d (Ringham et al., 2024). At present, we are the only study to use CaO in an aqueous form. The one study that does not see CaCO3 precipitation but uses solid CaO and Ca(OH)2 feedstocks to add alkalinity, only raised alkalinity by 250 µmol kg−1 (raising Ωaragonite from 2 to 5), after which higher additions resulted in precipitation (Moras et al., 2022).
In these same experimental conditions discussed above, the threshold for CaCO3 precipitation was surpassed after Ωaragonite increased, temperature increased, or the mineral induction period where alkalinity is stable had ended. In some cases, precipitation was favorable due to the presence of nucleation sites (Hartmann et al., 2023; Hashim et al., 2025; Moras et al., 2022, 2024; Ringham et al., 2024; Suitner et al., 2024; Varliero et al., 2024). These are all parameters that vary in a given oceanic environment. With NaHCO3 + Na2CO3 additions or NaOH additions where no solid feedstock was used, CaCO3 precipitated as early as 1 d when Ωaragonite>30 (Hartmann et al., 2023; Ringham et al., 2024; Suitner et al., 2024) or after 20 d when Ωaragonite exceeded 15 (Hartmann et al., 2023; Suitner et al., 2024). At warmer surface temperatures (27 °C) precipitation started at Ωaragonite≈10 (NaOH addition) within hours in a closed system (Hashim et al., 2025). In the experiments where nucleation sites were present, precipitation could be observed as low as Ωaragonite∼7 with CaO and Ca(OH)2 (Moras et al., 2022; Varliero et al., 2024). The influence of parameters such as surface area for nucleation and oversaturation with respect to Ωaragonite on runaway CaCO3 precipitation have been further constrained in observation driven modeling efforts (Suitner et al., 2026).
As our alkalinity additions only raised Ωaragonite to 2 (for [Ca2+] + [] addition) and Ωaragonite to 7–8 (NaOH) for 4 d, which is within the range of no observed precipitation of other studies, we believe our results are consistent with existing literature. With our CaO addition we raised Ωaragonite to 8–14, and we expected CaCO3 as our saturation values were above that of Moras et al. (2022). However, our experimental conditions did not have solid feedstock like Moras et al. (2022), which could explain the lack of precipitation. Given our results, OAE practioners in LA Harbour, perhaps analogous to other near-shore oceanic regions, could expect no CaCO3 precipitation with aqueous NaOH, [Ca2+] + [], or CaO addition at ∼ 500 µmol kg−1 for at least four days. Thus far it is clear that the thresholds for heterogeneous precipitation (i.e., relevant if using mineral feedstock) versus pseudo-homogeneous precipitation (i.e., relevant if primarily using aqueous solutions for OAE in natural seawater) (Chen et al., 2005; Marion et al., 2009; Wolf et al., 2008) must be different, and may vary with different temperature, salinity, or even organic matter content (Moras et al., 2024; Suitner et al., 2026). Future studies could focus on comparing these precipitation thresholds by systematically changing parameters that influence the induction period before mineral precipitation.
4.2 Impact of alkalinity on organic matter cycling
4.2.1 Minimal impacts of NaOH and [Ca2+] + [] additions
The Port of Los Angeles has a dynamic seasonal cycle that directly influences the carbon standing stock – driven by the seasonally dominant organisms within the water. The organic carbon biomass is highest in Spring at 300 µgC L−1, followed by 150 µgC L−1 in Summer, 100 µgC L−1 in Fall, and 80 µgC L−1 in the Winter (Connell et al., 2017). There is also seasonality in the types of organisms that are creating biomass and are thus responding to the alkalinity addition during our experiments.
The NaOH (starting [POC] = 200 µgC L−1) and [Ca2+] + [] (starting [POC] = 400 µgC L−1) experiments were conducted in the Summer, when Diatoms make up more than half of the particulate biomass, followed by Picoeukaryotes in the LA Port region (Connell et al., 2017). The lack of impact on POC or Chl a production between the controls and treatments after NaOH and [Ca2+] + [] addition (∼ 500 µmol kg−1, pHT 7.77–8.62) in this study is congruent with results seen from other Diatom specific studies (Gately et al., 2023; Oberlander et al., 2025) and natural community studies (Guo et al., 2025) where the resultant change in POC production was also negligible. Other studies have seen a decrease in Diatom concentration once the alkalinity addition has increased pH beyond 8.55 (Kousoulas et al., 2025; Oberlander et al., 2025) and note a decrease in Picoeukaryote concentration after NaOH addition (Ferderer et al., 2022; Kousoulas et al., 2025; Oberlander et al., 2025). In this study, we do not have evidence to say if the species compositions shifted, however, these alkalinity additions did not statistically alter the POC concentrations when compared to the control (Fig. 3). Ferderer et al. (2022) saw POC decline after alkalinity addition, which they attributed to a possible alteration in the composition of the diatom community and increased heterotrophic bacterial activity in their alkalinity (NaOH and NaHCO3) treatments.
Heterotrophic bacteria continuously recycle organic matter derived from primary production and thus will be affected by processes changing carbon biomass (Dittmar et al., 2021; Santinelli et al., 2024; Soong et al., 2020). Some of our results suggest that NaOH addition could change PIC and DOC production in waters incubated in the dark (See Fig. A2), but this is not observed in the dark CaO or [Ca2+] + [] additions. In the non-shaded bottles of the [Ca2+] + [] experiments, there appear to be substantial amounts of DOC production, but statistically we cannot say if this is a result of the ∼ 500 µmol kg−1 alkalinity enhancement. The observed heterogeneity may simply be caused by when the water was sampled. These results, when considered with existing literature suggest that more OAE impact studies should focus on changes in heterotrophic bacteria, metabolic reactions that utilize [], and recycling of DOC.
The pH in LA Harbor waters has a natural measured variability of 7.57–8.46 (Lyons and Birosik, 2007). Under the conditions of our incubations, the natural microbial populations may be acclimated to pH shifts of the order generated by the NaOH and [Ca2+] + [] additions (∼ 500 µmol kg−1, pHT 7.77–8.62) in these experiments. It is not uncommon for coastal environments to experience pH oscillations of 1 or more pH units due to tidal fluctuations or metabolic processes such as photosynthesis and respiration. Hinga (2002) reviewed 21 studies that assess the impact of pH on the growth rates of coastal marine phytoplankton. Some species were able to thrive at a wide pH range, but others were extremely sensitive to changes of <0.5 pH units. In LA Harbor there are also natural alkalinity changes experienced by the ecosystems, and therefore these water column ecosystems may be able to handle some extent of OAE. However, determining “safe” thresholds for OAE is a nuanced ecological and societal issue that requires further scientific consensus.
4.3 Potential impact of CaO addition
The impacts to Chl a and POC from the CaO addition when compared to the unamended conditions show different outcomes. Of the two experiments conducted around ∼ 500 µmol kg−1, one (27 January 2025; measured ΔTA = 612 ± 13 µmol kg−1) shows that Chl a was statistically lower. This trend was not seen in Chl a in the experiment conducted at ∼ 1000 µmol kg−1 (4 November 2024; measured ΔTA = 923 ± 12 µmol kg−1). POC production was reduced by 100 µgC L−1after 4 d from the ∼ 500 µmol kg−1 CaO additions (but the trend is not statistically significant due to high initial variability). POC production is reduced by 200 µgC L−1 after the ∼ 1000 µmol kg−1 addition, which is statistically significant. This coincides with statistically different (lower) dissolved oxygen after a ∼ 1000 µmol kg−1 CaO addition as compared to the control. The impacts of CaO addition at ∼ 500 µmol kg−1 may not be statistically significant on LA Harbor organic matter cycling, but at ∼ 1000 µmol kg−1 the impacts do become statistically significant.
Other studies that test the impact of ocean liming – either simulated by CaO, Ca(OH)2, or even NaOH + CaCl2 addition – have seen minimal effects on growth rates, grazing rate, and community composition when the resultant change has been below pH 9 (de Castro et al., 2025; Traboni et al., 2025). In our study, the starting pHT of the seawater is around 7.68–7.85 and the CaO additions bring this pHT to 8.57–8.91 (∼ 500–1000 µmol kg−1 experiments). Several studies, that raised pH > 9 with CaO, have shown a decrease in organism quality (i.e., nutrient composition) and growth rate (Bhaumik et al., 2025) or decreased motility and even increased mortality (Camatti et al., 2024; Pedersen and Hansen, 2003). CaO addition, that reduces pCO2 below ∼ 100 µatm, could cause issues in primary production from the CO2 limitation. This has been shown in coccolithophore growth (Bach et al., 2011; Faucher et al., 2025; Riebesell et al., 1993; Sett et al., 2014) and for other marine phytoplankton (Hansen, 2002; Pedersen and Hansen, 2003). These results draw attention to how reorganization of community composition (with smaller phytoplankton that are better adapted to lower pCO2 availability (Chrachri et al., 2018; Flynn et al., 2012; Wolf-Gladrow and Riebesell, 1997)) could result from alkalinity additions. This in turn could reduce the transfer efficiency of POM to the deeper ocean (Boyd and Newton, 1995). In this study we do not incorporate a characterization of size classes, but future alkalinity enhancement studies should also try to incorporate an analysis of changes in particle size class, among a suite of other ecological impacts (Marx et al., 2026).
Regional studies that systematically explore the impacts on biomass transfer but also characterize the changing biomass will be highly informative when considering the impacts of OAE on carbon partitioning. In our LA Harbor waters, POC sometimes increased or decreased over 4 d incubations. However, there was a consistent pattern of less POC production in CaO treatment bottles – lower by 100–200 µgC L−1 compared to control samples; as was statistically lower at Ωaragonite=14. Future studies should resolve changes in POC particle class size and leverage `omics tools to understand what parts of the organic matter cycle may be impacted by CaO addition. Studies should also draw attention to the impacts of increased alkalinity in regions where the amended water mass sinks below the euphotic zone and heterotrophic reactions may dominate carbon cycling.
Our experiments show that even factors that should increase the likelihood of CaCO3 precipitation – supersaturation & greater nucleation sites – did not lead to CaCO3 precipitation over a four-day incubation period at Ωaragonite≤14 in closed but photosynthetically active systems. Additionally, Chlorophyll as a proxy for the community of phytoplankton, did not show sensitivity to any of the three alkalinity types at an addition threshold of ∼ 500 µmol kg−1.
There may be other environmental parameters that influence PIC and POC production in concert with alkalinity enhancement. We recommend conducting longer duration experiments across a wide range of waters and ecosystems, especially regions that may experience smaller shifts in alkalinity. However, natural ecosystems that do experience more variability in alkalinity may be resilient to some OAE intervention.
In the 4 d experiments we also included 4 bottles that received no light (2 controls and 2 treatments), while the remaining 18 bottles were subjected to the regular day-night cycle. A summary of the carbonate system manipulations can be seen in Fig. A1. The biogeochemical changes to alkalinity additions are summarized in Fig. A2. There were no replicate bottles on Day 2 and 4, hence, we did not conduct any statistical analysis on this dataset. We have included this dataset for qualitative results that may encourage further study of the impacts of alkalinity on dark metabolic reactions and organic matter cycling. There are no consistent trends in Chl a or particulate organic carbon concentrations across treatments. We see an increase of particulate inorganic carbon and dissolved organic carbon in the NaOH treatment bottles relative to the control conditions, but we caution against making any conclusive judgements about the effective alkalinity on dark reactions from this dataset.
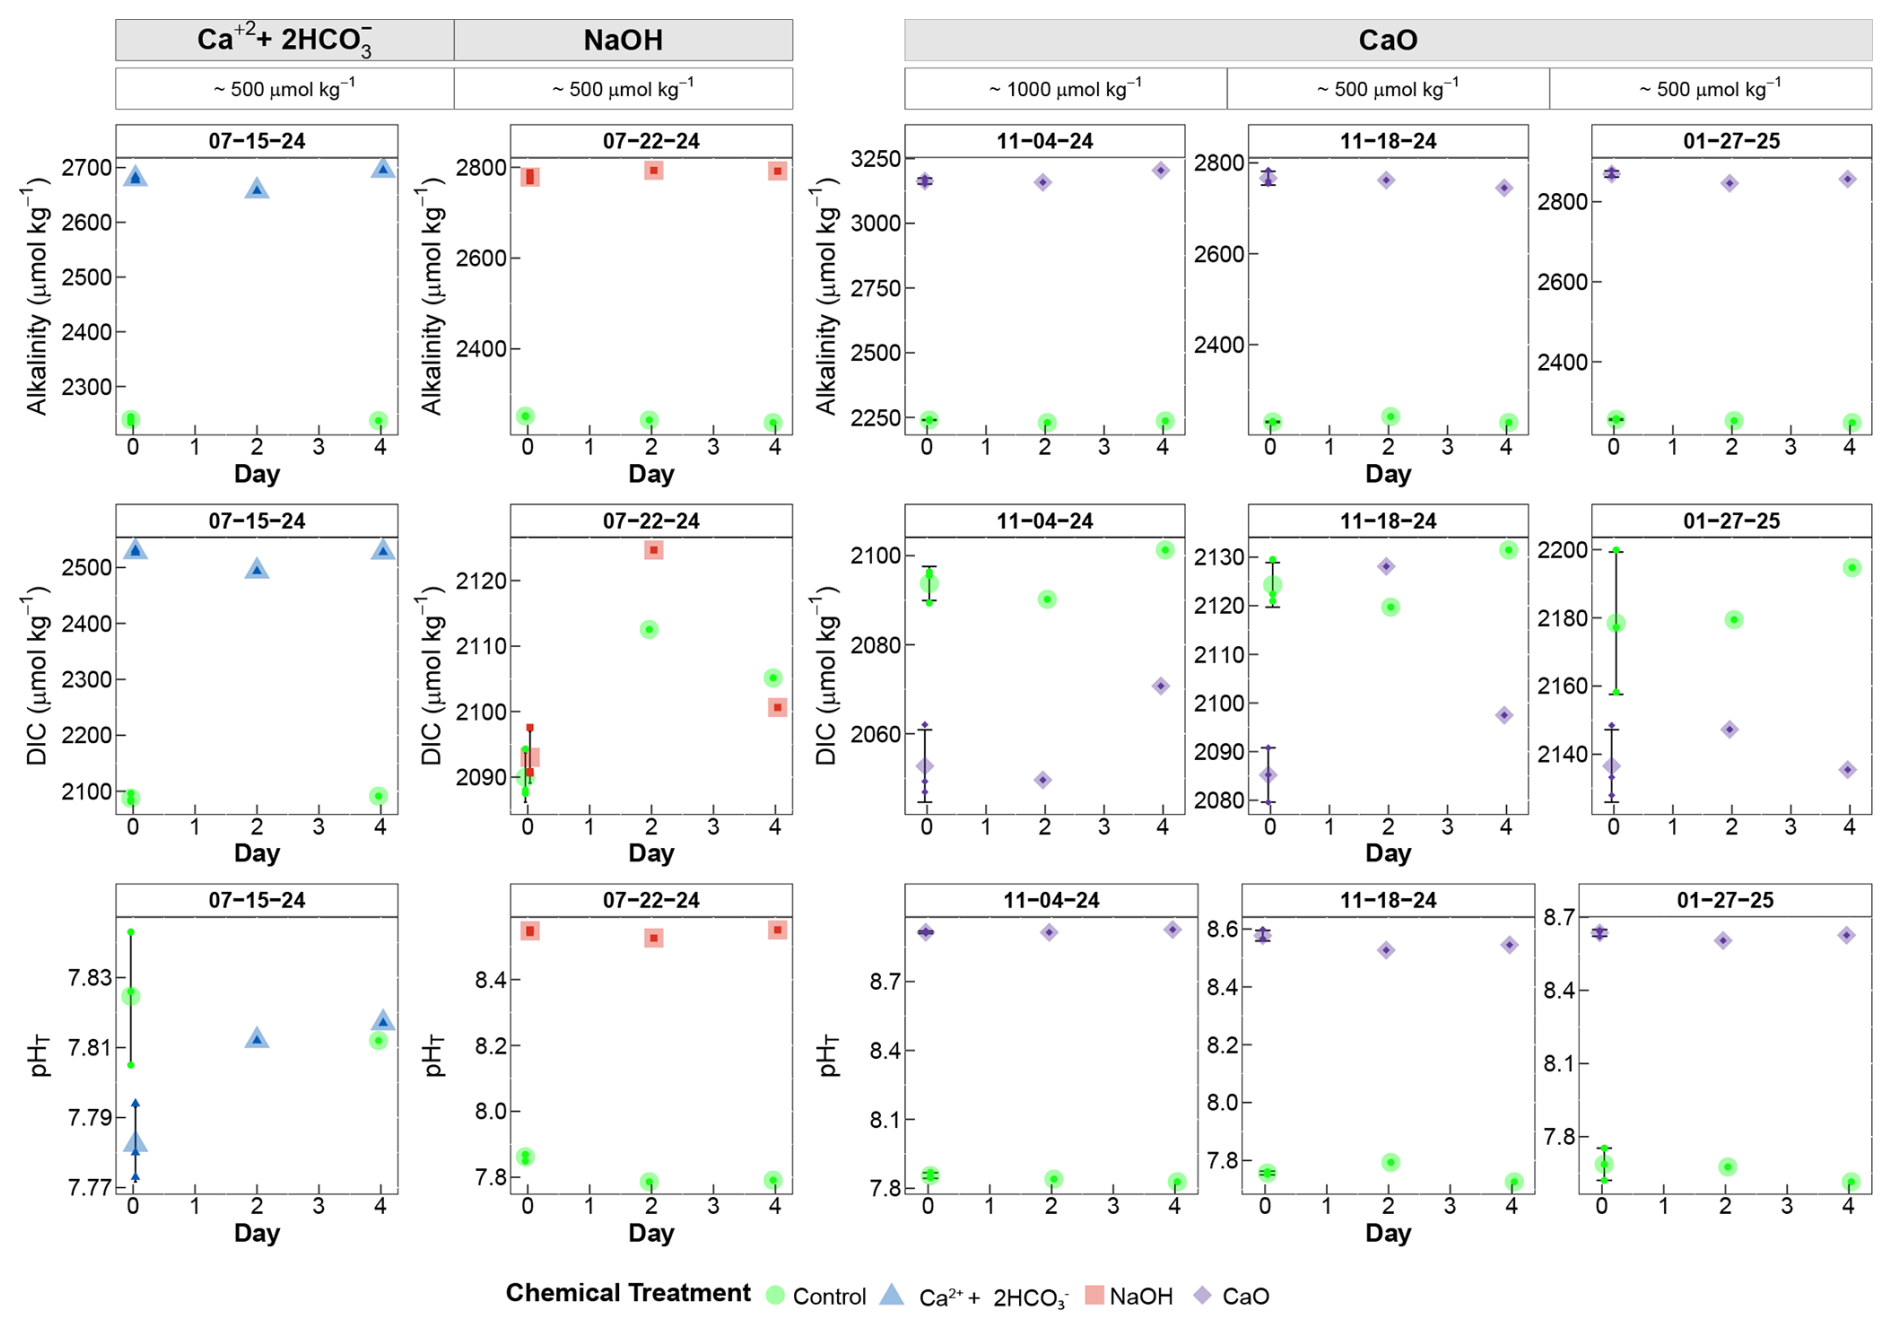
Figure A1Summary of carbonate chemistry measured in “Dark Bottles”. Data in figure panels (First Row) Total Alkalinity µmol kg−1, (Second Row) Dissolved Inorganic Carbon µmol kg−1, and (Third Row) pHT (as calculated on the Total Scale from the Total Alkalinity and DIC pair in CO2sys.v3 – detailed in Methods). Bottles that were devoid of light (deployed during the in-situ experiments) are shown in these figures; Day 0 Bottles from the normal light exposure experiments shown for reference (n=3). Day 2 and Day 4 bottles have an n=1 (Statistical analysis was not conducted on this data – only being presented for qualitative assessment). Treatments include Control (green), NaOH (red), CaCl2 + NaHCO3 (blue), and CaO (purple).
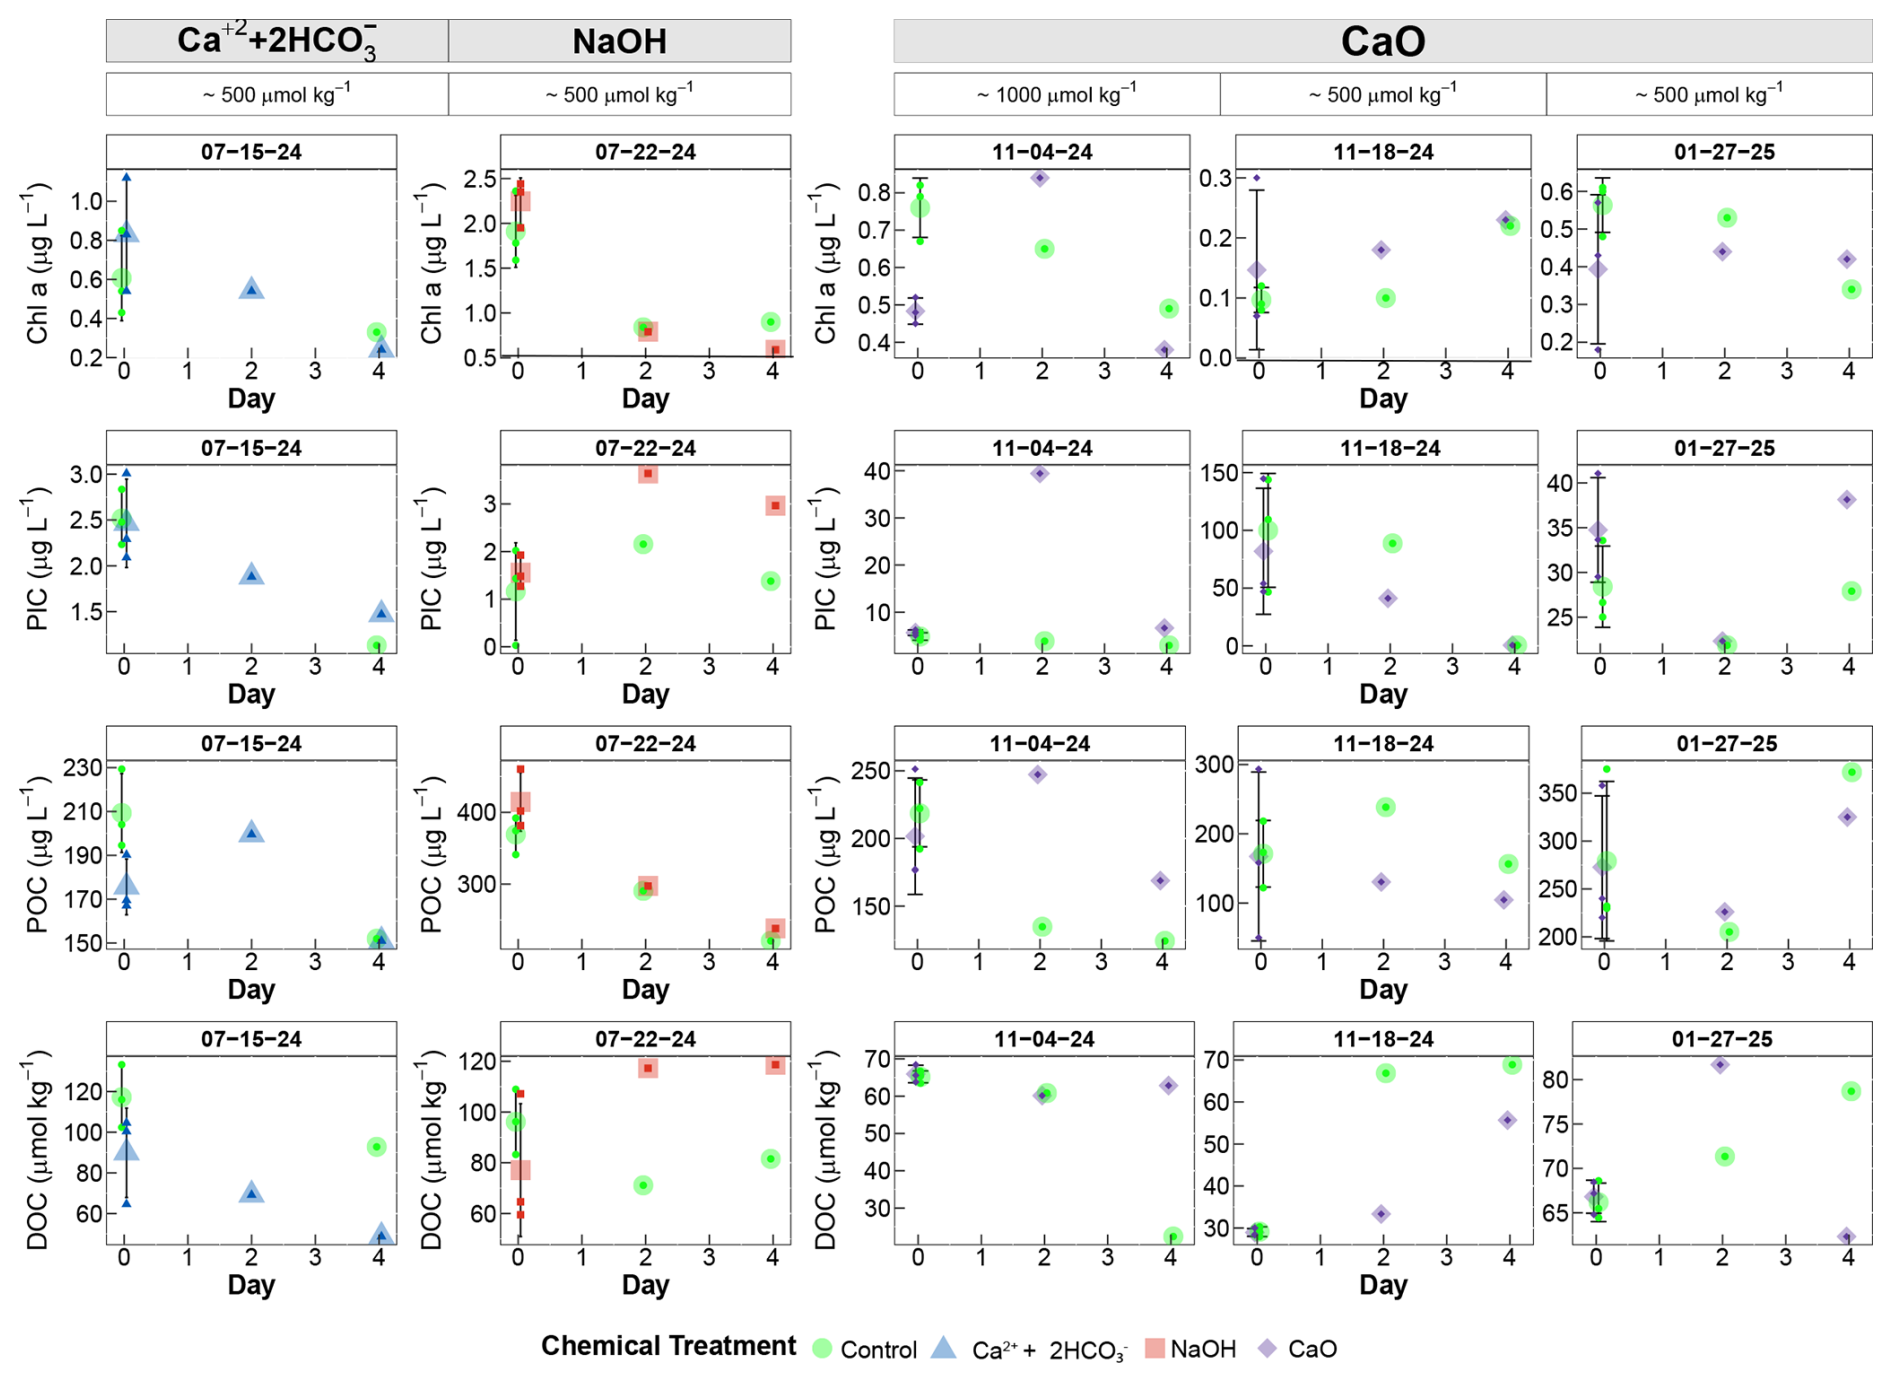
Figure A2Summary of biogeochemical variables measured in “Dark Bottles”. Data in figure panels (First Row) Chl a µg L−1, (Second Row) Particulate Inorganic Carbon µgC L−1, (Third Row) Particulate Organic Carbon µgC L−1, and (Fourth Row) Dissolved Organic Carbon µmol kg−1. Bottles that were devoid of light (deployed during the in-situ experiments) are shown in these figures; Day 0 Bottles from the normal light exposure experiments shown for reference (n=3). Day 2 and Day 4 bottles have an n=1 (Statistical analysis was not conducted on this data – only being presented for qualitative assessment). Treatments include Control (green), NaOH (red), CaCl2 + NaHCO3 (blue), and CaO (purple).
These tables summarize the conditions under which CaCO3 precipitation was and was not observed, as discussed in Sect. 4.1 Absence of secondary CaCO3 precipitation.
Table B1Experimental conditions where CaCO3 precipitation is NOT observed.
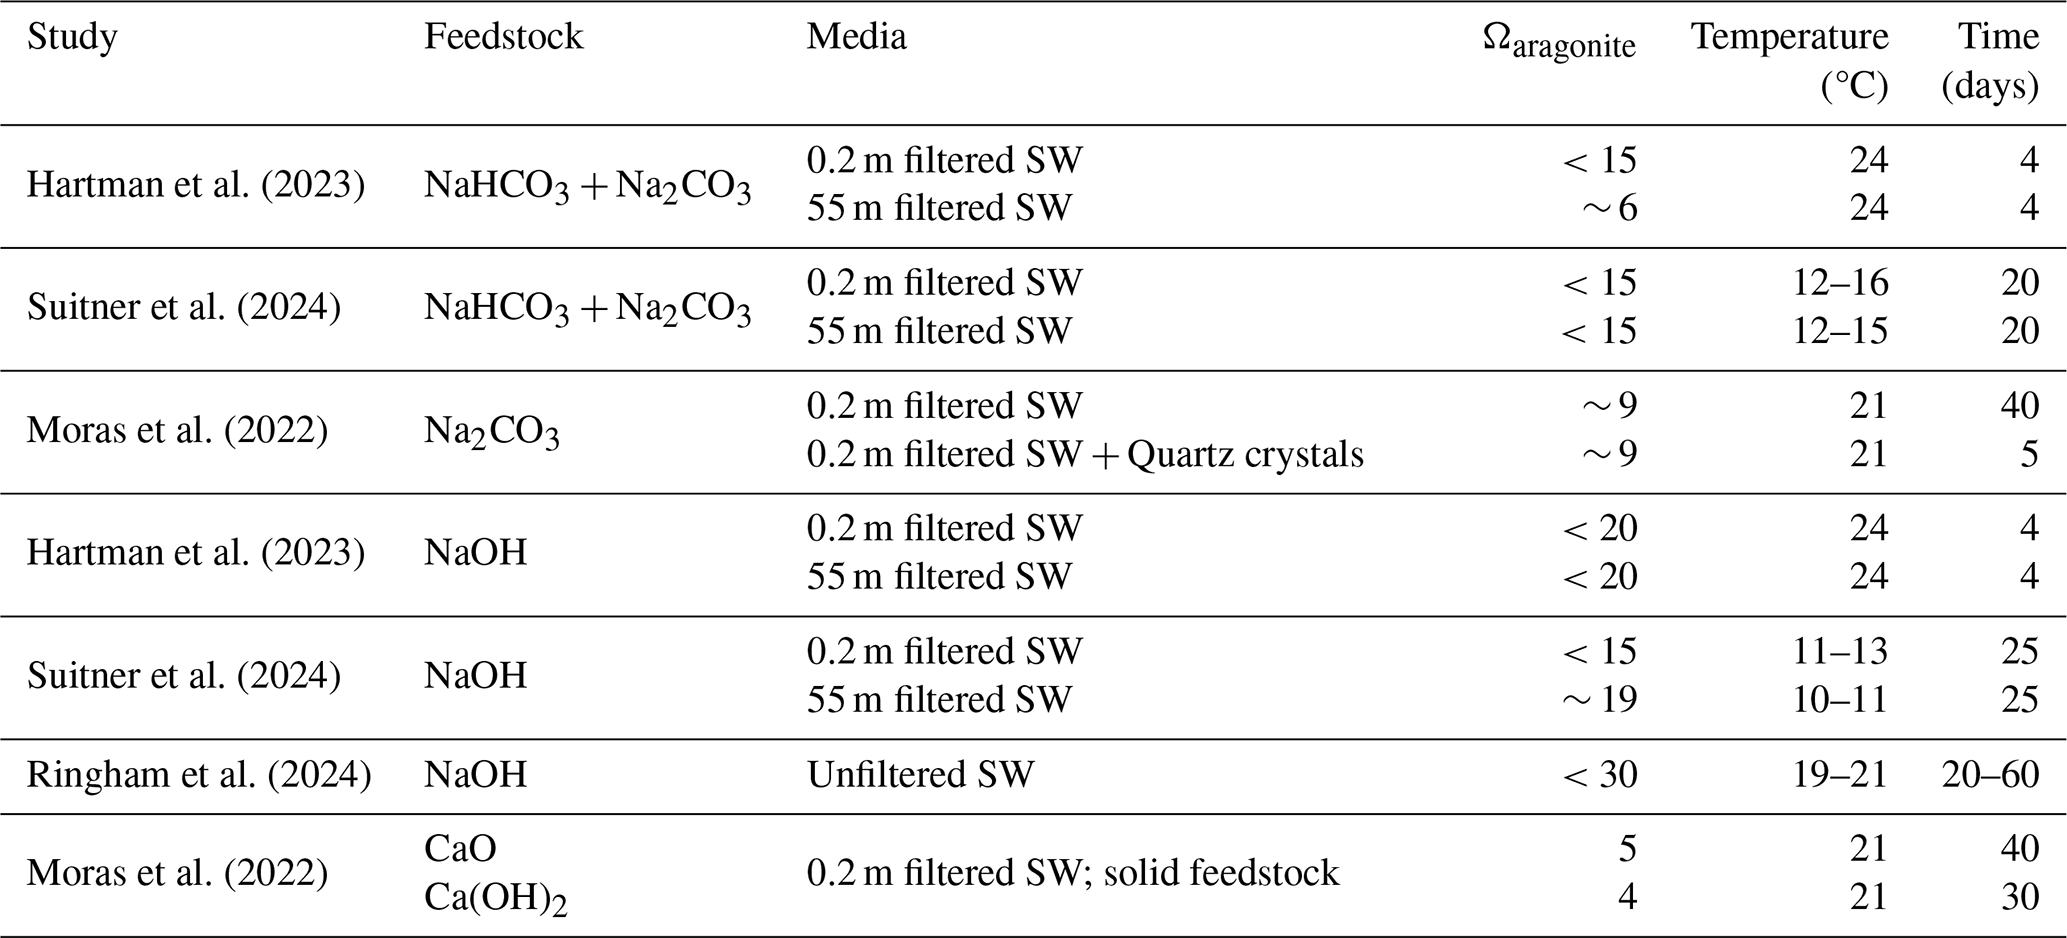
Table B2Experimental conditions where CaCO3 precipitation is observed.
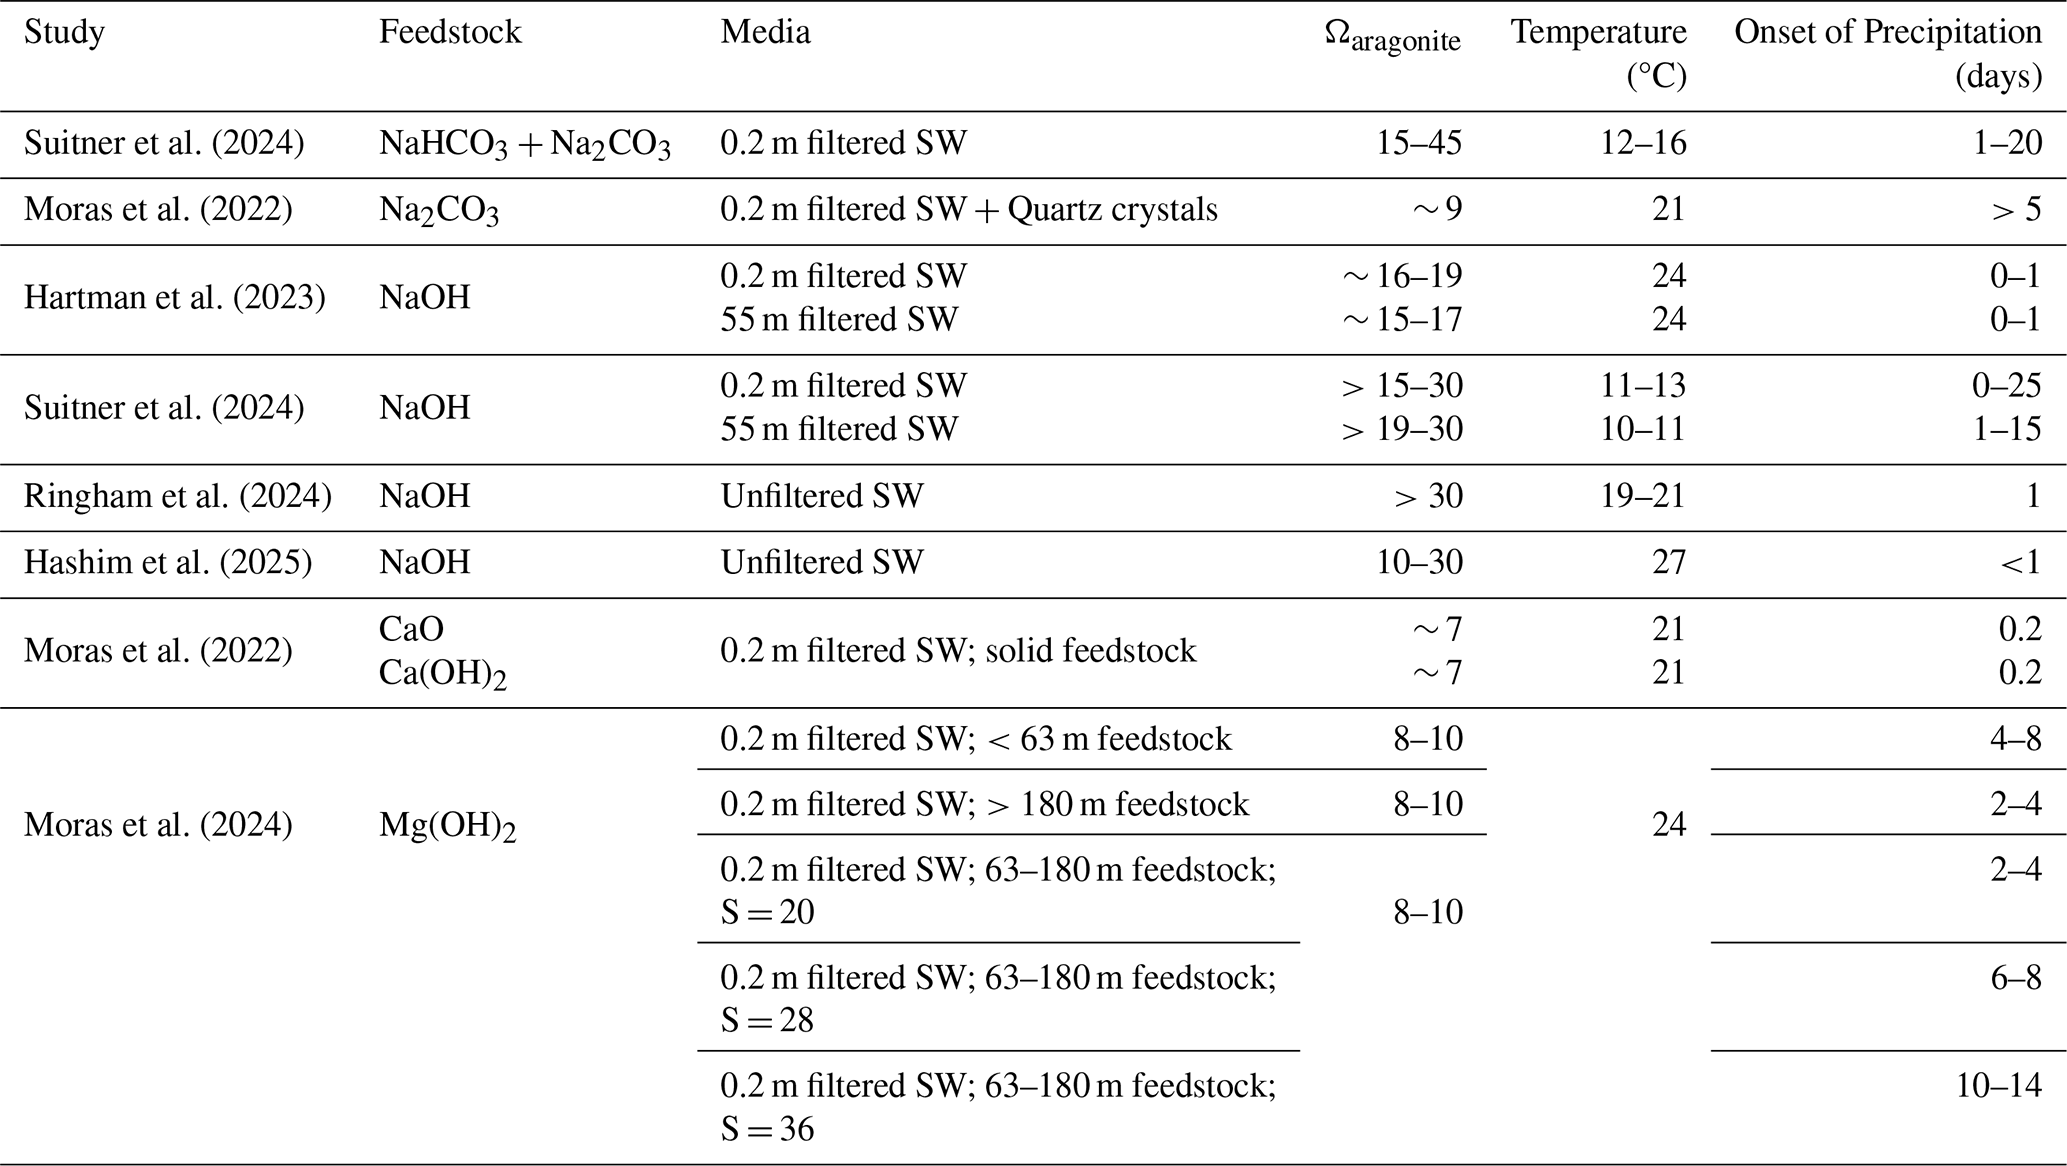
* Seawater abbreviated to SW; Salinity abbreviated to S.
Data are publicly available at https://doi.org/10.5281/zenodo.20059856 (Wani et al., 2026).
RPW and WMB designed the experiments with consultation from NER. RPW conducted these experiments with the help of DLR, RA, and EJL. RPW was responsible for sample analysis, data curation, and formal statistical analysis with consultation from NER and WMB. Funding was acquired by WMB. The manuscript was written and edited by RPW with contributions from WMB.
WB is the co-founder of Calcarea, Inc. The authors declare that they have no other competing interests.
Publisher's note: Copernicus Publications remains neutral with regard to jurisdictional claims made in the text, published maps, institutional affiliations, or any other geographical representation in this paper. The authors bear the ultimate responsibility for providing appropriate place names. Views expressed in the text are those of the authors and do not necessarily reflect the views of the publisher.
We thank AltaSea, Calcarea, USC Wrigley Institute of Environment and Sustainability, Departments of Environmental Engineering and Earth Sciences at the University of Southern California for access to lab, instrument, and dock resources. Specific thanks to Pierre Forin, Doug Capone, Myrna Jacobson, Sarah Feakins and the Berelson Lab. This work was conducted on the ancestral and unceded territory of the Kizh (Gabrieleño) people, and we pay our respects to the members of these communities. Additionally, we thank the two anonymous reviewers and the associate editor, Perran Cook, for their efforts in reviewing this manuscript.
This research was conducted while RW was a recipient of the Wrigley Institute Graduate Fellowship in 2023. The research was funded by the Lott Innovation Award and the Faculty Innovation Award (to WB) through the USC Wrigley Institute for Environmental Studies (WIES). We acknowledge an NSF-REU award to USC WIES for support of RA (2024) and a Zinsmeyer Summer Research Award to EJM (2023) through grant no. OCE-2244583.
This paper was edited by Perran Cook and reviewed by two anonymous referees.
Anderson, L. A.: On the hydrogen and oxygen content of marine phytoplankton, Deep-Sea Res. Pt. I, 42, 1675–1680, https://doi.org/10.1016/0967-0637(95)00072-E, 1995.
Archer, D. E.: An atlas of the distribution of calcium carbonate in sediments of the deep sea, Global Biogeochem. Cy., 10, 159–174, https://doi.org/10.1029/95GB03016, 1996.
Bach, L. T.: The additionality problem of ocean alkalinity enhancement, Biogeosciences, 21, 261–277, https://doi.org/10.5194/bg-21-261-2024, 2024.
Bach, L. T., Riebesell, U., and Schulz, K. G.: Distinguishing between the effects of ocean acidification and ocean carbonation in the coccolithophore Emiliania huxleyi, Limnol. Oceanogr., 56, 2040–2050, https://doi.org/10.4319/lo.2011.56.6.2040, 2011.
Bach, L. T., Gill, S. J., Rickaby, R. E. M., Gore, S., and Renforth, P.: CO2 Removal With Enhanced Weathering and Ocean Alkalinity Enhancement: Potential Risks and Co-benefits for Marine Pelagic Ecosystems, Frontiers in Climate, 1, https://doi.org/10.3389/fclim.2019.00007, 2019.
Bach, L. T., Ferderer, A. J., LaRoche, J., and Schulz, K. G.: Technical note: Ocean Alkalinity Enhancement Pelagic Impact Intercomparison Project (OAEPIIP), Biogeosciences, 21, 3665–3676, https://doi.org/10.5194/bg-21-3665-2024, 2024.
Barker, S., Archer, D., Booth, L., Elderfield, H., Henderiks, J., and Rickaby, R. E. M.: Globally increased pelagic carbonate production during the Mid-Brunhes dissolution interval and the CO2 paradox of MIS 11, Quat. Sci. Rev., 25, 3278–3293, https://doi.org/10.1016/j.quascirev.2006.07.018, 2006.
Berelson, W. M., Balch, W. M., Najjar, R., Feely, R. A., Sabine, C., and Lee, K.: Relating estimates of CaCO3 production, export, and dissolution in the water column to measurements of CaCO3 rain into sediment traps and dissolution on the sea floor:A revised global carbonate budget, Global Biogeochem. Cy., 21, 1–15, https://doi.org/10.1029/2006GB002803, 2007.
Berner, R. A.: The role of magnesium in the crystal growth of calcite and aragonite from sea water, Geochim. Cosmochim. Ac., 39, 489–504, https://doi.org/10.1016/0016-7037(75)90102-7, 1975.
Berner, R. A. and Berner, E. K.: Silicate Weathering and Climate, in: Tectonic Uplift and Climate Change, Springer US, Boston, MA, 353–365, https://doi.org/10.1007/978-1-4615-5935-1_15, 1997.
Berner, R. A., Lasaga, A. C., and Garrels, R. M.: The carbonate-silicate geochemical cycle and its effect on atmospheric carbon dioxide over the past 100 million years, Am. J. Sci., 283, 641–683, https://doi.org/10.2475/ajs.283.7.641, 1983.
Bhaumik, A., Faucher, G., Henning, M., Meunier, C. L., and Boersma, M.: Prey dynamics as a buffer: enhancing copepod resilience to ocean alkalinity enhancement, Environ. Res. Lett., 20, https://doi.org/10.1088/1748-9326/adaa8c, 2025.
Bialonski, S., Caron, D. A., Schloen, J., Feudel, U., Kantz, H., and Moorthi, S. D.: Phytoplankton dynamics in the Southern California Bight indicate a complex mixture of transport and biology, J. Plankton Res., 38, 1077–1091, https://doi.org/10.1093/plankt/fbv122, 2016.
Boyd, P. and Newton, P.: Evidence of the potential influence of planktonic community structure on the interannual variability of particulate organic carbon flux, Deep-Sea Res. Pt. I, 42, 619–639, https://doi.org/10.1016/0967-0637(95)00017-Z, 1995.
Cai, W.-J. and Jiao, N.: Wastewater alkalinity addition as a novel approach for ocean negative carbon emissions, The Innovation, 3, 100272, https://doi.org/10.1016/j.xinn.2022.100272, 2022.
Camatti, E., Valsecchi, S., Caserini, S., Barbaccia, E., Santinelli, C., Basso, D., and Azzellino, A.: Short-term impact assessment of ocean liming: A copepod exposure test, Mar. Pollut. Bull., 198, 115833, https://doi.org/10.1016/j.marpolbul.2023.115833, 2024.
Caron, D. A., Connell, P. E., Schaffner, R. A., Schnetzer, A., Fuhrman, J. A., Countway, P. D., and Kim, D. Y.: Planktonic food web structure at a coastal time-series site: I. Partitioning of microbial abundances and carbon biomass, Deep-Sea Res. Pt. I, 121, 14–29, https://doi.org/10.1016/j.dsr.2016.12.013, 2017.
Carter, C. M., Ross, A. H., Schiel, D. R., Howard-Williams, C., and Hayden, B.: In situ microcosm experiments on the influence of nitrate and light on phytoplankton community composition, J. Exp. Mar. Biol. Ecol., 326, 1–13, https://doi.org/10.1016/j.jembe.2005.05.006, 2005.
Caserini, S., Pagano, D., Campo, F., Abbà, A., De Marco, S., Righi, D., Renforth, P., and Grosso, M.: Potential of Maritime Transport for Ocean Liming and Atmospheric CO2 Removal, Frontiers in Climate, 3, 1–18, https://doi.org/10.3389/fclim.2021.575900, 2021.
Chen, T., Neville, A., and Yuan, M.: Calcium carbonate scale formation – assessing the initial stages of precipitation and deposition, J. Pet. Sci. Eng., 46, 185–194, https://doi.org/10.1016/j.petrol.2004.12.004, 2005.
Chou, H.-T.: On the dilution of liquid waste in ship's wake, J. Mar. Sci. Technol., 149–154, https://doi.org/10.1126/science.155.3770.1621, 1996.
Chrachri, A., Hopkinson, B. M., Flynn, K., Brownlee, C., and Wheeler, G. L.: Dynamic changes in carbonate chemistry in the microenvironment around single marine phytoplankton cells, Nat. Commun., 9, 74, https://doi.org/10.1038/s41467-017-02426-y, 2018.
Connell, P. E., Campbell, V., Gellene, A. G., Hu, S. K., and Caron, D. A.: Planktonic food web structure at a coastal time-series site: II. Spatiotemporal variability of microbial trophic activities, Deep-Sea Res. Pt. I, 121, 210–223, https://doi.org/10.1016/j.dsr.2017.01.007, 2017.
Daehler, C. C. and Strong, D. R.: Can You Bottle Nature? The Roles of Microcosms in Ecological Research, Ecology, 77, 663–664, https://doi.org/10.2307/2265487, 1996.
de Castro, I., Ribeiro, S. C., Louvado, A., Gomes, N. C. M., Cachão, M., Brito de Azevedo, E., and Barcelos e Ramos, J.: Ocean liming effect on a North Atlantic microbial community: changes in composition and rates, Front. Mar. Sci., 12, https://doi.org/10.3389/fmars.2025.1602158, 2025.
de Coninck, H., Revi, A., Babiker, M., Bertoldi, P., Buckeridge, M., Cartwright, A., Dong, W., Ford, J., Fuss, S., Hourcade, J.-C., Ley, D., Mechler, R., Newman, P., Revokatova, A., Schultz, K., Steg, L., and Sugiyama, T.: Strengthening and Implementing the Global Response In: Global Warming of 1.5 °C. An IPCC Special Report on the impacts of global warming of 1.5 °C above pre-industrial levels and related global greenhouse gas emission pathways, in the context of strengthening the global response to the threat of climate change, sustainable development, and efforts to eradicate poverty, in: Global Warming of 1.5°C, edited by: Masson-Delmotte, V., Zhai, P., Portner, H.-O., Roberts, D., Skea, J., Shukla, P. R., Pirani, A., Moufouma-Okia, W., Pean, C., Pidcock, R., Connors, S., Matthews, J. B. R., Chen, Y., Zhou, X., Gomis, M. I., Lonny, E., Maycock, T., Tignor, M., and Waterfield, T., Cambridge University Press, Cambridge, UK and New York, NY, USA, 313–444, https://doi.org/10.1017/9781009157940.006, 2018.
Dickson, A. G.: Thermodynamics of the dissociation of boric acid in synthetic seawater from 273.15 to 318.15 K, Deep Sea Research Part A. Oceanographic Research Papers, 37, 755–766, https://doi.org/10.1016/0198-0149(90)90004-F, 1990.
Dickson, A. G. and Millero, F. J.: A comparison of the equilibrium constants for the dissociation of carbonic acid in seawater media, Deep Sea Research Part A. Oceanographic Research Papers, 34, 1733–1743, https://doi.org/10.1016/0198-0149(87)90021-5, 1987.
Dickson, A. G., Sabine, C. L., and Christian, J. R. (Eds.): Guide to best practices for ocean CO2 measurements, PICES Special Publication 3, 191 pp., ISBN 1-897176-07-4, 2007.
Dittmar, T., Lennartz, S. T., Buck-Wiese, H., Hansell, D. A., Santinelli, C., Vanni, C., Blasius, B., and Hehemann, J.-H.: Enigmatic persistence of dissolved organic matter in the ocean, Nat. Rev. Earth Environ., 2, 570–583, https://doi.org/10.1038/s43017-021-00183-7, 2021.
Dong, S., Berelson, W. M., Forin, P., Gutierrez, M., Carroll, D., Menemenlis, D., Kyi, A. Y., and Adkins, J. F.: Potential of CO2 sequestration through accelerated weathering of limestone on ships, Sci. Adv., 11, https://doi.org/10.1126/sciadv.adr7250, 2025.
Dunne, J. P., Sarmiento, J. L., and Gnanadesikan, A.: A synthesis of global particle export from the surface ocean and cycling through the ocean interior and on the seafloor, Global Biogeochem. Cy., 21, https://doi.org/10.1029/2006GB002907, 2007.
Eisaman, M. D., Geilert, S., Renforth, P., Bastianini, L., Campbell, J., Dale, A. W., Foteinis, S., Grasse, P., Hawrot, O., Löscher, C. R., Rau, G. H., and Rønning, J.: Assessing the technical aspects of ocean-alkalinity-enhancement approaches, in: Guide to Best Practices in Ocean Alkalinity Enhancement Research, edited by: Oschlies, A., Stevenson, A., Bach, L. T., Fennel, K., Rickaby, R. E. M., Satterfield, T., Webb, R., and Gattuso, J.-P., Copernicus Publications, State Planet, 2-oae2023, 3, https://doi.org/10.5194/sp-2-oae2023-3-2023, 2023.
Falkowski, P., Scholes, R. J., Boyle, E., Canadell, J., Canfield, D., Elser, J., Gruber, N., Hibbard, K., Högberg, P., Linder, S., Mackenzie, F. T., Moore III, B., Pedersen, T., Rosenthal, Y., Seitzinger, S., Smetacek, V., and Steffen, W.: The Global Carbon Cycle: A Test of Our Knowledge of Earth as a System, Science, 290, 291–296, https://doi.org/10.1126/science.290.5490.291, 2000.
Faucher, G., Haunost, M., Paul, A. J., Tietz, A. U. C., and Riebesell, U.: Growth response of Emiliania huxleyi to ocean alkalinity enhancement, Biogeosciences, 22, 405–415, https://doi.org/10.5194/bg-22-405-2025, 2025.
Ferderer, A., Chase, Z., Kennedy, F., Schulz, K. G., and Bach, L. T.: Assessing the influence of ocean alkalinity enhancement on a coastal phytoplankton community, Biogeosciences, 19, 5375–5399, https://doi.org/10.5194/bg-19-5375-2022, 2022.
Flynn, K. J., Blackford, J. C., Baird, M. E., Raven, J. A., Clark, D. R., Beardall, J., Brownlee, C., Fabian, H., and Wheeler, G. L.: Changes in pH at the exterior surface of plankton with ocean acidification, Nat. Clim. Chang., 2, 510–513, https://doi.org/10.1038/nclimate1489, 2012.
Fraser, L. H. and Keddy, P.: The role of experimental microcosms in ecological research, Trends Ecol. Evol., 12, 478–481, https://doi.org/10.1016/S0169-5347(97)01220-2, 1997.
Gately, J. A., Kim, S. M., Jin, B., Brzezinski, M. A., and Iglesias-Rodriguez, M. D.: Coccolithophores and diatoms resilient to ocean alkalinity enhancement: A glimpse of hope?, Sci. Adv., 9, https://doi.org/10.1126/sciadv.adg6066, 2023.
Giesy, J. P.: Microcosms in ecological research: selected papers from a symposium held at Augusta, Georgia, 8–10 November 1978, Technical Information Center, U.S. Dept. of Energy, http://hdl.handle.net/2027/uc1.31822010562999 (last access: 20 May 2026), 1980.
Guo, J. A., Strzepek, R. F., Yuan, Z., Swadling, K. M., Townsend, A. T., Achterberg, E. P., Browning, T. J., and Bach, L. T.: Effects of ocean alkalinity enhancement on plankton in the Equatorial Pacific, Commun. Earth Environ., 6, https://doi.org/10.1038/s43247-025-02248-7, 2025.
Hansen, P.: Effect of high pH on the growth and survival of marine phytoplankton: implications for species succession, Aquat. Microb. Ecol., 28, 279–288, https://doi.org/10.3354/ame028279, 2002.
Hartmann, J., Suitner, N., Lim, C., Schneider, J., Marín-Samper, L., Arístegui, J., Renforth, P., Taucher, J., and Riebesell, U.: Stability of alkalinity in ocean alkalinity enhancement (OAE) approaches – consequences for durability of CO2 storage, Biogeosciences, 20, 781–802, https://doi.org/10.5194/bg-20-781-2023, 2023.
Hashim, M. S., Marx, L., Klein, F., Dean, C. L., Burdige, E., Hayden, M., McCorkle, D. C., and Subhas, A. V.: Mineral formation during shipboard ocean alkalinity enhancement experiments in the North Atlantic, Biogeosciences, 22, 7149–7165, https://doi.org/10.5194/bg-22-7149-2025, 2025.
Hinga, K.: Effects of pH on coastal marine phytoplankton, Mar. Ecol. Prog. Ser., 238, 281–300, https://doi.org/10.3354/meps238281, 2002.
Holland, H. D.: The chemistry of the atmosphere and oceans, Wiley, New York, ISBN 9780471035091, 1978.
Iglesias-Rodríguez, M. D., Rickaby, R. E. M., Singh, A., and Gately, J. A.: Laboratory experiments in ocean alkalinity enhancement research, in: Guide to Best Practices in Ocean Alkalinity Enhancement Research, edited by: Oschlies, A., Stevenson, A., Bach, L. T., Fennel, K., Rickaby, R. E. M., Satterfield, T., Webb, R., and Gattuso, J.-P., Copernicus Publications, State Planet, 2-oae2023, 5, https://doi.org/10.5194/sp-2-oae2023-5-2023, 2023.
Ives, A. R., Foufopoulos, J., Klopfer, E. D., Klug, J. L., and Palmer, T. M.: Bottle or Big‐Scale Studies: How do we do Ecology?, Ecology, 77, 681–685, https://doi.org/10.2307/2265491, 1996.
Kheshgi, H. S.: Sequestering atmospheric carbon dioxide by increasing ocean alkalinity, Energy, 20, 915–922, https://doi.org/10.1016/0360-5442(95)00035-F, 1995.
Kousoulas, K., Ferderer, A., Eriksen, R., and Bach, L. T.: Winners and losers under hydroxide-based ocean alkalinity enhancement in a Tasmanian plankton community, J. Phycol., https://doi.org/10.1111/jpy.70052, 2025.
de la Broise, D. and Palenik, B.: Immersed in situ microcosms: A tool for the assessment of pollution impact on phytoplankton, J. Exp. Mar. Biol. Ecol., 341, 274–281, https://doi.org/10.1016/J.JEMBE.2006.10.045, 2007.
Lawton, J. H., Naeem, S., Woodfin, R. M., Brown, V. K., Gange, A., Godfray, H. J. C., Heads, P. A., Lawler, S., Magda, D., Thomas, C. D., Thompson, L. J., and Young, S.: The Ecotron: a controlled environmental facility for the investigation of population and ecosystem processes, Philos. Trans. R. Soc. Lond. B Biol. Sci., 341, 181–194, https://doi.org/10.1098/rstb.1993.0102, 1993.
Lee, K., Kim, T.-W., Byrne, R. H., Millero, F. J., Feely, R. A., and Liu, Y.-M.: The universal ratio of boron to chlorinity for the North Pacific and North Atlantic oceans, Geochim. Cosmochim. Ac., 74, 1801–1811, https://doi.org/10.1016/j.gca.2009.12.027, 2010.
Lunstrum, A. and Berelson, W.: CaCO3 dissolution in carbonate-poor shelf sands increases with ocean acidification and porewater residence time, Geochim. Cosmochim. Ac., 329, 168–184, https://doi.org/10.1016/j.gca.2022.04.031, 2022.
Lunstrum, A., Hartmann, J., Moras, C., and Keller, D.: A framework for understanding efficiency losses of Ocean Alkalinity Enhancement, CDRXIV [preprint], https://doi.org/10.70212/cdrxiv.2026517.v1, 2026.
Lyons, M. J. and Birosik, S.: Water Quality in the Dominguez Channel and Los Angeles/Long Beach Harbor Watershed Management Area, Technical Report, Los Angeles Regional Water Quality Control Board, https://www.waterboards.ca.gov/water_issues/programs/swamp/docs/reports/r4_swamp_report_dominguez_channel.pdf (last access: 5 March 2026), 2007.
Marion, G. M., Millero, F. J., and Feistel, R.: Precipitation of solid phase calcium carbonates and their effect on application of seawater SA–T–P models, Ocean Sci., 5, 285–291, https://doi.org/10.5194/os-5-285-2009, 2009.
Marx, L., Rheuban, J. E., McCorkle, D. C., Murray, C. S., Guo, Y., Wang, Z. A., Michel, A. P. M., Chen, K., Kim, H. H., and Subhas, A. V.: The Ecological Activity Index tool for mapping potential ecosystem exposure to ocean alkalinity enhancement, Communications Sustainability, 1, 117, https://doi.org/10.1038/s44458-026-00123-w, 2026.
Moras, C. A., Bach, L. T., Cyronak, T., Joannes-Boyau, R., and Schulz, K. G.: Ocean alkalinity enhancement – avoiding runaway CaCO3 precipitation during quick and hydrated lime dissolution, Biogeosciences, 19, 3537–3557, https://doi.org/10.5194/bg-19-3537-2022, 2022.
Moras, C. A., Cyronak, T., Bach, L. T., Joannes-Boyau, R., and Schulz, K. G.: Effects of grain size and seawater salinity on magnesium hydroxide dissolution and secondary calcium carbonate precipitation kinetics: implications for ocean alkalinity enhancement, Biogeosciences, 21, 3463–3475, https://doi.org/10.5194/bg-21-3463-2024, 2024.
Morse, J. W. and He, S.: Influences of T, S and PCO2 on the pseudo-homogeneous precipitation of CaCO3 from seawater: implications for whiting formation, Mar. Chem., 41, 291–297, https://doi.org/10.1016/0304-4203(93)90261-L, 1993.
Morse, J. W., Arvidson, R. S., and Lüttge, A.: Calcium Carbonate Formation and Dissolution, Chem. Rev., 107, 342–381, https://doi.org/10.1021/cr050358j, 2007.
Mucci, A. and Morse, J. W.: The incorporation of Mg2+ and Sr2+ into calcite overgrowths: influences of growth rate and solution composition, Geochim. Cosmochim. Ac., 47, 217–233, https://doi.org/10.1016/0016-7037(83)90135-7, 1983.
National Academies of Sciences, Engineering, and Medicine: A Research Strategy for Ocean-based Carbon Dioxide Removal and Sequestration, National Academies Press, Washington, DC, 322 pp., https://doi.org/10.17226/26278, 2022.
Naviaux, J. D., Subhas, A. V., Dong, S., Rollins, N. E., Liu, X., Byrne, R. H., Berelson, W. M., and Adkins, J. F.: Calcite dissolution rates in seawater: Lab vs. in-situ measurements and inhibition by organic matter, Mar. Chem., 215, 103684, https://doi.org/10.1016/j.marchem.2019.103684, 2019.
Nguyen Dang, D., Gascoin, S., Zanibellato, A., G. Da Silva, C., Lemoine, M., Riffault, B., Sabot, R., Jeannin, M., Chateigner, D., and Gil, O.: Role of Brucite Dissolution in Calcium Carbonate Precipitation from Artificial and Natural Seawaters, Cryst. Growth Des., 17, 1502–1513, https://doi.org/10.1021/acs.cgd.6b01305, 2017.
Oberlander, J. L., Burke, M. E., London, C. A., and MacIntyre, H. L.: Assessing the impacts of simulated ocean alkalinity enhancement on viability and growth of nearshore species of phytoplankton, Biogeosciences, 22, 499–512, https://doi.org/10.5194/bg-22-499-2025, 2025.
Parsons, T. R.: The Future of Controlled Ecosystem Enclosure Experiments, in: Marine mesocosms: Biological and Chemical Research in Experimental Ecosystems, edited by: Grice, G. D. and Reeve, M. R., Springer-Verlag, New York, 411–418, https://doi.org/10.1007/978-1-4612-5645-8_30, 1982.
Paul, A. J., Haunost, M., Goldenberg, S. U., Hartmann, J., Sánchez, N., Schneider, J., Suitner, N., and Riebesell, U.: Ocean alkalinity enhancement in an open-ocean ecosystem: biogeochemical responses and carbon storage durability, Biogeosciences, 22, 2749–2766, https://doi.org/10.5194/bg-22-2749-2025, 2025.
Pedersen, F. and Hansen, P.: Effects of high pH on a natural marine planktonic community, Mar. Ecol. Prog. Ser., 260, 19–31, https://doi.org/10.3354/meps260019, 2003.
Penman, D. E., Caves Rugenstein, J. K., Ibarra, D. E., and Winnick, M. J.: Silicate weathering as a feedback and forcing in Earth's climate and carbon cycle, Earth. Sci. Rev., 209, 103298, https://doi.org/10.1016/j.earscirev.2020.103298, 2020.
Perez, F. F. and Fraga, F.: Association constant of fluoride and hydrogen ions in seawater, Mar. Chem., 21, 161–168, https://doi.org/10.1016/0304-4203(87)90036-3, 1987.
Pierrot, D., Epitalon, J. M., Orr, J. C., Lewis, E., and Wallace, D. W. R.: MS Excel program developed for CO2 system calculations – version 3.0, GitHub [code], https://github.com/dpierrot/co2sys_xl (last access: 18 September 2023), 2021.
Pukelsheim, F.: The Three Sigma Rule, Am. Stat., 48, 88–91, https://doi.org/10.1080/00031305.1994.10476030, 1994.
Rau, G. H. and Caldeira, K.: Enhanced carbonate dissolution: A means of sequestering waste CO2 as ocean bicarbonate, Energy Convers. Manag., 40, 1803–1813, https://doi.org/10.1016/S0196-8904(99)00071-0, 1999.
Renforth, P.: Perspective: The European Union is not prepared for geochemical carbon dioxide removal, 37–72, https://dialnet.unirioja.es/servlet/articulo?codigo=10837150 (last access: 10 August 2026), 2025.
Renforth, P. and Henderson, G.: Assessing ocean alkalinity for carbon sequestration, Rev. Geophys., 55, 636–674, https://doi.org/10.1002/2016RG000533, 2017.
Ridgwell, A. and Zeebe, R.: The role of the global carbonate cycle in the regulation and evolution of the Earth system, Earth Planet. Sci. Lett., 234, 299–315, https://doi.org/10.1016/j.epsl.2005.03.006, 2005.
Riebesell, U., Wolf-Gladrow, D. A., and Smetacek, V.: Carbon dioxide limitation of marine phytoplankton growth rates, Nature, 361, 249–251, https://doi.org/10.1038/361249a0, 1993.
Riebesell, U., Zondervan, I., Rost, B., Tortell, P. D., Zeebe, R. E., and Morel, F. M. M.: Reduced calcification of marine plankton in response to increased atmospheric CO2, Nature, 407, 364–367, https://doi.org/10.1038/35030078, 2000.
Riebesell, U., Körtzinger, A., and Oschlies, A.: Sensitivities of marine carbon fluxes to ocean change, P. Natl. Acad. Sci. USA, 106, 20602–20609, https://doi.org/10.1073/pnas.0813291106, 2009.
Riebesell, U., Lee, K., Nejstgaard, J. C., and Fisheries, I.: Pelagic mesocosms, Guide to Best Practices for Ocean Acidification Research and Data Reporting, 1–260, https://www.researchgate.net/publication/294685313_Pelagic_mesocosms (last access: 12 August 2026), 2010.
Ringham, M. C., Hirtle, N., Shaw, C., Lu, X., Herndon, J., Carter, B. R., and Eisaman, M. D.: An assessment of ocean alkalinity enhancement using aqueous hydroxides: kinetics, efficiency, and precipitation thresholds, Biogeosciences, 21, 3551–3570, https://doi.org/10.5194/bg-21-3551-2024, 2024.
Santinelli, C., Valsecchi, S., Retelletti Brogi, S., Bachi, G., Checcucci, G., Guerrazzi, M., Camatti, E., Caserini, S., Azzellino, A., and Basso, D.: Ocean liming effects on dissolved organic matter dynamics, Biogeosciences, 21, 5131–5141, https://doi.org/10.5194/bg-21-5131-2024, 2024.
Savoie, A. M., Ringham, M., Torres Sanchez, C., Carter, B. R., Dougherty, S., Feely, R. A., Hegeman, D., Herndon, J., Khangaonkar, T., Loretz, J., Minck, T., Pelman, T., Premathilake, L., Subban, C., Vance, J., and Ward, N. D.: Novel field trial for ocean alkalinity enhancement using electrochemically derived aqueous alkalinity, Frontiers in Environmental Engineering, 4, https://doi.org/10.3389/fenve.2025.1641277, 2025.
Sett, S., Bach, L. T., Schulz, K. G., Koch-Klavsen, S., Lebrato, M., and Riebesell, U.: Temperature Modulates Coccolithophorid Sensitivity of Growth, Photosynthesis and Calcification to Increasing Seawater pCO2, PLoS One, 9, e88308, https://doi.org/10.1371/journal.pone.0088308, 2014.
Soong, J. L., Fuchslueger, L., Marañon‐Jimenez, S., Torn, M. S., Janssens, I. A., Penuelas, J., and Richter, A.: Microbial carbon limitation: The need for integrating microorganisms into our understanding of ecosystem carbon cycling, Glob. Chang. Biol., 26, 1953–1961, https://doi.org/10.1111/gcb.14962, 2020.
Stachowski-Haberkorn, S., Becker, B., Marie, D., Haberkorn, H., Coroller, L., and de la Broise, D.: Impact of Roundup on the marine microbial community, as shown by an in situ microcosm experiment, Aquat. Toxicol., 89, 232–241, https://doi.org/10.1016/j.aquatox.2008.07.004, 2008.
Subhas, A. V., Rollins, N. E., Berelson, W. M., Dong, S., Erez, J., and Adkins, J. F.: A novel determination of calcite dissolution kinetics in seawater, Geochim. Cosmochim. Ac., 170, 51–68, https://doi.org/10.1016/j.gca.2015.08.011, 2015.
Subhas, A. V., Marx, L., Reynolds, S., Flohr, A., Mawji, E. W., Brown, P. J., and Cael, B. B.: Microbial ecosystem responses to alkalinity enhancement in the North Atlantic Subtropical Gyre, Frontiers in Climate, 4, https://doi.org/10.3389/fclim.2022.784997, 2022.
Suitner, N., Faucher, G., Lim, C., Schneider, J., Moras, C. A., Riebesell, U., and Hartmann, J.: Ocean alkalinity enhancement approaches and the predictability of runaway precipitation processes: results of an experimental study to determine critical alkalinity ranges for safe and sustainable application scenarios, Biogeosciences, 21, 4587–4604, https://doi.org/10.5194/bg-21-4587-2024, 2024.
Suitner, N., Hartmann, J., Varliero, S., Faucher, G., Suessle, P., and Moras, C. A.: Surface area and Ω-aragonite oversaturation as controls of the runaway precipitation process in ocean alkalinity enhancement, Biogeosciences, 23, 3965–3980, https://doi.org/10.5194/bg-23-3965-2026, 2026.
Sulpis, O., Boudreau, B. P., Mucci, A., Jenkins, C., Trossman, D. S., Arbic, B. K., and Key, R. M.: Current CaCO3 dissolution at the seafloor caused by anthropogenic CO2, P. Natl. Acad. Sci. USA, 115, 11700–11705, https://doi.org/10.1073/pnas.1804250115, 2018.
Traboni, C., Nocera, A. C., Romano, F., Courboulès, J., Chantzaras, C., Magiopoulos, I., Varliero, S., Basso, D., and Pitta, P.: Plankton do not care: Minimal effects of ocean liming on plankton growth and grazing in the Eastern Mediterranean, Limnol. Oceanogr., 70, https://doi.org/10.1002/lno.70136, 2025.
United Nations Framework Convention on Climate Change (UNFCC): NDC Synthesis Report, https://unfccc.int/ndc-synthesis-report-2022 (last access: 10 August 2026), 2022.
U.S. EPA: Standard Operating Procedure for In Vitro Determination of Chlorophyll a in Freshwater Phytoplankton by Fluorescence LG405, https://nepis.epa.gov/Exe/ZyNET.exe/P101AFBI.TXT?ZyActionD=ZyDocument&Client=EPA&Index=2011+Thru+2015&Docs=&Query=&Time=&EndTime=&SearchMethod=1&TocRestrict=n&Toc=&TocEntry=&QField=&QFieldYear=&QFieldMonth=&QFieldDay=&IntQFieldOp=0&ExtQFieldOp=0&XmlQuery=&File=D%3A%5Czyfiles%5CIndex%20Data%5C11thru15%5CTxt%5C00000046%5CP101AFBI.txt&User=ANONYMOUS&Password=anonymous&SortMethod=h%7C-&MaximumDocuments=1&FuzzyDegree=0&ImageQuality=r75g8/r75g8/x150y150g16/i425&Display=hpfr&DefSeekPage=x&SearchBack=ZyActionL&Back=ZyActionS&BackDesc=Results%20page&MaximumPages=1&ZyEntry=1&SeekPage=x&ZyPURL (last access: 12 August 2026), 2021.
Varliero, S., Buono, A., Caserini, S., Raos, G., and Macchi, P.: Chemical Aspect of Ocean Liming for CO2 Removal: Dissolution Kinetics of Calcium Hydroxide in Seawater, ACS Engineering Au, 4, 422–431, https://doi.org/10.1021/acsengineeringau.4c00008, 2024.
Walker, J. C. G., Hays, P. B., and Kasting, J. F.: A negative feedback mechanism for the long‐term stabilization of Earth's surface temperature, J. Geophys. Res.-Oceans, 86, 9776–9782, https://doi.org/10.1029/JC086iC10p09776, 1981.
Wani, R. P., Roper, D. L., Agrawal, R., Lim, E. J., Rollins, N. E., and Berelson, W. M.: Dataset for “The Impact of NaOH, CaO, and Ca2+ + HCO_3∧- Addition on PIC and POC Formation in Los Angeles Harbor Waters”, Zenodo [data set], https://doi.org/10.5281/zenodo.20059856, 2026.
Wolf, S. E., Leiterer, J., Kappl, M., Emmerling, F., and Tremel, W.: Early Homogenous Amorphous Precursor Stages of Calcium Carbonate and Subsequent Crystal Growth in Levitated Droplets, J. Am. Chem. Soc., 130, 12342–12347, https://doi.org/10.1021/ja800984y, 2008.
Wolf-Gladrow, D. and Riebesell, U.: Diffusion and reactions in the vicinity of plankton: A refined model for inorganic carbon transport, Mar. Chem., 59, 17–34, https://doi.org/10.1016/S0304-4203(97)00069-8, 1997.
Zachos, J. C., Röhl, U., Schellenberg, S. A., Sluijs, A., Hodell, D. A., Kelly, D. C., Thomas, E., Nicolo, M., Raffi, I., Lourens, L. J., McCarren, H., and Kroon, D.: Rapid Acidification of the Ocean During the Paleocene-Eocene Thermal Maximum, Science, 308, 1611–1615, https://doi.org/10.1126/science.1109004, 2005.
Zondervan, I., Zeebe, R. E., Rost, B., and Riebesell, U.: Decreasing marine biogenic calcification: A negative feedback on rising atmospheric pCO 2, Global Biogeochem. Cy., 15, 507–516, https://doi.org/10.1029/2000GB001321, 2001.
- Abstract
- Introduction
- Materials & Methods
- Results
- Discussion
- Conclusions
- Appendix A: Summary of data from “Dark-Bottles” during alkalinity enhancement experiments
- Appendix B: CaCO3 precipitation after OAE
- Data availability
- Author contributions
- Competing interests
- Disclaimer
- Acknowledgements
- Financial support
- Review statement
- References
- Abstract
- Introduction
- Materials & Methods
- Results
- Discussion
- Conclusions
- Appendix A: Summary of data from “Dark-Bottles” during alkalinity enhancement experiments
- Appendix B: CaCO3 precipitation after OAE
- Data availability
- Author contributions
- Competing interests
- Disclaimer
- Acknowledgements
- Financial support
- Review statement
- References