
the Creative Commons Attribution 4.0 License.
the Creative Commons Attribution 4.0 License.
 | 21 Aug 2026
Oxygen minimum zones in the Indian Ocean and their response to changes in the Indian Ocean meridional circulation
Eugene Odion Oboh
Niko Lahajnar
Birgit Gaye
Avanti Shrikumar
Tim Rixen
The Oxygen Minimum Zones (OMZs) in the northern Indian Ocean (i.e., the Arabian Sea and the Bay of Bengal) are among the most intense OMZs in the world's oceans. While there has been no clear evidence of a significant change in the Bay of Bengal OMZ (BoB OMZ), the Arabian Sea OMZ (AS OMZ) followed a global trend and expanded in the last decades until 2013. However, this trend has reversed, and the AS OMZ appears to have shrunk since 2013. The processes that stabilize the OMZ in the Bay of Bengal and regulate its expansion and contraction in the Arabian Sea are poorly understood. In this study, we redefined the source water types (SWTs) and employed an extended optimum multi-parameter (eOMP) analysis to investigate changes in the oxygen supply due to mixing and biological oxygen consumption in these OMZs based on empirical data from the Global Ocean Data Analysis Project version 2 (GLODAPv2) and data from a research cruise conducted with the German research vessel SONNE in 2024. In line with previous studies, our findings reveal a reversal in the expansion trend of the AS OMZ and an increase in oxygen supply to the BoB OMZ between 1995 and recent years. In both OMZs, this was due to an increased northward influx of oxygen-rich SWTs from the southern Indian Ocean, combined with a reduced contribution from relatively oxygen-poor local and equatorial SWTs. We also observed that the increased physical oxygen supply was accompanied by enhanced biological oxygen consumption, which partly offset the effect of this increase on the oxygen concentration in the OMZs. These changes are likely linked to a reorganization and slowdown of the shallow Indian Ocean meridional overturning circulation (IO-MOC), associated with the weakening of the Asian monsoon and the global thermohaline circulation (THC). This slowdown seems to have increased the residence time of water masses, which is consistent with the observed increase in biological oxygen consumption, whereas the weaker cross-equatorial circulation appears to have favored the northward meridional transport of oxygen-rich water from the southern Indian Ocean. This suggests a coupling between the OMZs in the Indian Ocean and climate-driven changes in the THC, as also indicated by palaeoceanographic records. However, the climate-related drivers differ between the past and present.
- Article
(7822 KB) - Full-text XML
-
Supplement
(2514 KB) - BibTeX
- EndNote


The decline in dissolved oxygen concentrations is one of the greatest threats to the ocean (Breitburg et al., 2018; Oschlies et al., 2018; Schmidtko et al., 2017). It affects biogeochemical cycles, endangers marine ecosystems, and ultimately threatens food security because many economically relevant marine organisms require oxygen to survive (Stramma et al., 2008, 2010). This so-called ocean deoxygenation is primarily attributed to global warming and the associated warming of ocean water, which reduces the solubility of oxygen in it (Benson and Krause, 1980; Stramma et al., 2008; Bopp et al., 2017). Oxygen minimum zones (OMZs) develop mainly below the surface mixed layer at water depths of approximately 100–600 m as a consequence of the interplay between physical oxygen supply and biological oxygen consumption (Sverdrup, 1938). The production of organic matter by phytoplankton, its subsequent export, and its respiration by bacteria and zooplankton below the photic zone control oxygen consumption (Sigman and Hain, 2012; Malone et al., 2015; Rixen et al., 2020). The primary mechanisms supplying oxygen to OMZs are the intrusion of former well-oxygenated surface waters through vertical mixing, variations in the surface mixed layer depth (MLD), eddy-induced subduction, as well as subduction and transport of former surface waters along density surfaces at frontal zones (Duteil and Oschlies, 2011; Rudnickas et al., 2019; Sarmiento et al., 2004).
Source water types (SWTs) that ventilate OMZs at lower latitudes are formed at high latitudes in association with deep and mode-water formation (Broecker, 1991; Sarmiento et al., 2004). They are also formed in regions where evaporation or cooling increases the density of the surface water until it becomes denser than the water below and sinks (Reichart et al., 2002). Owing to the continuous remineralization of organic matter exported to the water column, oxygen concentrations generally decline as water masses age, with “age” referring to the time elapsed since the water lost contact with the atmosphere (Jeansson et al., 2021; Olsen et al., 2019). Consequently, an increase in water age associated with prolonged residence times within the OMZ can enhance oxygen consumption, quantified as the difference between the in situ oxygen concentration and the salinity- and temperature-dependent oxygen saturation concentration. Additionally, an increase in the local export of organic carbon can have the same effect (Rixen et al., 2020; Rixen and Ittekkot, 2005; Cavan et al., 2017).
The most intense OMZs in the open ocean occur in the eastern tropical Pacific Ocean, Arabian Sea, and the Bay of Bengal. The latter two are semi-enclosed basins in the northern Indian Ocean, where dissolved oxygen levels drop below 20 µmol kg−1 (Rixen et al., 2020; Schulz et al., 2025; Acharya and Panigrahi, 2016). This threshold marks the transition from hypoxia to microbial hypoxia, where oxygen concentrations are not only low enough to adversely affect the performance of higher organisms such as fish (Ekau et al., 2010; Vaquer-Sunyer and Duarte, 2008), but also low enough to enable anoxic microbial processes such as the reduction of nitrate to N2 (Rixen et al., 2020). Climate projections under all “Shared Socioeconomic Pathways (SSPs)” predict a decrease in the globally averaged OMZ dissolved oxygen concentration (i.e., water depths between 100 and 600 m), whereas regional projections show considerable variation (Kwiatkowski et al., 2020). In particular, the largest decreases in dissolved oxygen concentrations are expected at higher latitudes, whereas rising concentrations are projected in equatorial regions. In the Indian Ocean, increasing equatorial oxygen concentrations have been associated with decreasing oxygen consumption and enhanced inflow of oxygen-enriched water masses from the southern Indian Ocean gyre (Kwiatkowski et al., 2020; Ditkovsky et al., 2023). However, the northern Arabian Sea appears to be an exception, with predictions indicating that the OMZ will intensify in the future (Kwiatkowski et al., 2020; Ditkovsky et al., 2023).
In line with model results, data collected prior to 2007 revealed an expansion of the AS OMZ (Banse et al., 2014; Goes et al., 2020; Rixen et al., 2014) due to both reduced ventilation and increased oxygen consumption. The former was related to warming, and thus a decline in the inflow of Persian Gulf Water (PGW) into the AS OMZ (Lachkar et al., 2019), and the latter was assumed to be a consequence of enhanced biological productivity in surface water in response to an assumed intensification of the Asian summer monsoon (Lachkar et al., 2018). The monsoon-driven upwelling of nutrient-rich deep waters in summer, in addition to the deepening of the mixed layer in winter, is responsible for the overall high biological productivity of the Arabian Sea and the associated export of organic matter (Brock et al., 1992; Haake et al., 1993; Rixen et al., 2019). However, in contrast to the observed and projected expansion of the AS OMZ, a recent Argo float study showed that the AS OMZ has been shrinking since 2013 due to a decline in surface ocean productivity (Liu et al., 2024). Additionally, recent studies have noted that changes in ventilation pathways may enhance oxygen supply to the AS OMZ (Oschlies et al., 2017; Vallivattathillam et al., 2023; Lachkar et al., 2019; Narvekar et al., 2025). In particular, shifts in the balance between cross-equatorial transport driven by the Indian Ocean meridional overturning circulation (IO-MOC) and the Indonesian Throughflow (ITF) alter the relative contributions of local (i.e., originating from the Arabian Sea and Bay of Bengal), equatorial, and remote (southern-sourced) SWTs (Ditkovsky et al., 2023). Nevertheless, the BoB OMZ has remained relatively stable (Johnson et al., 2019; Nayak et al., 2024) as physical forcing mechanisms, including salinity stratification and the occurrence of cyclonic and anticyclonic eddies, seem to have balanced the potential changes in oxygen consumption and remote oxygen supply (Sridevi and Sarma, 2020; Bhaskar et al., 2021).
However, OMZs in the northern Indian Ocean are poorly represented in climate models (Rixen et al., 2020; Vallivattathillam et al., 2023) owing to uncertainties in nearly all processes that affect their ventilation (Schmidt et al., 2021). Therefore, the scope of this study was to investigate changes in the AS and BoB OMZs between 1995 and recent years (i.e., 2016, 2018, 2019, and 2024) using empirical data. The primary objective was to determine how changes in the fraction of SWTs in the OMZs might have triggered the trend reversal of the OMZ in the Arabian Sea after 2013 and contributed to the stability of the BoB OMZ. Therefore, we redefined (i) SWTs, (ii) quantified their contribution to the OMZs using an extended optimum multi-parameter (eOMP) analysis, (iii) quantified the physical oxygen supply, and (iv) biological oxygen consumption, as well as temporal shifts between 1995 and recent years.
1.1 Study Area
The Indian Ocean differs from other ocean basins primarily due to its geographical characteristics, which have far-reaching consequences for atmospheric and oceanic circulation. The first unique geographical feature is the Asian landmass. It limits the northern extent of the Indian Ocean in the subtropics at approximately 30° N and enforces the development of the Asian monsoon. The monsoon is characterized by seasonal changes in wind direction, southwest (SW) in summer and northeast (NE) in winter (Gadgil et al., 2007), leading to an overall clockwise surface circulation in the ocean in summer and a counterclockwise surface circulation in winter (Fig. 1) (Wyrtki, 1973; Phillips et al., 2021; Schott et al., 2009). The Southwest Monsoon Current, in turn, carries Arabian Sea Water into the Bay of Bengal in summer, whereas the Northeast Monsoon Current transports Bay of Bengal Water into the Arabian Sea in winter (Fig. 1).
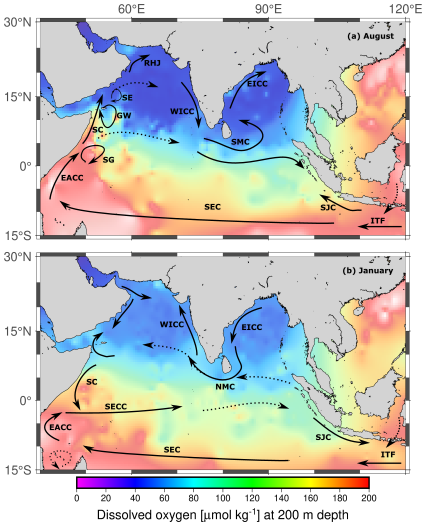
Figure 1Surface currents in the Indian Ocean during (a) the summer monsoon in August and (b) the winter monsoon in January. Modified from Schott et al. (2009). Abbreviations: Somali current (SC), South Equatorial Current (SEC), East African Coastal Current (EACC), Southern Gyre (SG), Socotra Eddy (SE), Great Whirl (GW), Southwest Monsoon Current (SMC), East Indian Coastal Current (EICC), Northeast Monsoon Current (NMC), West Indian Coastal Current (WICC), Indonesian Throughflow (ITF), Ras al Hadd jet (RHJ), South Java Current (SJC).
Another unique feature of the Indian Ocean is the Indonesian Archipelago, which allows the Indonesian Throughflow Water (ITFW) to flow from the Pacific into the Indian Ocean. It represents the only connection between major ocean basins at low latitudes (Gordon et al., 2003, 2010) and connects to the outflow of water from the Indian Ocean into the Atlantic Ocean through Agulhas leakage (Durgadoo et al., 2017; Gordon, 1986). Both the Agulhas leakage and the ITF act as bottlenecks within the surface water return flow of the global thermohaline circulation (THC, circulation linking the Atlantic, Indian, and Pacific basins via the ITF and Agulhas leakage) (Durgadoo et al., 2017; Broecker, 1991). The strength of the ITF is sensitive to climate variability, and it plays a key role in regulating heat and water mass exchange between the two ocean basins. The ITF also influences the composition of thermocline waters in both basins, as well as the strength of the Agulhas Current (AC) and South Equatorial Current (SEC) in the Indian Ocean (Gordon et al., 2010; Ditkovsky et al., 2023; Lee et al., 2002; Godfrey, 1996). According to numerical model results, blockage of the ITF weakens the SEC and AC (Lee et al., 2002).
Contrary to the Atlantic and Pacific Oceans, where major eastern boundary upwelling systems exist off California, NW Africa, Peru, and Namibia/South Africa, the only, but much weaker, upwelling system in the eastern Indian Ocean (EIO) develops off South Java and Bali (Susanto et al., 2001; Chavez and Messié, 2009; Rixen et al., 2006). However, driven by strong SW monsoon winds, a coastal upwelling system emerges along the Arabian Peninsula in summer, with an intensity comparable to that of the eastern boundary upwelling systems in other ocean basins (Sastry and D'Souza, 1972; Brock et al., 1991; Rixen et al., 2019). In summer, weaker but upwelling-favorable winds also occur along the Indian coasts in the Arabian Sea and the Bay of Bengal (Abbott and Mahadevan, 2024; Sharma, 1978; Shetye et al., 1990).
The large-scale meridional transport of water masses in the Indian Ocean is governed by the IO-MOC. It consists of shallow and deep overturning cells, with the shallow cell encompassing the upper 300–450 m and the deep cell water masses below this depth range (Schott and McCreary, 2001; Stramma et al., 2002). The shallow IO-MOC is controlled by monsoon-driven upwelling in the northern Indian Ocean and the formation and subduction of subsurface water masses, primarily near the Subantarctic Front in the south (Schott and McCreary, 2001). The high-salinity Subtropical Surface Water (STSW) forms preferentially north of the Subantarctic Front between 25 and 35° S and at approximately 90° E (Wyrtki et al., 1971; Beal et al., 2006). In contrast, south of the Subantarctic Front, at around 50–40° S, cool, low-salinity water is subducted below the warmer, lighter subtropical water masses (Fine, 1993; Koch-Larrouy et al., 2010; Talley, 1996). These bodies of water are called Subantarctic Mode Water (SAMW) and Antarctic Intermediate Water (AAIW), the latter of which is the deepest of these mode waters. It enters the Indian Ocean through the western boundary at approximately 47–39° S and 45–80° E (Fine, 1993; You, 1998). The deep IO-MOC comprises an intermediate limb ventilated by AAIW and an abyssal limb supplied by the Antarctic Bottom Water (AABW) (Schott and McCreary, 2001; Talley, 2013; Haine et al., 1998). The AABW forms around the Antarctic continental margins (Menezes et al., 2017) and enters the Indian Ocean through the Crozet-Kerguelen gap at depths below 2000 m. Since the AABW undergoes significant modification due to mixing in the abyssal Indian Ocean, it is referred to as modified Antarctic Bottom Water (mAABW) (Mantyla and Reid, 1995). Preferentially in spring, a non-upwelling season, when the Arabian Sea begins to warm and the winter MLD flattens, the Arabian Sea High Salinity Water (ASHSW) forms. This water mass typically occurs at depths between 0 and 100 m in the Arabian Sea (Kumar and Prasad, 1999). In addition, Red Sea Water (RSW) and Persian Gulf Water (PGW) from marginal seas flow through the Gulf of Aden and Gulf of Oman into the Arabian Sea at intermediate depths of approximately 300–1000 m and 250–300 m, respectively (Beal et al., 2000; Bower et al., 2000; Tchernia, 1980). The Bay of Bengal Water (BoBW) is another SWT that forms in the northern Indian Ocean within the strongly stratified upper surface of the Bay of Bengal, where excessive freshwater input from the Ganga and Brahmaputra rivers together with high precipitation produces a warm, low-salinity surface layer usually around 100 m depth (Shetye et al., 1996). The influence of the fresh BoBW extends up to 300 m, marked by a salinity maximum of about 35 (Shetye et al., 1996). SWTs described above can be referred to as primary source waters and differ from secondary mixtures, such as the Arabian Sea Water (ASW) found in the northern Indian Ocean, which originates from mixing between RSW and PGW in the Arabian Sea (You and Tomczak, 1993).
The Indian Ocean is also affected by climate anomalies such as the El Niño-Southern Oscillation (ENSO) (e.g. Bjerknes, 1966, 1969) and Indian Ocean Dipole (IOD) (Saji et al., 1999; Webster et al., 1999). ENSO has far-reaching consequences for the global and coupled circulations of the atmosphere and ocean, and it is often described in terms of sea surface temperature (SST) anomalies in the equatorial Pacific Ocean (https://psl.noaa.gov/data/timeseries/month, last access: 11 April 2026). The IOD describes anomalies in the difference between SSTs in the EIO and the western Indian Ocean (WIO). Both the IOD and ENSO influence upwelling in the EIO (Rixen et al., 2006; Abram et al., 2003).
2.1 Data collection
The data used in this study were obtained from the GLODAPv2 database (Lauvset et al., 2022; Olsen et al., 2019) and from a cruise with the German research vessel SONNE in the Indian Ocean in 2024 (hereafter referred to as cruise data) (Gaye et al., 2024). The GLODAPv2 data consist of 1995 and 2018 transects in the WIO, 1995 and 2016 transects in the EIO, and 1995 and 2019 transects in the central equatorial Indian Ocean (i.e., central Indian Ocean, CIO) (Fig. 2). We focused on the WIO and EIO transects because they protrude into the northern Indian Ocean OMZs and are therefore important in representing the AS and BoB OMZs. The GLODAPv2 data provide oceanographic data from the surface to a depth of 4000 m and include key parameters such as temperature, salinity, and concentrations of dissolved oxygen, nitrate, phosphate, and silicate. We specifically used the merged data product from GLODAPv2, which has undergone extensive quality control, including systematic bias evaluation and correction for calibration and measurement errors (Olsen et al., 2019). In addition to GLODAPv2, we incorporated cruise data collected near the equator in the CIO.
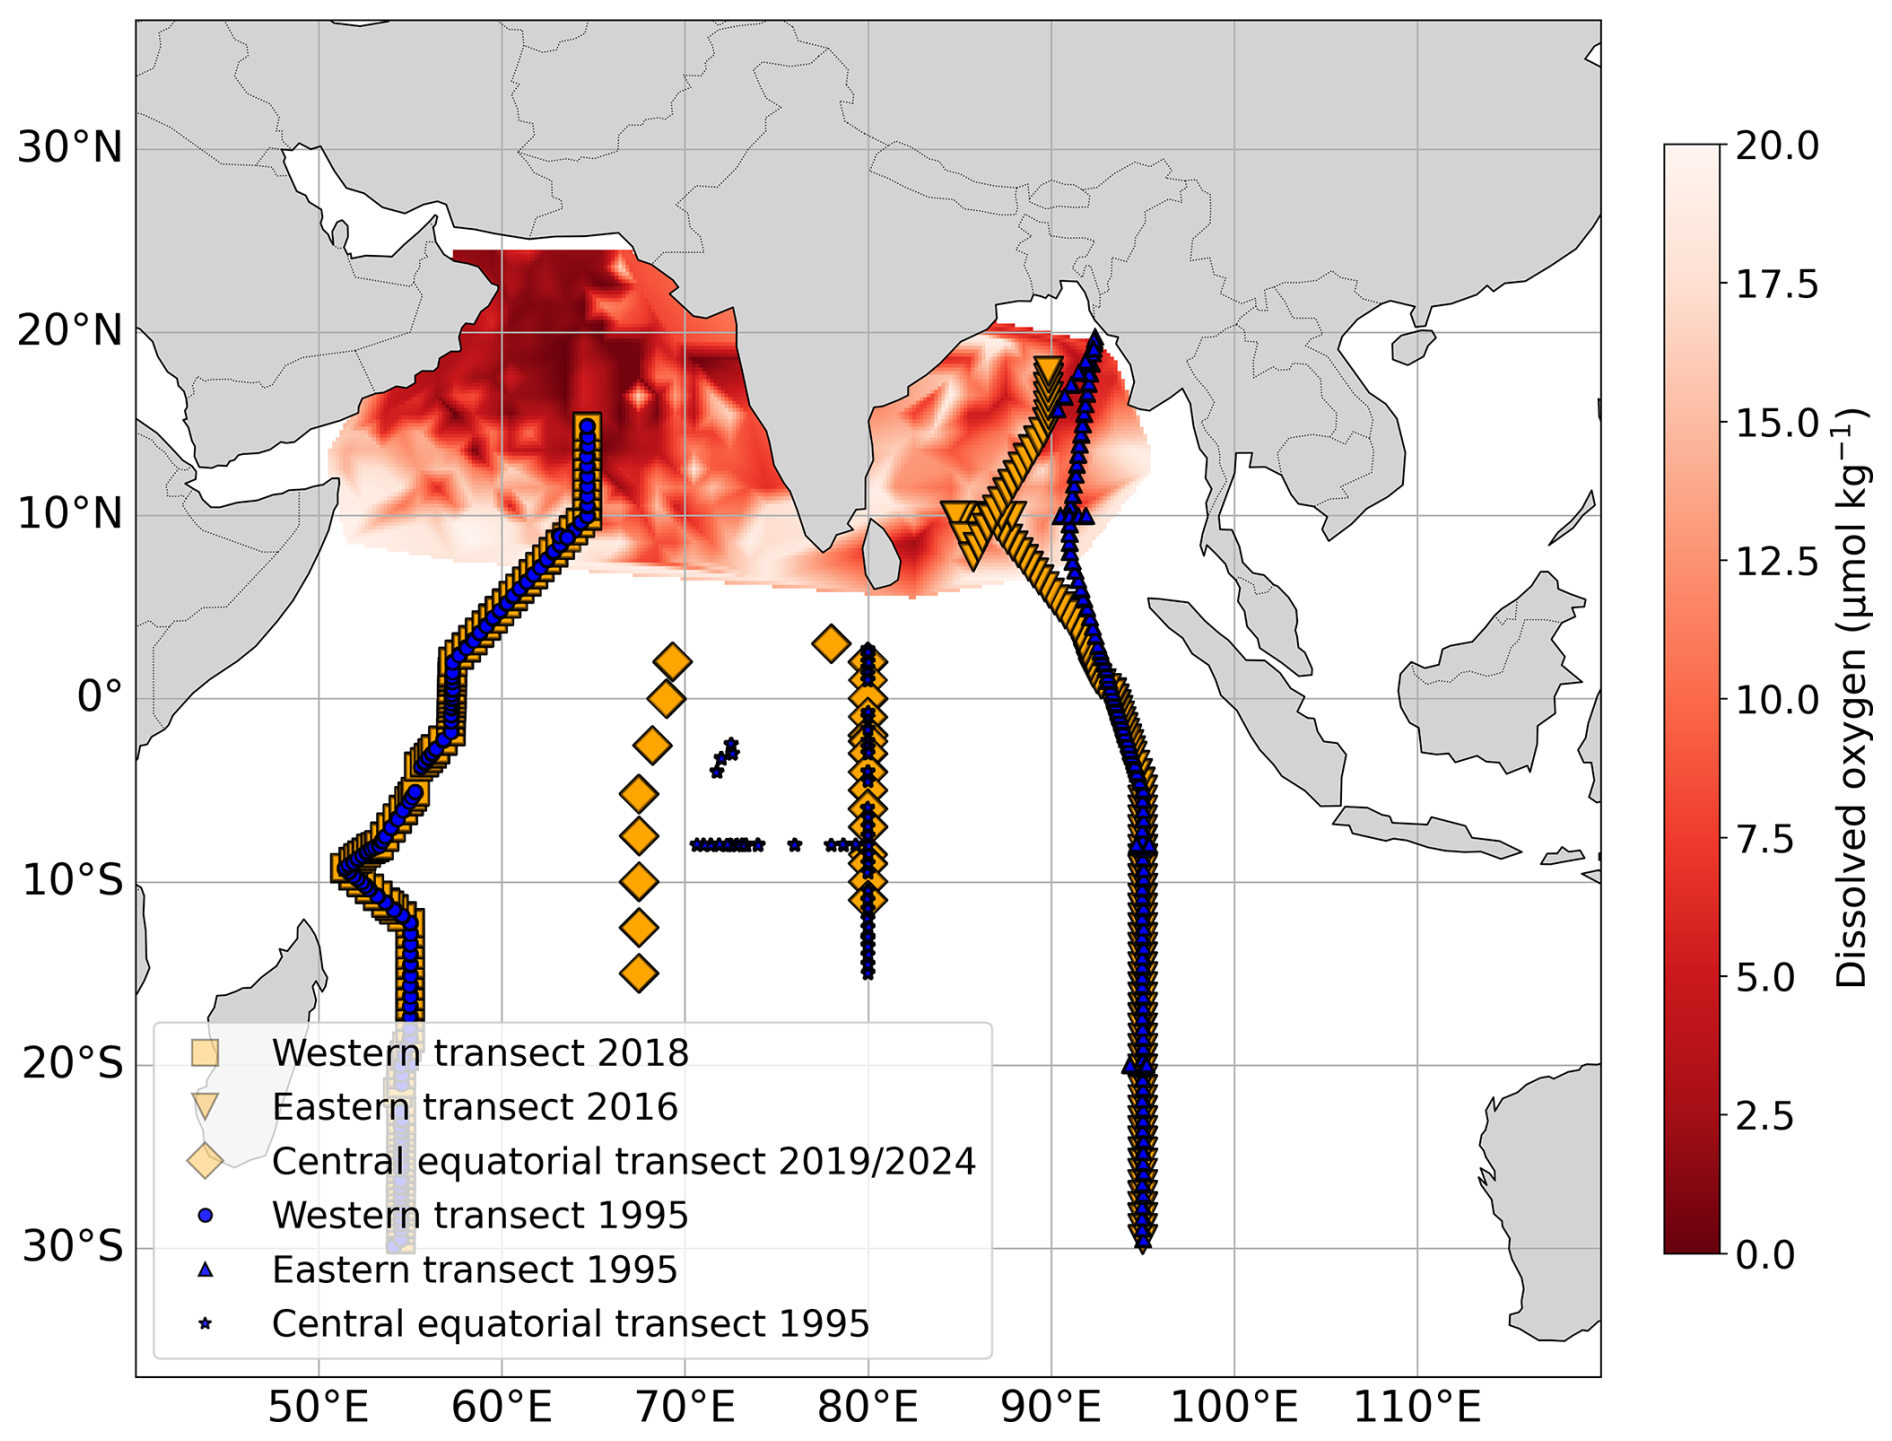
Figure 2Data transect used for extended optimum multi-parameter (eOMP) analysis. Western transect (WIO, 1995 and 2018 GLODAPv2 data), eastern transect (EIO, 1995 and 2016 GLODAPv2 data), central equatorial transects (CIO, 1995 GLODAPv2 data), and central equatorial transect (combination of 2024 cruise data and 2019 GLODAPv2 data). The red color indicates the extent of the Arabian Sea and Bay of Bengal oxygen minimum zone cores (O2<20 µmol kg−1) plotted from the WOA data. Solid rectangles highlight the portions of the transects used to estimate the OMZs core (O2<20 µmol kg−1) based on the GLODAPv2 data.
The entire WIO and EIO transects were analyzed over a depth range of 150–1200 m. This filtering enabled us to exclude upper ocean surface waters with high variability and focus on intermediate depths, which align with the depth range of OMZs. Furthermore, we defined the core of the OMZs within the transects as regions where the dissolved oxygen concentration fell below 20 µmol kg−1. This corresponds to depths of 150–1000 m for the AS OMZ and 150–700 m for the BoB OMZ. For the central equatorial region, we compared the 1995 GLODAPv2 data with a combination of the 2019 GLODAPv2 and 2024 cruise data (Fig. 2). The latter two were combined to increase the dataset size.
2.1.1 Primary productivity, sea surface temperature data and climate indices
Ocean primary productivity data from Kulk et al. (2020) were used to analyze productivity in the Arabian Sea and the equatorial Indian Ocean. The data were accessed on 26 March 2025 (https://catalogue.ceda.ac.uk/uuid/69b2c9c6c4714517ba10dab3515e4ee6/) and consist of monthly global marine phytoplankton primary production data at a 9 km resolution between 1998 and 2020. These data were filtered for the Arabian Sea (5–25° N, 50–75° E) and equatorial Indian Ocean (8° S–8° N, 55–85° E), and the annual mean was plotted to observe the trend (Supplement Fig. S1). Similarly, sea surface temperature (SST) data from NOAA were accessed on 20 July 2025 (https://psl.noaa.gov/data/gridded/data.noaa.oisst.v2.highres.html). It consists of weekly mean SST data from 1981 to 2025 at a spatial resolution of 0.25°. We filtered these data for the Indian Ocean region (30° N–30° S, 30–120° E) and plotted the yearly mean and 5-year running mean SST to observe the trend across the Indian Ocean (Supplement Fig. S2). Furthermore, the Oceanic Niño Index (ONI) and IOD or Dipole Mode Index have been downloaded from https://psl.noaa.gov/data/timeseries/month/ (last access: 11 April 2026). The ONI represents SST anomalies in the tropical Pacific Ocean (5° N–5° S, 120–170° W), and the IOD shows an anomalous SST gradient between the WIO (50–70° E and 10° S–10° N) and EIO (90–110° E and 10° S–0° N).
2.2 Source water types selection and definition
It is important to precisely define the SWTs' properties when performing eOMP analysis, as this method uses SWT characteristics to quantify mixing proportions and biogeochemical processes, representing a water sample as a linear combination of different SWTs (Shrikumar et al., 2022; Tomczak and Large, 1989). SWT is an identifiable body of water with distinct physical and chemical properties (e.g., temperature, salinity, and concentrations of oxygen and nutrients) that originates from a specific formation region and has a specific mixing history (Tomczak, 1999).
Defining SWTs in the Indian Ocean is challenging. Many studies rely on secondary rather than primary SWTs (Acharya and Panigrahi, 2016; Ditkovsky et al., 2023; Narvekar et al., 2025). Following the definition of water mass ages (Jeansson et al., 2021; Olsen et al., 2019), a primary SWT forms when water enters the ocean interior and becomes decoupled from atmospheric influences. Therefore, impacts of deeper water masses on the properties of the SWT, due to vertical and lateral mixing, cannot be ruled out. However, secondary SWTs are mixtures, such as ASW, which is a mixture of RSW and PGW as mentioned earlier. We focused on primary SWTs because they are essentially responsible for OMZs ventilation and carry the influence of global warming on their properties into the depths of the ocean.
However, we did not include the Indian Central Water (ICW) and SAMW as separate SWTs in the eOMP analysis, because, although ICW is formed by subduction in the Subtropical Front and advected northward (You and Tomczak, 1993), it is not considered as an independent principal water mass as it mixes with STSW and is identified by a mixing T/S line connecting AAIW and STSW (Schott and McCreary, 2001). Additionally, it can get diluted with ASW, BoBW, and ITFW (Gordon et al., 1997). SAMW, on the other hand, share the same density class and overlap with AAIW (Koch-Larrouy et al., 2010).
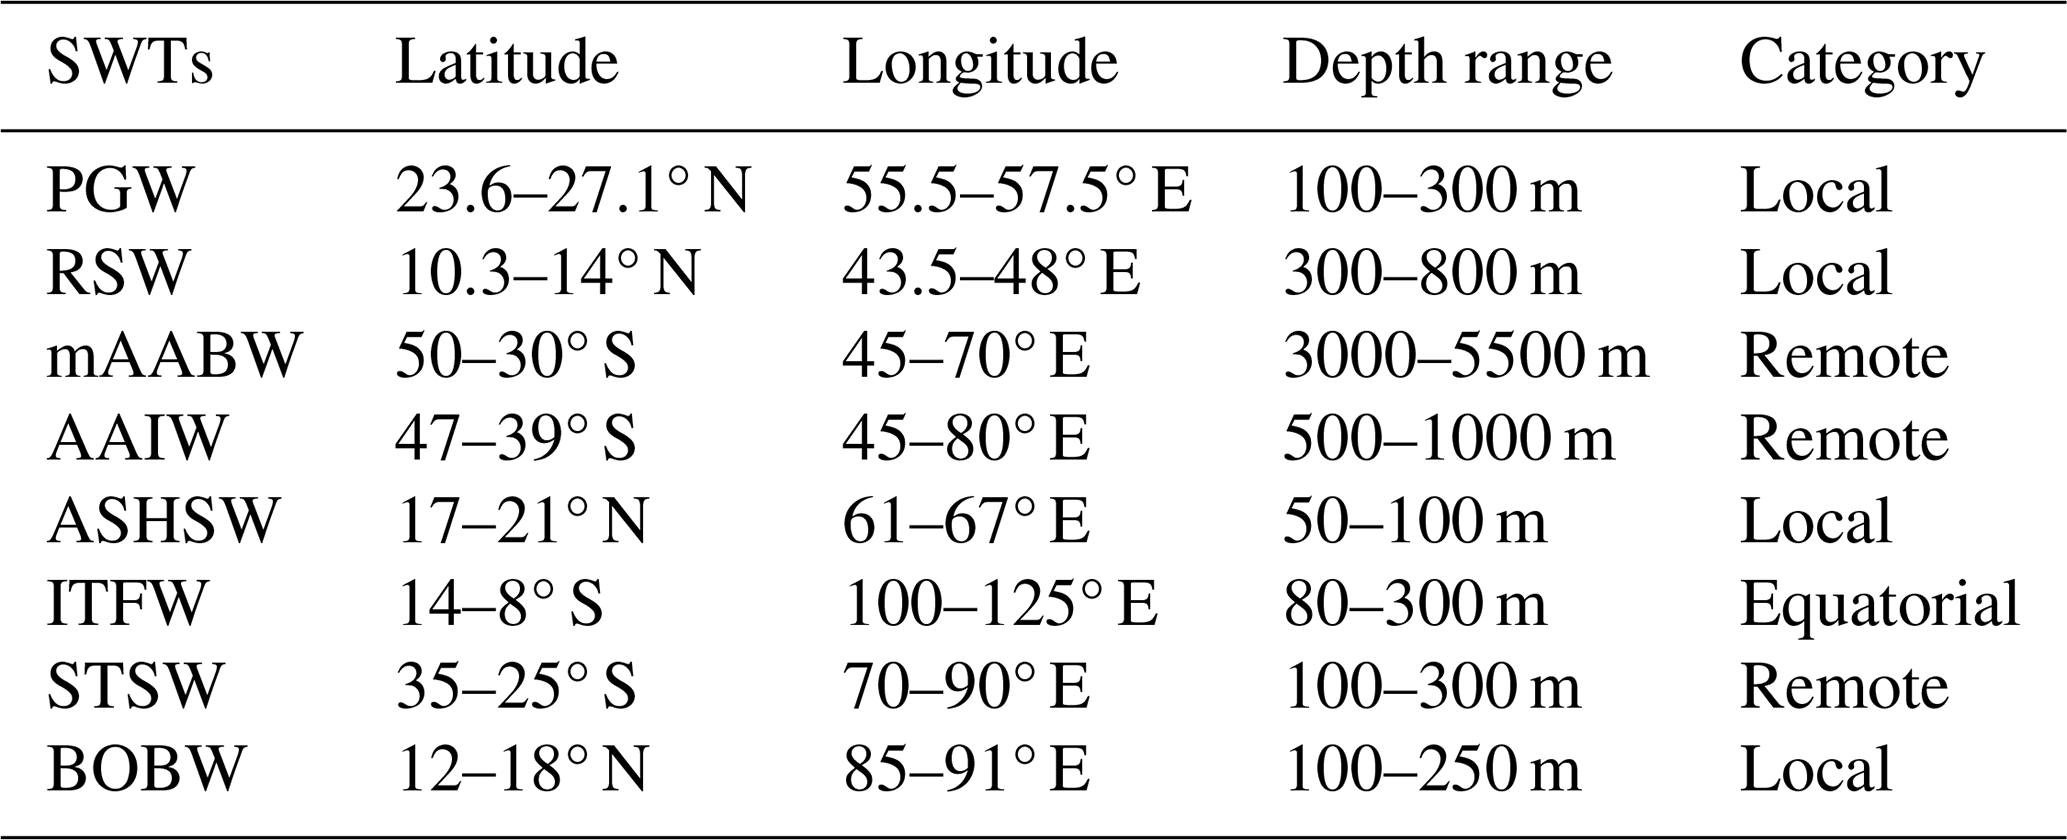
The properties of primary SWTs must be defined at their sites of origin, including a geographic area, characteristic depth range, and, in some cases, a specific time of the year. These variables are not precisely constrained and may shift in response to climate change; therefore, they are typically estimated to the best of our knowledge. Based on a literature review, we summarized the specific latitude, longitude, and depth ranges for all SWTs relevant to the OMZs ventilation in the northern Indian Ocean in Table 3 and marked the region of origin/definition in Fig. 3.
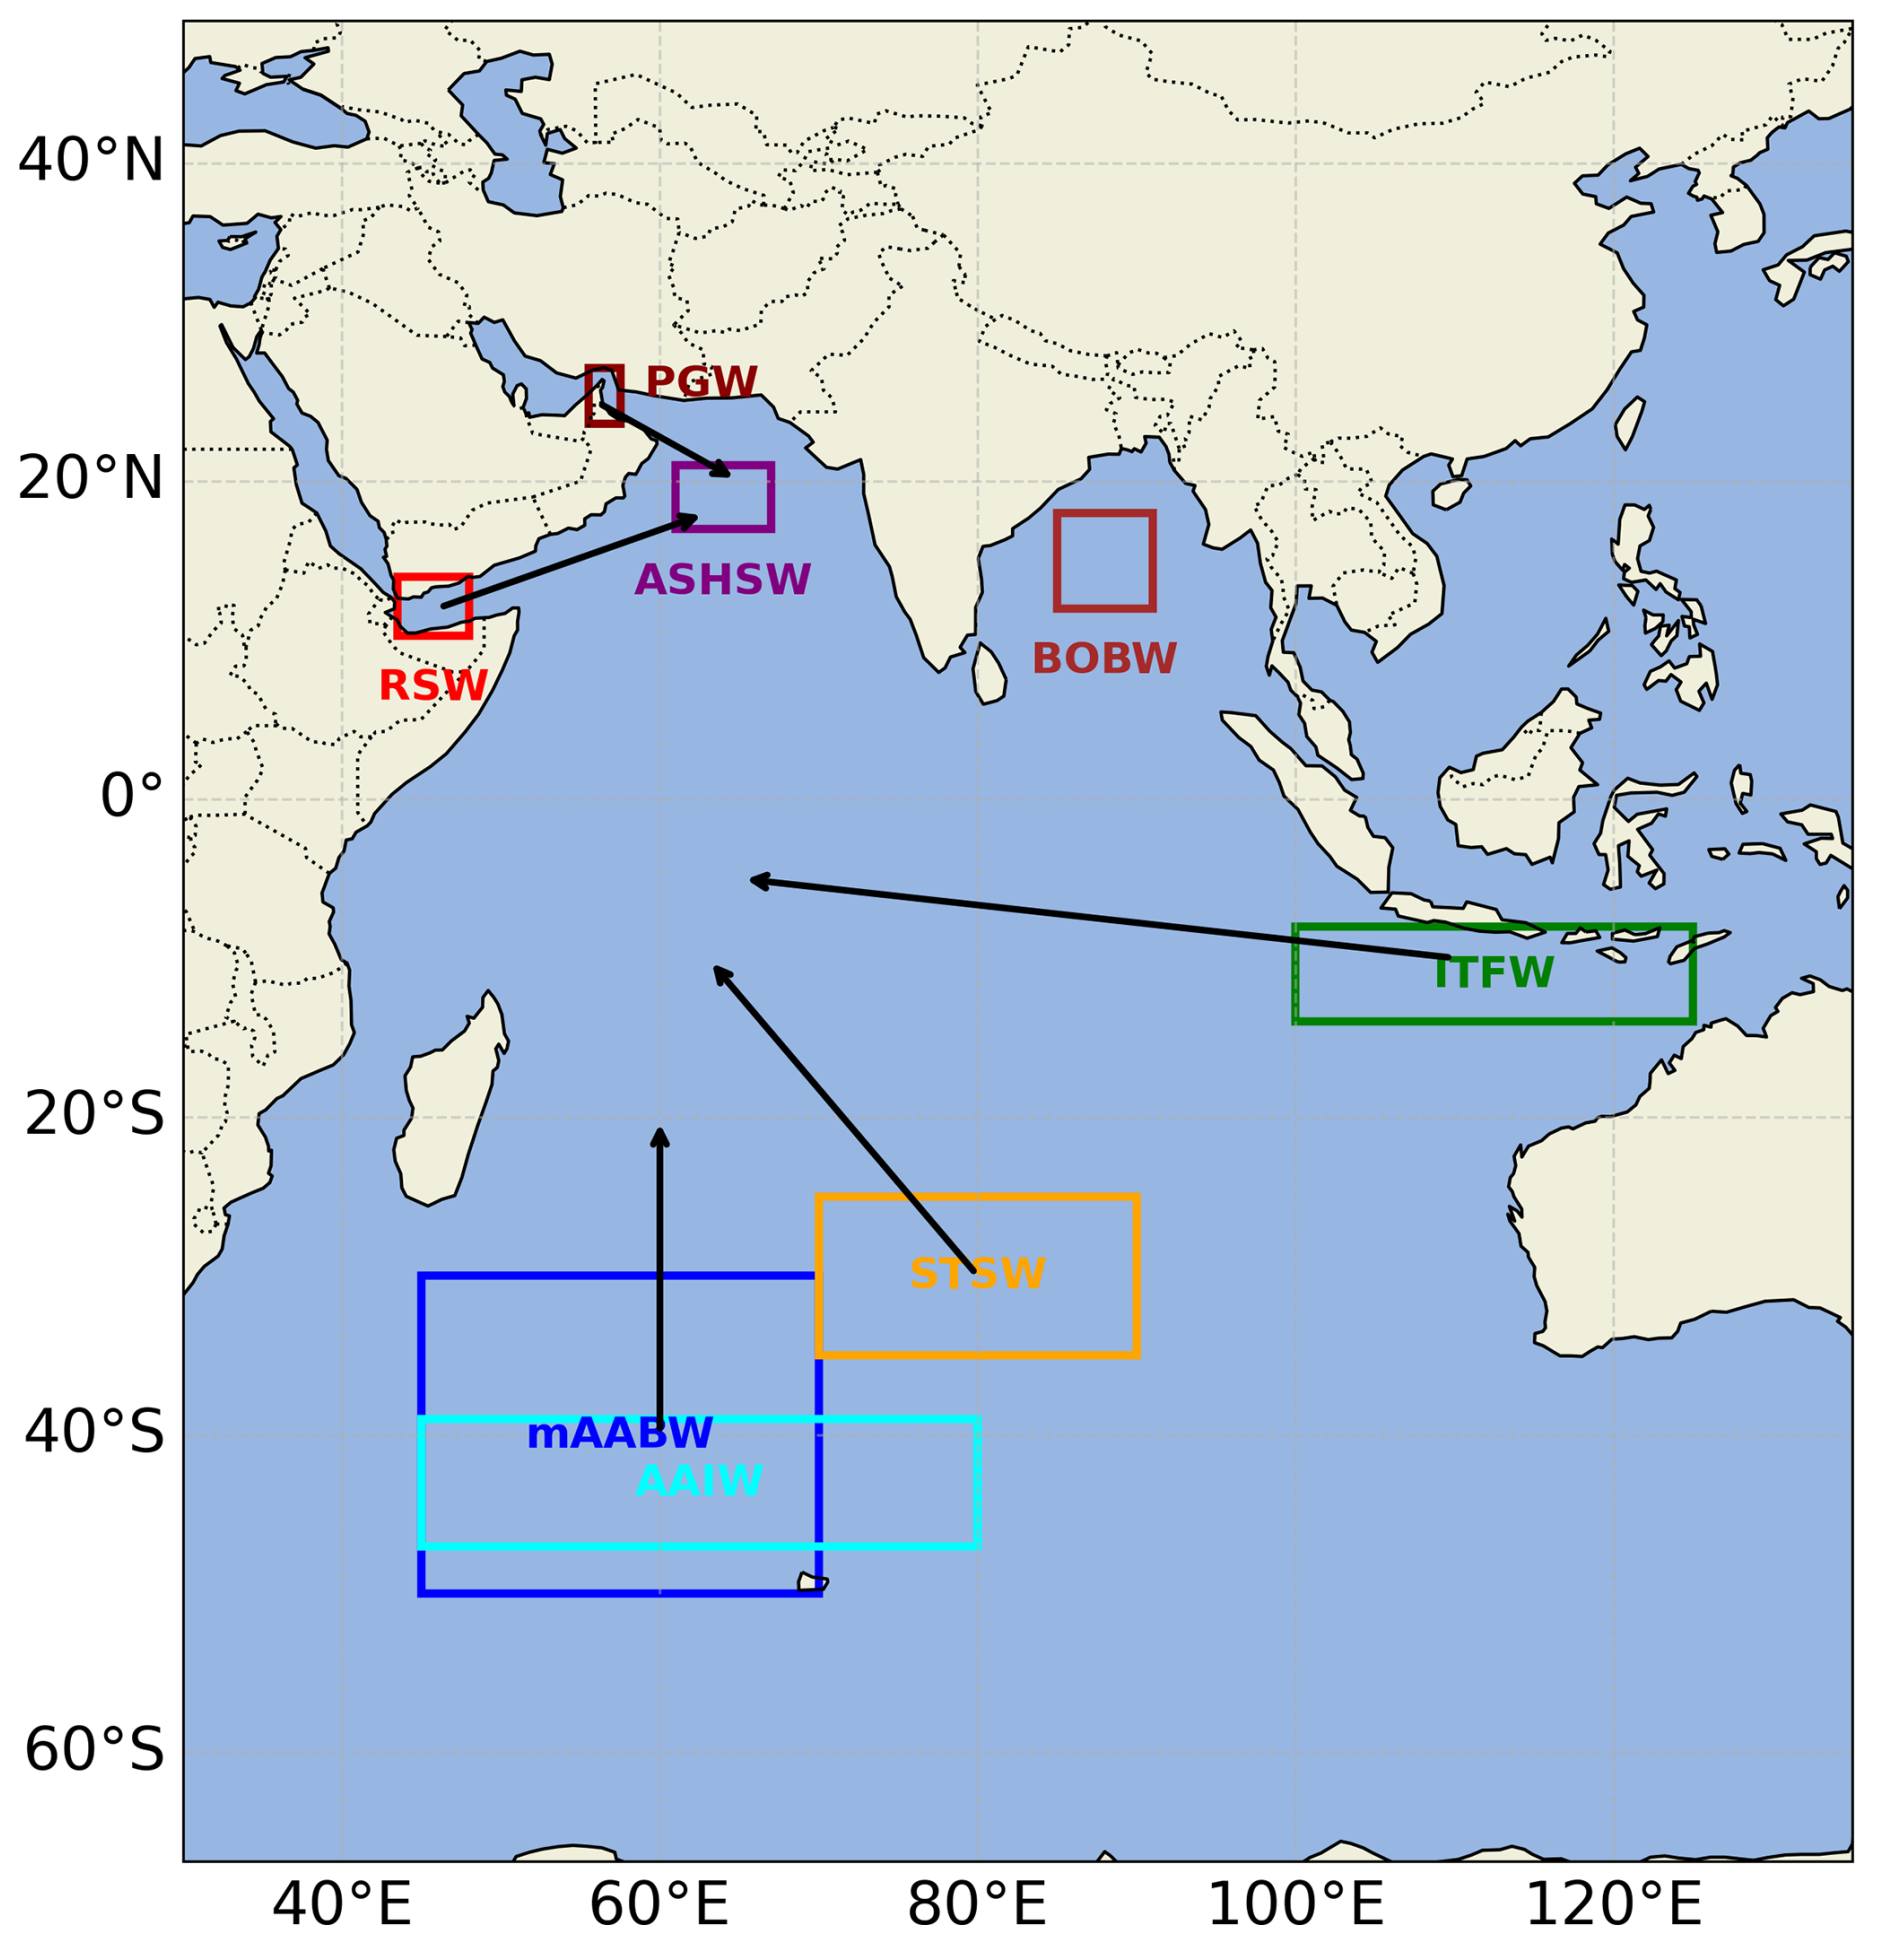
Figure 3Source water types used in the study; colored rectangular boxes represent regions (latitudes and longitudes) where their properties were defined and the direction of flow (black arrow). Persian Gulf Water (PGW), Red Sea Water (RSW), Arabian Sea High Salinity Water (ASHSW), Bay of Bengal Water (BOBW), Indonesian Throughflow Water (ITFW), Subtropical Surface Water (STSW), Antarctic Intermediate Water (AAIW), modified Antarctic Bottom Water (mAABW).
Eight SWTs were selected for our initial analyses: Persian Gulf Water (PGW), Subtropical Surface Water (STSW), modified Antarctic Bottom Water (mAABW), Indonesian Throughflow Water (ITFW), Antarctic Intermediate Water (AAIW), Arabian Sea High Salinity Water (ASHSW), Red Sea Water (RSW), and Bay of Bengal Water (BOBW), as they are known to influence the OMZ in the Indian Ocean (Chinni et al., 2019; Sabu et al., 2015; Singh et al., 2012; Yu et al., 2018; Song et al., 2004; Beal et al., 2000; Bower et al., 2000; Prasad et al., 2001; Shee et al., 2023).
Out of the eight selected SWTs for our initial analyses, the mAABW is an exception. It enters the Indian Ocean not as a primary SWT but as a deep-water mass that, as mentioned before, undergoes significant modification through mixing in the abyssal Indian Ocean (Mantyla and Reid, 1995). However, owing to its relevance for the ventilation of the northern Indian Ocean, and in particular the deep IO-MOC (Song et al., 2004; Johnson, 2008), it cannot be ignored in the eOMP analysis.
2.2.1 World Ocean Atlas and GLORYS12 data
The GLODAPv2 data lack coverage in the key source regions where the relevant SWTs form or enter the Indian Ocean; therefore, SWT properties were derived from the World Ocean Atlas (WOA) annual statistical data. These data consist of ° grid annual average temperature and salinity data from 1995 to 2004 and 2015 to 2022, 1° annual average oxygen concentration data from 1971 to 2000, and 1° grid annual average nutrient concentration data from 1965 to 2022. We acknowledge that data interpolation may introduce uncertainties. However, spatial mapping uncertainty computed from the WOA23 standard error fields with sparsity weighting revealed 0 % empty grid cells (sparsity index = 0.00) across all regions where SWTs were defined. This will be discussed in more detail in later sections.
To consider global change impacts on SWTs properties, we used the WOA 1995–2004 and WOA 2015–2022 data to define the temperatures and salinities of the SWTs (data are shown in Table 2). Additionally, we obtained the GLORYS12 global ocean reanalysis data, a ° eddy-resolving physical reanalysis product that provides dynamically consistent monthly temperature and salinity fields from 1993 to 2020. GLORYS12 assimilates sea level anomaly, satellite sea surface temperature, and in situ temperature and salinity profiles into a NEMO-based ocean model, yielding a gap-free temperature and salinity time series at each grid cell. Because it retains the temporal dimension that climatological products collapse, GLORYS12 is the appropriate product for estimating year-to-year ENSO and IOD variabilities in temperature and salinity in the SWTs' formation regions (Supplement Fig. S15). GLORYS12 shows a decadal temperature increase of about 0.2 °C, which is larger than that detected in the WOA data. Although the WOA data is a time-averaged climatology and cannot fully resolve temporal (interannual) variability of SWTs temperature and salinity, we used it to define SWT properties because it is based on measured data. However, GLORYS12 data have been used to quantify uncertainties in SWTs' properties in the Monte Carlo analysis (see below).
Due to insufficient data, there are no decadal averages for nutrient concentrations. Hence, we defined the nutrient concentration of SWTs using the WOA “all-time periods” data for both 1995 and recent years analyses. This implies that we assumed that the concentration of nutrients in the near-surface layer of the ocean, where SWTs form, has not changed. However, to estimate uncertainties arising from potential changes in nutrient concentrations, we conducted a Monte Carlo analysis as mentioned earlier.
The WOA oxygen data are not clearly separated into decades; instead, they are divided into two categories: WOA23 “all-time period” climatology (spanning combined annual averages from 1965–2020) and the WOA23 1971–2000 climatology. Nevertheless, unlike nutrient concentration, changes in oxygen concentration can be assumed because the solubility of oxygen depends on temperature and salinity. Therefore, we defined the SWTs' oxygen concentration using the WOA23 1971–2000 climatology for the 1995 eOMP analyses, whereas for recent years we calculated it to account for potential climate-driven changes, as described below.
2.2.2 Changes in source water types oxygen calculation
Oxygen saturation concentrations for 1995 and recent years were calculated from the corresponding temperature and salinity data of each SWT using the WOA 1995–2004 (1995) and WOA 2015–2022 (recent years) data and the formula of Benson and Krause (1984). In line with the global ocean deoxygenation, the differences in oxygen saturation concentrations between recent years and 1995 were mostly negative (except for the AAIW). To account for the impact of global warming on SWTs' oxygen concentrations, we subtracted the calculated oxygen change from the SWTs' oxygen values derived from the WOA23 1971–2000 climatology to estimate SWT oxygen concentrations for the recent years. Accordingly, WOA23 1971–2000 climatology-derived SWT oxygen values were used for the eOMP analyses in 1995, whereas the adjusted SWT oxygen values (i.e., 1995 values minus the calculated oxygen change) were used for the eOMP analyses in recent years (Table 2). The adjusted SWTs' oxygen values were similar to oxygen values calculated using the WOA “all-time periods” data, except for PGW (+10° µmol kg−1) and RSW (+1 µmol kg−1), whose oxygen values were relatively higher than the WOA23 1971–2000 climatology-derived SWT oxygen values, probably due to the data overlap nature when using both WOA23 1971–2000 and WOA23 “all-time period” climatologies. Since the adjusted SWTs' oxygen values are consistent with global warming, they were adopted to represent recent years' eOMP analyses, as mentioned earlier. However, this method ignores the influence of deeper water masses on the properties of these SWTs, and it is probably a weaker assumption for PGW and RSW because both water masses already undergo substantial mixing when they flow out of the marginal seas, and their oxygen content reflects this outflow mixing in addition to solubility-driven change. Uncertainties arising from variations in SWT oxygen concentration were quantified in the Monte Carlo analysis and oxygen sensitivity test as described in Sect. 2.5 and 2.6, respectively.
2.3 Optimum multi-parameter (OMP) analysis
OMP analysis is a mathematical technique developed by Tomczak and Large (1989) to study water mass mixing in a given ocean region. In this approach, a water sample is considered a mixture of multiple SWTs. The objective is to determine the fraction of each SWT in the water sample using a non-negative least-squares method to estimate the contribution of each SWT to a given measurement point in the sample. For this study, we performed an eOMP analysis, which, unlike the classic OMP analysis, accounts for the region's biogeochemistry. The eOMP analysis was performed using a Python-based model (PYOMPA) (Shrikumar et al., 2022). PYOMPA is based on the original OMP analysis by Tomczak and Large (1989). The mathematical formula used to solve the objective function is presented in Eq. (1):
Here, denotes the value of the property p in measured water sample j, stands for the estimated fraction of SWT i in water sample j, stands for the value of property p in the SWT, denotes the residual in explaining property p for sample j, represents the biogeochemical terms, where denotes the exchange ratio of two properties A (oxygen) and B (phosphate and nitrate), while denotes the amount of property B that is remineralized due to the consumption of property A in sample j.
The residual equation is given by Eq. (2), where μp represents the property mean.
Weights were assigned to each property to regulate its effect on the equation. The larger the weight, the greater its influence on the eOMP solution. Weights were adopted from Acharya and Panigrahi (2016), with higher weights assigned to temperature and salinity and lower weights assigned to non-conservative biogeochemical properties (Table 2). Remineralization was tracked as the conversion of oxygen to phosphate and nitrate according to the ratio , adopted from Hupe and Karstensen (2000). The low parameter residue in the objective and low mass residual in the OMZs (<0.003) recorded by the majority (>98.7 %) of the water samples suggests that the water samples were well represented by the SWTs included in the eOMP analysis (Poole and Tomczak, 1999; Shrikumar et al., 2022).
Determined eOMP solution
To obtain a determined eOMP solution, we reduced the number of SWTs via an exclusion process, resulting in six SWTs and seven constraints (temperature, salinity, nitrate, phosphate, silicate, and mass). First, we performed some preliminary underdetermined eOMP analyses using all eight SWTs relevant to the regions (see Table 3). Thereafter, we separated the SWTs into major (PGW, STSW, mAABW, and ITFW) and minor (AAIW, ASHSW, RSW, and BoBW) SWTs based on their contributions to the Arabian Sea OMZ. We then performed four sets of overdetermined eOMP analyses using five SWTs and seven constraints. The five SWTs included four major SWTs that were kept constant, plus one minor SWT at a time. Using this method, we identified PGW, RSW, STSW, mAABW, and ITFW as the major contributors to the OMZ with the least residuals, and the combination of PGW, RSW, STSW, mAABW, ITFW, and AAIW as the major contributors in the entire WIO transect with the least residuals (Supplement Figs. S4, S5). Because these six SWTs resulted in even smaller residuals in the EIO transect, we adopted them in the final eOMP analyses of all transects.
2.4 Physical oxygen supply and biological oxygen consumption analysis
The physical oxygen supply analysis determines the amount of oxygen (O2) in the sample (j) supplied via mixing by a specific SWT (). Therefore, the fraction of SWT () in the measured sample, j, was multiplied by the defined oxygen concentration of the SWT () according to Eq. (3).
Oxygen consumption in this study represents net biological oxygen utilization and is closely related to Apparent Oxygen Utilization (AOU). Biological oxygen consumption in a given sample (j) due to remineralization (), was calculated using the measured oxygen in the sample (), and the overall oxygen due to mixing of all SWTs , according to Eq. (4):
The oxygen consumption term is exactly equal to the remineralization term calculated within the eOMP solution when the oxygen residual is added to it. We calculated the physical oxygen supply and biological oxygen consumption for the OMZ core, which corresponded to depth ranges of 150–1000 m for the AS OMZ and 150–700 m for the BoB OMZ. The same was calculated for the entire WIO and EIO transects (150–1200 m) and equatorial transects (15° S–3° N, 150–1200 m).
2.5 Sparsity-weighted Monte Carlo eOMP perturbation analysis
To determine whether the observed changes in the SWTs mixing fraction between 1995 and recent years were statistically distinguishable from the combined uncertainty in the defined SWTs properties, we implemented a sparsity-weighted Monte Carlo perturbation analysis (n=10 000 iterations). This approach propagates two uncertainty components (temporal and spatial) through the eOMP solution.
2.5.1 Uncertainty budget construction
The temporal uncertainty (σtemporal) for temperature and salinity was estimated from the interannual standard deviation of the annual mean values within each SWT formation box (Table 3) extracted from the GLORYS12 global ocean reanalysis (Mercator Ocean, ° horizontal resolution, monthly output 1993–2020). Box-mean values were computed using cosine-latitude weighting to correct for latitudinal variation in the grid cell area. For dissolved oxygen, σtemporal was estimated as the absolute difference between the WOA23 1971–2000 climatology and the WOA23 “all-time period” climatology at each SWT formation box, representing the documented long-term oxygen change at the sources. For nutrients (NO3, PO4, Si), σtemporal was estimated from the WOA23 sparsity-weighted standard error (SE) field, as WOA23 does not provide decadal nutrient climatologies as mentioned earlier.
Spatial mapping uncertainty (σmapping) was computed from the WOA23 formal SE fields using sparsity weighting: each grid cell was assigned a weight ), where is the number of observations in that cell. This formula assigns a higher weight to data-sparse cells, penalizing regions with limited observational constraints. Crucially, the analysis revealed 0 % empty grid cells (sparsity index = 0.00) across all six SWTs formation regions. The weighted mean SE across all cells in each SWT formation box was taken as σmapping. For oxygen and nutrients, σtemporal and σmapping are both WOA23-derived and therefore not independent; σmapping was set to zero for these variables to avoid double counting, and σtotal=σtemporal for these properties. For temperature and salinity, the two uncertainty sources were genuinely independent (GLORYS12 vs. WOA23 SE) and were combined in quadrature as follows: . The uncertainty analysis showed relatively small (<5 %) uncertainty in SWTs properties. The largest relative uncertainties occurred for the silicate and oxygen contents of the shallow, marginal-sea-influenced SWTs, PGW (Si 11.3 %, O2 8.6 %) and RSW (O2 8.9 %), reflecting greater interannual variability and long-term changes in these shallow formation regions. The deep, stable water mass mAABW showed the lowest relative uncertainties across all properties (≤0.7 %) (Supplement Fig. S12).
2.5.2 Monte Carlo perturbation procedure
In each Monte Carlo iteration, the SWT properties were perturbed by two components. A structural perturbation (δmapping) was drawn from σmapping for each property and SWT, and applied identically to both the 1995 and recent years SWT tables, reflecting the shared WOA mapping uncertainty. Independent temporal perturbations (δtemporal) were drawn from σtemporal separately for the 1995 and recent years, reflecting independent interannual conditions in the source regions. The combined perturbation δmapping+δtemporal is mathematically equivalent to drawing from σtotal. The perturbed SWTs tables were passed to PYOMPA (Shrikumar et al., 2022) to solve the eOMP system with the original GLODAPV2/sonne cruise observations, and the resulting averaged mixing fractions were recorded. This procedure was repeated 10 000 times (random seed = 42), yielding probability distributions of fraction change (Δfraction), representing recent year minus 1995 for each SWT in each region. For each iteration, the oxygen supply contribution of each SWT was computed for both periods as the product of its mixing fraction and its oxygen concentration, yielding probability distributions of the change in each SWT oxygen contribution (positive or negative) per region. Analysis was performed independently for the AS OMZ and BoB OMZ cores (O2<20 µmol kg−1), the WIO, EIO (150–1200 m), and the CIO (1995 vs. 2019/2024, 150–1200 m) transects.
2.5.3 Statistical assessment of Monte Carlo analysis
The robustness of each observed change was assessed using the following criteria applied to the Monte Carlo distributions: (1) 95 % confidence interval (CI) exclusion of zero, computed as the 2.5th and 97.5th percentiles of the Δfraction distribution; (2) the overlap coefficient (OVL), which is a measure of how much the 1995 and recent year mixing-fraction distributions coincide, and ranges from 0 (no overlap, fully separated distributions) to 1 (identical distributions); and (3) Mann-Whitney U test (MWp) comparing the 1995 and recent year distributions; (4) P correct direction (Pdir) which measures the proportion of the 10 000 iterations mean that reproduce the direction (increase or decrease) of the observed change (1=100 %); (5) signal-to-noise ratio (SNR) which measures the magnitude of the change relative to its uncertainty, calculated as the absolute mean change divided by the standard deviation of the Monte Carlo distribution. A higher SNR means the signal stands out more clearly from the noise. Results of Δfraction distribution were classified as robust (CI excludes zero, OVL < 0.20, MWp<0.05), likely robust (CI excludes zero, OVL < 0.35, MWp<0.05), directionally robust (Pdir ≥ 0.85, i.e., 85 % of iterations produce a change in the observed direction, MWp<0.05, but CI includes zero), or uncertain (none of the above criteria were met). Robustness of changes in physical oxygen contribution by individual SWTs was classified as robust (95 % CI excludes zero and SNR > 2), directionally robust (SNR ≥ 1, Pdir ≥ 0.85), or uncertain (none of the above criteria were met).
2.6 Sensitivity of eOMP solution to variability in source water types properties
To evaluate the sensitivity of the eOMP solution to variability in SWT oxygen concentrations, we conducted oxygen sensitivity test, where we used a higher oxygen scenario (i.e., added the calculated oxygen change described earlier to the 1995 oxygen values), a constant oxygen scenario (i.e., used the 1995 oxygen values for eOMP analysis of recent years), and a lower oxygen scenario (where the oxygen change was subtracted). The resulting SWT fractions and changes between 1995 and recent years were not significantly different (Supplement Fig. S6). Therefore, the variability in the SWT oxygen concentration does not alter the conclusions of this study.
We also performed a variability test on the SWT properties to understand how the SWTs fraction derived from the eOMP analysis are affected by variability in their properties. To achieve this, we defined all six selected SWTs using literature values, as shown in Table 1 (see Table S1 in the Supplement for the SWTs properties used in the sensitivity analysis). We performed a sensitivity analysis using the 2018 WIO transect. The results did not differ significantly (Supplement Fig. S7), as the major SWTs contribution remained similar to the output when the SWTs properties were defined using the WOA data, as shown in Table 2.
Table 1Literature values of source water types (SWTs) properties.
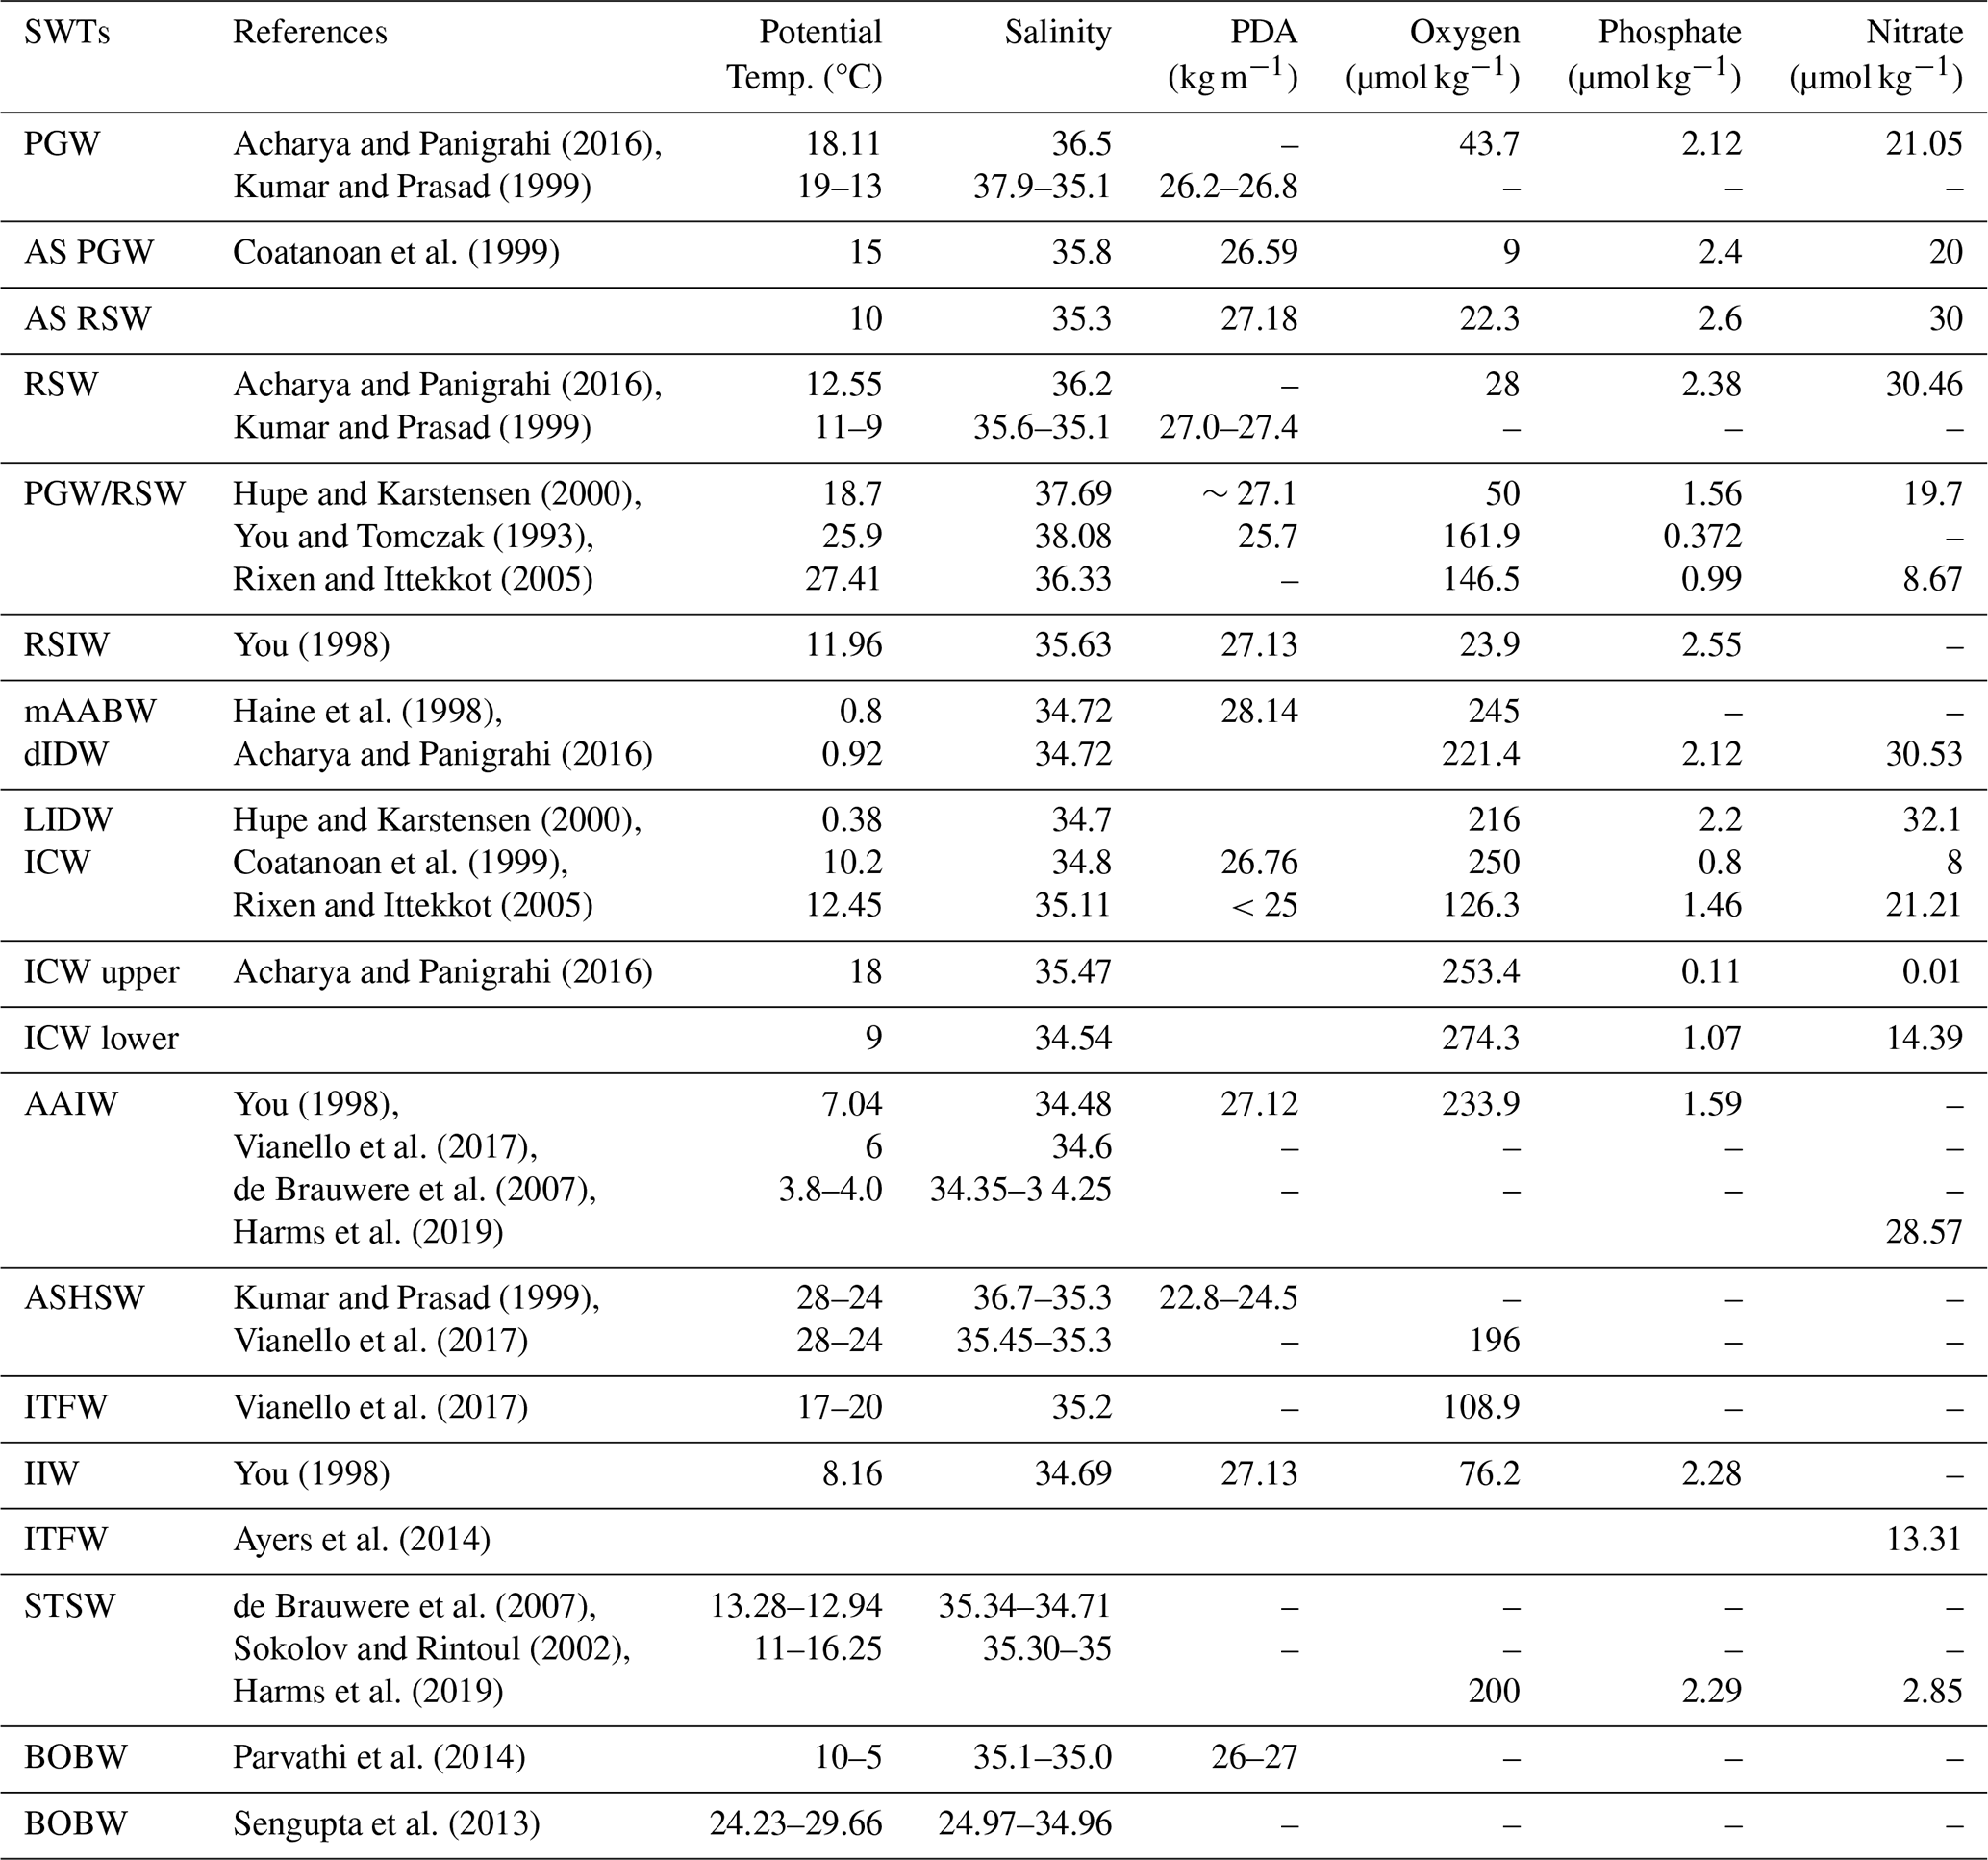
IIW – Indonesian Intermediate water, RSIW – Red Sea Intermediate Water, LIDW – Lower Indian Deep Water; dIDW – deep Indian Deep Water, AS PGW – Arabian Sea Persian Gulf water, AS RSW – Arabian Sea Red Sea water.
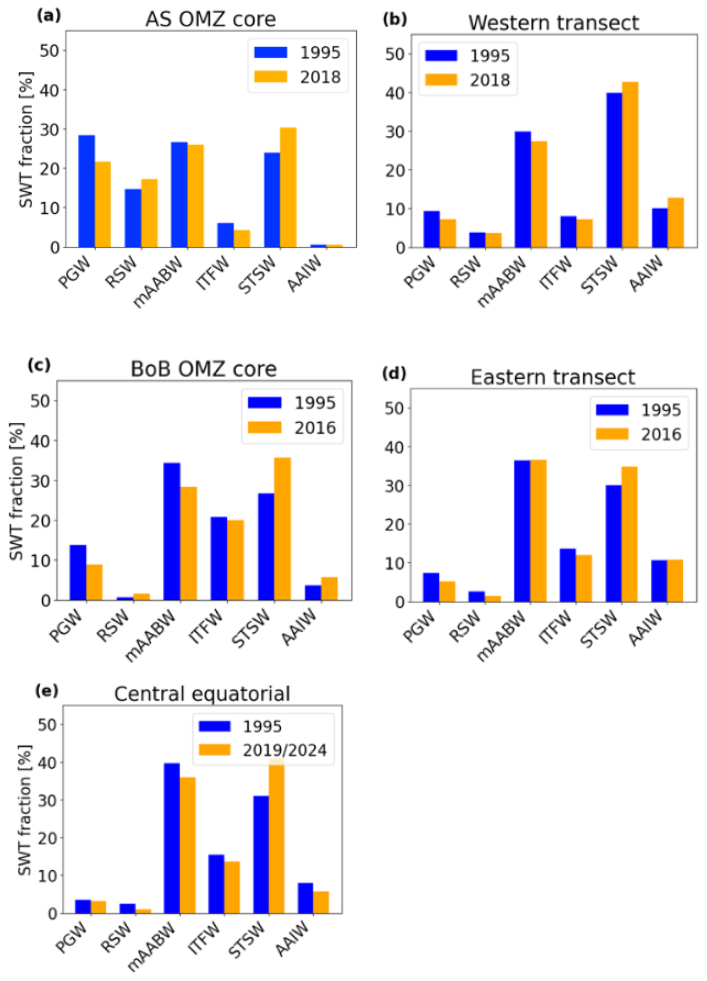
Figure 4Source water types (SWTs) fraction in the Indian Ocean: (a) Arabian Sea OMZ (AS OMZ, O2<20 µmol kg−1, depth 150–1000 m), (b) entire western transect (WIO, 150–1200 m), (c) Bay of Bengal OMZ (BoB OMZ, O2<20 µmol kg−1, depth 150–700 m), (d) entire eastern transect (EIO, 150–1200 m), (e) central equatorial region (CIO, 15° S–3° N, depth 150–1200 m).
Table 2Properties of source water types (SWTs) included in this study and their associated weights in the eOMP solution.
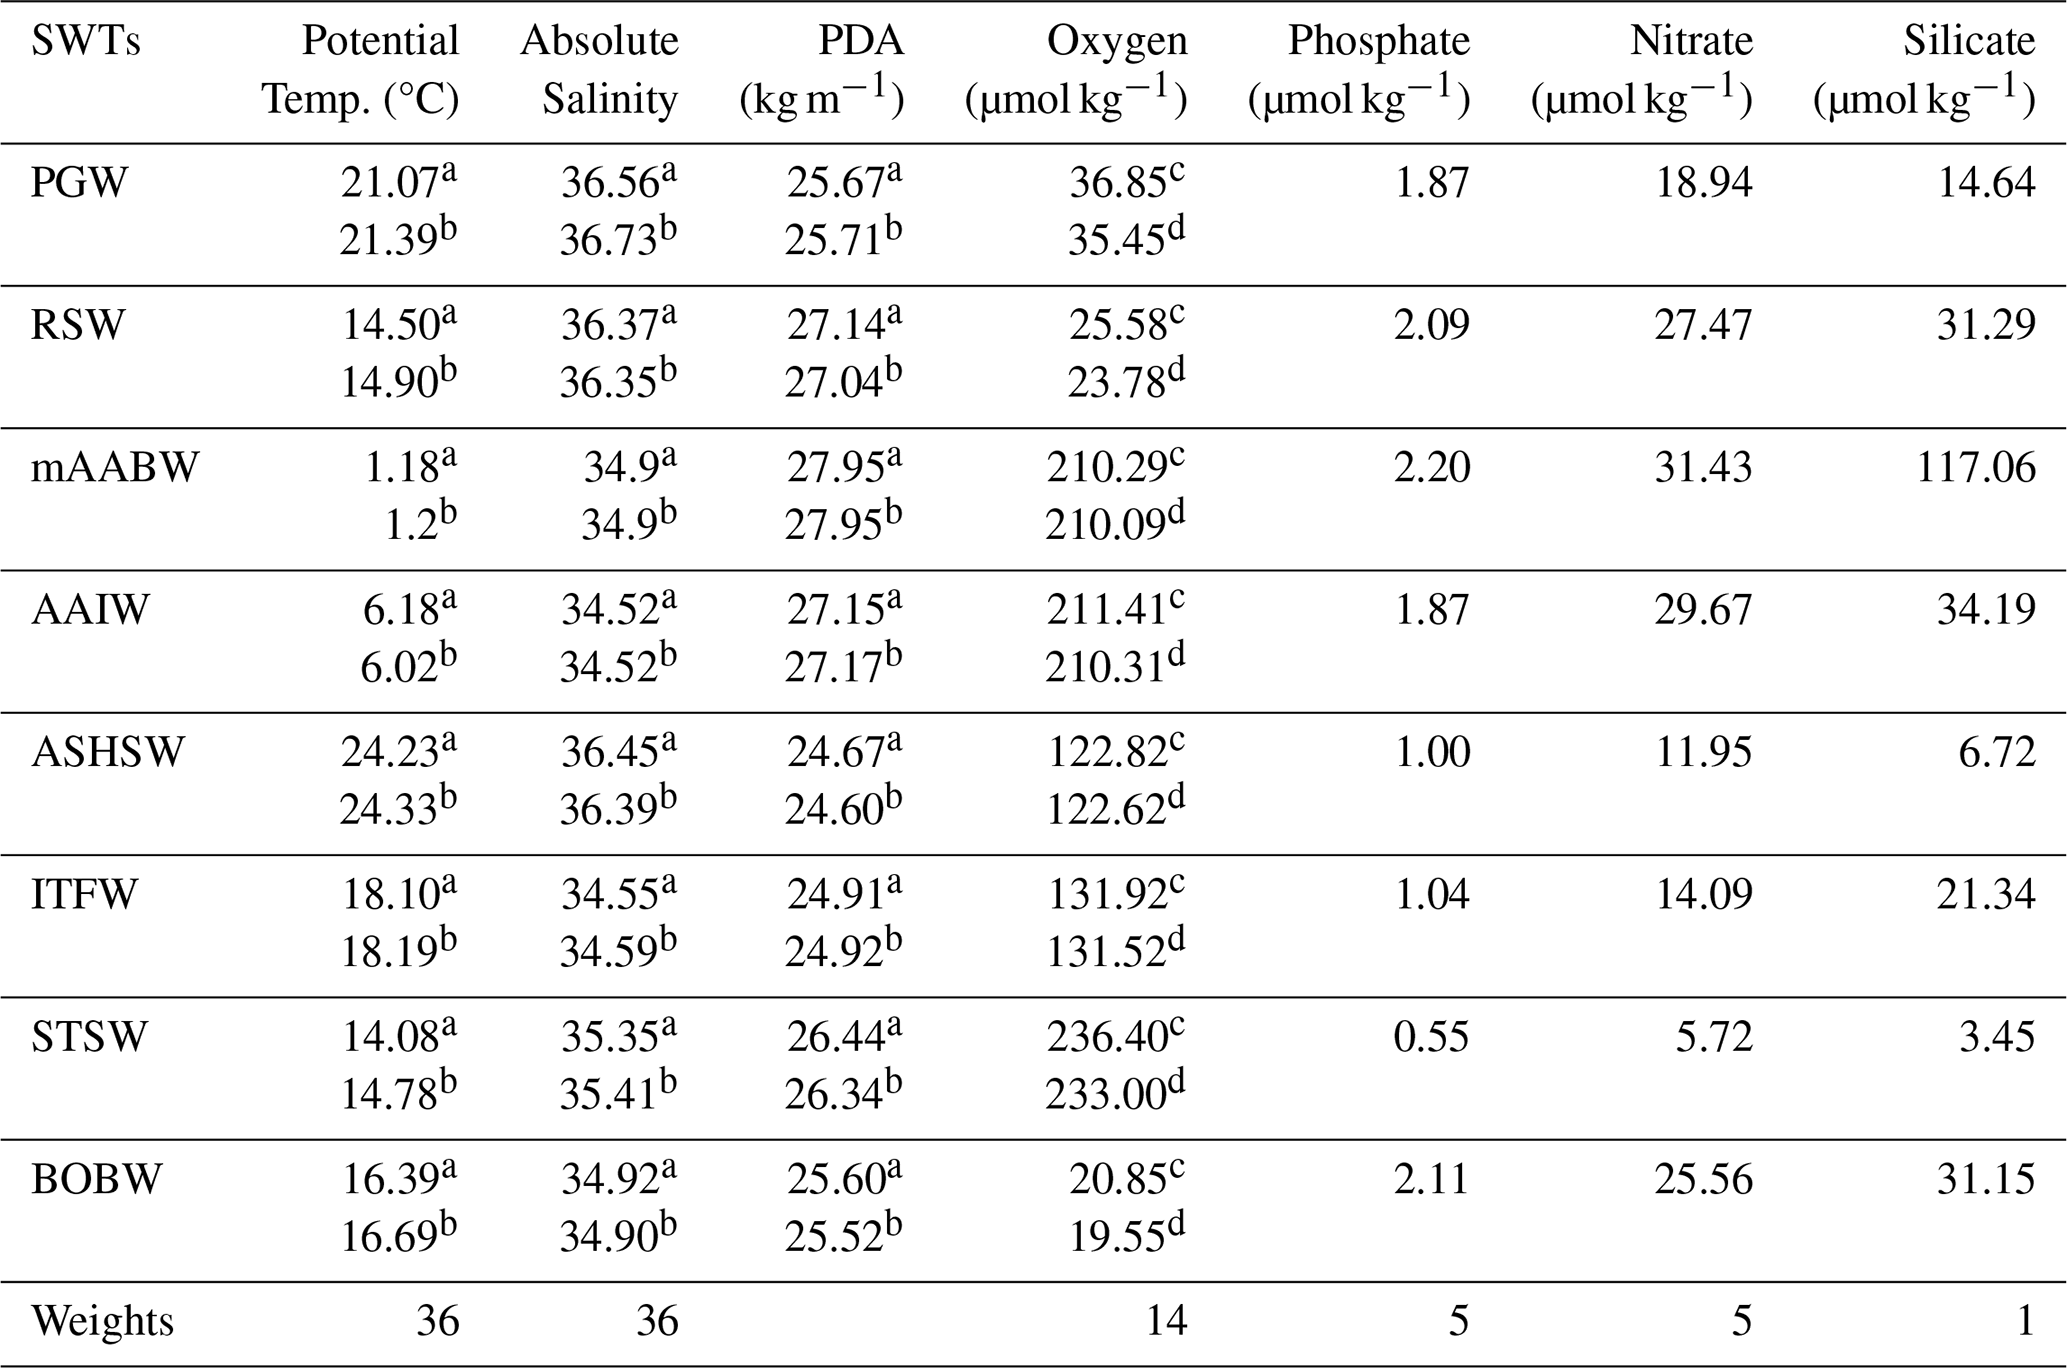
PDA = Potential density anomaly with respect to a reference pressure of 0 dbar, a = SWT properties defined using 1995–2004 WOA data, b = SWT properties defined using 2015–2022 WOA data, c = SWT oxygen properties defined using WOA23 1971–2000 climatologies, d = SWT oxygen properties calculated from oxygen change according to Benson and Krause (1984).
2.7 Sensitivity of eOMP solution to remineralization ratios and parameter weights
We performed a sensitivity analysis to assess the sensitivity of the eOMP solution to O remineralization ratios and the parameter weights. For the remineralization ratios, we performed a sensitivity analysis based on three O ratio scenarios: (the standard Redfield ratios), (Hupe and Karstensen, 2000), and (Anderson and Sarmiento, 1994). For each scenario, we computed the model's root mean square (RMS) error from the total weighted sum of squared residuals and the mean fraction of SWTs. The results revealed that the scenario with the lowest oxygen ratio (i.e., O) led to the highest RMS errors and a more varied distribution of SWTs compared to the other two scenarios, while ratios with O and O both had similar RMS and SWTs distribution (Supplement Fig. S8), we selected because it recorded the lowest RMS and aligned more closely with the standard Redfield stoichiometry. Additionally, we conducted a sensitivity analysis to evaluate how variations in individual parameter weights from Acharya and Panigrahi (2016) influence the model solution. Each weight (e.g., for temperature, salinity, oxygen, phosphate, nitrate, and silicate) was independently varied by ±3 units from its baseline value, while all other weights remained fixed. All runs used constant remineralization ratios (O). For each scenario, we computed the model's RMS error and mean SWT fractions. The results showed that the model was more sensitive to changes in nutrients and relatively stable to changes in temperature and salinity (Supplement Fig. S9). Finally, we adopted the parameter weights from Acharya and Panigrahi (2016) because, despite higher sensitivity to variations in nutrient weights, the overall SWTs contributions remained relatively stable, indicating a robust solution.
Table 3The specific latitude, longitude, and depth ranges used for source water types (SWTs) definition.
3.1 SWTs in the Indian Ocean
The primary objective of this study was to investigate the distribution of SWTs along the GLODAP transects in the WIO, CIO, and EIO in 1995 and in recent years (2016–2024), and to quantify the associated physical oxygen supply and resulting biological oxygen consumption. Thereby, recent year refer to 2018 in the WIO (15° N–30° S, 150–1200 m), 2016 in the EIO (15° N–30° S, 150–1200 m), and 2019/2024 in the CIO (3° N–15° S, 150–1200 m). Based on the overdetermined eOMP analyses, we identified six SWTs as the major contributors in the entire WIO. From a northern Indian Ocean/OMZ perspective, these six SWTs can be considered as remote sources (STSW, AAIW, and mAABW) with a southern Indian Ocean pathway, an equatorial source (ITFW), and local sources (PGW and RSW), i.e., formed close to marginal seas in the Arabian Sea.
3.1.1 Spatial distribution of SWTs in 1995
STSW (30 %–39 %) and mAABW (30 %–40 %) are the main SWTs along the transects in the WIO, CIO, and EIO (Fig. 4). The STSW predominantly occurred at water depths between 200 and 600 m, while the mAABW dominated at water depths of >800 m (Figs. 6 and 7). The mean contribution of the AAIW ranged between 8 % and 11 % at all three transects and was highest at water depths between 500 and 1200 m. The contribution of the equatorial SWT (i.e., the ITFW, 8 %–15 %) and the local water masses (i.e., PGW plus RSW, 9 %–13 %) was similar to that of the AAIW (Fig. 4). The ITFW was more prominent at depths between 150 and 300 m and 600–1000 m around 10 and 20° S (Fig. 5d, g).
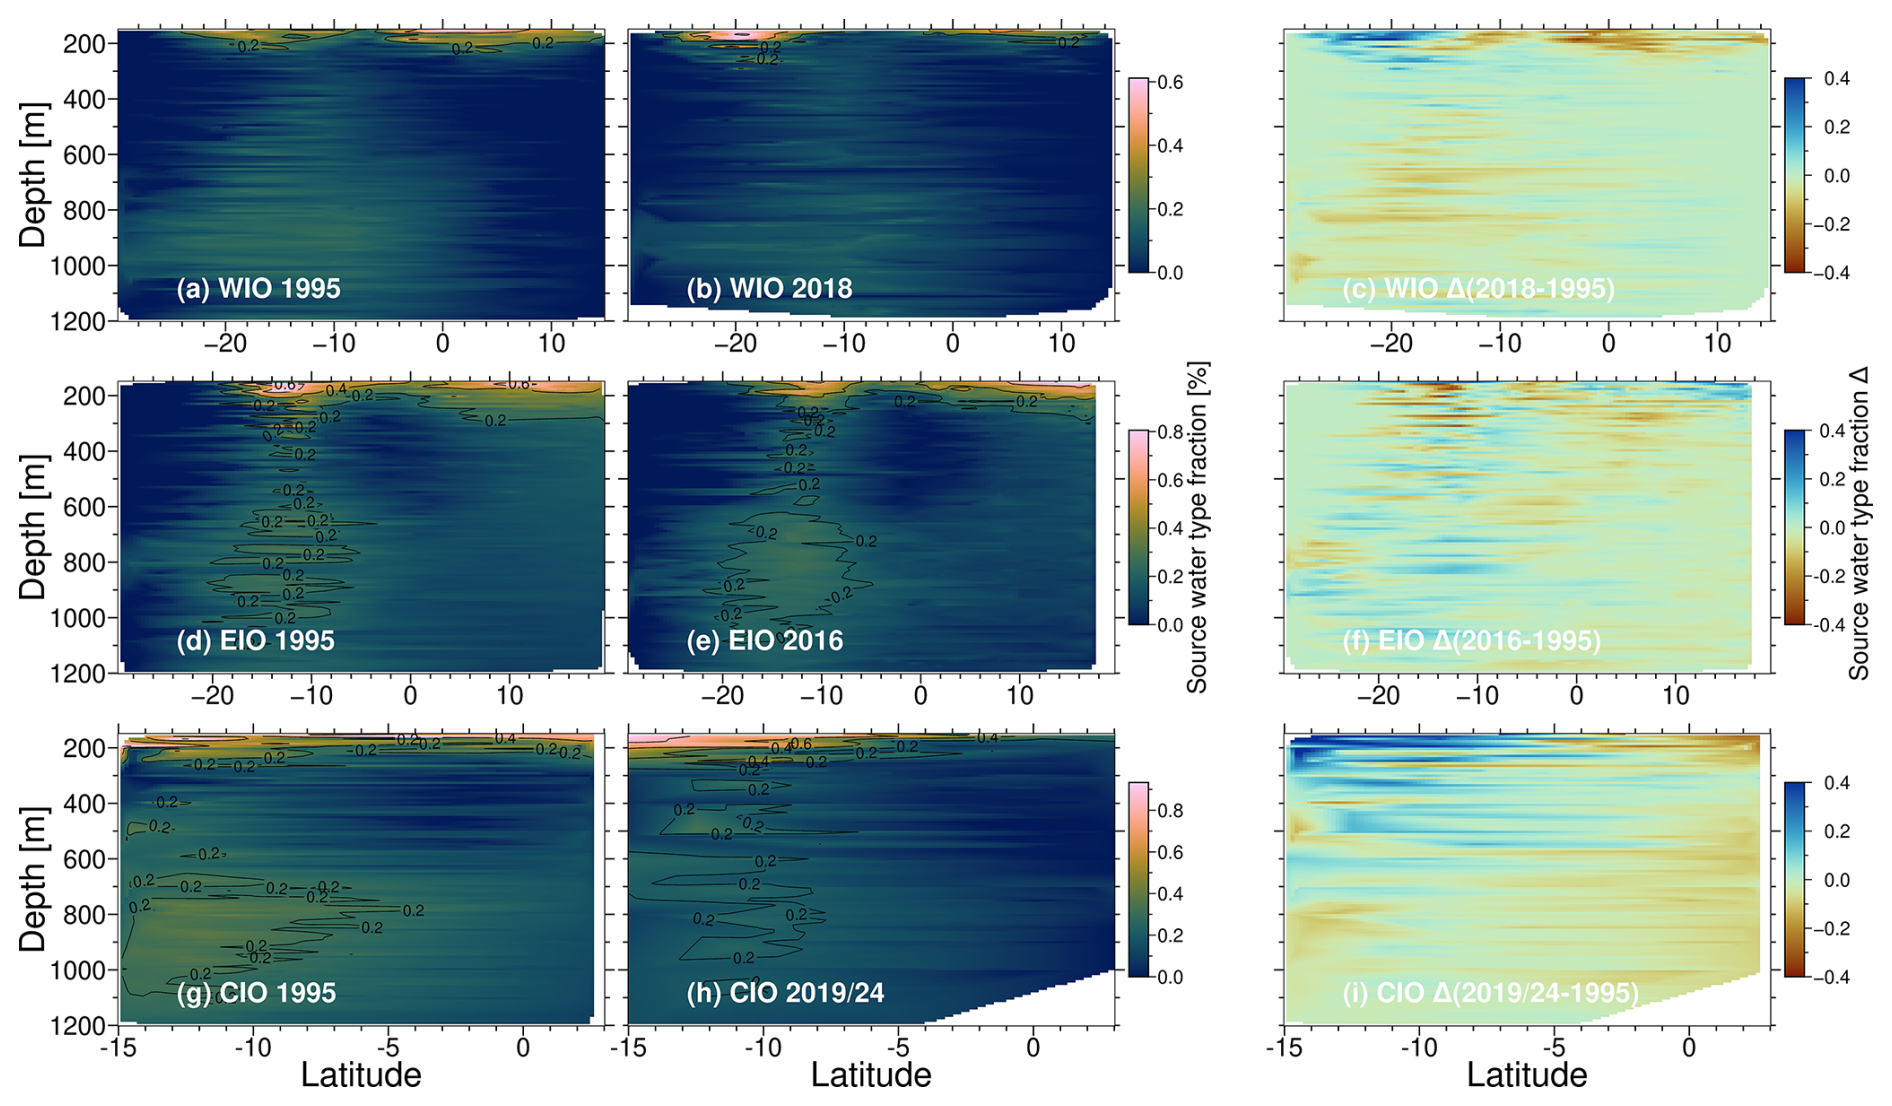
Figure 5Temporal changes in Indonesian Throughflow Water (ITFW) fraction between 1995 and recent years across (a, b) western Indian Ocean (WIO) transect, (d, e) eastern Indian Ocean (EIO) transect, (g, h) central Indian Ocean (CIO) transect, and (c, f, i) source water type fraction change (recent year–1995) for the WIO, EIO, and CIO.
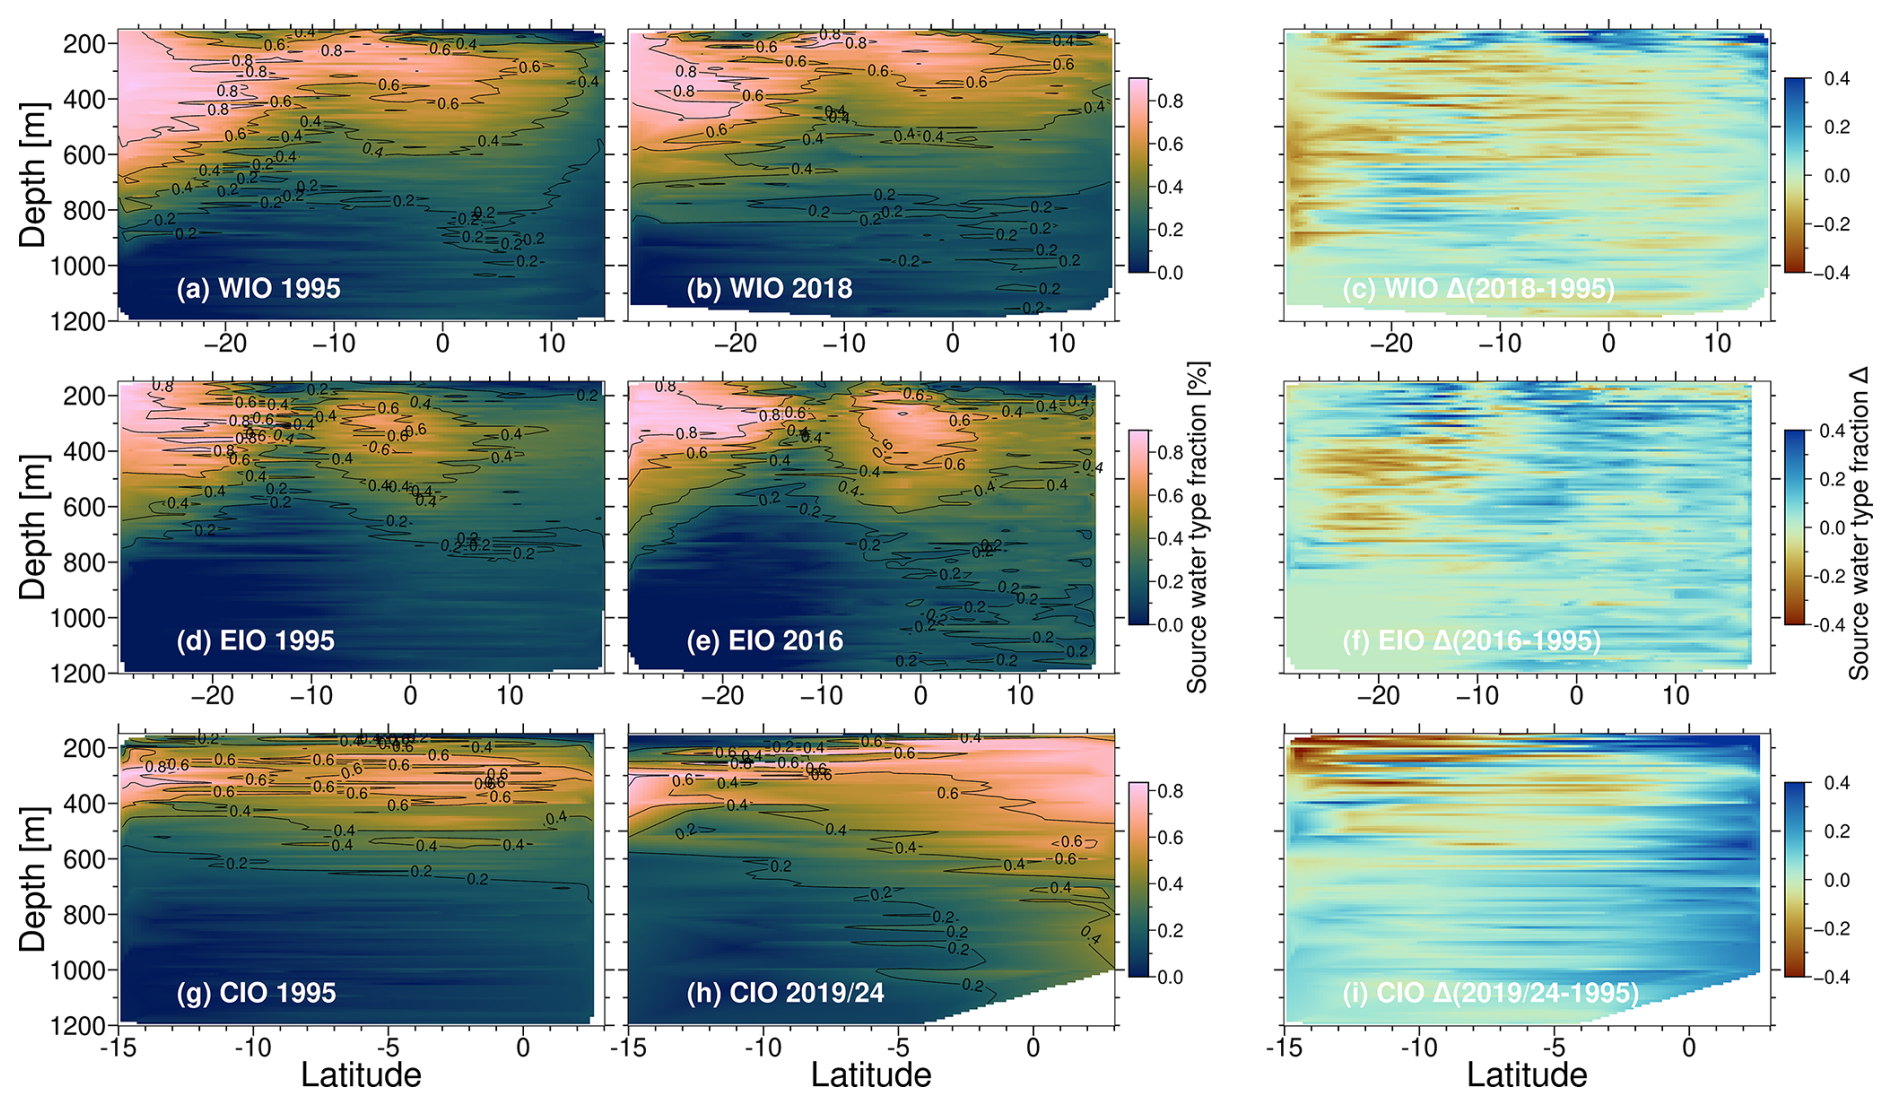
Figure 6Temporal changes in Subtropical Surface Water (STSW) fraction between 1995 and recent years across (a, b) western Indian Ocean (WIO) transect, (d, e) eastern Indian Ocean (EIO) transect, (g, h) central Indian Ocean (CIO) transect, and (c, f, i) source water type fraction change (recent year–1995) for the WIO, EIO, and CIO.
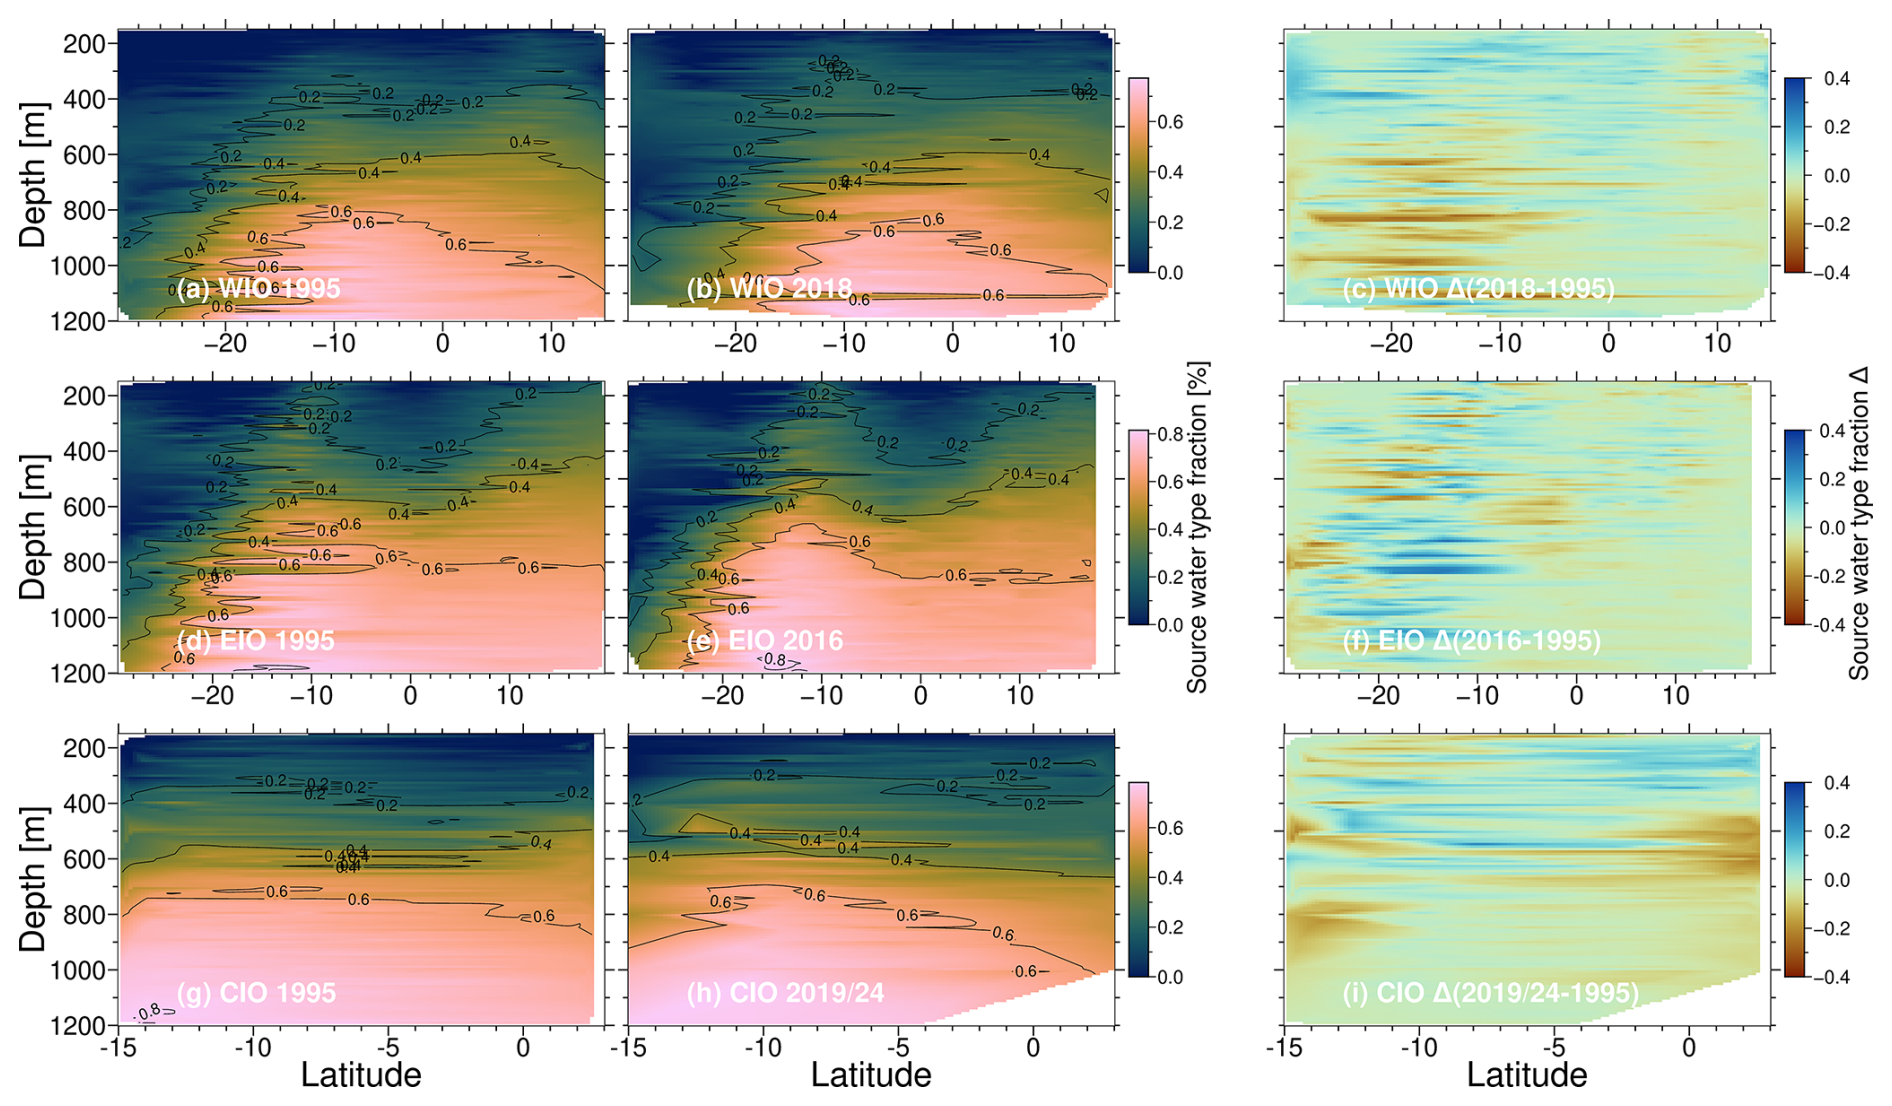
Figure 7Temporal changes in Subtropical Surface Water (mAABW) fraction between 1995 and recent years across (a, b) western Indian Ocean (WIO) transect, (d, e) eastern Indian Ocean (EIO) transect, (g, h) central Indian Ocean (CIO) transect, and (c, f, i) source water type fraction change (recent year–1995) for the WIO, EIO, and CIO.
3.1.2 Distinct characteristics of the Arabian Sea and Bay of Bengal OMZs in 1995
The OMZs reveal a similar picture to the transects as a whole, with mAABW (27 %–34 %) and STSW (24 %–27 %) as the dominant water masses, but the contribution of the AAIW to the water masses in these OMZs was low (1 %–3 %). In contrast, the proportion of local water masses was significantly higher in the AS OMZ (PGW = 28 %, RSW = 14 %), whereas in the BoB OMZ (ITFW = 21 % and PGW = 14 %), the ITFW appears to have replaced the RSW (Fig. 4).
3.1.3 Temporal shifts in source water contribution between 1995 and recent years.
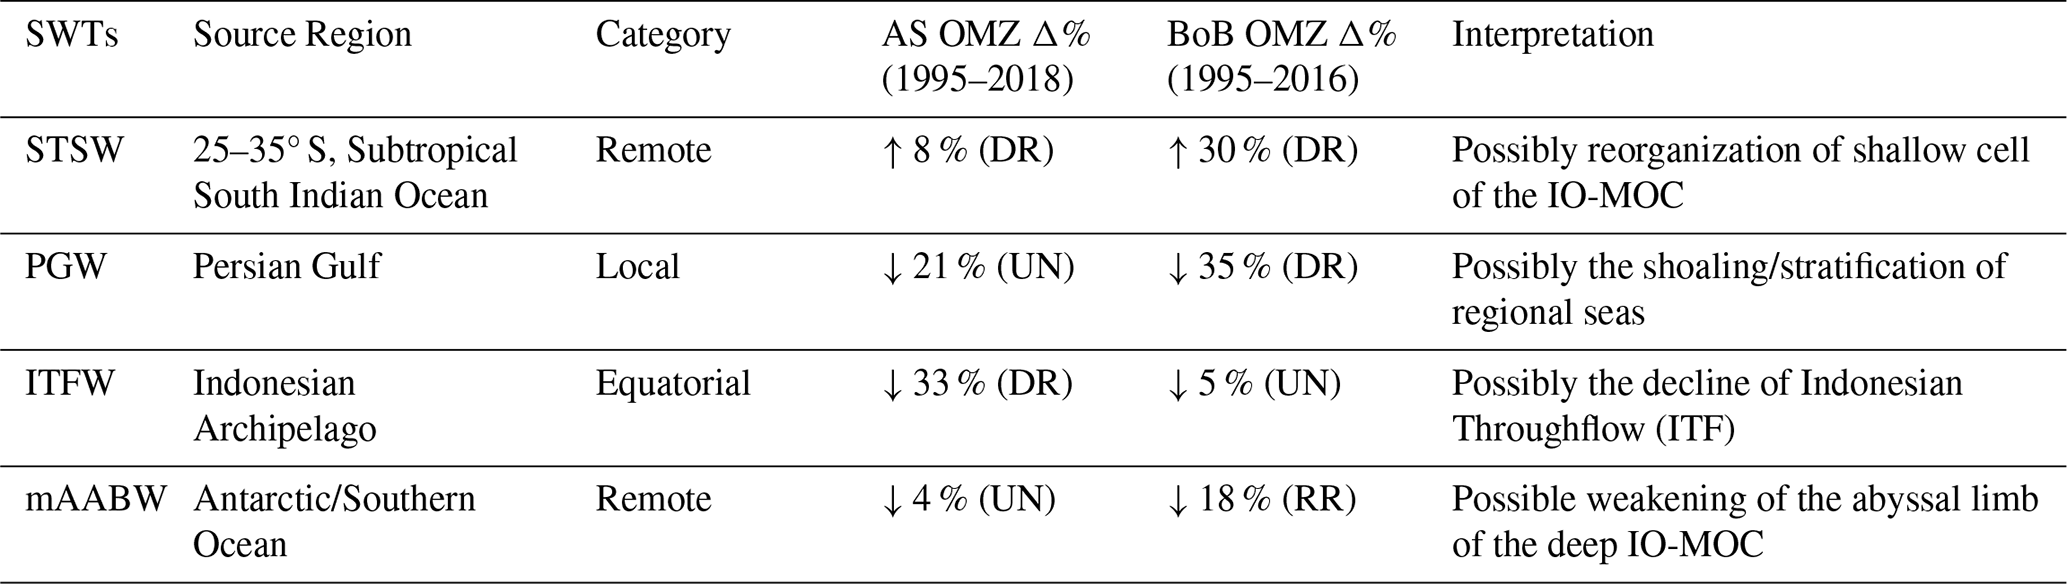
Compared with 1995, our results show that the proportion of STSW has increased across all transects (WIO: 39 %→42 %; CIO: 31 %→41 %; EIO: 30 %→35 %) in recent years (Fig. 4). In turn, the proportion of ITFW and local waters decreased. A similar trend was also evident in the AS OMZ and the BoB OMZ, where the proportion of STSW increased from 24 %→30 % and 27 %→35 %, respectively and the contribution of PGW, mAABW and ITFW decreased (Fig. 4, Table 4). These changes in the SWTs fraction are, on the whole, quite moderate (<10 %), which is to be expected given that difference between the two considered times periods is approximately 24 years and AAIW takes approximately 9 years to reach the central Indian Ocean and about 30 years to reach the eastern South Indian Ocean (Fine, 1993). However, to better assess the robustness of the observed changes, we conducted a Monte Carlo analysis as described earlier. Monte Carlo analysis revealed that the increase in STSW was formally robust in the CIO within the 95 % confidence interval (CI: [+0.035; +0.157], OVL = 0.05) and directionally robust (Pdir = 0.9, MWp<0.05) across all other transects and OMZ cores. Similarly, the decline in PGW was directionally robust (Pdir = 0.9, MWp<0.05) across all transects and OMZ cores (except in the CIO and AS OMZ). Furthermore, the decline in mAABW in the BoB OMZ core was formally robust within the 95 % confidence interval (CI: [−0.10; −0.02], OVL = 0.05) and was likely robust within the CIO (CI: [−0.076; −0.003], OVL = 0.2). Additionally, the ITFW decline was directionally robust in ≥85 % of iterations in the AS OMZ and uncertain in the other transects, with Pdir values ranging from 0.7 to 0.9. Therefore, while not all eOMP results are statistically distinguishable from uncertainties in SWTs properties, the Monte Carlo analysis directionally supports the main results shown by the eOMP analyses (Supplement Figs. S10–14), that along selected GLODAPV2 sections the proportion of STSW has increased at the expense of local water masses such as the PGW, which was most likely also associated with a reduced contribution from ITFW and mAABW.
Table 4Percentage change in source water types (SWTs) fraction with at least a robust (RR) or directionally robust (DR) Monte Carlo robustness verdict either in the Arabian Sea OMZ (AS OMZ) or Bay of Bengal OMZ (BoB OMZ). UN = uncertain.
3.2 Physical oxygen supply and biological oxygen consumption
The physical oxygen supply reported below is likely insensitive to uncertainties in the defined SWTs oxygen values, as an oxygen variability sensitivity test in the AS OMZ, with scenarios including decreasing SWT oxygen, constant SWTs oxygen, and increasing SWTs oxygen values, showed no significant changes in the SWTs fraction. In all scenarios, the SWTs fraction were similar, i.e., an increase in STSW and a decline in PGW, ITFW and mAABW (Supplement Fig. S6). This was also supported by Monte Carlo analysis of physical oxygen supply perturbations (see below).
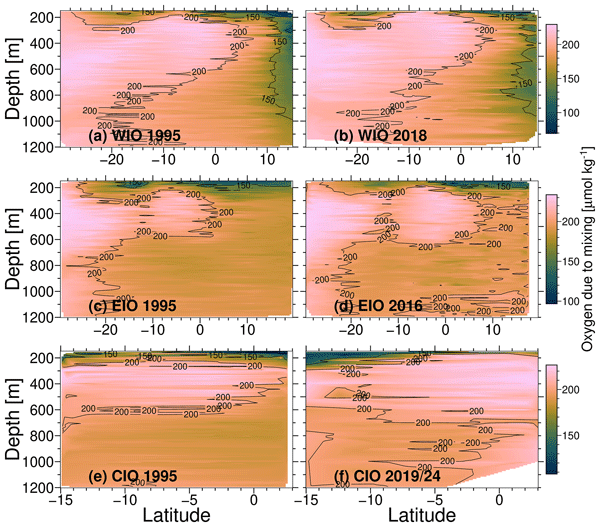
Results from physical oxygen supply show that in the WIO and AS OMZ, the physical oxygen supply increased from 193.2 to 196.5 µmol kg−1 and 135.8 to 143.8 µmol kg−1, respectively, between 1995 and 2018 (Fig. 8a, c). In the EIO and BoB OMZ transects, oxygen supply rose from 191.3 to 198.4 µmol kg−1 and 175.7 to 184.3 µmol kg−1, respectively, between 1995 and 2016 (Fig. 8b, c).
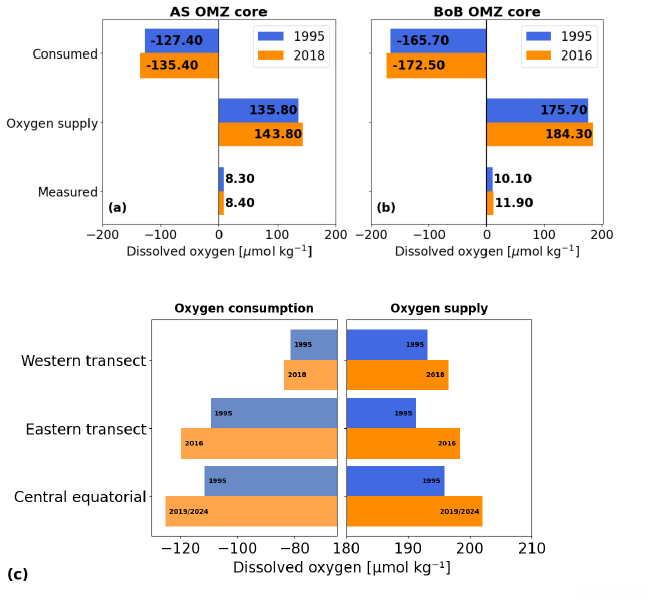
Figure 8Mean oxygen supply (oxygen due to mixing), measured oxygen, and biological oxygen consumption averaged over (a) Arabian Sea OMZ (AS OMZ, O2<20 µmol kg−1, depth range 150–1000 m), (b) Bay of Bengal OMZ (BoB OMZ, O2<20 µmol kg−1, depth range 150–700 m). The measured oxygen values represent average dissolved oxygen within the OMZs at the same depth range above (c) comparing oxygen supply and consumption across the western (WIO, 1995 and 2018), eastern (EIO, 1995 and 2016), and central equatorial transects (CIO, 1995 and 2019/2024).
Physical oxygen contributions by individual SWTs were also analyzed. The STSW showed increased physical oxygen supply across all transects, whereas PGW showed decreased oxygen contribution across all transects (Table 5). Furthermore, mAABW showed decreased oxygen contribution in the BoB OMZ (−12.9 µmol kg−1), WIO (−5.7 µmol kg−1), and CIO (−4.1 µmol kg−1), while AAIW showed an increase in the WIO (Table 5). We assessed the robustness of the physical oxygen change associated with individual SWTs from the Monte Carlo perturbation analysis (n=10 000 iterations), as described in the methods. The results show that the increase in physical oxygen supply associated with STSW was directionally robust (SNR ≥ 1, Pdir ≥ 0.85) across all transects; additionally, the increase in oxygen due to AAIW was directionally robust only in the WIO (SNR = 1.2, Pdir = 0.9). Furthermore, decrease in physical oxygen supply associated with PGW was directionally robust (SNR ≥ 1, Pdir ≥ 0.85) across all transects and OMZs, while decrease in oxygen supply due mAABW was formally robust in the BoB OMZ (SNR = 3.0, Pdir = 1), and directionally robust in the WIO (SNR = 1.5, Pdir = 0.9) and CIO (SNR = 1.4, Pdir = 0.9) (Table 5).
Table 5Monte Carlo (MC) robustness verdict of physical oxygen contribution change (recent year minus 1995) of individual source water types (SWTs) to combined uncertainty in SWTs properties from MC perturbation analysis (n=10 000 iterations). MC verdict description: robust (RR) (95 % CI excludes zero and SNR > 2), directionally robust (DR) (Pdir ≥ 85 % and SNR ≥ 1).
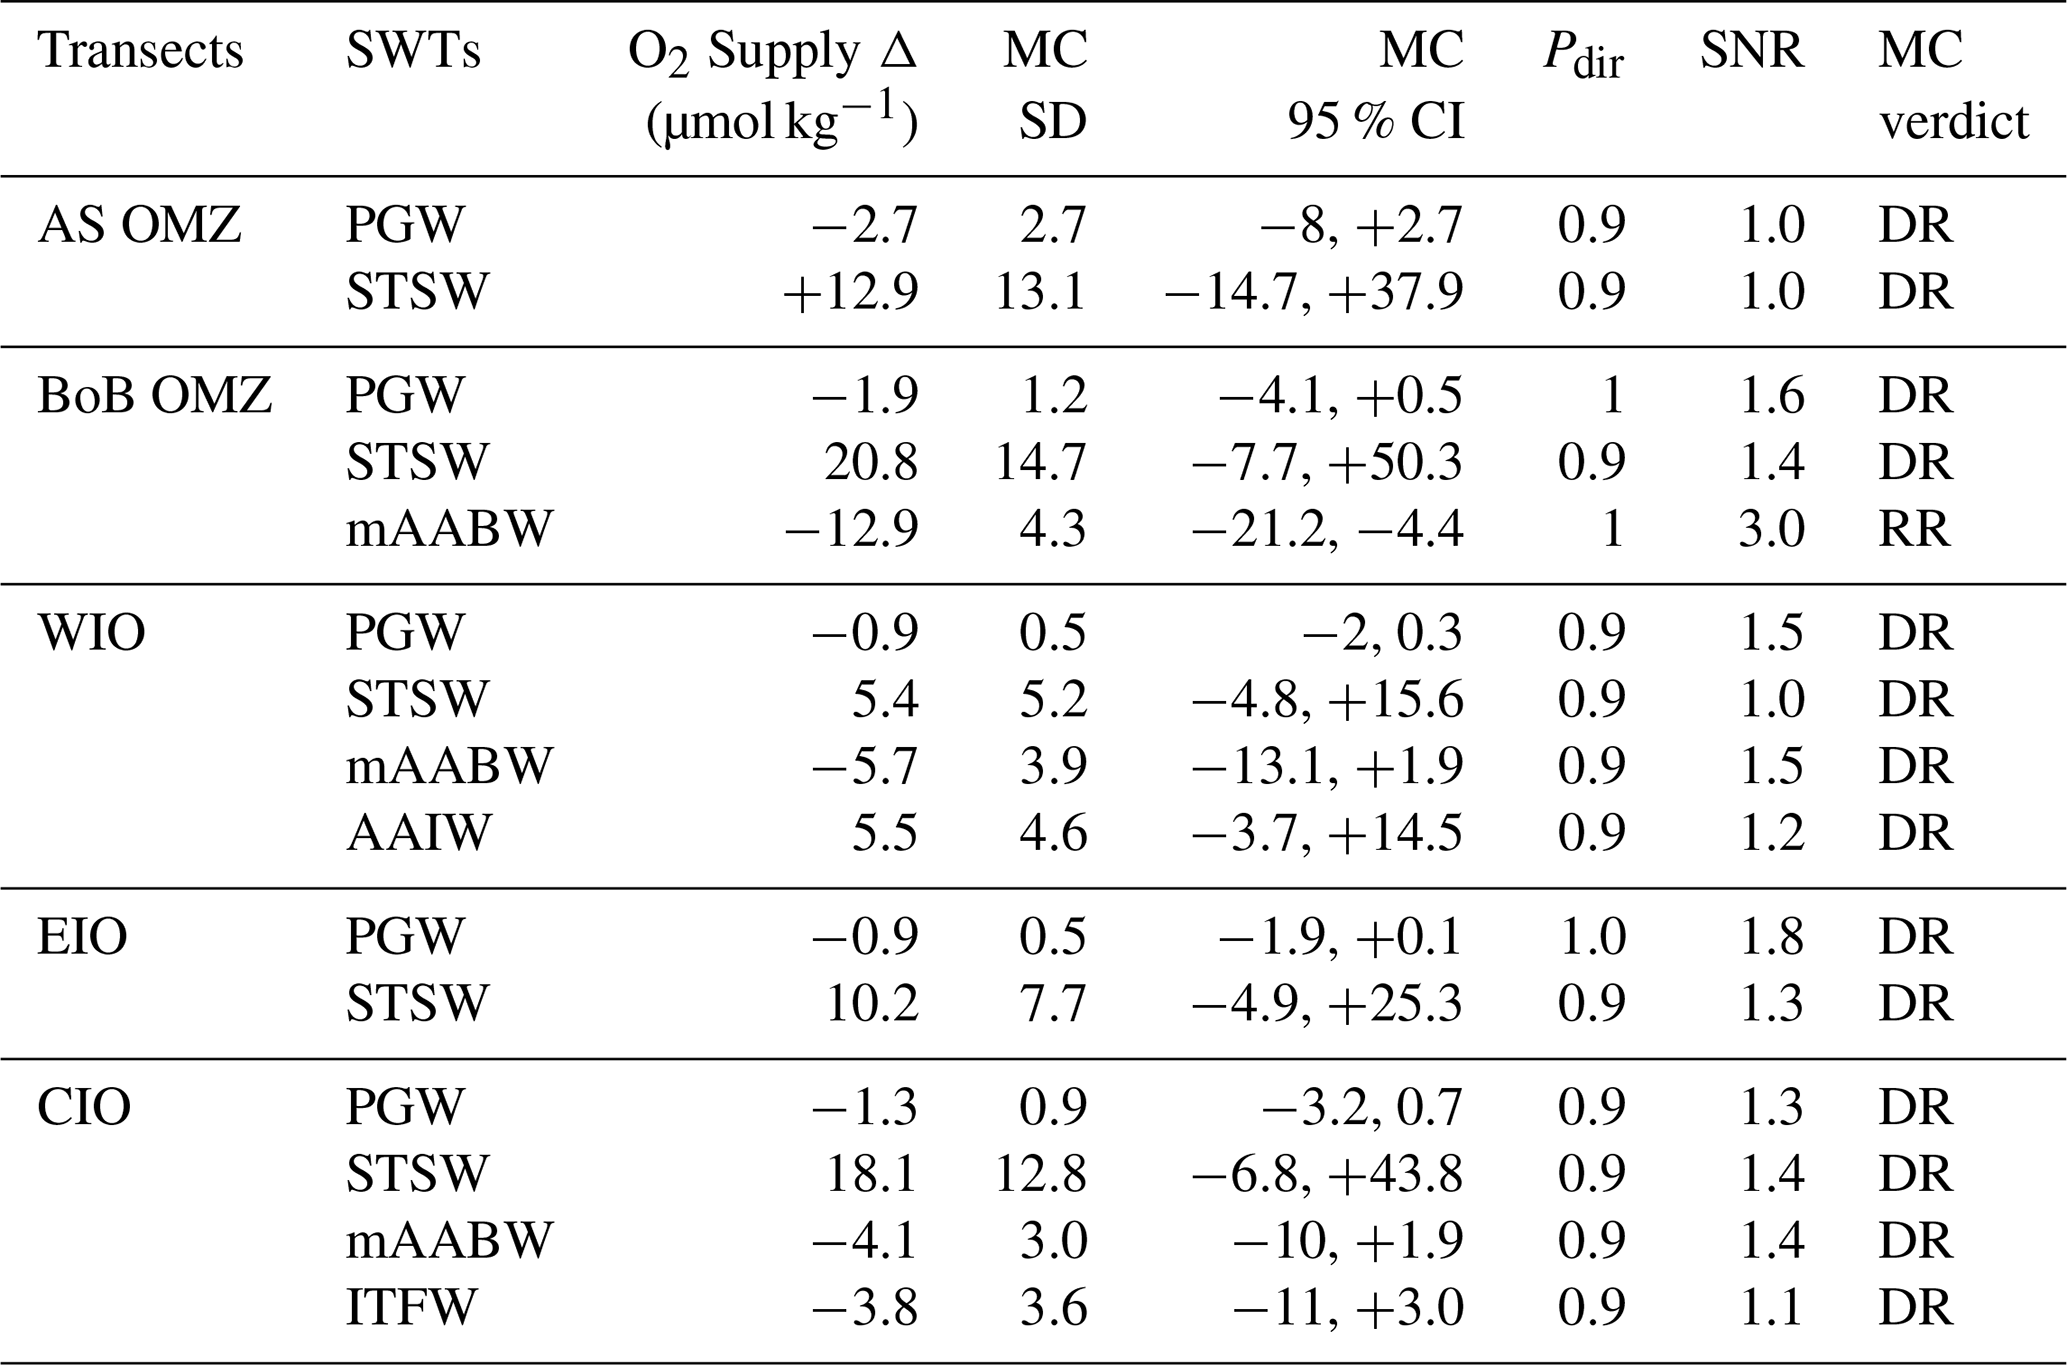
SNR (signal-to-noise ratio). P correct direction (Pdir): the proportion of the mean of 10 000 iterations that reproduces the direction of the observed change (1=100 %).
Analysis of the CIO transect also revealed an increase in the physical oxygen supply around the equator, primarily due to increased STSW. Overall, the average physical oxygen supply increased from 195.9 to 201.1 µmol kg−1 in the CIO between 1995 and 2019/2024 (Fig. 8c). The core of both the BoB OMZ (from 744 to 733 m) and AS OMZ (from 1092 to 1025 m) became shallower in 2016/2018 than in 1995. Overall, the increase in physical oxygen supply was more pronounced from approximately 15° S towards the northern Indian Ocean (Fig. 9).
Analysis of data across all transects revealed an increase in biological oxygen consumption. In the WIO, oxygen consumption rose from −81.3 to −83.6 µmol kg−1 between 1995 and 2018, whereas in the EIO, it rose from −110.2 to −119.6 µmol kg−1 between 1995 and 2016 (Fig. 8c). Similarly, biological oxygen consumption increased from −111.4 to −125.1 µmol kg−1 in the central equatorial region between 1995 and 2019/2024 (Fig. 8c). Furthermore, the analysis indicated a significant increase in biological oxygen consumption in the core of both the AS and BoB OMZ. In the AS OMZ, oxygen consumption increased from an average of −127.4 µmol kg−1 in 1995 to −135.4 µmol kg−1 in 2018; similarly, in the BoB OMZ, oxygen consumption rose from approximately −165.7 µmol kg−1 in 1995 to −172.5 µmol kg−1 in 2016 (Fig. 8a, b).
4.1 Temporal changes in source water fraction
The eOMP analysis identified six main SWTs entering the central and north Indian Ocean via the southern Indian Ocean pathway (STSW, AAIW, and mAABW), the Indo-Pacific throughflow (ITFW), and locally (PGW and RSW). Earlier studies identified the ICW as the most prominent SWT in the AS OMZ, associated with the RSW and PGW (Schmidt et al., 2020; Rixen and Ittekkot, 2005; Acharya and Panigrahi, 2016; Hupe and Karstensen, 2000). However, the ICW in the northern Indian Ocean is not considered as an independent principal water mass due to its dilution with ASW (a mixture of RSW and PGW), BoBW and ITFW (Gordon et al., 1997). Therefore, the result derived from our eOMP analysis is largely consistent with previous studies but enables a direct assessment of the role of primary SWTs, rather than mixtures, in ventilating the OMZ.
In line with Monte Carlo analysis, the comparison of the eOMP results between 1995 and recent years showed a significant increase in the STSW at the expense of local and equatorial SWTs at intermediate depths (150–1200 m).
These findings also correspond with studies by Ditkovsky et al. (2023) which highlight that the southwest Indian Ocean experienced increased influx of high-oxygenated waters supplied from the southern Indian Ocean gyre due to a decline in the contribution of the ITF.
Hence, such a shift is consistent with, and likely linked to a broader reorganization of large-scale ocean circulation, including the shallow IO-MOC and the warm water return flow of the THC. A decline in the THC due to global warming has been reported (Caesar et al., 2021; de la Vara et al., 2022; Gou et al., 2024), which has weakened the ITF inflow into the Indian Ocean and Agulhas leakage into the Atlantic Ocean (Großelindemann et al., 2025; Shen et al., 2023; Peng et al., 2023). Such a weakening of the cross-equatorial flow seems to have favored the northward (meridional) flow of remote SWTs along the shallow IO-MOC into the northern Indian Ocean. However, in contrast to previous studies, the detected decline in mAABW implies a reduced influence of the abyssal limb of the deep IO-MOC.
4.2 Physical oxygen supply and biological oxygen consumption
In the Indian Ocean, the increasing equatorial oxygen concentrations and the associated reversal from expansion to contraction in the AS OMZ since 2013 have been attributed to an enhanced inflow of oxygen-enriched water masses from the southern Indian Ocean gyre and decreasing oxygen consumption (Liu et al., 2024), mechanisms that have also been identified in century-scale projections (Vallivattathillam et al., 2023; Ditkovsky et al., 2023; Kwiatkowski et al., 2020).
Our analysis is consistent with these findings, raising the question of whether signals of projected changes have already emerged in observations, as the Indian Ocean OMZs experienced increased physical oxygen supply due to a greater contribution from remote SWTs (mainly STSW) across all transects in recent years compared to 1995. This was accompanied by a reduced influence from relatively oxygen-poor local and equatorial SWTs (e.g., PGW and ITFW). Furthermore, recent studies have suggested a weakening of the summer monsoon (Zhou et al., 2008; Roxy et al., 2015), in combination with the decline in primary productivity (PP) in the Arabian Sea/equatorial Indian Ocean since 2005 (Supplement Fig. S1), has increased the equatorial oxygen concentrations additionally by lowering the biological oxygen consumption (Kwiatkowski et al., 2020). In contrast, our analysis points towards increased oxygen consumption, suggesting that alternative mechanisms may be involved.
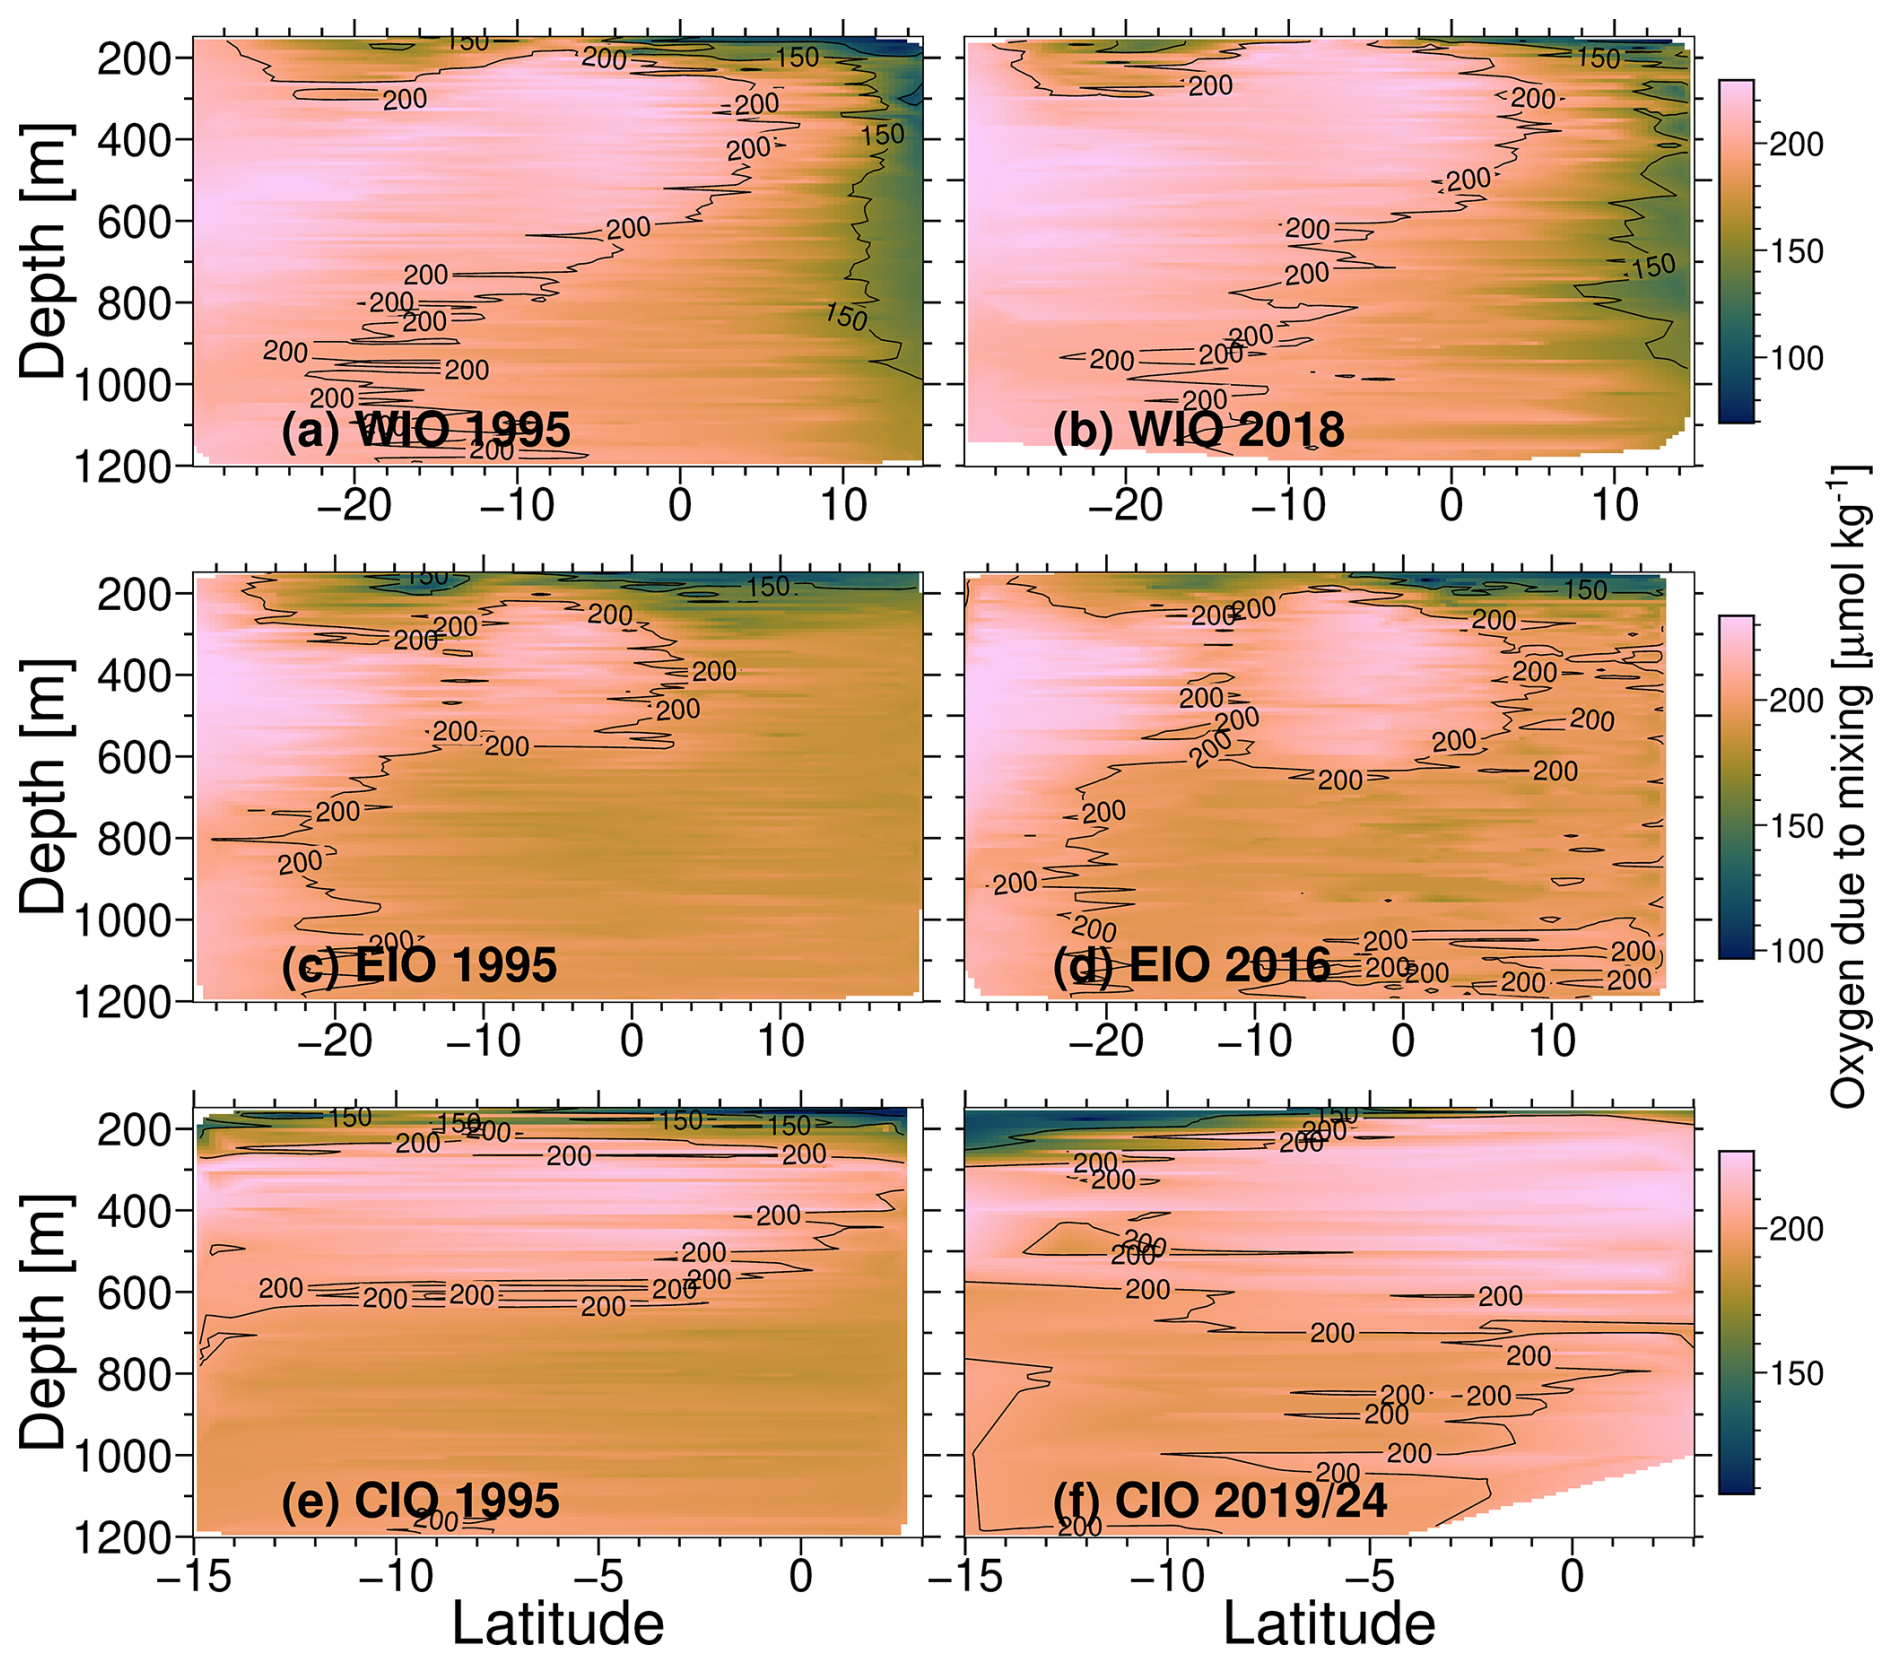
Figure 9Temporal changes in physical oxygen supply (oxygen due to mixing) between 1995 and recent years across (a, b) western Indian Ocean (WIO) transect, (c, d) eastern Indian Ocean (EIO) transect, and (e, f) central Indian Ocean (CIO) transect.
One possible explanation for this increased biological oxygen consumption is that water masses remain longer in the Indian Ocean upon arrival. This means that water masses are trapped within the OMZs for a longer period, prolonging their exposure to remineralization processes (Cavan et al., 2017; Rixen et al., 2020). Hence, it seems that the weakening of the monsoon-driven upwelling, in addition to the slowdown in the THC (i.e., the associated reduced inflow via the ITF and lower outflow via Agulhas leakage), has not only rearranged the STWs' contributions but also slowed the shallow IO-MOC. While the former seems to have increased the physical oxygen supply, the latter appears to have increased the oxygen consumption by increasing the residence time of water in the OMZs. Due to these counteracting processes, the measured increase in dissolved oxygen in the GLODAPv2 data is relatively small, approximately 0.1 µmol kg−1 in the AS OMZ and, on average, 1.8 µmol kg−1 in the BoB OMZ (Fig. 8a, b). This indicates that, in the EIO, the influence of SWTs' reorganization in the shallow IO-MOC on the BoB OMZ dominates and overcompensates for the possible slowdown between 1995 and 2016.
4.3 Historical context of OMZ variability
Historical results obtained from the global atmosphere-ocean model and eddy-resolving regional models indicate that the reduced inflow of oxygen-rich waters from the south has contributed to the intensification of the AS OMZ over the past 6000 years, as reported in a review by Rixen et al. (2020). Our results, in line with model results (Vallivattathillam et al., 2023; Ditkovsky et al., 2023), suggest the opposite mechanism: an enhanced supply of oxygen-rich waters from the south has caused the shrinkage of the AS OMZ since 2013 (Liu et al., 2024). This trend reversal has been attributed to the reorganization of the shallow IO-MOC in response to the weakening of the warm-water return flow of the THC in the Indian Ocean, and the monsoon-driven upwelling in the Arabian Sea. However, whether this trend will persist seems to depend on the competing influences of the enhanced physical oxygen supply and the biological oxygen consumption due to the reorganization and the associated slowdown of the IO-MOC, respectively.
These results also support paleoceanographic studies indicating a strong link between climate changes in the North Atlantic and the AS OMZ on glacial and interglacial time scales (Altabet et al., 1999; Schulz et al., 1998; Suthhof et al., 2001). In contrast to our results, global warming was associated with intensified OMZ, and cooling with reduced intensification. However, on these paleo-time scales, climate changes are linked to changes in sea level (Rosenthal et al., 2003; DiNezio and Tierney, 2013). During the Last Glacial Maximum (∼20 000 years ago), the sea level fell by approximately 120 m, exposing large areas of the Sunda and Sahul shelves and closing the shallow Java Sea ITF pathway (DiNezio and Tierney, 2013). The deeper main ITF straits (e.g., Makassar and Lombok) remained submerged and active; nevertheless, the ITF was reduced during this cooler glacial phase. This reduction in ITF transport would, in turn, have favored an enhanced meridional inflow into the northern Indian Ocean. In contrast, in the 21st century, the reduced influx of the ITF is not caused by a drop in sea level but is linked to the slowdown of the THC in response to global warming (Großelindemann et al., 2025; Shen et al., 2023; Peng et al., 2023). However, the mechanism appears to be similar: a reduction in cross-equatorial (ITF) transport increases the relative contribution of meridional, southern-sourced inflow to the Indian Ocean OMZs, even as the absolute volume transport associated with the shallow IO-MOC itself is likely also slowing. Hence, how the OMZs develop in the future depends on both the reorganization of the SWTs contributions and the transport rate of the shallow IO-MOC.
The eOMP analysis identified six main SWTs entering the central and north Indian Ocean via the southern Indian Ocean pathway (STSW, AAIW, and mAABW), the Indo-Pacific throughflow (ITFW), and locally (PGW and RSW).
In 1995, the water-mass structure across the WIO, CIO, and EIO was dominated by STSW (30 %–39 %) in the upper intermediate depths (200–600 m) and mAABW (30 %–40 %) in the deep ocean (>800 m). AAIW made a relatively modest contribution (8 %–11 %), with its greatest influence between 500 and 1200 m. The ITFW (8 %–15 %) and local water masses (PGW and RSW; 9 %–13 %) contributed similarly. Within the OMZs, STSW and mAABW remained the dominant water masses, whereas AAIW contributed only 1 %–3 %. The two OMZs differed primarily in their intermediate water contributions: the AS OMZ was characterized by strong contributions from local water masses (PGW and RSW), whereas the BoB OMZ showed a greater influence from ITFW, indicating distinct regional ventilation pathways.
Compared with 1995, recent years analyses shows that the contribution of STSW has increased across all transects, whereas the proportion of ITFW and PGW decreased. A similar trend was evident in the AS OMZ and the BoB OMZ, where the contribution of STSW increased while that of PGW, mAABW, and ITFW decreased. These changes are consistent with a reorganization of the shallow IO-MOC in response to the weakening of the warm water return flow of the THC in the Indian Ocean and monsoon-driven upwelling in the Arabian Sea. Consistent with other studies, our findings revealed that the enhanced inflow of oxygen-rich remote SWTs increased the physical oxygen supply. However, in contrast to other results, our findings indicate increased biological oxygen consumption, which partly offsets the effect of increased oxygen supply on oxygen concentration in the OMZs. Such increased oxygen consumption was attributed to longer residence times of water masses in the Indian Ocean basin due to a slowdown in the THC and a shallow IO-MOC. Nevertheless, the net result was an overall increase in dissolved oxygen in both the AS and BoB OMZ. Paleoceanographic studies indicate a strong link between climate change in the North Atlantic and the AS OMZ on glacial and interglacial timescales. In contrast to the present, where ITF weakening is primarily caused by climate-driven circulation changes, past variations in the ITF were linked to extreme sea-level changes on glacial-interglacial timescales. However, the underlying mechanism remains the same: a reduced ITF favors an increased meridional flow and ventilation of the OMZs. Therefore, the future of Indian Ocean OMZs depends on the reorganization and transfer rate of the shallow IO-MOC.
The data and codes to reproduce our results are available for download here: https://doi.org/10.5281/zenodo.21210975 (Oboh, 2026).
The supplement related to this article is available online at https://doi.org/10.5194/bg-23-5759-2026-supplement.
Cruise data collection: T.R, B.G., and N.L. Data curation: E.O. Data preparation, coding, and analysis: E.O. Funding acquisition: T.R, B.G. PYOMPA package development and code review: A.S. Writing: E.O. Reviews and editing: T.R, B.G, N.L., A.S.
The contact author has declared that none of the authors has any competing interests.
Publisher's note: Copernicus Publications remains neutral with regard to jurisdictional claims made in the text, published maps, institutional affiliations, or any other geographical representation in this paper. The authors bear the ultimate responsibility for providing appropriate place names. Views expressed in the text are those of the authors and do not necessarily reflect the views of the publisher.
We appreciate the efforts and contributions of the entire team who participated in the SONNE SO303 cruise in January to February 2024. Furthermore, many thanks to the German Federal Ministry of Education and Research (BMBF); this work was only possible with their funding (grant nos. 03G0303B and 03G0303A). Finally, we appreciate the entire team at Leibniz Centre for Tropical Marine Research (ZMT), Bremen for providing a conducive environment and the tools needed for research and learning.
The research was funded by Federal Ministry of Education and Research (BMBF) (grant nos. 03G0303B and 03G0303A).
This paper was edited by Huixiang Xie and reviewed by two anonymous referees.
Abbott, K. and Mahadevan, A.: Why Is the Monsoon Coastal Upwelling Signal Subdued in the Bay of Bengal?, J. Geophys. Res.-Oceans, 129, e2024JC022023, https://doi.org/10.1029/2024JC022023, 2024.
Abram, N. J., Gagan, M. K., McCulloch, M. T., Chappell, J., and Hantoro, W. S.: Coral Reef Death During the 1997 Indian Ocean Dipole Linked to Indonesian Wildfires, Science, 301, 952–955, 2003.
Acharya, S. S. and Panigrahi, M. K.: Eastward shift and maintenance of Arabian Sea oxygen minimum zone: Understanding the paradox, Deep-Sea Res. Pt. I, 115, 240–252, https://doi.org/10.1016/j.dsr.2016.07.004, 2016.
Altabet, M. A., Murray, D. W., and Prell, W. L.: Climatically linked oscillations in Arabian Sea denitrification over the past 1 my: Implications for the marine N cycle, Paleoceanography, 14, 732–743, 1999.
Anderson, L. A. and Sarmiento, J. L.: Redfield ratios of remineralization determined by nutrient data analysis, Global Biogeochem. Cy., 8, 65–80, 1994.
Ayers, J. M., Strutton, P. G., Coles, V. J., Hood, R. R., and Matear, R. J.: Indonesian throughflow nutrient fluxes and their potential impact on Indian Ocean productivity, Geophys. Res. Lett., 41, 5060–5067, 2014.
Banse, K., Naqvi, S., Narvekar, P., Postel, J., and Jayakumar, D.: Oxygen minimum zone of the open Arabian Sea: variability of oxygen and nitrite from daily to decadal timescales, Biogeosciences, 11, 2237–2261, 2014.
Beal, L. M., Ffield, A., and Gordon, A. L.: Spreading of Red Sea overflow waters in the Indian Ocean, J. Geophys. Res.-Oceans, 105, 8549–8564, 2000.
Beal, L. M., Chereskin, T. K., Lenn, Y. D., and Elipot, S.: The sources and mixing characteristics of the Agulhas Current, J. Phys. Oceanogr., 36, 2060–2074, 2006.
Benson, B. B. and Krause Jr., D.: The concentration and isotopic fractionation of gases dissolved in freshwater in equilibrium with the atmosphere. 1. Oxygen, Limnol. Oceanogr., 25, 662–671, https://doi.org/10.4319/lo.1980.25.4.0662, 1980.
Benson, B. B. and Krause Jr., D.: The concentration and isotopic fractionation of oxygen dissolved in freshwater and seawater in equilibrium with the atmosphere 1, Limnol. Oceanogr., 29, 620–632, 1984.
Bhaskar, T., Sarma, V. V. S. S., and Kumar, J. P.: Potential Mechanisms Responsible for Spatial Variability in Intensity and Thickness of Oxygen Minimum Zone in the Bay of Bengal, J. Geophys. Res.-Biogeo., 126, https://doi.org/10.1029/2021jg006341, 2021.
Bjerknes, J.: A possible response of the atmospheric Hadley circulation to equatorial anomalies of ocean temperature, Tellus, 18, 820–829, https://doi.org/10.1111/j.2153-3490.1966.tb00303.x, 1966.
Bjerknes, J.: Atmospheric Teleconnections from the Equatorial Pacific, Mon. Weather Rev., 97, 163–172, 1969.
Bopp, L., Resplandy, L., Untersee, A., Le Mezo, P., and Kageyama, M.: Ocean (de)oxygenation from the Last Glacial Maximum to the twenty-first century: insights from Earth System models, Philos. T. R. Soc. A, 375, 20160323, https://doi.org/10.1098/rsta.2016.0323, 2017.
Bower, A. S., Hunt, H. D., and Price, J. F.: Character and dynamics of the Red Sea and Persian Gulf outflows, J. Geophys. Res.-Oceans, 105, 6387–6414, 2000.
Breitburg, D., Levin, L. A., Oschlies, A., Grégoire, M., Chavez, F. P., Conley, D. J., Garçon, V., Gilbert, D., Gutiérrez, D., Isensee, K., Jacinto, G. S., Limburg, K. E., Montes, I., Naqvi, S. W. A., Pitcher, G. C., Rabalais, N. N., Roman, M. R., Rose, K. A., Seibel, B. A., Telszewski, M., Yasuhara, M., and Zhang, J.: Declining oxygen in the global ocean and coastal waters, Science, 359, eaam7240, https://doi.org/10.1126/science.aam7240, 2018.
Brock, J. C., McClain, C. R., Luther, M. E., and Hay, W. W.: The Phytplankton Bloom in the Northwestern Arabian Sea During the Southwest Monsoon of 1979, J. Geophys. Res., 96, 20623–620642, 1991.
Brock, J. C., McClain, C. R., Anderson, D. M., Prell, W. L., and Hay, W. W.: Southwest Monsoon Circulation and Environments of Recent Planktonic Foraminifera in the Northwestern Arabian Sea, Paleoceanography, 7, 799–813, 1992.
Broecker, W. S.: The Great Ocean Conveyor, Oceanography, 4, 79–89, 1991.
Caesar, L., McCarthy, G., Thornalley, D., Cahill, N., and Rahmstorf, S.: Current Atlantic meridional overturning circulation weakest in last millennium, Nat. Geosci., 14, 118–120, https://doi.org/10.1038/s41561-021-00699-z, 2021.
Cavan, E. L., Trimmer, M., Shelley, F., and Sanders, R.: Remineralization of particulate organic carbon in an ocean oxygen minimum zone, Nat. Commun., 8, 14847, https://doi.org/10.1038/ncomms14847, 2017.
Chavez, F. P. and Messié, M.: A comparison of Eastern Boundary Upwelling Ecosystems, Prog. Oceanogr., 83, 80–96, 2009.
Chinni, V., Singh, S. K., Bhushan, R., Rengarajan, R., and Sarma, V.: Spatial variability in dissolved iron concentrations in the marginal and open waters of the Indian Ocean, Mar. Chem., 208, 11–28, 2019.
Coatanoan, C., Metzl, N., Fieux, M., and Coste, B.: Seasonal water mass distribution in the Indonesian throughflow entering the Indian Ocean, J. Geophys. Res.-Oceans, 104, 20801–20826, 1999.
de Brauwere, A., Jacquet, S. H., De Ridder, F., Dehairs, F., Pintelon, R., Schoukens, J., and Baeyens, W.: Water mass distributions in the Southern Ocean derived from a parametric analysis of mixing water masses, J. Geophys. Res.-Oceans, 112, https://doi.org/10.1029/2006JC003742, 2007.
de la Vara, A., Parras-Berrocal, I. M., Izquierdo, A., Sein, D. V., and Cabos, W.: Climate change signal in the ocean circulation of the Tyrrhenian Sea, Earth Syst. Dynam., 13, 303–319, https://doi.org/10.5194/esd-13-303-2022, 2022.
DiNezio, P. N. and Tierney, J. E.: The effect of sea level on glacial Indo-Pacific climate, Nat. Geosci., 6, 485–491, 2013.
Ditkovsky, S., Resplandy, L., and Busecke, J.: Unique ocean circulation pathways reshape the Indian Ocean oxygen minimum zone with warming, Biogeosciences, 20, 4711–4736, 2023.
Durgadoo, J. V., Rühs, S., Biastoch, A., and Böning, C. W. B.: Indian Ocean sources of Agulhas leakage, J. Geophys. Res.-Oceans, https://doi.org/10.1002/2016JC012676, 2017.
Duteil, O. and Oschlies, A.: Sensitivity of Simulated Extent and Future Evolution of Marine Suboxia to Mixing Intensity, Geophys. Res. Lett., 38, https://doi.org/10.1029/2011gl046877, 2011.
Ekau, W., Auel, H., Pörtner, H.-O., and Gilbert, D.: Impacts of hypoxia on the structure and processes in pelagic communities (zooplankton, macro-invertebrates and fish), Biogeosciences, 7, 1669–1699, https://doi.org/10.5194/bg-7-1669-2010, 2010.
Fine, R. A.: Circulation of Antarctic intermediate water in the South Indian Ocean, Deep-Sea Res. Pt. I, 40, 2021–2042, 1993.
Gadgil, S., Rajeevan, M., and Francis, P. A.: Monsoon variability: Links to major oscillations over the equatorial Pacific and Indian oceans, Curr. Sci., 93, 182–194, 2007.
Gaye, B., Andersch, T., Bartsch, P., Cosmus, H., Dähnke, K., Dasbach, D., Eisnecker, P., Gök, I., Harms, N., Hubert-Huard, R., Hüge, F., John, F., Keuter, S., Kretzschmann, L., Lahajnar, N., Lisitano, L., Lüdmann, T., Markfort, G., Meiritz, L., Oldhaver, M., Penopp, J., Prien, R. D., Rixen, T., Ruda, L., Sanders, T., Schulz, G., Schulz, H., Siccha, M., Sommer, M., Sorge, Y., and Waniek, J. J.: BIOGeochemistry in the equatorial INdian Ocean – BIOGIN-IIOE2, Cruise No. SO303, 23 January 2024–19 February 2024, La Réunion (France) – Colombo (Sri Lanka), Begutachtungspanel Forschungsschiffe, Bonn2510-764X, 1–81, https://doi.org/10.48433/cr_so303, 2024.
Godfrey, J. S.: The effect of the Indonesian throughflow on ocean circulation and heat exchange with the atmosphere: A review, J. Geophys. Res., 101, 12217–212237, 1996.
Goes, J., Tian, H., Gomes, H. d. R., Anderson, O., Al-Hashmi, K., deRada, S., Luo, H., Al-Kharusi, L., Al-Azri, A., and Martinson, D.: Ecosystem state change in the Arabian Sea fuelled by the recent loss of snow over the Himalayan-Tibetan Plateau region, Sci. Rep., 10, 7422, https://doi.org/10.1038/s41598-020-64360-2, 2020.
Gordon, A. L.: Interocean Exchange of Thermocline Water, J. Geophys. Res., 91, 5037–5046, https://doi.org/10.1029/JC091iC04p05037, 1986.
Gordon, A. L., Ma, S., Olson, D. B., Hacker, P., Ffield, A., Talley, L. D., Wilson, D., and Baringer, M.: Advection and diffusion of Indonesian throughflow water within the Indian Ocean South Equatorial Current, Geophys. Res. Lett., 24, 2573–2576, 1997.
Gordon, A. L., Susanto, R. D., and Vranes, K.: Cool Indonesian throughflow as a consequence of restricted surface layer flow, Nature, 425, 824–828, 2003.
Gordon, A. L., Sprintall, J., Van Aken, H. M., Susanto, D., Wijffels, S., Molcard, R., Ffield, A., Pranowo, W., and Wirasantosa, S.: The Indonesian throughflow during 2004–2006 as observed by the INSTANT program, Dynam. Atmos. Oceans, 50, 115–128, https://doi.org/10.1016/j.dynatmoce.2009.12.002, 2010.
Großelindemann, H., Castruccio, F. S., Danabasoglu, G., and Biastoch, A.: Long-term variability and trends in the Agulhas Leakage and its impacts on the global overturning, Ocean Sci., 21, 93–112, https://doi.org/10.5194/os-21-93-2025, 2025.
Gou, R., Lohmann, G., and Wu, L.: Atlantic meridional overturning circulation decline: Tipping small scales under global warming, Phys. Rev. Lett., 133, 034201, https://doi.org/10.1103/PhysRevLett.133.034201, 2024.
Haake, B., Ittekkot, V., Rixen, T., Ramaswamy, V., Nair, R. R., and Curry, W. B.: Seasonality and interannual variability of particle fluxes to the deep Arabian Sea, Deep-Sea Res. Pt. I, 40, 1323–1344, 1993.
Haine, T. W., Watson, A. J., Liddicoat, M. I., and Dickson, R. R.: The flow of Antarctic bottom water to the southwest Indian Ocean estimated using CFCs, J. Geophys. Res.-Oceans, 103, 27637–27653, 1998.
Harms, N. C., Lahajnar, N., Gaye, B., Rixen, T., Dähnke, K., Ankele, M., Schwarz-Schampera, U., and Emeis, K.-C.: Nutrient distribution and nitrogen and oxygen isotopic composition of nitrate in water masses of the subtropical southern Indian Ocean, Biogeosciences, 16, 2715–2732, 2019.
Hupe, A. and Karstensen, J.: Redfield stoichiometry in Arabian Sea subsurface waters, Global Biogeochem. Cy., 14, 357–372, 2000.
Jeansson, E., Steinfeldt, R., and Tanhua, T.: Water mass ages based on GLODAPv2 data product (NCEI Accession 0226793), NOAA National Centers for Environmental Information [data set], https://doi.org/10.25921/xp33-q351, 2021.
Johnson, G. C.: Quantifying Antarctic bottom water and North Atlantic deep water volumes, J. Geophys. Res.-Oceans, 113, https://doi.org/10.1029/2007JC004477, 2008.
Johnson, K. S., Riser, S. C., and Ravichandran, M.: Oxygen variability controls denitrification in the Bay of Bengal oxygen minimum zone, Geophys. Res. Lett., 46, 804–811, 2019.
Koch-Larrouy, A., Morrow, R., Penduff, T., and Juza, M.: Origin and mechanism of Subantarctic Mode Water formation and transformation in the Southern Indian Ocean, Ocean Dynam., 60, 563–583, 2010.
Kulk, G., Platt, T., Dingle, J., Jackson, T., Jönsson, B. F., Bouman, H. A., Babin, M., Brewin, R. J., Doblin, M., and Estrada, M.: Primary production, an index of climate change in the ocean: satellite-based estimates over two decades, Remote Sens., 12, 826, https://doi.org/10.3390/rs12050826, 2020.
Kumar, S. P. and Prasad, T.: Formation and spreading of Arabian Sea high‐salinity water mass, J. Geophys. Res.-Oceans, 104, 1455–1464, 1999.
Kwiatkowski, L., Torres, O., Bopp, L., Aumont, O., Chamberlain, M., Christian, J. R., Dunne, J. P., Gehlen, M., Ilyina, T., John, J. G., Lenton, A., Li, H., Lovenduski, N. S., Orr, J. C., Palmieri, J., Santana-Falcón, Y., Schwinger, J., Séférian, R., Stock, C. A., Tagliabue, A., Takano, Y., Tjiputra, J., Toyama, K., Tsujino, H., Watanabe, M., Yamamoto, A., Yool, A., and Ziehn, T.: Twenty-first century ocean warming, acidification, deoxygenation, and upper-ocean nutrient and primary production decline from CMIP6 model projections, Biogeosciences, 17, 3439–3470, https://doi.org/10.5194/bg-17-3439-2020, 2020.
Lachkar, Z., Lévy, M., and Smith, S.: Intensification and deepening of the Arabian Sea oxygen minimum zone in response to increase in Indian monsoon wind intensity, Biogeosciences, 15, 159–186, https://doi.org/10.5194/bg-15-159-2018, 2018.
Lachkar, Z., Lévy, M., and Smith, K. S.: Strong Intensification of the Arabian Sea Oxygen Minimum Zone in Response to Arabian Gulf Warming, Geophys. Res. Lett., 46, 5420–5429, https://doi.org/10.1029/2018GL081631, 2019.
Lauvset, S. K., Lange, N., Tanhua, T., Bittig, H. C., Olsen, A., Kozyr, A., Alin, S., Álvarez, M., Azetsu-Scott, K., Barbero, L., Becker, S., Brown, P. J., Carter, B. R., da Cunha, L. C., Feely, R. A., Hoppema, M., Humphreys, M. P., Ishii, M., Jeansson, E., Jiang, L.-Q., Jones, S. D., Lo Monaco, C., Murata, A., Müller, J. D., Pérez, F. F., Pfeil, B., Schirnick, C., Steinfeldt, R., Suzuki, T., Tilbrook, B., Ulfsbo, A., Velo, A., Woosley, R. J., and Key, R. M.: GLODAPv2.2022: the latest version of the global interior ocean biogeochemical data product, Earth Syst. Sci. Data, 14, 5543–5572, https://doi.org/10.5194/essd-14-5543-2022, 2022.
Lee, T., Fukumori, I., Menemenlis, D., Xing, Z., and Fu, L.-L.: Effects of the Indonesian throughflow on the Pacific and Indian Oceans, J. Phys. Oceanogr., 32, 1404–1429, 2002.
Liu, T., Qiu, Y., Lin, X., Ni, X., Wang, L., Li, H., and Jing, C.: Dissolved oxygen recovery in the oxygen minimum zone of the Arabian Sea in recent decade as observed by BGC-argo floats, Geophys. Res. Lett., 51, e2024GL108841, https://doi.org/10.1029/2024GL108841, 2024.
Malone, T., Azzaro, M., Bode, A., Brown, E., Duce, R., Kamykowski, D., Kang, S., Kedong, Y., Thorndyke, M., and Wang, J.: Primary Production, Cycling of Nutrients, Surface Layer and Plankton, Centro Oceanográfico de A Coruña, http://hdl.handle.net/10261/316293 (last access: 15 February 2026), 2015.
Mantyla, A. W. and Reid, J. L.: On the origins of deep and bottom waters of the Indian Ocean, J. Geophys. Res.-Oceans, 100, 2417–2439, 1995.
Menezes, V. V., Macdonald, A. M., and Schatzman, C.: Accelerated freshening of Antarctic Bottom Water over the last decade in the Southern Indian Ocean, Science Advances, 3, e1601426, https://doi.org/10.1126/sciadv.1601426, 2017.
Narvekar, J., Kesserkar, P., Sreejith, K., Fernandes, L., and Kumar, S. P.: Recent oxygenation of oxygen minimum zone in the Arabian Sea and possible causes, Prog. Oceanogr., 103600, https://doi.org/10.1016/j.pocean.2025.103600, 2025.
Nayak, A. A., Vinayachandran, P., and George, J. V.: Arabian Sea high salinity core supplies oxygen to Bay of Bengal oxygen minimum zone, arXiv [preprint], https://doi.org/10.48550/arXiv.2406.10571, 2024.
Oboh, E.: Oxygen minimum zones in the Indian Ocean and their response to changes in the Indian Ocean meridional circulation, Zenodo [data set and code], https://doi.org/10.5281/zenodo.21210975, 2026.
Olsen, A., Lange, N., Key, R. M., Tanhua, T., Álvarez, M., Becker, S., Bittig, H. C., Carter, B. R., Cotrim da Cunha, L., Feely, R. A., van Heuven, S., Hoppema, M., Ishii, M., Jeansson, E., Jones, S. D., Jutterström, S., Karlsen, M. K., Kozyr, A., Lauvset, S. K., Lo Monaco, C., Murata, A., Pérez, F. F., Pfeil, B., Schirnick, C., Steinfeldt, R., Suzuki, T., Telszewski, M., Tilbrook, B., Velo, A., and Wanninkhof, R.: GLODAPv2.2019 – an update of GLODAPv2, Earth Syst. Sci. Data, 11, 1437–1461, https://doi.org/10.5194/essd-11-1437-2019, 2019.
Oschlies, A., Duteil, O., Getzlaff, J., Koeve, W., Landolfi, A., and Schmidtko, S.: Patterns of deoxygenation: sensitivity to natural and anthropogenic drivers, Philos. T. R. Soc. A, 375, 20160325, https://doi.org/10.1098/rsta.2016.0325, 2017.
Oschlies, A., Brandt, P., Stramma, L., and Schmidtko, S.: Drivers and mechanisms of ocean deoxygenation, Nat. Geosci., 11, 467–473, https://doi.org/10.1038/s41561-018-0152-2, 2018.
Parvathi, V., Thadathil, P., Rajkumar, M., Prasannakumar, S., Muraleedharan, P., Ravichandran, M., Rao, R., and Gopalakrishna, V.: Quality of temperature and salinity data from Argo profiling floats in the Bay of Bengal, Indian J. Geo-Mar. Sci., 43, 1870–1878, https://drs.nio.res.in/drs/handle/2264/7631 (last access: 15 February 2026), 2014.
Peng, Q., Xie, S.-P., Huang, R. X., Wang, W., Zu, T., and Wang, D.: Indonesian throughflow slowdown under global warming: Remote AMOC effect versus regional surface forcing, J. Climate, 36, 1301–1318, 2023.
Phillips, H. E., Tandon, A., Furue, R., Hood, R., Ummenhofer, C. C., Benthuysen, J. A., Menezes, V., Hu, S., Webber, B., Sanchez-Franks, A., Cherian, D., Shroyer, E., Feng, M., Wijesekera, H., Chatterjee, A., Yu, L., Hermes, J., Murtugudde, R., Tozuka, T., Su, D., Singh, A., Centurioni, L., Prakash, S., and Wiggert, J.: Progress in understanding of Indian Ocean circulation, variability, air–sea exchange, and impacts on biogeochemistry, Ocean Sci., 17, 1677–1751, https://doi.org/10.5194/os-17-1677-2021, 2021.
Poole, R. and Tomczak, M.: Optimum multiparameter analysis of the water mass structure in the Atlantic Ocean thermocline, Deep-Sea Res. Pt. I, 46, 1895–1921, 1999.
Prasad, T., Ikeda, M., and Kumar, S. P.: Seasonal spreading of the Persian Gulf Water mass in the Arabian Sea, J. Geophys. Res.-Oceans, 106, 17059–17071, 2001.
Reichart, G. J., Nortier, J., Versteegh, G., and Zachariasse, W. J.: Periodical breakdown of the Arabian Sea oxygen minimum zone caused by deep convective mixing, Geological Society London Special Publications, 195, 407–419, https://doi.org/10.1144/GSL.SP.2002.195.01.22, 2002.
Rixen, T. and Ittekkot, V.: Nitrogen deficits in the Arabian Sea, implications from a three component mixing analysis, Deep-Sea Res. Pt II, 52, 1879–1891, 2005.
Rixen, T., Ittekkot, V., Herundi, B., Wetzel, P., Maier-Reimer, E., and Gaye-Haake, B.: ENSO-driven carbon see saw in the Indo-Pacific, Geophys. Res. Lett., 33, L07606, https://doi.org/10.1029/2005GL024965, 2006.
Rixen, T., Baum, A., Gaye, B., and Nagel, B.: Seasonal and interannual variations in the nitrogen cycle in the Arabian Sea, Biogeosciences, 11, 5733–5747, 2014.
Rixen, T., Gaye, B., and Emeis, K.-C.: The monsoon, carbon fluxes, and the organic carbon pump in the northern Indian Ocean, Prog. Oceanogr., 175, 24–39, https://doi.org/10.1016/j.pocean.2019.03.001, 2019.
Rixen, T., Cowie, G., Gaye, B., Goes, J., do Rosário Gomes, H., Hood, R. R., Lachkar, Z., Schmidt, H., Segschneider, J., and Singh, A.: Reviews and syntheses: Present, past, and future of the oxygen minimum zone in the northern Indian Ocean, Biogeosciences, 17, 6051–6080, 2020.
Rosenthal, Y., Oppo, D. W., and Linsley, B. K.: The amplitude and phasing of climate change during the last deglaciation in the Sulu Sea, western equatorial Pacific, Geophys. Res. Lett., 30, https://doi.org/10.1029/2002GL016612, 2003.
Roxy, M. K., Ritika, K., Terray, P., Murtugudde, R., Ashok, K., and Goswami, B.: Drying of Indian subcontinent by rapid Indian Ocean warming and a weakening land-sea thermal gradient, Nat. Commun., 6, 7423, https://doi.org/10.1038/ncomms8423, 2015.
Rudnickas, D., Palter, J. B., Hebert, D., and Rossby, T.: Isopycnal Mixing in the North Atlantic Oxygen Minimum Zone Revealed by RAFOS Floats, J. Geophys. Res.-Oceans, 124, 6478–6497, https://doi.org/10.1029/2019jc015148, 2019.
Sabu, P., George, J. V., Anilkumar, N., Chacko, R., Valsala, V., and Achuthankutty, C.: Observations of watermass modification by mesoscale eddies in the subtropical frontal region of the Indian Ocean sector of Southern Ocean, Deep-Sea Res. Pt. II, 118, 152–161, 2015.
Saji, N. H., Goswami, B. N., Vinayachandran, P. N., and Yamagata, T.: A dipole mode in the tropical Inian Ocean, Nature, 401, 360–363, 1999.
Sarmiento, J. L., Gruber, N., Brzezinski, M. A., and Dunne, J. P.: High-latitude controls of thermocline nutrients and low latitude biological productivity, Nature, 427, 56–60, 2004.
Sastry, J. S. and D'Souza, R. S.: Upwelling & Upward Mixing in the Arabian Sea, Indian J. Mar. Sci., 1, 17–27, 1972.
Schmidt, H., Czeschel, R., and Visbeck, M.: Seasonal variability of the Arabian Sea intermediate circulation and its impact on seasonal changes of the upper oxygen minimum zone, Ocean Sci., 16, 1459–1474, https://doi.org/10.5194/os-16-1459-2020, 2020.
Schmidt, H., Getzlaff, J., Löptien, U., and Oschlies, A.: Causes of uncertainties in the representation of the Arabian Sea oxygen minimum zone in CMIP5 models, Ocean Sci., 17, 1303–1320, https://doi.org/10.5194/os-17-1303-2021, 2021.
Schmidtko, S., Stramma, L., and Visbeck, M.: Decline in global oceanic oxygen content during the past five decades, Nature, 542, 335–339, 2017.
Schott, F. A. and McCreary Jr., J. P.: The monsoon circulation of the Indian Ocean, Prog. Oceanogr., 51, 1–123, 2001.
Schott, F. A., Xie, S.-P., and McCreary Jr., J. P.: Indian Ocean circulation and climate variability, Rev. Geophys., 47, https://doi.org/10.1029/2007RG000245, 2009.
Schulz, G., Dähnke, K., Sanders, T., Penopp, J., Bange, H. W., Czeschel, R., and Gaye, B.: Nitrogen dynamics and nitrate stable isotopes indicate nitrogen loss in the Bay of Bengal, EGUsphere [preprint], https://doi.org/10.5194/egusphere-2025-1660, 2025.
Schulz, H., Von Rad, U., Erlenkeuser, H., and von Rad, U.: Correlation between Arabian Sea and Greenland climate oscillations of the past 110,000 years, Nature, 393, 54–57, 1998.
Sengupta, S., Parekh, A., Chakraborty, S., Ravi Kumar, K., and Bose, T.: Vertical variation of oxygen isotope in Bay of Bengal and its relationships with water masses, J. Geophys. Res.-Oceans, 118, 6411–6424, 2013.
Sharma, G. S.: Upwelling Off the Soutwest Coast of India, Indian J. Mar. Sci., 7, 209–218, 1978.
Shee, A., Sil, S., and Gangopadhyay, A.: Recent changes in the upper oceanic water masses over the Indian Ocean using Argo data, Sci. Rep., 13, 20252, https://doi.org/10.1038/s41598-023-47658-9, 2023.
Shen, C., Moore, J. C., Kuswanto, H., and Zhao, L.: The Indonesian Throughflow circulation under solar geoengineering, Earth Syst. Dynam., 14, 1317–1332, 2023.
Shetye, S., Gouveia, A., Shankar, D., Shenoi, S., Vinayachandran, P., Sundar, D., Michael, G., and Nampoothiri, G.: Hydrography and circulation in the western Bay of Bengal during the northeast monsoon, J. Geophys. Res.-Oceans, 101, 14011–14025, 1996.
Shetye, S. R., Gouveia, A. D., Shenoi, S. S. C., Sundar, D., Michael, G. S., Almeida, A. M., and Santanam, K.: Hydrography and circulation off the west coast of India during the Southwest Monsoon 1987, J. Mar. Res., 48, 359–378, 1990.
Shrikumar, A., Lawrence, R., and Casciotti, K. L.: PYOMPA technical note, ESS Open Archive eprints, 105, 10507053, https://doi.org/10.1002/essoar.10507053.1, 2022.
Sigman, D. M. and Hain, M. P.: The Biological Productivity of the Ocean. In Nature Education Knowledge (Vol. 3, Issue 6, pp. 1–16). Nature Education, https://doi.org/10.5281/zenodo.13370237, 2012.
Singh, S. P., Singh, S. K., Goswami, V., Bhushan, R., and Rai, V. K.: Spatial distribution of dissolved neodymium and ϵNd in the Bay of Bengal: Role of particulate matter and mixing of water masses, Geochim. Cosmochim. Ac., 94, 38–56, 2012.
Sokolov, S. and Rintoul, S. R.: Structure of Southern Ocean fronts at 140 E, J. Marine Syst., 37, 151–184, 2002.
Song, Q., Gordon, A. L., and Visbeck, M.: Spreading of the Indonesian throughflow in the Indian Ocean, J. Phys. Oceanogr., 34, 772–792, 2004.
Sridevi, B. and Sarma, V.: A revisit to the regulation of oxygen minimum zone in the Bay of Bengal, J. Earth Syst. Sci., 129, 1–7, 2020.
Stramma, L., Brandt, P., Schott, F., Quadfasel, D., and Fischer, J.: Winter and summer monsoon water mass, heat and freshwater transport changes in the Arabian Sea near 8° N, Deep-Sea Res. Pt. II, 49, 1173–1195, 2002.
Stramma, L., Johnson, G. C., Sprintall, J., and Mohrholz, V.: Expanding oxygen-minimum zones in the tropical oceans, Science, 320, 655–658, https://doi.org/10.1126/science.1153847, 2008.
Stramma, L., Schmidtko, S., Levin, L. A., and Johnson, G. C.: Ocean oxygen minima expansions and their biological impacts, Deep -Sea Res. Pt. I, 57, 587–595, https://doi.org/10.1016/j.dsr.2010.01.005, 2010.
Susanto, R. D., Gordon, A. L., and Zengh, Q.: Upwelling along the coasts of Java and Sumatra and its relation to ENSO, Geophys. Res. Lett., 28, 1599–1602, 2001.
Suthhof, A., Ittekkot, V., and Gaye-Haake, B.: Millenial-scale oscillation of denitrification intensitiy in the Arabian Sea during the late Quaternary and its potential influence on atmospheric N2O and global climate, Global Biogeochem. Cy., 15, 637–650, 2001.
Sverdrup, H. U.: On the Explanation of the Oxygen Minima and Maxima in the Oceans1), ICES J. Mar. Sci., 13, 163–172, https://doi.org/10.1093/icesjms/13.2.163, 1938.
Talley, L. D.: Antarctic Intermediate Water in the South Atlantic, in: The South Atlantic: Present and Past Circulation, Springer Berlin Heidelberg, Berlin, Heidelberg, 219–238, https://doi.org/10.1007/978-3-642-80353-6_11, 1996.
Talley, L. D.: Closure of the global overturning circulation through the Indian, Pacific, and Southern Oceans: Schematics and transports, Oceanography, 26, 80–97, 2013.
Tchernia, P.: Descriptive Regional Oceanography, Pergamon Press, https://archive.org/details/descriptiveregio0000tche (last access: 15 February 2026), 1980.
Tomczak, M.: Some historical, theoretical and applied aspects of quantitative water mass analysis, J. Mar. Res., 57, 275–303, https://elischolar.library.yale.edu/journal_of_marine_research/2318 (last access: 15 February 2026), 1999.
Tomczak, M. and Large, D. G.: Optimum multiparameter analysis of mixing in the thermocline of the eastern Indian Ocean, J. Geophys. Res.-Oceans, 94, 16141–16149, 1989.
Vallivattathillam, P., Lachkar, Z., and Lévy, M.: Shrinking of the Arabian Sea oxygen minimum zone with climate change projected with a downscaled model, Frontiers in Marine Science, 10, 1123739, https://doi.org/10.3389/fmars.2023.1123739, 2023.
Vaquer-Sunyer, R. and Duarte, C. M.: Thresholds of hypoxia for marine biodiversity, P. Natl. Acad. Sci. USA, 105, 15452, https://doi.org/10.1073/pnas.0803833105, 2008.
Vianello, P., Ansorge, I., Rouault, M., and Ostrowski, M.: Transport and transformation of surface water masses across the Mascarene Plateau during the Northeast Monsoon season, Afr. J. Mar. Sci., 39, 453–466, 2017.
Webster, P. J., Moore, A. M., Loschnigg, J. P., and Leben, R. R.: Coupled ocean-atmosphere dynamics in the Indian Ocean during 1997–98, Nature, 401, 356–360, 1999.
Wyrtki, K.: Physical Oceanography of the Indian Ocean, in: The Biology of the Indian Ocean, edited by: Zeitschel, B., Springer Verlag, Berlin, Heidelberg, New York, 18–36, https://doi.org/10.1007/978-3-642-65468-8_3, 1973.
Wyrtki, K., Bennett, E. B., and Rochford, D. J.: Oceanographic atlas of the international Indian Ocean expedition, National Science Foundation, Washington D.C., 531 pp., 1971.
You, Y.: Intermediate water circulation and ventilation of the Indian Ocean derived from water-mass contributions, J. Mar. Res., 56, 1029–1067, https://elischolar.library.yale.edu/journal_of_marine_research/2299 (last access: 15 February 2026), 1998.
You, Y. and Tomczak, M.: Thermocline circulation and ventilation in the Indian Ocean derived from water mass analysis, Deep-Sea Res. Pt. I, 40, 13–56, 1993.
Yu, Z., Colin, C., Ma, R., Meynadier, L., Wan, S., Wu, Q., Kallel, N., Sepulcre, S., Dapoigny, A., and Bassinot, F.: Antarctic Intermediate Water penetration into the Northern Indian Ocean during the last deglaciation, Earth Planet. Sc. Lett., 500, 67–75, 2018.
Zhou, T., Yu, R., Li, H., and Wang, B.: Ocean forcing to changes in global monsoon precipitation over the recent half-century, J. Climate, 21, 3833–3852, 2008.