
the Creative Commons Attribution 4.0 License.
the Creative Commons Attribution 4.0 License.
 | 25 Aug 2026
Quantifying the influence of wood carbon fractions on tree- and forest ecosystem-scale carbon estimation in a temperate forest
Dilene Mugenzi
Sean C. Thomas
Audrey Barker-Plotkin
Mahendra Doraisami
Mark Givelas
Adam Gorgolewski
Rachel O. Mariani
David Orwig
Benton N. Taylor
Leeladarshini Sujeeun
Accurate forest carbon (C) estimation is critical for understanding the role forests play in the global C cycle. Forest C estimation relies on wood carbon fractions (CF) – the proportion of dry wood that is comprised of elemental carbon – in order to convert estimates of tree biomass into C stock estimates, which are then upscaled to estimate forest C stocks at larger spatial scales. Generic wood CFs are often used in C estimation frameworks, despite evidence suggesting this trait varies widely across species, and that this variability influences our understanding of C stocks in trees and forests. Here, we couple data from over 39 000 trees in a 13.5 ha forest dynamics plot in central Ontario, Canada, with open-access wood CF databases, to quantify how wood CFs influence C stock estimates from the individual tree through to 400 m2 and 1 ha forest ecosystem scales. In comparison to generalized wood CF assumptions (e.g., assuming a 50 % CF or using wood CFs from the Intergovernmental Panel on Climate Change), species-specific wood CFs significantly influence C estimates at multiple scales. In comparison to species-specific wood CF data, tree-level estimates derived from other wood CF assumptions were biased by 0.8–3.9 kg C per tree on average, with differences ranging up to >500 kg C in large trees. While relatively small, these tree-level differences compound at larger spatial scales, with C stocks estimated using generalized wood CFs differing by 1.3–3.2 Mg C ha−1 on average vs. those generated using species-specific wood CFs. These forest-scale discrepancies in C estimates increase in forest stands with high amounts of aboveground biomass in large trees and greater proportions of conifers, in some instances exceeding 23.5 Mg C ha−1 in especially biomass-dense conifer-dominated forest stands. When extrapolated to the temperate forest biome, our results indicate that a 50 % wood CF assumption – historically and presently one of the most common methodological assumptions in forest C research – overestimates global C stocks by 2.2–2.5 Pg C. Our study is among the first to examine how wood CF assumptions influence tree- and forest-scale C estimation. We specifically demonstrate that species-specific wood CF data – especially for species that comprise the largest trees – are critical to ensuring accurate C stock estimates derived from forest and tree inventory data.
- Article
(5308 KB) - Full-text XML
-
Supplement
(1063 KB) - BibTeX
- EndNote


Forests play a critical role in the global carbon (C) cycle and in mitigating climate change, with estimates from 2020 indicating that forest biomes store (95 % confidence interval [C.I.]) Pg C globally, of which ∼135.78 Pg (∼15 %) originate in the temperate forest biome (Pan et al., 2024). Between 1990–2010, forests across the globe sequestered (95 % C.I.) Pg C yr−1 (Pan et al., 2024). While global forest C sequestration has remained stable at this rate over the past three decades, the differential impacts of biotic and abiotic environmental change drivers on forest structure and composition across space and time (e.g., Anderegg et al., 2015; Hartmann et al., 2022; Simler-Williamson et al., 2019; Hogan et al., 2024; Weed et al., 2013) have led to distinct changes in sink strength across and within biomes (Yang et al., 2023; Harris et al., 2021; Xu et al., 2021).
Specifically, the C sinks in both boreal and tropical intact forests have declined by an estimated 36 % and 31 %, respectively, while temperate forest C sinks have increased by an estimated 30 % since 1990, from 0.53±0.04 (95 % C.I.) Pg C yr−1 in the 1990s to 0.69±0.05 (95 % C.I.) Pg C yr−1 in the 2010s. Increasing C sink strength among temperate forests was largely driven by afforestation in China, which offset reductions in temperate forest C sink strength in the United States and Europe (Pan et al., 2024). Standing carbon stock densities in temperate forests have followed similar trends, increasing from 157.03 Mg C ha−1 in the 1990s to 171.00 Mg C ha−1 through the 2010s (Pan et al., 2024).
Within temperate forests, ∼38 % of C stocks persist as living aboveground biomass (AGB) – the focus of our research here – while 54 % is present in soils: values that closely approximate global estimates where 43 % of C stocks exist within living AGB and ∼45 % in soils (with ∼8 % in deadwood and ∼4 % in leaf litter) (Pan et al., 2024). Carbon stocks and fluxes in living AGB in temperate forests, especially in North America, therefore represent a vitally important component of current and future global forest C cycles (Domke et al., 2020; Yang et al., 2023). In turn, accurate estimates of temperate tree and forest C stocks are critical for understanding the role forests play in mitigating the climate-forcing potential of anthropogenic greenhouse gas emissions.
Obtaining tree- and forest-level C estimates entails first determining AGB, generally done through field-based forest surveys (e.g., Davies et al., 2021) or remote sensing methods (e.g., Coops et al., 2021), and then converting AGB to C stocks by multiplying AGB by a wood carbon fraction (CF) that represents the proportion of biomass comprised of elemental carbon (Martin and Thomas, 2011; Thomas and Martin, 2012). In forest C estimation studies and models, researchers commonly assume generic wood CFs, with 50 % being the most common assumption or other generic wood CF values (reviewed by Martin et al., 2018). However, recent studies have demonstrated that a single wood CF conversion factor may overlook ecologically meaningful variability in wood chemistry across species, ultimately leading to inaccurate estimates of tree- and forest-scale C stocks.
Meta-analyses have shown that wood CFs vary across all tree species and forested biomes, ranging from 28 %–65 % (Doraisami et al., 2022 and references therein). Databases of wood traits indicate that temperate tree species have wood CFs ranging from 40.5 %–55.6 %, with angiosperms (46.5±0.3 % [s.e.]) typically having lower average wood CFs than conifers (50.1±0.4 % [s.e.]). These trends are hypothesized to reflect a larger contribution of C-rich lignin to wood chemical composition in conifers, and generally lower lignin/holocellulose ratios in angiosperm wood (Doraisami et al., 2024; Martin et al., 2018; Lamlom and Savidge, 2003). Furthermore, the published literature suggests that using a 50 % wood CF assumption, or other wood CFs recommended by the Intergovernmental Panel on Climate Change (IPCC), systematically overestimate temperate forest C stocks (cf. Table 1 in Martin et al., 2018). However, we lack a precise understanding of how this error at the tree level (in terms of kg C per tree) scales up to the ecosystem level (in terms of Mg C ha−1 of forest), since mean wood CF values across tree species do not correspond to mean values representative of whole ecosystems.
The literature documenting variability in wood chemical traits suggests C estimation errors associated with generic wood CF assumptions (especially a 50 % wood CF assumption) may be lower in certain forest communities compared to others, due to varying species composition and the proportion of angiosperms and conifers. Specifically, in forests dominated by conifers, one might expect lower C estimation errors, since conifer wood CFs are closer to 50 % or existing IPCC recommendations, as compared to angiosperms (Doraisami et al., 2024; Martin et al., 2018; Lamlom and Savidge, 2003). Conversely, C estimation in angiosperm-dominated forests would be expected to be overestimated by generic wood CF assumptions. To our knowledge, no study has integrated forest inventory data with wood CF data to test this hypothesis or quantify the magnitude of large-scale biases.
Recently published frameworks exist for selecting appropriate wood CFs for forest C estimation studies and models under different data availability scenarios (Doraisami et al., 2024). Specifically, recent work suggests that there exist different options for wood CF values that can be applied to C estimation methods and models. Generally, among the levels of wood CF determination, species-specific wood CFs – derived from wood chemical trait data (Lamlom and Savidge, 2003) or trait databases (Doraisami et al., 2022) – should produce tree- and ultimately forest-level C estimates that account for species differences in wood C chemistry. The level of species-specificity in wood CFs is considered the most data-informed trait option, relative to other wood CFs that are (a) generalized for conifers and angiosperms at varying levels of biome-specificity, or (b) reflect a generic 50 % wood CF assumption (Doraisami et al., 2024). Explicitly comparing how estimates of C differ across these approaches, across tree- to forest ecosystem scales, would provide a more detailed understanding of the degree to which wood CF assumptions influence our understanding of temperate (and global) forest C dynamics.
In this study, we paired forest inventory data from a large-scale temperate research plot (Davies et al., 2021; Kish et al., 2022) with wood CFs obtained from open-access wood trait databases (Doraisami et al., 2022) and recently developed decision matrices for integrating wood CFs into C estimation protocols (Doraisami et al., 2024), to characterize the role that wood CF variation plays in forest C estimation. We integrated these to address the following research questions: (1) What is the magnitude of error in tree-level C stocks associated with generic wood CF assumptions? (2) How does this error scale up from the tree level to the forest ecosystem level? (3) Does the magnitude of this error vary according to forest attributes, including tree species composition and/or forest biomass?
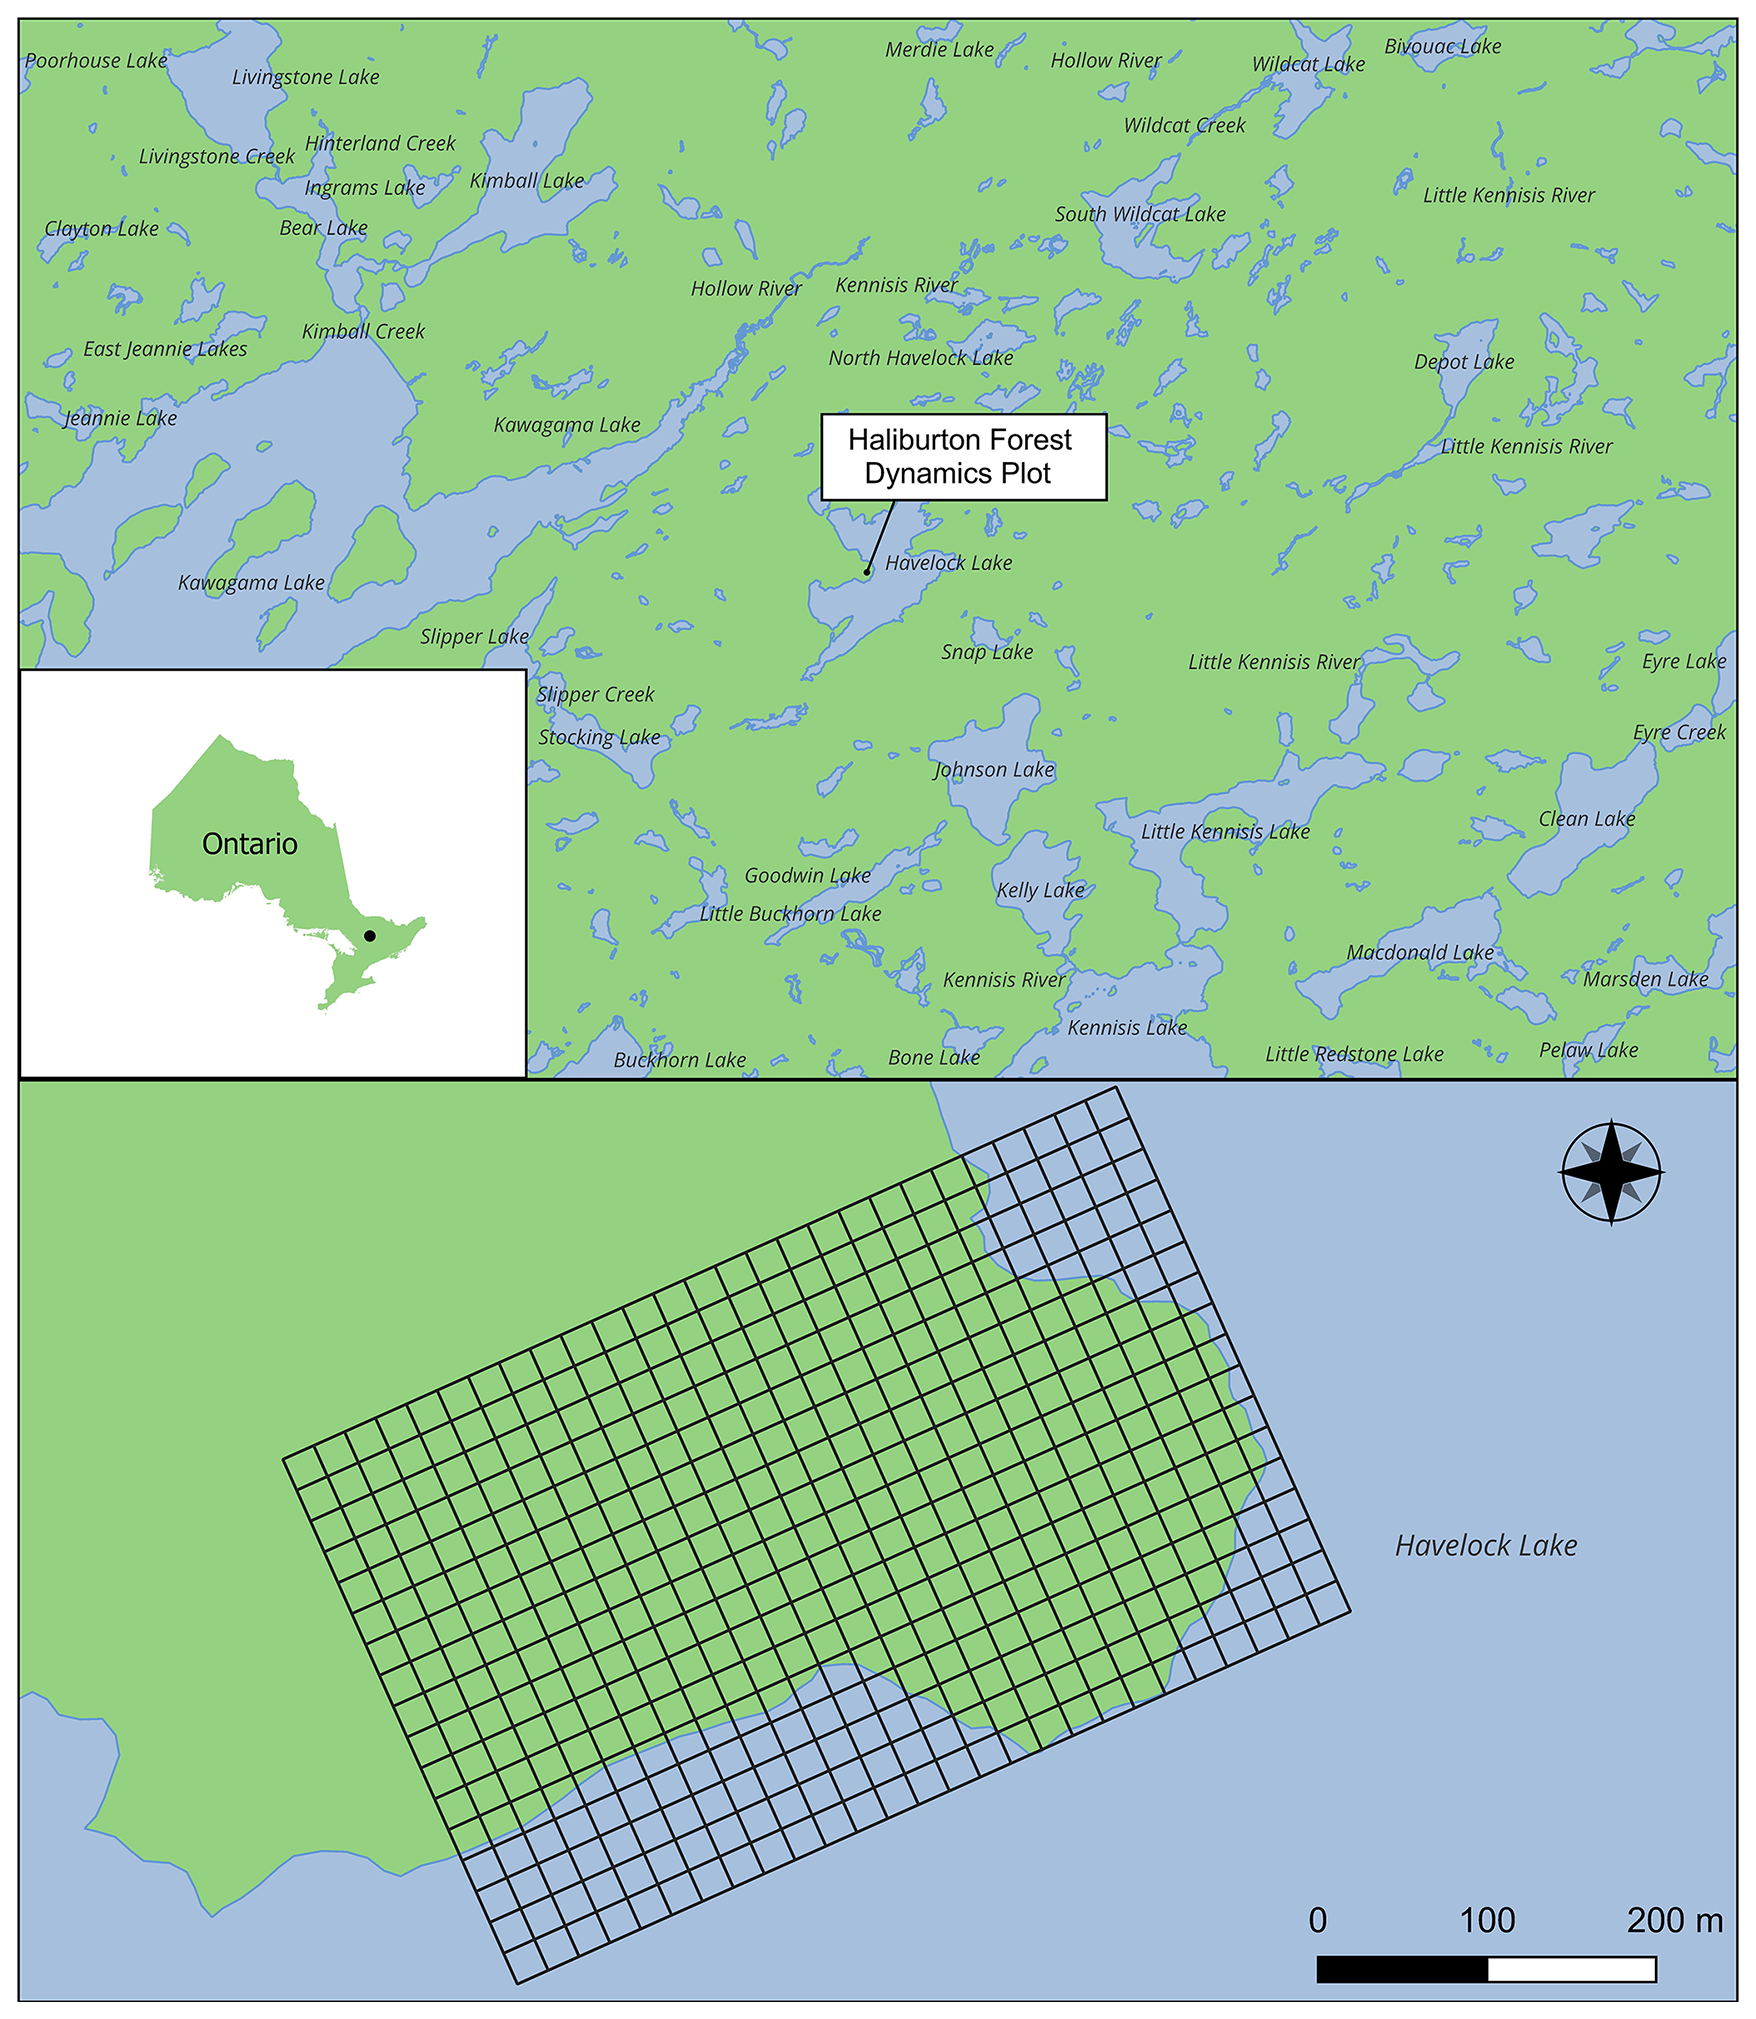
Figure 1Geographical location of the Haliburton Forest Dynamics Plot (HFDP) situated in Haliburton County, Ontario, Canada. Panels (A) and (B) represent the location of the HFDP within provincial and regional contexts, respectively, while panel (C) represents the extent of the 13.5 ha HFDP as subdivided into n=368 subplots of 400 m2 (20-by-20 m) in size.
2.1 Study site
Our study was conducted in the Haliburton Forest Dynamics Plot (HFDP), in the Haliburton Forest & Wild Life Reserve Ltd., in Ontario, Canada (43°130′ N, 78°350′ W) (Fig. 1). The HFDP is among a network of forest inventory plots of the Forest Global Earth Observatory (ForestGEO): a network comprised of 71 forest inventory plots located across all forested biomes and ranging in size from 4–50 ha (Davies et al., 2021). Across all ForestGEO plots, every tree ≥1 cm diameter at breast height (DBH) has its DBH measured, is identified to species, and is mapped every five years (Davies et al., 2021). The HFDP is located in the temperate forest biome and is representative of the Great Lakes–St. Lawrence forest region of eastern Canada and the United States (Kish et al., 2022).
The HFDP is a 13.5 ha forest inventory plot situated on the margins of a freshwater lake with an average elevation of 434 m a.s.l. across a gradient ranging from 413–454 m a.s.l. (Fig. 1). The HFDP consists of trees and shrubs belonging to 28 species, with Acer saccharum (L.), Abies balsamea ([L.] Mill.), Fagus grandifolia (Ehrh.), and Tsuga canadensis (L.) being among the most common and dominant canopy species. Within the HFDP, other common angiosperm species include Acer rubrum (L.), Betula allegheniensis (Britt.), Betula cordifolia (Regel), Prunus serotina (Ehrh.), and Quercus rubra (L.), while other common conifers include Picea glauca ([Moench] Voss), Pinus strobus (L.), and Thuja occidentalis (L.) (Kish et al., 2022). Shrubs that reach ≥1 cm DBH in the HFDP are also included in the census and our analysis here. In recent years, forest structure and C dynamics have been especially influenced by the presence and spread of beech bark disease, which is currently among the most important drivers of biomass and C dynamics in the HFDP (Kish et al., 2022).
2.2 Tree-level aboveground biomass and carbon estimation
Based on the ForestGEO sampling protocols (Davies et al., 2021), we used stem DBH values taken from the 2014 HFDP recensus to quantify aboveground biomass (AGB) and C stocks for n=39 064 trees and shrubs ≥1 cm DBH, while assuming five different wood CF scenarios. To do so, we first used DBH measurements in conjunction with published species-specific allometric equations to derive tree-level AGB estimates. Specifically, we employed allometric equations published by Lambert et al. (2005), which estimate AGB (in kg) for three separate tree compartments – stems, branches, and bark – as:
where tree DBH is measured in cm, βwood1 and βwood2 represent species-specific model coefficients for estimating AGB in stem wood, βbranches1 and βbranches2 represent species-specific model coefficients for estimating AGB in branches, and βbark1 and βbark2 represent species-specific model coefficients for estimating AGB in bark (Lambert et al., 2005). Based on these values, we then estimated total AGB for each tree (ytotal) as:
Tree-level C estimates were then calculated based on AGB data (from Eq. 4), using varying degrees of wood CF specificity: low degrees of specificity entail wood CFs that are more general in nature (i.e., a 50 % wood CF assumption for all trees), whereas a high degree of specificity entails (for example) wood CFs that are informed by species-specific trait data. The wood CFs employed in our study broadly correspond to Tiers 1–3 forest C stock estimation methods employed by the IPCC, which incorporate wood CFs at five different levels based on the framework published by Doraisami et al. (2024).
Tree-level C estimates at Level 1 (Ctree1) entail the use of species-specific wood CFs based on stem tissue. The use of wood CFs of stem tissue is due to its close correlation with wood C concentrations from all plant tissues within a given species (Martin et al., 2018; Thomas and Martin, 2012), especially with respect to species in the HFDP (Martin et al., 2015). In generating Ctree1 data, species-specific wood CF values were available for 17 of the 28 species in the HFDP dataset (Table S1). Though these 17 species represent 99.9 % of the total tree-level C stocks in our study site (based on our Ctree1 data). In the cases of the less common and small understory angiosperm tree species that did not have species-specific wood CF data, Ctree1 estimates are based on mean wood CFs from temperate angiosperms (described below).
Level 2 (Ctree2) presents a lower degree of species-specificity, whereby wood CFs are specific to angiosperms (46.5 %) and conifers (50.1 %) from temperate forested biomes. Level 3 (Ctree3) uses taxonomic divisions; however, the values for angiosperms (46.8 %) and conifers (48.5 %) are more generalized as they are derived from data for trees across all forested biomes. Wood CFs employed to generate values of Ctree2 and Ctree3 are based on global analyses of wood CF data (Martin et al., 2018) from open-access databases (Doraisami et al., 2022), which have specifically been proposed as alternatives to existing IPCC-based forest C estimation protocols (Doraisami et al., 2024).
The most generalized two levels, Levels 4 and 5, both apply a single wood CF value to all trees when converting AGB to carbon. Specifically, Level 4 (Ctree4) is based on IPCC forest C estimation guidelines (IPCC, 2006), which employs a default wood CF of 0.47 for “all” trees (their Table 4.1). Lastly, Level 5 (Ctree5) entails the use of the coarsest (and most common) wood CF assumption, employing a default wood CF of 50 % for all trees. In summary, for each of the n=39 064 individual trees within the HFDP, we generated five different tree-level C values denoted as Ctree1 through Ctree5, with decreasing species-specificity in their wood CFs used to convert all values of ytotal into Ctree values.
2.3 Statistical analysis – the influence of wood CFs on tree-level C estimates
All analyses were performed using R v. 4.2.2 statistical software (R Foundation for Statistical Computing, Vienna, Austria). To assess differences in Ctree values across different wood CF assumptions, Ctree1, which represents our most species-specific wood CF assumption, was taken as a reference point. Therefore, we statistically assessed the following contrasts: Ctree1 vs. Ctree2; Ctree1 vs. Ctree3; Ctree1 vs. Ctree4; and Ctree1 vs. Ctree5. We refined our analysis to these contrasts only because we were explicitly interested in understanding how species-specific wood CFs refined our understanding of tree- and forest-level C stocks compared to more generalized wood CF assumptions. For this analysis, we first calculated differences in tree-level C estimates (measured in kg C per tree) as Ctree1 minus Ctree2–Ctree5, such that negative values denote instances where more generalized wood CFs overestimate tree-level C estimates (compared to species-specific wood CFs) and positive differences denote instances where generic wood CFs underestimate tree-level C estimates (compared to species-specific wood CFs assumptions). We then tested whether or not these differences deviated statistically from a null expectation of no difference in Ctree values. To do so, we used a mixed effects modelling approach implemented using the “lmer” function in the “lme4” R package (Bates et al., 2015) where differences in Ctree values were predicted as a function of an intercept as the only fixed effect (corresponding to the average difference in Ctree values across all n=39 064 trees) while accounting for subplot identity and species identity as random effects. Once models were fitted we generated 95 % confidence intervals and a p-value surrounding the intercept term. Intercept terms with 95 % confidence limits that did not overlap 0 % and returned p values ≤0.05 therefore indicated statistically significant differences between any two Ctree estimates (i.e., Ctree1 vs. Ctree2–Ctree5).
Lastly, we used analysis of covariance (ANCOVA) to test if differences in tree-level C estimates owing to wood CF assumptions differ across taxonomic divisions and/or scale with tree DBH. These models were fit for each of the four sets of differences (i.e., Ctree1 minus Ctree2–Ctree5), where differences in tree-level C estimates were predicted as a function of an intercept term (corresponding to an average C stock difference between Ctree1 vs. the other four Ctree estimates), taxonomic division (as a categorical factor), DBH, a second-order polynomial DBH term (DBH2), as well as division-by-DBH and division-by-DBH2 interaction terms.
2.4 Statistical analysis – the influence of wood CFs on forest-level C estimates
To assess how wood CF assumptions scale from trees to forests, we used our data to scale all five Ctree values to two area-based estimates: (1) a 20-by-20 m subplot level (Csubplot) and (2) a per ha level (Cha). For this analysis our 20-by-20 m subplot divisions are presented visually in Fig. 1, while our per ha subdivisions follow those published by Doraisami et al. (2026, their Fig. 1) and are presented visually in our results below. At both scales, we again derived five distinct values of Csubplot and Cha for each wood CF assumption (also denoted as Csubplot1 through Csubplot5, and Cha1 through Cha5). In the HFDP, there are n=369 distinct subplots, which were then aggregated into n=10 ha of forest following previous analyses of deadwood C dynamics in the HFDP (Doraisami et al., 2026). Due to the irregular shape of the HFDP, all Csubplot values derived from subplots situated on the lake margin were scaled to their respective area (Fig. 1), with a number of subplots omitted from analyses of Cha data.
At both scales, we again calculated differences in Csubplot and Cha values, specifically comparing values underpinned by species-specific wood CF data (Csubplot1 and Cha1, respectively) vs. values derived from more general wood CFs (Csubplot2 through Csubplot4, and Cha2 through Cha4, respectively). We then used ANCOVA models to evaluate how tree biomass and species composition at the subplot or ha scale influenced differences in Csubplot or Cha values. Here, we were especially interested in understanding the role that large trees play in C estimate differences (akin to our DBH terms in the tree-level ANCOVA models above), and the role that species composition may play in driving differences (akin to the taxonomic division model terms in the ANCOVAs described above). Therefore, in these models, differences in Csubplot or Cha values between any two estimates were predicted as a function of large tree biomass (defined as the total kg of biomass in trees ≥10 cm DBH in a subplot or per ha), small tree (1–10 cm DBH) biomass, and the proportion of biomass represented by conifers in a subplot or per ha. To allow for non-linearity in relationships between biomass and discrepancies in C estimates (as informed by our tree-level analysis described below), we also included 2nd-order polynomial terms in these models for large tree biomass and small tree biomass. The sample sizes for these models were n=368 subplots and n=10 ha; so, we interpret the per-ha analysis cautiously. Finally, these models did not include any biomass-by-composition interaction terms to simplify the interpretation of our results and avoid model overfitting (especially at the per ha scale of analysis).
Table 1Summary statistics of carbon stock estimates at per tree (kg C), 400 m−2 subplot (kg C), and ha−1 (Mg C) scales, generated using five different wood carbon fraction (CF) assumptions. Descriptive statistics presented here are based on n=39 064 trees (for Ctree), n=368 subplots (for Csubplot), and n=10 ha (for Cha).
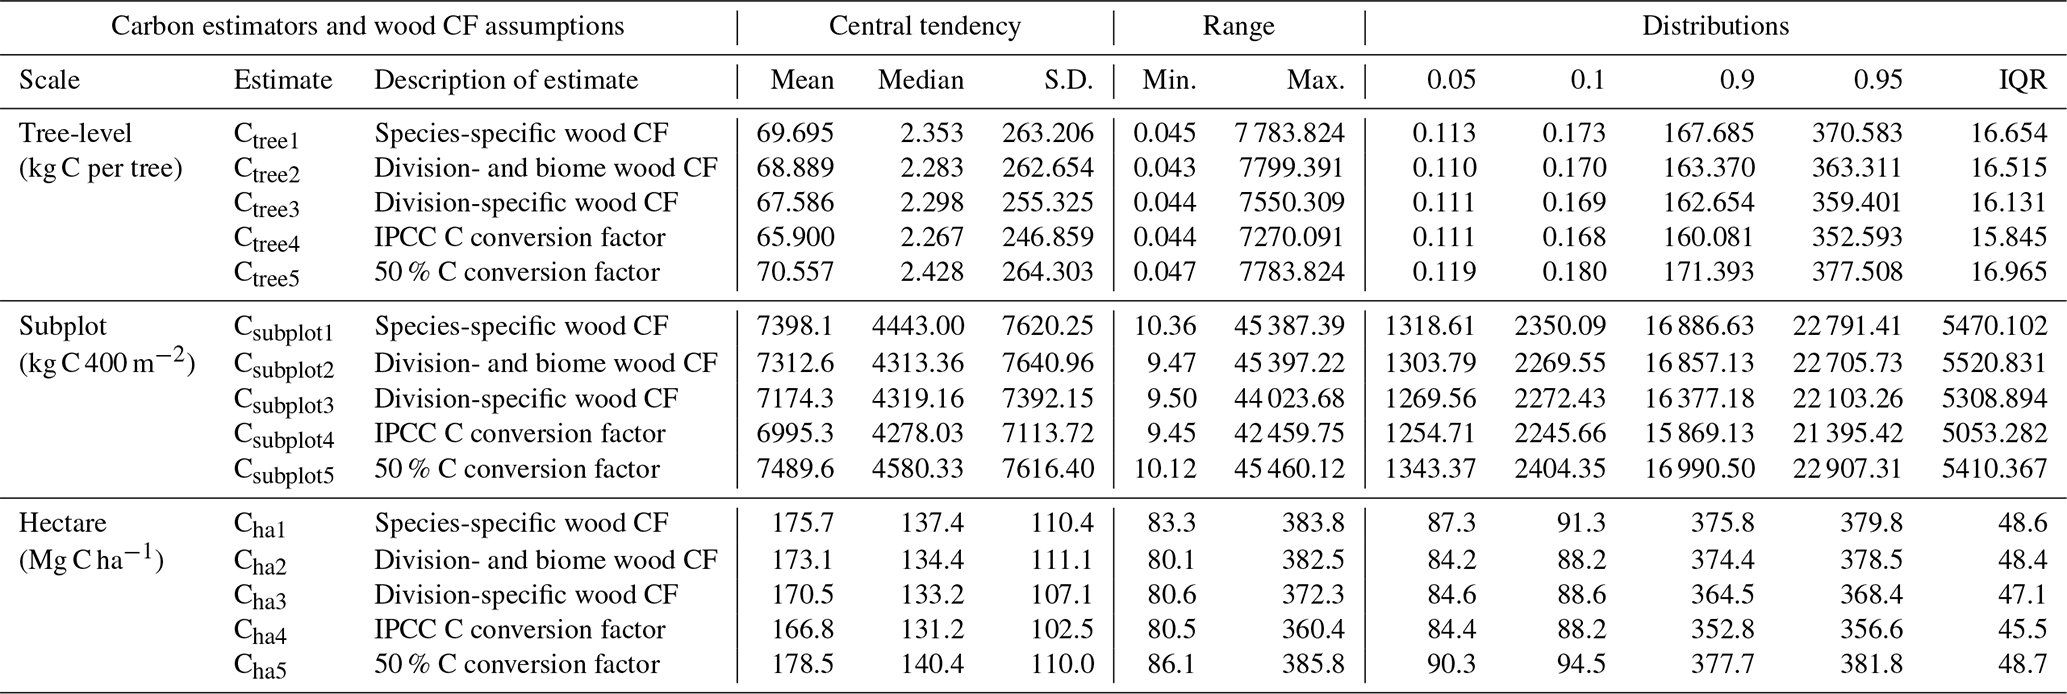
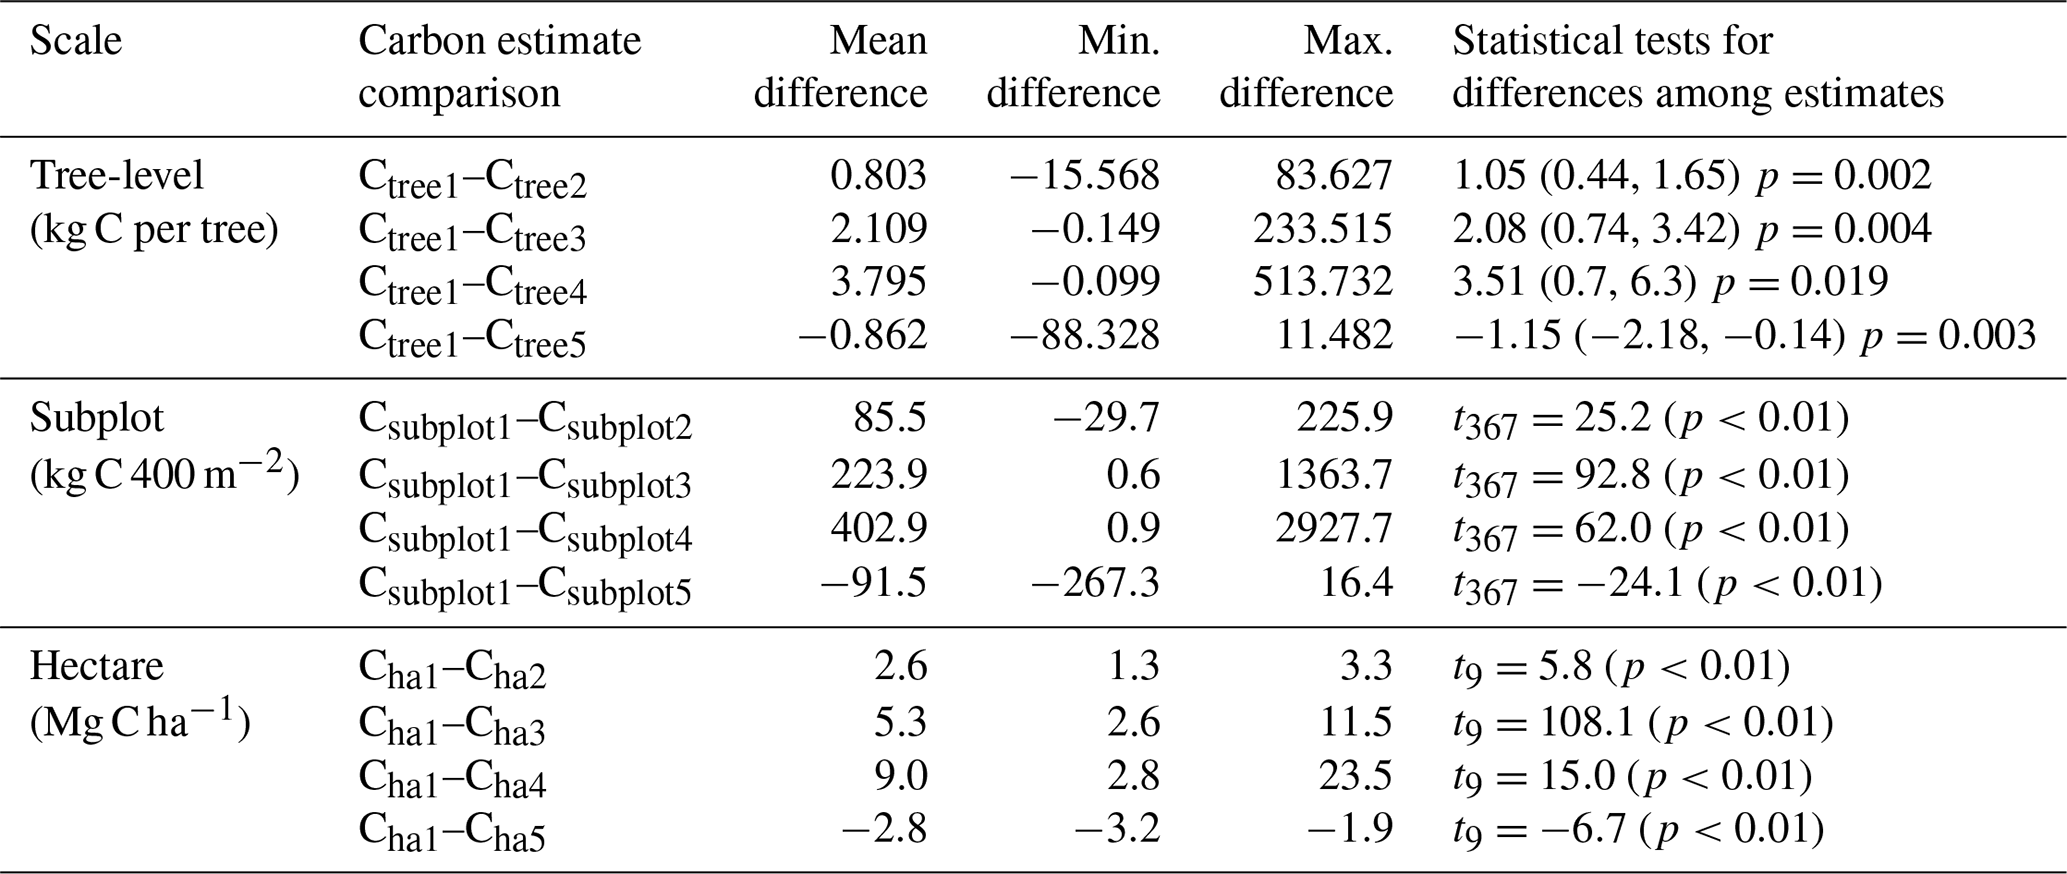
Table 2Summary statistics of carbon stock differences calculated at per tree (kg C), 400 m−2 subplot (kg C), and ha−1 (Mg C) scales, generated using five different wood carbon fraction (CF) assumptions. In these calculations, C estimates at all scales are generated by converting tree-level biomass to C with species-specific wood CF data (Ctree1, Csubplot1, and Cha1, as described in Table 1). Therefore, positive differences denote instances where more generalized wood CF assumptions underestimate tree-, subplot-, and per-ha C stock estimates (i.e., Ctree2–Ctree4, Csubplot2–Csubplot4, Cha2–Cha4), while negative values denote instances where generalized wood CF assumptions overestimate tree-, subplot-, and per-ha C stock estimates (i.e., Ctree5, Csubplot5, Cha5). Also shown are statistical tests of differences among estimates. Tree-level statistical tests correspond to the intercept term from a linear mixed effects model predicting differences in Ctree as a function of an intercept (as the only fixed effect, with 95 % confidence intervals in brackets) while accounting for spatial location and tree species identity. Subplot and per-ha statistical results correspond to paired t-tests. Summary statistics and raw values are presented visually in Fig. 2 (for Ctree comparisons), Fig. 3 (for Csubplot comparisons), and Fig. 4 (for Cha comparisons).
3.1 The influence of wood CF assumptions on tree-level C estimates
Wood CF assumptions influenced tree-level C stock estimates, with estimates of Ctree1 generated using species-specific wood CFs differing significantly from all other Ctree estimates (mixed effects model intercept term p≤0.019 across all four comparisons; Tables 1 and 2). In all but the instance of a 50 % wood CF assumption (Ctree5), species-specific wood CFs (Ctree1) resulted in significantly higher average tree-level C estimates (mean = 69.7 kg, median = 2.35 kg, range = 0.045–7783.82 kg) vs. those generated using: (a) wood CFs for temperate biome trees specific to conifers and angiosperms (Ctree2, mean = 68.9 kg, median = 2.28 kg, range = 0.044–7799.39 kg); (b) non-biome-specific wood CFs for conifers and angiosperms (Ctree3, mean = 67.59 kg, median = 2.3 kg, range = 0.044–7550.31 kg); and (c) the IPCC default wood CF assumption (Ctree4, mean = 65.9 kg, median = 2.27 kg, range = 0.044–7270.09 kg). A 50 % wood CF assumption (Ctree5) resulted in considerably higher tree-level C values (mean = 70.56 kg, median = 2.43 kg, range = 0.047–7783.82 kg) (Table 1).
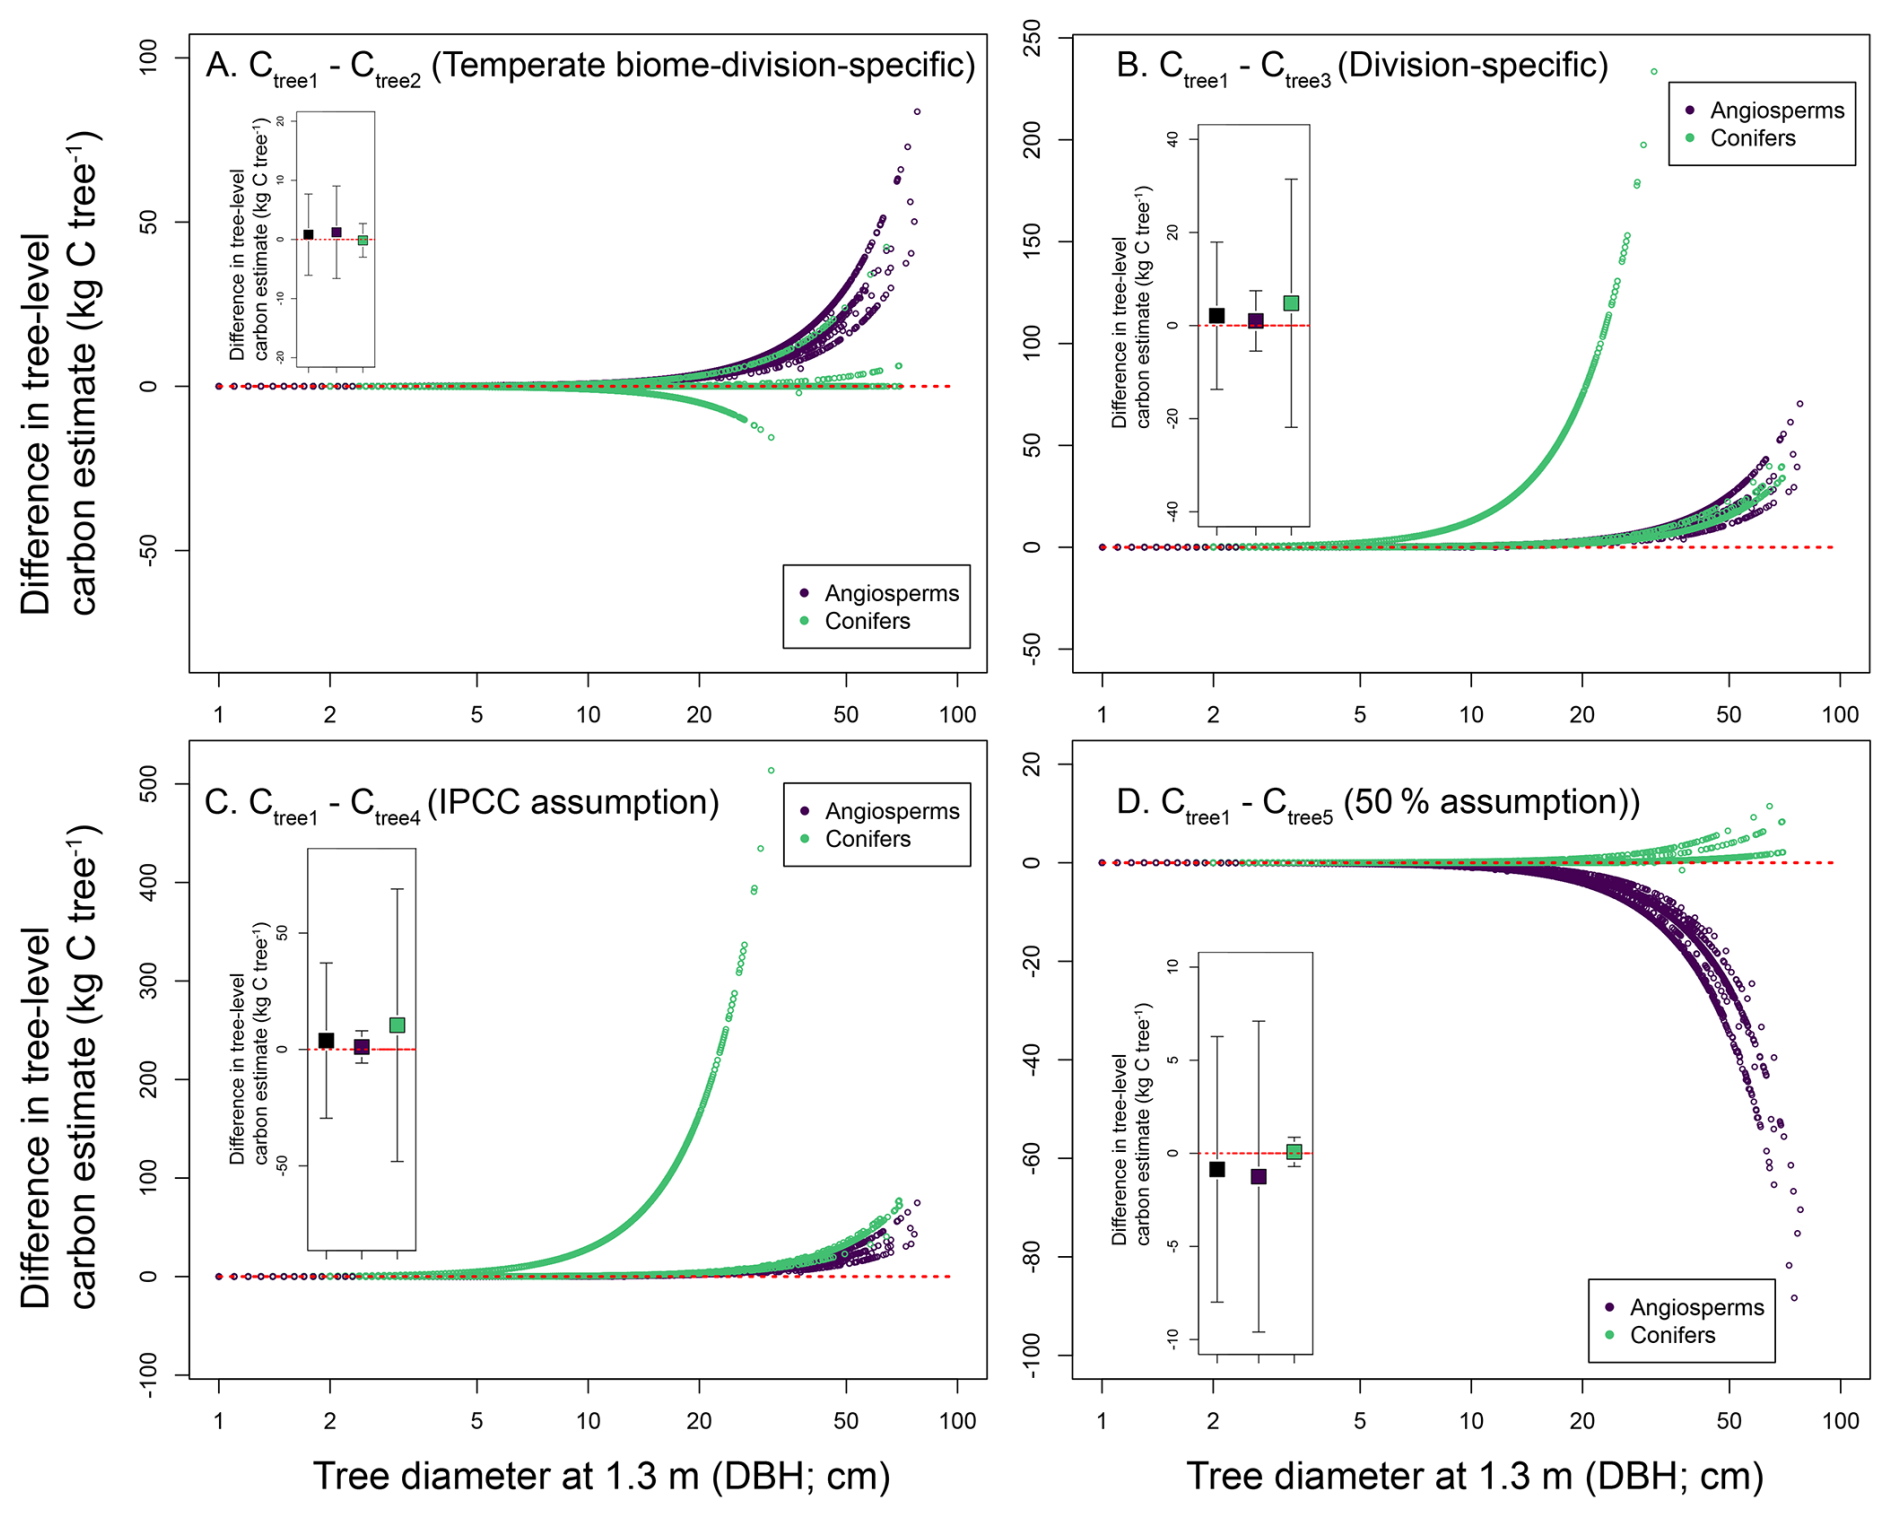
Figure 2Differences in tree-level carbon (C) stocks (measured in kg C per tree) estimated using different wood carbon fraction (CF) assumptions. Main panels show differences in tree-level C stocks for n=39 064 trees distributed across angiosperms (n=27 589 individual trees; purple open points) and conifers (n=11 475 individual trees; green open points). Differences in tree-level C estimates are calculated as follows: (A) Ctree1 (generated using species-specific wood CF data) minus Ctree2 (generated assuming wood CFs for temperate biome trees specific to conifers and angiosperms). (B) Ctree1 minus Ctree3 (generated assuming non-biome-specific wood CFs for conifers and angiosperms). (C) Ctree1 minus Ctree4 (panel C; generated assuming a single IPCC default wood CF assumption). (D) Ctree1 minus Ctree5 (generated assuming a single 50 % wood CF assumption). Red dotted lines denote 0 differences in tree-level C stock estimates, such that (i) all values above 0 indicate instances where species-specific wood CFs (Ctree1) are higher compared to estimates generated using generalized wood CF assumptions (Ctree2–Ctree5), and (ii) all values below 0 indicate instances where species-specific wood CFs (Ctree1) are lower compared to estimates generated using generalized wood CF assumptions (Ctree2–Ctree5). Inset graphs in each panel represent mean differences in Ctree estimates (calculated as in the main panels) across all trees (black symbols), angiosperms (purple-filled symbols), and conifers (green-filled symbols), with error bars denoting 2 standard deviations about the mean.
Differences in Ctree1 vs. other Ctree estimates varied significantly as a function of taxonomic division and DBH (ANCOVA model r2=0.266–0.971, p<0.01 in all cases; Fig. 2, Table S2). The ANCOVA also returned statistically significant terms for DBH2, and the division-by-DBH and division-by-DBH2 interaction terms (p<0.01 in all but one case where p=0.048): differences between Ctree1 and other Ctree estimates were larger in conifers vs. angiosperms (p<0.01 for the taxonomic division and division-by-DBH interaction terms) and scaled non-linearly with tree size (p<0.01 for the taxonomic division and division-by-DBH2 interaction terms; Fig. 2, Table S2). Non-linear increases in the absolute differences between Ctree1 vs. Ctree2−5 largely tracked allometric relationships associated with different tree species, such that these differences in Ctree increased with tree-level AGB (i.e., ytotal values). The rate at which Ctree differences increased with DBH depended on species identities (Fig. 2), reflecting differences in allometric relationships between ytotal and DBH. The strong influence of DBH on tree-level C estimates is also evidenced by our results showing that the lower 5 % of tree-level C estimates was largely consistent across Ctree1 through Ctree5 (range of lower 5 % C.I. = 0.11–0.119 kg C), though differences were more pronounced at the upper 90 % C.I. (Ctree1=169.69 kg C vs. C–171.37 kg C) and upper 95 % C.I. (Ctree1=370.58 kg C vs. C–377.508) (Fig. 2, Table 2).
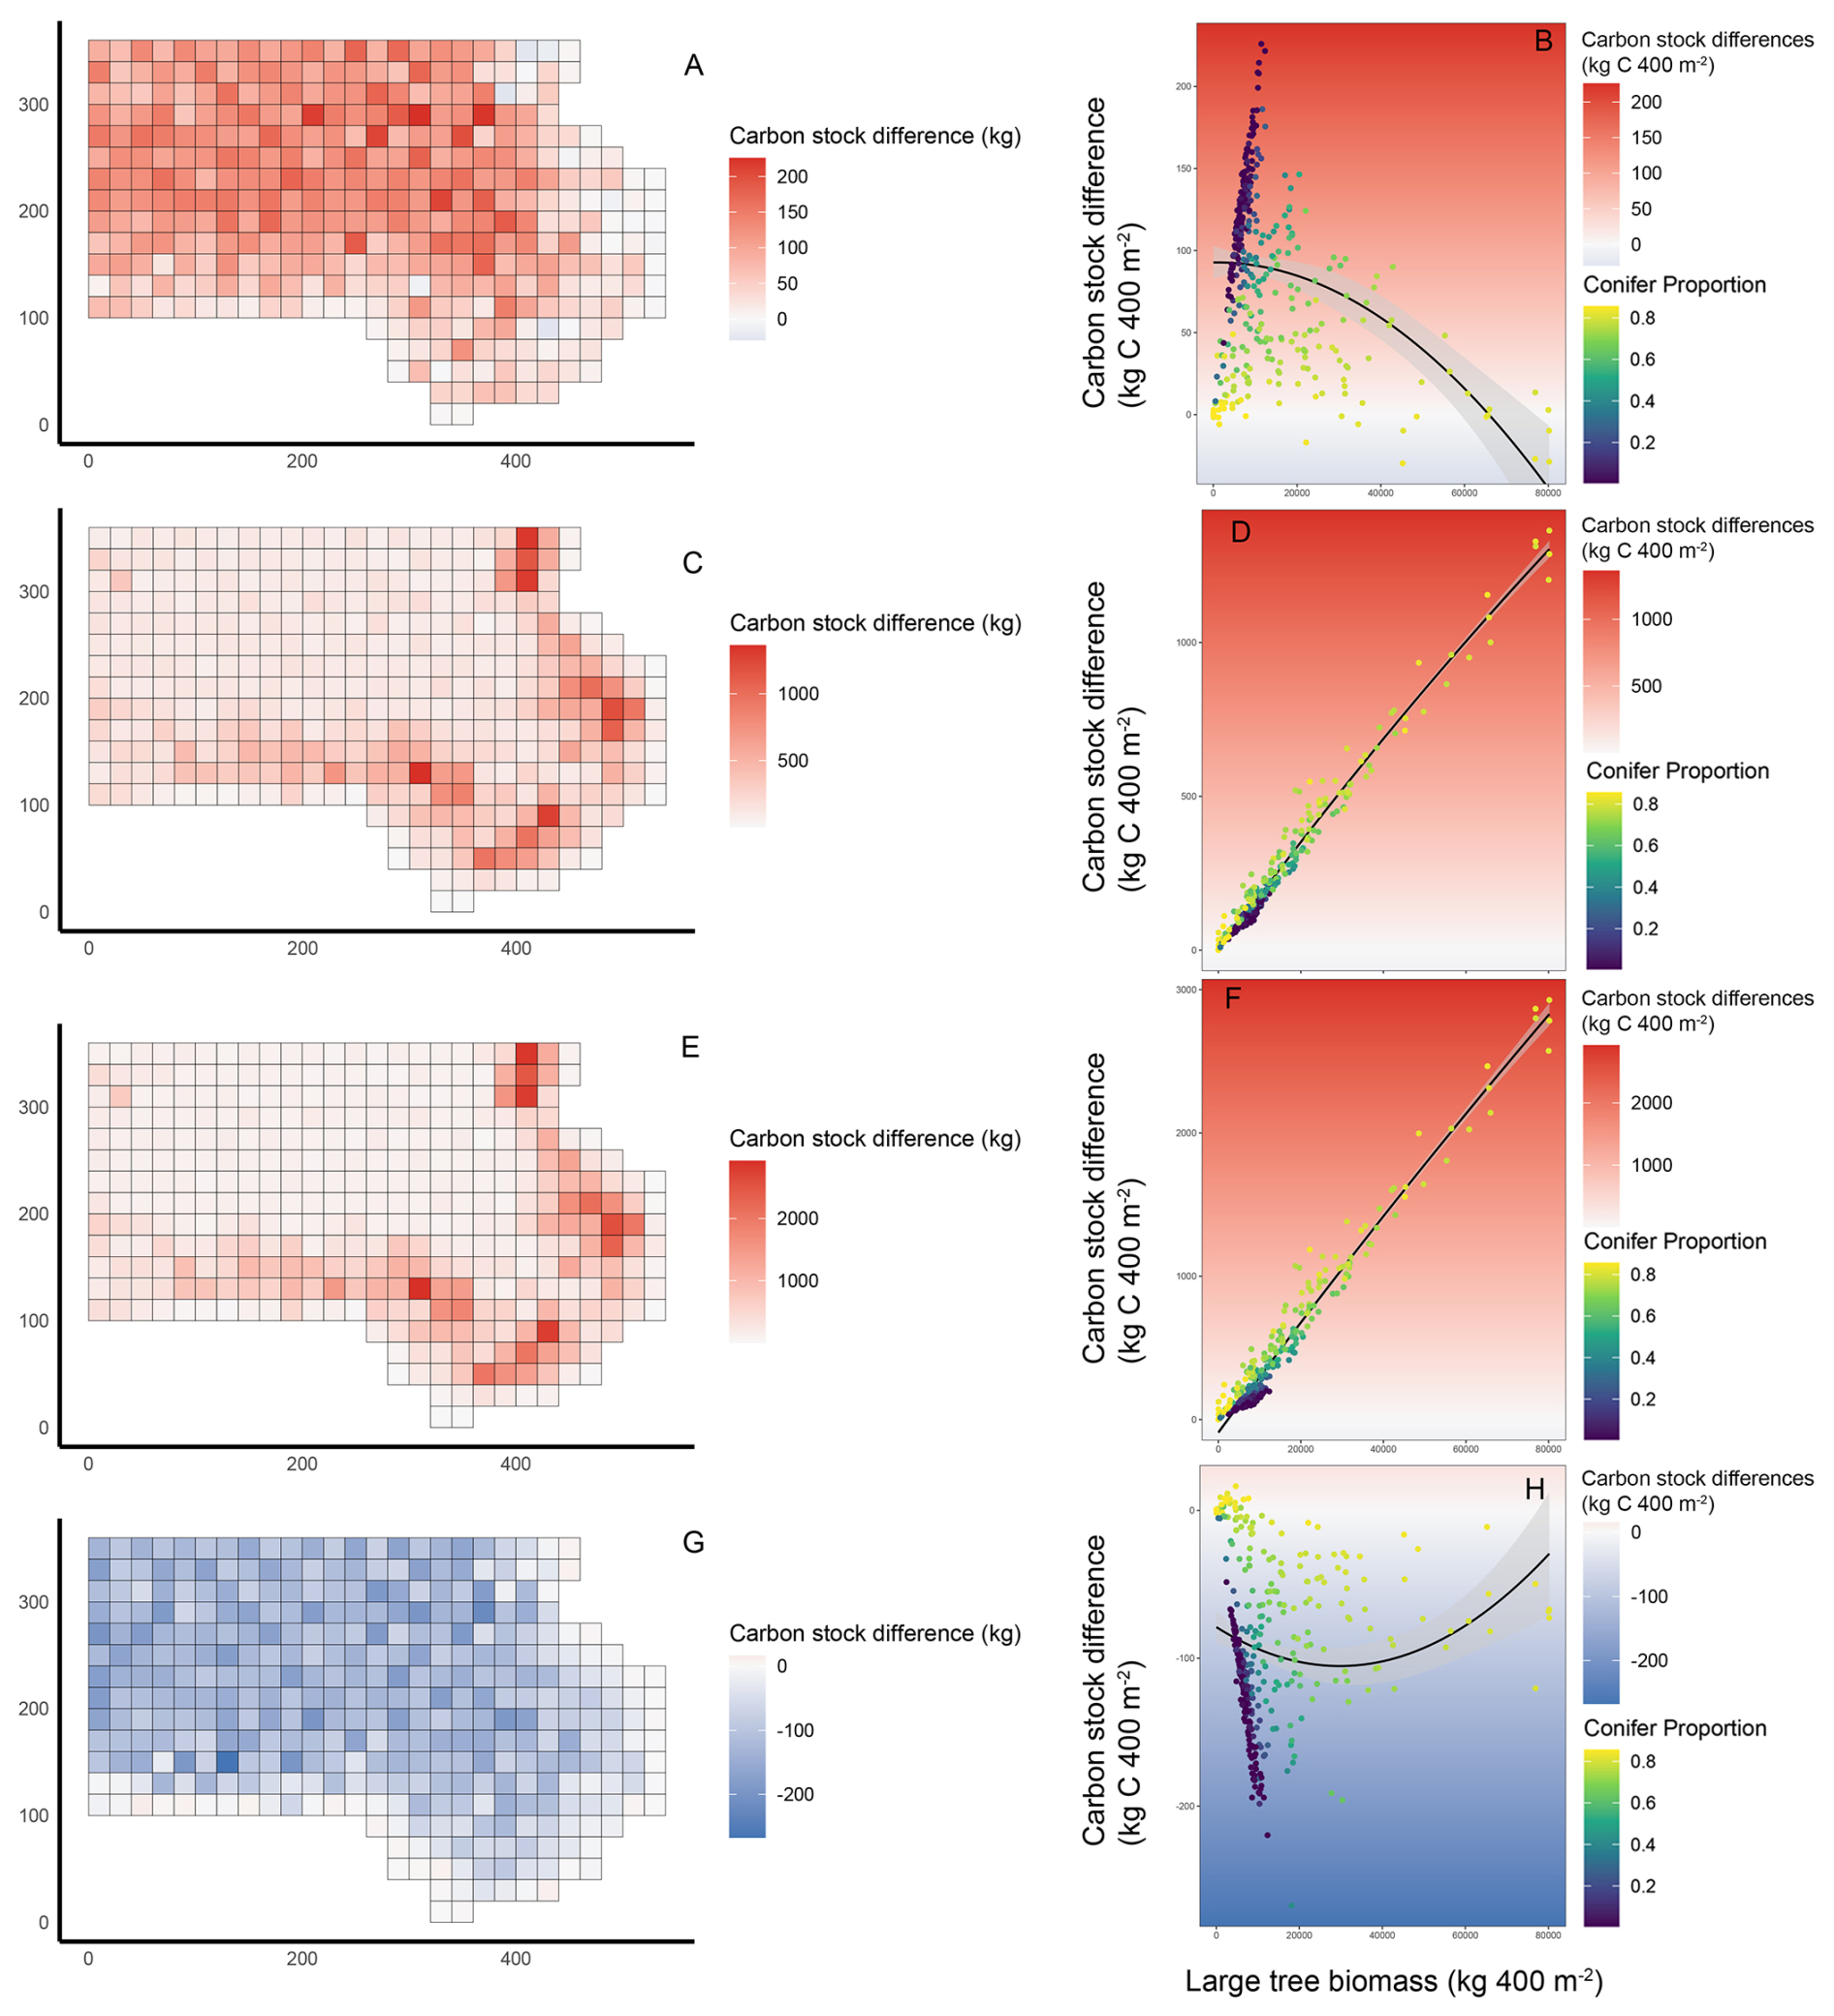
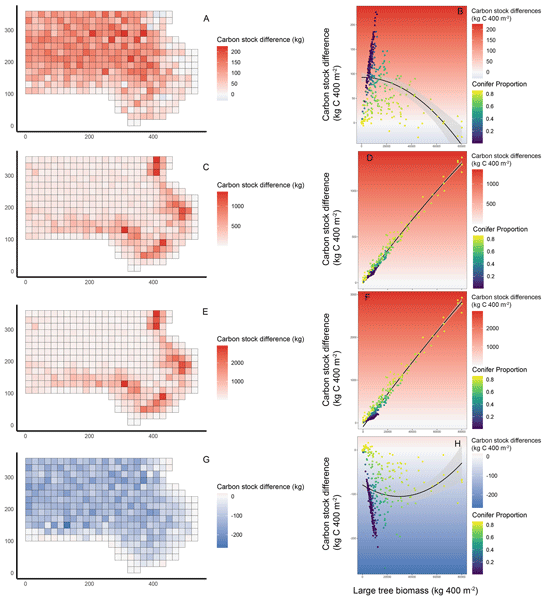
Figure 3Differences in 400 m2 subplot-level carbon (Csubplot) stocks (measured in kg C per subplot) estimated using different wood carbon fraction (CF) assumptions. Subplot-level differences are calculated as the difference between Csubplot1 (generated using species-specific wood CF data) and Csubplot2 (panels A–B; generated assuming wood CFs for temperate biome trees specific to conifers and angiosperms); Csubplot3 (panels C–D; generated assuming non-biome-specific wood CFs for conifers and angiosperms); Csubplot4 (panels E–F; generated assuming a single IPCC default wood CF assumption); and Csubplot5 (panels G–H; generated assuming a single 50 % wood CF assumption). Therefore in all maps and graphs, (i) all values above 0 and in red shading indicate instances where species-specific wood CFs (Csubplot1) are higher compared to estimates generated using generalized wood CF assumptions (Csubplot2-Csubplot5), and (ii) all values below 0 and in blue shading indicate instances where species-specific wood CFs (Csubplot1) are lower compared to estimates generated using generalized wood CF assumptions (Csubplot2-Csubplot5). Left-side panels show spatial variability in differences between subplot-level C stocks for n=368 subplots distributed across a 13.5-ha forest dynamics plot in Haliburton, Ontario, Canada. Right-hand panels show statistically significant relationships between differences in C stock estimates (as described above) modeled as a function of large tree biomass (≥10 cm diameter at 1.3 m aboveground) in each subplot, and a second-order polynomial term for large tree biomass. Error bars represent 95 % confidence limits surrounding model fits, and point colors correspond to the proportion of biomass represented by conifers in each subplot (a full analysis of covariance model parameters for each fit is presented in Table S3).
3.2 The influence of wood CF assumptions on forest-level C estimates at small spatial scales
Differences in tree-level C estimates (Ctree1–Ctree5) scaled up to influence forest-level C stocks at both the 400 m2 subplot (Csubplot1–Csubplot5) and ha (Cha1–Cha5) scales. At the subplot level, C stock estimates derived from species-specific wood CFs (Csubplot1) differed significantly from all other C stock estimates (paired t test p<0.001, absolute in all four comparisons; Fig. 3, Table 2, Fig. S1). Mean Csubplot values owing to different wood CF assumptions ranged from 6995–7489 kg C 400 m−2 (median range of Csubplot values = 4278–4580 kg C 400 m−2). At this scale of analysis, the most generalized wood CF assumptions led to the widest range of average Csubplot values, with the IPCC-recommended wood CF (Csubplot4) resulting in the lowest mean/median Csubplot estimates, and a 50 % wood CF (Csubplot5) resulting the highest mean/median estimates (Table 2).
Consistent with the previous findings of variability in Ctree estimates being especially pronounced in large trees, statistically significant differences in Csubplot1 vs. all other Csubplot estimates were also driven by high-biomass subplots. Specifically, the lower 5th percentile of Csubplot ranged by 87 kg C, and the higher 95th percentile of Csubplot values across all estimates ranged by over 468 kg C (Table 2). An ANCOVA model predicting differences in Csubplot as a function of subplot-level characteristics corroborated this trend, indicating that differences in Csubplot1 values vs. Csubplot2–Csubplot5 values were statistically correlated with the amount of subplot biomass contained in large trees (p<0.01, partial r2=0.221–0.961 for the large tree biomass term; Fig. 3, Table S3). However, the wide range of partial r2 values for the large tree biomass term indicates that these relationships were idiosyncratic.
Differences between Csubplot1 vs. Csubplot3 (taxonomic division-specific wood CFs) and Csubplot4 (IPCC-recommended wood CFs) were consistently positive, with differences ranging from 0.6–2927.7 kg C per subplot (mean difference = 223.9 and 402.9 kg C per subplot, respectively), indicating that these assumptions consistently underestimate Csubplot values compared to species-specific wood CF data (Fig. 3). Differences in Csubplot1 vs. Csubplot3 and Csubplot4 became larger as the amount of total biomass contained in large trees increased (ANCOVA model parameter p<0.01, partial r2=0.932 and 0.961, respectively, Table S3). This trend indicates that underestimates in Csubplot3 and Csubplot4 values (compared to Csubplot1 estimates) increase with higher subplot-level biomass. In these comparisons, we also found a statistically significant contribution of conifer biomass proportion explaining these differences (ANCOVA model parameter p<0.01, partial r2=0.087 and 0.635, respectively, Table S3).
Comparatively, differences in Csubplot1 vs. Csubplot2 (i.e., biome-specific wood CFs for angiosperms and conifers) were smaller (mean difference = 85.5 kg C per subplot, range = −29.7 to 225.9 kg C per subplot) and were both positive and negative, indicating that the wood CF assumptions embedded in Csubplot2 led to both over- and underestimates of Csubplot compared to estimates using species-specific data. Here, differences in Csubplot estimates were more strongly dictated by species composition, such that conifer biomass proportion was the strongest correlate of these Csubplot1 vs. Csubplot2 differences (ANCOVA model parameter p<0.01, partial r2=0.654 and 0.635, respectively, Table S3). Large tree biomass played a secondary, albeit statistically significant, role in governing Csubplot estimation differences (ANCOVA model parameter p<0.01, partial r2=0.087 and 0.635, respectively), and these relationships were non-linear (Fig. 3).
Differences between Csubplot1 and Csubplot5 (a 50 % wood CF fraction) were unique in that these differences were the only negative average values (mean difference = −91.5 kg C per subplot), indicating that a 50 % assumption overestimates Csubplot values. However, individual differences calculated for Csubplot1 vs. Csubplot5 did indicate that a 50 % wood CF assumption resulted in both over- and underestimates compared to species-specific wood CF data. The 50 % wood CF overestimated Csubplot values in 342 of 368 subplots, with these overestimates being much larger than the few underestimates (Fig. S1). Again, in these comparisons, species composition was the strongest correlate of these differences: as conifer proportions increased, the differences between Csubplot values generated using species-specific data vs. a 50 % assumption generally grew closer to 0 (ANCOVA model parameter p<0.01, partial r2=0.635, respectively; Table S3). The amount of biomass in large trees also influenced this relationship, albeit in a non-linear manner (Fig. 3). Here, trends indicated that as large conifer biomass increased, differences in Csubplot1 vs. Csubplot5 became less negative; conversely, differences in Csubplot1 vs. Csubplot5 values were largest in subplots with high angiosperm proportions (Fig. 3).
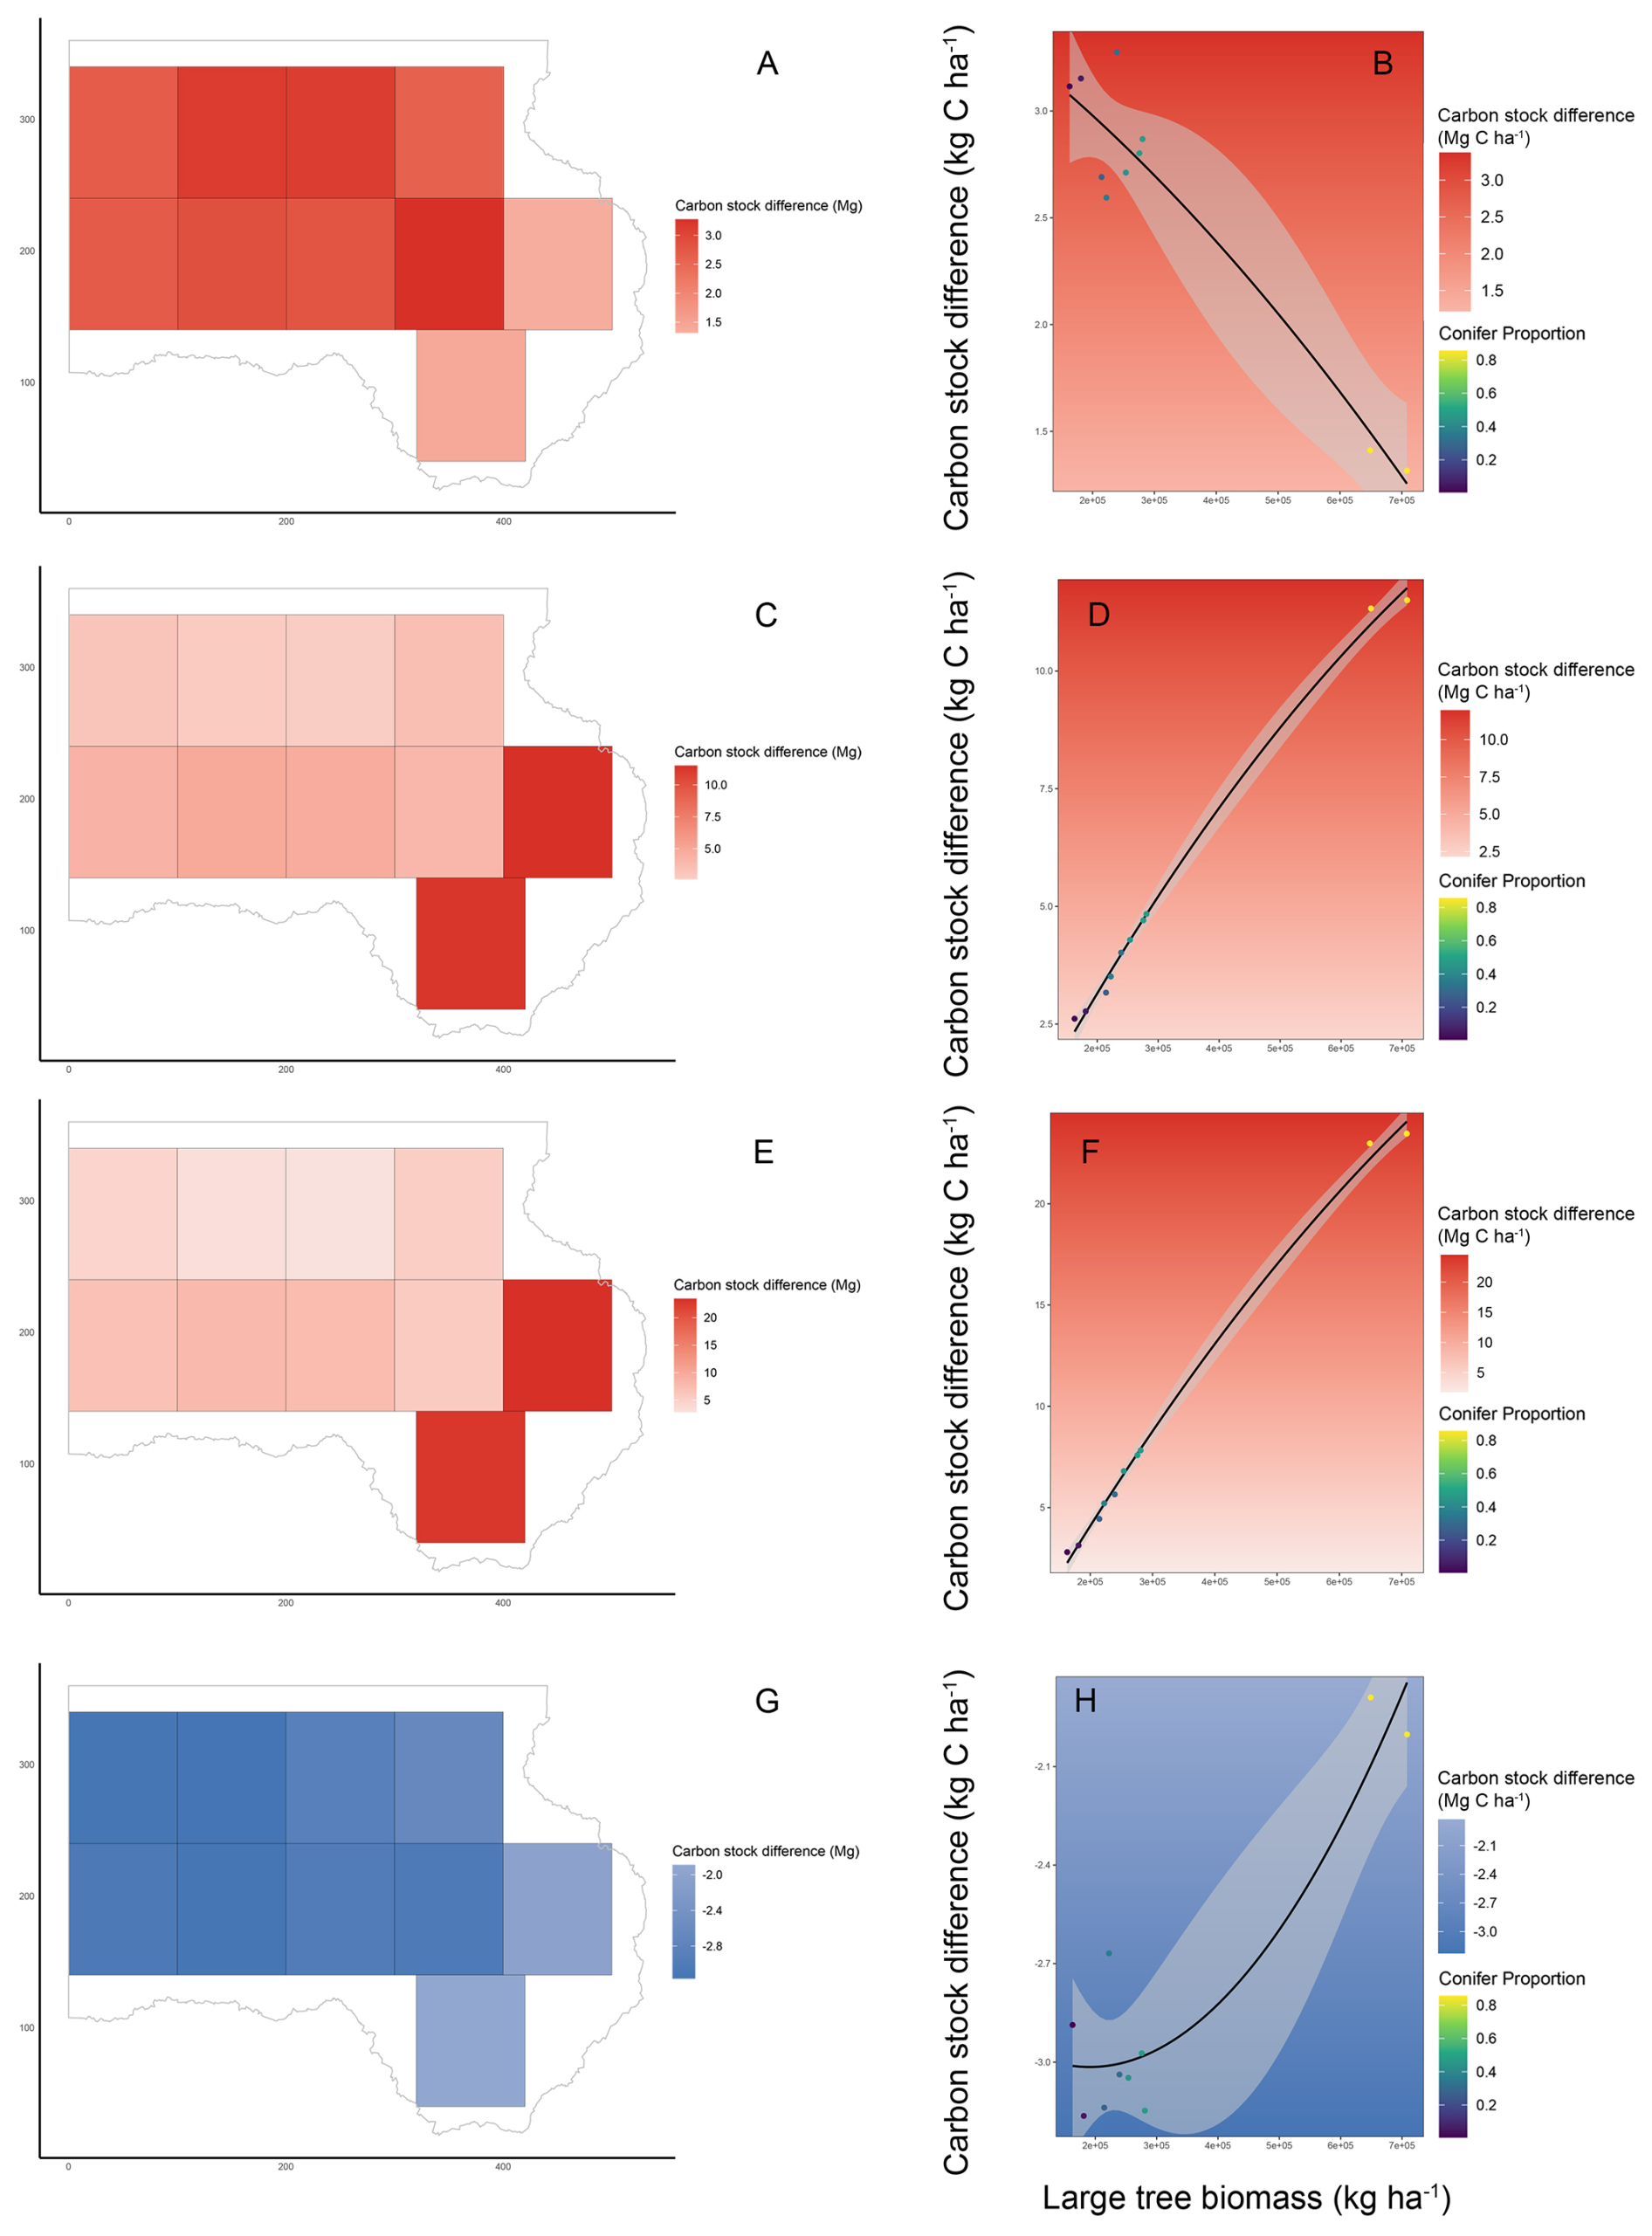
Figure 4Differences in ha-scale carbon (Cha) stocks (measured in Mg C ha−1) estimated using different wood carbon fraction (CF) assumptions. Per ha-level differences are calculated as the difference between Cha1 (generated using species-specific wood CF data) and Cha2 (panels A–B; generated assuming wood CFs for temperate biome trees specific to conifers and angiosperms); Cha3 (panels C–D; generated assuming non-biome-specific wood CFs for conifers and angiosperms); Cha4 (panels E–F; generated assuming a single IPCC default wood CF assumption); and Cha5 (panels G–H; generated assuming a single 50 % wood CF assumption). Therefore in all maps and graphs, (i) all values above 0 and in red shading indicate instances where species-specific wood CFs (Cha1) are higher compared to estimates generated using generalized wood CF assumptions (Cha2–Cha5), and (ii) all values below 0 and in blue shading indicate instances where species-specific wood CFs (Cha1) are lower compared to estimates generated using generalized wood CF assumptions (Cha2–Cha5). Left-side panels show spatial variability in differences in subplot-level C stocks for n=10 ha designations distributed across a 13.5 ha forest dynamics plot in Haliburton, Ontario, Canada. Right-hand panels show statistically significant relationships between differences in C stock estimates (as described above) modeled as a function of large tree biomass (≥10 cm diameter at 1.3 m aboveground) in each ha of forest, and a second-order polynomial term for large tree biomass. In these graphs, error bars represent 95 % confidence limits surrounding model fits, and point colors correspond to the proportion of biomass represented by conifers in each ha of forest (a full analysis of covariance model parameters for each fit is presented in Table S4).
3.3 The influence of wood CF assumptions on forest-level C estimates at larger spatial scales
Species-specific wood CFs led to higher forest C stocks on a per ha scale (Cha1) and resulted in statistically higher estimates than those based on more generalized wood CFs (namely, Cha2–Cha4; t9≥5.8, p<0.01 in all three paired t tests; Figs. 4, S2, Tables 1 and 2). Owing to sample size limitations at this scale these results are interpreted cautiously, but clear descriptive patterns emerged. In these comparisons, Cha1 averaged 83.3 Mg C ha−1, vs. 80.1–80.6 Mg C ha−1 on average under Cha2–Cha4 assumptions (Table 1). Similar to our tree- or subplot-level analyses, statistically significant differences across Cha1 vs. other estimates were most pronounced at the higher range of Cha values (Table 2). Furthermore, across these comparisons (Cha1 vs. Cha2–Cha4), species-specific wood CF data increased Cha estimates by 2.6–9.0 Mg C ha−1 on average, with differences ranging from 1.3–23.5 Mg C ha−1 (Fig. 4). Differences in Cha values mostly increased as wood CF assumptions became more generalized, being most pronounced when comparing Cha1 to estimates generated using the IPCC's default value (Cha4; Fig. 4, Table 2).
Consistent with subplot-scale analyses, differences in Cha1 vs. Cha2, Cha3, and Cha4 appeared statistically correlated with the quantity of large-tree biomass per hectare of forest, although at this scale, species composition played a clearer role in driving C estimate differences (Fig. 4, Table S4). Specifically, differences between Cha1 and Cha2 were largest in areas of the forest dominated by angiosperms, suggesting wood CF data for angiosperm species differ most strongly from the wood CF values assumed in these estimates. Alternatively, differences in Cha1 vs. Cha3 and Cha4 values were largest in forests with the highest conifer values (Fig. 4), suggesting the wood CF values assumed in these estimates (i.e., those of the IPCC) differ strongly from actual wood CF values.
At the per ha scale, the 50 % wood CF assumption was the only assumption that appears to lead to systematic overestimates of Cha values compared to estimates underpinned by species-specific wood CF data (paired t test , p<0.01). Specifically, in comparison to species-specific wood CF data, the 50 % assumption appears to overestimate forest C stocks by 2.8 Mg C ha−1 on average, with overestimates occurring in all 10 ha of forest analyzed here, ranging from 1.9–3.2 Mg C ha−1 (Figs. 4, S2). These apparent overestimates were largest in forests dominated by angiosperms, with differences declining with greater conifer biomass (especially large conifers), indicating that the 50 % wood CF differs most widely from wood CFs in angiosperms (Fig. 4).
Studies documenting variability in wood CFs among trees have expanded over the past decade (Doraisami et al., 2022), leading to a considerably greater amount of wood CF data now available for integration with forest C estimation frameworks (Doraisami et al., 2024). To our knowledge, the present study is the first to integrate wood CF data into detailed forest C assessments using large-scale detailed tree inventory datasets. In doing so, we find that although certain assertions in the wood CF/forest C estimation literature are supported by our C estimation analysis, there exists considerable nuance surrounding how wood CF variation influences tree- to forest-level C stocks. Our clearest finding is that a 50 % wood CF assumption – historically the value most commonly employed in large-scale studies and national-scale models of forest C stocks and fluxes – consistently overestimates C stocks in comparison to estimates generated using species-specific wood CF data, and that this systematic error compounds across individual trees (Ctree; 0.86 kg C per tree on average), to small spatial scales (Csubplot; 91.5 kg C 400 m−2 on average), and ultimately to larger forest ecosystem scales (Cha; 2.8 Mg C ha−1 on average) (Figs. 2–4). Consistent with angiosperms expressing lower wood CFs compared to conifers (Martin et al., 2018), these overestimates are especially prominent in angiosperm trees and angiosperm-dominated forests (Figs. 3, 4).
A novel contribution of our study is evidence that while the 50 % wood CF assumption systematically overestimates C across all scales, the magnitude of this error – in absolute Ctree, Csubplot, and Cha terms – is actually smaller than the error associated with other wood CF assumptions. Our analysis finds that a 50 % CF assumption leads to (a) the smallest absolute errors, but simultaneously, (b) errors that consistently overestimate C stocks in nearly all trees and forest stands. To illustrate, a 50 % wood CF results in a total estimate of 2756.2 Mg C across our 13.5 ha forest dynamics plot: a value that is 33.7 Mg C larger than the estimate using species-specific CFs (i.e., 2722.5 Mg C). At larger scales, even if our minimum observed difference between Cha1 and Cha5 (1.9 Mg C ha−1) is scaled to the temperate forest biome – estimated at 794 072 373 ha in recent analyses (Pan et al., 2024) – the 50 % wood CF overestimates temperate forest C stocks by 1.5 Pg C (equivalent to 1 508 737 509 Mg C). However, if our average or maximum discrepancy between Cha1 and Cha5 (2.8 and 3.2 Mg C ha−1, respectively) is scaled in a similar manner, this overestimate would be equivalent to 2.2–2.5 Pg C. This value is lower than coarse estimates of similar errors discussed for tropical forests (Martin and Thomas, 2011), which suggests that the dominance of angiosperms would lead to differences between our Cha1 and Cha5 terms that are much larger. Generally, one may expect the IPCC wood CF to be more “accurate” compared to a 50 % assumption. Though with respect to this general expectation, one novel and counterintuitive caveat uncovered through our analysis is that under certain circumstances, the current IPCC default wood CF value (0.47) underestimates tree- and forest C stocks as compared to a 50 % wood CF assumption. Our analysis shows this trend is especially prominent in forests that are comprised or dominated by large conifers.
Owing to the wide variation in factors that dictate carbon storage in forests, including tree community structure and species composition, caution is needed when suggesting our results also apply to forests throughout the temperate biome. Analyses that employ the wood CF decision-making framework employed here (Doraisami et al., 2024), alongside a larger number of forest inventory datasets (Davies et al., 2021), represent a key next step in further characterizing and generalizing the biases in forest C estimation that owe to wood CF variability. Nonetheless, our findings here provide among the most detailed analyses to date demonstrating that a 50 % wood CF assumption systematically overestimates C stock estimates at tree and forest ecosystem scales, with reason to expect this bias extends to the biome scale.
Our analyses of other wood CF assumptions contribute the novel finding that alternative generic CF values – for example, those recommended by the IPCC (Ctree4) – generally underestimate C compared to estimates based on species-specific wood CF data. Here, the influence of wood CF assumptions on C estimation is more nuanced, but certain trends emerged. First, the magnitude of underestimates depends on tree species identity and DBH at the individual tree scale (Fig. 2), as well as forest composition and the amount of forest biomass contained in large (≥10 cm DBH) trees at the forest scale (Fig. 3). Second, the overall magnitude of these underestimates generally increases as wood CF assumptions become more generalized from (i) temperate biome-specific wood CFs for angiosperms and conifers (Ctree2), to (ii) wood CFs for angiosperms and conifers that are not biome-specific (Ctree3), and finally, iii) the IPCC's default wood CF of 0.47 for all trees (Ctree4). We therefore suggest the current IPCC values recommended for C estimation should be replaced by existing published values, specifically wood CF data for angiosperms and conifers that are biome-specific (e.g., as presented most recently in Doraisami et al., 2024).
As expected following previous studies, our analysis found that generalized wood CF assumptions used to estimate our Ctree2–Ctree5 data approximate the empirically-derived wood CFs (i.e., those used to estimate Ctree1) better for some tree species than others (Fig. 2). This has been well-described by existing studies on wood CF variation among trees globally (Martin et al., 2018; Thomas and Martin, 2012). Here, we show that the precise wood CF data are especially important for tree- and forest C stock estimates for large trees (≥10 cm DBH) that contribute large proportions of forest biomass (Figs. 3, 4). In our study site, large trees represent 87.0 %–90.0 % of total live aboveground biomass at the 400 m2 subplot and per ha scales. In turn, four species, namely balsam fir (A. balsamea), sugar maple (A. saccharum), eastern hemlock (T. canadensis), and American beech (F. grandifolia), represent ∼76 % of the large trees in our dataset, with differences in their wood CFs vs. generalized assumptions therefore having a major influence on C stock estimate discrepancies among methods.
Stem wood CFs extracted from open-access databases (Doraisami et al., 2022) and used in our Ctree1 calculations for A. balsamea and T. canadensis were 50.0 % and 50.1 %, respectively. This likely suggests that forest-scale overestimates owing to a 50 % wood CF assumption (Figs. 4, S2) may be more constrained in our study site vs. others where dominant trees differ more widely from a 50 % wood CF. Empirically derived wood CFs for these two conifer species become progressively more different vs. wood CF assumptions embedded in estimates of Ctree2 (50.1 %), Ctree3 (48.5 %), and Ctree4 (46.7 %). These two species-specific patterns therefore contribute substantially to our findings that differences in tree- and forest-scale C estimation between Csubplot1 and Cha1 values vs. all other estimates (except those based on a 50 % assumption) both (a) increase with greater wood CF generality and (b) are correlated with large conifer biomass.
The most common angiosperms in our datasets, A. saccharum and F. grandifolia, had empirically derived wood CF values of 48.4 % and 47.9 %, respectively (Doraisami et al., 2024). Differences between these species-specific wood CF values vs. wood CFs embedded in Ctree2 (46.5 %), Ctree3 (46.8 %), and Ctree4 (46.7 %) estimates did not increase systematically with greater generality of wood CF assumptions. Therefore, except for a 50 % wood CF assumption, Ctree values associated with these dominant angiosperms did not necessarily increase or decrease systematically with more generalized wood CFs (i.e., those used to calculate Ctree2, Ctree3, and Ctree4; Fig. 2). In turn, our analysis indicates that while species-specific wood CF data correct for underestimates in angiosperm C stocks compared to all general wood CF assumptions (except a 50 % value), ultimately, discrepancies in C estimates for angiosperm-dominated forests do not become larger as more general wood CFs are employed in C estimation.
One important question raised by our analysis is whether or not the majority of variation in wood CFs exists among vs. within tree species. If wood CFs vary more widely among than within tree species, then one might infer that species-specific wood CF values are a “gold standard” in forest C estimation protocols. Though meta-analyses have primarily shown that species identity is the most important factor explaining wood CF variation, with intraspecific variation owing to tissue type being less important (Doraisami et al., 2024; Martin et al., 2018). However, other studies have pointed to variability that exists in wood CFs across tissue types (e.g., Ma et al., 2018), spatial/ edaphic factors (e.g., Dong et al., 2025), climate gradients (e.g., Paroshy et al., 2021), and tree age/ size (e.g., Martin and Thomas, 2013). We would therefore argue that despite much recent research on the topic, the relative contribution of inter- vs. intraspecific variability in wood CFs remains only loosely disentangled.
Despite these outstanding uncertainties, we suggest that analyses employing and comparing multiple different species-specific wood CF data points when estimating Ctree values, likely represent the most direct path for quantifying whether or not intraspecific variation in wood CF influences tree- and forest C estimates. Additionally, belowground biomass and deadwood represent critical and dynamic ecosystem C pools that were not accounted for in our study (Pan et al., 2024). Research has shown that wood CFs in roots vary considerably among tree species (Doraisami et al., 2022), and recent analysis from our study site has shown that variability in deadwood CFs influences deadwood C stock estimates (Doraisami et al., 2026). Therefore, refining belowground C estimates alongside root CF data, and understanding how wood CFs change at and throughout the live-to-deadwood transition, represent viable paths forward in refining tree- and forest C cycle modelling.
From an applied perspective, our findings are applicable towards the assessment, monitoring, and potential enhancement of forest C stocks across several management-relevant contexts, frameworks, and scales. At the national scale, our results suggest that the adoption of more species-specific wood CFs into forest C estimation protocols leads to marked changes in C stock estimates, which scale up from the tree-, to forest ecosystem-, and ultimately to biome scales. Our findings suggest that species-specific wood CFs should be employed when estimating forest C stocks and fluxes, though when unavailable, alternative wood CFs other than a 50 % wood CF are likely to provide a more conservative estimate of forest C stocks and fluxes. Additionally, consistent with research on the critical role that large trees play in forest ecosystem functioning (e.g., Lutz et al., 2018), our results suggest that careful consideration of wood CFs among common trees that contribute the most to large-stem biomass is especially important in accurately estimating C stocks and fluxes in trees and forests.
No new software packages were developed and used in the analysis presented here, and all R code is available upon request to the corresponding author.
Data for this study are available upon request to the corresponding author.
The supplement related to this article is available online at https://doi.org/10.5194/bg-23-5811-2026-supplement.
Data collection: ARM, MD, MG, RM, LS, SCT. Data analysis: ARM, DM, MD. Manuscript writing: ARM, DM. Manuscript editing: MD, MG, AG, DO, ABP, BT, ROM, LS, SCT. Funding acquisition and logistics: ARM, AG, DO, ABP, BT, SCT.
The contact author has declared that none of the authors has any competing interests.
Publisher's note: Copernicus Publications remains neutral with regard to jurisdictional claims made in the text, published maps, institutional affiliations, or any other geographical representation in this paper. The authors bear the ultimate responsibility for providing appropriate place names. Views expressed in the text are those of the authors and do not necessarily reflect the views of the publisher.
The authors wish to thank the numerous field researchers who assisted in the collection of field data from the Haliburton Forest Dynamics Plot, as well as the Haliburton Forest & Wild Life Reserve for continued support of the Haliburton Forest Dynamics Plot and the Forest Global Earth Observatory program.
This research was supported by the Charles Bullard Fellowship in Forest Research to A.R.M. Funding for the Haliburton Forest Dynamics Plot was supported by Discovery Grants from the Natural Sciences and Engineering Research Council of Canada to both A.R.M. and S.C.T.
This paper was edited by Marcos Fernández-Martínez and reviewed by Zhenhong Hu and one anonymous referee.
Anderegg, W. R., Hicke, J. A., Fisher, R. A., Allen, C. D., Aukema, J., Bentz, B., Hood, S., Lichstein, J. W., Macalady, A. K., and McDowell, N.: Tree mortality from drought, insects, and their interactions in a changing climate, New Phytol., 208, 674–683, 2015.
Bates, D., Mächler, M., Bolker, B., and Walker, S.: Fitting linear mixed-effects models using lme4, J. Stat. Softw., 67, 1–48, 2015.
Coops, N. C., Tompalski, P., Goodbody, T. R., Queinnec, M., Luther, J. E., Bolton, D. K., White, J. C., Wulder, M. A., van Lier, O. R., and Hermosilla, T.: Modelling lidar-derived estimates of forest attributes over space and time: a review of approaches and future trends, Remote Sens. Environ., 260, 112477, https://doi.org/10.1016/j.rse.2021.112477, 2021.
Davies, S. J., Abiem, I., Salim, K. A., Aguilar, S., Allen, D., Alonso, A., Anderson-Teixeira, K., Andrade, A., Arellano, G., and Ashton, P. S.: ForestGEO: Understanding forest diversity and dynamics through a global observatory network, Biol. Conserv., 253, 108907, https://doi.org/10.1016/j.biocon.2020.108907, 2021.
Domke, G. M., Oswalt, S. N., Walters, B. F., and Morin, R. S.: Tree planting has the potential to increase carbon sequestration capacity of forests in the United States, P. Natl. Acad. Sci. USA, 117, 24649–24651, 2020.
Dong, C., Liu, Y., Zhang, L., Liu, Z., Zhao, H., Li, W., Chao, X., and Wang, X.: Spatial patterns of stem tissue carbon content in Fagaceae species from typical forests in China, Forests, 16, 1478, https://doi.org/10.3390/f16091478, 2025.
Doraisami, M., Kish, R., Paroshy, N. J., Domke, G. M., Thomas, S. C., and Martin, A. R.: A global database of woody tissue carbon concentrations, Sci. Data, 9, 284, https://doi.org/10.1038/s41597-022-01396-1, 2022.
Doraisami, M., Domke, G. M., and Martin, A. R.: Improving wood carbon fractions for multiscale forest carbon estimation, Carbon Balance and Management, 19, 25, https://doi.org/10.1186/s13021-024-00272-2, 2024.
Doraisami, M., Gorgolewski, A., Thomas, S. C., and Martin, A. R.: Wood carbon fractions influence deadwood carbon stock estimates, Ecosystems, 29, 10, https://doi.org/10.1007/s10021-025-01027-x, 2026.
Harris, N. L., Gibbs, D. A., Baccini, A., Birdsey, R. A., De Bruin, S., Farina, M., Fatoyinbo, L., Hansen, M. C., Herold, M., and Houghton, R. A.: Global maps of twenty-first century forest carbon fluxes, Nat. Clim. Change, 11, 234–240, 2021.
Hartmann, H., Bastos, A., Das, A. J., Esquivel-Muelbert, A., Hammond, W. M., Martínez-Vilalta, J., McDowell, N. G., Powers, J. S., Pugh, T. A., and Ruthrof, K. X.: Climate change risks to global forest health: emergence of unexpected events of elevated tree mortality worldwide, Annu. Rev. Plant Biol., 73, 673–702, 2022.
Hogan, J. A., Domke, G. M., Zhu, K., Johnson, D. J., and Lichstein, J. W.: Climate change determines the sign of productivity trends in US forests, P. Natl. Acad. Sci. USA, 121, e2311132121, https://doi.org/10.1073/pnas.2311132121, 2024.
IPCC: IPCC guidelines for national greenhouse gas inventories, prepared by the national greenhouse gas inventories programme, https://www.ipcc-nggip.iges.or.jp/public/2006gl/ (last access: 21 August 2026), 2006.
Kish, R., James, P. M., Mariani, R. O., Schurman, J. S., Thomas, S. C., Young, E. N., and Martin, A. R.: Beech Bark Disease in an unmanaged temperate forest: patterns, predictors, and impacts on ecosystem function, Frontiers in Forests and Global Change, 5, 831663, https://doi.org/10.3389/ffgc.2022.831663, 2022.
Lambert, M.-C., Ung, C., and Raulier, F.: Canadian national tree aboveground biomass equations, Can. J. Forest Res., 35, 1996–2018, 2005.
Lamlom, S. and Savidge, R.: A reassessment of carbon content in wood: variation within and between 41 North American species, Biomass and Bioenergy, 25, 381–388, 2003.
Lutz, J. A., Furniss, T. J., Johnson, D. J., Davies, S. J., Allen, D., Alonso, A., Anderson‐Teixeira, K. J., Andrade, A., Baltzer, J., and Becker, K. M.: Global importance of large‐diameter trees, Global Ecol. Biogeogr., 27, 849–864, 2018.
Ma, S., He, F., Tian, D., Zou, D., Yan, Z., Yang, Y., Zhou, T., Huang, K., Shen, H., and Fang, J.: Variations and determinants of carbon content in plants: a global synthesis, Biogeosciences, 15, 693–702, https://doi.org/10.5194/bg-15-693-2018, 2018.
Martin, A. R. and Thomas, S. C.: A reassessment of carbon content in tropical trees, PloS ONE, 6, e23533, https://doi.org/10.1371/journal.pone.0023533, 2011.
Martin, A. R. and Thomas, S. C.: Size-dependent changes in leaf and wood chemical traits in two Caribbean rainforest trees, Tree Physiol., 33, 1338–1353, 2013.
Martin, A. R., Gezahegn, S., and Thomas, S. C.: Variation in carbon and nitrogen concentration among major woody tissue types in temperate trees, Can. J. Forest Res., 45, 744–757, 2015.
Martin, A. R., Doraisami, M., and Thomas, S. C.: Global patterns in wood carbon concentration across the world's trees and forests, Nat. Geosci., 11, 915–920, 2018.
Pan, Y., Birdsey, R. A., Phillips, O. L., Houghton, R. A., Fang, J., Kauppi, P. E., Keith, H., Kurz, W. A., Ito, A., and Lewis, S. L.: The enduring world forest carbon sink, Nature, 631, 563–569, 2024.
Paroshy, N. J., Doraisami, M., Kish, R., and Martin, A. R.: Carbon concentration in the world's trees across climatic gradients, New Phytol., 232, 123–133, 2021.
Simler-Williamson, A. B., Rizzo, D. M., and Cobb, R. C.: Interacting effects of global change on forest pest and pathogen dynamics, Annu. Rev. Ecol. Evol. S., 50, 381–403, 2019.
Thomas, S. C. and Martin, A. R.: Carbon content of tree tissues: a synthesis, Forests, 3, 332–352, 2012.
Weed, A. S., Ayres, M. P., and Hicke, J. A.: Consequences of climate change for biotic disturbances in North American forests, Ecol. Monogr., 83, 441–470, 2013.
Xu, L., Saatchi, S. S., Yang, Y., Yu, Y., Pongratz, J., Bloom, A. A., Bowman, K., Worden, J., Liu, J., and Yin, Y.: Changes in global terrestrial live biomass over the 21st century, Sci. Adv., 7, eabe9829, https://doi.org/10.1126/sciadv.abe9829, 2021.
Yang, H., Ciais, P., Frappart, F., Li, X., Brandt, M., Fensholt, R., Fan, L., Saatchi, S., Besnard, S., and Deng, Z.: Global increase in biomass carbon stock dominated by growth of northern young forests over past decade, Nat. Geosci., 16, 886–892, 2023.