
the Creative Commons Attribution 4.0 License.
the Creative Commons Attribution 4.0 License.
 | 26 Aug 2026
Organic carbon pathways across the fluvial-marine transition zone of the Mackenzie River Delta – Beaufort Sea region and implications on ocean color remote sensing
Annabeth McCall
Martin Hieronymi
P. Paul Overduin
Lisa Bröder
Julie Lattaud
Rüdiger Röttgers
Irina Overeem
Anne Morgenstern
Guido Grosse
Bennet Juhls
Arctic warming and hydrological intensification are accelerating permafrost thaw and increasing the export of terrestrial organic carbon (OC) and sediments from land via rivers and shallow coastal waters into marine waters, yet the fate of these materials in deltaic and coastal transition zones remains poorly understood. Here, we synthesize multiyear in-situ biogeochemical, optical, and radiometric observations (2009–2024) across the Mackenzie River Delta – southern Beaufort Sea land – ocean continuum. By using a compartmental approach (river, delta, coastal, marine) we quantify spatial and seasonal variability in dissolved organic carbon (DOC), particulate organic carbon (POC), and suspended particulate matter (SPM) and refine bio-optical relationships that support satellite retrievals in optically complex Arctic waters. Our results show that DOC concentrations declined from river to marine waters (mean 4.8 to 1.9 mg L−1), while POC and SPM showed more variability with marked reductions across the transition, consistent with retention and transformation processes in deltaic and nearshore zones. Across all compartments, DOC exhibited a strong non-linear relationship with CDOM absorption at 443 nm (aCDOM(443); r2=0.81), whereas POC related linearly to particulate absorption at 443 nm (aP(443); r2=0.73), with substantial compartment-dependent differences in slope and fit strength that indicate shifting OC composition and optical regimes along the salinity gradient. Optical Water Type (OWT) classification derived from remote sensing reflectance (Rrs) resolved transitions from turbid, particle-dominated waters to clearer coastal and marine regimes, providing a framework for guiding algorithm selection and improving retrieval performance. These results provide the first concurrent, Arctic fluvial-marine assessment of DOC, POC, SPM, and optical properties while demonstrating how land–sea connectivity governs both organic carbon processing and optical structure in Arctic coastal waters.
- Article
(3685 KB) - Full-text XML
- BibTeX
- EndNote


Increasingly warmer temperatures in the Arctic have led to accelerated permafrost thaw and mobilization of previously sequestered terrestrial soil organic carbon (Schuur et al., 2015). Coupled with increasing precipitation (Rapaić et al., 2015) and consequently increasing riverine discharge (Peterson et al., 2002; Holmes et al., 2012) the transport of terrestrial organic matter into the aquatic system and coastal waters is intensifying across major Arctic watersheds (Holmes et al., 2012; Clark et al., 2022). As fresh riverine water mixes with saline ocean water across deltaic and coastal transition zones, strong gradients in salinity, turbidity, and light availability drive biogeochemical transformations including flocculation, remineralization (Eisma, 1986), photochemical and microbial degradation (Holmes et al., 2012; Juhls et al., 2019). These processes regulate the fate of terrestrial matter along the land-ocean continuum (Holmes et al., 2012; Clark et al., 2022) and ultimately influence regional carbon cycling and climate feedbacks. Among these systems, the Mackenzie River Delta– Beaufort Sea region represents one of the largest and most dynamic fluvial–marine transition zones in the Arctic, characterized by strong sediment loads, extensive permafrost influence, and pronounced optical variability, making it an ideal natural laboratory to investigate organic carbon and sediment pathways from land to ocean.
Deltaic and coastal waters function as critical biogeochemical filters that modulate the quantity and quality of organic matter and sediments exported to the Arctic Ocean (AO). Accelerated warming (Rantanen et al., 2022), permafrost thaw (Biskaborn et al., 2019) and coastal erosion (Irrgang et al., 2022; Nielsen et al., 2022) in the Arctic enhance sediment and carbon delivery to these transition zones, potentially increasing biogeochemical transformation and altering the balance between carbon storage and atmospheric CO2 exchange. Recent studies suggest that terrestrial inputs may reduce the AO's net CO2 sink strength by 7 %–14 % (Nielsen et al., 2022), which can turn coastal shelf regions into local CO2 sources (Bertin et al., 2023; Oziel et al., 2025). Despite their importance, deltaic and coastal shallow waters remain sparsely sampled, limiting our ability to resolve how land–sea connectivity controls carbon pathways and fluxes in these rapidly changing Arctic systems (Holmes et al., 2012; Zhang et al., 2021).
The magnitude and fate of exported carbon depend strongly on its composition and transport history. OC carbon exported from rivers to the ocean varies widely in both origin and composition, reflecting watershed hydrology, geomorphology, and permafrost influence (Lynch et al., 2019; Clark et al., 2022). Although dissolved and particulate fractions of OC originate from similar terrestrial sources, for instance, vascular plant degradation, soil leaching, and terrigenous erosion, they respond differently to transport and mixing processes along the fluvial–marine continuum (Clark et al., 2022). Studies across Arctic fluvial systems have shown that high river discharge conditions preserved the quality of dissolved organic matter (DOM), while low flow conditions in summer months allowed for significant microbial and photochemical degradation (Novak et al., 2022). In parallel, particulate organic carbon (POC) undergoes substantial modification through sedimentation, resuspension, and sorting processes during downstream transport and across deltaic transition zones (McClelland et al., 2016; Ogneva et al., 2023). These combined processes influence both the concentration and optical properties of organic matter delivered to Arctic shelf seas. Similarly, Juhls et al. (2019) showed modifications of terrigenous DOM across the Lena-Laptev Sea transition zone with subsequent work revealing pronounced seasonal and salinity-dependent variability in dissolved organic carbon (DOC) concentrations and optical properties on the Beaufort Sea shelf (Juhls et al., 2022).
Across fluvial-marine gradients, changes in organic matter and sediment composition are closely linked to shifts in optical properties of the water. The absorption of colored dissolved organic matter aCDOM(λ) and particulates aP(λ) provide measurable proxies for DOC and POC concentrations, and form the basis for Ocean Color Remote Sensing (OCRS) applications, or how constituents in water absorb and scatter incident light at different wavelengths, particularly in Arctic waters (Gonçalves-Araujo et al., 2015; Matsuoka et al., 2012, 2017; Pugach et al., 2018; Juhls et al., 2019, 2022). These bio-optical relationships enable synoptic monitoring of surface water properties at high temporal resolution and have supported regional retrieval algorithms for DOC, POC, and suspended particulate matter (SPM) across Arctic river-influenced shelves (Doxaran et al., 2012; Matsuoka et al., 2017, 2022; Juhls et al., 2022; Tarasenko et al., 2023). However, the robustness and accuracy of satellite retrievals depend on transferable relationships between biogeochemical and bio-optical properties, which still remain poorly constrained across the full river-delta-coastal-offshore continuum (Doxaran et al., 2012).
Satellite-based observations suggest substantial long-term changes in the Mackenzie Delta-Beaufort Sea transport, including a ∼ 50 % increase of terrestrial SPM flux (Doxaran et al., 2015), and increases in concentration of up to 57 % for POC and up to 8 % for DOC (Matsuoka et al., 2022). Consistent with this, complementary in-situ measurements indicate a 39 % increase in DOC flux over the past four decades, likely linked to permafrost thaw (Tank et al., 2016). In contrast, however, a more recent study by Tarasenko et al. (2023) reported decreasing SPM concentrations. This divergence highlights the optical complexity of fluvial-marine transition zones where waters shift from highly scattering sediment-rich plumes to more absorbing, CDOM-rich waters, and ultimately to clearer oceanic regimes. Such variability pushes satellite algorithms beyond their optimal ranges and underscores the need for more consistent in-situ validation and improved reliability of remote sensing based assessments in these dynamic Arctic environments.
Region-specific challenges further complicate remote sensing applications. During winter, the absence of sunlight precludes optical observations while the short open-water season introduces uncertainties in remote-sensing reflectance (Rrs), the fundamental input for constituent retrieval, due to persistent cloud cover and low solar elevation angles. In addition, the lack of spatially resolved, parallel measurements of biogeochemical, bio-optical, and radiometric properties across salinity gradients limits efforts to validate and operationalize satellite-based estimates of DOC, POC, and SPM across the river–delta–coastal continuum. As rivers deliver seasonally varying mixtures of dissolved and particulate constituents to coastal waters (Holmes et al., 2012), optical properties evolve across ocean, coastal, and inland waters (Xi et al., 2013), directly influencing the spectral characteristics and consequently the Rrs (Bi and Hieronymi, 2024). Optical water type (OWT) classification provides a framework to interpret this variability by linking spectral reflectance patterns to dominant optical regimes, narrowing down the corresponding concentration range of optically active water constituents. By integrating in-situ observations with bio-optical characterization, we can bridge the existing gap between point-scale biogeochemical observations and synoptic-scale satellite monitoring.
Despite these advances, Arctic coastal and deltaic waters remain under-sampled. In particular, the lack of spatially resolved parallel-sampled biogeochemical, bio-geo-optical, and radiometric data across the salinity gradients limits efforts to validate and operationalize satellite-based matter flux estimates. These areas are central to understanding how changes will impact the pan-Arctic carbon budget and source-to-sink dynamics yet are often excluded from monitoring programs due to accessibility and cost constraints. Without improved observations and process understanding in these transition zones, monitoring and modelling of carbon fluxes at relevant spatial and temporal scales remains limited.
Within this broader Arctic context, the Mackenzie-Beaufort Sea system provides an ideal setting to examine organic carbon and sediment pathways across fluvial-marine compartments. Here, we (i) quantify seasonal and spatial variability of DOC, POC, and SPM across four aquatic compartments: river, delta, coastal, and marine waters, (ii) establish refined empirical relationships between optical properties and OC, and (iii) test and apply OWT classification for improving satellite retrieval accuracy in optically complex Arctic waters. By synthesizing biogeochemical, optical and radiometric datasets collected between 2009 and 2024 across river, delta, coastal, and marine compartments, this study links OC and sediment transport to optical regimes, providing new constraints for regional satellite retrieval approaches. This work presents the first synthesis to concurrently quantify DOC, POC, SPM, and optical properties across all major compartments of the Mackenzie River Delta–Beaufort Sea fluvial–marine continuum.
2.1 Study area and expeditions
This study focuses on the land–ocean interface of the Mackenzie River Delta–southern Beaufort Sea, a fluvial-dominated delta at the terminus of the Mackenzie River, which drains the largest watershed in Canada (1.8 million km2). Approximately 42 % of the basin is covered by continuous and discontinuous permafrost (Woo and Thorne, 2003; Holmes et al., 2012; Elshamy et al., 2025) (Fig. 1a). This broad permafrost transition exerts strong controls on hydrology, sediment delivery, and organic carbon composition entering the delta-shelf system. Zones of continuous permafrost are characterized by flashy, surface-dominated runoff with strong seasonal pulses and episodic sediment delivery. The shallow soils in continuous permafrost zones can also be characterized by more labile carbon inputs from recent plant material in the near-surface area. As permafrost becomes patchier in discontinuous and sporadic zones, there is more surface-subsurface connectivity, which can lead to older, more processed inputs of carbon (Vonk et al., 2019).
The Mackenzie River is characterized by strong seasonality in both discharge and biogeochemistry (Fig. 2). Discharge observations used for this study were collected from the Mackenzie-Red River gauge station at Tsiigehtchic, part of the Arctic Great Rivers Observatory (ArcticGRO) long-term monitoring effort (arcticgreatrivers.org). The hydrography of the Mackenzie River can be described in three periods: spring ice break-up, summer to autumn months, and winter. For the purpose of this study, we will focus on the ice-free summer and autumn months (June through October).
The in-situ data presented in this study are synthesized from several datasets from both ship and land-based expeditions to the Mackenzie River Delta and Beaufort Sea that took place from 2009 to 2024: MALINA 2009 (Massicotte et al., 2021), Nunataryuk 2019 (Lizotte et al., 2023), PeCaBeau 2021 (Bröder et al., 2022), and FLOCHAR 2024 (this study), in addition to two stationary long-term sampling efforts, ArcticGRO and Mackenzie Monitoring (mackenzie-monitoring.awi.de). Table 1 shows a summary of sampling periods, sample/data types and the measured parameters of individual campaign datasets.
Sampling locations from these datasets include large parts of the Beaufort Shelf, shallow coastal waters around the Mackenzie Delta including Kugmallit Bay and Shallow Bay, and channels and distributaries of the Mackenzie River (Fig. 1b). These data were collected at various levels of river discharge (Fig. 2), where 2024 exhibited drought conditions (purple hydrograph) and 2021 exhibited a high flow year (red hydrograph). The variations exhibited by the Mackenzie River over the sampling periods allow us to investigate the influence of discharge on the transport and transformation of carbon from land to sea.
Table 1Sampling period, sample type and measured parameters of datasets used in this study.
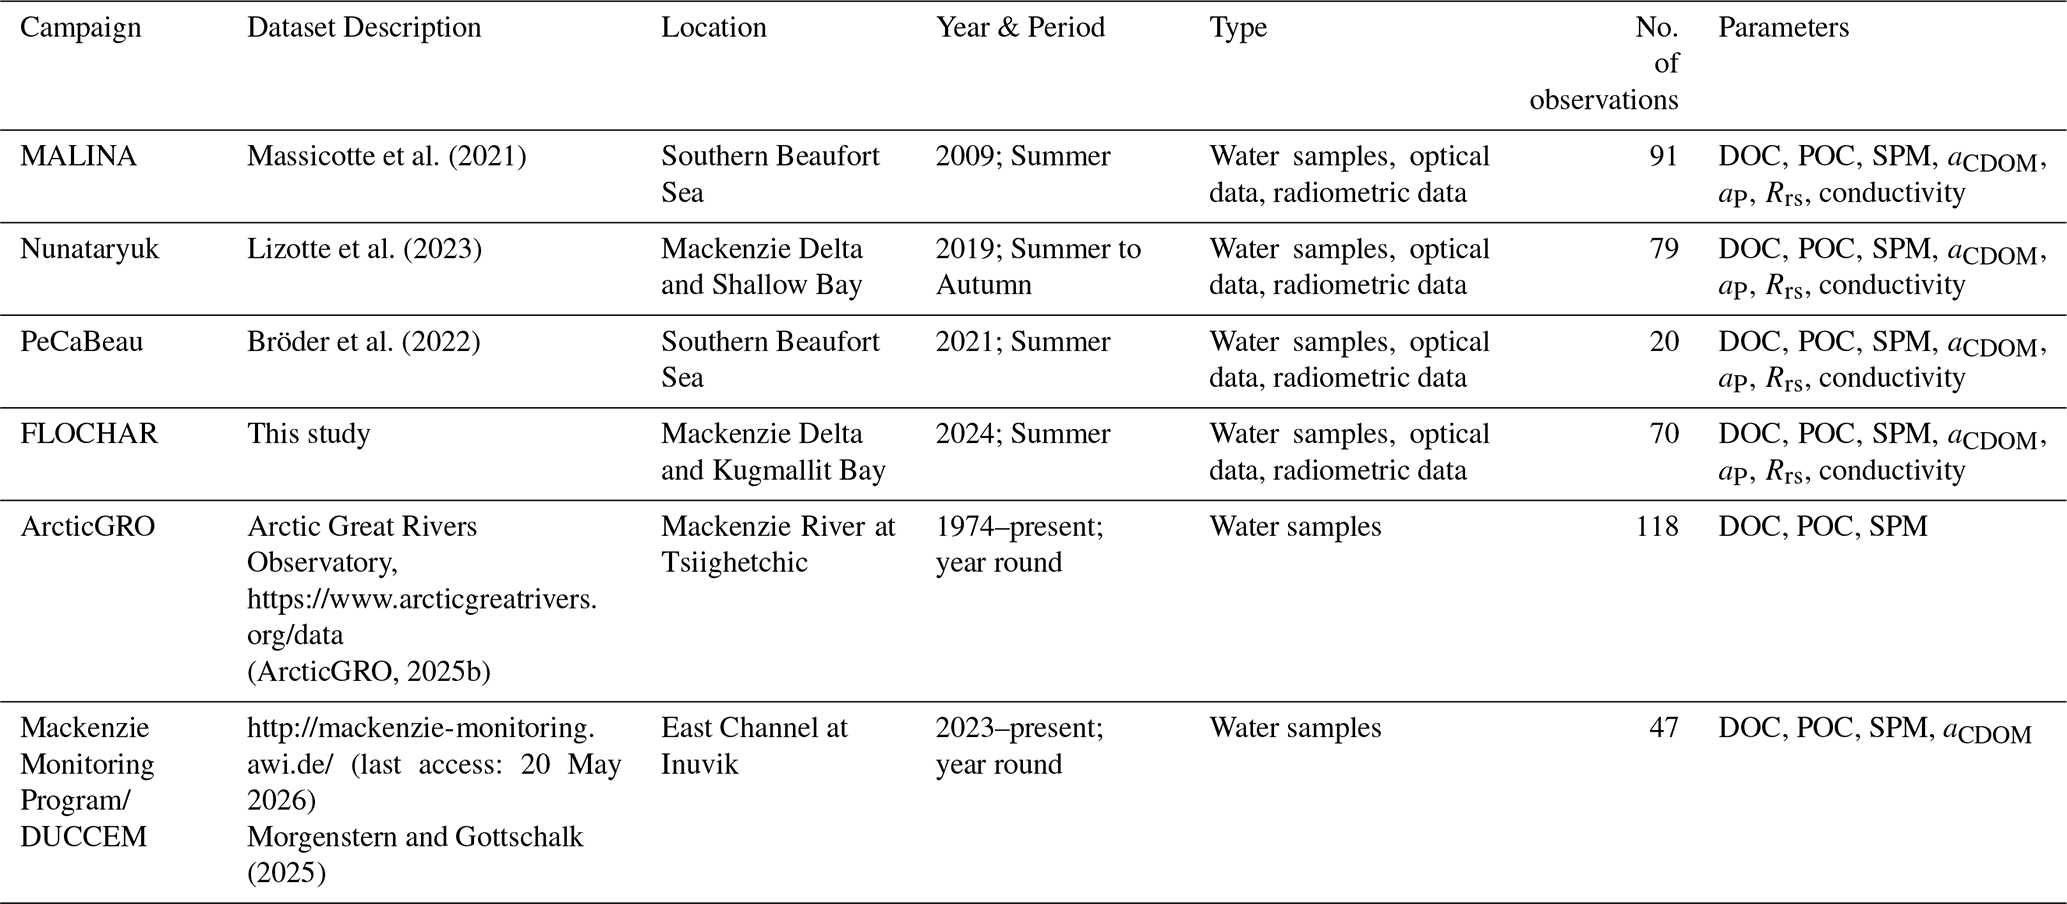
(aCDOM) = absorption of colored dissolved organic matter. (aP) = particulate absorption.
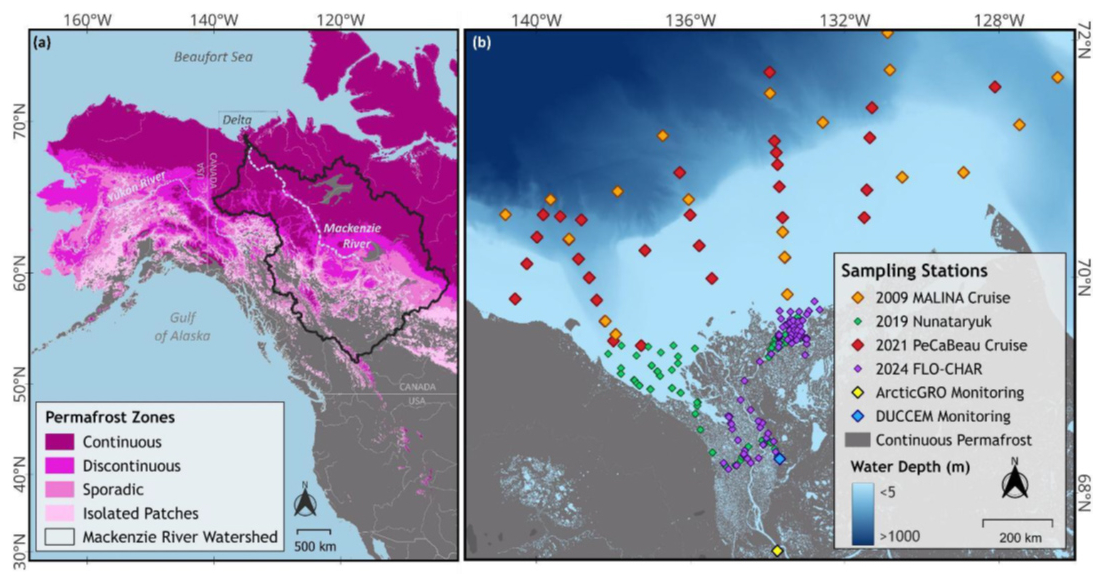
Figure 1(a) The Mackenzie River watershed footprint with the extent of permafrost zones throughout as described in Brown et al. (2002) (b) all in-situ observations collected from 2009–2024 across the land-ocean transition of the Mackenzie River Delta-southern Beaufort Sea region with the different campaigns and respective year specified in the legend (Table 1).
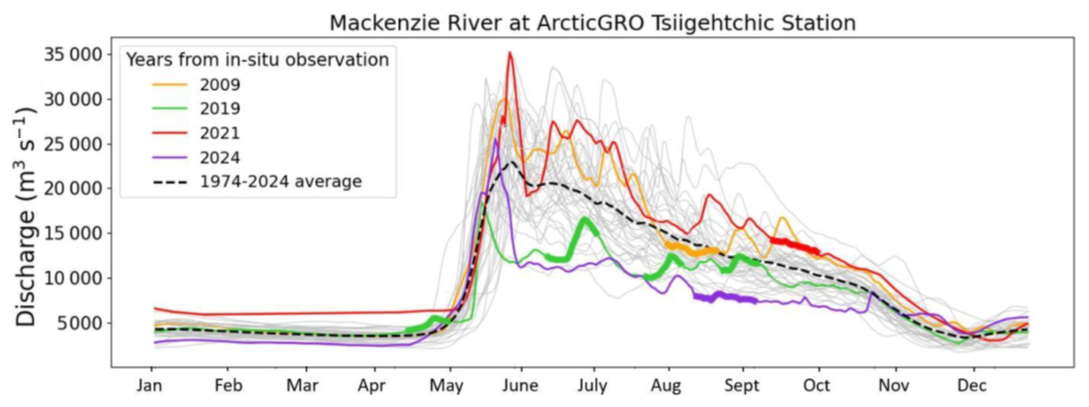
Figure 2Mackenzie River discharge at the Arctic-Red River gauge station at Tsiigehtchic (ArcticGRO monitoring; yellow diamond in Fig. 1b) from 1974 to 2024 (annual hydrograph). The annual average hydrograph for this period is indicated with a black dashed line and the hydrographs for the four years in which in-situ sampling campaigns took place are indicated by respective color with sampling periods indicated by a thicker line (Arctic Great Rivers Observatory, Absorbance Dataset, Version 20250402. https://www.arcticgreatrivers.org/data, ArcticGRO, 2025a).
2.2 Sample collection
During ship-based expeditions aboard the CCGS Amundsen (MALINA, PeCaBeau), water samples were taken using Niskin bottles on a Rosette system at defined depths along predefined transects across the shelf. For land-based expeditions (Nunataryuk, FLOCHAR, Mackenzie Monitoring), a combination of small draft boats, hovering helicopter, and riverbank sampling was used to sample freshwater locations within the delta and the shallow receiving waters of the two main outflow regions of the Mackenzie River: Kugmallit Bay to the east, and Shallow Bay and Mackenzie Bay to the west.
During land-based expeditions (Nunataryuk, FLOCHAR), discrete water samples were collected as close to the surface as possible using a pump and plastic hose to fill 10 L containers. For the Mackenzie Monitoring program, river water was sampled at the shore just below the water surface with 1 L bottles. The pump and sample containers were rinsed twice with sample water prior to collection. All water samples were filtered within 12 h of collection (see details on filtration below).
Since this study focuses on characterizing bio-optical relationships for satellite retrievals, only surface water samples (<5 m water depth; assuming a homogenous freshwater upper layer) were included in the compiled dataset. Details of the aforementioned sampling techniques can be found in the following literature for each campaign (Massicotte et al., 2021; Bröder et al., 2022; Lizotte et al., 2023; Morgenstern and Gottschalk, 2023).
2.3 Biogeochemical parameters
The following section describes the methods used to collect and analyze biogeochemical parameters presented in this study. The methods for each parameter across individual campaigns and monitoring projects are slightly different. Differences significant to this study are explained below, but for information beyond what is described, further methodological details on these campaigns are provided in Massicotte et al. (2021), Bröder et al. (2022), Lizotte et al. (2023), and Morgenstern and Gottschalk (2025).
For DOC, the MALINA and Nunataryuk, samples were filtered through 25 mm, Millipore Whatman GF/F pre-combusted filters with a nominal pore size of 0.7 µm. For the FLOCHAR and Mackenzie Monitoring programs, 47 mm, 0.45 µm Millipore cellulose acetate (CA) filters were used. The filtration setup varied slightly between each campaign. For the MALINA campaign, water samples were gravity filtered from the Niskin bottles used for collection. For the Nunataryuk, PeCaBeau, and
Mackenzie Monitoring, 30 mL syringe filtration was used. A Nalgene filtration unit was used for FLOCHAR samples. All filtered samples were acidified and stored frozen (−20 °C) immediately after processing in pre-combusted borosilicate glass vials. DOC concentrations were measured using a high-temperature catalytic oxidation (TOC-VCPH, Shimadzu) at the Alfred Wegener Institute (AWI, Potsdam, Germany) (Benner and Strom, 1993). For ArcticGRO, samples were analyzed on a Shimadzu TOC/TN analyzer at the Woodwell Climate Research Center (WHRC) in the United States.
Water samples for the analysis of colored dissolved organic matter absorption (aCDOM) were filtered and measured using slightly different procedures across the individual campaigns. For the Mackenzie Monitoring and FLOCHAR programs, samples were filtered through 0.45 µm cellulose acetate (CA) syringe filters and subsequently analyzed at the German Research Center for Geosciences (GFZ, Potsdam, Germany) using a PerkinElmer LAMBDA 950 UV–Vis spectrophotometer. Sample processing and analytical protocols followed Juhls et al. (2021). Samples collected during the PeCaBeau, MALINA, and Nunataryuk campaigns were filtered through 0.2 µm GHP syringe filters (Acrodisc Inc.) and analyzed with a Liquid Waveguide UltraPath system (World Precision Instruments Inc.) immediately after sampling aboard ship (MALINA and PeCaBeau) or following short transport to the laboratory (Nunataryuk). For ArcticGRO, absorbance was measured between 200–800 nm at 1 nm intervals using a Shimadzu UV-1800 spectrophotometer and a 1 cm pathlength.
Samples for POC from Nunataryuk and PeCaBeau were filtered using pre-combusted 47 mm Millipore Whatman GF/F filters, while samples from FLOCHAR, Mackenzie Monitoring, and ArcticGRO used pre-combusted 25 mm Millipore Whatman GF/F filters. For Nunataryuk, 0.25–1.6 L of sample volume was filtered, while 2–10 L of sample volume was filtered for PeCaBeau, and 5–6 different volumes of sample were filtered for each station ranging from 0.05–0.4 L for the FLOCHAR campaign. All sample filters were dried at room temperature, 50 °C, or freeze-dried. For Nunataryuk, samples were weighed three times each with a Mettler Toledo microscale at Laval University (Quebec City, Canada). Two punched replicates from the filters were placed into tin capsules and processed in a PerkinElmer elemental analyzer (PE 2400 Series-II CHNS/O Elemental Analyzer). For Mackenzie Monitoring, POC content was measured using a punched portion of the GF/F filters, fumigated and dried while analysis was completed on an Elemental Analyzer (EA) interface coupled to a stable isotope analyzer (Thermo Scientific EA IsoLink IRMS System) using standards Ethylenediaminetetraacetic acid (EDTA, Sigma Aldrich), following Lattaud et al. (2025). For FLOCHAR, POC concentration was processed at Helmholtz-Zentrum Hereon (Geesthacht, Germany), where the samples were acidified to remove carbonates, pressed in tin capsules, and the particulate carbon concentration determined in a Vario TOC cube instrument (Elementar, Germany). For PeCaBeau, the sample filters were not washed for salts after filtration, which may underestimate the resulting measurement, but we do not believe this has a significant impact.
For particulate absorption (aP) samples from Nunataryuk, approximately 20–500 mL of water was filtered through 25 mm Whatman GF/F pre-combusted filters. A spectrophotometer (Cary 100; Agilent Technologies, Inc.) equipped with a small (60 mm) integrating sphere was used to measure the transmittance and reflectance from the sample filters (350 to 800 nm at 1 nm increments) (Tassan and Ferrari, 1995, 2002). For PeCaBeau, water samples were filtered through pre-combusted 25 mm Whatman GF/F filters. The filters were stored frozen until measurements of particulate absorption were made at Scripps Institution of Oceanography (San Diego, California, USA) using a custom-made spectrophotometer attached to a 150 mm integrating sphere. For FLOCHAR, one volume (3–30 mL) was filtered on a combusted 25 mm GF/F filter for samples measured in the visible (350–800 nm), and one volume (100–400 mL) was filtered on a combusted 25 mm GF/F filter for samples measured in the near infrared (NIR, 700–2500 nm). All sample filters were directly measured with a QFT-ICAM (Röttgers et al., 2015). Here, measurements with a PSICAM (Röttgers and Doerffer, 2007) conducted on unfiltered and filtered water samples (500 mL; 0.2 µm) are used for accurate aP measurements in the wavelength range 400–700 nm, and finally combined with the results of the QFT-ICAM.
For SPM samples from Nunataryuk and PeCaBeau, pre-combusted 47 mm Millipore Whatman GF/F filters were used, while pre-combusted 25 mm Millipore Whatman GF/F filters were used for FLOCHAR and Mackenzie Monitoring. For Nunataryuk, samples were weighed three times each with a Mettler Toledo microscale. For FLOCHAR, 5–6 different volumes of the same sample (0.1–2 L) were filtered using a Nalgene filtration unit as described in Röttgers et al. (2014). For Nunataryuk and Mackenzie Monitoring, 30 mL syringe filtration was used. For all samples, values for SPM were obtained by subtracting the initial weight of the blank filters from the final weight of the dried particulate-matter-laden filter. For PeCaBeau, the sample filters were not washed for salts after filtration, which may overestimate the resulting measurement, but we do not believe this has a significant impact.
2.4 Optical parameters
Inherent optical properties (IOPs) such as light absorption, beam attenuation, and scattering coefficients define apparent optical properties (AOPs), including Rrs, which is often used synonymously with ocean color. To relate water sample properties to radiometric measurements, absorption at 443 nm was analyzed alongside DOC and POC concentrations from co-located samples collected during all campaigns. This is a commonly used wavelength in ocean color remote sensing due to its sensitivity to multiple optically active constituents and its widespread availability across satellite missions (Pegau et al., 1997; Sullivan et al., 2006). Identifying and characterizing these variabilities is necessary to understand and define the limits of validity of these bio-optical relationships in order to best estimate DOC and POC across the fluvial-marine compartments. In order to evaluate the limitations of these relationships, we compared the relationship of each compartment (river, delta, coastal, marine) with a cross-compartment relationship that spans the full fluvial-marine and salinity gradient.
For this study, filtration for particle absorption in the visible (350–800 nm) called for 2–20 mL of sample filtered through a combusted 25 mm GF/F filter. These filters were directly measured with a quantitative filter technique using an integrating cavity absorption meter (QFT-ICAM) as described in Röttgers et al. (2015). Because this study synthesizes datasets collected during several independent campaigns between 2009 and 2024, minor methodological differences in sample collection, filtration, and analytical protocols exist among the contributing datasets. In particular, different filter types and pore sizes were used for dissolved measurements (0.7 µm GF/F filters during MALINA and Nunataryuk while 0.45 µm cellulose acetate filters were used during FLOCHAR and the Mackenzie Monitoring program). Additionally, CDOM absorption was measured using different optical systems (e.g., UltraPath/Liquid Waveguide systems versus conventional spectrophotometers). Such differences can potentially influence measured DOC concentrations and CDOM absorption by altering the operational definition of the dissolved fraction or by introducing small instrument-specific biases.
However, previous methodological intercomparisons indicate that these effects are generally small relative to the natural variability observed across Arctic fluvial marine gradients. For example, filter comparison experiments in the Lena River showed that DOC concentrations measured with 0.45 and 0.7 µm filters differed on average by only ∼ 2.5 %, while aCDOM(443) measurements obtained using different filtration approaches and analytical instruments typically varied by ∼ 5 %–10 % without showing a systematic bias (Supplement Fig. S1 in Juhls et al., 2021). These differences are small compared with the large spatial gradients observed in this study.
While such methodological variability may introduce minor scatter in cross-campaign comparisons and bio-optical regressions, it is unlikely to affect the major patterns or relationships identified across the fluvial-marine continuum. Nonetheless, the compilation of long-term multi-campaign datasets highlights the importance of continued efforts toward methodological harmonization in Arctic monitoring programs to further improve the comparability of optical and biogeochemical measurements.
2.5 Radiometric data
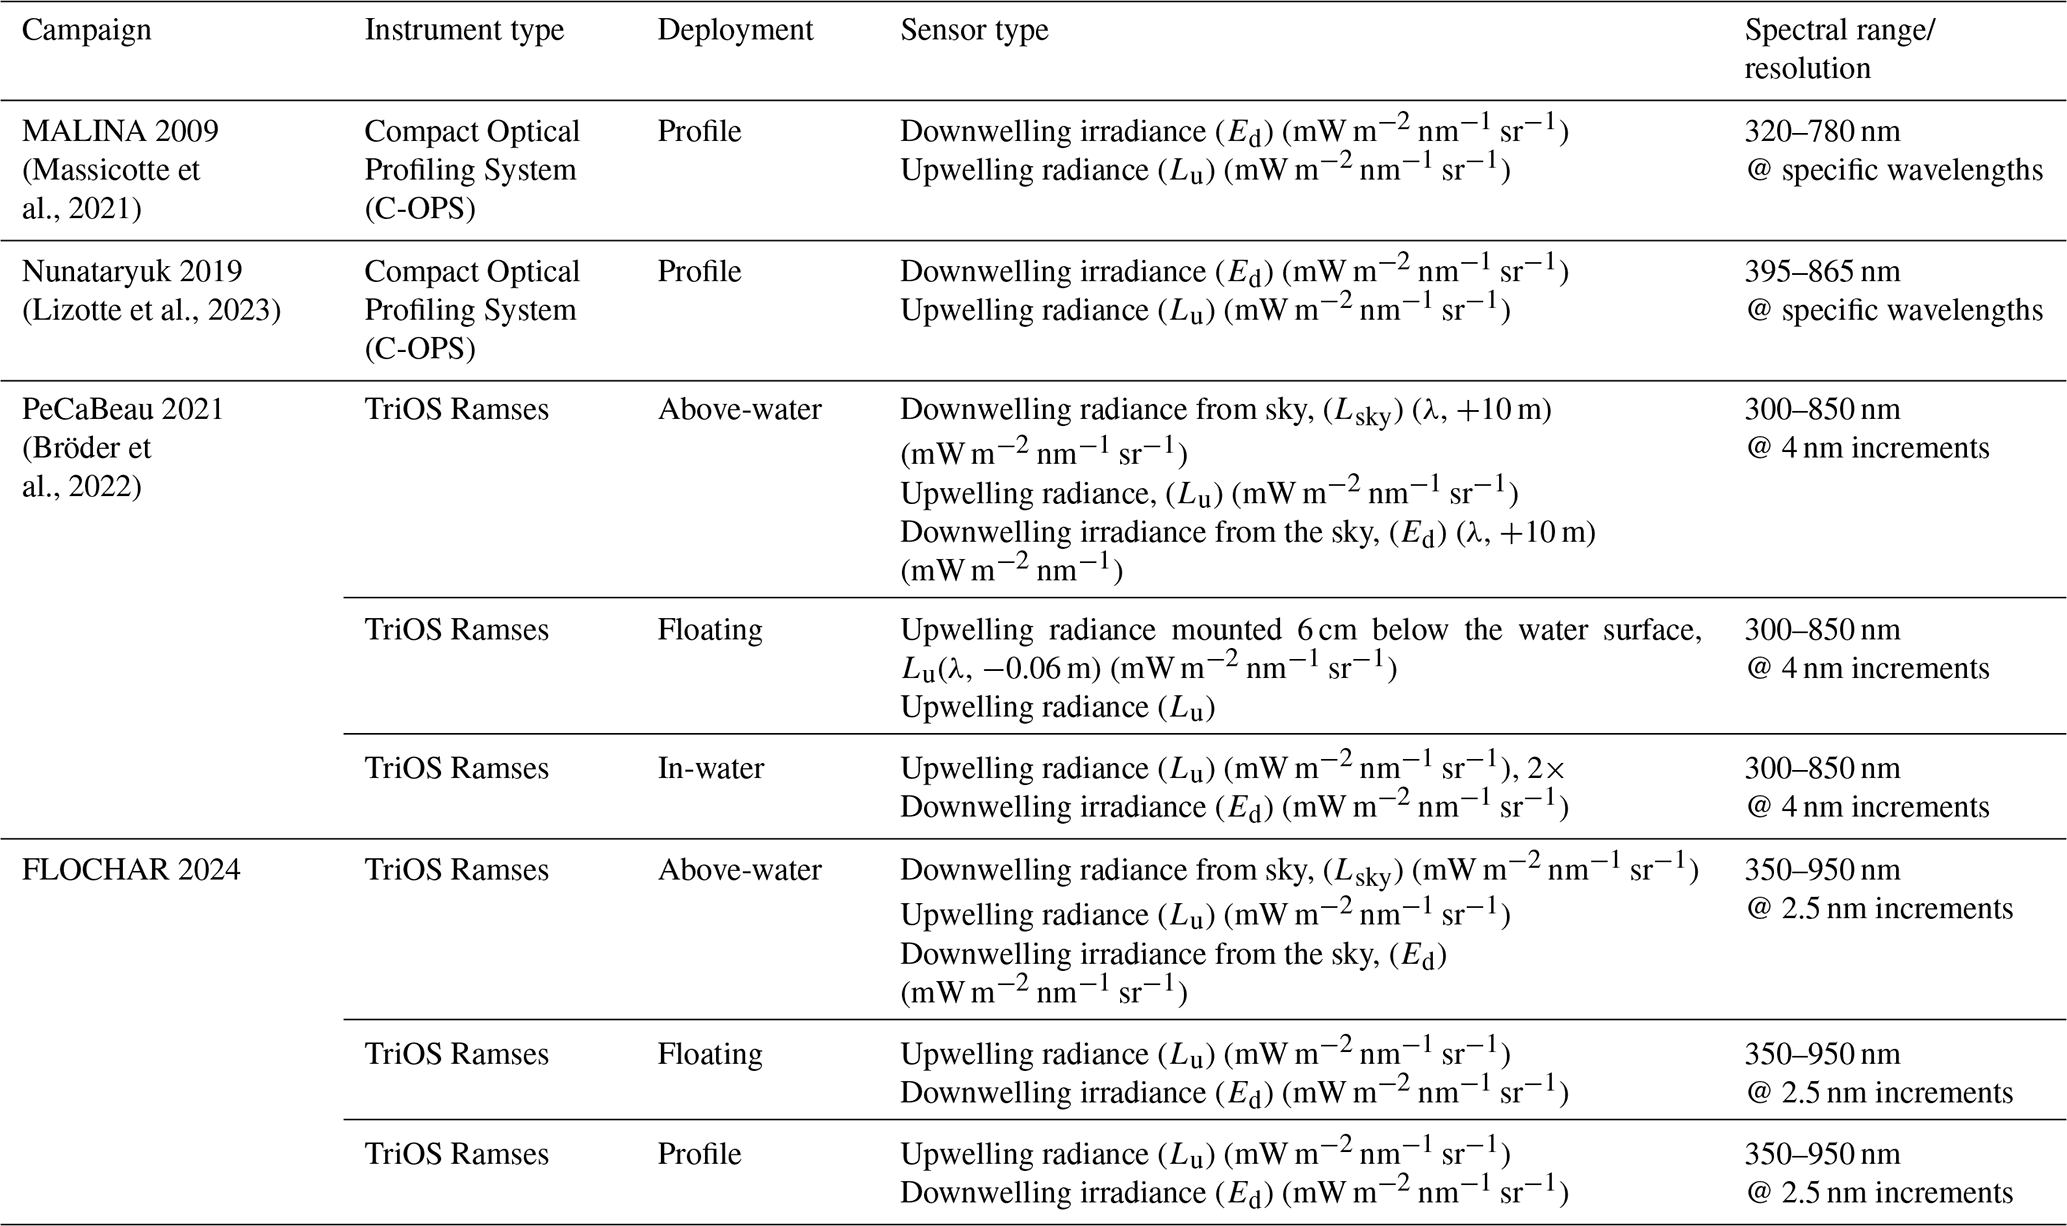
Radiometric measurements were conducted using a variety of instrument setups for both ship and land-based expeditions to capture the in-situ water reflectance spectra (Rrs). Table 2 provides detailed information on sampling techniques for each sampling campaign.
Table 2Details of radiometric measurements made during each sampling campaign from 2009–2024.
2.6 Optical Water Type (OWT) classification
In-situ measurements of bio-optical properties are essential for the calibration and validation of OCRS algorithms. When integrated with radiometric observations (e.g., upwelling radiance, downwelling irradiance, and water-leaving reflectance), these measurements provide critical ground-truth data to improve satellite-derived estimates of POC and DOC concentrations. For further interpretation of these bio-optical and radiometric measurements, we employed the OWT classification scheme by Bi and Hieronymi (2024).
This method distinguishes clusters of Rrs, which are determined by different concentration ranges of the optically active water constituents. The classification scheme is designed to apply to inland, coastal and ocean waters, as well as for various hyper- and multispectral band settings of in-situ measurement methods and satellite missions. In this method, three optical variables are extracted from the Rrs spectrum to classify the OWT, leveraging both the spectral shape and magnitude. These are: the apparent visible wavelength (AVW) between 400 and 800 nm, the (Box-Cox-transformed) spectral area below three red, green, and blue bands (ABC), and the normalized difference index at green and red (NDI). Ten types are defined, covering the optical extremes from oligotrophic ocean waters (OWT 1), to eutrophic waters with high phytoplankton biomass (OWT 5), and to CDOM-rich waters (OWT 7). OWT labels ending with “a” and “b” are intended for types with similar spectral shapes but different magnitudes, with “b” generally representing a variant with higher brightness. In color scales, OWT 1 and 2 stand for blue, 3 for turquoise, 4 and 5 for greenish, 6 for light brown and 7 for dark brown waters. For the purposes of this study and to better represent the regional optical variability, broader categories river, delta, coastal, and marine are used as well.
2.7 Hydro-salinity Compartment Delineation
To examine the fate and variability of biogeochemical parameters across the fluvial-marine transition of the Mackenzie River Delta-Beaufort Sea system, we generated a large dataset that covers spring freshet to late summer for years between 2009 and 2024 (Table 1, Figs. 1 and 2). Compared to previously published studies, this synthesis presents a unique compilation of riverine, deltaic distributary, coastal and marine water types, which we use to examine biogeochemical relationships and calculate flux of organic matter across the land-sea transition.
The compiled dataset was first classified into three water types according to in-situ salinity measurements (CastAway CTD) based on the Venice System (1958): freshwater (salinity < 0.5 psu), coastal (0.5–20.0 psu), and marine (>20 psu). To further examine the variability within the dynamic delta zone of the Mackenzie River Delta, we subclassified freshwater based on channel morphology: main river channel (river compartment) upstream of the distributary network channels (delta compartment) (Fig. 1b). The river compartment includes the main stem of the Mackenzie River channel upstream of its bifurcation into distributary channels, located at Tsigethchiic, which is approximately 150 km from the river mouth (Tarasenko et al., 2023). The delta compartment includes distributary channels downstream of the first major bifurcation at the delta apex, where interaction between the river and deltaic channels continue downstream until the coastal waters.
3.1 Spatial variability of DOC, POC, and SPM
The four aquatic compartments classified by salinity and channel morphology are used in this study to describe the spatial patterns of DOC, POC, and SPM across the fluvial-marine transition. The main riverine channel is hereafter referred to as the “river” compartment, freshwater distributary channels of the deltaic floodplain as the “delta” compartment, waters with salinity 0.5–20.0 psu as the “coastal” compartment, and waters >20.0 psu as the “marine” compartment.
Sampling coverage was not evenly distributed across seasons or compartments per campaign, reflecting the multi-campaign nature of the compiled dataset. The distribution of DOC, POC, and SPM concentrations was examined using all available data throughout the campaign years (2009–2024) and the two monitoring stations. DOC concentrations were highest in the river compartment (n=39; mean 4.78 ± 1.12 mg L−1), and declined steadily across the fluvial-marine gradient towards marine waters (n=50; mean 1.88 ± 0.96 mg L−1; Fig. 3a). POC exhibited a broadly similar decrease along the gradient, but showed greater variability within the delta compartment (n=91; mean 1.38 ± 1.21 mg L−1) compared to the river compartment (n=45; mean 1.49 ± 1.06 mg L−1).
Similarly, SPM concentrations were highest in the river compartment (n=39; mean 104.63 ± 86.20 mg L−1) and decreased considerably towards marine waters (n=56; mean 7.17 ± 12.44 mg L−1; Fig. 3), with the largest variability observed in river and delta waters. Sample availability varied among compartments and seasons, reflecting differences in campaign focus and accessibility across the fluvial–marine transition.
Examining the seasonality of the river compartment, where year-round observations are available from the ArcticGRO monitoring station at Tsiigehtchic, SPM and POC concentrations show peaks during the freshet (May–June) and remain elevated into summer (August–September). A second, smaller and more variable peak occurs during the late summer/fall (September–October) (Fig. 3c and d). DOC concentrations exhibit a similar summer maximum, followed by increased concentrations during autumn and early winter (October–December) (Fig. 3e).
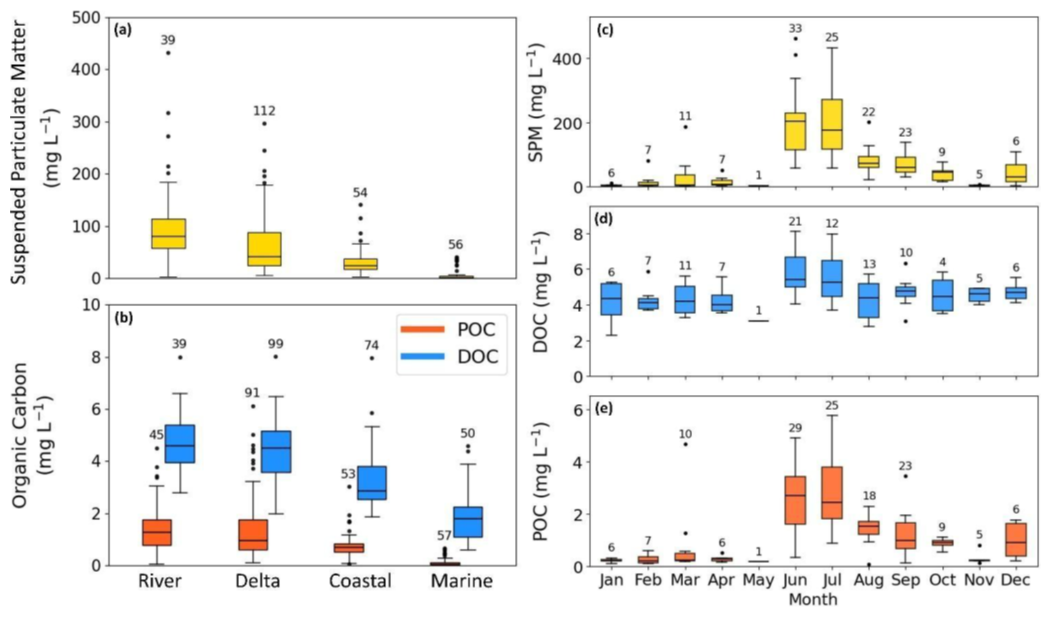
Figure 3Spatial variation of biogeochemical parameters (a–b) across the river, delta, coastal and marine compartments of the fluvial-marine transition zone from all campaign data from 2009–2024 and (c–e) monthly average concentrations in the river compartment from ArcticGRO year-round observations at Tsiigehtchic from 2009–2024. Boxplots show median, quartiles, outliers and range for measurements of SPM (yellow), DOC (blue), and POC (orange). The river compartment is delineated as the freshwater main river channel of the Mackenzie River, the delta compartment is defined as the freshwater distributary channels of the deltaic floodplain, waters with salinity 0.5–20.0 psu are defined as the “coastal” compartment, and waters >20.0 psu are defined as the “marine” compartment.
Concentrations of dissolved and particulate constituents notably decreased with increasing salinity along the fluvial-marine transition (Fig. 4). DOC exhibited a strong negative linear relationship with salinity (0.2–35 psu) (r2=0.79), with the highest concentrations (>10 mg L−1) occurring at very low salinities and declining to <1 mg L−1 at salinities above 30 psu (Fig. 4a).
Figure 4b depicts aCDOM(443) showing a similar inverse relationship with salinity (r2=0.74), with values decreasing from >4 m−1 in freshwater to much lower values in marine waters. POC and SPM concentrations also generally declined with increasing salinity, although with greater scatter relative to dissolved components (r2=0.5 and r2=0.45, respectively). POC concentrations were highest at low salinities (>3 mg L−1) and decreased to much lower concentrations in marine waters (Fig. 4). Similarly, SPM concentrations were highest in the freshwater endmember (up to 400 mg L−1) and declined substantially along the salinity gradient, with most marine samples exhibiting concentrations below 20 mg L−1 (Fig. 4d).
The dashed red lines show the theoretical conservative mixing line between freshwater (≤0.2 psu) during spring freshet and the marine endmember. The dashed black lines show the theoretical conservative mixing line of year-round averaged concentrations between freshwater (≤0.2 psu) and the marine endmember. Red-outlined symbols represent water samples collected during the spring freshet (May through June) across different campaigns. The spring freshet mean for DOC (6.61 mg L−1) is noticeably higher than the annual freshwater mean (5.12 mg L−1) (Fig. 4a). Similarly, for aCDOM(443), the spring freshet measurements draw the freshwater mean from (1.45 m−1 annual mean) to (2.01 m−1 spring freshet mean) (Fig. 4b). Particulates exhibit a similar pattern between year-round and spring freshet freshwater endmembers. For SPM, the average freshwater freshet concentration is almost 2× higher than the annual freshwater average (117.03 and 62.97 mg L−1, respectively) (Fig. 4d), while the average freshwater freshet concentration for POC (1.62 mg L−1) is also noticeably higher than the mean annual freshwater endmember (1.02 mg L−1) (Fig. 4c).
Overall, these relationships demonstrate pronounced decreases in both dissolved and particulate organic matter pools along the fluvial–marine mixing continuum with noticeable influences from the seasonal spring freshet from the Mackenzie River.
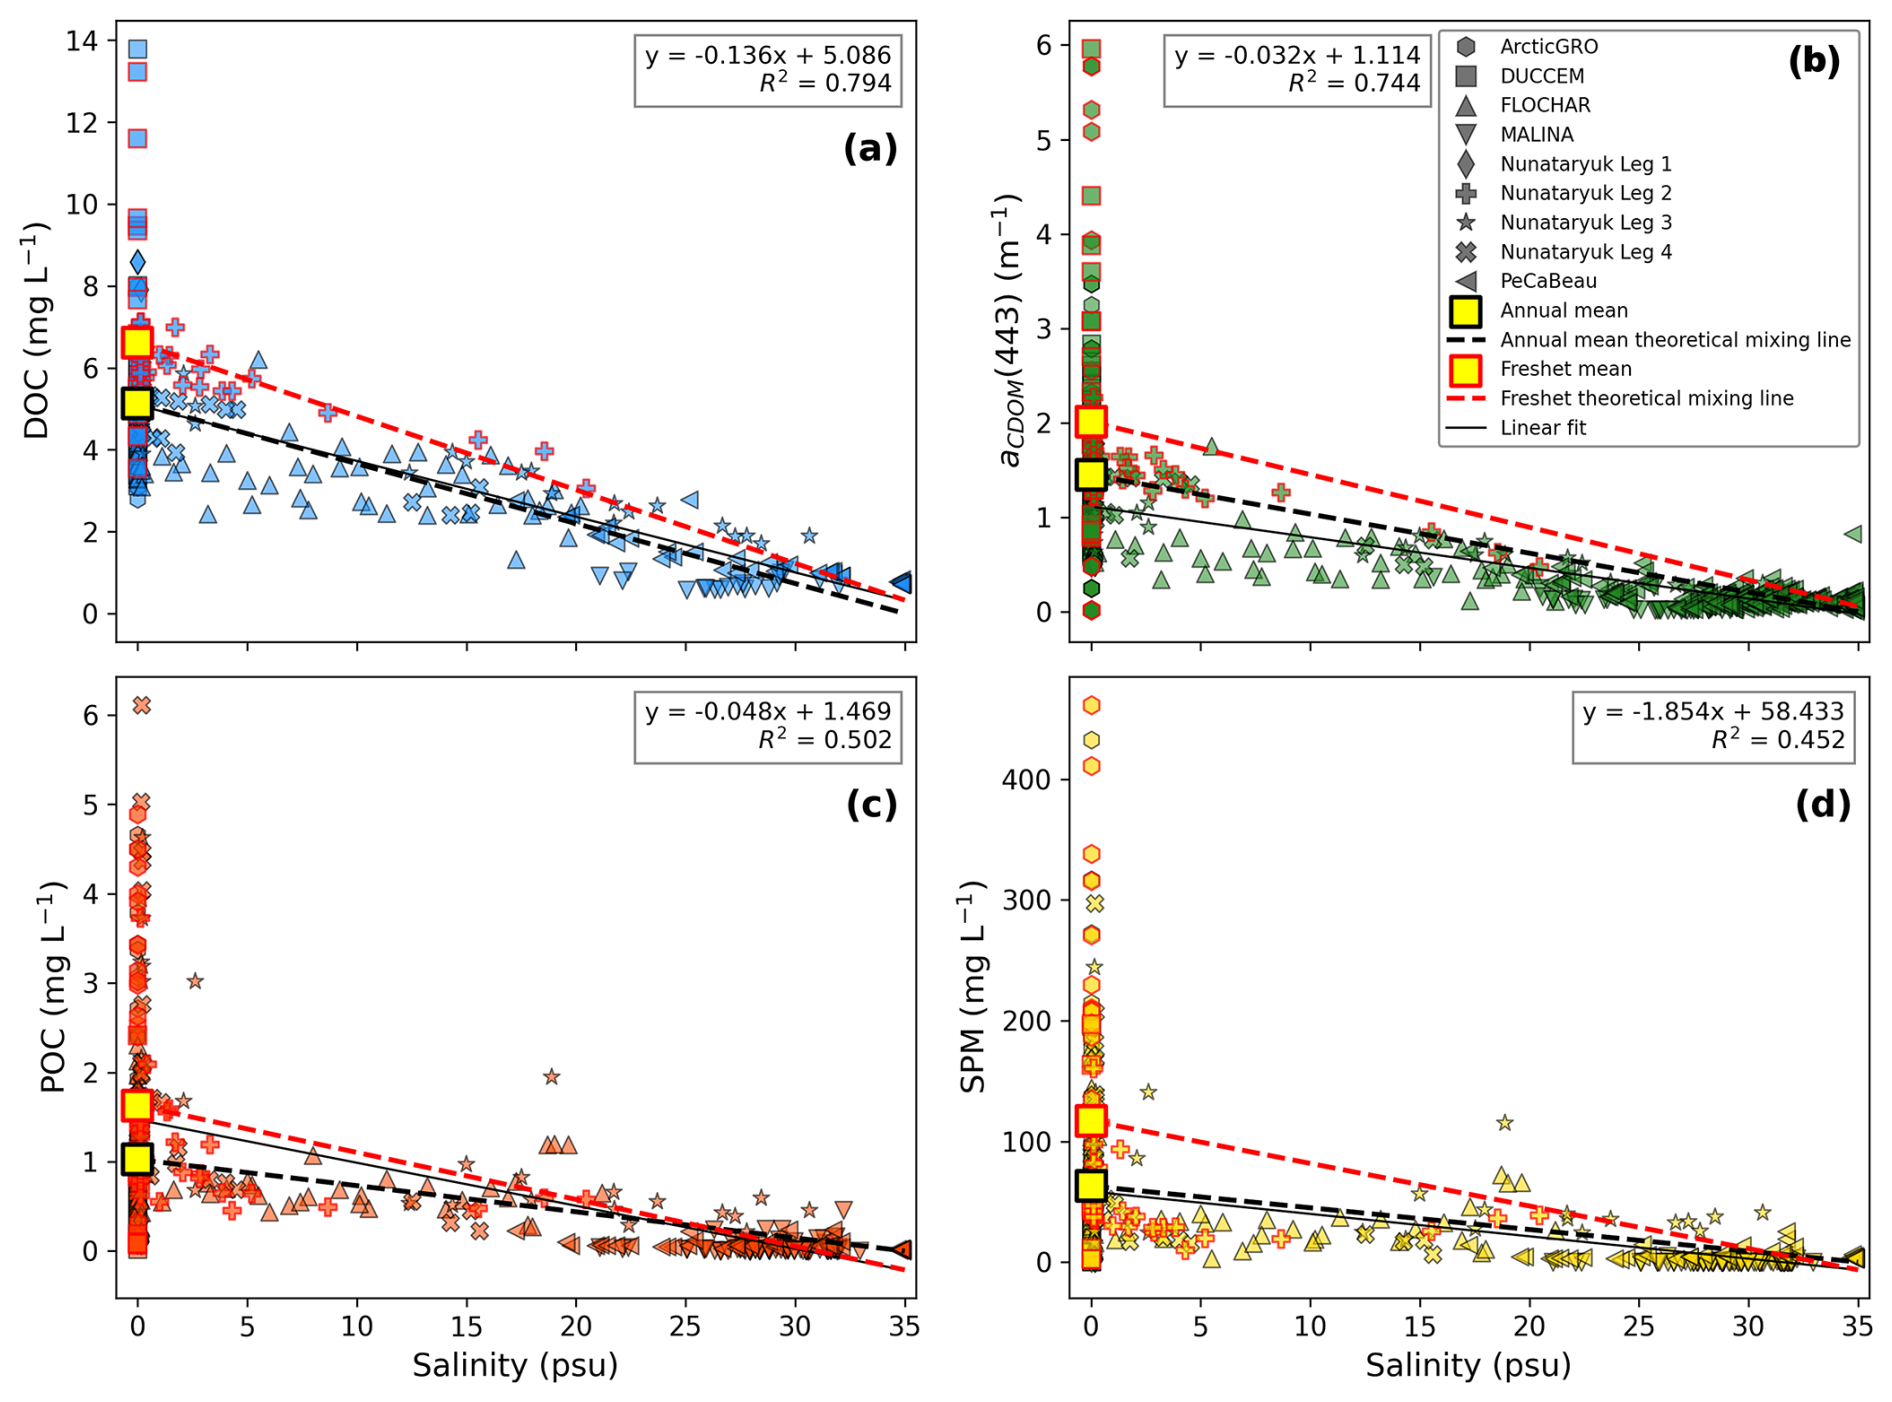
Figure 4Linear regressions between salinity (psu) and (a) DOC, (b) aCDOM(443), (c) POC and (d) SPM across the fluvial marine salinity gradient from all campaign data from 2009–2024. The solid black lines represent the linear fit. The linear regression analysis filtered observations for salinity >0.2 psu for all four parameters to exclude the large seasonal variation of the river water. The yellow box outlined in black represents the annual mean for observations ≤0.2 psu and the black dashed line represents the annual mean theoretical mixing line. The yellow box outlined in red represents the freshet mean for observations ≤0.2 psu while the red dashed line represents the spring freshet theoretical mixing line (for months May–June, as described in Holmes et al., 2012). Observations outlined in red represent samples from May and June. Equations and coefficients of determination (r2) are shown for each plot.
Across the salinity gradient, total OC concentrations declined from freshwater to marine environments (Fig. 5a). This decrease was primarily driven by a reduction in the dissolved fraction of OC, which constituted the predominant fraction throughout the fluvial-marine gradient, while POC contributed a smaller and more variable fraction. The most pronounced reduction in total OC occurred at low salinities (<10 psu), followed by a more gradual decline towards marine waters. Variability was highest at low salinity, where both DOC and POC showed a broader range of concentrations, whereas offshore waters showed lower concentrations with reduced variability. When aggregated by compartment (Fig. 5b), the river and delta compartments exhibited the highest total OC concentrations, with DOC consistently exceeding POC, while the marine compartment showed the lowest total OC and the smallest relative POC contribution to the OC pool. Note that sample numbers varied among salinity bins and compartments, reflecting uneven spatial and seasonal sampling coverage across the fluvial marine transition.
3.2 Associated optical properties and absorption characteristics
Comparison of particulate and dissolved absorption from filtered and unfiltered water samples revealed clear differences along the fluvial-marine continuum. Particulate absorption (aP) consistently dominated over the dissolved component (aCDOM) along the salinity gradient (Fig. 5c), with a distinct decrease in aP above 20 psu. In contrast, aCDOM exhibited a more gradual decline and showed less variability than aP. A comparable pattern is evident across the freshwater-to-marine compartments (Fig. 5d). While aCDOM remains relatively stable from the river to the coastal compartment, aP demonstrates a progressive decline across this transition. In the marine compartment, located furthest from the influence of the sediment plume, both particulate and dissolved absorption components show a marked decrease.
Overall, these patterns indicate a systematic shift in the relative contributions of particulate and dissolved optical components along the fluvial-marine continuum. While dissolved organic carbon constituted the dominant fraction of total organic carbon, particulate absorption (aP) contributed disproportionately to total absorption, indicating that particulate components exert a stronger influence on optical properties than suggested by their relative contribution to total organic carbon concentrations.
3.3 Optical water types
The distribution of optical water types (OWTs) classified by maximum membership shows a systematic shift along the salinity gradient and across fluvial-marine compartments (Fig. 5e–f). At low to medium salinities (0–20 psu), OWT 6 represents the dominant class, it stands for bright brown water with a high concentration of detritus. In addition, OWT classes 5a and 5b contribute with a green and bright green appearance and a much lower sediment proportion. With increasing salinity, the relative contribution of OWT 5a and 5b increases and becomes more prevalent within the coastal salinity range. At salinities exceeding 20 psu, the sediment component decreases substantially, while classes defined for transitional waters OWT 3a and OWT 2 increase in relative abundance. When grouped by compartment (Fig. 5f), delta samples are primarily associated with OWT 6, whereas coastal waters show a broader distribution of OWT memberships, including a few cases characterized by higher phytoplankton biomass OWT 5a and 5b. The marine compartment is characterized by a shift toward OWT 3a and OWT 2, with only minor contributions from higher-numbered OWT classes. Overall, the distribution of OWT memberships indicates a gradual transition in optical regimes across the fluvial–marine continuum.
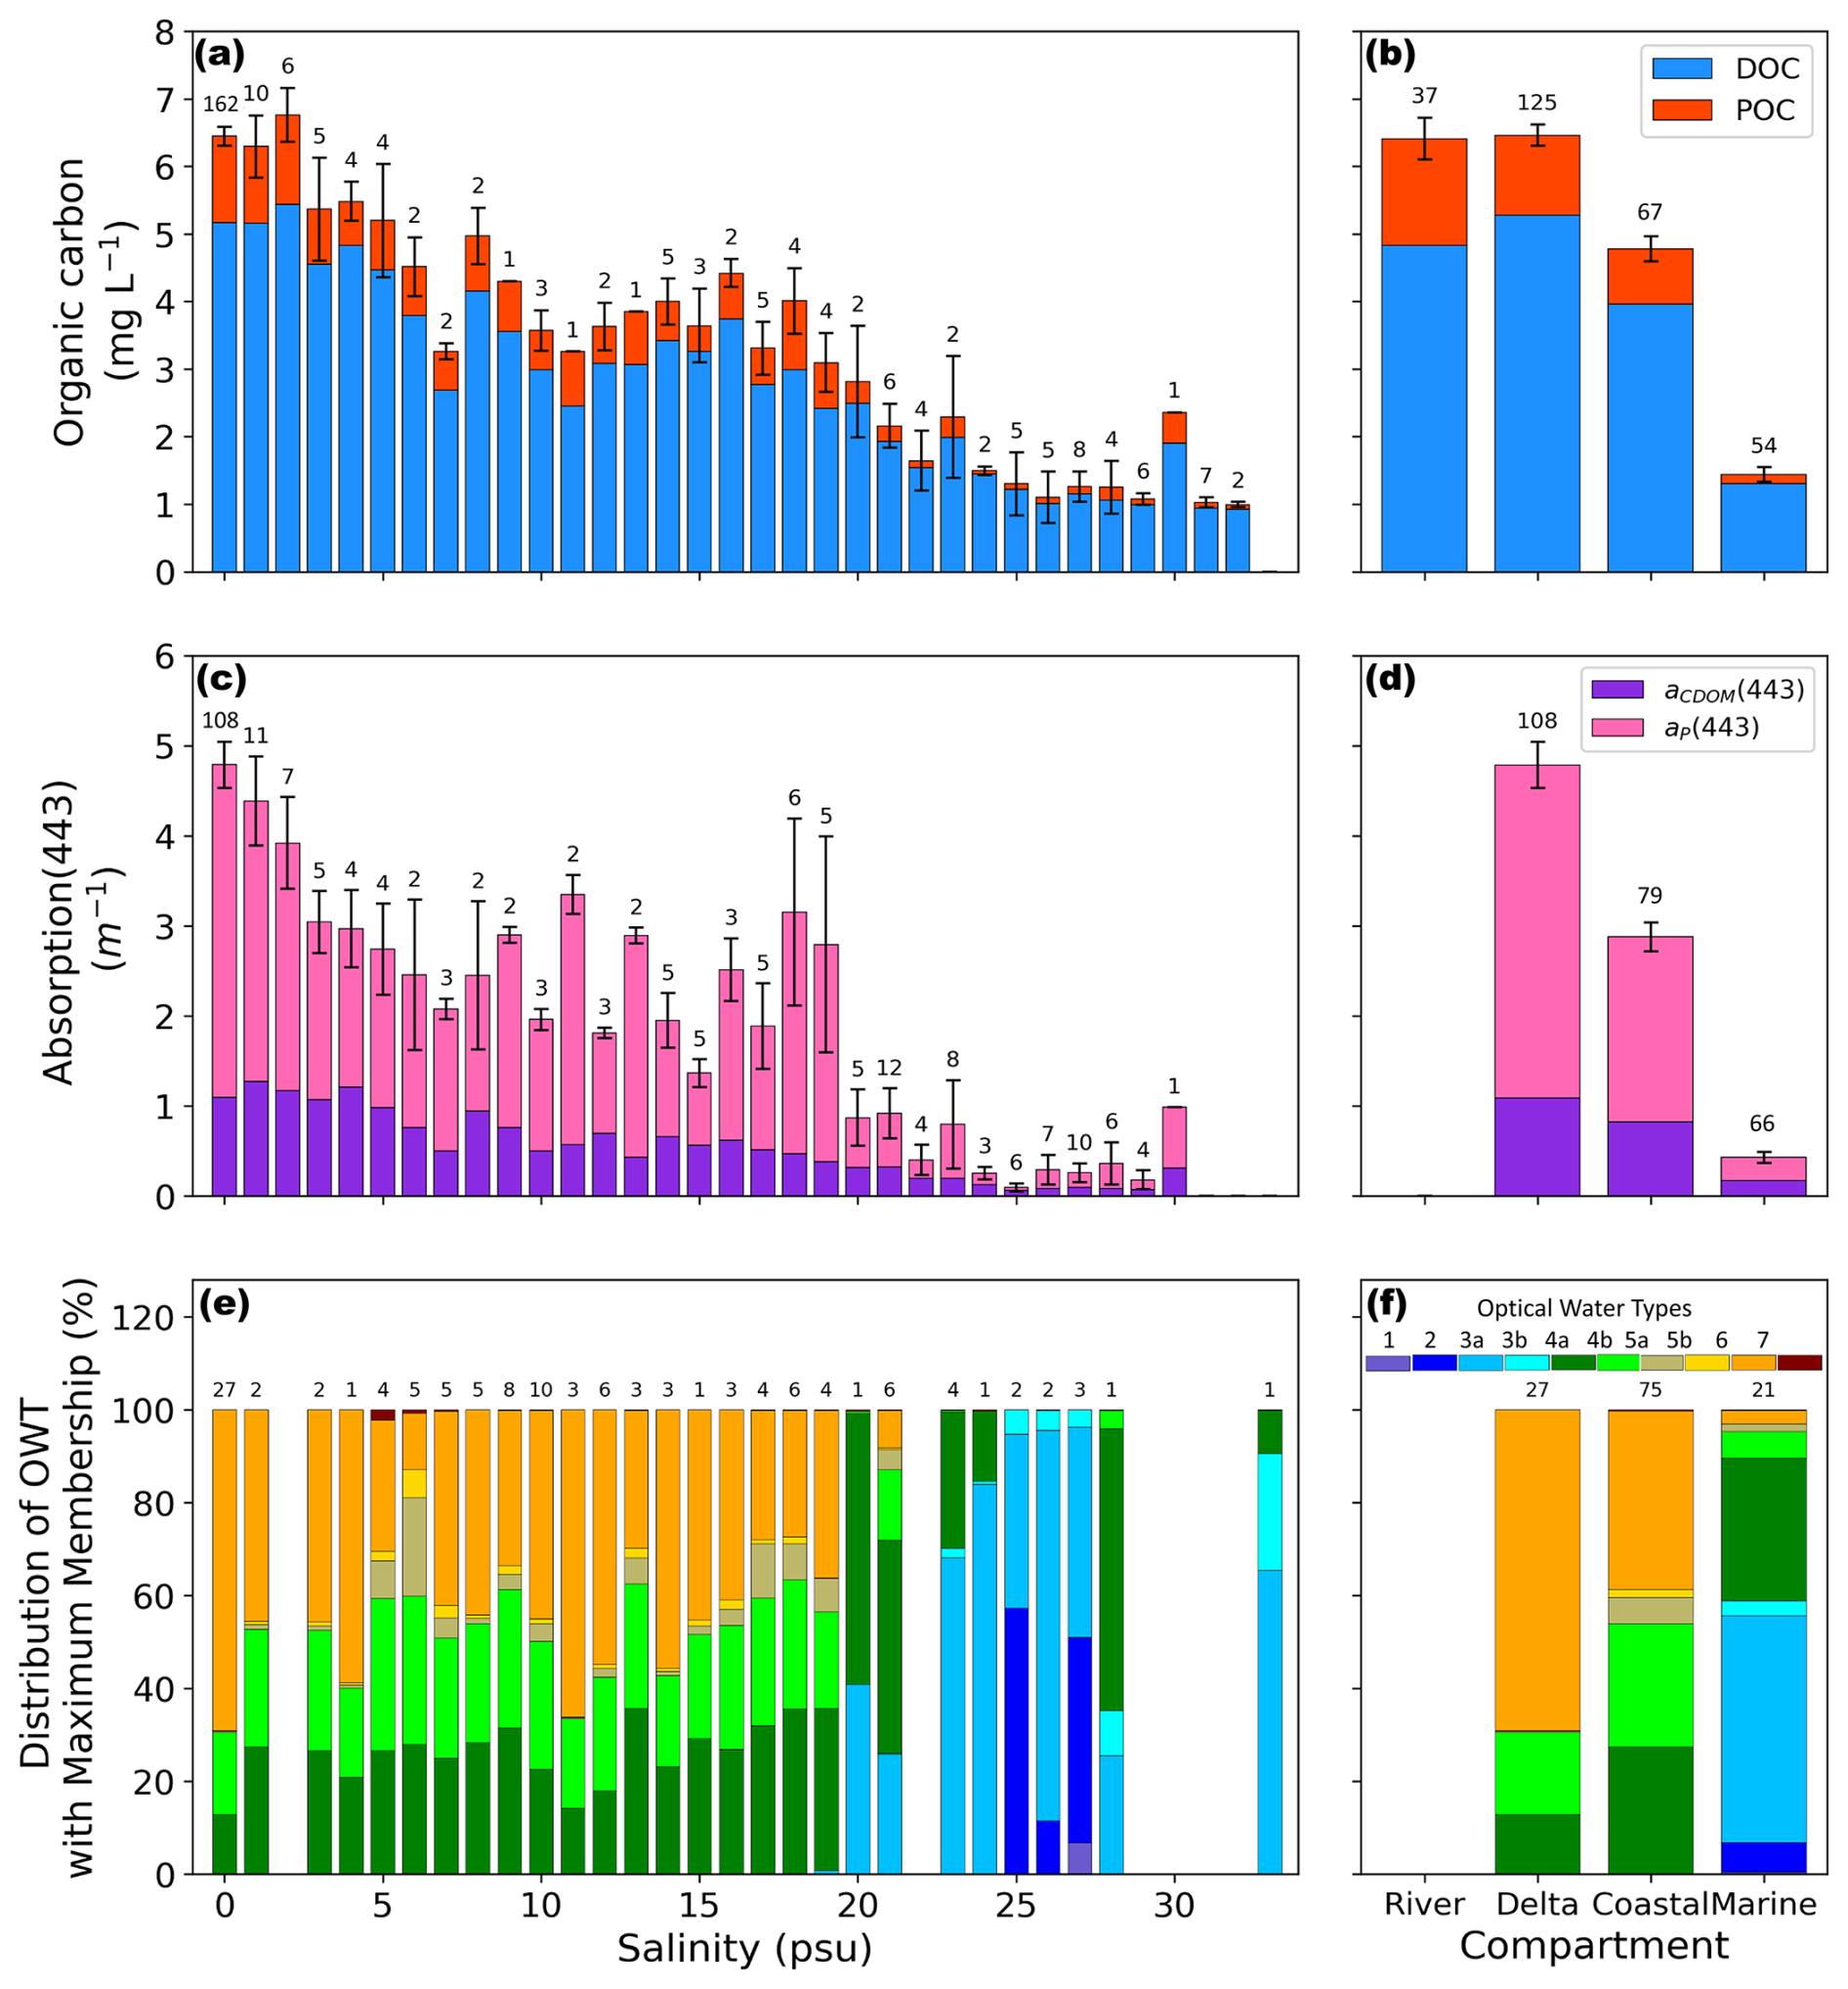
Figure 5(a) Changes in DOC (blue) and POC (red) concentration along the salinity gradient and (b) from river to delta to coastal to marine compartments for samples collected during the open-water season from the MALINA, Nunataryuk, PeCaBeau, FLOCHAR, ArcticGRO, and Mackenzie Monitoring campaigns during 2009–2024. The middle graphs (c, d) show the relative contributions to the light absorption coefficient of dissolved (purple) and particulate (pink) components from MALINA, Nunataryuk, PeCaBeau, and FLOCHAR campaign samples. The lower graphs (e, f) show the contributions of OWT memberships along the salinity gradient and along the freshwater-marine compartments from a subset of data where both radiometric and optical data was available. Error bars represent standard error and the numbers above bars reflect the number of samples.
3.4 Bio-optical relationships
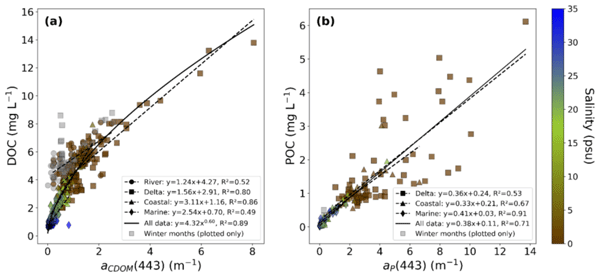
A strong, non-linear relationship was found between observed DOC concentrations and aCDOM(443) across the full salinity gradient, with an overall coefficient of determination of r2=0.89 (Fig. 6a). While compartment-specific relationships were generally linear, combining samples across compartments resulted in a non-linear relationship. The overall regression reflects the combined variability of river and delta samples at higher aCDOM(443) values, while marine samples form a tightly clustered low-concentration group. The strength and type of this relationship vary markedly among compartments with the coastal compartment exhibiting the strongest linear relationship (r2=0.86) followed by the delta compartment (r2=0.80). The marine compartment (r2=0.49) exhibited a weaker relationship and narrower range of DOC variability. The compartment specific regressions differed not only in strength but also in slope, with steeper relationships observed in coastal and marine compartments compared to river and delta samples, contributing to the non-linear cross-compartment scaling.
A linear pattern is observed between POC and aP(443) across delta, coastal, and marine compartments (Fig. 6b), with an overall r2=0.71. Note that no aP(443) data was available for the river compartment. Among individual compartments, the marine zone showed the strongest POC-aP(443) relationship (r2=0.91), while the delta compartment exhibited the weakest correlation (r2=0.53). In contrast, the coastal compartment shows a moderate relationship (r2=0.67), indicating spatial variability in the optical-biogeochemical coupling of particulate matter. Slopes of the POC-aP(443) relationships were more consistent across compartments, resulting in a broadly linear cross-compartment relationship despite differences in correlation strength. Samples associated with lower-numbered OWT classes clustered toward lower aCDOM(443) and aP(443) values, whereas higher-numbered OWTs occupied the high-absorption end of the regression space within the subset of samples with available radiometric measurements (Fig. A1). Consistent with the observed POC-aP(443) relationships, POC concentrations exhibited a strong positive linear association with suspended particulate matter (SPM) across the dataset (Fig. A1; r2=0.69, n=162). POC increased linearly with SPM, with variability primarily driven by particle load (Fig. A1).
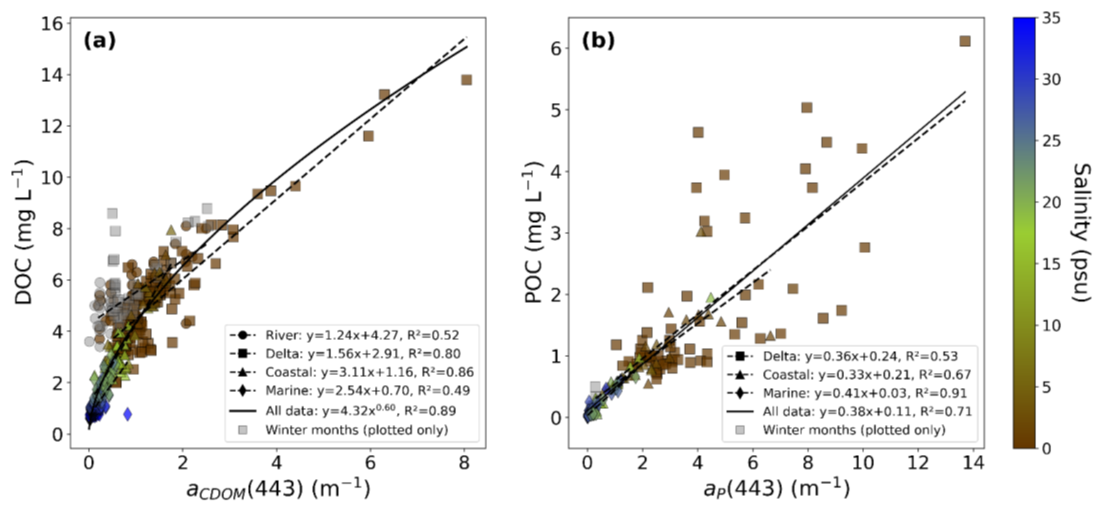
Figure 6Bio-optical relationships for measured in-situ (a) DOC and aCDOM(443) and (b) POC and aP(443) along the freshwater-marine salinity gradient during 2009–2024. The black solid line shows the regression of all samples (Massicotte et al., 2021; Lizotte et al., 2023; Bröder et al., 2022; ArcticGRO, 2024; this study; mackenzie-monitoring.awi.de) across all compartments. The dashed black lines show the relationship per compartment. Observations in grey are plotted but are not included in the statistical analysis.
4.1 Sediment and organic carbon processing across the land-ocean continuum
As riverine freshwater flow transits the interconnected network of distributary channels, it moves through the shallow coastal zone and eventually into the marine zone of the Beaufort Sea. Along this transition, spatial gradients in DOC, POC and SPM observed across compartments (Fig. 3), reflect active chemical and mechanical processing of OC and sediments during transport through the deltaic network and nearshore plume. These processes include flocculation, photochemical and microbial degradation, remineralization, and oxidation, which regulate the fate of terrigenous material during mixing with saline waters (Hernes and Benner, 2003; Vonk et al., 2015; Mann et al., 2016; Bertin et al., 2025; Clark et al., 2022).
While concentration gradients alone cannot uniquely distinguish dilution from biogeochemical processing, shifts in the specific ultraviolet absorbance (SUVA) and the slope ratio (SR) along the salinity gradient indicate changes in DOM composition and molecular character, consistent with progressive photochemical and microbial alteration during transport from river to marine waters (Fig. 7). While the observed shifts in SUVA and SR suggest that the compositional changes in DOM accompany the non-linear DOC-aCDOM(443) relationship, these patterns cannot fully disentangle conservative mixing from in-situ biogeochemical processing, as multiple factors, including overlapping seasonal mixing lines, influence the relationship. Similar spatial gradients in DOC, POC and SPM across riverine, deltaic and shelf environments have been documented for the Mackenzie system and other Arctic deltas, highlighting the role of distributary networks and shallow estuarine environments as active biogeochemical filters that modulate terrestrial carbon export prior to its delivery to the Arctic Ocean (Emmerton et al., 2008; Clark et al., 2022).
At the land-sea interface, where freshwater from the river and delta mixes with saline waters, our observations reveal abrupt shifts in DOC, POC, and SPM distributions, highlighting the mixing zone as a hotspot of material transformation (Figs. 3 and 4). The strong decline in particulate loads and concurrent reorganization of DOC patterns across the plume suggest enhanced aggregation, settling, and selective removal of terrigenous material during early stages of marine exposure. Mixing of riverine freshwater with higher-salinity coastal waters enhances ionic strength and promotes flocculation and aggregation of dissolved and colloidal organic matter, facilitating a transfer from dissolved to particulate organic carbon and enhancing particle settling. Such aggregation-driven phase shifts are well documented in estuarine mixing zones and contribute to the redistribution and removal of terrestrial organic matter within nearshore plume environments (Sholkovitz, 1976; Keil et al., 1997; Burd and Jackson, 2009; Clark et al., 2022).
While flocculation and aggregation are well-documented mechanisms driving DOC to POC conversion and the resulting abrupt concentrations changes in estuarine mixing zones, testing the POC DOC ratio vs. salinity revealed no clear indication of DOC to POC conversion (Fig. A2). Rather than an increase in the POC DOC ratio at low salinity conditions (5–10 psu) followed by a continual decrease at higher salinities, a slight increase at moderate salinity (15–20 psu) followed by a gradual decline into saline waters was observed. This pattern suggests that dilution is likely the dominant control with only localized or episodic deviations from flocculation and settling.
Concurrently, as turbidity decreases from the river channel mouth, increased light penetration allows sunlight (UV and visible light) to interact more readily with the surface water. This promotes a breakdown of particulate and dissolved OC via photochemical degradation, oxidation, and remineralization, likely reflected by the 28 % decrease in DOC as waters reach the coastal compartment and an additional 15 % decrease observed in the marine compartment. These estimates are comparable to those reported by Bertin et al. (2025), which suggested that flocculation may account for up to 45 % of DOC loss.
The shallow distributary channels of deltas are typically characterized as areas of sedimentation and deposition. Here, this is reflected by the 38 % decrease in SPM across the river to delta transition (Fig. 3). The much smaller decrease in POC (7 %) and DOC (7 %) across these two compartments highlights the preferential deposition and retention of mineral sediments relative to organic particulates. While some transformation of OC is likely occurring in the delta compartment, these patterns emphasize the dual role of the delta as both a site of retention and transformation. Despite DOC representing the dominant fraction of OC, particulate material exerted a strong influence on optical absorption (Fig. 5c–d), indicating that particle-driven processes shape the optical properties in near-delta environments. This reflects differences in specific absorption efficiency, as suspended mineral and detrital particles exhibit higher absorption and scattering cross-sections than dissolved organic matter (Doxaran et al., 2012). Processes such as primary production and in-situ POC generation via phytoplankton growth may also occur in deltaic waters, although are likely limited in these highly turbid waters due to reduced light penetration (Clark et al., 2022).
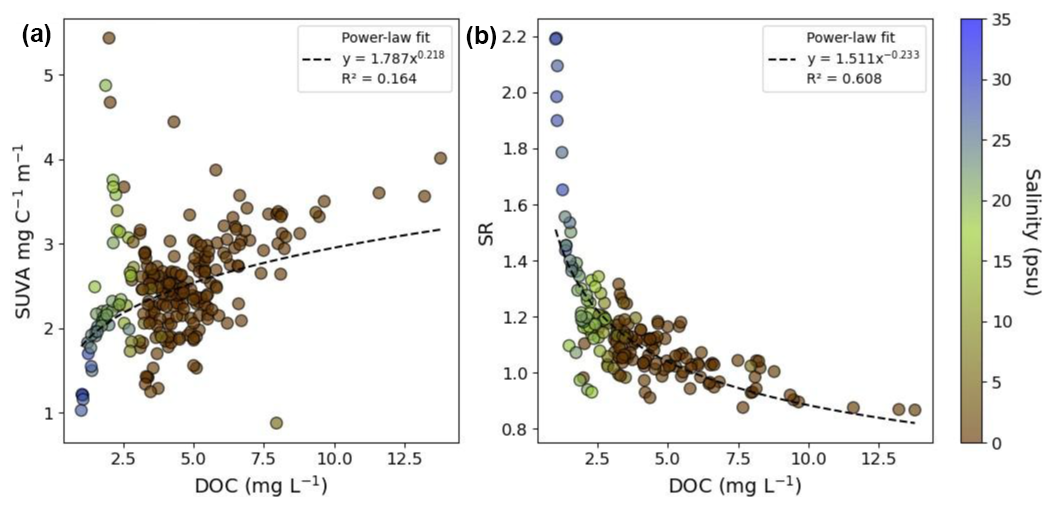
Figure 7Relationships between DOC and (a) Specific Ultraviolet Absorbance (SUVA) and (b) Slope Ratio of S275-295/S350-400. along the freshwater-marine salinity gradient during 2009–2024. The black dashed line shows the power law fit of all samples (Lizotte et al., 2023; Bröder et al., 2022; this study; https://mackenzie-monitoring.awi.de, last access: 20 May 2026) across all compartments.
Similar to the Yukon River Delta and Lena River Delta systems (Juhls et al., 2019; Clark et al., 2022), DOC concentrations in the Mackenzie River Delta exhibited a distinct spring freshet peak (Fig. 2), followed by moderately elevated levels that persisted through the ice-free season. This pattern suggests that snow and ice-melt driven inputs during breakup provide an initial DOC pulse, while continued mobilization from catchment soils and small tributaries sustains concentrations into summer. In contrast, POC and SPM showed more episodic variability, with significantly high freshet peaks followed by secondary peaks during mid-summer high-discharge events (Figs. 3c and e; A1a and c). These dynamics highlight the combined influence of seasonal hydrology and local deltaic processes, or catchment disturbance processes, such as permafrost thaw bank erosion and thermokarst lake dynamics (Douglas et al., 2023).
Previous studies from Arctic river-shelf systems have shown that temporally constrained river-plume transects can exhibit near-conservative mixing relationships between DOC, CDOM, and salinity (e.g., Grunert et al., 2021; Hölemann et al., 2021; Clark et al., 2022). However, due to the complex dynamics and biogeochemistry of the seasonal freshet, more intensive sampling during and between under-studied high flow conditions is needed to improve our understanding of OC composition and reactivity across the land-ocean scale (Burns et al., 2024).
When combining observations from multiple seasons, years, and spatial compartments, overlapping seasonal mixing trajectories may produce more diffuse or non-linear annual relationships. Figure 4a demonstrates the influence of the seasonal spring freshet on DOC conservative mixing, where observations collected during the May–June freshet result in a freshwater endmember of 6.61 mg L−1 compared to the year-round mean freshwater endmember (5.21 mg L−1). Similarly, aCDOM(443) illustrates a similar relationship along the salinity gradient (Fig. 4b), where measurements collected during the spring freshet shift the theoretical mixing lines, which is visible by the changing slopes (−0.06 m−1 psu−1 during the May–June freshet to −0.04 m−1 psu−1 including year-round observations).
Since processes such as degradation, flocculation, coastal erosion, sea-ice meltwater input, and seasonal variability in freshwater endmembers overlap spatially and temporally, it remains difficult to attribute deviations from conservative mixing to a single mechanism. We therefore interpret the observed patterns as reflecting a combination of conservative mixing and seasonally variable biogeochemical processing across the fluvial–marine continuum.
Salinity-DOC and salinity-aCDOM(443) relationships reveal a narrow zone of non-conservative behavior at low salinities (0–5 psu), where DOC concentrations decline more steeply than predicted by conservative mixing. This pattern is consistent with partial transformation or removal of chromophoric DOM during the initial freshwater-marine transition. At salinities above 5 psu, both DOC and aCDOM(443) decrease linearly with salinity indicating predominantly conservative transport through the inner plume, in agreement with Juhls et al. (2022) (Fig. 4a and c). The observed decline in aCDOM(443) from 3.2 to 1.8 m−1 within 0–5 psu likely reflects a combination of processes and compositional shifts in DOM.
Overall, these results indicate that most terrigenous DOC is transported conservatively through the inner plume, while a measurable fraction is altered or removed near the freshwater-marine interface. In contrast, POC and SPM both exhibited a strong decrease at low salinities, indicating distinct non-conservative behavior associated with particle settling (Fig. 4). The variation observed in particulate concentrations near 15 psu could be reflective of resuspension and redistribution processes that can occur during offshore transport.
These transformations can have implications for air-sea CO2 exchange. Terrestrial OC fluxes strongly influence CO2 exchange in coastal waters (Nielsen et al., 2022). Recent estimates suggest that OC inputs reduce the AO's net CO2 sink strength by 7 %–14 % (Nielsen et al., 2022) and may convert some shelves into net CO2 sources (Bertin et al., 2023). Our observations indicate non-conservative behavior and partial removal of DOC within the near-delta plume, deviating from a linear mixing line between freshwater and saline endmembers, suggesting that roughly 27 % of riverine DOC may be transformed or lost at low salinity coastal waters. Scaling this first-order estimate to the mean Mackenzie River DOC export (∼ 1.4 Tg C yr−1; Matsuoka et al., 2022) implies a potential removal of ∼ 0.38 Tg C yr−1 within the mixing zone. Assuming a fraction of 10 %–15 % of this removed DOC undergoes photochemical mineralization (Bertin et al., 2023), this corresponds to an estimated CO2 release of 0.04–0.06 Tg C yr−1. While approximate, these values underscore that DOC transformation in the low-salinity plume can represent a measurable contribution to coastal carbon outgassing.
The compartmental framework applied here provides a system-scale context for interpreting OC and sediment transport and retention across the Arctic land-ocean continuum (Fig. 8). The river, delta, coastal, and marine compartments reveal distinct regimes of organic carbon processing, reflected in the observed gradients in concentration, optical properties and bio-optical relationships (Figs. 3–6). By resolving these four distinct compartments across the entire salinity gradient, our results highlight how hydrodynamic sorting, mixing behaviors and optical regime shifts collectively shape OC dynamics in Arctic river-shelf environments. While similar patterns have been reported in other observations from Arctic river-shelf systems (Juhls et al., 2019, 2022; Clark et al., 2022), here they are resolved consistently across all major components of the fluvial–marine continuum.
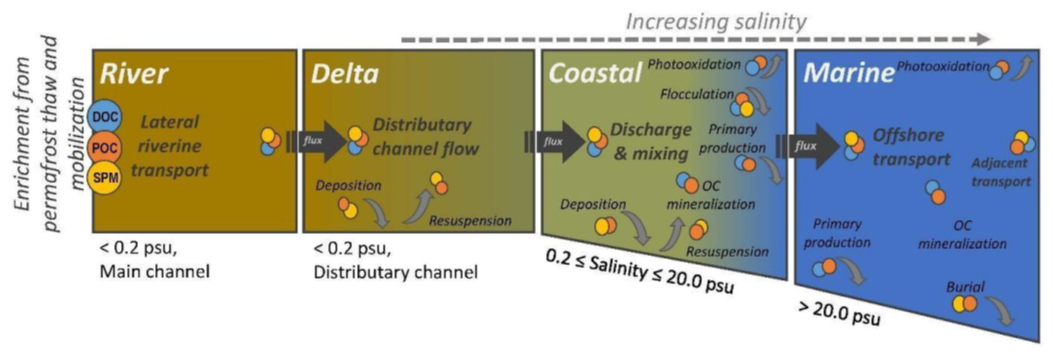
Figure 8Conceptual diagram demonstrates compartments along the fluvial-marine gradient in the Mackenzie River Delta–southern Beaufort Sea, delineated by salinity and channel size. Processes assumed to change concentrations of dissolved and particulate organic carbon and suspended particulate matter in the water column are indicated.
4.2 Bio-optical properties, OWT classification, and implications for remote sensing
To address uncertainties in satellite retrievals for optically complex Arctic coastal waters, we derived compartment-specific and cross-compartment bio-optical relationships spanning the full salinity gradient (Fig. 6). Within individual compartments, DOC-aCDOM(443) relationships were largely linear, whereas combining data across compartments resulted in a distinctly non-linear relationship. Similarly, POC-aP(443) relationships varied among compartments, reflecting differences in particle composition and optical regime along the continuum. These contrasts underscore that riverine, deltaic, coastal, and marine waters exhibit distinct optical and biogeochemical coupling, emphasizing the need for retrieval approaches that account 555 for spatial variability rather than relying on a single pan-arctic parameterization.
When examined across the full dataset, the non-linear DOC-aCDOM(443) relationship (Fig. 6a) reflects systematic changes in the composition and optical quality of DOM along the fluvial–marine continuum. In the deltaic and low-salinity coastal zones, mixing of terrestrially derived, highly absorbing DOM with less colored marine DOM reduces CDOM absorption relative to DOC concentrations, flattening the relationship. Photobleaching and microbial processing during offshore transport preferentially remove chromophoric components relative to the total DOC (Vonk et al., 2015). As a result, relationships that appear linear within individual compartments as reported in many studies (e.g., Mann et al., 2012; Walker et al., 2013; Novak et al., 2022) diverge non-linearly when considered across the full cross-compartment continuum, which integrates these compositional and optical shifts (Fig. 6a; black solid line).
Previous studies from Arctic river-shelf systems have shown that temporally constrained river–plume transects can exhibit near-conservative mixing relationships between DOC, CDOM, and salinity (e.g., Clark et al., 2022; Hölemann et al., 2021; Grunert et al., 2021). However, due to the complex dynamics and biogeochemistry of the seasonal freshet, more intensive sampling during and between under-studied high flow conditions is needed to improve our understanding of OC composition and reactivity across the land-ocean scale (Burns et al., 2024).
When combining observations from multiple seasons, years, and spatial compartments, overlapping seasonal mixing trajectories may produce more diffuse or non-linear annual relationships. Since processes such as degradation, flocculation, coastal erosion, sea-ice meltwater input, and seasonal variability in freshwater endmembers overlap spatially and temporally, it remains difficult to attribute deviations from conservative mixing to a single mechanism. We therefore interpret the observed patterns as reflecting a combination of conservative mixing and seasonally variable biogeochemical processing across the fluvial–marine continuum.
While compartment-specific bio-optical relationships have commonly been used for regional retrievals (Doxaran et al., 2015; Matsuoka et al., 2013, 2017), our analysis shows that such relationships may not be transferable across the full salinity gradient. The emergence of non-linear cross-compartment behavior and changing slopes of the relationships with adding compartments (Fig. 6) suggests that synoptic-scale remote sensing requires relationships derived across the entire continuum of optical conditions.
Seasonal contrasts between the ice-free period and the full annual dataset further refine these patterns. Cross-compartment relationships between DOC-aCDOM(443) strengthened during the ice-free season (filtering data to only July–October), with the coefficient of determination increasing to r2=0.92, whereas the POC-aP(443) relationship remained comparatively stable from r2=0.71 annually to r2=0.72 in the ice-free season (Fig. 6). Stronger coupling during the ice-free season likely reflects more consistent optical regimes, whereas winter freshwater samples add variability. Winter in-situ observations were largely limited to freshwater compartments, as sea-ice cover restricted access to coastal and marine compartments. The spring freshet (May–June) represents an important but under-sampled period in this seasonal cycle, when large pulses of freshwater transport elevated OC and sediment concentrations into the system.
Although overall seasonal differences in bio-optical relationships were modest, continued monitoring remains essential, as Arctic warming and hydrological intensification are expected to increase variability in the amount and composition of CDOM and suspended particulates (Bertin et al., 2025; Novak et al., 2022; Chalov et al., 2023).
Our observations confirm that optical properties in Arctic coastal waters are strongly controlled by both CDOM and suspended particles, with their relative importance varying among compartments (Fig. 5c–d). The enhanced absorption in blue wavelengths (400–500 nm) produces the characteristic brown–green coloration of deltaic and nearshore waters. In low-salinity deltaic waters, aP exceeded aCDOM by a factor of ∼ 1.5–2, indicating that mineral and detrital particles dominate light attenuation despite DOC representing the major fraction of OC. This reflects differences in mass-specific absorption and scattering efficiency. These shifts illustrate how optical–biogeochemical coupling evolves across the fluvial–marine continuum where particle-rich waters obscure CDOM signals and complicate retrievals of DOC from remote sensing. Photodegradation and compositional changes in CDOM further modulate these gradients (Ward et al., 2017; Grunert et al., 2021; Clark et al., 2022; Moran et al., 2022), underscoring the need for cross-compartment, or OWT-specific bio-optical algorithms (Fig. A3) in Arctic coastal and deltaic environments.
While bio-optical relationships refine the retrieval of DOC and POC, OWT classification provides an additional framework for interpreting optical variability and guiding algorithm selection in Arctic coastal waters. In our dataset, OWT distributions revealed a structured transition from OWT 6 dominance in river and delta compartments toward increased contributions of OWT 4a–4b in coastal waters and OWT 3a–2 in marine environments (Fig. 5f). Previous studies have associated higher-numbered OWT classes with stronger particulate and detrital scattering signatures, whereas lower-numbered classes typically reflect increasing contributions of phytoplankton and clearer water optical conditions (Bi and Hieronymi, 2024). The observed progression therefore suggests a shift from particle-rich delta waters toward optically clearer offshore regimes, consistent with the measured changes in aP and aCDOM along the fluvial–marine continuum.
Within the delta compartment, localized occurrences of OWT 4a and 4b likely reflect reduced hydrodynamic connectivity and enhanced particle settling in smaller distributary channels and floodplain environments. Such conditions may promote changes in the relative contributions of detrital material, phytoplankton biomass, and CDOM, resulting in optical regimes that differ from those of the main plume pathway. By linking reflectance-based OWT classes to dominant optical regimes, OWT classification provides a practical basis for selecting regime-specific retrieval approaches in ocean color remote sensing (OCRS) (Fig. A3). Incorporating OWT-dependent parameterizations may therefore reduce retrieval bias and improve estimates of carbon and sediment dynamics across optically complex river-sea systems (Hieronymi et al., 2026).
Together, the observed shifts in optical regimes (Fig. 5) and the emergence of non-linear cross-compartment bio-optical relationships (Fig. 6) demonstrate how land-sea connectivity controls both the biogeochemical and optical structure of Arctic coastal waters. With continued warming, enhanced runoff, permafrost thaw, and coastal erosion are likely to further intensify sediment and OC delivery, potentially amplifying variability in optical conditions across the fluvial-marine transition zone. Integrating spatially resolved in-situ observations with OWT-informed remote sensing approaches offers a pathway to capture these transitions at synoptic scales, improving the robustness of DOC, POC, and SPM retrievals in optically complex Arctic environments. These findings highlight that accurate monitoring of terrestrial matter transport on Arctic shelves requires frameworks that account for evolving optical regimes rather than relying on static regional calibrations.
Distribution and transformation of OC and suspended sediments across the Mackenzie River Delta-Beaufort Sea land–ocean interface is shaped by strong spatial transitions in hydrodynamic, biogeochemical, and optical water types. By using a compartmental framework applicable to other Arctic deltaic systems on a synthesized multi-year dataset (2009–2024), we show that DOC, POC, and SPM concentrations vary spatially and seasonally across river, delta, coastal, and marine compartments, reflecting distinct regimes of biogeochemical processing along the fluvial–marine continuum.
As water flows through the delta into the coastal waters and increases in salinity, DOC and POC drop and the ratio of DOC to POC increases. Across this fluvial–marine continuum, bio-optical relationships that appear linear within individual environments become non-linear when evaluated synoptically, reflecting shifts in DOM composition and particle regimes rather than measurement uncertainty. These findings indicate that remote sensing retrievals in Arctic coastal waters require calibrations spanning the full range of optical conditions. For this reason, optical water type classification provides a complement to classifying the fluvial-marine continuum, for interpreting these transitions and guiding algorithm selection in optically complex environments.
The framework applied here represents a necessary simplification of a highly heterogeneous Arctic river-sea system given still-limited in-situ observations. The strong spatial variability of particulate matter, especially, further indicates that point based sampling alone cannot fully resolve organic carbon distributions across deltaic and plume environments. Synoptic OCRS therefore offers a critical complementary perspective, capturing spatial gradients and evolving optical regimes that underpin cross-continuum carbon dynamics.
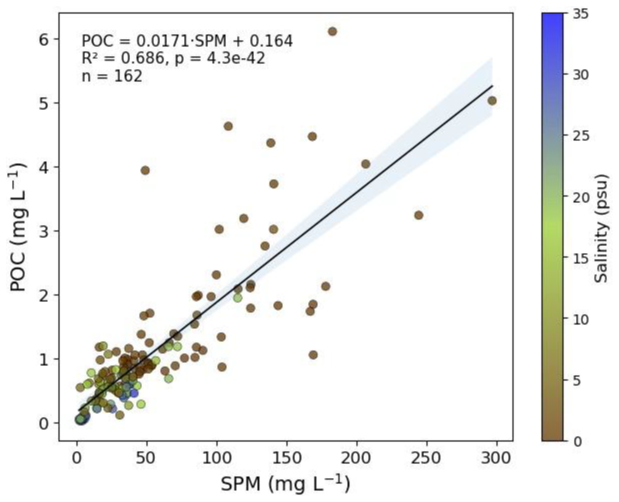
Figure A1Relationship between suspended particulate matter (SPM) and particulate organic carbon (POC). POC concentrations increase significantly with SPM, indicating a strong positive association between particle load and organic carbon content. Point color denotes salinity (psu). The solid line represents the linear regression, and the shaded band indicates the 95 % confidence interval.
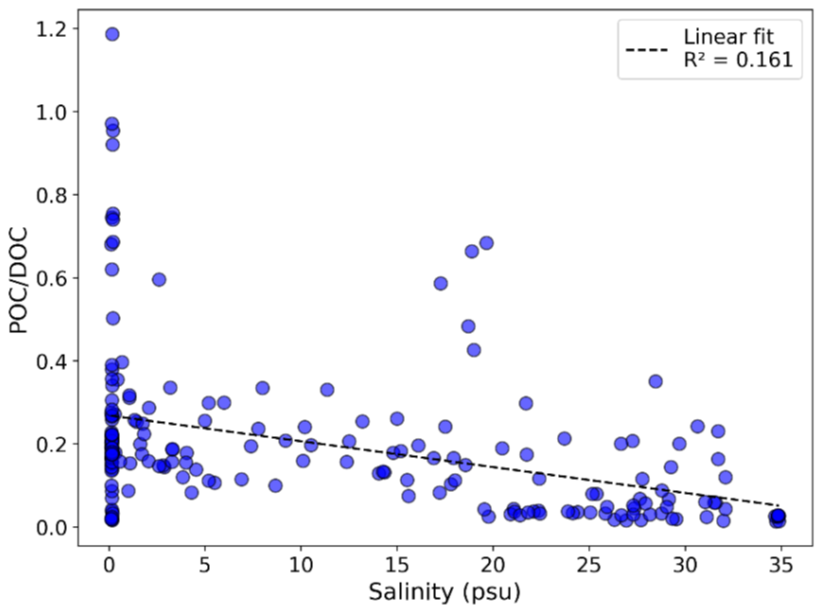
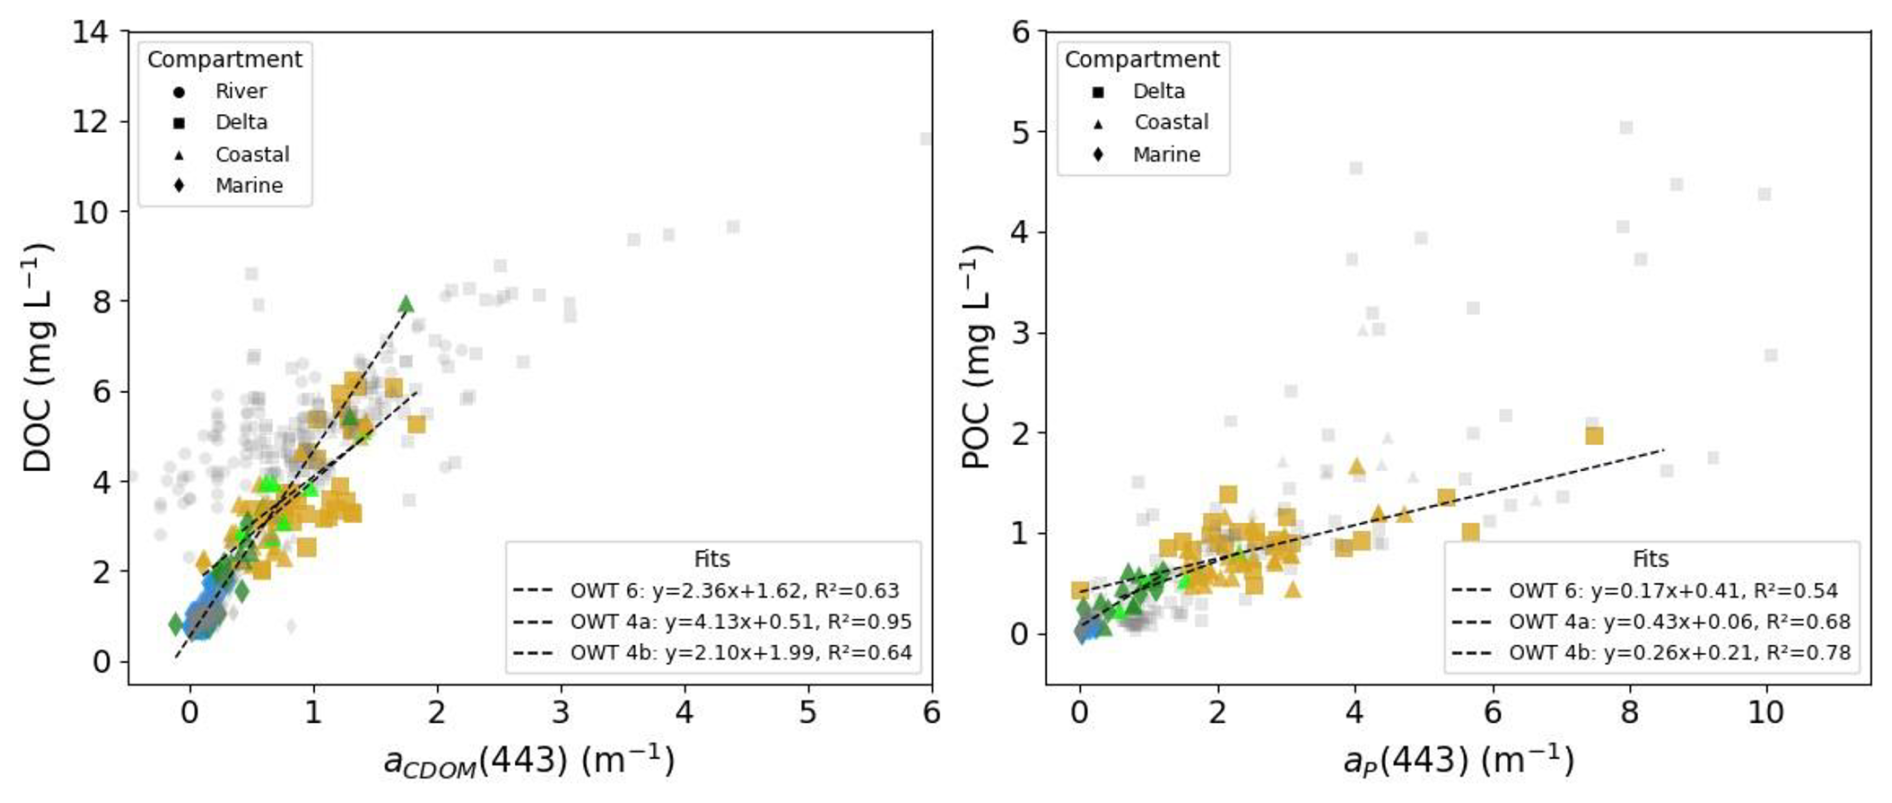
Figure A3Bio-optical relationships for measured in-situ DOC and aCDOM(443) and POC and aP(443) by OWT. The dashed black lines show the relationship for samples with dominant OWT maximum memberships (OWT 4a, 4b, 6). (OWT 6: DOC-aCDOM: n=72; POC-aP: n=57) (Massicotte et al., 2021; Lizotte et al., 2023; Bröder et al., 2022; this study, https://mackenzie-monitoring.awi.de/, last access: 20 May 2026).
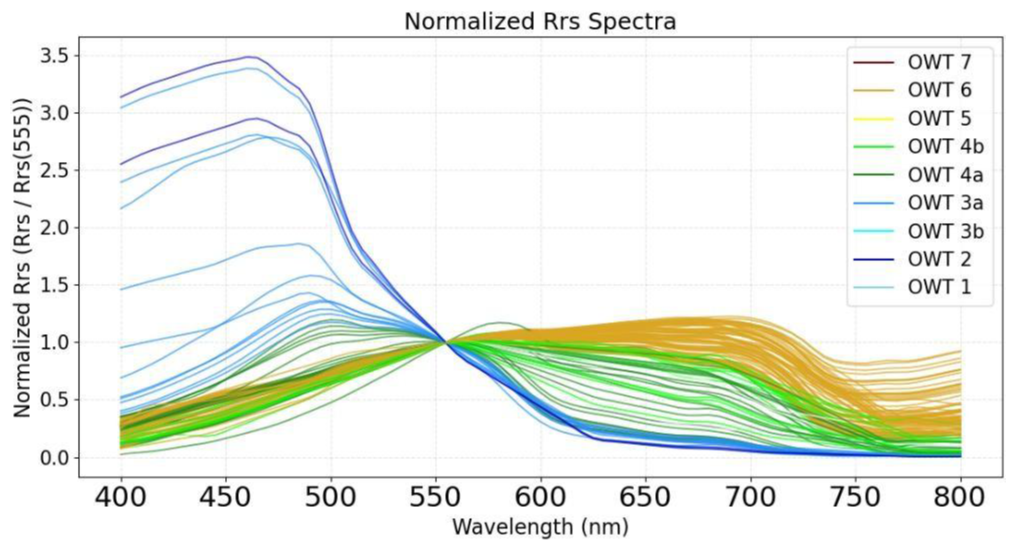
Figure A4In-situ remote sensing reflectance (Rrs) observations normalized to Rrs(555) nm from MALINA, Nunataryuk, PeCaBeau, and FLOCHAR sampling campaigns. This figure shows that the OWT classification applied in this study can distinguish Rrs spectra very well.
Data can be found at the links provided or by the corresponding author upon request. Nunataryuk (https://doi.org/10.1594/PANGAEA.937587, Juhls et al., 2021); PeCaBeau (https://doi.org/10.1594/PANGAEA.979687, Bröder et al., in review); Mackenzie River monitoring (https://doi.org/10.1594/PANGAEA.993858, Juhls et al., DOI registration in progress); and MALINA (https://doi.org/10.17882/75345, Massicotte et al., 2025).
BJ, PPO, planned the campaign; AM, BJ, MH, RR performed measurements; AM, BJ, MH, RR, JL, and LB analyzed the data; AM, BJ, PPO, RR, and MH wrote the manuscript draft; GG, JL, LB, AM, and IO reviewed and edited the manuscript.
The contact author has declared that none of the authors has any competing interests.
Publisher's note: Copernicus Publications remains neutral with regard to jurisdictional claims made in the text, published maps, institutional affiliations, or any other geographical representation in this paper. The authors bear the ultimate responsibility for providing appropriate place names. Views expressed in the text are those of the authors and do not necessarily reflect the views of the publisher.
We thank all participants of the expeditions and persons involved in the logistical support and measurements of the samples, including Atsushi Matsuoka, Felica Gehde, Antje Eulenberg, and Maddie Santos. This project was made possible through the tremendous support of the Aurora Research Institute (ARI), the hunters and trappers committees, the hamlet and town councils, the community corporations, as well as several members of the communities of Aklavik, Inuvik and Tuktoyaktuk.
This work was supported by the BNP Paribas Foundation Climate & Biodiversity Initiative (FLO CHAR project) and partially funded through Transnational Access of the H2020 project INTERACT (Grant Agreement No. 871120).
The article processing charges for this open-access publication were covered by the Alfred-Wegener-Institut Helmholtz-Zentrum für Polar- und Meeresforschung.
This paper was edited by Huixiang Xie and reviewed by Piotr Kowalczuk and one anonymous referee.
Arctic Great Rivers Observatory (ArcticGRO): ArcticGRO Absorbance Dataset, Version 20240402, ArcticGRO [data set], https://www.arcticgreatrivers.org/data (last access: 20 February 2026), 2024.
Arctic Great Rivers Observatory (ArcticGRO): ArcticGRO Discharge Dataset, Version 20251202, ArcticGRO [data set], https://www.arcticgreatrivers.org/data (last access: 16 April 2026), 2025a.
Arctic Great Rivers Observatory (ArcticGRO): ArcticGRO Water Quality Dataset, Version 20250402, ArcticGRO [data set], https://www.arcticgreatrivers.org/data (last access: 12 February 2026), 2025b.
Benner, R. and Strom, M.: A critical evaluation of the analytical blank associated with DOC measurements by high-temperature catalytic oxidation, Mar. Chem., 41, 153–160, 1993.
Bertin, C., Carroll, D., Menemenlis, D., Dutkiewicz, S., Zhang, H., Matsuoka, A., Tank, S., Manizza, M., Miller, C. E., Babin, M., Mangin, A., and Le Fouest, V.: Biogeochemical River Runoff Drives Intense Coastal Arctic Ocean CO2 Outgassing, Geophys. Res. Lett., 50, e2022GL102377, https://doi.org/10.1029/2022GL102377, 2023.
Bertin, C., Le Fouest, V., Carroll, D., Dutkiewicz, S., Menemenlis, D., Matsuoka, A., Manizza, M., and Miller, C. E.: Colored dissolved organic matter (CDOM) alters the seasonal physics and biogeochemistry of the Arctic Mackenzie River plume, Biogeosciences, 22, 6607–6629, https://doi.org/10.5194/bg-22-6607-2025, 2025.
Bi, S. and Hieronymi, M.: Holistic optical water type classification for ocean, coastal, and inland waters, Limnol. Oceanogr., 69, 1547–1561, https://doi.org/10.1002/lno.12606, 2024.
Biskaborn, B. K., Smith, S. L., Noetzli, J., Matthes, H., Vieira, G., Streletskiy, D. A., Schoeneich, P., Romanovsky, V. E., Lewkowicz, A. G., Abramov, A., Allard, M., Boike, J., Cable, W. L., Christiansen, H. H., Delaloye, R., Diekmann, B., Drozdov, D., Etzelmüller, B., Grosse, G., Guglielmin, M., Ingeman-Nielsen, T., Isaksen, K., Ishikawa, M., Johansson, M., Johannsson, H., Joo, A., Kaverin, D., Kholodov, A., Konstantinov, P., Kröger, T., Lambiel, C., Lanckman, J. P., Luo, D., Malkova, G., Meiklejohn, I., Moskalenko, N., Oliva, M., Phillips, M., Ramos, M., Sannel, A. B. K., Sergeev, D., Seybold, C., Skryabin, P., Vasiliev, A., Wu, Q., Yoshikawa, K., Zheleznyak, M., and Lantuit, H.: Permafrost is warming at a global scale, Nat. Commun., 10, 264, https://doi.org/10.1038/s41467-018-08240-4, 2019.
Bröder, L., O'Regan, M., Fritz, M., Juhls, B., Priest, T., Lattaud, J., Whalen, D., Matsuoka, A., Pellerin, A., Bossé-Demers, T., Rudbäck, D., Eulenburg, A., Carson, T., Rodriguez-Cuicas, M. E., Overduin, P., and Vonk, J. E.: The Permafrost Carbon in the Beaufort Sea (PeCaBeau) expedition of the research vessel CCGS Amundsen (AMD2104) in 2021, Berichte zur Polar- und Meeresforschung, 759, 120 pp., https://doi.org/10.48433/BzPM_0759_2022, 2022.
Brown, J., Ferrians, O., Heginbottom, J. A., and Melnikov, E.: Circum-Arctic map of permafrost and ground-ice conditions, Version 2, National Snow and Ice Data Center [data set], https://doi.org/10.7265/skbg-kf16, 2002.
Burd, A. B. and Jackson, G. A.: Particle aggregation, Ann. Rev. Mar. Sci., 1, 65–90, https://doi.org/10.1146/annurev.marine.010908.163904, 2009.
Burns, A. J., Spencer, R. G. M., Kellerman, A. M., Yan, G., Leonard, L., Kaiser, K., Mannino, A., Tzortziou, M., and Hernes, P. J.: The Distinct Composition and Transformation of Terrestrial Organic Carbon in the Yukon River Delta and Plume During the Mighty Spring Freshet, J. Geophys. Res.-Biogeo., 129, e2023JG007812, https://doi.org/10.1029/2023JG007812, 2024.
Chalov, S., Prokopeva, K., Magritsky, D., Grigoriev, V., Fingert, E., Habel, M., Juhls, B., Morgenstern, A., Overduin, P. P., and Kasimov, N.: Climate change impacts on streamflow, sediment load and carbon fluxes in the Lena River delta, Ecol. Indic., 157, 111252, https://doi.org/10.1016/j.ecolind.2023.111252, 2023.
Clark, J. B., Mannino, A., Tzortziou, M., Spencer, R. G. M., and Hernes, P.: The Transformation and Export of Organic Carbon Across an Arctic River-Delta-Ocean Continuum, J. Geophys. Res.-Biogeo., 127, e2022JG007139, https://doi.org/10.1029/2022JG007139, 2022.
Douglas, M. M., Miller, K. L., Schmeer, M. N., and Lamb, M. P.: Ablation-Limited Erosion Rates of Permafrost Riverbanks, J. Geophys. Res.-Earth, 128, e2023JF007098, https://doi.org/10.1029/2023JF007098, 2023.
Doxaran, D., Ehn, J., Bélanger, S., Matsuoka, A., Hooker, S., and Babin, M.: Optical characterisation of suspended particles in the Mackenzie River plume (Canadian Arctic Ocean) and implications for ocean colour remote sensing, Biogeosciences, 9, 3213–3229, https://doi.org/10.5194/bg-9-3213-2012, 2012.
Doxaran, D., Devred, E., and Babin, M.: A 50 % increase in the mass of terrestrial particles delivered by the Mackenzie River into the Beaufort Sea (Canadian Arctic Ocean) over the last 10 years, Biogeosciences, 12, 3551–3565, https://doi.org/10.5194/bg-12-3551-2015, 2015.
Eisma, D.: Flocculation and de-flocculation of suspended matter in estuaries, Neth. J. Sea Res., 20, 183–199, https://doi.org/10.1016/0077-7579(86)90041-4, 1986.
Elshamy, M., Pomeroy, J. W., Pietroniro, A., Wheater, H., Abdelhamed, M., and Davison, B.: Land surface hydrological modelling of the Mackenzie River Basin: Parametrization to simulate streamflow and permafrost dynamics, J. Hydrol. (Amst)., 659, 133134, https://doi.org/10.1016/j.jhydrol.2025.133134, 2025.
Emmerton, C. A., Lesack, L. F. W., and Vincent, W. F.: Mackenzie River nutrient delivery to the Arctic Ocean and effects of the Mackenzie Delta during open water conditions, Global Biogeochem. Cy., 22, https://doi.org/10.1029/2006GB002856, 2008.
Gonçalves-Araujo, R., Stedmon, C. A., Heim, B., Dubinenkov, I., Kraberg, A., Moiseev, D., and Bracher, A.: From fresh to marine waters: characterization and fate of dissolved organic matter in the Lena River Delta region, Siberia, Front. Mar. Sci., 2, 108, https://doi.org/10.3389/fmars.2015.00108, 2015.
Grunert, B. K., Tzortziou, M., Neale, P., Menendez, A., and Hernes, P.: DOM degradation by light and microbes along the Yukon River-coastal ocean continuum, Scientific Reports, 11, 10236, https://doi.org/10.1038/s41598-021-89327-9, 2021.
Hernes, P. J. and Benner, R.: Photochemical and microbial degradation of dissolved lignin phenols: Implications for the fate of terrigenous dissolved organic matter in marine environments, J. Geophys. Res.-Oceans, 108, https://doi.org/10.1029/2002jc001421, 2003.
Hieronymi, M., Behr, D., Bi, S., and Röttgers, R.: Optical complexity of North Sea, Baltic Sea, and adjacent coastal and inland waters derived from Sentinel-3 OLCI satellite data, Earth Syst. Sci. Data, 18, 1307–1329, https://doi.org/10.5194/essd-18-1307-2026, 2026.
Hölemann, J. A., Juhls, B., Bauch, D., Janout, M., Koch, B. P., and Heim, B.: The impact of the freeze–melt cycle of land-fast ice on the distribution of dissolved organic matter in the Laptev and East Siberian seas (Siberian Arctic), Biogeosciences, 18, 3637–3655, https://doi.org/10.5194/bg-18-3637-2021, 2021.
Holmes, R. M., Mcclelland, J. W., Peterson, B. J., Tank, S. E., Bulygina, E., Eglinton, T. I., Gordeev, V. V, Gurtovaya, T. Y., Raymond, P. A., Repeta, D. J., Staples, R., Striegl, R. G., Zhulidov, A. V, Zimov, S. A., Holmes, R. M., Bulygina, E., Mcclelland, J. W., Peterson, B. J., Tank, S. E., Gordeev, V. V, Shirshov, P. P., Gurtovaya, T. Y., Zhulidov, A. V, Raymond, P. A., Repeta, D. J., Staples, R., Striegl, R. G., and Zimov, S. A.: Seasonal and Annual Fluxes of Nutrients and Organic Matter from Large Rivers to the Arctic Ocean and Surrounding Seas, Estuar. Coast., 35, 369–382, https://doi.org/10.1007/s12237-011-9386-6, 2012.
Irrgang, A. M., Bendixen, M., Farquharson, L. M., Baranskaya, A. V., Erikson, L. H., Gibbs, A. E., Ogorodov, S. A., Overduin, P. P., Lantuit, H., Grigoriev, M. N., and Jones, B. M.: Drivers, dynamics and impacts of changing Arctic coasts, Nature Reviews Earth & Environment, 3, 39–54, https://doi.org/10.1038/s43017-021-00232-1, 2022.
Juhls, B., Overduin, P. P., Hölemann, J., Hieronymi, M., Matsuoka, A., Heim, B., and Fischer, J.: Dissolved organic matter at the fluvial–marine transition in the Laptev Sea using in situ data and ocean colour remote sensing, Biogeosciences, 16, 2693–2713, https://doi.org/10.5194/bg-16-2693-2019, 2019.
Juhls, B., Lizotte, M., Matsuoka, A., Mével, G., Bécu, G., Overduin, P. P., Devred, E., Doxaran, D., Ferland, J., Forget, M.-H., Hilborn, A., Leymarie, E., Maury, J., Oziel, L., Tisserand, L., Miles, D., Anikina, D. O. J., Guilmette, C., Béguin, M., Couture, R.-M., Bossé-Demers, T., Laberge-Carignan, A., Chaillou, G., Bélanger, S., Bruyant, F., and Babin, M.: Hydrographical, biogeochemical and biooptical water properties in the Mackenzie Delta Region during 4 expeditions from spring to fall in 2019, PANGAEA [data set], https://doi.org/10.1594/PANGAEA.937587, 2021.
Juhls, B., Matsuoka, A., Lizotte, M., Bécu, G., Overduin, P. P., El Kassar, J., Devred, E., Doxaran, D., Ferland, J., Forget, M. H., Hilborn, A., Hieronymi, M., Leymarie, E., Maury, J., Oziel, L., Tisserand, L., Anikina, D. O. J., Dillon, M., and Babin, M.: Seasonal dynamics of dissolved organic matter in the Mackenzie Delta, Canadian Arctic waters: Implications for ocean colour remote sensing, Remote Sens. Environ., 283, 113327, https://doi.org/10.1016/j.rse.2022.113327, 2022.
Keil, R. G., Mayer, L. M., Quay, P. D., Richey, J. E., and Hedges, J. I.: Loss of organic matter from riverine particles in deltas, Geochim. Cosmochim. Ac., 61, 1507–1511, https://doi.org/10.1016/S0016-7037(97)00044-6, 1997.
Lattaud, J., Aichner, B., Gierga, M., Stolz, A., Meȩtrak, M., Wilk, M., Suska-Malawska, M., Mischke, S., Sachse, Di., Rajabov, I., Rajabov, N., and Rethemeyer, J.: Biomarker 14C evidence for sources and recycling of pre-aged organic carbon in Arctic permafrost regions, Geochim. Cosmochim. Ac., 393, 75–85, https://doi.org/10.1017/RDC.2021.78, 2025.
Lizotte, M., Juhls, B., Matsuoka, A., Massicotte, P., Mével, G., Anikina, D. O. J., Antonova, S., Bécu, G., Béguin, M., Bélanger, S., Bossé-Demers, T., Bröder, L., Bruyant, F., Chaillou, G., Comte, J., Couture, R.-M., Devred, E., Deslongchamps, G., Dezutter, T., Dillon, M., Doxaran, D., Flamand, A., Fell, F., Ferland, J., Forget, M.-H., Fritz, M., Gordon, T. J., Guilmette, C., Hilborn, A., Hussherr, R., Irish, C., Joux, F., Kipp, L., Laberge-Carignan, A., Lantuit, H., Leymarie, E., Mannino, A., Maury, J., Overduin, P., Oziel, L., Stedmon, C., Thomas, C., Tisserand, L., Tremblay, J.-É., Vonk, J., Whalen, D., and Babin, M.: Nunataryuk field campaigns: understanding the origin and fate of terrestrial organic matter in the coastal waters of the Mackenzie Delta region, Earth Syst. Sci. Data, 15, 1617–1653, https://doi.org/10.5194/essd-15-1617-2023, 2023.
Lynch, L. M., Machmuller, M. B., Boot, C. M., Covino, T. P., Rithner, C. D., Cotrufo, M. F., Hoyt, D. W., and Wallenstein, M. D.: Dissolved Organic Matter Chemistry and Transport Along an Arctic Tundra Hillslope, Global Biogeochem. Cy., 33, 47–62, https://doi.org/10.1029/2018GB006030, 2019.
Mann, P. J., Davydova, A., Zimov, N., Spencer, R. G. M., Davydov, S., Bulygina, E., Zimov, S., and Holmes, R. M.: Controls on the composition and lability of dissolved organic matter in Siberia's Kolyma River basin, J. Geophys. Res.-Biogeo., 117, https://doi.org/10.1029/2011JG001798, 2012.
Mann, P. J., Spencer, R. G. M., Hernes, P. J., Six, J., Aiken, G. R., Tank, S. E., McClelland, J. W., Butler, K. D., Dyda, R. Y., and Holmes, R. M.: Pan-arctic trends in terrestrial dissolved organic matter from optical measurements, Front. Earth Sci. (Lausanne)., 4, 171139, https://doi.org/10.3389/feart.2016.00025, 2016.
Massicotte, P., Amon, R. M. W., Antoine, D., Archambault, P., Balzano, S., Bélanger, S., Benner, R., Boeuf, D., Bricaud, A., Bruyant, F., Chaillou, G., Chami, M., Charrière, B., Chen, J., Claustre, H., Coupel, P., Delsaut, N., Doxaran, D., Ehn, J., Fichot, C., Forget, M.-H., Fu, P., Gagnon, J., Garcia, N., Gasser, B., Ghiglione, J.-F., Gorsky, G., Gosselin, M., Gourvil, P., Gratton, Y., Guillot, P., Heipieper, H. J., Heussner, S., Hooker, S. B., Huot, Y., Jeanthon, C., Jeffrey, W., Joux, F., Kawamura, K., Lansard, B., Leymarie, E., Link, H., Lovejoy, C., Marec, C., Marie, D., Martin, J., Martín, J., Massé, G., Matsuoka, A., McKague, V., Mignot, A., Miller, W. L., Miquel, J.-C., Mucci, A., Ono, K., Ortega-Retuerta, E., Panagiotopoulos, C., Papakyriakou, T., Picheral, M., Prieur, L., Raimbault, P., Ras, J., Reynolds, R. A., Rochon, A., Rontani, J.-F., Schmechtig, C., Schmidt, S., Sempéré, R., Shen, Y., Song, G., Stramski, D., Tachibana, E., Thirouard, A., Tolosa, I., Tremblay, J.-É., Vaïtilingom, M., Vaulot, D., Vaultier, F., Volkman, J. K., Xie, H., Zheng, G., and Babin, M.: The MALINA oceanographic expedition: how do changes in ice cover, permafrost and UV radiation impact biodiversity and biogeochemical fluxes in the Arctic Ocean?, Earth Syst. Sci. Data, 13, 1561–1592, https://doi.org/10.5194/essd-13-1561-2021, 2021.
Massicotte, P., Amon, R. M. W., Antoine, D., Archambault, P., Balzano, S., Bélanger, S., Benner, R., Boeuf, D., Bricaud, A., Bruyant, F., Chaillou, G., Chami, M., Charrière, B., Chen, J., Claustre, H., Coupel, P., Delsaut, N., Doxaran, D., Ehn, J., Fichot, C., Forget, M.-H., Fu, P., Gagnon, J., Garcia, N., Gasser, B., Ghiglione, J.-F., Gorsky, G., Gosselin, M., Gourvil, P., Gratton, Y., Guillot, P., Heipieper, H. J., Heussner, S., Hooker, S. B., Huot, Y., Jeanthon, C., Jeffrey, W., Joux, F., Kawamura, K., Lansard, B., Leymarie, E., Link, H., Lovejoy, C., Marec, C., Marie, D., Martin, J., Martín, J., Massé, G., Matsuoka, A., McKague, V., Mignot, A., Miller, W. L., Miquel, J.-C., Mucci, A., Ono, K., Ortega-Retuerta, E., Panagiotopoulos, C., Papakyriakou, T., Picheral, M., Piepenburg, D., Prieur, L., Raimbault, P., Ras, J., Reynolds, R. A., Rochon, A., Rontani, J.-F., Schmechtig, C., Schmidt, S., Sempéré, R., Shen, Y., Song, G., Stramski, D., Tachibana, E., Thirouard, A., Tolosa, I., Tremblay, J.-É., Vaïtilingom, M., Vaulot, D., Vaultier, F., Volkman, J. K., Vonk, J. E., Xie, H., Zheng, G., and Babin, M.: The Malina oceanographic expedition: How do changes in ice cover, permafrost and UV radiation impact biodiversity and biogeochemical fluxes in the Arctic Ocean?, SEANOE [data set], https://doi.org/10.17882/75345, 2025.
Matsuoka, A., Bricaud, A., Benner, R., Para, J., Sempéré, R., Prieur, L., Bélanger, S., and Babin, M.: Tracing the transport of colored dissolved organic matter in water masses of the Southern Beaufort Sea: relationship with hydrographic characteristics, Biogeosciences, 9, 925–940, https://doi.org/10.5194/bg-9-925-2012, 2012.
Matsuoka, A., Hooker, S. B., Bricaud, A., Gentili, B., and Babin, M.: Estimating absorption coefficients of colored dissolved organic matter (CDOM) using a semi-analytical algorithm for southern Beaufort Sea waters: application to deriving concentrations of dissolved organic carbon from space, Biogeosciences, 10, 917–927, https://doi.org/10.5194/bg-10-917-2013, 2013.
Matsuoka, A., Boss, E., Babin, M., Karp-Boss, L., Hafez, M., Chekalyuk, A., Proctor, C. W., Werdell, P. J., and Bricaud, A.: Pan-Arctic optical characteristics of colored dissolved organic matter: Tracing dissolved organic carbon in changing Arctic waters using satellite ocean color data, Remote Sens. Environ., 200, 89–101, https://doi.org/10.1016/j.rse.2017.08.009, 2017.
Matsuoka, A., Babin, M., and Vonk, J. E.: Decadal trends in the release of terrigenous organic carbon to the Mackenzie Delta (Canadian Arctic) using satellite ocean color data (1998–2019), Remote Sens. Environ., 283, 113322, https://doi.org/10.1016/j.rse.2022.113322, 2022.
McClelland, J. W., Holmes, R. M., Peterson, B. J., Raymond, P. A., Striegl, R. G., Zhulidov, A. V., Zimov, S. A., Zimov, N., Tank, S. E., Spencer, R. G. M., Staples, R., Gurtovaya, T. Y., and Griffin, C. G.: Particulate organic carbon and nitrogen export from major Arctic rivers, Global Biogeochem. Cy., 30, 629–643, https://doi.org/10.1002/2015GB005351, 2016.
Moran, M. A., Ferrer-González, F. X., Fu, H., Nowinski, B., Olofsson, M., Powers, M. A., Schreier, J. E., Schroer, W. F., Smith, C. B., and Uchimiya, M.: The Ocean's labile DOC supply chain, Limnol. Oceanogr., 67, 1007–1021, https://doi.org/10.1002/lno.12053, 2022.
Morgenstern, A. and Gottschalk, M.: Expedition CA-Land_2023_Inuvik (DUCCEM 2023), in: Arctic Land Expeditions in Permafrost Research in 2023, edited by: Bornemann, H., Berichte zur Polar- und Meeresforschung, 797, 6–13, https://doi.org/10.57738/BzPM_0797_2025, 2025.
Nielsen, D. M., Pieper, P., Barkhordarian, A., Overduin, P., Ilyina, T., Brovkin, V., Baehr, J., and Dobrynin, M.: Increase in Arctic coastal erosion and its sensitivity to warming in the twenty-first century, Nat. Clim. Change, 12, 263– 270, https://doi.org/10.1038/s41558-022-01281-0, 2022.
Novak, M. G., Mannino, A., Clark, J. B., Hernes, P., Tzortziou, M., Spencer, R. G. M., Kellerman, A. M., and Grunert, B.: Arctic biogeochemical and optical properties of dissolved organic matter across river to sea gradients, Front. Mar. Sci., 9, 949034, https://doi.org/10.3389/fmars.2022.949034, 2022.
Ogneva, O., Mollenhauer, G., Juhls, B., Sanders, T., Palmtag, J., Fuchs, M., Grotheer, H., Mann, P. J., and Strauss, J.: Particulate organic matter in the Lena River and its delta: from the permafrost catchment to the Arctic Ocean , Biogeosciences, 20, 1423–1441, https://doi.org/10.5194/bg-20-1423-2023, 2023.
Oziel, L., Gürses, Ö., Torres-Valdés, S., Hoppe, C. J. M., Rost, B., Karakuş, O., Danek, C., Koch, B. P., Nissen, C., Koldunov, N., Wang, Q., Völker, C., Iversen, M., Juhls, B., and Hauck, J.: Climate change and terrigenous inputs decrease the efficiency of the future Arctic Ocean's biological carbon pump, Nat. Clim. Change, 15, 171–179, https://doi.org/10.1038/s41558-024-02233-6, 2025.
Pegau, W. S., Gray, D., and Zaneveld, J. R. V.: Absorption and attenuation of visible and near-infrared light in water: dependence on temperature and salinity, Appl. Optics, 36, 6035, https://doi.org/10.1364/ao.36.006035, 1997.
Peterson, B. J., Holmes, R. M., McClelland, J. W., Vörösmarty, C. J., Lammers, R. B., Shiklomanov, A. I., Shiklomanov, I. A., and Rahmstorf, S.: Increasing river discharge to the Arctic Ocean, Science, 298, 2171–2173, https://doi.org/10.1126/science.1077445, 2002.
Pugach, S. P., Pipko, I. I., Shakhova, N. E., Shirshin, E. A., Perminova, I. V., Gustafsson, Ö., Bondur, V. G., Ruban, A. S., and Semiletov, I. P.: Dissolved organic matter and its optical characteristics in the Laptev and East Siberian seas: spatial distribution and interannual variability (2003–2011), Ocean Sci., 14, 87–103, https://doi.org/10.5194/os-14-87-2018, 2018.
Rantanen, M., Karpechko, A. Y., Lipponen, A., Nordling, K., Hyvärinen, O., Ruosteenoja, K., Vihma, T., and Laaksonen, A.: The Arctic has warmed nearly four times faster than the globe since 1979, Communications Earth & Environment, 3, 168, https://doi.org/10.1038/s43247-022-00498-3, 2022.
Rapaić, M., Brown, R., Markovic, M., and Chaumont, D.: An Evaluation of Temperature and Precipitation Surface-Based and Reanalysis Datasets for the Canadian Arctic, Atmos. Ocean, 53, 283–303, https://doi.org/10.1080/07055900.2015.1045825, 2015.
Röttgers, R. and Doerffer, R.: Measurements of optical absorption by chromophoric dissolved organic matter using a point source integrating-cavity absorption meter, Limnol. Oceanogr.-Meth., 5, 126–135, https://doi.org/10.4319/lom.2007.5.126, 2007.
Röttgers, R., McKee, D., and Utschig, C.: Temperature and salinity correction coefficients for light absorption by water in the visible to infrared spectral region, Opt. Express, 22, 25093–25108, https://doi.org/10.1364/oe.22.025093, 2014.
Röttgers, R., Doxaran, D., and Dupouy, C.: Quantitative filter technique measurements of spectral light absorption by aquatic particles using a portable integrating cavity absorption meter (QFT-ICAM), Opt. Express, 24, A1, https://doi.org/10.1364/oe.24.0000a1, 2015.
Schuur, E. A. G., McGuire, A. D., Schädel, C., Grosse, G., Harden, J. W., Hayes, D. J., Hugelius, G., Koven, C. D., Kuhry, P., Lawrence, D. M., Natali, S. M., Olefeldt, D., Romanovsky, V. E., Schaefer, K., Turetsky, M. R., Treat, C. C., and Vonk, J. E.: Climate change and the permafrost carbon feedback, Nature, 520, 171–179, https://doi.org/10.1038/nature14338, 2015.
Sholkovitz, E. R.: Flocculation of dissolved organic and inorganic matter during the mixing of river water and seawater, Geochim. Cosmochim. Ac., 40, 831–845, https://doi.org/10.1016/0016-7037(76)90035-1, 1976.
Sullivan, J. M., Twardowski, M. S., Zaneveld, J. R. V., Moore, C. M., Barnard, A. H., Donaghay, P. L., and Rhoades, B.: Hyperspectral temperature and salt dependencies of absorption by water and heavy water in the 400–750 nm spectral range, Appl. Optics, 45, 5294–5309, https://doi.org/10.1364/AO.45.005294, 2006.
Tank, S. E., Striegl, R. G., McClelland, J. W., and Kokelj, S. V.: Multi-decadal increases in dissolved organic carbon and alkalinity flux from the Mackenzie drainage basin to the Arctic Ocean, Environ. Res. Lett., 11, 054015, https://doi.org/10.1088/1748-9326/11/5/054015, 2016.
Tarasenko, A., Doxaran, D., and Gentili, B.: Variations of suspended particulate matter concentrations of the Mackenzie River plume (Beaufort Sea, Arctic Ocean) over the last two decades, Mar. Pollut. Bull., 196, 115619, https://doi.org/10.1016/j.marpolbul.2023.115619, 2023.
Tassan, S. and Ferrari, G. M.: Proposal for the measurement of backward and total scattering by mineral particles suspended in water, Appl. Optics, 34, 8345, https://doi.org/10.1364/ao.34.008345, 1995.
Tassan, S. and Ferrari, G. M.: A sensitivity analysis of the “Transmittance – Reflectance” method for measuring light absorption by aquatic particles, J. Plankton Res., 24, 757–774, https://doi.org/10.1093/plankt/24.8.757, 2002.
Venice System: The Venice system for the classification of marine waters according to salinity, Limnol. Oceanogr., 3, 346–347, https://doi.org/10.4319/lo.1958.3.3.0346, 1958.
Vonk, J. E., Tank, S. E., Bowden, W. B., Laurion, I., Vincent, W. F., Alekseychik, P., Amyot, M., Billet, M. F., Canário, J., Cory, R. M., Deshpande, B. N., Helbig, M., Jammet, M., Karlsson, J., Larouche, J., MacMillan, G., Rautio, M., Walter Anthony, K. M., and Wickland, K. P.: Reviews and syntheses: Effects of permafrost thaw on Arctic aquatic ecosystems, Biogeosciences, 12, 7129–7167, https://doi.org/10.5194/bg-12-7129-2015, 2015.
Vonk, J. E., Tank, S. E., and Walvoord, M. A.: Integrating hydrology and biogeochemistry across frozen landscapes, Nat. Commun., 10, 5377, https://doi.org/10.1038/s41467-019-13361-5, 2019.
Walker, S. A., Amon, R. M. W., and Stedmon, C. A.: Variations in high-latitude riverine fluorescent dissolved organic matter: A comparison of large Arctic rivers, J. Geophys. Res.-Biogeo., 118, 1689–1702, https://doi.org/10.1002/2013JG002320, 2013.
Ward, C. P., Nalven, S. G., Crump, B. C., Kling, G. W., and Cory, R. M.: Photochemical alteration of organic carbon draining permafrost soils shifts microbial metabolic pathways and stimulates respiration, Nat. Commun., 8, 772, https://doi.org/10.1038/s41467-017-00759-2, 2017.
Woo, M.-K. and Thorne, R.: Streamflow in the Mackenzie Basin, Canada, Arctic, 56, 328–340, https://doi.org/10.14430/arctic630, 2003.
Xi, H., Larouche, P., Tang, S., and Michel, C.: Seasonal variability of light absorption properties and water optical constituents in Hudson Bay, Canada, J. Geophys. Res.-Oceans, 118, 3087–3102, https://doi.org/10.1002/jgrc.20237, 2013.
Zhang, R., Wang, H., Fu, Q., Rasch, P. J., Wu, M., and Maslowski, W.: Understanding the Cold Season Arctic Surface Warming Trend in Recent Decades, Geophys. Res. Lett., 48, e2021GL094878, https://doi.org/10.1029/2021GL094878, 2021.