
the Creative Commons Attribution 4.0 License.
the Creative Commons Attribution 4.0 License.
 | 03 Sep 2026
Ecosystem respiration during snowmelt and soil thaw leads to a rare annual CO2 net loss in a boreal fen
Karoliina Särkelä

Timo Vesala
Torben R. Christensen
Juval Cohen
Angelika Kübert
Xuefei Li
Hannu Marttila
Jouni Pulliainen
Eeva-Stiina Tuittila
Efrén López-Blanco
Although boreal peatlands play a critical role in the global carbon cycle, their year-round carbon dioxide (CO2) dynamics, and particularly the contribution of the non-growing season, remain poorly constrained in annual balance estimates. Using 17 years (2005–2021) of eddy covariance measurements from a fen in southern Finland, we first quantified the magnitude, timing, and interannual variability of CO2 fluxes. We then examined in greater detail the non-growing season, specifically the non-productive season defined by the net productivity of the system. We assessed the flux drivers during different periods of the year, with particular emphasis on soil temperature dynamics and the role of thermal legacy effects. On average, the non-productive season accounted for 60 % of the year (226 ± 27 d), ranging from mid-September to late April, and offset 57 % (±33 %) of the subsequent productive season's CO2 uptake. Emissions declined from autumn to spring, with the highest carbon emissions occurring across September–December and the lowest in January–February. Soil temperature, both concurrent and lagged up to four months, was the main control of CO2 fluxes during November–December and spring thaw, while photosynthetically active radiation (PAR) dominated during the onset of the non-productive season. Variability in annual CO2 balances was large, and in two years (2016 and 2018) the fen switched from a net CO2 sink to a source. Finally, we focused on 2016 in detail: an exceptional six-week CO2 release during April–May released 84 g C m−2, offsetting 38 % of the following productive season's CO2 uptake. This event was linked to unusually warm late-autumn soils, minimal snow insulation, and subsequent rapid surface freezing, which likely enhanced CO2 accumulation and stimulated CO2 release during thaw. Our results demonstrate that short-lived but intense events during the non-productive season can determine the annual peatland CO2 balance and therefore significantly affect the annual carbon budget of boreal peatlands.
- Article
(1710 KB) - Full-text XML
-
Supplement
(1649 KB) - BibTeX
- EndNote


Boreal and sub-Arctic peatlands store between 400 Gt (Gorham, 1991; Yu et al., 2011) and 1000 Gt of carbon (Nichols and Peteet, 2019), contributing up to 30 % of the global soil carbon pool (Friedlingstein et al., 2022). These ecosystems have had a net cooling effect on the atmosphere over the past millennia, as carbon uptake by plants has outweighed losses from heterotrophic respiration (Hugelius et al., 2020). However, global warming – especially at high latitudes, where temperatures are rising three to four times faster than the global average (AMAP, 2021; Rantanen et al., 2022) – may alter the balance between carbon sequestration and loss in boreal and sub-Arctic regions. Elevated temperatures have already intensified carbon cycling by enhancing both productivity and respiration in these ecosystems (See et al., 2024).
Carbon dynamics outside the growing season, i.e., late autumn, winter, and early spring, play a critical yet understudied role in shaping the annual carbon balance of boreal peatlands. These non-growing season periods have become increasingly important as warming trends intensify during the coldest months (Rantanen et al., 2023). While fluxes are typically low in mid-winter, cumulative emissions can offset a significant proportion of growing season uptake, with up to three-quarters of summer sequestration negated in some years based on in situ measurements in the boreal–Arctic zone (Arndt et al., 2023; Virkkala et al., 2022). These emissions are expected to increase even further in the future (Natali et al., 2019), linked with decreasing snow depth and snow cover duration (Pongracz et al., 2024).
Carry-over effects from previous seasons can strongly influence CO2 fluxes during the non-growing season. For example, high microbial activity during warm summer and autumn can lead to gas build-up in the soil, which is then subsequently released during soil freeze-up or thaw (Raz-Yaseef et al., 2017; Sullivan et al., 2012). Pulses of high carbon release during freezing and thawing have been observed for both methane (Kübert et al., 2026; Mastepanov et al., 2013) and CO2 (Raz-Yaseef et al., 2017; Arndt et al., 2020; Wang et al., 2023). These events, though infrequent, have been shown to have the potential to reduce annual carbon uptake by up to 46 % (Raz-Yaseef et al., 2017), highlighting the importance of understanding carbon exchange across the full annual cycle.
Despite their non-trivial implications for net carbon sink strength, non-growing season processes remain underrepresented in carbon flux studies, largely due to logistical and environmental challenges. Data from the ABCFlux database show that the majority of flux measurements still occur during the growing season, with June to August accounting for 32 % of observations, compared to just 18 % for winter (Virkkala et al., 2022; Virkkala et al., 2025; See et al., 2024). Eddy covariance (EC) sites provide high-temporal-resolution measurements of atmosphere–biosphere exchanges at the ecosystem scale and are the only method capable of directly quantifying net carbon fluxes across these areas. However, relatively few EC sites operate continuously year-round (Pallandt et al., 2022), leaving major gaps in our understanding of winter emissions and seasonal transitions (Hugelius et al., 2024).
This study utilizes a unique 17-year (2005–2021) time series dataset (Alekseychik et al., 2024) of the net ecosystem exchange of CO2 (NEE) from the Siikaneva fen to understand the overall interannual variability and examine the role of non-growing season periods in the annual carbon balance of a boreal fen. Given the scarcity of long-term, year-round measurements, this study offers a rare dataset for assessing long-term carbon exchange in these ecosystems.
The aim of this study is to assess the non-growing season carbon exchange and identify periods within the non-growing season that contributed significantly to the annual carbon balance. We specifically ask:
-
How much does the non-productive season contribute to the annual CO2 balance in the Siikaneva fen, and what are the seasonal patterns of CO2 fluxes during the non-growing season?
-
What are the primary environmental drivers of CO2 fluxes during the non-growing season? Specifically, do prior soil thermal conditions predict non-growing season fluxes, particularly during high-emission periods?
We hypothesize that the non-productive season contributes substantially to the annual CO2 balance, with distinct seasonal patterns characterized by higher emissions in autumn and spring thaw periods. We expect soil temperature to be the primary driver of non-growing season CO2 fluxes, with soil thermal conditions from prior seasons potentially affecting CO2 exchange, especially during late autumn and spring soil thaw.
2.1 Site description
Siikaneva wetland (Fig. 1) study site is an oligotrophic fen within a large aapamire complex located in southern Finland (61°50′ N, 24°12′ E, 162 m above sea level), with ongoing measurements since 2005. The site has been part of the ICOS research infrastructure since 2017 and is classified as a Class 2 ecosystem station. Peat depth at the site ranges from 2 to 6 meters. The terrain is generally flat, with vegetation dominated by peat mosses (Sphagnum balticum [Russow] C.E.O. Jensen, S. majus [Russow] C.E.O. Jensen, S. papillosum Lindb.), sedges (Carex rostrata Stokes, C. limosa L., Eriophorum vaginatum L.), and Rannoch rush (Scheuchzeria palustris L.) (Korrensalo et al., 2022). On one site the fen is neighboured by Scots pine forest growth on mineral soil. The mean annual temperature for the period 1971–2000 was 3.3 °C, and the total annual precipitation was 713 mm, based on data from the Hyytiälä weather station, located 5 km from Siikaneva (Drebs et al., 2002).

Figure 1Photo composite featuring Siikaneva in September (left), December (middle) and July (right). Photos by Maximilian King and Karoliina Särkelä.
2.2 Non-growing season definitions: non-productive season and thermal non-growing season
Many different definitions exist for the growing season and non-growing season, which can be based on environmental variables such as air temperature (referred to as the thermal growing season when persistently above 5 °C (Kollo et al., 2023; Ruosteenoja et al., 2016)), snow cover period (Arndt et al., 2020; Rafat et al., 2022), or thresholds in gross primary production (Böttcher et al., 2014). In this study, we define growing season and non-growing season based on the ecosystem carbon exchange (NEE), following one of the definitions suggested by Körner et al. (2023), and specifically referred to as productive or non-productive season. The productive season corresponds to the period when the ecosystem acts as a net carbon sink (daily NEE < 0), and the non-productive season when it is a net carbon source (daily NEE > 0). We used a threshold of three days (following the sink period definition by Aurela et al., 2004): the productive season starts on the first of three consecutive days with negative NEE and ends on the first of three consecutive days with positive NEE.
Additionally, we evaluated thermal growing season and non-growing season We defined the thermal growing season for each year as the period between the day of year when the cumulative sum of daily mean air temperature above a 5 °C threshold (air temperature °C −5 °C) reached its minimum, corresponding to the point before sustained daily temperatures consistently exceeded 5 °C, and the day of year when this cumulative sum reached its maximum, corresponding to the point after which daily temperatures no longer contributed to net accumulation above the 5 °C threshold (Ruosteenoja et al., 2016).
2.3 Eddy covariance (EC) measurements
The net ecosystem exchange (NEE) of CO2 at the Siikaneva fen site was measured using the eddy covariance (EC) technique (Baldocchi et al., 2003), providing continuous, high-frequency estimates of ecosystem–atmosphere CO2 exchange. Measurements have been conducted since 2005, with the flux tower installed at a height of 2.7 m above the peat surface. 80 %–90 % footprint was used for flux calculations, which varies between tens of meters to a maximum of 200 m depending on atmospheric conditions. Between 2005 and 2015, the EC system consisted of a Metek USA-1 three-dimensional sonic anemometer (Metek GmbH, Elmshorn, Germany) and a LI-COR LI-7000 CO2 H2O gas analyzer (LI-COR, Lincoln, NE, USA). In late 2015, the system was upgraded to a Gill HS-50 anemometer (Gill Instruments Ltd., UK) and a LI-COR LI-7200 enclosed-path gas analyzer, resulting in a data gap between September 2015 and February 2016. The processed and gapfilled data were available at the Finnish metadata catalog Etsin. Raw 10 Hz data were processed in EddyUH (Mammarella et al., 2016), including despiking, double coordinate rotation, sonic temperature correction, frequency response correction, and were calculated using mixing ratios. Fluxes were filtered for turbulence intermittency and atmospheric stability and corrected for CO2 storage below the measurement height. Further details on EC data processing can be found in Mammarella et al. (2016). Missing NEE data was gapfilled with the sum of modelled gross primary productivity (GPP) and ecosystem respiration (Reco). GPP was modelled as a function of photosynthetically active radiation (PAR) and air temperature, with parameters optimized for the preceding two-week period Photosynthesis was constrained to zero when air temperature dropped below 0 °C. Reco was modelled as a function of air temperature using site- and period-specific coefficients. The equations for the flux partitioning are provided in Kulmala et al. (2019) with site-specific modifications – for the flux timeseries in Siikaneva fen, air temperature was used to model the Reco as soil temperature records were inconsistent across the study period. Processed and gap-filled hourly NEE data were aggregated to daily sums and converted from µmol CO m−2 s−1 to g C m−2 d−1. Negative NEE values indicate net ecosystem carbon uptake.
2.4 Ancillary measurement
We reviewed a range of ancillary environmental variables alongside CO2 fluxes, including soil temperature, photosynthetically active radiation (PAR), vapor pressure deficit (VPD), precipitation, water table depth, and snow depth.
Soil temperature was measured using Campbell 107 thermistors (Campbell Scientific, Logan, UT, USA) from 2005 to 2016, and UMS TH3-s temperature profile probes (UMS GmbH & Co. KG, Willmars, Germany) from 2017 to 2021. The latter represents the average of five microsites within the EC footprint. Data from 5 and 50 cm depths (2005–2016) and from 5 and 45 cm depths (2017–2021) were used, specifically from a lawn microsite representative of the EC footprint. For consistency, temperatures at 45 and 50 cm are both referred to as “soil temperature at 50 cm depth”. Photosynthetically active radiation (PAR, µmol m−2) was measured with a Li-Cor Li-190R quantum sensor (LI-COR, Lincoln, NE, USA), but data from 2009–2015 were excluded due to sensor malfunction. Data from the Hyytiälä forestry site (5 km to the northeast of Siikaneva) were used for this period, measured with a Li-Cor Li-190SZ quantum sensor (LI-COR, Lincoln, NE, USA). Vapor pressure deficit (VPD, kPa) was calculated using the fCalcVPDfromRHandTair function in the R package ReddyProc (Wutzler et al., 2018), based on air temperature and relative humidity from a Rotronic HC2 sensor (Rotronic AG, Bassersdorf, Switzerland). Water table depth (WTD) was measured with Druck PDCR1830 and Campbell CS451 pressure transducers (Campbell Scientific). WTD is expressed in centimeters (cm) relative to the surface, with negative values indicating depths below ground. Precipitation (mm) was recorded using an ARG-100 tipping bucket rain gauge (2005–2016), which underreports sleet and snow. In 2017, it was replaced by an OTT Pluvio2S weighing rain gauge (OTT HydroMet, Kempten, Germany). Instrument upgrades in late 2015 caused data gaps across several variables (dates vary by parameter). To assess autumn and winter 2015 conditions, air temperature and snow depth data were retrieved from the Hyytiälä Forestry Station, 5 km from Siikaneva. Air temperature there was measured with a Pt100 sensor inside a custom shield. A linear regression comparing air temperatures at the two sites yielded a slope of 0.98 and R2 of 0.98, validating the use of Hyytiälä's temperature data.
2.5 Freeze–thaw status classification
The freeze–thaw state of the study area was classified using the Sentinel-1 IW GRD SAR (Synthetic Aperture Radar) data available from autumn 2014 onwards. These data have been processed by Google Earth Engine into calibrated and ortho-rectified grids of Sigma Nought backscatter values with 10 m pixel size. Median backscatter time series (VV, VH, and VH VV ratio) were extracted for a 200 m zone around the Eddy Covariance mast and the broader Siikaneva Fen. The 200 m zone represents ∼ 75 % flux footprint area (Riutta et al., 2007). Data from both ascending and descending orbits were used. The temporal resolution was, on average, two acquisitions per week. Due to changes in liquid water content, soil freezing typically reduces the measured backscatter intensity by a few decibels (Hallikainen et al., 1985; Ulaby et al., 1982; Cohen et al., 2021), and the presence of wet snow further reduces the backscatter by an additional few decibels (Nagler and Rott, 2000; Luojus et al., 2007)
Freeze–thaw periods were identified through visual inspection of backscatter trends, supported by in situ measurements (air and soil temperature, soil water content, and snow depth). Freezing onset was marked by a ≥2 dB drop in backscatter in VV polarization; the frozen period continued as long as all orbits consistently showed low values. Thaw onset was defined either by a sharp drop indicating wet snow or by a rise in backscatter consistent with thawed soil; thaw continued as long as all orbits showed higher backscatter values typical of thawed conditions.
2.6 Data analysis
We quantified the relative importance of environmental drivers controlling the carbon sink or source strength, expressed as daily net ecosystem exchange (NEE), using a machine-learning random forest regression algorithm. Random forest is a machine-learning technique widely used for complex multi-regression analyses (e.g., López-Blanco et al., 2017; Wei et al., 2022) that builds an ensemble of decision trees by repeatedly sampling random subsets of the training data (Breiman, 2001; Pedregosa et al., 2011). Each decision tree partitions the explanatory variables (covariates) to create clusters of data, within which regression models predict the response variable (NEE). Variable importance is then quantified as the percentage of times a variable is used in the decision splits across all trees, reflecting its contribution to explaining variability in NEE.
Our set of explanatory variables included photosynthetically active radiation (PAR), vapor pressure deficit (VPD), water table depth (WTD), and soil temperature. All variables and NEE were aggregated to daily means. Daily data were then binned into two-month periods: January–February, March–April, May–June, July–August, September–October, and November–December. These periods loosely follow the approximate periods when the system turns into a net source, i.e., the onset of the NGS (September–October); when the surface freezes (November–December); when the surface is typically frozen (January–February); when the surface thaws (March–April); when the system turns into a net sink of CO2, i.e., the onset of the GS (May–June); and when it is consistently a net sink of CO2 (July–August). Variable importance was then assessed for each model, with standard deviations calculated to evaluate uncertainty.
Days with fewer than 12 hourly NEE observations were excluded from the analysis to ensure data quality. Due to incomplete PAR records at the Siikaneva site for 2009–2015, PAR data from the nearby Hyytiälä Forest Station (5 km to the northeast of the Siikaneva fen) were used as a proxy. Due to strong collinearity between air temperature and soil temperature, we did not include air temperature in the analysis. Precipitation was excluded as an explanatory variable, since the instrument measuring precipitation could not reliably detect snow and sleet. Therefore, such precipitation data could introduce biases in the analysis by underestimating the amount of precipitation during winter compared to summer.
To investigate the potential influence of soil thermal conditions over different temporal scales and legacy effects, three separate model frameworks were constructed, each differing in how soil temperature was aggregated:
- a.
Daily mean soil temperature at 5 cm depth, representing contemporaneous conditions.
- b.
Daily running mean of 60 d of soil temperature at 5 cm, representing the conditions in the last two months.
- c.
Daily running mean of 60 d of soil temperature at 5 cm, lagged by 60 d, representing the conditions 2–4 months prior. For example, the soil temperature data point used as a driver for the daily NEE on 1 April is the mean soil temperature between 2 December and 30 January.
3.1 Duration of the non-productive and thermal non-growing season
On average, the non-productive season accounted for 60 % (226 ± 27 d) of the year, beginning on 17 September (±19 d) and ending on 30 April (±15 d). The non-productive season started latest in 2011 on 26 October and earliest in 2018 on 30 July (Fig. 2a) and ended the earliest in 2006 on 18 March and latest in 2016 on 2 June (Fig. 2a). The non-productive season that started in 2018 and ended in 2019 was the longest NGS (278 d) in the whole study period, due to an exceptionally early start of the season.
On average, the thermal non-growing season accounted for approximately 53 % of the year (195 ± 17 d), beginning on 13 October (±10) and ending on 26 April (±9), therefore being 31 d longer than the non-productive season. The mean absolute difference between the non-growing season periods based on the two definitions was 27 d for the onset and 12 d for the end. The largest delay between the onset of the thermal growing season and the start of the productive season occurred in spring 2016 (thermal growing season onset 27 April vs. productive season onset 3 June), whereas the earliest onset of the non-productive season relative to the thermal non-growing season occurred in 2018 (30 July non-productive season onset vs. 22 October thermal non-growing season onset).

Figure 2(A) Daily net ecosystem exchange of CO2 (NEE; g C m−2 d−1) in 2005–2021 and the non-productive season (black rectangular outline) periods centered in the winter. Each row represents one year, beginning in July and ending in June of the following year. Colors indicate daily mean NEE values, where the yellow–green gradient reflects negative values (net carbon sink) and the yellow–pink gradient reflects positive values (net carbon release). Black rectangular outlines mark the NGS periods, defined as the period beginning after the first three consecutive days of positive NEE and ending after the first three consecutive days of negative NEE. On average, the NGS started on 17 September and ended on 30 April. (B) Daily mean air temperature for 2005–2021, with the thermal non-growing season centered on winter. Each row represents one year, beginning in July and ending in June of the following year. Black rectangular outlines mark the thermal non-growing season following the definition of Ruosteenoja et al. (2016). The season boundaries are determined from the annual cumulative sum of daily temperature deviations from a 5 °C threshold: the growing season begins when the cumulative sum reaches its minimum and ends when it reaches its maximum, indicating that temperatures remain persistently above or below 5 °C. On average, the thermal non-growing started on 13 October and ending on 26 April.
3.2 Interannual and interseasonal CO2 fluxes
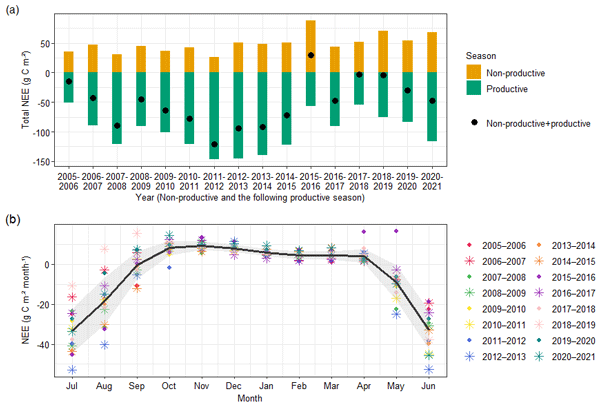
The fen acted as a net CO2 sink during the study period, with an average annual uptake of −51 ± 39 g C m−2. In two years, 2016 and 2018, the fen was a net source of CO2, releasing 28 and 21 g C m−2, respectively (Fig. A1a). However, when looking at the pairs of full non-productive and productive seasons (Fig. 3a), only productive season in 2016 and the preceding non-productive season from 2015–2016 were a net source of CO2. The mean cumulative carbon release during the non-productive seasons was 49 ± 15 g C m−2 (Fig. 3a), offsetting on average 57 % of the following productive season carbon uptake (−100 ± 31 g C m−2) (Fig. 3a). Interannual variability was high (±33 %). The lowest cumulative carbon emissions over the non-productive season were observed in 2012 (26 g C m−2), while the highest were recorded in 2016 (84 g C m−2) (Fig. 3a). The mean daily CO2 flux during non-productive season ranged from 0.14 g C m−2 in 2012 to 0.33 g C m−2 in 2016. Mean during the whole study period was 0.21 ± 0.048 g C m−2.
During the non-productive season, CO2 emissions generally declined from autumn to spring (Fig. 3a and b). The transitional months of October and April, marking the shift into and out of the growing season, showed the highest interannual variability (Fig. 3a and b). Emissions peaked in November (9.03 ± 2.07 g C m−2), followed by October (8.09 ± 3.60 g C m−2) and December (7.9 ± 2 g C m−2; Fig. 3b). Mean CO2 emissions during October–December were 75 % higher than those in January–March (8.4 vs. 4.8 g C m−2; Fig. 3b). April and May of 2016, both part of the non-productive season that year, exhibited the highest monthly net CO2 losses and the largest deviations from the long-term mean, followed by August and September in 2018 (Figs. 3a and 2b). Fluxes during that 2016 period exceeded the 95th percentile for 32 nearly consecutive days (see Fig. S5 in the Supplement). All other periods with three or more consecutive days above the 95th percentile occurred between September and December, with event durations of up to five days (see Fig. S5).
The strongest CO2 sinks occurred in June and July (−33 ± 9.6 and −33 ± 11 g C m−2, respectively; Fig. 3B). Monthly variability was higher during periods of net CO2 sink (May–September; Fig. 3b) than during the period of CO2 source (October–April; Fig. 3b).
There was a significant data gap in the EC measurements from 22 September 2015, to 25 February 2016. Notably, 2016 had the highest annual carbon emissions (1 January– 31 December, Fig. A1a). To ensure that this finding was not an artifact of the extended gap-filled period, annual balances were recalculated for all years, excluding data from 1 January to 25 February (Fig. A1b). Since 2016 still showed the highest annual balance (meaning a net source of CO2), we conclude that the gap-filling procedure did not significantly bias the results. Additionally, we evaluated the gapfilling performance after the data gap and during the anomalously high flux values. The adjusted R2 between the gap-filled NEE and the highest quality measured data from spring 2016 (26 February–30 May) was 0.78, indicating a generally good agreement (see Fig. S7).

Figure 3(a) Non-productive season and productive season net ecosystem exchange (NEE) sums of CO2 for each full non-productive season and the following productive season, with the net balance of the combined period indicated by black points. Negative values indicate a carbon uptake, and positive values indicate carbon loss to the atmosphere. We use the terms productive season and non-productive season to refer to periods when the ecosystem acts as a net carbon sink (productive) or a net carbon source (non-productive), based on daily NEE values, following the definition for a sink period by Aurela et al. (2002). The start of the non-productive season is defined as the first of three consecutive days with positive NEE, and the productive season begins on the first of three consecutive days with negative NEE. The non-productive season sum of CO2 is calculated for the full season, starting in autumn and ending in spring. (b) Monthly NEE sums across the study years, with the mean monthly sums (black line) and standard deviation (shaded area) shown for the period 2005–2021.
3.3 Respiration release in spring 2016
Since 2016 exhibited the highest cumulative CO2 emissions during the non-growing season (84 g C m−2) and was one of the few years with an annual net carbon loss (28 g C m−2), coupled with unusually high net emissions of CO2 in April and May (Fig. 3b), we examined this year in greater detail to better understand the underlying drivers and the conditions leading up to and during the peak emission period (Fig. 4).
The late autumn of 2015 was notably warm, with November-December reaching the highest mean temperature in the 2005–2021 record at 1.69 °C, 3.22 °C above the long-term average (Fig. 4c). A sharp temperature drop in January 2016 drove surface soil temperatures to their lowest levels recorded from 2005 to 2021, with air temperatures plunging from above zero to −25 °C over a two-week period (Fig. 4c). The cold spell lasted nearly three weeks, and the second-lowest air temperature in the study period (−25.2 °C) was recorded. Snow depth was not measured for most of the winter in early 2016 at Siikaneva. Measurements at Hyytiälä (5 km to the northeast of Siikaneva) recorded no snowpack at the beginning of the cold spell. During the cold spell, snow depth only increased from 0 to 4 cm – well below the 2016–2021 average of 16 cm. Surface soils froze, but the deeper soil layers remained warmer throughout the winter (Fig. 4b) due to the warm late autumn. From January to March 2016, the mean soil temperature at 50 cm depth was about 0.85 °C higher than the long-term at 2.95 °C. The soil temperature showed unique fluctuations at 50 cm depth but not in shallower layers (Fig. S2).
Complementary satellite-derived freeze–thaw status classification indicated the beginning of thawing for the 200 m radius from the EC mast on 27 March, marking the start of snowmelt (see Table S2 in the Supplement). At this point, CO2 flux increased sharply while soil temperatures at 5 cm remained at 0 °C (Fig. 4a–b), together with CH4 flux (see Fig. S8). The CH4 flux decreased after around two weeks, while elevated CO2 emissions persisted throughout the entire thawing period (see Fig. S8). Once the soil temperature at 5 cm began to rise more rapidly in the beginning of May, a second, more pronounced peak in CO2 emissions followed, fluctuating in response to the warming topsoil (Fig. 4a–b). In April 2016, daily emissions (positive NEE) were nearly four times higher than the monthly average: 0.53 g C m−2 d−1 compared to the typical 0.13 g C m−2 d−1. Cumulative emissions in April and May were substantial, offsetting 38 % of the total carbon uptake observed during the subsequent productive season.
To assess whether the high positive values of NEE were related to a delayed onset of photosynthetic activity, we evaluated GPP (see Fig. S9). Overall, GPP in spring 2016 closely followed the long-term mean and did not exhibit anomalous behaviour. The onset of photosynthetic activity, defined as the first occurrence of five consecutive days with GPP exceeding 1 g C m−2 d−1, occurred on 6 May, which is five days earlier than the 17-year average and within the range of interannual variability. This timing coincided with the decline in NEE and the increase in CH4 emissions (see Fig. S8), suggesting the onset of biological activity. However, the NEE stayed positive indicating a net release of CO2 until June 3rd, when it turned permanently negative (see Fig. 2b).

Figure 4(a) Daily means of Net Ecosystem Exchange of CO2, (b) soil temperature at 5 and 50 cm depth, and (c) air temperature, snow depth, and water table depth (expressed as centimeters from the surface, where positive values indicate water level above the surface) from 1 November 2015, to 1 June 2016. In each panel, the solid line shows observed values, the dotted line represents the mean for each day of the year (2005–2021, excluding 2015–2016), and shading indicates the standard deviation. Air temperature was measured 9 km away at the Hyytiälä Forest Station due to a data gap at the Siikaneva site in autumn 2015. The blue shading highlights the period of high flux values observed in spring 2016.
3.4 Variable importance controlling NEE
We used machine learning random forest models to evaluate the relative importance of environmental drivers controlling CO2 exchange, with a particular focus on the role of soil temperature over different time scales. The pronounced respiration pulse observed in spring 2016 (Fig. 4a) suggested that soil thermal conditions from the preceding autumn and winter (Fig. 4b) might influence carbon emissions during soil thaw. To investigate this, we compared three temporal representations of soil temperature as predictors: concurrent daily soil temperature (Fig. 5a), a 60 d running mean (Fig. 5b), and a 60 d running mean lagged by two months (Fig. 5c). The 60 d window was chosen to capture potential cross-seasonal effects of soil temperature, such as the influence of summer conditions on autumn respiration and late-autumn temperatures on winter CO2 efflux.
Random forest models that were used to evaluate the relative importance of environmental drivers controlling CO2 exchange revealed that during soil thawing and snowmelt in March–April (see Fig. S4), fluxes were influenced by both concurrent soil temperature (Fig. 5a) and the thermal history (Figs. 5b and 4c) of the preceding four months. Concurrent soil temperature dominated fluxes during the highest non-growing season emissions in November–December (38 % ± 5.2; Fig. 5a). At the onset of the non-growing season (September–October), CO2 exchange was primarily driven by PAR (58 % ± 3.1 %; Fig. 5a). During January–February, when soils were typically frozen or snow-covered (see Fig. S4), no single driver clearly dominated (Fig. 5a). During the productive season, fluxes were mainly driven by PAR (43 % ± 3.4 %; Fig. 5a) and WTD (36 % ± 3.2 %; Fig. 5a). The soil thermal conditions in the last 60 d were also an important driver during the onset of the GS (Fig. 5b).
Overall, model performance was moderate to high (R2 = 0.38–0.71) and varied depending on the soil temperature representation. The best-performing model for November–December and January–February periods used concurrent soil temperature (R2= 0.38 and R2= 0.53, respectively; model used in Fig. 5a), for March–April and May–June the 2–4 month lagged soil temperature performed best (R2= 0.52 and R2= 0.67, respectively; model used in Fig. 5c), and for July–August the 60 d running mean showed the highest explanatory power (R2= 0.71; model used in Fig. 5b), while differences between representations were small in September–October (R2= 0.62–0.65).
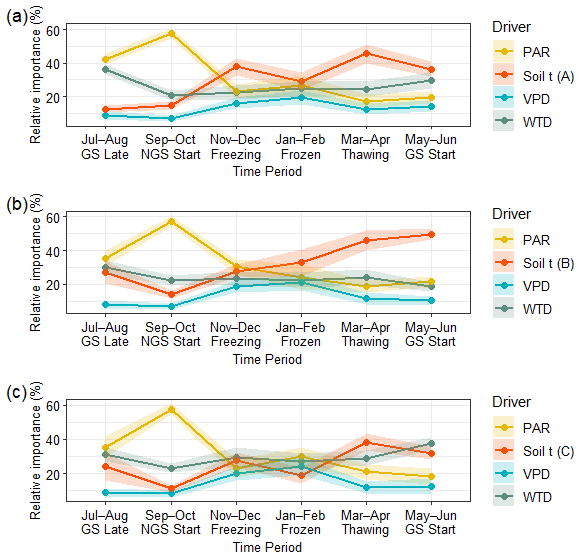
Figure 5Relative importance of photosynthetically active radiation (PAR), vapor pressure deficit (VPD), water table depth (WTD), and soil temperature at 5 cm in predicting daily net ecosystem exchange (NEE), based on random forest models. All variables and NEE were aggregated to daily means. Shading represents standard deviation. Due to incomplete PAR records at the Siikaneva site, data from the Hyytiälä Forest Station were used for 2009–2015. Subplots differ in the soil temperature aggregation used: (a) Daily mean soil temperature at 5 cm; (b) Mean soil temperature at 5 cm, averaged over the two months preceding each flux measurement; (c) Mean soil temperature at 5 cm, averaged over a two-month window and lagged by 60 d (i.e., a lagged two-month mean).
Our aim is to examine how much the non-productive season contributed to annual CO2 exchange at the Siikaneva fen and to describe the seasonal patterns of CO2 fluxes during this period. Additionally, we investigated the main environmental factors driving CO2 emissions specifically focusing on concurrent and lagged soil temperature as a driver. The year 2016 emerged as a key focus because it featured an unusually large CO2 release during the spring thaw.
4.1 Annual ecosystem carbon exchange and its seasonal variation through the year
On average, the studied fen ecosystem functioned as a CO2 sink, with an annual net carbon uptake of −51 ± 39 g C m−2. This is more than twice the mean of boreal wetlands based on a recent synthesis (−17 g C m−2 yr−1; Virkkala et al., 2021), indicating it is a highly productive wetland site. Emissions during the non-productive season offset approximately 60 % of the carbon sequestered during the following productive season (Fig. 3A), a proportion comparable to that observed in other wetland sites (Virkkala et al., 2021; Aurela et al., 2002; Wang et al., 2023; López-Blanco et al., 2018; Yao et al., 2022), although the studies differ in the definition used for the non-growing season.
The non-productive season lasted on average from mid-September through the end of April (Fig. 2a), and was a month shorter than the thermal non-growing season (Fig. 2). The 5 °C threshold used to define the thermal growing season was a better predictor of the onset of the growing season than of its end, indicating a closer link between temperature conditions and spring onset than autumn termination. The two years, 2016 and 2018, with a positive annual CO2 balance (i.e., when the ecosystem acted as a net source of CO2 rather than a sink) showed strong deviations between the thermal and productivity-based season definitions. In 2016, the non-productive season persisted unusually late into early June (ending on 3 June), whereas in 2018 it began exceptionally early, already on 30 July. The unusually early onset of the non-productive season in 2018 has previously been linked to extreme summer drought conditions (Rinne et al., 2020). However, it is important to note that this early start of the non-productive season does not necessarily indicate a lack of photosynthesis or actual plant growth, but rather a net carbon loss at the ecosystem level.
Emissions generally declined from autumn to spring (Fig. 3b): mean fluxes from October to December (8.4 g C m−2 month−1) were nearly twice those observed from January to March. Autumn is typically the period with the highest emissions (Byrne et al., 2022; Commane et al., 2017), which can potentially shift the system to an annual net carbon source. However, at boreal sites, growing season uptake generally offsets autumn emissions, even under current warming trends (See et al., 2024). PAR emerged as a strong driver during September–October, a period when the system typically shifted from productive to non-productive. This transition is highly sensitive to declining light availability, which influences the onset and progression of senescence. As a result, day-to-day variability in carbon uptake is largely determined by PAR. During the peak emission period from November to December (Fig. 3b), carbon exchange was mainly controlled by soil temperature (Fig. 5a), which is typically the dominant driver of non-growing season emissions (Natali et al., 2019).
Emissions were lowest in January and February (Fig. 3b), with low interannual variability and high uncertainty in concurrent environmental drivers (Fig. 5a). This uncertainty may partly arise from a temporal lag between environmental conditions, such as soil temperature, and the observed fluxes, as snow and ice can restrict gas diffusion, allowing CO2 to build up in the soil and snowpack before being released later (Martz et al., 2016; Morgner et al., 2010). The 60 d averaged soil temperature was also not identified as an important driver (Fig. 5b), indicating that midwinter fluxes are not consistently higher or lower following warmer or colder prior soil conditions.
From March to April, random forest analysis highlighted both concurrent soil temperature and the preceding months' conditions (e.g., the 60 d running mean and December–January soil temperatures) as important predictors of fluxes (Fig. 5). This indicates a legacy effect of late-autumn and early-winter temperatures on spring emissions, consistent with the hypothesis that CO2 accumulates during frozen conditions and is released upon thaw (Raz-Yaseef et al., 2017; Sullivan et al., 2012). In addition, thermal conditions in autumn and winter may influence microbial activity and substrate availability during thaw.
4.2 Spring 2016 respiration enhanced by winter conditions and snowmelt
In 2016, an exceptional respiration pulse during April–May dominated the annual CO2 budget (Fig. 4a). Lasting about six weeks, this event offset 37 % of the subsequent productive season uptake and produced the highest annual CO2 loss of the record. Comparable pulses have been reported from other cold-climate wetlands (Wang et al., 2023) and permafrost-affected tundra sites (Raz-Yaseef et al., 2017; Arndt et al., 2020). Raz-Yaseef et al. (2017) and Wang et al. (2023) associated the pulse with the rapid release of gases that accumulated beneath snow and ice during winter. A similar event was reported by Arndt et al. (2020), who further suggested that snowmelt infiltration and oxygen supply can stimulate microbial activity, enhancing respiration during thaw. Our results add to this evidence but are, to our knowledge, the first to document such an event in a non-permafrost site. Overall, our observations indicate that the 2016 events combined the release of CO2 accumulated during winter with an additional increase in respiration during spring thaw, together enhancing total emissions.
During snowmelt, CO2 and CH4 emissions rose sharply while surface soil temperatures remained near 0 °C, suggesting release of stored gases from the snowpack and soil, possibly aided by ice cracking (Raz-Yaseef et al., 2017). The conditions during the previous autumn and winter were favourable for gas buildup in soil. Phenocamera observations show the presence of an ice layer during winter (see Fig. S10), which appeared more extensive than in other years and likely formed after a sudden cold spell in January following a warm autumn. This ice layer would have restricted gas diffusion, allowing CO2 and CH4 produced at depth to accumulate. Warm conditions in late autumn 2015 and early winter kept deep soil layers warmer than average throughout the winter months (Fig. 4b), enhancing CO2 and CH4 production during the non-productive season and increasing the pool of gases available for release once transport pathways reopened. The random forest analysis confirmed a soil temperature legacy effect, with late-autumn and early-winter conditions influencing fluxes during spring thaw (Fig. 5c).
After snow cover disappeared, CH4 fluxes declined while CO2 emissions remained elevated, indicating a shift from transport-dominated fluxes to enhanced respiration. This increase in respiration was likely driven by the decomposition of labile organic matter made available through freeze–thaw damage to the organic matter in the soil. Soil freeze-up can create mechanical disturbance and break down biomass in the soil, which could promote faster decomposition in the following spring (Brooks et al., 2005; Byun et al., 2021). Freezing can also damage the winter microbial populations, which releases easily degradable carbon and nutrients to the surviving community, boosting respiration post thaw (Brooks et al., 2005). In addition to responses related to soil freezing, infiltration of oxygen-rich snowmelt water has been shown to stimulate aerobic microbial activity at depth (Arndt et al., 2020), further amplifying respiration during thaw.
Given the severity of the cold spell in January and the formation of a surface ice layer, it is possible that vegetation was affected by these extreme conditions, potentially delaying the onset of photosynthetic activity and contributing to the positive high NEE observed in spring. To evaluate whether elevated NEE was driven by increased respiration or reduced photosynthetic uptake, we examined GPP dynamics (Fig. S9). As GPP followed the long-term average and exceeded 1 g C m−2 d−1 already on 6 May, four weeks before NEE turned permanently negative, this indicates that the onset of photosynthetic activity was not delayed. Therefore, the persistently high positive NEE values observed in spring were not primarily driven by reduced photosynthetic uptake but instead reflect elevated ecosystem respiration. Additionally, the thermal growing season started on 27 April (Fig. 2b), one day after the long-term mean, indicating that spring thermal conditions were within the typical range and therefore unlikely to have constrained the onset of ecosystem activity or reduced early-season carbon uptake.
Beyond the biological explanations for the 2016 event, a physical process may also be relevant. Campeau et al. (2021) found that weakened thermal stratification in autumn promotes turbulent diffusion that has the potential to release large amount of CO2 stored in deep porewater to the surface. In our data, temperature fluctuations at 50 cm depth (see Fig. S2) during winter while the upper layers remained frozen and stable suggest hydrological mixing within saturated peat. The subsequent CO2 pulse coincided with a period of weak thermal stratification, when the surface and deeper soil layers reached similar temperatures, conditions that could have supported the rapid release of stored CO2. The pulse may therefore have been supported not only by microbial processes but also by transient physical mixing and mobilization of deeper CO2. Although direct evidence of porewater CO2 dynamics is lacking, this temporal correspondence suggests that biological and physical pathways may have interacted to produce the unusually high CO2 efflux in 2016. More broadly, these findings highlight the need to consider CO2 accumulation in the peat profile and both vertical and lateral transport as a fully integrated net ecosystem carbon balance (López-Blanco et al., 2025).
Such events appear to be infrequent but can have outsized impacts on the annual carbon balance. In 17 years of monitoring, 2016 was the only year when such a pronounced spring pulse was observed. The event suggests that no single environmental driver can account for its magnitude; rather, several conditions (e.g., warm soils at depth, surface freeze-up) likely needed to coincide for it to occur. To better understand these dynamics, direct monitoring of peat gas buildup during the non-growing season would be valuable for determining whether spring pulses primarily reflect the release of gases accumulated under frozen conditions or enhanced microbial respiration initiated during thaw.
4.3 Vulnerability of northern wetlands CO2 balance to NGS changes
The dominance of non-productive season processes in affecting the annual CO2 balance means that warming late autumns, earlier spring thaws, or increased frequency of freeze–thaw events could substantially alter the net sink strength of boreal fens. Projected late-season warming may prolong microbial activity and amplify NGS losses (Natali et al., 2019) unless offset by concurrent growing season gains (See et al., 2024).
In this time series, two years (2016 and 2018) shifted the fen from a net CO2 sink to a source (Figs. 3 and A1). In 2018, a summer drought reduced uptake during the productive season and caused an earlyonset of the non-productive season (Rinne et al., 2020). While this extended the non-productive season to its longest duration in the record, total productive season emissions remained smaller than in 2016, demonstrating that short-lived but intense events during the non-productive part of the year can outweigh more gradual seasonal anomalies in determining the annual carbon balance.
Representation of episodic emissions during spring thaw and autumn freeze is currently lacking in process-based models and future projections (e.g., Watts et al., 2023). Given that high, episodic carbon release during the non-productive season resulted in the highest annual net loss of CO2 in this study, models aiming to predict peatland carbon–climate feedbacks must explicitly represent the thermal legacy effects from autumn to spring and soil gas accumulation and release mechanisms during freezing and thawing. Without such process-level representation, predictions may underestimate the potential for short-term non-growing season events to transform high-productivity peatlands from strong sinks into net sources of CO2.
Our study highlights the importance of non-growing season carbon exchange in shaping the annual carbon balance of boreal peatlands. While the fen generally acted as a CO2 sink, episodic events – such as the exceptional spring pulse in 2016 – demonstrated that infrequent disturbances can strongly influence the annual carbon balance.
Our results point to the significance of soil thermal history, potential peat gas accumulation and increased respiration following soil freezing as key mechanisms driving these pulses. These processes remain poorly constrained and are not yet well represented in ecosystem models, but they are critical for predicting peatland carbon exchange. Long-term, continuous measurements proved particularly valuable: our 17-year record not only captured infrequent but influential events such as the respiration pulse in 2016 but also provided the broader context to recognize their rarity and evaluate their contribution to interannual variability.
Autumn accounted for the largest share of emissions, emphasizing the role of shoulder seasons in offsetting growing-season uptake. Consequently, warmer autumns and predicted reduced snow cover are likely to enhance CO2 efflux by prolonging the period of unfrozen soils and stimulating late-season microbial activity.
Looking forward, warming autumns and changes in snow cover will alter soil thermal conditions, which can affect both concurrent CO2 fluxes during the non-growing season and fluxes later in the season. Understanding these processes – including soil thermal legacies and potential subsurface gas buildup – is therefore essential for assessing the vulnerability of peatland carbon storage under future climate change.

Figure A1(a) Cumulative sums of gap-filled daily sums of net ecosystem exchange of CO2 (NEE), starting from the day of year (DoY) 1 and (b) starting from DoY 57. As 2016 had the highest annual balance, but there was a significant measurement gap in DoY 1–57 in 2016, we calculated the annual sums for all years excluding this period. 2016 remained to have the highest balance, and the relative ranking in the annual balances remained similar. We therefore concluded that the positive balance of 2016 was not a result of the gapfilling period.
The meteorological and soil data (https://doi.org/10.23729/0766621e-99bf-42f2-ad55-889cdb08b66a, Alekseychik et al., 2024b) and CO2 flux data (https://doi.org/10.23729/a3c8d0fe-2a69-4aa9-acbd-5da569fd264e, Alekseychik et al., 2024a) from the SMEAR II Siikaneva fen site during the study period are accessible via the Finnish metadata catalog Etsin.
The supplement related to this article is available online at https://doi.org/10.5194/bg-23-6037-2026-supplement.
KS: Conceptualization, Formal analysis, Investigation, Software, Visualization, Writing (original draft preparation). TV: Conceptualization, Writing (review and editing). JC: Methodology and Investigation (Sect. 2.5), Writing (review and editing). AK: Conceptualization, Writing (review and editing). XL: Conceptualization, Writing (review and editing). TRC: Conceptualization, Funding acquisition, Writing (review and editing). HM: Conceptualization, Writing (review and editing). EST: Writing (review and editing). JP: Methodology (Sect. 2.5). ELB: Conceptualization, Writing (review and editing).
The contact author has declared that none of the authors has any competing interests.
Publisher's note: Copernicus Publications remains neutral with regard to jurisdictional claims made in the text, published maps, institutional affiliations, or any other geographical representation in this paper. The authors bear the ultimate responsibility for providing appropriate place names. Views expressed in the text are those of the authors and do not necessarily reflect the views of the publisher.
We thank the staff and technicians at Hyytiälä Forestry Station for their efforts in maintaining the research infrastructure at the Siikaneva fen. The site is part of the ICOS Finland infrastructure. We acknowledge the use of AI in assisting with code development and text editing.
KS was supported by the High-latitude Greenhouse Gases – a Balancing Act (HILAC) project, funded by the Kvantum Institute, and by the Digital Waters (DIWA) Flagship funded by the Research Council of Finland. XL was supported by the Research Council of Finland (Project 371040). The work of AK was funded by the Academy of Finland fellowship PeatStress (grant no. 360071). ELB and TRC consider this study a contribution to the GreenFeedBack project (Greenhouse Gas Fluxes and Earth System Feedbacks), funded by the European Union’s Horizon Research and Innovation Programme (grant agreement no. 101056921).
This paper was edited by Paul Stoy and reviewed by Manuel Helbig and one anonymous referee.
Alekseychik, P., Peltola, O., Li, X., Aurela, M., Hatakka, J., Pihlatie, M., Rinne, J., Haapanala, S., Laakso, H., Taipale, R., Matilainen, T., Salminen, T., Levula, J., Ke, P., and Kolari, P.: SMEAR II Siikaneva 1 wetland eddy covariance (Version 3), University of Helsinki, Institute for Atmospheric and Earth System Research [data set], https://doi.org/10.23729/a3c8d0fe-2a69-4aa9-acbd-5da569fd264e, 2024a.
Alekseychik, P., Kolari, P., Rinne, J., Haapanala, S., Laakso, H., Taipale, R., Matilainen, T., Salminen, T., Levula, J., and Tuittila, E.: SMEAR II Siikaneva 1 wetland meteorology and soil (Version 4), University of Helsinki, Institute for Atmospheric and Earth System Research [data set], https://doi.org/10.23729/0766621e-99bf-42f2-ad55-889cdb08b66a, 2024b.
AMAP: Arctic Climate Change Update 2021: Key Trends and Impacts, Arctic Monitoring and Assessment Programme (AMAP), Tromsø, Norway, viii, 148 pp., ISBN 978-82-7971-201-5, 2021.
Arndt, K. A., Lipson, D. A., Hashemi, J., Oechel, W. C., and Zona, D.: Snow melt stimulates ecosystem respiration in Arctic ecosystems, Glob. Change Biol., 26, 5042–5051, https://doi.org/10.1111/gcb.15193, 2020.
Arndt, K. A., Hashemi, J., Natali, S. M., Schiferl, L. D., and Virkkala, A.-M.: Recent Advances and Challenges in Monitoring and Modeling Non-Growing Season Carbon Dioxide Fluxes from the Arctic Boreal Zone, Curr. Clim. Change Rep., 9, 27–40, https://doi.org/10.1007/s40641-023-00190-4, 2023.
Aurela, M., Laurila, T., and Tuovinen, J.-P.: Annual CO2 balance of a subarctic fen in northern Europe: Importance of the wintertime efflux, J. Geophys. Res.-Atmos., 107, ACH 17-1–ACH 17-12, https://doi.org/10.1029/2002JD002055, 2002.
Aurela, M., Laurila, T., and Tuovinen, J.-P.: The timing of snow melt controls the annual CO2 balance in a subarctic fen, Geophys. Res. Lett., 31, https://doi.org/10.1029/2004GL020315, 2004.
Baldocchi, D. D.: Assessing the eddy covariance technique for evaluating carbon dioxide exchange rates of ecosystems: past, present and future, Glob. Change Biol., 9, 479–492, https://doi.org/10.1046/j.1365-2486.2003.00629.x, 2003.
Böttcher, K., Aurela, M., Kervinen, M., Markkanen, T., Mattila, O.-P., Kolari, P., Metsämäki, S., Aalto, T., Arslan, A. N., and Pulliainen, J.: MODIS time-series-derived indicators for the beginning of the growing season in boreal coniferous forest – A comparison with CO2 flux measurements and phenological observations in Finland, Remote Sens. Environ., 140, 625–638, https://doi.org/10.1016/j.rse.2013.09.022, 2014.
Breiman, L.: Random forests, Mach. Learn., 45, 5–32, https://doi.org/10.1023/a:1010933404324, 2001.
Brooks, P. D., McKnight, D., and Elder, K.: Carbon limitation of soil respiration under winter snowpacks: Potential feedbacks between growing season and winter carbon fluxes, Glob. Change Biol., 11, 231–238, https://doi.org/10.1111/j.1365-2486.2004.00877.x, 2005.
Byrne, B., Liu, J., Yi, Y., Chatterjee, A., Basu, S., Cheng, R., Doughty, R., Chevallier, F., Bowman, K. W., Parazoo, N. C., Crisp, D., Li, X., Xiao, J., Sitch, S., Guenet, B., Deng, F., Johnson, M. S., Philip, S., McGuire, P. C., and Miller, C. E.: Multi-year observations reveal a larger than expected autumn respiration signal across northeast Eurasia, Biogeosciences, 19, 4779–4799, https://doi.org/10.5194/bg-19-4779-2022, 2022.
Byun, E., Rezanezhad, F., Fairbairn, L., Slowinski, S., Basiliko, N., Price, J. S., Quinton, W. L., Roy-Léveillée, P., Webster, K., Van and Cappellen, P.: Temperature, moisture and freeze–thaw controls on CO2 production in soil incubations from northern peatlands, Sci. Rep., 11, 23219, https://doi.org/10.1038/s41598-021-02606-3, 2021.
Campeau, A., Vachon, D., Bishop, K., Nilsson, M. B., and Wallin, M. B.: Autumn destabilization of deep porewater CO2 store in a northern peatland driven by turbulent diffusion, Nat. Commun., 12, 6857, https://doi.org/10.1038/s41467-021-27059-0, 2021.
Cohen, J., Rautiainen, K., Lemmetyinen, J., Smolander, T., Vehviläinen, J., and Pulliainen, J.: Sentinel-1 based soil freeze/thaw estimation in boreal forest environments, Remote Sens. Environ., 254, 112267, https://doi.org/10.1016/j.rse.2020.112267, 2021.
Commane, R., Lindaas, J., Benmergui, J., Luus, K. A., Chang, R. Y.-W., Daube, B. C., Euskirchen, E. S., Henderson, J. M., Karion, A., Miller, J. B., Miller, S. M., Parazoo, N. C., Randerson, J. T., Sweeney, C., Tans, P., Thoning, K., Veraverbeke, S., Miller, C. E., and Wofsy, S. C.: Carbon dioxide sources from Alaska driven by increasing early winter respiration from Arctic tundra, P. Natl. Acad. Sci. USA, 114, 5361–5366, https://doi.org/10.1073/pnas.1618567114, 2017.
Drebs, A., Nordlund, A., Karlsson, P., Helminen, J., and Rissanen, P.: Climatological statistics of Finland 1971–2000, Finnish Meteorological Institute, Helsinki, 99 pp., ISBN 951-697-568-2, 2002.
Friedlingstein, P., O'Sullivan, M., Jones, M. W., Andrew, R. M., Gregor, L., Hauck, J., Le Quéré, C., Luijkx, I. T., Olsen, A., Peters, G. P., Peters, W., Pongratz, J., Schwingshackl, C., Sitch, S., Canadell, J. G., Ciais, P., Jackson, R. B., Alin, S. R., Alkama, R., Arneth, A., Arora, V. K., Bates, N. R., Becker, M., Bellouin, N., Bittig, H. C., Bopp, L., Chevallier, F., Chini, L. P., Cronin, M., Evans, W., Falk, S., Feely, R. A., Gasser, T., Gehlen, M., Gkritzalis, T., Gloege, L., Grassi, G., Gruber, N., Gürses, Ö., Harris, I., Hefner, M., Houghton, R. A., Hurtt, G. C., Iida, Y., Ilyina, T., Jain, A. K., Jersild, A., Kadono, K., Kato, E., Kennedy, D., Klein Goldewijk, K., Knauer, J., Korsbakken, J. I., Landschützer, P., Lefèvre, N., Lindsay, K., Liu, J., Liu, Z., Marland, G., Mayot, N., McGrath, M. J., Metzl, N., Monacci, N. M., Munro, D. R., Nakaoka, S.-I., Niwa, Y., O'Brien, K., Ono, T., Palmer, P. I., Pan, N., Pierrot, D., Pocock, K., Poulter, B., Resplandy, L., Robertson, E., Rödenbeck, C., Rodriguez, C., Rosan, T. M., Schwinger, J., Séférian, R., Shutler, J. D., Skjelvan, I., Steinhoff, T., Sun, Q., Sutton, A. J., Sweeney, C., Takao, S., Tanhua, T., Tans, P. P., Tian, X., Tian, H., Tilbrook, B., Tsujino, H., Tubiello, F., van der Werf, G. R., Walker, A. P., Wanninkhof, R., Whitehead, C., Willstrand Wranne, A., Wright, R., Yuan, W., Yue, C., Yue, X., Zaehle, S., Zeng, J., and Zheng, B.: Global Carbon Budget 2022, Earth Syst. Sci. Data, 14, 4811–4900, https://doi.org/10.5194/essd-14-4811-2022, 2022.
Gorham, E.: Northern Peatlands: Role in the Carbon Cycle and Probable Responses to Climatic Warming, Ecol. Appl., 1, 182–195, https://doi.org/10.2307/1941811, 1991.
Hallikainen, M. T., Ulaby, F. T., Dobson, M. C., El-Rayes, M. A., and Wu, L.-K.: Microwave dielectric behavior of wet soil – Part 1: Empirical models and experimental observations, IEEE T. Geosci. Remote, GE-23, 25–34, https://doi.org/10.1109/TGRS.1985.289497, 1985.
Hugelius, G., Loisel, J., Chadburn, S., Jackson, R. B., Jones, M., MacDonald, G., Marushchak, M., Olefeldt, D., Packalen, M., Siewert, M. B., Treat, C., Turetsky, M., Voigt, C., and Yu, Z.: Large stocks of peatland carbon and nitrogen are vulnerable to permafrost thaw, P. Natl. Acad. Sci. USA, 117, 20438–20446, https://doi.org/10.1073/pnas.1916387117, 2020.
Hugelius, G., Ramage, J., Burke, E., Chatterjee, A., Smallman, T. L., Aalto, T., Bastos, A., Biasi, C., Canadell, J. G., Chevallier, F., Ciais, P., Chang, J., Feng, L., Jones, M. W., Kleinen, T., Kuhn, M., Liu, J., and Zheng, B.: Permafrost Region Greenhouse Gas Budgets Suggest a Weak CO2 Sink and CH4 and N2O Sources, Global Biogeochem. Cy., 38, e2023GB007969, https://doi.org/10.1029/2023GB007969, 2024.
Kollo, J., Metslaid, S., Padari, A., Hordo, M., Kangur, A., and Noe, S. M.: Trends in thermal growing season length from years 1955–2020 – A case study in hemiboreal forest in Estonia, Boreal Environ. Res., 28, 169–180, 2023.
Korrensalo, A., Mammarella, I., Alekseychik, P., Vesala, T., and Tuittila, E.-S.: Plant mediated methane efflux from a boreal peatland complex, Plant Soil, 471, 375–392, https://doi.org/10.1007/s11104-021-05180-9, 2022.
Kübert, A., Lohila, A., Vekuri, H., Hatakka, J., Laurila, T., Mäkelä, T., Rainne, J., Suopajärvi, S., Tuovinen, J.-P., and Aurela, M.: Summer temperatures largely control annual methane budgets of a northern peatland, Agr. Forest Meteorol., 381, 111101, https://doi.org/10.1016/j.agrformet.2026.111101, 2026.
Körner, C., Möhl, P., and Hiltbrunner, E.: Four ways to define the growing season, Ecol. Lett., 26, 1277–1292, https://doi.org/10.1111/ele.14260, 2023.
Kulmala, L., Pumpanen, J., Kolari, P., Dengel, S., Berninger, F., Köster, K., Matkala, L., Vanhatalo, A., Vesala, T., and Bäck, J.: Inter- and intra-annual dynamics of photosynthesis differ between forest floor vegetation and tree canopy in a subarctic Scots pine stand, Agr. Forest Meteorol., 271, 1–11, https://doi.org/10.1016/j.agrformet.2019.02.029, 2019.
López-Blanco, E., Lund, M., Williams, M., Tamstorf, M. P., Westergaard-Nielsen, A., Exbrayat, J.-F., Hansen, B. U., and Christensen, T. R.: Exchange of CO2 in Arctic tundra: impacts of meteorological variations and biological disturbance, Biogeosciences, 14, 4467–4483, https://doi.org/10.5194/bg-14-4467-2017, 2017.
López-Blanco, E., Lund, M., Christensen, T. R., Tamstorf, M. P., Smallman, T. L., Slevin, D., Westergaard-Nielsen, A., Hansen, B. U., Abermann, J., and Williams, M.: Plant Traits are Key Determinants in Buffering the Meteorological Sensitivity of Net Carbon Exchanges of Arctic Tundra, J. Geophys. Res.-Biogeo., 123, 2675–2694, https://doi.org/10.1029/2018JG004386, 2018.
López-Blanco, E., Väisänen, M., Salmon, E., Jones, C. P., Schmidt, N. M., Marttila, H., Lohila, A., Juutinen, S., Scheller, J., and Christensen, T. R.: The net ecosystem carbon balance (NECB) at catchment scales in the Arctic, Front. Environ. Sci., 13, 1544586, https://doi.org/10.3389/fenvs.2025.1544586, 2025.
Luojus, K. P., Pulliainen, J. T., Metsamäki, S. J., and Hallikainen, M. T.: Snow-Covered Area Estimation Using Satellite Radar Wide-Swath Images, IEEE T. Geosci. Remote, 45, 978–989, https://doi.org/10.1109/TGRS.2006.888864, 2007.
Mammarella, I., Peltola, O., Nordbo, A., Järvi, L., and Rannik, Ü.: Quantifying the uncertainty of eddy covariance fluxes due to the use of different software packages and combinations of processing steps in two contrasting ecosystems, Atmos. Meas. Tech., 9, 4915–4933, https://doi.org/10.5194/amt-9-4915-2016, 2016.
Martz, F., Vuosku, J., Ovaskainen, A., Stark, S., and Rautio, P.: The Snow Must Go On: Ground Ice Encasement, Snow Compaction and Absence of Snow Differently Cause Soil Hypoxia, CO2 Accumulation and Tree Seedling Damage in Boreal Forest, PLoS One, 11, e0156620, https://doi.org/10.1371/journal.pone.0156620, 2016.
Mastepanov, M., Sigsgaard, C., Tagesson, T., Ström, L., Tamstorf, M. P., Lund, M., and Christensen, T. R.: Revisiting factors controlling methane emissions from high-Arctic tundra, Biogeosciences, 10, 5139–5158, https://doi.org/10.5194/bg-10-5139-2013, 2013.
Morgner, E., Elberling, B., Strebel, D., and Cooper, E. J.: Importance of winter in annual ecosystem respiration in the High Arctic, Polar Res., 29, 58–74, https://doi.org/10.1111/j.1751-8369.2010.00151.x, 2010.
Nagler, T. and Rott, H.: Retrieval of wet snow by means of multitemporal SAR data, IEEE T. Geosci. Remote, 38, 754–765, https://doi.org/10.1109/36.842004, 2000.
Natali, S. M., Watts, J. D., Rogers, B. M., Potter, S., Ludwig, S. M., Selbmann, A.-K., Sullivan, P. F., Abbott, B. W., Arndt, K. A., Birch, L., Björkman, M. P., Bloom, A. A., Celis, G., Christensen, T. R., Christiansen, C. T., Commane, R., Cooper, E. J., Crill, P., Czimczik, C., Davydov, S., Du, J., Egan, J. E., Elberling, B., Euskirchen, E. S., Friborg, T., Genet, H., Göckede, M., Goodrich, J. P., Grogan, P., Helbig, M., Jafarov, E. E., Jastrow, J. D., Kalhori, A. A. M., Kim, Y., Kimball, J. S., Kutzbach, L., Lara, M. J., Larsen, K. S., Lee, B.-Y., Liu, Z., Loranty, M. M., Lund, M., Lupascu, M., Madani, N., Malhotra, A., Matamala, R., McFarland, J., McGuire, A. D., Michelsen, A., Minions, C., Oechel, W. C., Olefeldt, D., Parmentier, F.-J. W., Pirk, N., Poulter, B., Quinton, W., Rezanezhad, F., Risk, D., Sachs, T., Schaefer, K., Schmidt, N. M., Schuur, E. A. G., Semenchuk, P. R., Shaver, G., Sonnentag, O., Starr, G., Treat, C. C., Waldrop, M. P., Wang, Y., Welker, J., Wille, C., Xu, X., Zhang, Z., Zhuang, Q., and Zona, D.: Large loss of CO2 in winter observed across the northern permafrost region, Nat. Clim. Chang., 9, 852–857, https://doi.org/10.1038/s41558-019-0592-8, 2019.
Nichols, J. E. and Peteet, D. M.: Rapid expansion of northern peatlands and doubled estimate of carbon storage, Nat. Geosci., 12, 917–921, https://doi.org/10.1038/s41561-019-0454-z, 2019.
Pallandt, M. M. T. A., Kumar, J., Mauritz, M., Schuur, E. A. G., Virkkala, A.-M., Celis, G., Hoffman, F. M., and Göckede, M.: Representativeness assessment of the pan-Arctic eddy covariance site network and optimized future enhancements, Biogeosciences, 19, 559–583, https://doi.org/10.5194/bg-19-559-2022, 2022.
Pedregosa, F., Varoquaux, G., Gramfort, A., Michel, V., Thirion, B., Grisel, O., Blondel, M., Prettenhofer, P., Weiss, R., Dubourg, V., Vanderplas, J., Passos, A., Cournapeau, D., Brucher, M., Perrot, M., and Duchesnay, É.: Scikit-learn: machine learning in python, J. Mach. Learn. Res., 12, 2825–2830, 2011.
Pongracz, A., Wårlind, D., Miller, P. A., Gustafson, A., Rabin, S. S., and Parmentier, F.-J. W.: Warming-induced contrasts in snow depth drive the future trajectory of soil carbon loss across the Arctic-Boreal region, Commun. Earth Environ., 5, 684, https://doi.org/10.1038/s43247-024-01838-1, 2024.
Rafat, A., Byun, E., Rezanezhad, F., Quinton, W. L., Humphreys, E. R., Webster, K., and Van Cappellen, P.: The definition of the non-growing season matters: a case study of net ecosystem carbon exchange from a Canadian peatland, Environ. Res. Commun., 4, 021003, https://doi.org/10.1088/2515-7620/ac53c2, 2022.
Rantanen, M., Karpechko, A. Y., Lipponen, A., Nordling, K., Hyvärinen, O., Ruosteenoja, K., Vihma, T., and Laaksonen, A.: Arctic warming amplification, Commun. Earth Environ., 3, 1–10, https://doi.org/10.1038/s43247-022-00498-3, 2022.
Rantanen, M., Lee, S. H., and Aalto, J.: Asymmetric warming rates between warm and cold weather regimes in Europe, Atmos. Sci. Lett., 24, e1178, https://doi.org/10.1002/asl.1178, 2023.
Raz-Yaseef, N., Torn, M. S., Wu, Y., Billesbach, D. P., Liljedahl, A. K., Kneafsey, T. J., Romanovsky, V. E., Cook, D. R., and Wullschleger, S. D.: Large CO2 and CH4 emissions from polygonal tundra during spring thaw in northern Alaska, Geophys. Res. Lett., 44, 504–513, https://doi.org/10.1002/2016GL071220, 2017.
Rinne, J., Tuovinen, J.-P., Klemedtsson, L., Aurela, M., Holst, J., Lohila, A., Weslien, P., Vestin, P., Łakomiec, P., Peichl, M., Tuittila, E.-S., Heiskanen, L., Laurila, T., Li, X., Alekseychik, P., Mammarella, I., Ström, L., Crill, P., and Nilsson, M. B.: Effect of the 2018 European drought on methane and carbon dioxide exchange of northern mire ecosystems, Philos. T. R. Soc. B, 375, 20190517, https://doi.org/10.1098/rstb.2019.0517, 2020.
Riutta, T., Laine, J., and Tuittila, E.-S.: Sensitivity of CO2 Exchange of Fen Ecosystem Components to Water Level Variation, Ecosystems, 10, 718–733, https://doi.org/10.1007/s10021-007-9046-7, 2007.
Ruosteenoja, K., Jylhä, K., and Kämäräinen, M.: Climate Projections for Finland Under the RCP Forcing Scenarios, Geophysica, 51, 17–50, 2016
See, C. R., Virkkala, A.-M., Natali, S. M., Rogers, B. M., Mauritz, M., Biasi, C., Bokhorst, S., Boike, J., Bret-Harte, M. S., Celis, G., Chae, N., Christensen, T. R., Murner (Connon), S. J., Dengel, S., Dolman, H., Edgar, C. W., Elberling, B., Emmerton, C. A., Euskirchen, E. S., Göckede, M., Grelle, A., Heffernan, L., Helbig, M., Holl, D., Humphreys, E., Iwata, H., Järveoja, J., Kobayashi, H., Kochendorfer, J., Kolari, P., Kotani, A., Kutzbach, L., Kwon, M. J., Lathrop, E. R., López-Blanco, E., Mammarella, I., Marushchak, M. E., Mastepanov, M., Matsuura, Y., Merbold, L., Meyer, G., Minions, C., Nilsson, M. B., Nojeim, J., Oberbauer, S. F., Olefeldt, D., Park, S.-J., Parmentier, F.-J. W., Peichl, M., Peter, D., Petrov, R., Poyatos, R., Prokushkin, A. S., Quinton, W., Rodenhizer, H., Sachs, T., Savage, K., Schulze, C., Sjögersten, S., Sonnentag, O., St. Louis, V. L., Torn, M. S., Tuittila, E.-S., Ueyama, M., Varlagin, A., Voigt, C., Watts, J. D., Zona, D., Zyryanov, V. I., and Schuur, E. A. G.: Decadal increases in carbon uptake offset by respiratory losses across northern permafrost ecosystems, Nat. Clim. Chang., 14, 853–862, https://doi.org/10.1038/s41558-024-02057-4, 2024.
Sullivan, B. W., Dore, S., Montes-Helu, M. C., Kolb, T. E., and Hart, S. C.: Pulse Emissions of Carbon Dioxide during Snowmelt at a High-Elevation Site in Northern Arizona, U.S.A, Arct. Antarct. Alp. Res., 44, 247–254, https://doi.org/10.1657/1938-4246-44.2.247, 2012.
Ulaby, F. T., Moore, R. K., and Fung, A. K.: Microwave Remote Sensing, Active and Passive: Volume II, Radar Remote Sensing and Surface Scattering and Emission Theory, Longman Higher Education, 634 pp., ISBN 978-0890061916, 1982.
Virkkala, A.-M., Aalto, J., Rogers, B. M., Tagesson, T., Treat, C. C., Natali, S. M., Watts, J. D., Potter, S., Lehtonen, A., Mauritz, M., Schuur, E. A. G., Kochendorfer, J., Zona, D., Oechel, W., Kobayashi, H., Humphreys, E., Goeckede, M., Iwata, H., Lafleur, P. M., Euskirchen, E. S., Bokhorst, S., Marushchak, M., Martikainen, P. J., Elberling, B., Voigt, C., Biasi, C., Sonnentag, O., Parmentier, F.-J. W., Ueyama, M., Celis, G., St.Louis, V. L., Emmerton, C. A., Peichl, M., Chi, J., Järveoja, J., Nilsson, M. B., Oberbauer, S. F., Torn, M. S., Park, S.-J., Dolman, H., Mammarella, I., Chae, N., Poyatos, R., López-Blanco, E., Christensen, T. R., Kwon, M. J., Sachs, T., Holl, D., and Luoto, M.: Statistical upscaling of ecosystem CO2 fluxes across the terrestrial tundra and boreal domain: Regional patterns and uncertainties, Glob. Change Biol., 27, 4040–4059, 2021.
Virkkala, A.-M., Natali, S. M., Rogers, B. M., Watts, J. D., Savage, K., Connon, S. J., Mauritz, M., Schuur, E. A. G., Peter, D., Minions, C., Nojeim, J., Commane, R., Emmerton, C. A., Goeckede, M., Helbig, M., Holl, D., Iwata, H., Kobayashi, H., Kolari, P., López-Blanco, E., Marushchak, M. E., Mastepanov, M., Merbold, L., Parmentier, F.-J. W., Peichl, M., Sachs, T., Sonnentag, O., Ueyama, M., Voigt, C., Aurela, M., Boike, J., Celis, G., Chae, N., Christensen, T. R., Bret-Harte, M. S., Dengel, S., Dolman, H., Edgar, C. W., Elberling, B., Euskirchen, E., Grelle, A., Hatakka, J., Humphreys, E., Järveoja, J., Kotani, A., Kutzbach, L., Laurila, T., Lohila, A., Mammarella, I., Matsuura, Y., Meyer, G., Nilsson, M. B., Oberbauer, S. F., Park, S.-J., Petrov, R., Prokushkin, A. S., Schulze, C., St. Louis, V. L., Tuittila, E.-S., Tuovinen, J.-P., Quinton, W., Varlagin, A., Zona, D., and Zyryanov, V. I.: The ABCflux database: Arctic–boreal CO2 flux observations and ancillary information aggregated to monthly time steps across terrestrial ecosystems, Earth Syst. Sci. Data, 14, 179–208, https://doi.org/10.5194/essd-14-179-2022, 2022.
Virkkala, A.-M., Wargowsky, I., Vogt, J., Kuhn, M. A., Madaan, S., O'Keefe, R., Windholz, T., Arndt, K. A., Rogers, B. M., Watts, J. D., Kent, K., Göckede, M., Olefeldt, D., Rocher-Ros, G., Schuur, E. A. G., Bastviken, D., Aalstad, K., Aho, K., Ala-Könni, J., Alcock, H., Althuizen, I., Arp, C. D., Asanuma, J., Attermeyer, K., Aurela, M., Balathandayuthabani, S., Barr, A., Barret, M., Batkhishig, O., Biasi, C., Björkman, M. P., Black, A., Blanc-Betes, E., Bodmer, P., Boike, J., Bolek, A., Bouchard, F., Bussmann, I., Cabrol, L., Canfora, E., Carey, S., Castro-Morales, K., Chae, N., Christen, A., Christensen, T. R., Christiansen, C. T., Chu, H., Clark, G., Clayer, F., Crill, P., Cunada, C., Davidson, S. J., Dean, J. F., Dengel, S., Detto, M., Dieleman, C., Domine, F., Dyukarev, E., Edgar, C., Elberling, B., Emmerton, C. A., Euskirchen, E., Falvo, G., Friborg, T., Garneau, M., Giamberini, M., Glagolev, M. V., Gonzalez-Meler, M. A., Granath, G., Guðmundsson, J., Happonen, K., Harazono, Y., Harris, L., Hashemi, J., Hasson, N., Heerah, J., Heffernan, L., Helbig, M., Helgason, W., Heliasz, M., Henry, G., Hensgens, G., Hiyama, T., Hock, M., Holl, D., Holmes, B., Holst, J., Holst, T., Hould-Gosselin, G., Humphreys, E., Hung, J., Huotari, J., Ikawa, H., Ilyasov, D. V., Ishikawa, M., Iwahana, G., Iwata, H., Jackowicz-Korczynski, M. A., Jansen, J., Järveoja, J., Jassey, V. E. J., Jensen, R., Jentzsch, K., Jespersen, R. G., Johannesson, C.-F., Jones, C. P., Jonsson, A., Jung, J. Y., Juutinen, S., Kane, E., Karlsson, J., Karsanaev, S., Kasak, K., Kelly, J., Kempton, K., Klaus, M., Kling, G. W., Kljun, N., Knutson, J., Kobayashi, H., Kochendorfer, J., Kohonen, K.-M., Kolari, P., Korkiakoski, M., Korrensalo, A., Kortelainen, P., Koster, E., Koster, K., Kotani, A., Krishnan, P., Kurbatova, J., Kutzbach, L., Kwon, M. J., Kyzivat, E. D., Lagroix, J., Langhorst, T., Lapshina, E., Larmola, T., Larsen, K. S., Laurion, I., Ledman, J., Lee, H., Leffler, A. J., Lesack, L., Lindroth, A., Lipson, D., Lohila, A., López-Blanco, E., St. Louis, V. L., Lundin, E., Luoto, M., Machimura, T., Magnani, M., Malhotra, A., Maljanen, M., Mammarella, I., Männistö, E., Marchesini, L. B., Marsh, P., Martkainen, P. J., Marushchak, M. E., Mastepanov, M., Mavrovic, A., Maximov, T., Minions, C., Montemayor, M., Morishita, T., Murphy, P., Nadeau, D. F., Nicholls, E., Nilsson, M. B., Niyazova, A., Nordén, J., Noumonvi, K. D., Nykanen, H., Oechel, W., Ojala, A., Okadera, T., Pal, S., Panov, A. V., Papakyriakou, T., Papale, D., Park, S.-J., Parmentier, F.-J. W., Pastorello, G., Peacock, M., Peichl, M., Petrov, R., St. Pierre, K., Pirk, N., Plein, J., Preskienis, V., Prokushkin, A., Pumpanen, J., Rains, H. A., Rakos, N., Räsänen, A., Rautakoski, H., Rinnan, R., Rinne, J., Rocha, A., Roulet, N., Roy, A., Rutgersson, A., Sabrekov, A. F., Sachs, T., Sahlée, E., Salazar, A., Sawakuchi, H. O., Schulze, C., Seco, R., Sepulveda-Jauregui, A., Serikova, S., Serrone, A., Silvennoinen, H. M., Sjogersten, S., Skeeter, J., Snöälv, J., Sobek, S., Sonnentag, O., Stanley, E. H., Strack, M., Strom, L., Sullivan, P., Sullivan, R., Sytiuk, A., Tagesson, T., Taillardat, P., Talbot, J., Tank, S. E., Tenuta, M., Terenteva, I., Thalasso, F., Thiboult, A., Thorgeirsson, H., Garcia Tigreros, F., Torn, M., Townsend-Small, A., Treat, C., Tremblay, A., Trotta, C., Tuittila, E.-S., Turetsky, M., Ueyama, M., Umair, M., Vähä, A., van Delden, L., van Hardenbroek, M., Varlagin, A., Varner, R. K., Veretennikova, E., Vesala, T., Virtanen, T., Voigt, C., Vonk, J. E., Wagner, R., Walter Anthony, K., Wang, Q., Watanabe, M., Webb, H., Welker, J. M., Westergaard-Nielsen, A., Westermann, S., White, J. R., Wille, C., Williamson, S. N., Zolkos, S., Zona, D., and Natali, S. M.: ABCFlux v2: Arctic–boreal CO2 and CH4 monthly flux observations and ancillary information across terrestrial and freshwater ecosystems, Earth Syst. Sci. Data Discuss. [preprint], https://doi.org/10.5194/essd-2025-585, in review, 2025.
Wang, H., Yu, L., Chen, L., Zhang, Z., Li, X., Liang, N., Peng, C., and He, J.-S.: Carbon fluxes and soil carbon dynamics along a gradient of biogeomorphic succession in alpine wetlands of Tibetan Plateau, Fundam. Res., 3, 151–159, https://doi.org/10.1016/j.fmre.2022.09.024, 2023.
Watts, J. D., Farina, M., Kimball, J. S., Schiferl, L. D., Liu, Z., Arndt, K. A., Zona, D., Ballantyne, A., Euskirchen, E. S., Parmentier, F.-J. W., Helbig, M., Sonnentag, O., Tagesson, T., Rinne, J., Ikawa, H., Ueyama, M., Kobayashi, H., Sachs, T., Nadeau, D. F., Kochendorfer, J., Jackowicz-Korczynski, M., Virkkala, A., Aurela, M., Commane, R., Byrne, B., Birch, L., Johnson, M. S., Madani, N., Rogers, B., Du, J., Endsley, A., Savage, K., Poulter, B., Zhang, Z., Bruhwiler, L. M., Miller, C. E., Goetz, S., and Oechel, W. C.: Carbon uptake in Eurasian boreal forests dominates the high-latitude net ecosystem carbon budget, Glob. Change Biol., 29, 1870–1889, https://doi.org/10.1111/gcb.16553, 2023.
Wei, J., Li, X., Liu, L., Christensen, T. R., Jiang, Z., Ma, Y., Wu, X., Yao, H., and López-Blanco, E.: Radiation, soil water content, and temperature effects on carbon cycling in an alpine swamp meadow of the northeastern Qinghai–Tibetan Plateau, Biogeosciences, 19, 861–875, https://doi.org/10.5194/bg-19-861-2022, 2022.
Wutzler, T., Lucas-Moffat, A., Migliavacca, M., Knauer, J., Sickel, K., Šigut, L., Menzer, O., and Reichstein, M.: Basic and extensible post-processing of eddy covariance flux data with REddyProc, Biogeosciences, 15, 5015–5030, https://doi.org/10.5194/bg-15-5015-2018, 2018.
Yao, H., Peng, H., Hong, B., Guo, Q., Ding, H., Hong, Y., Zhu, Y., Cai, C., and Chi, J.: Environmental Controls on Multi-Scale Dynamics of Net Carbon Dioxide Exchange From an Alpine Peatland on the Eastern Qinghai-Tibet Plateau, Front. Plant Sci., 12, https://doi.org/10.3389/fpls.2021.791343, 2022.
Yu, Z., Beilman, D. W., Frolking, S., MacDonald, G. M., Roulet, N. T., Camill, P., and Charman, D. J.: Peatlands and Their Role in the Global Carbon Cycle, Eos T. AGU, 92, 97–98, https://doi.org/10.1029/2011EO120001, 2011.