
the Creative Commons Attribution 4.0 License.
the Creative Commons Attribution 4.0 License.
 | 07 Sep 2026
Introducing relative pollen productivity estimates for Iberian taxa: methodological insights and implications for landscape modelling in the Western Mediterranean

Vojtěch Abraham
Miguel Sevilla-Callejo
Xavier Font
Héctor Romanos
Eduardo García-Prieto
Josu Aranbarri
Maria Leunda
Michelle Farrell
Fátima Franco-Múgica
Michela Mariani
Florence Mazier
Helios Sainz-Ollero
Penélope González-Sampériz
Graciela Gil-Romera
Understanding the impact of ongoing global change on plant communities requires long-term quantitative reconstructions of past vegetation dynamics. Fossil pollen records offer one of the most powerful tools to reconstruct past landscapes, yet for their accurate interpretation it is important to take into account the differential pollen productivity of plant taxa. For southern Europe, and particularly for the Iberian Peninsula, estimates of pollen productivity remain scarce, limiting our ability to refine palaeoecological reconstructions.
Here we present the first relative pollen productivity estimates (RPPs) for 21 common taxa in continental Spain. For that purpose, we used 1113 modern pollen samples from our own surveys and the Eurasian Modern Pollen Database (EMPD2), and vegetation data from the Spanish Forestry Map (MFE) and the Iberian and Macaronesian Vegetation Information System (SIVIM). RPPs were derived by applying an optimisation algorithm with the REVEALS model (REgional VEgetation Estimates from Large Sites). To test the reliability of our RPPs, we validated 8 arboreal taxa in 27 present-day coretops across Spain. We also compared the obtained RPPs with different studies across Europe, using a bias-free comparison framework.
Our findings indicate that the dominant arboreal taxa (Pinus, evergreen and deciduous Quercus) are high pollen producers, whereas temperate forest, shrub and herbaceous taxa generally yielded medium to low estimates of pollen productivity. Validation of arboreal taxa from present-day coretops showed that REVEALS-based estimates perform better than raw pollen counts when compared with present-day vegetation cover. Comparison between different studies in Europe also showed that most of the Spanish RPPs are similar to those obtained in Europe, although notable differences emerged for some taxa.
This study calculates, validates and compares the first RPPs in the Western Mediterranean, highlighting the value of quantitative palaeoecological data for Holocene landscape reconstructions. The findings of this paper would support that the Iberian Peninsula could have been home to a heterogeneous mosaic of open areas, conifers and broadleaf trees, offering new frameworks to improve both palaeoecological reconstructions and contemporary forest management strategies. Note: nomenclature and authority of the taxa in this paper were selected according to Flora Iberica (Castroviejo, 1986–2012).
- Article
(8352 KB) - Full-text XML
-
Supplement
(3522 KB) - BibTeX
- EndNote


Science for mitigation and adaptation to global change needs to quantify how much landscapes changed under the pressure of climate variability and human agency. Acquiring a numerically detailed understanding of changes in land use and vegetation cover through time is crucial to establish reliable environmental models of the impacts of past climate change on plant communities.
Likewise, land cover reconstructions are crucial to reconstruct changes in land use (Fyfe et al., 2015; Pearce et al., 2023; Roberts et al., 2018; Trondman et al., 2014; Woodbridge et al., 2019). A central challenge in palaeoecology is to determine not only how vegetation cover varied in space and time, but also how these changes interacted with the physical environment and disturbance regimes. This involves asking key palaeoecological questions shaped by some of the long-standing debates over the historical structure and dynamics of European landscapes. Some influential and controversial hypotheses (e.g., Svenning, 2002; Vera, 2000) dispute the traditional view of densely forested wilderness (Bradshaw and Mitchell, 1999; Ellenberg, 1988; Peterken, 2001). Instead, they propose that large herbivores and disturbance regimes maintained extensive areas of semi-open habitats across much of postglacial Europe. This debate continues today, supported by robust palaeoecological data used to evaluate these hypotheses (Pearce et al., 2023). Recent studies increasingly suggest that postglacial Europe had a mixed composition of both closed forests and open areas (Carrión et al., 2010a; Nikulina et al., 2024; Pearce et al., 2025a), highlighting that the drivers of vegetation openness extend beyond climatic and human influences and emphasising the significant roles of large herbivores (Pearce et al., 2025b).
Accurate reconstruction of forest structure and baseline conditions for ecological restoration largely depends on pollen-based land cover reconstructions, which are not only vital for unravelling the long-term interplay between ecological and human processes, but also for producing reliable regional and global climate models and biogeochemical cycles (Abrantes et al., 2012; Cheddadi et al., 1998; Li et al., 2011; Liu et al., 2023). Integrating quantitative pollen data with diachronic cartography and multi-proxy evidence is also crucial to reconstruct the effects of past disturbances (Githumbi et al., 2022; Pirzamanbein et al., 2014, 2020; Zanon et al., 2018) – including fire, human deforestation and herbivory – allowing us to quantify biomass affected over time and the spatial extent of disturbance regimes and to disentangle overlapping effects of natural and anthropogenic drivers (Ellis, 2021; Morrison et al., 2021; Nikulina et al., 2024; Pearce et al., 2025b).
In this regard, pollen records are the most widely used proxy records for past vegetation reconstruction (Andersen, 1970; Broström et al., 2008; Davis, 1963; Huntley, 1990; Sugita, 1994; Von Post, 1918). Indeed, one of the main goals of pollen analysis is to reconstruct past plant abundances. However, it has long been known that there is a lack of linearity between pollen presence and abundance of the producing plant taxa (Andersen, 1970; Davis, 1963; Prentice and Parsons, 1983; Sugita, 1994), resulting in some taxa being overrepresented in fossil pollen records due to their high productivity and effective dispersal, while others may be underrepresented owing to low productivity and limited dispersal capacity (Davis, 1963). This discrepancy can lead to biased reconstructions of past vegetation and land cover (Prentice and Webb, 2009; Sugita, 1994).
Thus, rigorous estimation of the composition of past vegetation relies on our ability to better comprehend and quantify the relationships between fossil pollen assemblages and the composition of the vegetation that produces them.
A first step in the quantitative reconstruction of Quaternary vegetation using fossil pollen records requires calculating the relative pollen productivity estimates (RPPs/PPEs) for the taxa whose land cover we aim to reconstruct. Pollen productivity is often defined as the number of pollen grains produced per unit relative abundance of a given taxon, and is usually expressed as a dimensionless ratio relative to a reference taxon, since absolute pollen production measurement is difficult to determine (Andersen, 1970). Relative pollen productivity estimates (hereafter referred to as RPPs) are one of the critical parameters required to produce a reliable model of past vegetation abundance, as they enable correction of under or over estimations of taxa abundance.
RPPs have been calculated for many regions of northern and central Europe in the last decades (Abraham and Kozáková, 2012; Baker et al., 2016; Broström et al., 2004; Bunting et al., 2005; Grindean et al., 2019; Hjelle, 1998; Kuneš et al., 2019; Mazier et al., 2008; Nielsen, 2004; Niemeyer et al., 2015; Poska et al., 2011; Soepboer et al., 2007; Theuerkauf et al., 2013). RPPs have also been calculated in the eastern Mediterranean (Ergin et al., 2024), as well as in North America (Calcote, 1995; Chaput and Gajewski, 2018; Commerford et al., 2013), Africa (Duffin and Bunting, 2008; Tabares et al., 2021), Asia (Han et al., 2017; He et al., 2016; Jiang et al., 2020) and Oceania (Mariani et al., 2016, 2022). Despite the abundance of RPP studies for different taxa in mid or high European latitudes, other regions of the world remain understudied. One example is the five Mediterranean-climate regions (MCRs) of the world. Despite occupying less than 5 % of the Earth's surface, they host about 48 250 known vascular plant species (Cowling et al., 1996) and yet, there are very few RPPs existing in these areas (Ergin et al., 2024; Githumbi et al., 2022). The MCRs also represent a critical biome for understanding long-term human-landscape relationships as the Mediterranean Basin in particular represents a very long history of human occupation and therefore ecosystem change, resilience or persistence, besides a particularly vulnerable scenario regarding current global change and future warming (IPCC, 2023). The lack of RPPs for MCRs precludes any quantitative land cover reconstruction from fossil records in these areas, although efforts have been recently made to obtain new RPPs for some Mediterranean areas (Ergin et al., 2024; Githumbi et al., 2022; Serge et al., 2023). The fact that all previous numerical approaches have been conducted in mixed temperate forests or in subtropical areas implies that the complexity of Mediterranean plant communities has rarely been considered in these attempts.
Some of the available RPPs for northern European taxa could potentially be of use in the Mediterranean Basin, but it is well-known that pollen productivity might be driven by a number of geographical factors, plant taxonomy and climate constraints (Baker et al., 2016; Broström et al., 2004, 2008). Often, RPPs for the same taxa may differ due to methodological issues at the data resolution and landscape characterisation level, and from a number of methodological assumptions (Liu et al., 2022). These inconsistencies challenge the transferability of RPPs beyond their original context and, consequently, their application is often restricted to localised settings (Liu et al., 2022). Essentially, having a robust estimate of pollen productivity for taxa of a particular region implies considering all these factors and thus obtaining new RPPs.
In the present work, our objectives are: (1) to produce RPPs for 21 woody and herbaceous taxa across the Spanish Territory of Iberia (STI, from now on), (2) to validate the obtained results using present-day pollen samples from coretops within the region and (3) to compare our results with those from other European RPP studies. STI holds one of the greatest ecosystem, habitat and plant species diversities of Europe (Maestre et al., 2021; Médail and Quézel, 1999; Mutke et al., 2010) and comprises two biogeographical domains: the Mediterranean region, which accounts for about 70 % of the STI, and the Eurosiberian region, located in the northernmost areas of the STI (∼ 30 %). Our work is the first comprehensive study conducted in Iberia to obtain relative pollen productivity estimates, and it represents the first step towards the quantitative reconstruction of past landscapes framework in the Western Mediterranean, and particularly in STI.
2.1 Study area
The study area covers the whole of continental Spain (504 782 km2) including the two biogeographical regions, Eurosiberian and Mediterranean.
2.1.1 Mediterranean biogeographic region
The Mediterranean region extends throughout most of the STI, covering all of the central and eastern region except for the mountain and alpine areas. STI exhibits remarkable climatic diversity, largely driven by its complex topography and geographic position. Mean annual temperatures (MAT) range from approximately 8 °C in the interior plateaus and mountainous regions to around 18 °C along the Mediterranean coast (Fig. 1). In alpine zones of the Mediterranean (Southern Spain), MAT often falls below 8 °C. Precipitation patterns are equally heterogeneous: while the national mean annual precipitation (MAP) is around 500 mm, values vary widely – from 1000–1500 mm in mountainous areas to as low as 200–600 mm in coastal and plateau regions (Chazarra et al., 2018) (Fig. 1). This climatic variability underpins the country's exceptional ecological and floristic diversity, resulting in a variety of habitats and landscapes.
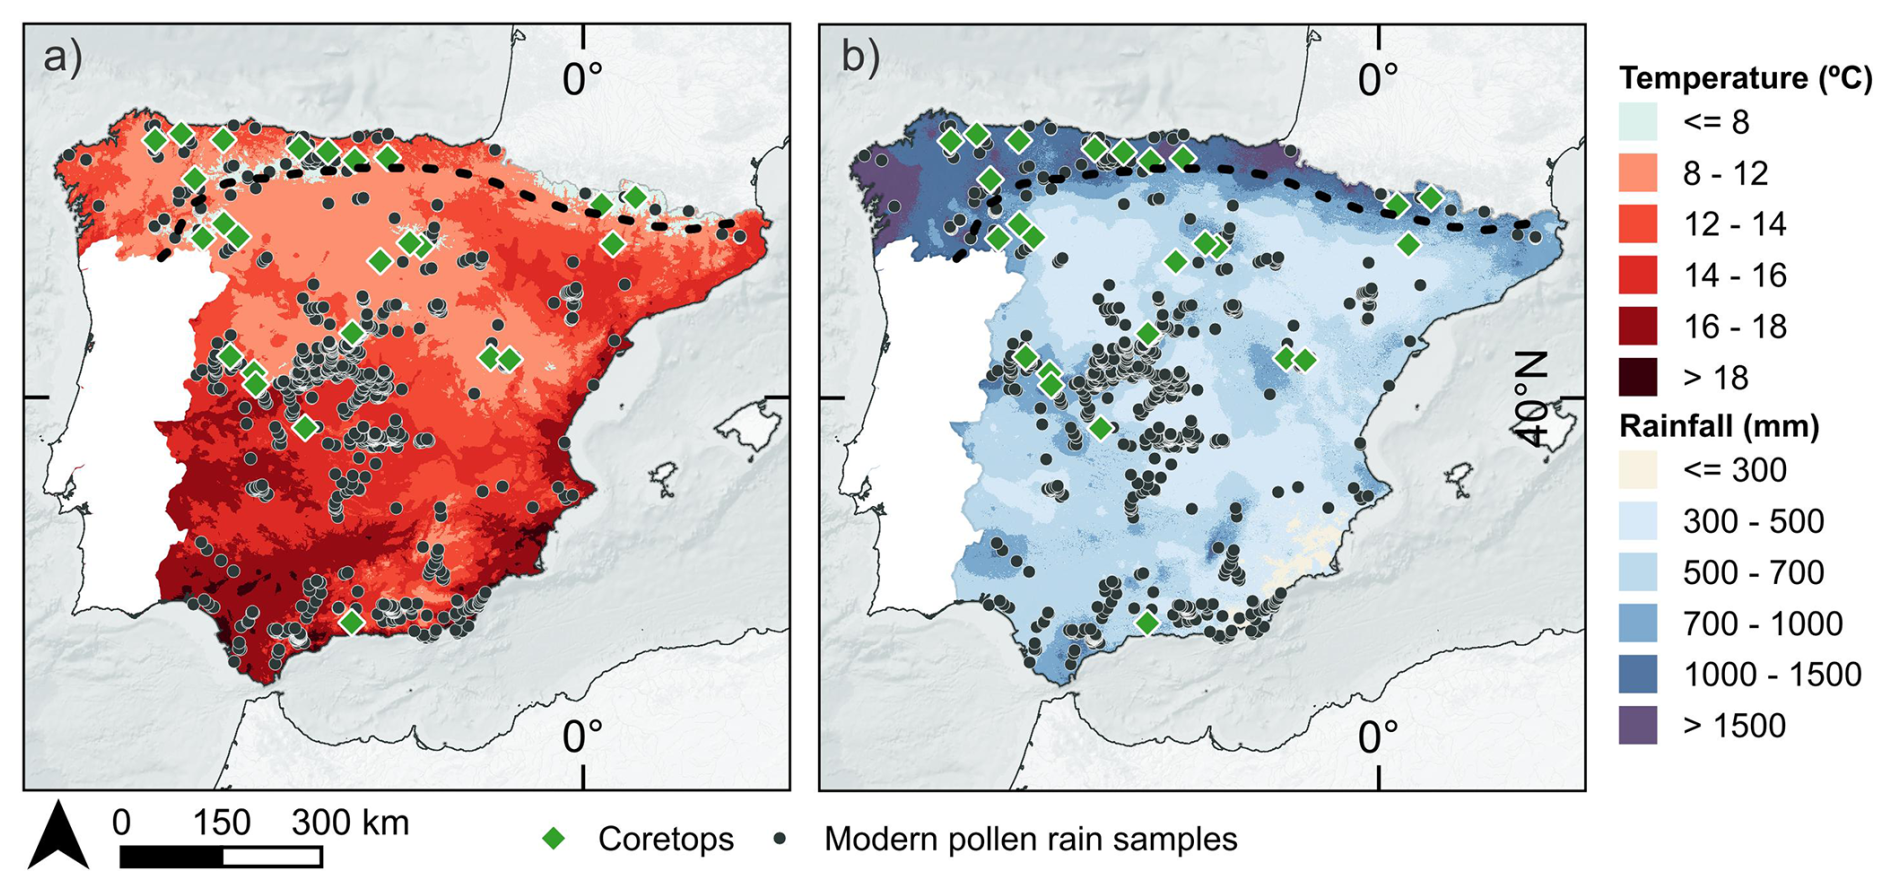
Figure 1(a) Mean annual temperature (MAT, °C) and (b) mean annual precipitation (MAP, mm) in continental Spain (Ninyerola et al., 2005). Black dots represent the locations of the surface samples used in this study; green diamonds represent the coretops used for validation. Black dashed line delimits the bioclimatic regions, Eurosiberian in the North, Mediterranean in the South.
Mediterranean forest ecosystems cover two thirds of the total wooded region in the STI (Costa et al., 1998). These woody communities are physiognomically diverse and vary from shrub to dense mature forests, and from thorny, macchia-like temperate steppes to cold semi-deserts (Costa et al., 1998; Gavilán et al., 2018). Mediterranean forests, structured along a marked altitudinal gradient, are predominantly monospecific, although they are occasionally mixed with other woody species. These are mainly evergreen sclerophyllous taxa, though sometimes deciduous taxa are also present (Fig. 2).
In coastal and lowland areas (0–400 m a.s.l.) macchia and garrigue-type shrublands, grasslands and forests of different species of Pinus (P. halepensis Mill., P. pinaster Aiton, P. pinea L.) are dominant. Some other pines can also be found in the Mediterranean foothills and mountain belts (400–1200 m a.s.l.): P. sylvestris L. (Scots pine), P. nigra subsp. salzmanii (Dunal) Franco, P. nigra subsp. nigra J.F. Arnold (black pine) and those from lowland areas, along with the main oak taxa of Mediterranean sclerophyllous forests, Quercus ilex L. and Q. suber L. (holm and cork oak woodlands, Fig. 2). These forests appear often combined with Juniperus spp. communities (J. thurifera L., J. phoenicea L., J. communis L., J. oxycedrus L., or J. sabina L.), which are quite characteristic of the plateau-continental STI, including open areas that rarely form continuous canopy forests. Oak, pine and juniper communities are all adapted to periods of aridity that may vary from two to nine months of the year. Some woodlands in the Mediterranean mountains also support deciduous taxa such as birch (Betula pendula Roth., B. alba L.) and ash (Fraxinus excelsior Vahl., F. angustifolia L.), as well as some semi-deciduous oak species such as Q. faginea Lam. and Q. pyrenaica Willd. Relics of Abies pinsapo Boiss. are also found in the mountain ranges of Southern Spain.
Mountain vegetation (>1200 m a.s.l.) often presents continuous arboreal cover as, over the last decades, forest recovery in previously managed montane regions has produced denser forest communities. Yet, these montane-subalpine regions also host patchy plant communities where forests blend with open ecosystems. Some species of juniper (J. phoenicea and J. thurifera) as well as mountain and Scots pine (P. sylvestris, P. uncinata Ramond ex DC. in Lam. & DC.) are present. This vegetation belt is also characterised by sparse shrubs and grasses.
Cultivated olive trees (Olea europaea L.) are very extensive in the southern half of Spain (see Fig. S1 in the Supplement), and often appear in the wild in shrubby habitat in the eastern half of Spain. The olive tree is a key Mediterranean taxon that existed in Iberia before domestication, represented since at least the Upper Pleistocene in continental records (i.e., Fernández et al., 2007; González-Sampériz et al., 2020) and even the Early Pleistocene in the marine cores of Portugal and Spain (Magri et al., 2017), but started to expand during the Early Holocene (Langgut et al., 2019), with cultivation beginning during the late Middle Holocene and intensifying during the last 4000 years (Carrión et al., 2010b; Martín-Puertas et al., 2008).
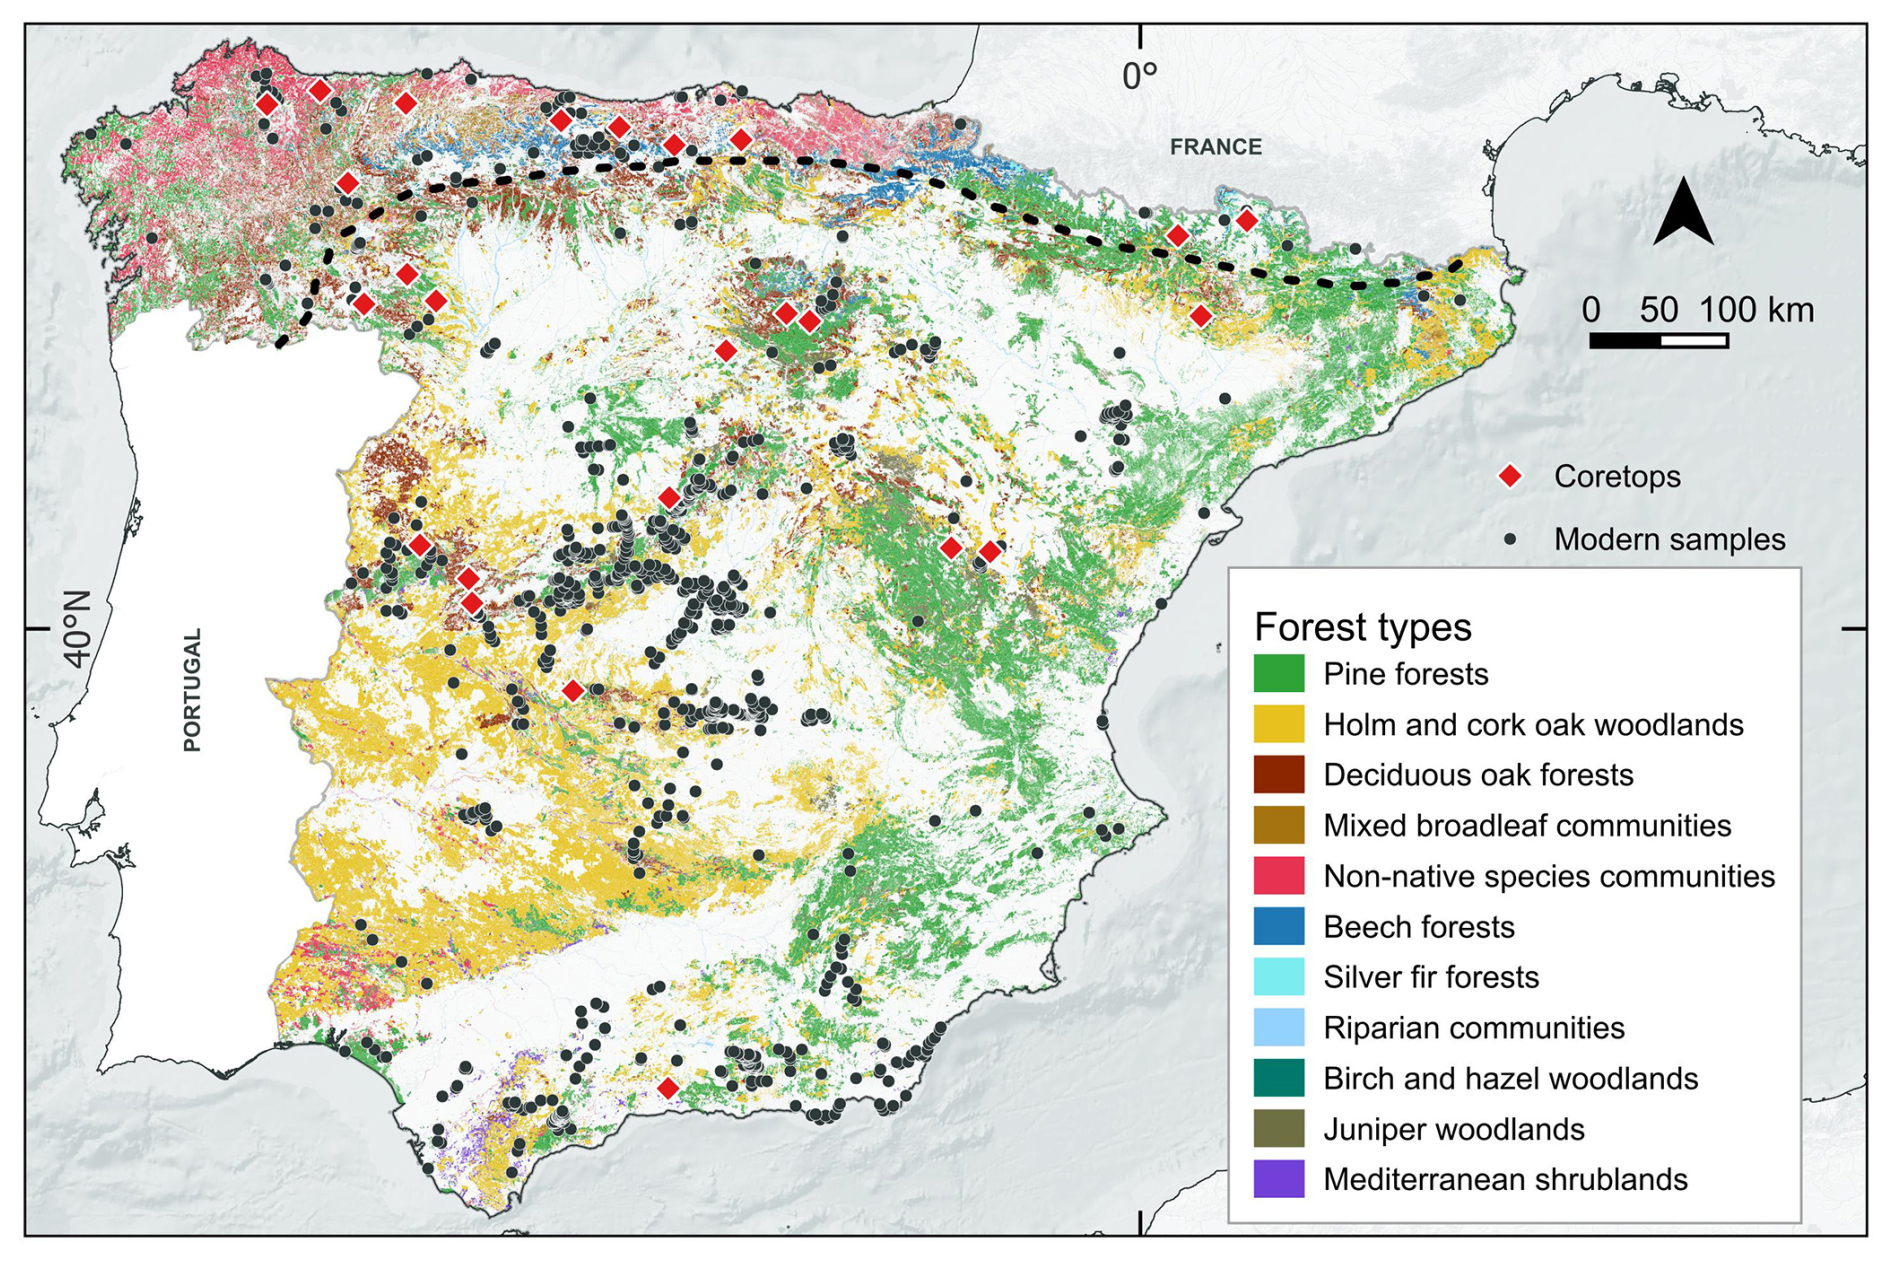
Figure 2Main forest types in the Iberian Peninsula (MITECO, 2024). Black dots represent the locations of the surface samples used; red diamonds represent the coretops used for validation. Black dashed line delimits both bioclimatic regions.
2.1.2 Eurosiberian biogeographic region
The Eurosiberian or Atlantic region lies in the northern area of the STI, including the Cantabrian range and the Pyrenees. Climatic conditions are characterised by cold winters and mild summers, with MAT ranging from 5 °C in the mountainous areas to 14 °C in the coastal areas (Fig. 1). Drought periods are shorter with abundant and well-distributed rainfall throughout the year, with MAP ranging from 1000 to 2000 mm.
Forest composition differs considerably from that of the Mediterranean region. In coastal areas (0–300 m a.s.l.), vegetation has been severely affected by invasive alien species (“Non-native species communities” group in Fig. 2), especially by Pinus radiata D. Don and Eucalyptus spp. L'Hér., both of which were cultivated for reforestation and industrial timber production but are now naturalised. Forests dominate in montane areas (300–1000 m a.s.l. in the Cantabrian range; 1000–1600 m a.s.l. in the Pyrenees). These forests are deciduous or semi-deciduous mixed communities of oaks (Q. robur L., Q. petraea (Matt.) Liebl., Q. pyrenaica), beech (Fagus sylvatica L.), birch (Betula alba, B. pendula), ash (Fraxinus angustifolia, F. excelsior), hazel (Corylus avellana L.) and other mesic taxa (“Mixed broadleaf communities group in Fig. 2) that rarely form monospecific communities (Sorbus aria (L.) Crantz, S. aucuparia L., Acer monsspesulanum L., A. opalus Mill., A. campestre L., Tilia cordata Mill., T. platyphyllos Scop., Juglans nigra L., J. regia L., Castanea sativa Mill.). Atlantic mountains support conifers such as Pinus sylvestris or P. uncinata (Fig. 2), or other conifers such as Abies alba Mill. (silver fir), which often form mixed forests with beech in the Pyrenees (Fig. 2). Subalpine vegetation (1600–2400 m a.s.l.) is characterised by sparse shrub and grasses, which are heavily grazed by livestock, although conifers such as Scots and mountain pines can still be present, as well as the silver fir. Mountain pine marks the alpine tree line (>2400 m a.s.l.), above which only grasslands and cushion plant communities can resist the severe climatic stress found at these altitudes.
2.2 Quantitative pollen-vegetation relationships
Brief overview of existing methods
Pollen-vegetation models have expanded over the last decades from those based solely on pollen/vegetation ratios (Davis, 1963), linear regressions and extended R-values (ERV) (Parsons and Prentice, 1981; Prentice and Parsons, 1983; Sugita, 1994), to the Landscape Reconstruction Algorithm (Sugita et al., 2010) and the most recent Bayesian models (Dawson et al., 2016; Garreta et al., 2012; Liu et al., 2022; Veeken et al., 2022).
One of the first attempts to develop appropriate techniques that account for pollen productivity and dispersal was made by Davis (1963): the R-value model. This model assumes that pollen deposition rates are directly proportional to abundances, each taxon having a characteristic constant of proportionality, i.e., an R-value (Prentice and Parsons, 1983). The R-value would designate the ratio between pollen percentage and vegetation percentage for each taxon. Parsons and Prentice (1981) developed the Extended R-value (ERV) method, introducing two submodels (ERV-1 and 2) to overcome the statistical limitations of ratios, site-to-site variability, and the effects of long-distance pollen transport. ERV-1 expressed the background component (non-local pollen) as “a constant background pollen percentage for each taxon” while ERV-2 expressed it as “a constant proportion of total forest volume (or whatever measure of abundance is being used)”. A third submodel (ERV-3) assumes a constant absolute amount of background pollen deposition for each taxon at all sites (Sugita, 1994), since the correlation between pollen and vegetation will not improve further beyond a certain distance, introducing the concept of the Relevant Source Area of Pollen (RSAP). As a modification to ERV-3 to address site-to-site taxon variability, Theuerkauf and Couwenberg (2022) developed ERV-4, expressing the background component as a result of the pollen productivity multiplied by the distance-weighted regional plant abundance for each taxon. ERV-1 and 2 use pollen and vegetation percentages, whereas ERV-3 and 4 use pollen percentages and plant abundance data expressed in absolute abundances. In our study area, the application of ERV approaches, whilst possible, would seem logistically challenging due to the large spatial extent, rendering the need for more flexible methods.
Sugita (2007a, b) proposed a new framework for vegetation reconstruction, the Landscape Reconstruction Algorithm (LRA), consisting of two different steps: the REVEALS and LOVE models. The REVEALS (REgional VEgetation Estimates from Large Sites) model is designed to reconstruct regional vegetation composition over large spatial scales (typically >106 ha) by correcting for biases in pollen representation due to differences in pollen productivity and dispersal. It uses pollen data from large lakes or multiple small sites to estimate the relative abundance of plant taxa in the surrounding landscape. This approach accounts for differential pollen production and transport, making it more robust than simple pollen percentage analyses. LOVE (LOcal VEgetation Estimates), on the other hand, focuses on reconstructing vegetation at smaller spatial scales (<104 ha), integrating regional vegetation estimates from REVEALS with local pollen data to separate local vegetation signals from regional background. This two-step framework allows for a hierarchical understanding of vegetation patterns, from broad regional trends to fine-scale local dynamics. The LRA model was developed as an inverse process for the ERV model. Both hold the same assumptions, especially when the REVEALS model uses several small sites rather than one big lake. The most important one is the even (homogeneous) pattern of vegetation (Sugita et al., 1999). This implies that at all sites, on average, all species at all distances should be the same, including the regional vegetation. This can be fulfilled in simulated landscapes, but real landscapes potentially have very large vegetation patches produced by mountains or vegetation belts (Abraham et al., 2014; Fang et al., 2019; Kuneš et al., 2019). If their size is about half or one third the size of the region and if the sampling area falls uniquely into one of these patches, species representation across different distances produces a non-stationary pattern.
More recently, pollen-vegetation models have been parameterised by using Bayesian hierarchical models, which have the primary goal of accounting for the uncertainty of pollen dispersal and production (Dawson et al., 2016; Liu et al., 2022; Paciorek and McLachlan, 2009). These Bayesian approaches, contrary to the ERV, REVEALS and LOVE models, simultaneously estimate pollen productivity and dispersal by finding the parameter values that best explain the sediment pollen data given the known vegetation cover, adapting better to spatial complexity and making them more suitable for regions with diverse vegetation and topography. However, Bayesian approaches to estimating pollen productivity and dispersal are challenging to apply in regions devoid of nearly-continuous sampling strategies (Dawson et al., 2016; Liu et al., 2022; Trachsel et al., 2020). These models, as those from the ERV, typically assume relatively homogeneous forest structure, consistent vegetation composition, and access to fine-scale, spatially resolved vegetation data - conditions that are rarely met in complex landscapes like the Iberian Peninsula. In Iberia, vegetation is highly patchy and spans distinct bioclimatic zones, and available data sources vary in resolution and taxonomic detail, making it difficult to replicate the fine-scale separation between local and regional vegetation required by such models. Additionally, the small size and topographic complexity of most Iberian lakes, along with the presence of unique taxa with distinct dispersal traits, further complicate the direct application of these Bayesian methods. In short, these particularities limit the transferability of the standard Bayesian framework and highlight the need for regional recalibrations.
Our selection to compute RPPs in the Iberian Peninsula
In this study, we have obtained RPPs relative to Poaceae by using the inverted REVEALS method that finds optimal RPP values by comparing REVEALS vegetation estimates from recent pollen spectra with current regional vegetation (Fig. 3). This approach was developed by Abraham et al. (2014) as manual adjustments of RPP values in the performance of the REVEALS model. The next application of inverted REVEALS was made by Kuneš et al. (2019), by integrating the global optimisation algorithm DEoptim (Mullen et al., 2011), which finds the RPP value iteratively and gains higher precision than manual adjustments. The algorithm begins by generating initial candidate RPP values for each taxon, which are then used to compute REVEALS estimates from pollen and vegetation data. The distance between the REVEALS estimates and the observed vegetation is then calculated with a loss function (Eq. 1). To identify the best-fitting RPP values, we iteratively adjusted them to minimise the loss function, using the Generalised Simulated Annealing algorithm, as implemented in the GenSA package in R (Xiang et al., 2013) (Fig. 3). GenSA belongs to a class of stochastic global optimisation techniques particularly well-suited for navigating complex, multidimensional parameter spaces characterised by numerous local minima. Unlike traditional optimisation approaches that may become trapped in suboptimal solutions, Generalised Simulated Annealing leverages probabilistic transitions to explore the solution space more broadly and escape local optima. GenSA is implemented with a C++ core, ensuring computational efficiency and scalability for large ecological datasets.
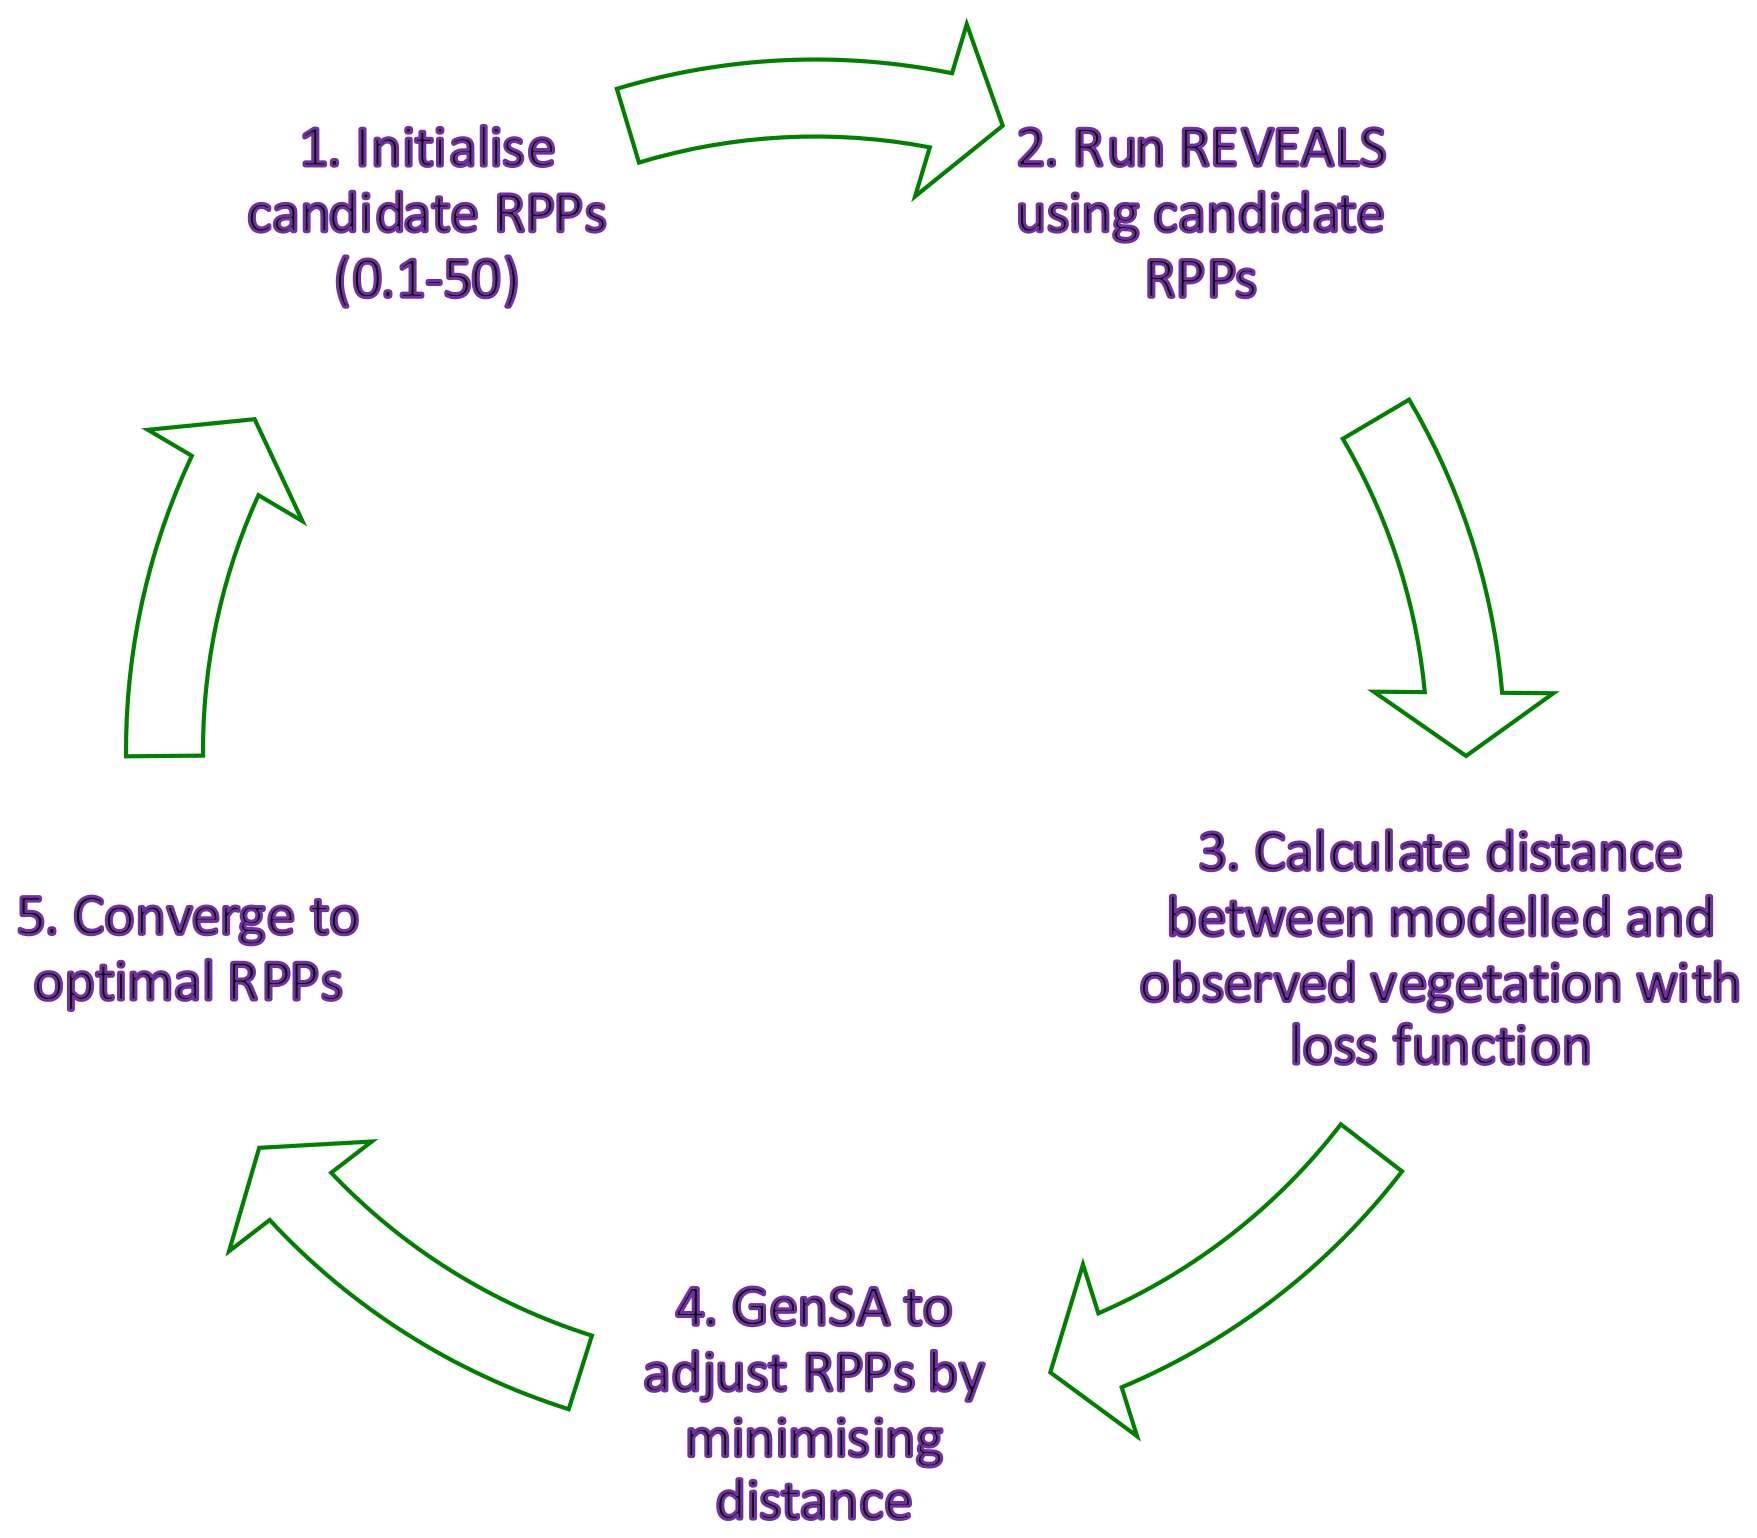
Figure 3The optimisation loop to obtain RPPs. The algorithm starts with trial RPPs for each taxon (1), then uses candidate RPPs to estimate REVEALS from pollen data (2), and calculates distance between modelled and observed vegetation with a loss function (3). By using GenSA, the algorithm iteratively adjusts RPPs to minimise the loss function (4) until optimal RPPs are found (5).
GenSA identifies the optimal set of taxon-specific RPP values that minimises the discrepancy between observed regional vegetation composition and vegetation proportions reconstructed by the REVEALS model. The objective function minimised during optimisation is the weighted sum of squared errors (WSSE) between modelled and observed vegetation proportions across all regions. This approach aligns with the weighted least squares (WLS) regression (Carroll and Ruppert, 1988), although we included a smoothing offset in the denominator to reduce the influence of low-abundance taxa and to avoid division by zero:
where:
-
a: vector of RPP to be estimated
-
R: number of analysed grids
-
m: number of taxa
-
: vegetation proportion for taxon i in region r, reconstructed by REVEALS
-
: = observed vegetation proportion of taxon i in region r.
Retrieving RPPs with the optimisation loop involved first setting the initial range of possible pollen productivity values to 0.1–50 (Fig. 3), meaning that the optimisation function would search for 500 possibilities before displaying the RPPs that gave the smallest distance between observed and reconstructed vegetation proportions. Moreover, we set 500 iterations to ensure the decrease between each run, and bootstrapped 100 resampled versions of all the sites, in order to obtain error estimates. Since such a setup of the parameters requires high computational efforts (500×100 runs per taxon are needed to retrieve a single RPP), we compiled the optimisation function for a better performance by using the “compiler” package, included in base R (R Core Team, 2025). We also parallelised the optimisation process using “foreach” (Folashade et al., 2009) and “doParallel” (Folashade et al., 2011) packages. Full code workflow is provided in the Supplement.
Regarding pollen dispersal, this parameter is crucial for reconstructing past vegetation abundances, although in practice it is not possible to reliably measure long-distance dispersal of airborne particles (Katul et al., 2005). While models for predicting airborne particle dispersal are needed (Kuparinen et al., 2007), the correct model selection according to the studied area is also key. In the present work, we compute the Gaussian Plume and the Lagrangian Stochastic models (GPM and LSM, respectively) to calculate the dispersal and deposition factor. GPMs are the most widely used dispersal models, which describe dispersal patterns based on observations of particles in the atmosphere (Jackson and Lyford, 1999). However, it is known that GPMs are based on observations of the dispersion of larger objects than pollen, and their application to pollen transport can provide an incomplete representation of the full, long-distance, dispersal pattern, underestimating dispersal of heavy pollen grain taxa like Abies (Abraham et al., 2014; Kuparinen, 2006; Mariani et al., 2016; Theuerkauf et al., 2013, 2016; Theuerkauf and Couwenberg, 2020). The weighting factor decreases their distance-weighted plant abundance, and therefore the pollen signal is counterbalanced with high pollen productivity. Since large basins strengthen overestimation of Abies RPP with the GPM model (Abraham et al., 2014), studies with different basin sizes lead to different RPPs for Abies. The LSM (Andersen, 1991; Kuparinen et al., 2007) is a mechanistic model that describes wind and turbulence conditions in the atmosphere, simulating the trajectory of single pollen grains over short and long distances (101–105 m) (Theuerkauf et al., 2013), below, in and above the canopy (Kuparinen, 2006; Theuerkauf, 2025). This paper focuses on LSM-derived RPPs, since they showed lower standard deviations than the GPM-derived RPPs, as well as a better performance during the validation process for Abies and Juniperus. Nevertheless, the results of the GPM-RPPs and their validation are available in the Appendices A and B.
Pollen fall speeds (Tables S1 and S2, Supplement) were retrieved from the literature or calculated following Stoke's law for spherical particles and with Falck's assumption for ellipsoidal grains (Gregory, 1961) using the photographs contained in identification guides (Reille, 1992, 1995).
In short, we have applied a framework using the inverted REVEALS approach (Abraham et al., 2014; Kuneš et al., 2019; Theuerkauf, 2025), i.e., we estimate REVEALS before calculating RPPs, then validated the results using modern coretop samples and compared them with other pollen productivity estimates from Europe (Fig. 4).
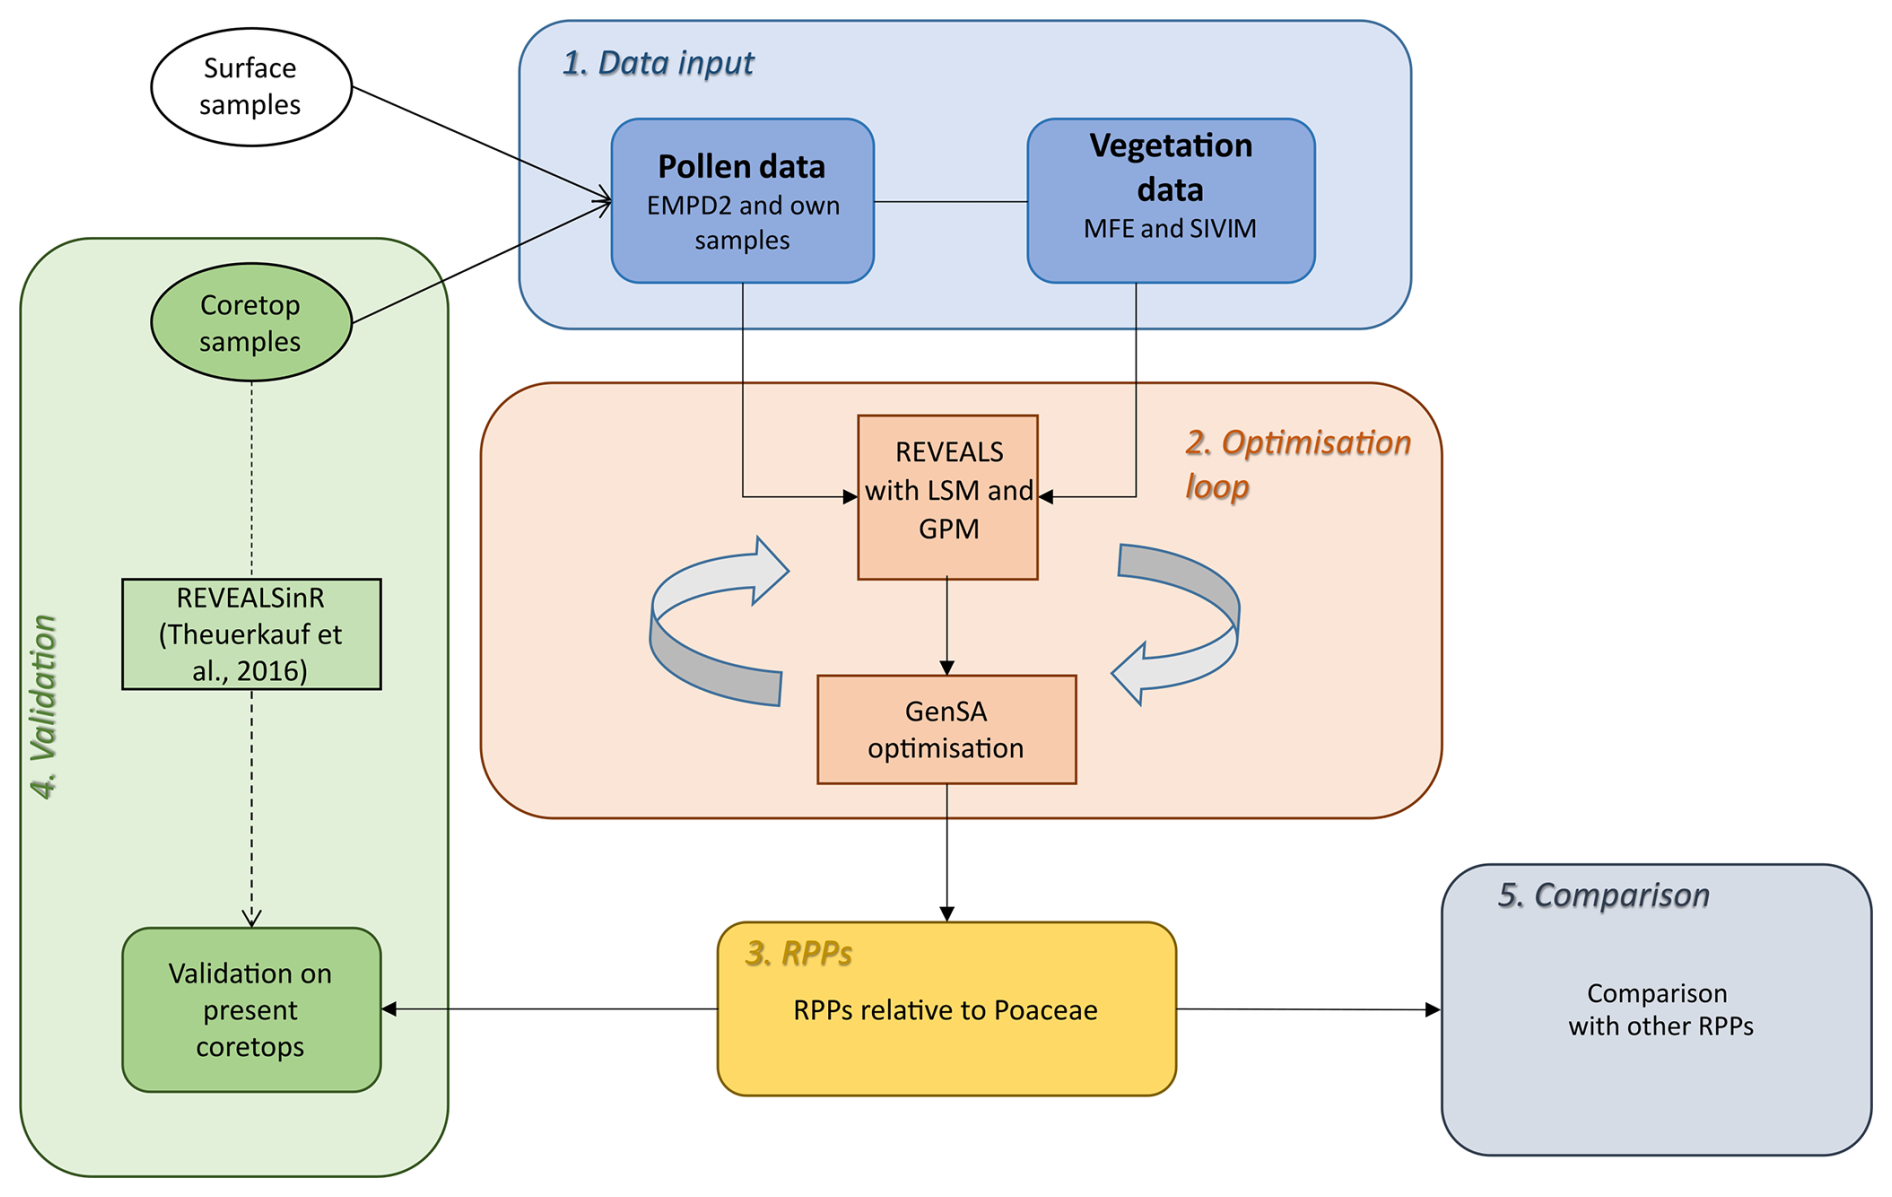
Figure 4Methodological workflow of this study. Pollen data (from surface and coretop samples) and vegetation data were used (1) to calculate present-day REVEALS estimates. Using both a Lagrangian Stochastic dispersal model and the Gaussian Plume model, the GenSA optimisation algorithm was applied (2) to identify the optimal set of RPPs relative to Poaceae, minimising the difference between observed and REVEALS-estimated vegetation proportions (3). The resulting RPPs were validated against present-day coretops (4) and compared with values obtained in other studies (5), following the numerical workflow described in Sect. 2.3 “RPPs comparison across European studies”.
2.2.1 Pollen and vegetation data acquisition
The taxa chosen for RPP computations include the most frequent arboreal types in both present-day STI forests and palynological sequences (Carrión et al., 2022) to which we can attribute pollen types: Abies Mill., Betula L., Corylus L., Fagus L., Pinus L., Olea L., deciduous and evergreen Quercus L. Shrub and herbaceous taxa from frequently represented families and genera in STI vegetation and fossil pollen records have also been included: Amaranthaceae/Chenopodiaceae Juss., Artemisia L., Asteraceae. SF. Asteroideae Lindl., Brassicaceae Burnett, Asteraceae. SF. Cichorioideae Chevall., Erica L., Genista-type (Genista L. and Ulex L.), Juniperus L., Plantago L., Poaceae Juss., Ranunculaceae Juss., Rosaceae Juss. and Rumex L.
Pollen data
Producing the necessary RPPs for STI requires analysis of a large number of sampling points of both modern pollen and vegetation cover. Therefore, we divided the study area into 25 grids of 150×150 km2 each (Fig. S2 in the Supplement). The percentage of pollen for the main taxa was then retrieved for each grid, and compared with regional vegetation data.
We used modern pollen counts from the Eurasian Modern Pollen Database 2 (hereafter referred to as EMPD2) (Davis et al., 2020). According to the EMPD2, the region of continental Spain has the second highest number of samples, with 1110 modern pollen samples taken from terrestrial moss polsters, soils or lake sediments.
We reviewed the sample context and excluded those originating from marine and estuarine environments, resulting in the selection of 1113 samples, of which 70 were obtained through our own field surveys, conducted at various times over the past 30 years. RPPs were then obtained by excluding 51 modern coretops that have been used as a validation set (see Fig. 4 and Sect. 2.2.2 “Validation of RPPs”).
Vegetation data
Present-day arboreal vegetation cover for the 150×150 km2 grids was obtained through the most recently published database of the Spanish Forestry Map (MFE) at a scale of 1:25 000 (MITECO, 2024). MFE classifies the vegetation cover into plant communities for which detailed information on the coverage of the 3 main woody, arboreal or shrub species is provided. We then estimated the forest patch size by multiplying the percentage cover of each main species by the area of the polygon in which it is located.
For shrub and herbaceous taxa we used the relevé-based database Information System on Iberian and Macaronesian Vegetation (SIVIM) (Font et al., 2017). We used all the available plant inventories from SIVIM, amounting to a total of 149 646 surveys where we performed taxa harmonisation according to pollen types (Tables S1 and S2, Supplement).
We derived information on crops and other land uses using the CORINE land cover (CLC) database (European Environment Agency, 2019) so all vegetation types could be analysed, especially in areas where human-modified landscapes are dominant. We spatially intersected CLC polygons with MFE to classify each territory unit according to both land use type and forest cover presence/absence. This dual classification differentiates between areas designated as forest by CLC that indeed retain actual forest cover and those that have undergone deforestation. The resulting landscape matrix was then combined with SIVIM data, which incorporates shrub and herb taxa, to quantify the floristic composition across different landscape contexts and forest cover conditions. Additionally, CLC provided critical information on Olea europaea crop abundance, which is absent from MFE as olive typically represents agricultural rather than natural forest systems.
2.2.2 Validation of RPPs
Validating REVEALS-based vegetation estimates using modern forest composition and raw pollen data requires an independent dataset. Accordingly, we excluded 51 coretop samples from the EMPD2 dataset when deriving RPPs (Fig. 4) to reduce potential circularity. This allowed us to reconstruct vegetation proportions for those sites using our new RPPs, and compare them with actual forest cover. From the 51 coretops validation dataset we chose 27 samples by excluding salt lakes, where the surface samples are often subject to aeolian erosion, and samples under closed canopy or from high elevations where the pollen signal might be biased. The coretops for validation were selected from a variety of landscapes and can be found as a map compilation in Fig. S3 of the Supplement.
We validated RPPs on those 27 samples using the REVEALSinR function from the “disqover' package (Theuerkauf et al., 2016) to account for the productivity and dispersal-deposition biases. Data input requires: (i) pollen counts at each lake site from which the coretop comes; (ii) estimates of pollen productivity and fall speed of pollen for all taxa; (iii) standard errors of the RPPs; (iv) distance-weighting method, for which both the LSM and GPM (Prentice-Sugita dispersal-deposition model) (Sugita, 1994) were selected; (v) basin type (peatland or lake) and diameter in meters for each and; (vi) diameter of the reconstructed region in meters. REVEALS-based estimates of the modern samples were then compared with rings of 15, 30, 45 and 100 km radius of present tree cover around each sample. Only arboreal taxa (disaggregated by taxa) were selected, since herb and shrub taxa data are devoid of surface area information. Regional plant cover for validation was obtained from the MFE, except for Olea (olive crops) which was calculated from the CORINE Land Cover dataset.
Evaluation of the validation process was conducted using a multimetric approach based on four error and bias metrics for each taxon: root mean square error, mean absolute error, mean absolute percentage error and normalised mean bias. The root mean square error and the mean absolute percentage quantify absolute deviations; the mean absolute percentage error expresses deviations relative to observed values, and the normalised mean bias captures systematic over- or underestimation. Each metric was calculated as the difference between raw pollen estimates and REVEALS-derived values, standardised using z-scores, and averaged per taxon to produce a composite improvement score – a dimensionless measure of validation performance.
Given the large volume of validation results, this paper focuses on the coretop validation of LSM-RPPs at 45 km resolution, which showed the strongest performance according to the multimetric analysis. The rest of the results regarding the LSM-RPPs validation can be found in the Supplement (Figs. S4–S6).
2.3 Comparison of RPPs across European studies
Comparing RPPs between studies has become a challenging task due to the large number of existing studies which all make partially different assumptions. We introduce a numerical workflow designed to address such a challenge, enabling more reliable comparisons and addressing methodological discrepancies between studies (e.g., different reference taxa).
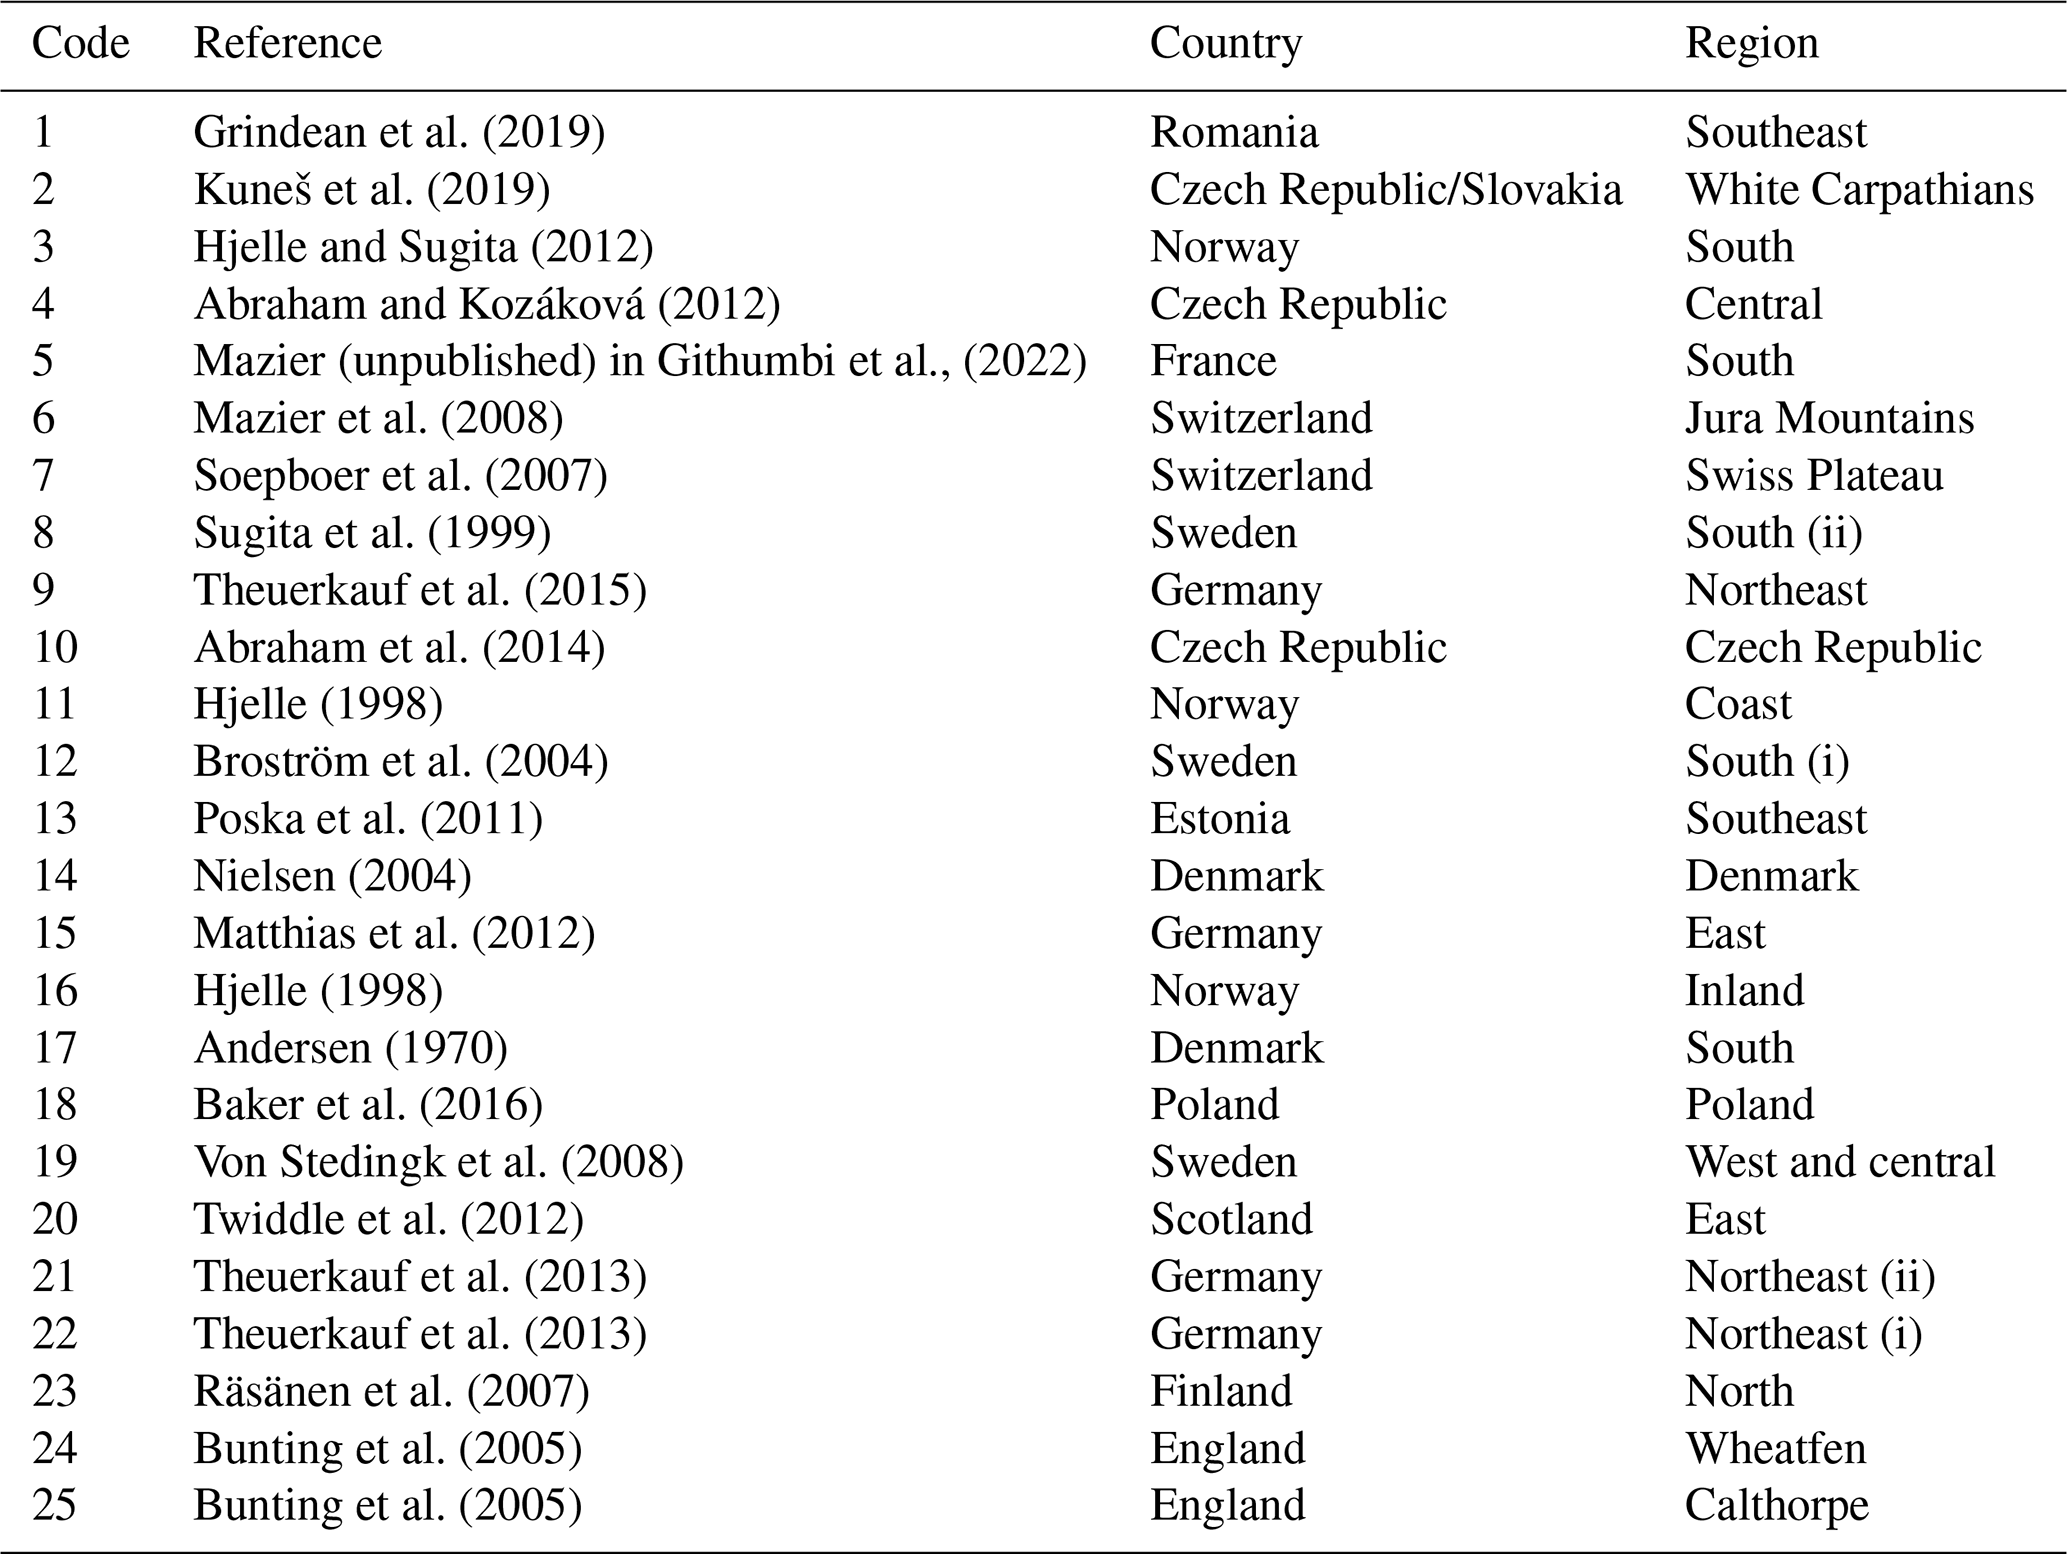
Table 1List of studies included in the comparison. Full metadata of the references are available in Table S3 in the Supplement.
We applied this workflow to compare RPPs from published studies across Europe with our LSM-RPPs, implementing the following steps:
- 1.
Debiasing RPPs for heavy pollen grain taxa: we adopted the adjusted RPP for Abies according to Theuerkauf (2025), as the original estimate was based on the Gaussian Plume model.
- 2.
Pairwise ratio comparison: we calculated ratios between pairs of taxa in our dataset and compared them to corresponding ratios in previous studies. A taxon pair from a previous study was considered matching if its ratio differed by no more than a factor of 1.5 (i.e., within the range of 0.67 to 1.5) from the equivalent ratio in our dataset.
- 3.
Selecting the scaling factor taxa: we selected taxa whose pairwise ratios passed the similarity window of 1.5 and used them to compute the scaling factor. In this study, RPPs from Erica and Genista-type were compared to RPPs of Ericaceae and Fabaceae, respectively, since these represent equivalent taxonomic groups identified at different resolutions across studies.
- 4.
Compute scaling factor and adjust RPP values. To remove the influence of the reference taxon, we calculated a scaling factor for each previously published study. Specifically, we determined the mean RPP of the scaling taxa within our dataset and compared it to the mean RPP of the same taxa in each previous study. The scaling factor was obtained as the ratio of these two means (our dataset divided by the corresponding study). All RPP values from each previous study were then multiplied by this scaling factor, assuming that the offset between studies is systematic and affects all taxa proportionally.
- 5.
Visualisation: for selected studies, we plotted the RPPs of comparable taxa using two approaches:
- a.
Spatial visualisation: we produced a map comparing the similarity of our RPPs with other studies in Europe.
- b.
Fold-change symmetric bar plots, where values <1 were plotted below the horizontal axis as reciprocals (e.g., a RPP of 0.1 is shown as below the axis), and values >1 were plotted above. This approach allows for multiplicative inverse of RPPs.
- a.
Previous RPP studies often include multiple sets of pollen samples, analysed using different methods. For each original study conducted in Europe, we selected one representative set of RPP values corresponding to a distinct set of pollen samples. Regarding the calculation methods (e.g., the ERV models), we followed choices outlined by Githumbi et al. (2022). However, the RPPs themselves were sourced from Wieczorek and Herzschuh (2020), who provided the original, unmodified estimates without recalculation. References of the studies used for comparison are available in Table 1.
3.1 Pollen productivity estimates
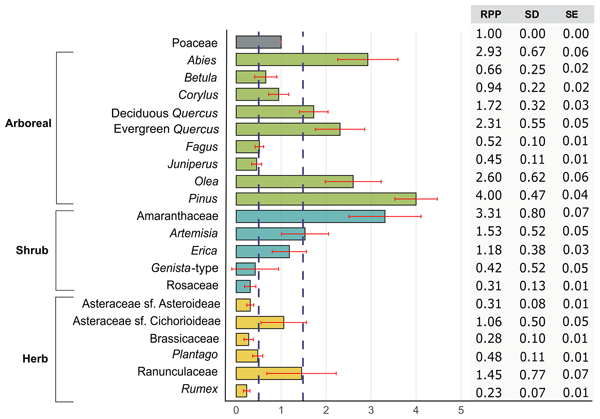
The first RPPs relative to Poaceae in STI identify low, medium and high pollen producers (Fig. 5). Low pollen producers (lower than 0.48) are Asteraceae sf. Asteroideae, Brassicaceae, Genista-type, Juniperus, Plantago, Rosaceae and Rumex; medium producers (0.49–1.42) are Betula, Asteraceae sf. Cichorioideae, Corylus, Erica, Fagus and Ranunculaceae, while high producers (>1.43) are Abies, Artemisia, Amaranthaceae, Olea, Pinus, evergreen and deciduous Quercus.
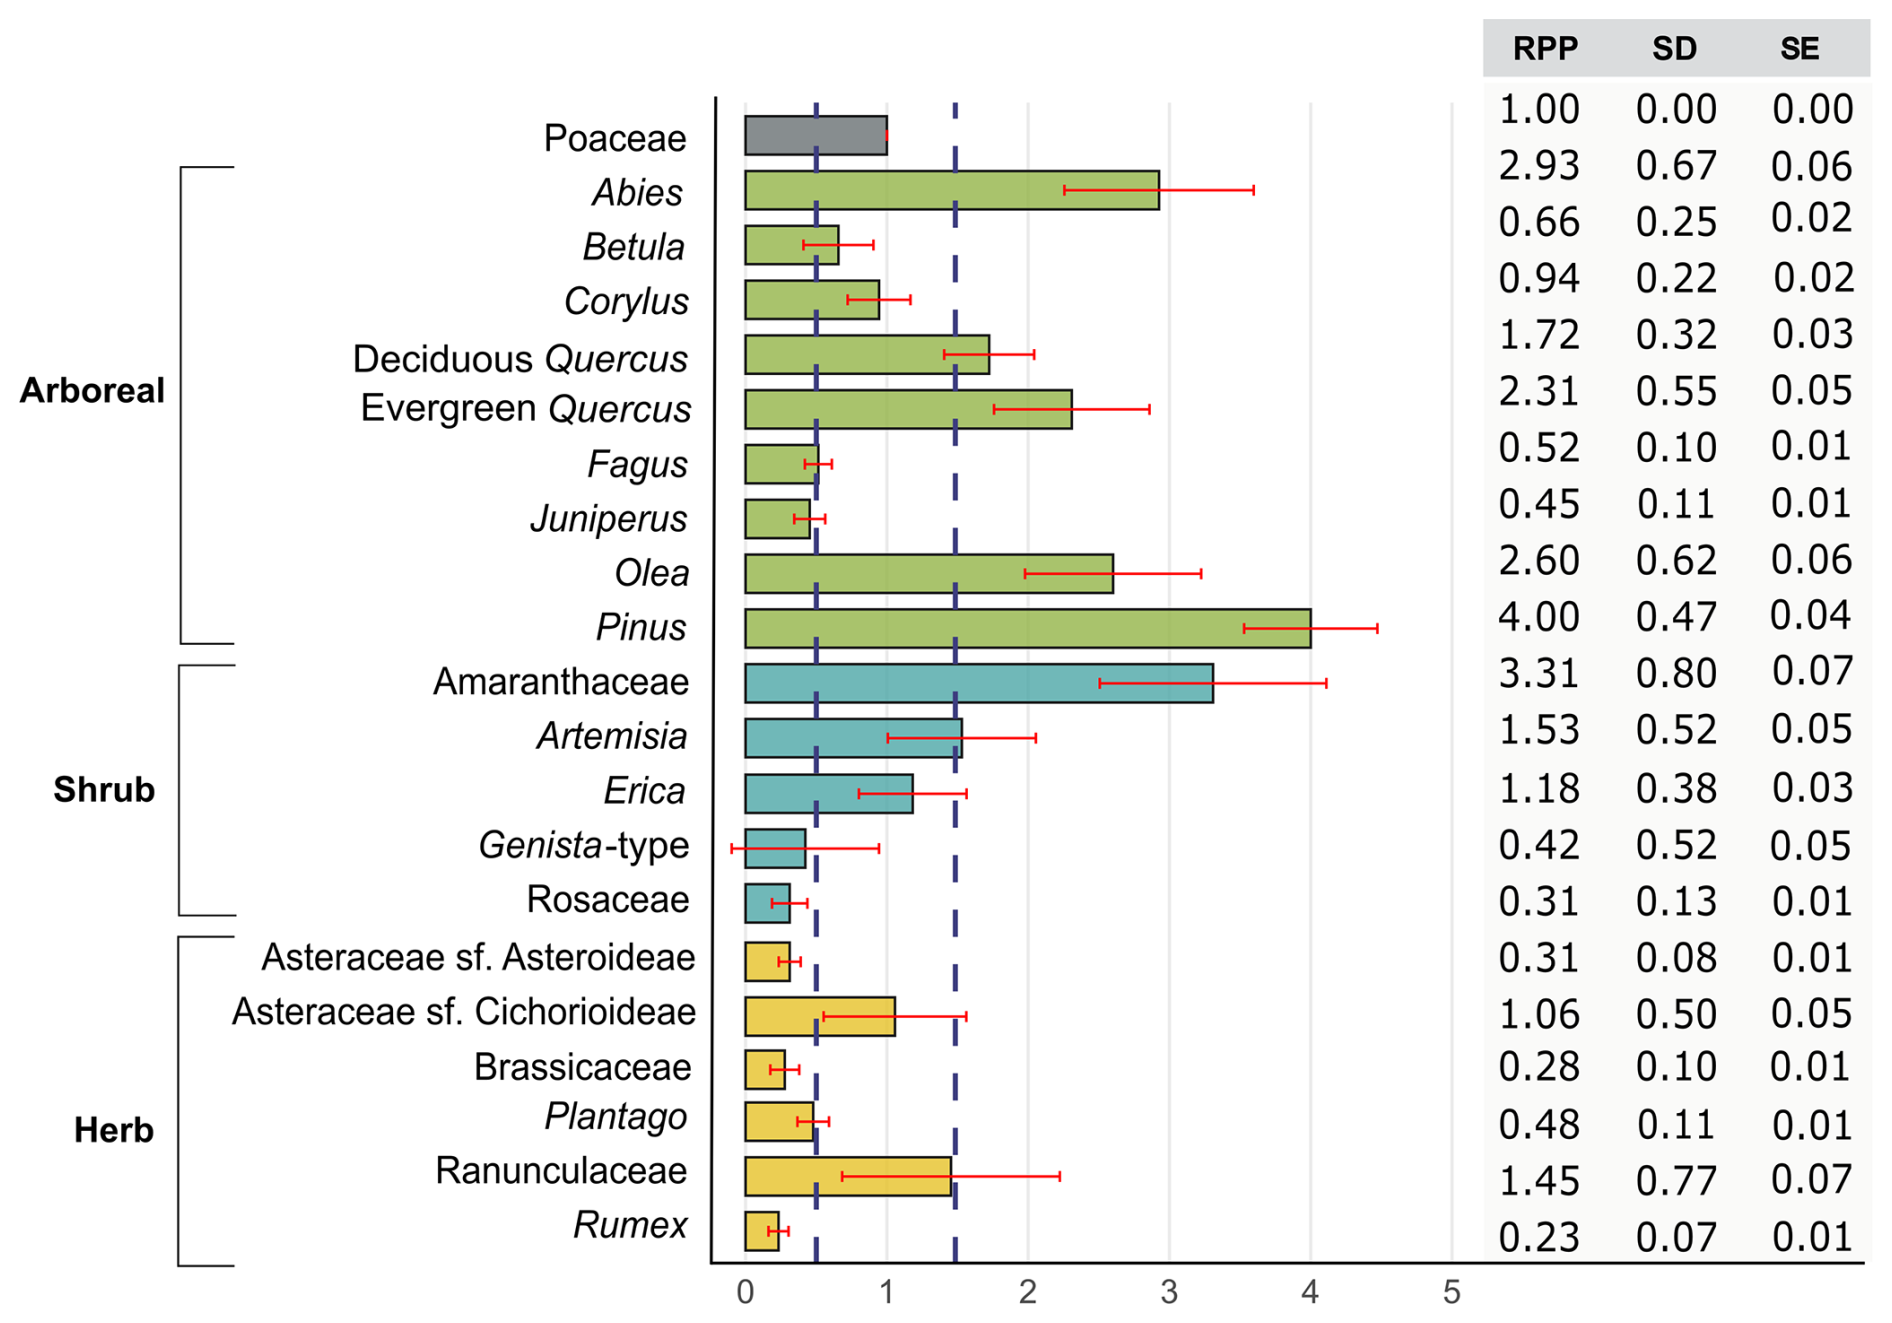
Figure 5Relative pollen productivity estimates (RPPs) relative to Poaceae calculated using the LSM, with standard deviation (SD) and standard error (SE) for 21 characteristic taxa in continental Spain. Red bars refer to the SD. Blue dashed lines indicate the cutoff values, based on percentiles, between low, medium and high pollen producers. Colours refer to the different groups of taxa (Poaceae in grey, arboreal in green, shrubs in teal and herbs in yellow). GPM-RPPs are shown in Fig. A1. The calculated RPPs for continental Spain are publicly available at https://doi.org/10.5281/zenodo.17927544 (Jungkeit-Milla et al., 2025).
3.2 Validation of RPPs on modern coretops
We applied the arboreal RPPs (relative to Poaceae) to the 27 coretops to test their validity (Fig. 6). We compiled all available samples containing Abies pollen that had not been used to retrieve the RPPs, selecting only 4 samples in total. The results of the validation for Abies are shown in Fig. B3 in Appendix B.
The REVEALS model corrects the uneven pollen productivity across taxa, resulting in an abundance reduction of overrepresented taxa and an increase for the underrepresented taxa (Fig. 6). This correction is evident when comparing raw pollen percentages (Fig. 6, left column) with REVEALS-based vegetation estimates (Fig. 6, right column). Pinus and both evergreen and deciduous Quercus, which dominate Iberian tree communities, show a marked reduction in estimated vegetation cover. The case of Pinus is especially illustrative: the adjusted estimates align closely with the observed vegetation cover (Fig. 6), suggesting the model performs well in accounting for its high pollen productivity. Another important example is Olea, for which REVEALS estimates indicate a reduction in the extent of olive cultivation. Nonetheless, several coretops were found to have no crops within a 45 km radius and we found that pollen from Olea correlated better with olive crop coverage at 100 km distance (see Figs. S4, S5 and S6 in the Supplement).
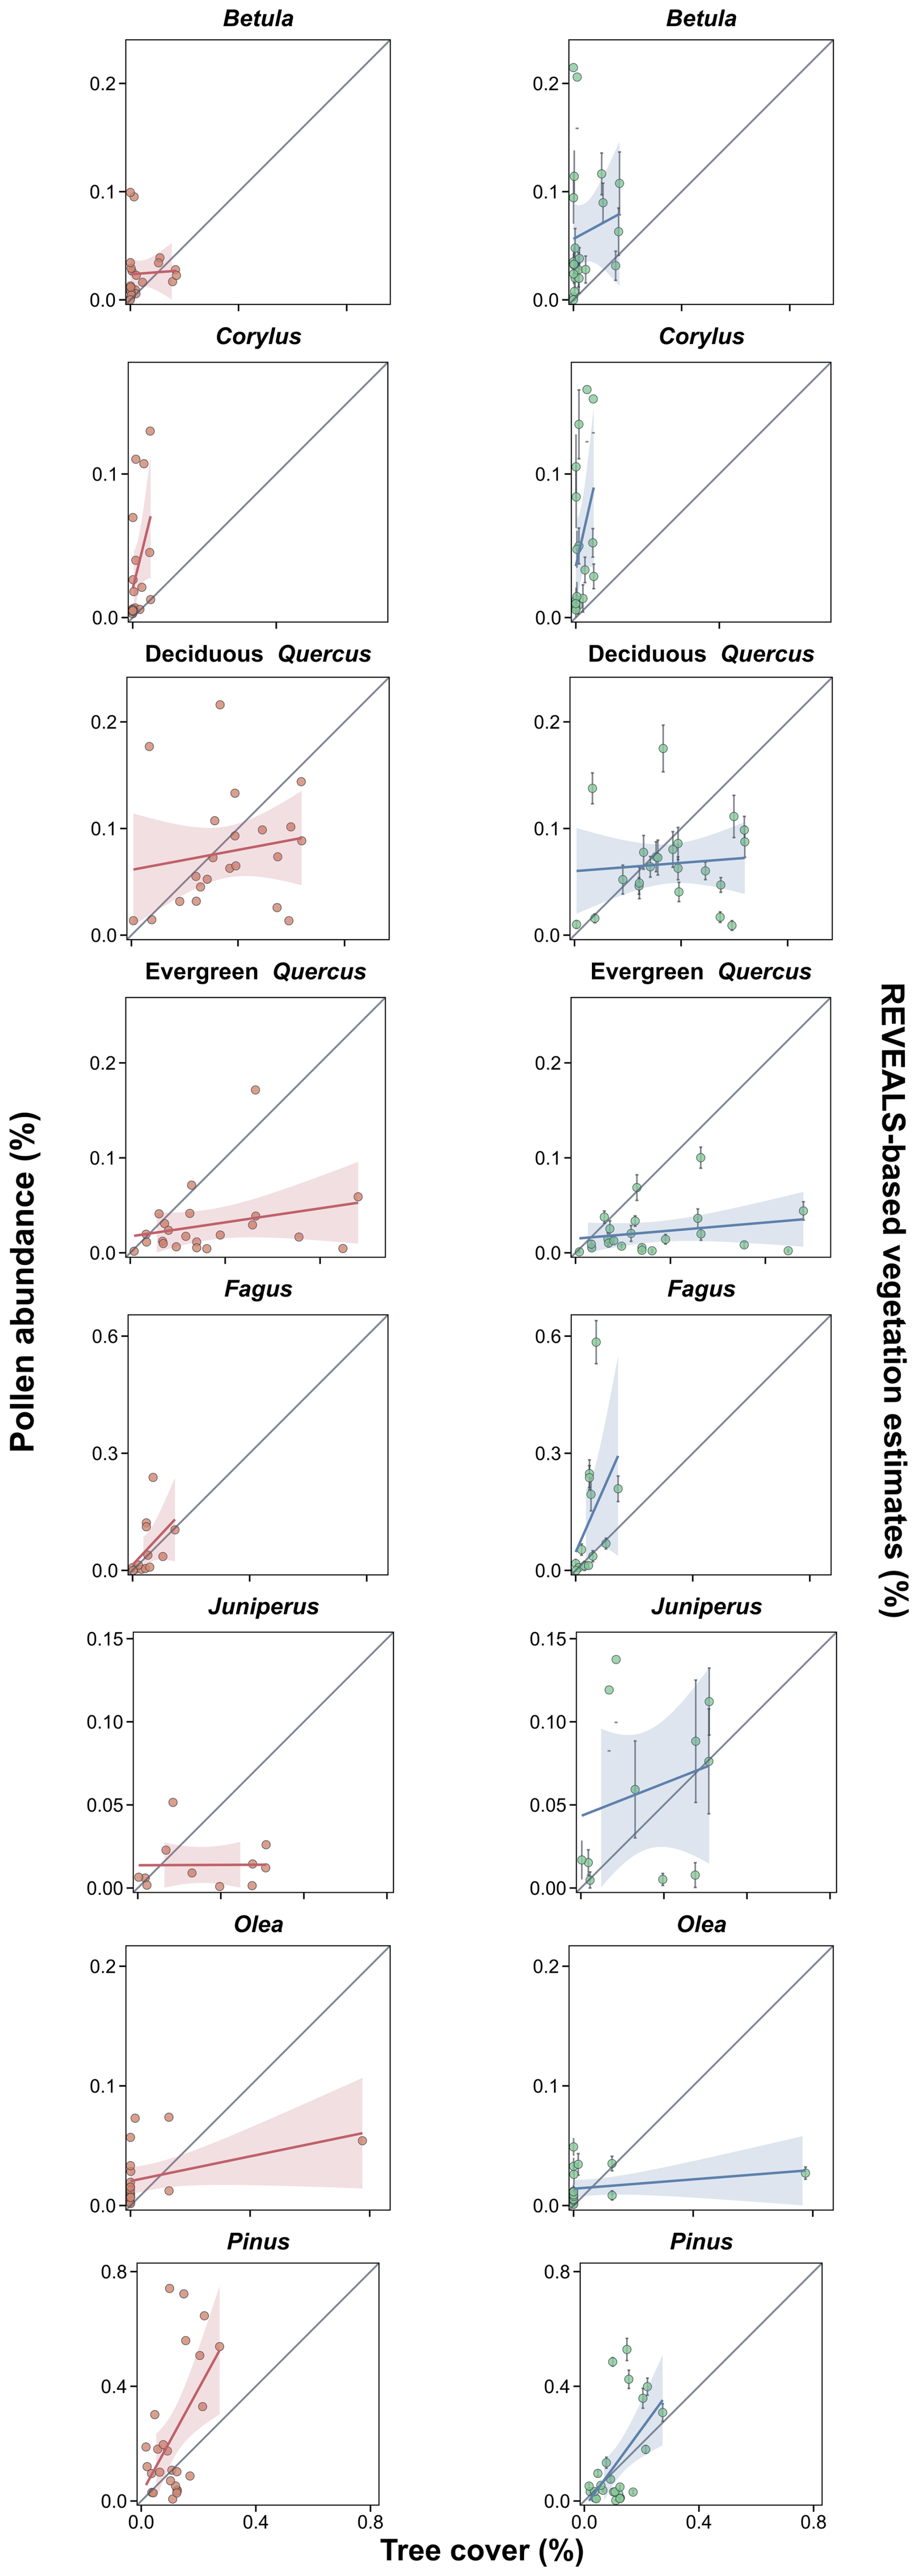
Figure 6Relationship between the mean tree cover at 45 km in each coretop with untransformed pollen abundances (left, in red) and with the REVEALS-based vegetation estimates (right, in blue) with standard errors. The grey diagonal line represents the 1:1 reference line, indicating perfect correspondence between pollen/vegetation estimates and actual tree cover. Coloured lines represent linear regressions with 95 % confidence intervals (shaded areas). Points above the reference line suggest pollen overrepresentation relative to actual tree cover, while points below indicate underrepresentation.
On the contrary, temperate forest taxa such as Betula, Corylus and Fagus, having relatively low RPPs (Fig. 5), tend to be underrepresented in pollen assemblages in Iberia. REVEALS corrects for this bias, resulting in higher vegetation estimates for these taxa. Juniperus, moderately underrepresented in raw pollen data likely due to low pollen productivity (Fig. 5), is partially corrected by REVEALS, resulting in slightly higher estimates of vegetation cover. The standardised composite improvement score of the multimetric analysis at 45 km revealed that temperate forest taxa perform better with raw pollen counts than with the REVEALS-based reconstructions when comparing with observed regional vegetation cover (Fig. 7). Nonetheless, REVEALS estimates still provide more ecological sense in accounting for the observed vegetation than pollen percentages for Betula at 15 and 100 km (Figs. S4 and S6 in the Supplement).
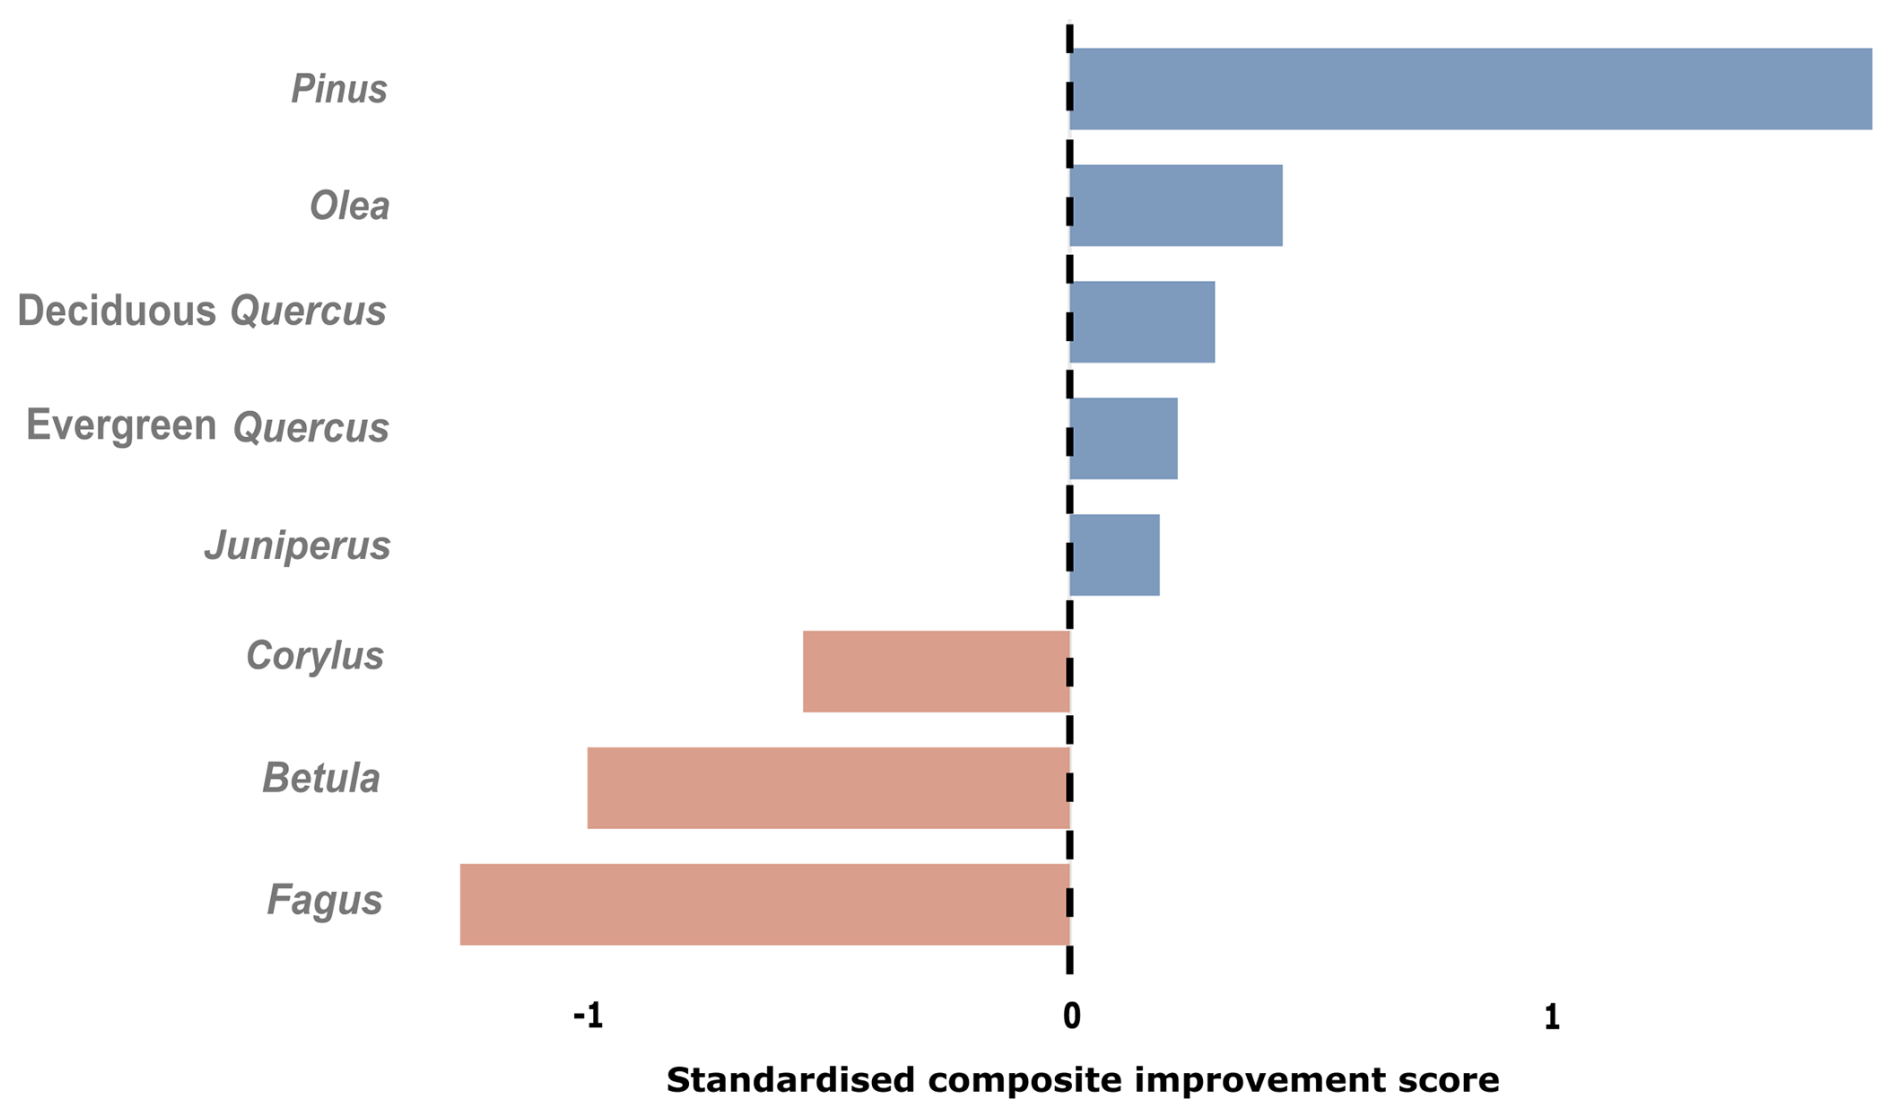
Figure 7Multimetric analysis comparing performance of REVEALS at 45 km for the selected arboreal taxa. Blue bars refer to positive values (better performance of REVEALS); red bars refer to negative values (better performance of pollen percentages).
3.3 Comparison of RPPs across European studies
Comparison of RPPs demonstrated similar values, at least in one pair, in all or more than half of the previously published values for the following taxa: Amaranthaceae, Artemisia, Asteraceae sf. Asteroideae, Brassicaceae, Asteraceae sf. Cichorioideae, Corylus, Ericaceae (Erica), Fabaceae (Genista-type), Fagus, Juniperus, Plantago, Poaceae, evergreen and deciduous Quercus, Ranunculaceae and Rumex. In contrast, the remaining taxa – Abies, Betula, Pinus and Rosaceae – show agreement with only half or fewer of the European sites (Fig. S7a in Supplement).
The eight studies with the highest number of matching taxa are from Romania, Czech Republic-Slovakia, Norway, France, Switzerland and Sweden. The remaining studies, which show lower similarity between RPPs, come from Great Britain, Germany, Denmark, Poland, Estonia, and Finland (Fig. 8).
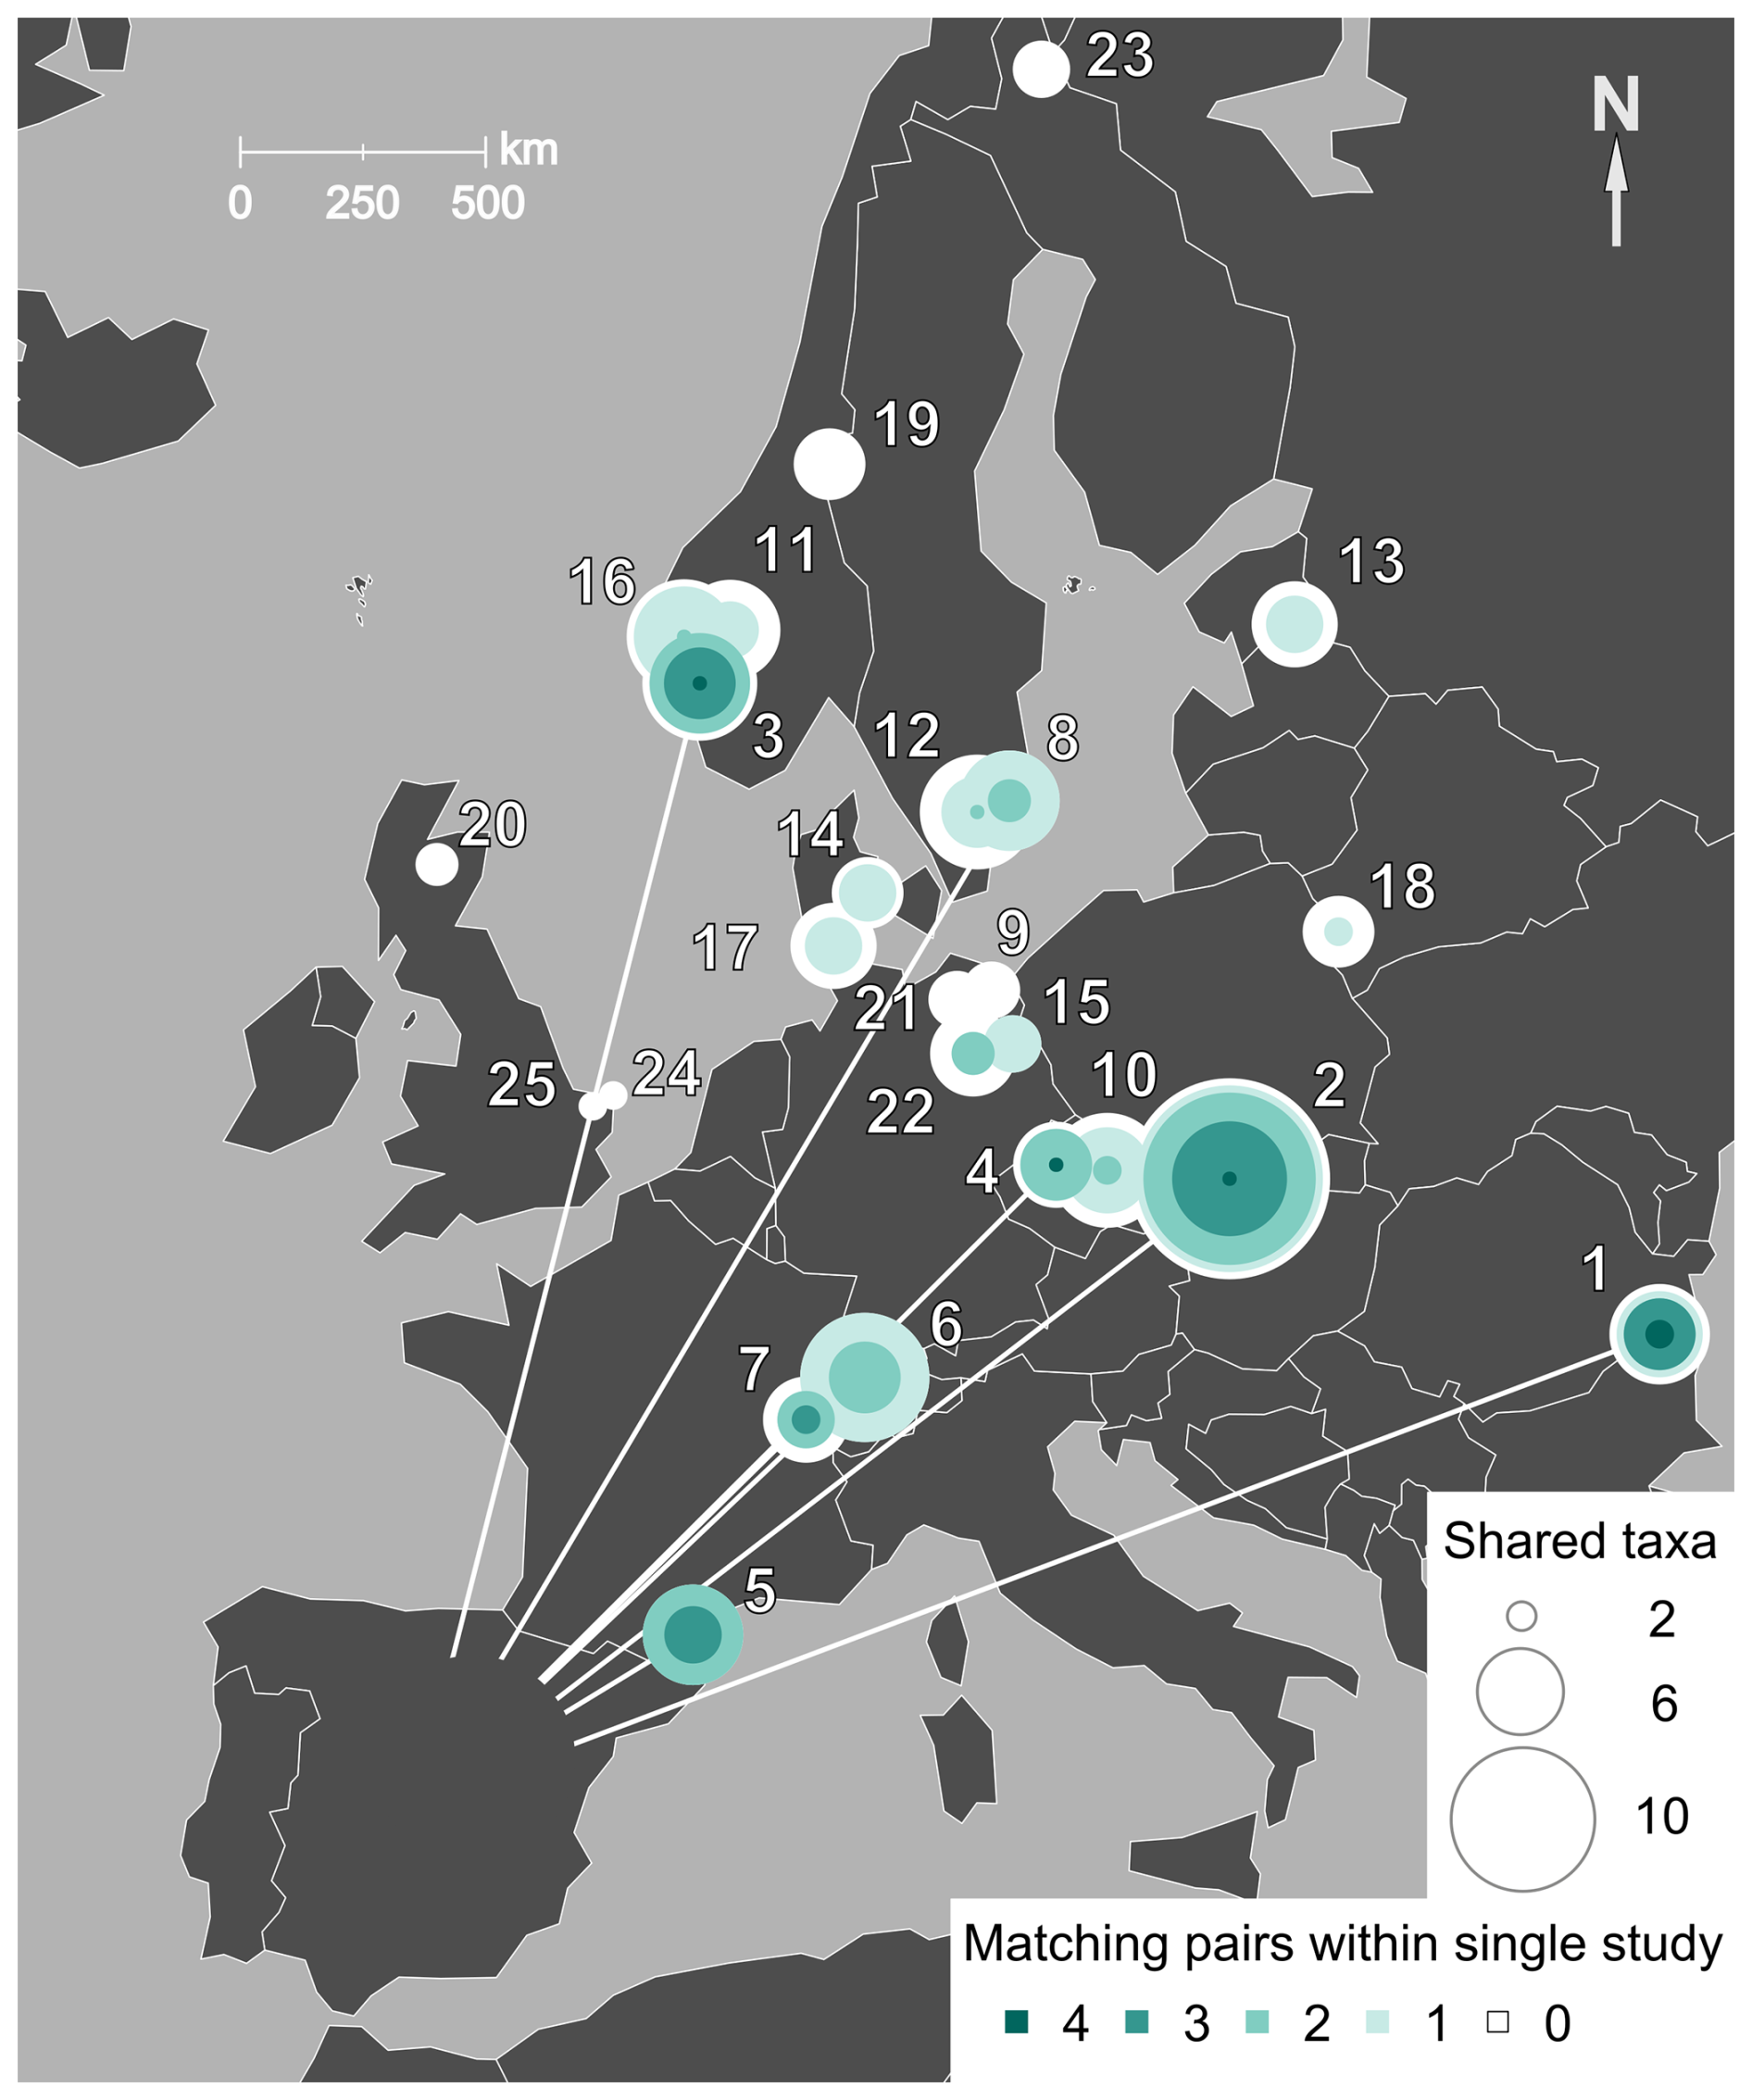
Figure 8Comparison of RPP studies across Europe: teal gradient indicates the number of species appearing in matching pairs; the size of the circle indicates the number of comparable taxa per study. Numbers on the map refer to the studied regions (see Table 1). White lines indicate the 8 most similar studies. See Fig. S7 in Supplement for standard barplots with number of comparable taxa.
For several taxa – Quercus (deciduous), Asteraceae sf. Asteroideae, Corylus, Ericaceae, Plantago, Poaceae, and Pinus – the STI RPPs are near the midpoint of the observed range in similar studies (Fig. 9). Notably, Poaceae and Pinus form two distinct clusters across studies; the STI values are within the higher cluster (4 for Pinus, and 1 for Poaceae).
For the remaining taxa, STI RPPs are distributed towards the edges of the observed ranges (Fig. 9), though still close to some previously reported values. These include Amaranthaceae, Artemisia, Asteraceae sf. Cichorioideae, Fabaceae, Fagus, Juniperus, Ranunculaceae, and Rosaceae. In the case of Abies, our estimate is higher than from any other European studies, while for Betula and Rumex, the values are lower.
Only two studies have derived RPPs for Brassicaceae, Fabaceae and evergreen Quercus, while only the present study provides a RPP for Olea. Within this limited data, evergreen Quercus is consistently represented as a high pollen producer, whereas Brassicaceae appears as a low pollen producer (Fig. 9).
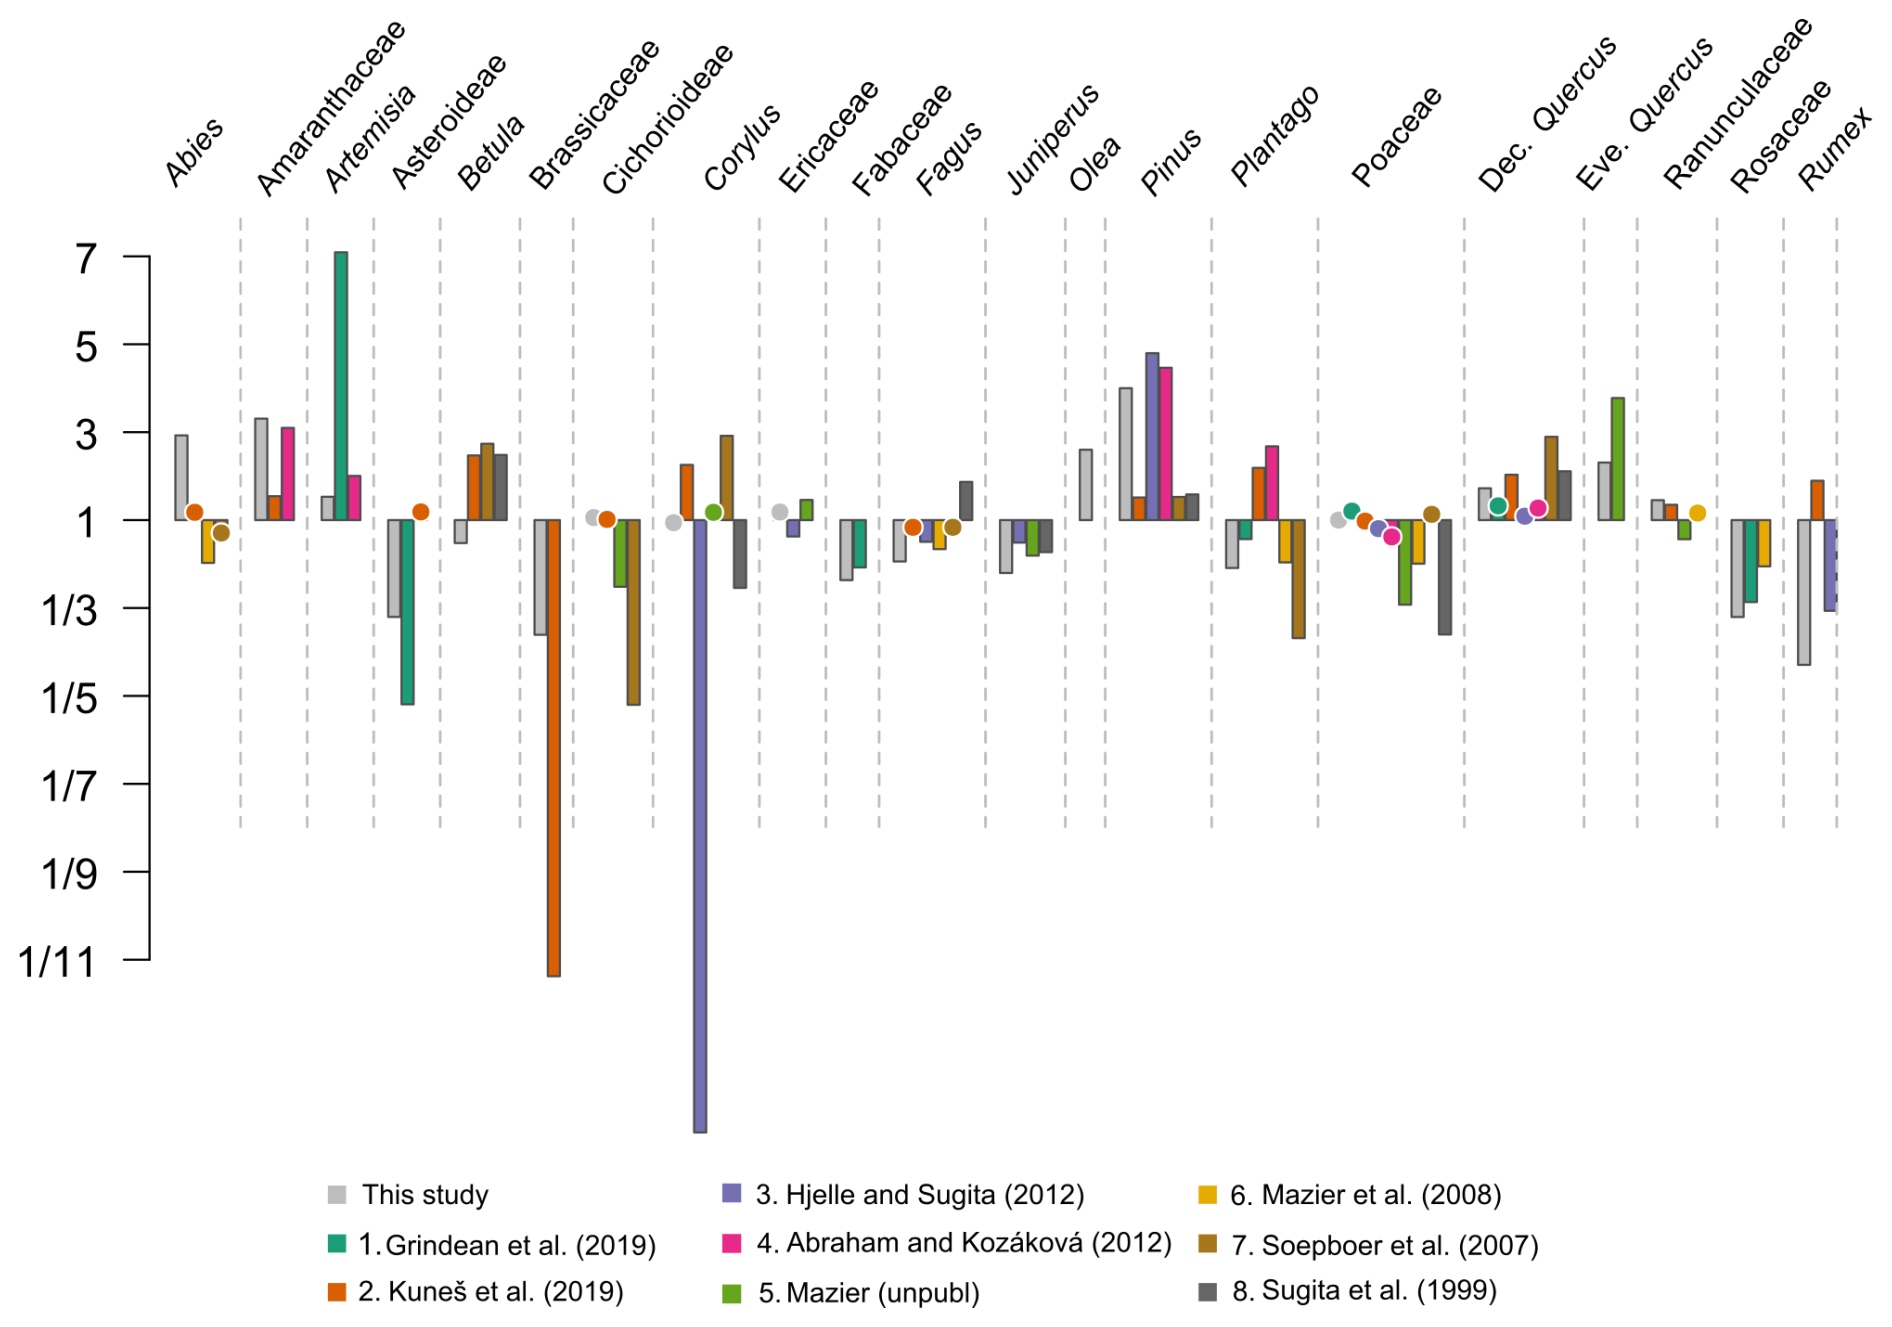
Figure 9Fold-change symmetric barplot of recalculated RPPs from the eight most similar studies. Adjustments account for reference taxon differences and dispersal model correction for Abies. Values <1 plotted as reciprocals. Each bar represents one of the eight most similar studies (from study 1 to 8), coming from Southern Sweden (8), Swiss Plateau (7), Jura Mountains in Switzerland (6), Southern France (5), Central Czech Republic (4), Southern Norway (3), White Carpathians (2) and Southeastern Romania (1). Circles represent visualisation of different studies for RPP ≈ 1. See Table 1 for more details of each study and Fig. S8 in the Supplement for RPPs with confidence intervals.
The results presented here are the first RPPs produced in Iberia. Our results show clear differences in pollen productivity among the 21 taxa analysed. Among the low producers, herbaceous and shrub taxa dominate, while the medium and high pollen producers include a mix of trees and shrubs. Validation using coretops indicated that RPPs of the dominant taxa in present-day landscapes are more accurately estimated than the less abundant ones. Comparison with previously published European RPPs shows that our estimates align closely with 8 different studies. Our discussion is thus framed around our three main objectives of estimating, evaluating and comparing the Iberian RPPs under the prism of the methodological challenges we found.
4.1 Validation and potential implementation of the first Iberian pollen productivities
The validation presented in this study is the first carried out in heterogeneous environments of the Western Mediterranean using vegetation survey data and disaggregated by taxa rather than by total tree cover. Validation of RPPs in modern samples remains uncommon but has been performed for the whole of Europe (Serge et al., 2023), Southern Sweden (Hellman et al., 2008), Australia (Mariani et al., 2017, 2022) and various Asian regions (Jiang et al., 2020; Wan et al., 2022; Xu et al., 2014). They generally found an excellent performance for large groups of taxa, although the fit between the modelled estimates and the vegetation data was not always as good when single taxa were considered (Hellman et al., 2008). Wan et al. (2022) presented the first evaluation of RPPs in a tropical region, suggesting that the REVEALS model performs well especially when applied at the landscape level rather than for individual species. In our dataset, we could not validate REVEALS for herb and shrub taxa because MFE only includes arboreal taxa. Nevertheless, we hypothesise that some herbaceous and shrub taxa may be overrepresented when applying the REVEALS model (as in Li et al., 2023; Marquer et al., 2020). This is because, in the Iberian context, these taxa are relatively low pollen producers, similar to certain genera such as Betula, Corylus and Fagus.
REVEALS generally performed well when reconstructing the coverage of arboreal taxa (Fig. 6), although only 5 of the 8 taxa performed better with REVEALS than with pollen abundances, according to the multimetric analysis performed at 45 km radius: Pinus, Juniperus, Olea, deciduous and evergreen Quercus (Fig. 7). Juniperus showed improved performance as the distance increased, specifically up to 45 km (see multimetric results at other distances in the Supplement Figs. S4–S6), likely because junipers occur in small copses or patchy forest stands (e.g., J. thurifera), so the greater the distance considered, the more individuals are found. In this work, and as far as we know, we calculated the first pollen productivity estimate for Olea. We found that Olea is a high pollen producer, which aligns with previous studies highlighting its high dispersal capability (Cañellas-Boltà et al., 2009; Fernández-Rodríguez et al., 2014) and its presence in modern samples where sometimes the nearest olive trees are more than 70 km away (Leunda et al., 2017). In our modern samples, most of the Olea pollen comes from olive crops in southern Spain. The MFE inventory rarely includes wild olive trees, since they do not form forests or small groves naturally. These two examples underscore the need of accounting for source area when interpreting pollen records, particularly for taxa frequently employed as indicators of environmental change. The contrasting distribution patterns and dispersal capacities of Juniperus and Olea demonstrate how spatial context and distance exert a substantial influence on pollen representation.
The standard errors of the 8 validated taxa were consistently lower than their estimates, providing a measure of precision in terms of reliability (Githumbi et al., 2022; Li et al., 2023). Nevertheless, the quality of REVEALS outputs is ultimately constrained by the quality of input datasets (EMPD2 and MFE). According to the theory, deviation of REVEALS estimates from observed vegetation may suggest unreliable RPP values. We however believe that such deviation could be explained by: (i) a poor performance of REVEALS for Betula, Corylus and Fagus, since they are not present in all the STI due to environmental heterogeneity; and (ii) inaccuracies in the vegetation dataset, especially for taxa that do not form large, continuous forests such as Juniperus, Betula or Corylus (Wan et al., 2022).
Regarding the validation of Abies (Fig. B3), only 4 coretops were available to test the performance of REVEALS, both with GPM and LSM. The GPM-REVEALS yielded estimates up to three times higher than the LSM-REVEALS. These findings are consistent with previous studies (Abraham et al., 2014; Theuerkauf et al., 2013, 2016), which showed that large basins strengthen the overestimation of this taxon. The weighting factor decreases their distance-weighted plant abundance, and therefore the pollen signal is counterbalanced with high pollen productivity, ca. 2 times higher than the LSM-RPP (Fig. A1). As larger basins strengthen the overestimation of Abies (Abraham et al., 2014), RPP estimates of Abies may vary considerably among studies with different basin sizes (Fig. B3). Moreover, according to the multimetric analyses (Figs. B2 and B4), these indicate that LSM-REVEALS produced more accurate and consistent estimates of Abies cover than GPM-REVEALS at all distances. A similar pattern was also observed for Juniperus, for which LSM-REVEALS also outperformed the GPM approach. This is particularly important because Juniperus is a key taxon, containing 5 woody species in Iberia and thoroughly present in several fossil records across the Iberian Peninsula. This is the case with the longest continuous records in the western Mediterranean from the Villarquemado paleolake (Aranbarri et al., 2014; González-Sampériz et al., 2020; Moreno et al., 2012), which shows substantial proportions of juniper during the previous interglacial (the Eemian). An accurate reconstruction of the history of Juniperus is therefore essential for assessing ecosystem resilience under extreme climate fluctuations.
In light of our results, we believe that implementing our RPPs to quantitatively reconstruct vegetation cover from fossil pollen records could be promising for both arboreal and non-arboreal taxa in Iberia. The relatively low standard errors for trees in our validated coretops (especially for Pinus, Olea and both evergreen and deciduous Quercus) indicate that they can be confidently used for regional reconstructions of past vegetation. Even for some with lower performance, such as temperate forest species, these RPP values can still provide a useful reference until region-specific estimates are available. Both GPM- and LSM-RPPs proved that they can be used for reconstructions of vegetation dynamics. However, due to the aforementioned reasons, the LSM proved to provide more robust results, as the GPM may underestimate the dispersal of heavy pollen taxa, potentially leading to unrealistic vegetation reconstructions.
As for shrub and herb taxa, while direct validation was not possible, the generally robust SEs we retrieved suggest that these values could be cautiously implemented in reconstructions of open vegetation dynamics within Mediterranean landscapes. The overrepresentation of trees in pollen records aligns with findings from other European studies and with long-lasting intuitive expectations in the palaeoecological community. Notably significant are the values among dominant tree species: Pinus (4.00), evergreen (2.31), and deciduous (1.72) Quercus, suggesting a lower prevalence of pine communities in the past than has been interpreted based on previous reconstructions that indicated a higher abundance of pines, using both pollen data and/or wood charcoal and macrofossil analyses (Aranbarri et al., 2014, 2020; Carrión et al., 2004; Ezquerra et al., 2019; Múgica et al., 2001; Rubiales et al., 2010). Conversely, some deciduous trees in Iberia, such as Betula (0.66) and Fagus (0.52), showed lower productivity, potentially leading to them being underrepresented in fossil pollen records. This underestimation could affect our understanding of Pleistocene and Holocene temperate forest dynamics unless RPPs are applied (Broström et al., 2005; Githumbi et al., 2022; Trondman et al., 2015). For instance Corylus, with a RPP close to 1, provides crucial information for linking it to, e.g., early postglacial vegetation expansions (Aranbarri et al., 2014; González-Sampériz et al., 2006; Pearce et al., 2025b; Theuerkauf et al., 2014), and post-disturbance responses (Gil-Romera et al., 2014; Leunda et al., 2020).
For herb and shrub taxa with particularly low RPPs, such as Rumex (0.23), Brassicaceae (0.28), Juniperus (0.45) or Plantago (0.48), their roles in vegetation dynamics are expected to be underestimated if only raw pollen counts in fossil records are considered. This is especially critical for taxa associated with anthropogenic activities, such as Plantago or Rumex, whose historical presence in the Mediterranean landscape may be stronger than traditionally inferred without REVEALS estimates (Grindean et al., 2019; Kuneš et al., 2019; Mazier et al., 2008; Soepboer et al., 2007).
Our RPPs demonstrate that percentage pollen assemblages may bias reconstructions of Pleistocene and Holocene vegetation by overemphasising high pollen producers such as conifers and some oaks while downplaying the ecological importance of low-productivity taxa, including several deciduous broadleaved trees and herbs. Future quantitative reconstructions of vegetation dynamics in the STI hold the potential to substantially advance debates on the contentious idea of past continuous forest canopies in Iberia (Gomes et al., 2020; Pérez-Obiol et al., 2011). Incorporating revised pollen productivity estimates may reveal an even more fragmented forest landscape in the Southwestern Mediterranean, characterised by a mix of broadleaf woodlands, coniferous patches, temperate forests and open areas, as suggested in various studies (i.e., see compilations and references in Carrión et al., 2010a and González-Sampériz et al., 2010).
Future implementations of our RPPs in Iberia expand the possibilities for reconstructing past disturbances. By integrating RPPs with fossil pollen records, we can quantify vegetation composition over time and estimate biomass dynamics affected by various disturbances. With reliable RPPs, it would become feasible to produce spatially explicit models showcasing the long-term effects of environmental drivers across time and space, including anthropogenic or natural factors as well as the long-term interactions between disturbances and ecosystem recovery (Githumbi et al., 2022; Knight et al., 2022; Theuerkauf and Couwenberg, 2017).
4.2 Pollen productivities across Europe
Dominant vegetation types of the STI – pines, evergreen and deciduous oaks – exhibited RPP values successfully validated with independent top core samples. These taxa are identified as high pollen producers, consistent with findings from previous studies, particularly after adjusting original RPP values by the average scaling factor (see Sect. 2.3 “Comparison of RPPs across European studies”). Specifically, Pinus showed a RPP of 4.0 (Fig. 9), which aligns reasonably well with values reported from Central Czech Republic (4.5) and Southern Norway (4.8) (numbers 4 and 3 in Fig. 9, respectively). Evergreen Quercus exhibited a RPP of 2.31, comparable to 3.8 reported in Southern France (number 5, Fig. 9), and deciduous Quercus had a RPP of 1.72, which closely matches the value of 2.0 from the White Carpathians (number 2), in Czech Republic and Slovakia.
We also observed that our RPPs for most taxa fall near the midpoint of the range observed in other European studies, which is of interest since the STI has different environmental conditions that could have influenced pollen productivity. High pollen producers include wind-pollinated shrubs and herbs such as Amaranthaceae (3.31) and Artemisia (1.53), which yielded similar values to those reported in the Central Czech Republic (3.1 and 2.0, respectively, number 4 in Fig. 9). Medium pollen producers comprise shrubs and herbaceous taxa, including Erica (1.18), comparable to the value from Southern France (1.5) (number 5), Asteraceae sf. Cichorioideae (1.06) and Ranunculaceae (1.45), the latter two aligning with values of 1.0 and 1.3, respectively, reported from the White Carpathians (number 2 in Fig. 9). Low pollen producers – primarily entomophilous herbs or shrubs – such as Rosaceae (0.31) and Genista-type/Fabaceae (0.42) correspond well with previously reported values of 0.3 and 0.5 from Southeastern Romania (number 1).
In contrast, other taxa did not clearly match values reported in earlier studies, either due to a limited number of existing estimates or a wide variability in published data. For instance, RPP values for Asteraceae sf. Asteroideae (0.31) and Brassicaceae (0.28) are among the first reported or there are only a few previous estimates, making direct comparison difficult. For Corylus (0.94) our result lies within the mid-range of previously published values, which vary considerably (Fig. 9). Nonetheless, these values appear consistent with biological expectations – entomophilous herbs typically show lower pollen productivity than anemophilous trees – suggesting that the estimates are reasonable despite limited comparative data. For some taxa, Iberian RPPs follow a different trend than elsewhere in Europe, especially for Abies or Betula. When values are rescaled to remove the effect of the reference taxon, Abies emerged as a high pollen producer in STI (2.93), and Betula (0.66) presents lower productivity than in other European studies (Fig. 9). As discussed above, this underrepresentation of the temperate forest taxa may point to the need for computation of specific RPPs for the Eurosiberian biogeographical region, which is where these forest taxa are mainly found in STI.
RPPs for Olea (2.60) in this study are the first estimates in Europe. Both Olea and evergreen Quercus are only present in Southern Europe, and therefore new RPPs in all other Mediterranean peninsulas are needed in future studies to unravel the palaeoecological history of these species during the Holocene. It is of critical importance to better understand the history of key pollen taxa, especially when they vary their functional role in the ecosystem and become closely linked to human presence, as with Olea, offering new insights into anthropogenic triggers in the past. Indeed, Plantago and Rumex, also key taxa related to human activities, were found to present lower productivities in STI than in the eight most comparable studies from elsewhere in Europe. We argue that two main factors explain lower productivity of these taxa in Spain: first, Mediterranean climatic conditions may constrain the growth of these herbaceous taxa, thereby reducing their reproductive performance (López-Orozco et al., 2023); and second, traditional Iberian land-use systems (e.g., extensive grazing, dehesa-like agro-silvo pastoral mosaics) tend to maintain semi-open or wooded pastures rather than the continuously open, nutrient-rich grasslands common in Northern Europe (Connor et al., 2019).
4.3 Methodological constraints
Reconstructing past vegetation in Iberia with REVEALS poses unique methodological constraints owing to the region's pronounced topographic and environmental heterogeneity. This reason directly challenges one of the core assumptions of REVEALS: the need for spatially consistent pollen-vegetation relationships. Iberia's spatial heterogeneity often leads to an uneven vegetation distribution. This is particularly evident for mixed temperate forest taxa (e.g., Betula, Corylus, Fagus) which are confined to the northern fringe and are therefore not present across the entire STI. In addition, the lack of large lake basins, otherwise common in northern Europe, often forces reliance on smaller sedimentary basins, increasing uncertainty (Sugita, 2007a). Averaging RPPs across the STI may therefore underestimate productivity in optimal habitats.
Furthermore, the surface pollen collection may have introduced spatial biases in two different ways: (1) overrepresentation of certain vegetation communities and (2) overrepresentation of certain taxa. Both are related to the use of moss polsters as pollen traps, which are typically located in humid, mountainous environments (Fig. 1), especially in the Mediterranean region, limiting the representation of open vegetation landscapes from Iberia. In addition, moss polsters are often located under the tree canopy, especially in the Mediterranean region, perhaps resulting in overrepresentation of arboreal taxa. For instance, this could have been the case with Abies (see pollen percentage per grid in Fig. S9 and REVEALS estimates per grid in Fig. S10 in the Supplement), where both species (A. pinsapo and A. alba) coexist with the moss polsters in humid, cooler regions, potentially leading to higher estimates of pollen productivity.
Vegetation survey data also introduce uncertainty. The MFE maps well the dominant tree species but underrepresents taxa forming scattered stands (J. oxycedrus, J. communis), beyond the scope of forestry interest. The SIVIM database contains almost 150 000 phytosociological plant inventories. The frequency of the taxa is estimated on a scale of 1 to 5, which we transformed into percentages of abundances (equivalence table can be found in Table S4 in the Supplement). Despite the non-continuous nature of the SIVIM data, RPPs for shrub and herb taxa yielded robust and ecologically meaningful results, except for Genista-type, whose productivity estimate was lower than the standard deviation. Regarding the main source of pollen data, the EMPD2, some of the samples were incomplete or misclassified (e.g., some salt lakes were not specified as such; some samples had inaccurate coordinates or lacked information about the sample type or the sample context).
Moreover, the choice of a loss function could influence RPP estimates. In our work, we chose a weighted sum of squared errors (WSSE) method that calculates the optimal set of taxon-specific RPP values that minimises the discrepancy between observed regional vegetation composition and vegetation proportions reconstructed by REVEALS. This loss function addresses two main challenges in pollen-vegetation modelling: heteroskedasticity and taxon-specific biases. Pollen-vegetation relationships are inherently heteroskedastic, which means that the variance of the residuals scales with vegetation abundance (Sugita et al., 2010). Dominant taxa typically exhibit high pollen production, leading to smaller relative errors in their vegetation estimates, while rare or underrepresented taxa often show disproportionate noise due to low pollen counts and localised distributions (Broström et al., 2008). In order to partially account for these uncertainties, we weight errors inversely, as the WSSE function ensures that deviations for rare taxa contribute meaningfully to the optimisation, preventing their signals from being overshadowed by dominant taxa. By doing this, we acknowledge that residual uncertainty remains higher for the less frequent taxa.
Finally, a limitation of the inverted REVEALS approach is that the optimisation procedure seeks RPPs that maximise the agreement between REVEALS-derived vegetation estimates and observed vegetation cover. Consequently, part of the observed correspondence is an expected outcome of the optimisation process rather than a fully independent validation. We acknowledge that this limitation exists, and therefore a cross-validation approach was initially implemented to reduce this potential circularity, by explicitly excluding a subset of sites during RPP estimation and subsequently using them for validation, as described in Sect. 2.2.2 “Validation of RPPs”.
We used inverted REVEALS to produce the first pollen productivity estimates (relative to Poaceae) for the Spanish Territory of Iberia. Overall, we found that conifers (Pinus and Abies), both evergreen and deciduous Quercus, and Olea are high pollen producers in continental Spain. Temperate forest taxa (Betula, Corylus and Fagus) were identified as medium pollen producers, while shrub and herb taxa generally yielded lower RPPs, except for anemophilous taxa like Amaranthaceae.
We also performed the first validation of RPPs for arboreal taxa in southern Europe, using 27 present-day coretops and forest inventory data. The most frequent arboreal taxa in present-day landscapes performed better with REVEALS-based estimates than with raw pollen counts. Additionally, we conducted a bias-free comparison of our RPPs with other European datasets, finding similar values overall, except for temperate taxa and Abies. Future studies should examine whether more accurate estimates could be achieved by producing separate RPP datasets for the Eurosiberian and Mediterranean bioclimatic regions. Region-specific RPPs, tailored to bioclimatic variability, could improve the accuracy of vegetation reconstructions and disturbance assessments across the Iberian Peninsula.
Finally, these findings suggest that previous reconstructions of past vegetation dynamics in the Iberian Peninsula may have overestimated the presence of pines and oaks, and therefore fossil records from the Southwestern Mediterranean may require reinterpretation. Future research using the new relative pollen productivity estimates for Iberian taxa to generate quantitative vegetation reconstructions could indicate a more mosaic-like pattern of broadleaf woodlands, conifers, temperate forests and open ecosystems, aligning with most recent findings.
The Gaussian Plume model (GPM) is the most established model to simulate pollen transport and dispersal. Consequently, we also computed RPPs using the GPM. The results are shown in Fig. A1, complementing the LSM-RPPs in Fig. 5.
Generally speaking, GPM-RPPs showed similar results to the LSM-RPPs. However, the standard deviations are higher (marked in red in Fig. A1) on the GPM estimates. Significant differences are visible in the GPM-RPP values of Abies and Erica, which are ca. 2 times higher than the LSM-RPP values, related to their high fall speed and low wind speed (Abraham et al., 2014). The dispersal of both species is underestimated by GPM, which results in lower species-specific distance-weighted plant abundance. Thus, the pollen signal is counterbalanced with high RPPs.
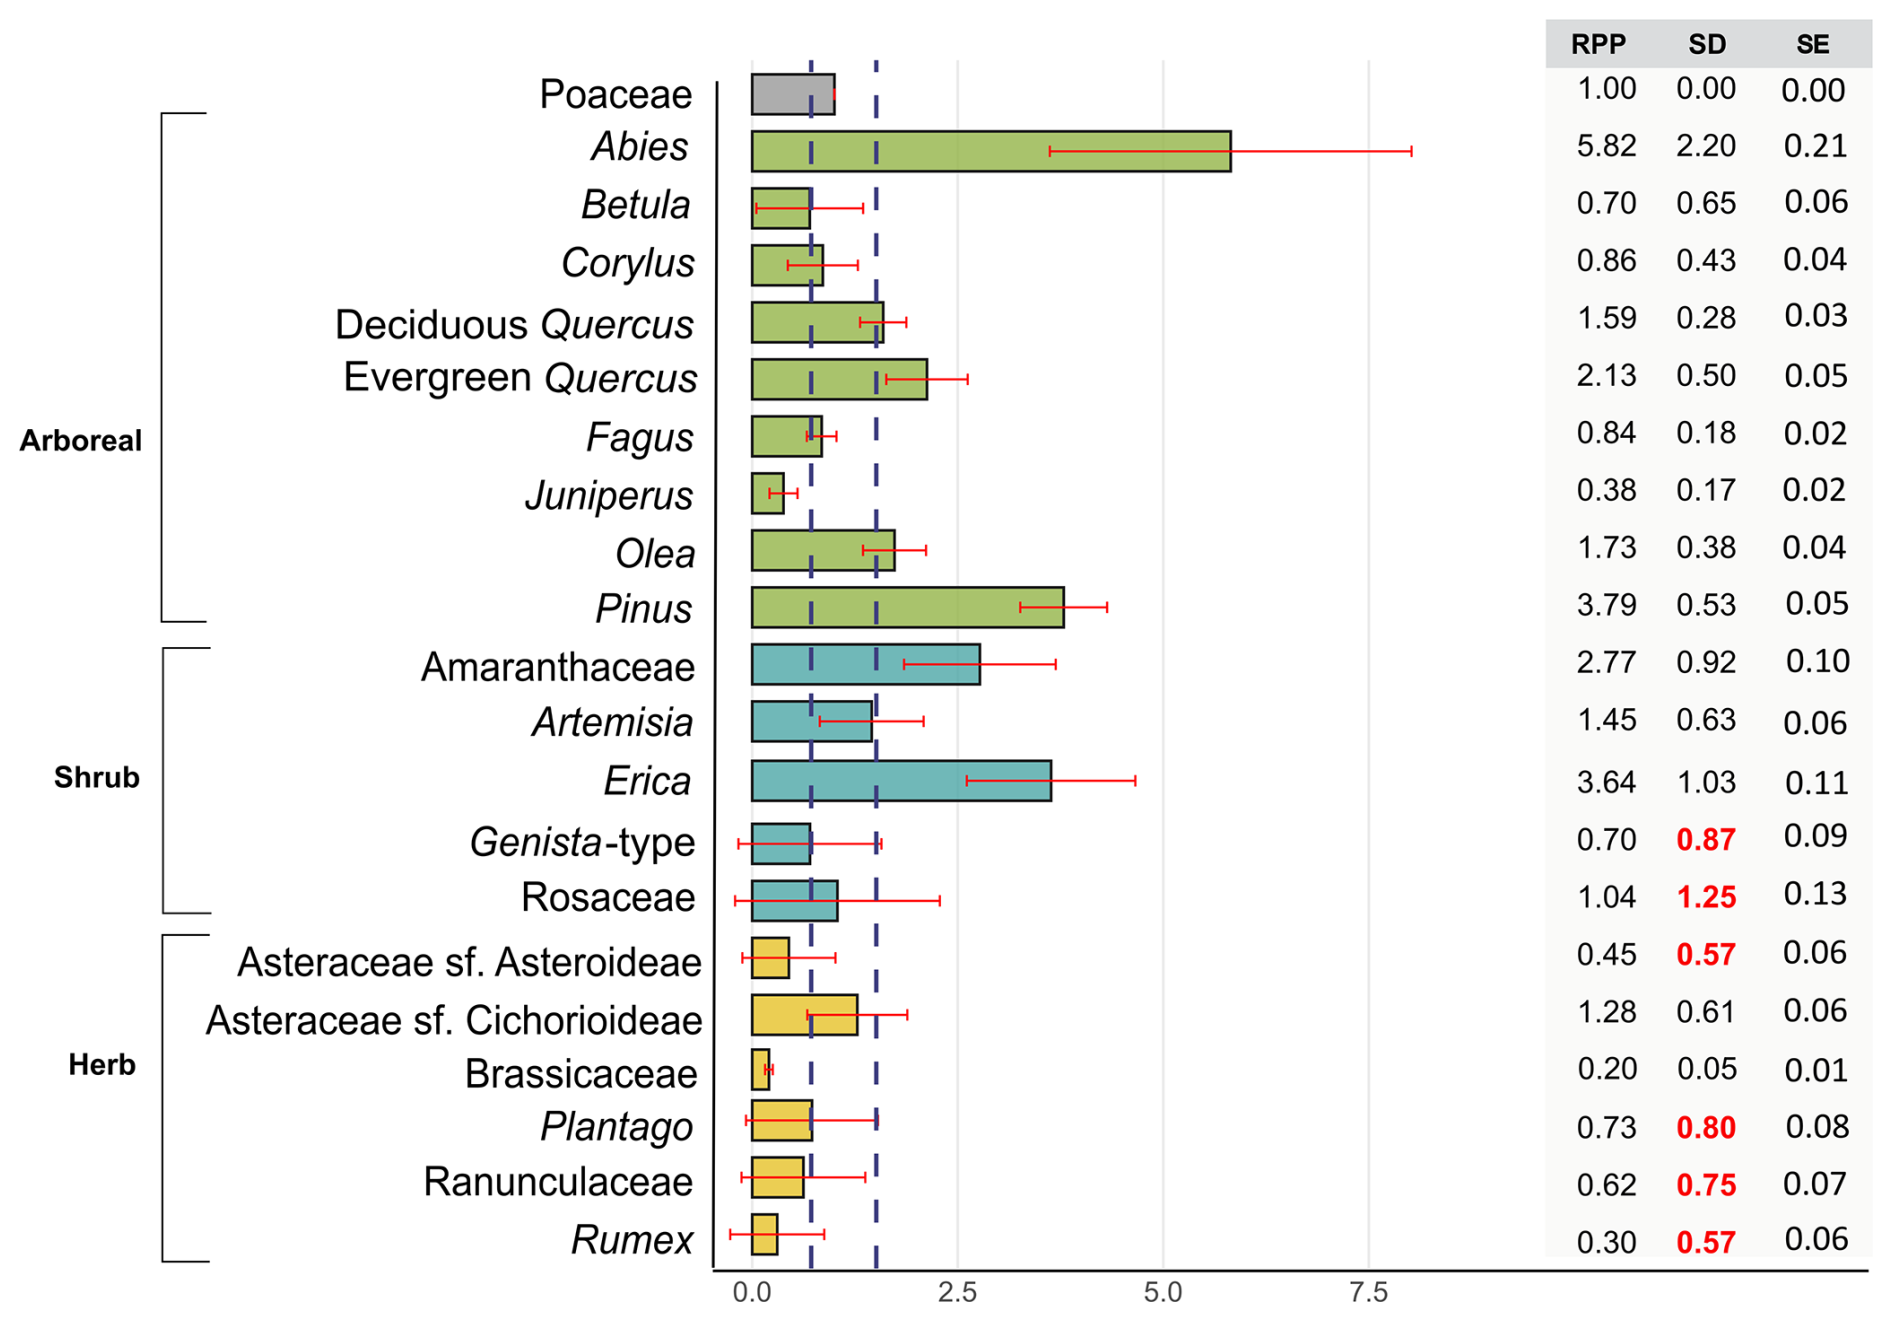
Figure A1Relative pollen productivity estimates (RPPs) relative to Poaceae and calculated using the GPM, with standard deviation (SD) and standard error (SE) for 21 characteristic taxa in continental Spain. Red bars refer to the SD. Blue dashed lines indicate the cutoff values, based on percentiles, between low, medium and high pollen producers. Colours refer to the different groups of taxa (Poaceae in grey, arboreal in green, shrubs in teal and herbs in yellow).
GPM-RPPs were validated in 27 coretops using the GPM for unstable conditions in the REVEALSinR package (Theuerkauf et al., 2016). Vegetation rings of 15, 30, 45 and 100 km have been calculated. Here we select the 45 km ring, which showed the strongest performance according to the multimetric analysis. Figure B1 shows the relationship between pollen abundance and tree cover (left column) and between the derived estimates (REVEALS-based vegetation estimates) and tree cover (right column) at a ring of 45 km distance.
Results from the GPM-REVEALS estimates showed a slight overrepresentation of Juniperus compared with the LSM-REVEALS estimates (Fig. 6), suggesting that the GPM is less suitable than the LSM for reconstructing the arboreal cover of this particular taxon. This result is also evident in Fig. B2, where the multimetric analysis was performed to evaluate the performance of the GPM estimates.
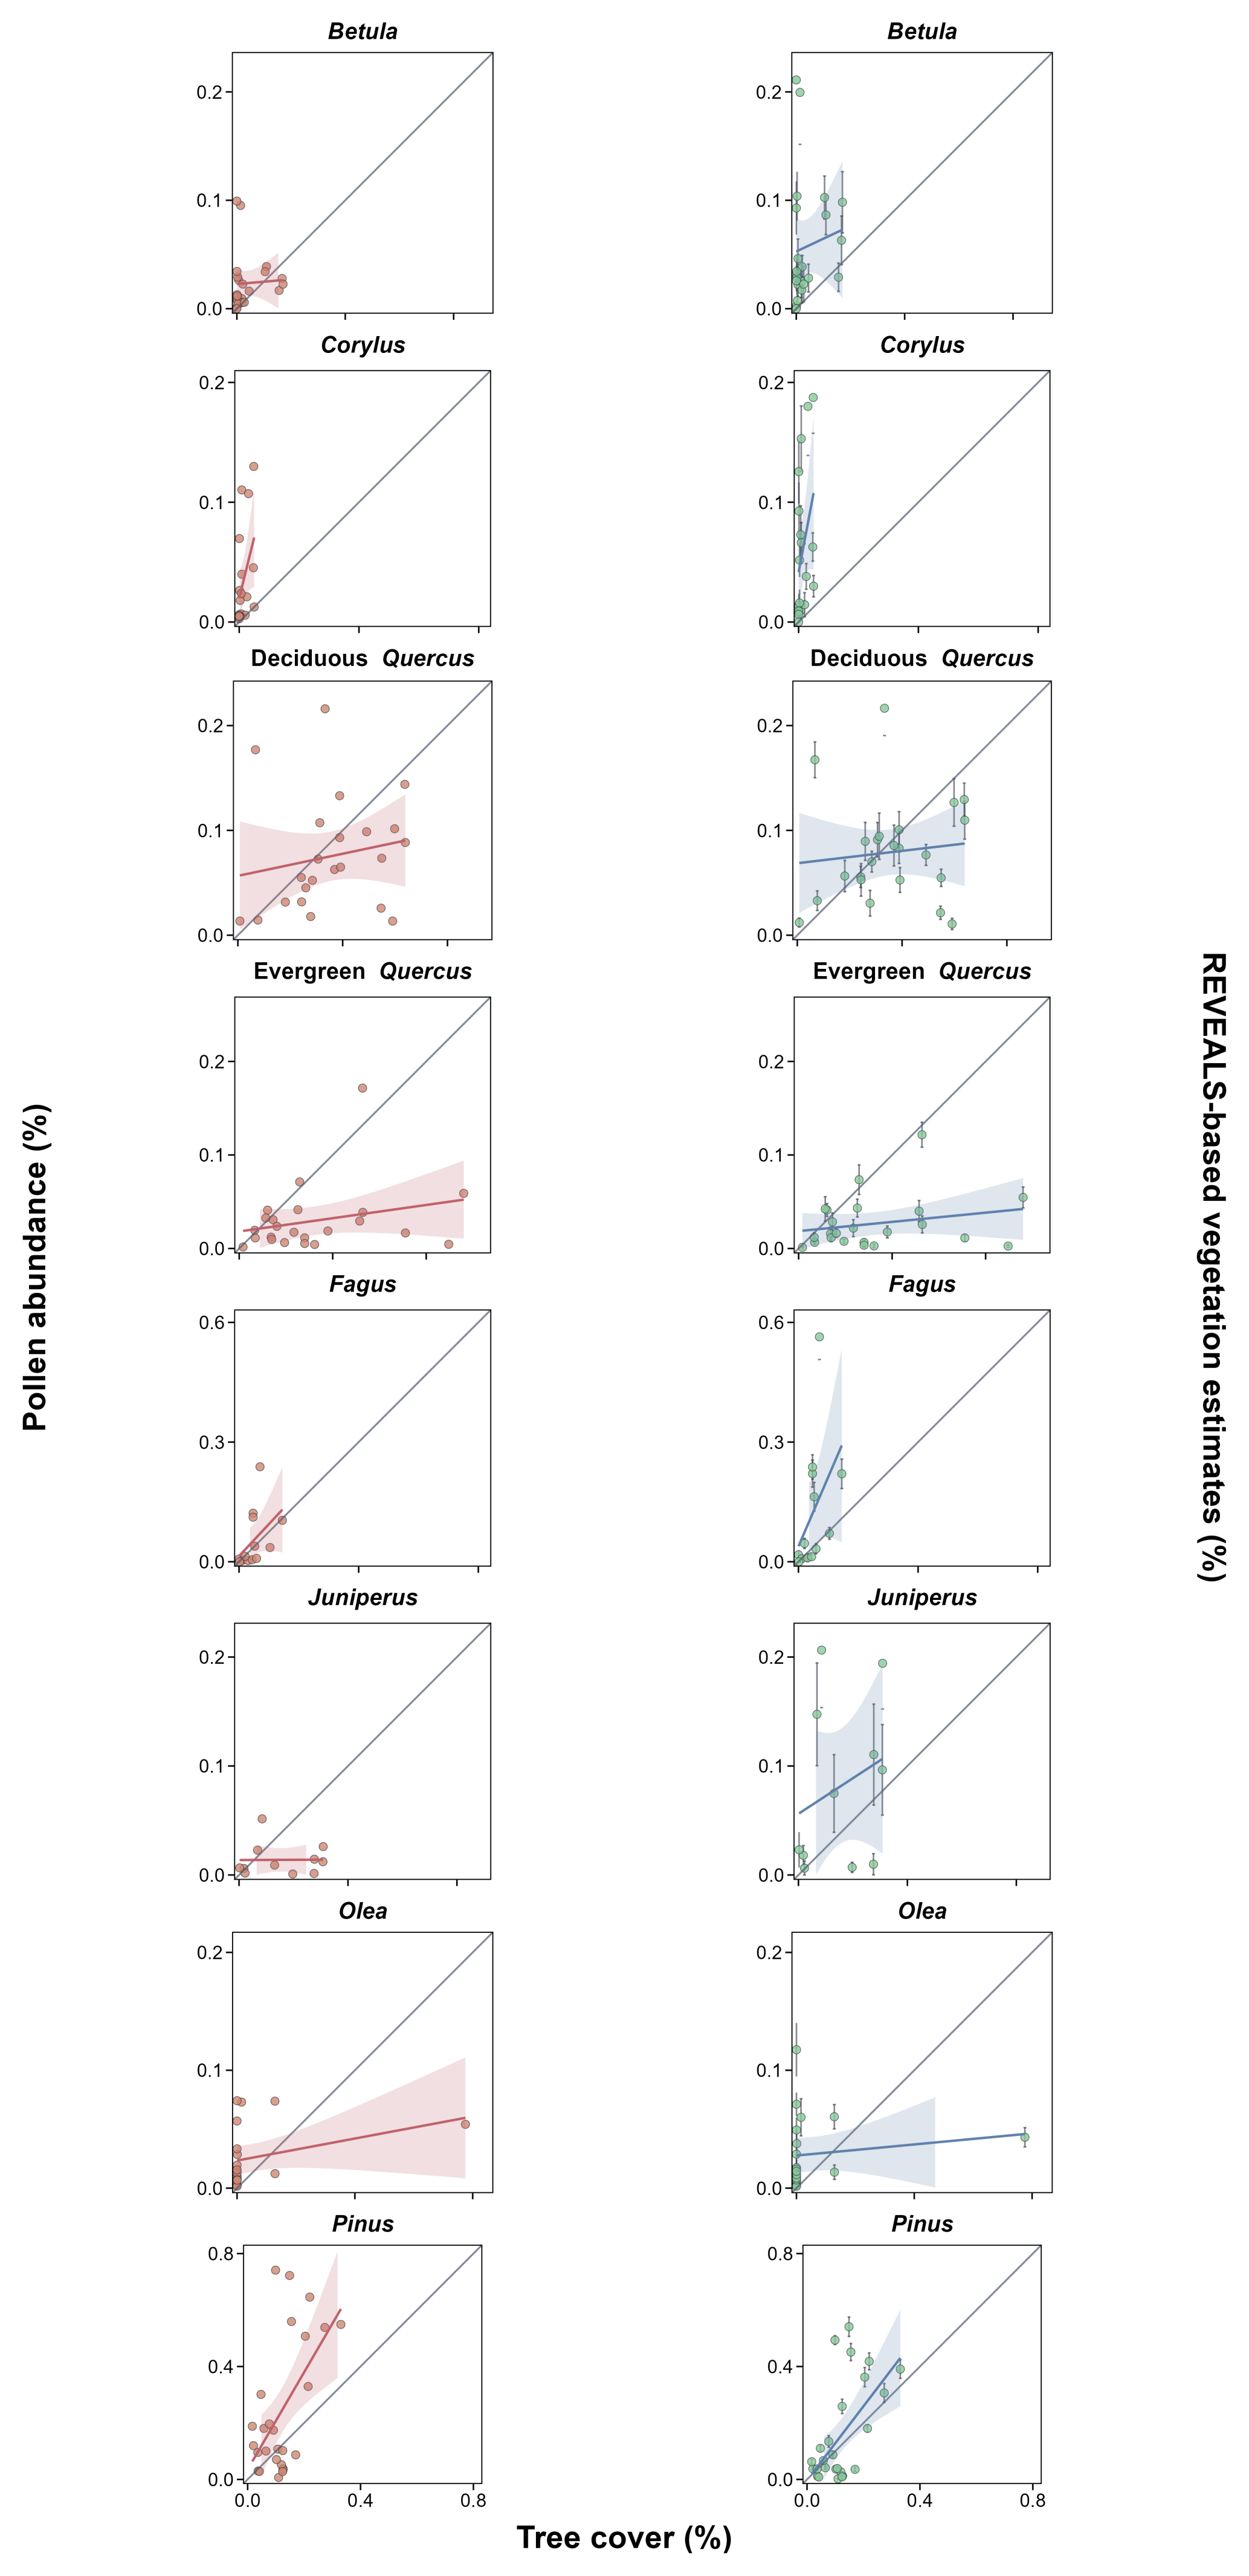
Figure B1Relationship between the mean tree cover at 45 km in each coretop with untransformed pollen abundances (left, in red) and with the GPM REVEALS-based vegetation estimates (right, in blue) with standard errors. The grey diagonal line represents the 1:1 reference line, indicating perfect correspondence between pollen/vegetation estimates and actual tree cover. Coloured lines represent linear regressions with 95 % confidence intervals (shaded areas). Points above the reference line suggest pollen overrepresentation relative to actual tree cover, while points below indicate underrepresentation.
As previously reported, Abies is a well-known taxon posing challenges for the Gaussian Plume models. To further assess its performance, we selected all available coretops containing Abies pollen and applied both GPM- and LSM-derived RPPs to generate REVEALS estimates (Fig. B3).
Although only 4 samples in the validation dataset contained Abies pollen, the results show that the GPM can overestimate Abies abundance by up to a factor of 3. Multimetric analysis of Abies performed at all distances also suggests that the use of REVEALS (both with GPM and with LSM) is preferable to only using pollen counts (Fig. B4), except for the GPM at 100 km. Despite the good performance of REVEALS, LSM estimates yielded higher scores than the GPM-REVEALS estimates at all distances.
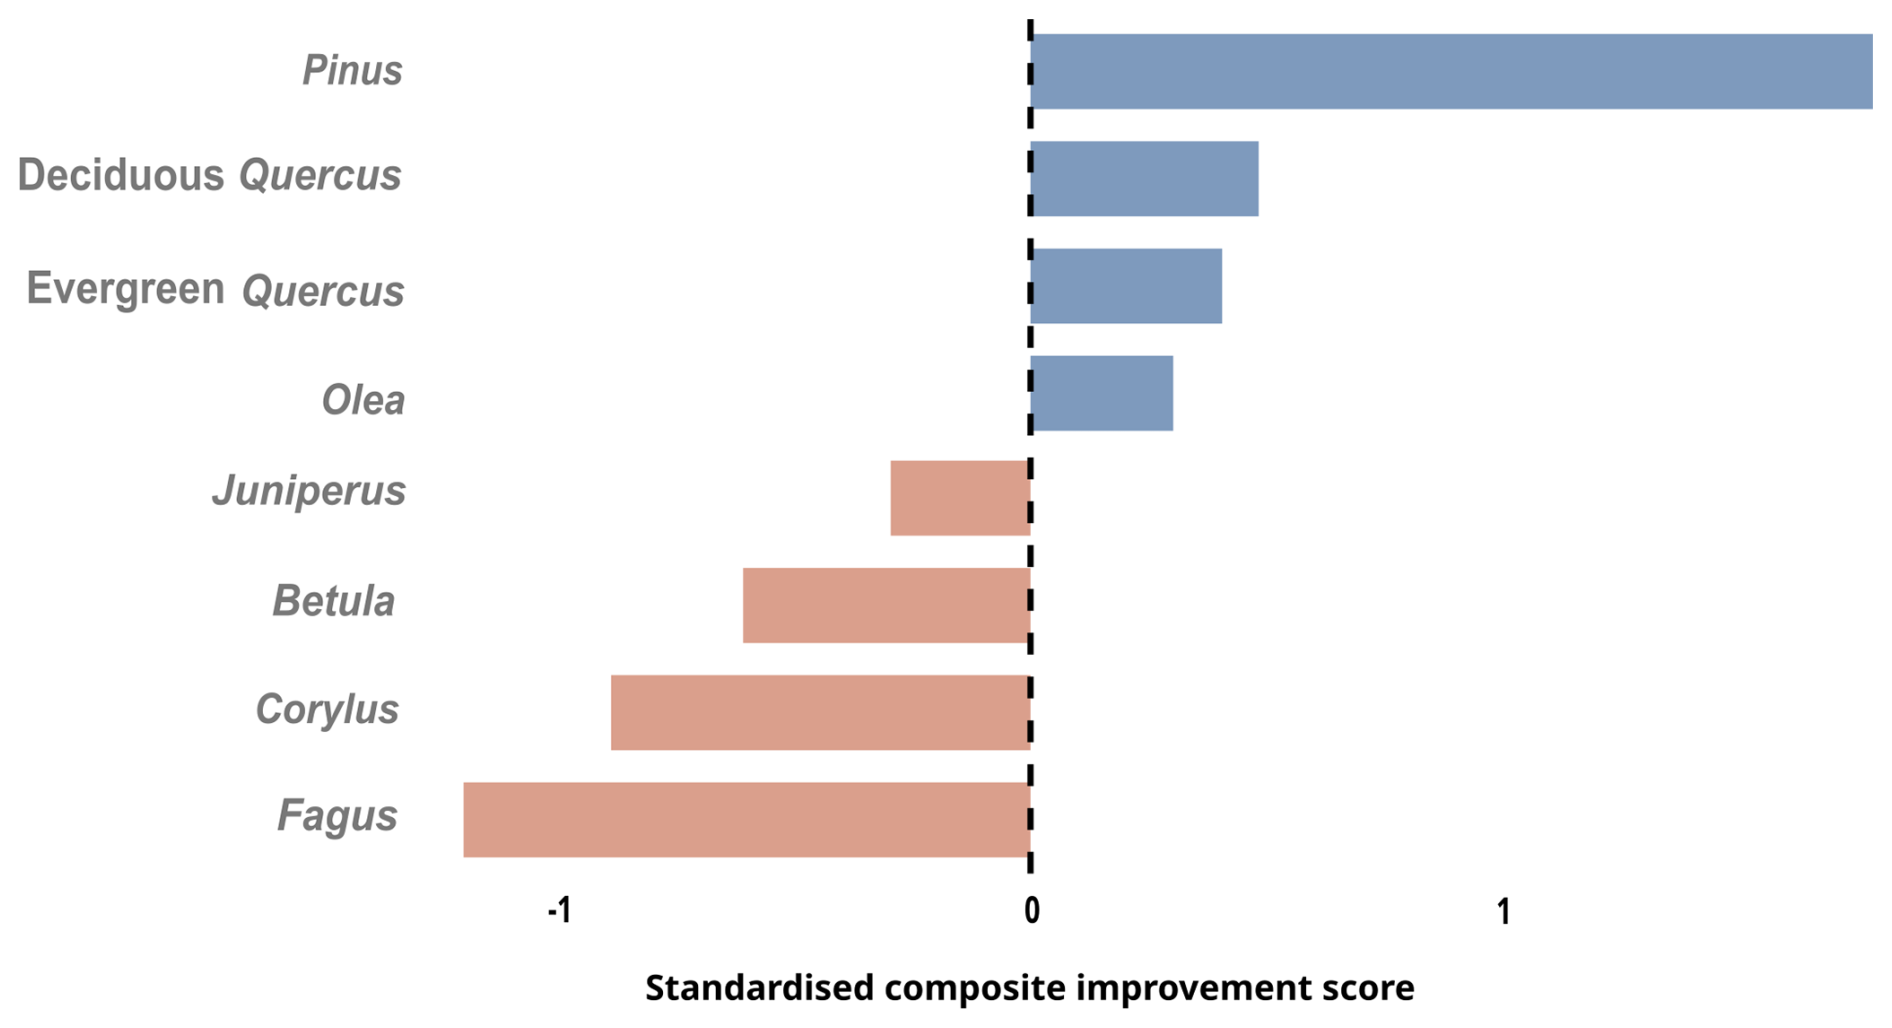
Figure B2Multimetric analysis comparing performance of GPM-REVEALS at 45 km for the selected arboreal taxa. Blue bars refer to positive values (better performance of GPM-REVEALS); red bars refer to negative values (better performance of pollen percentages).
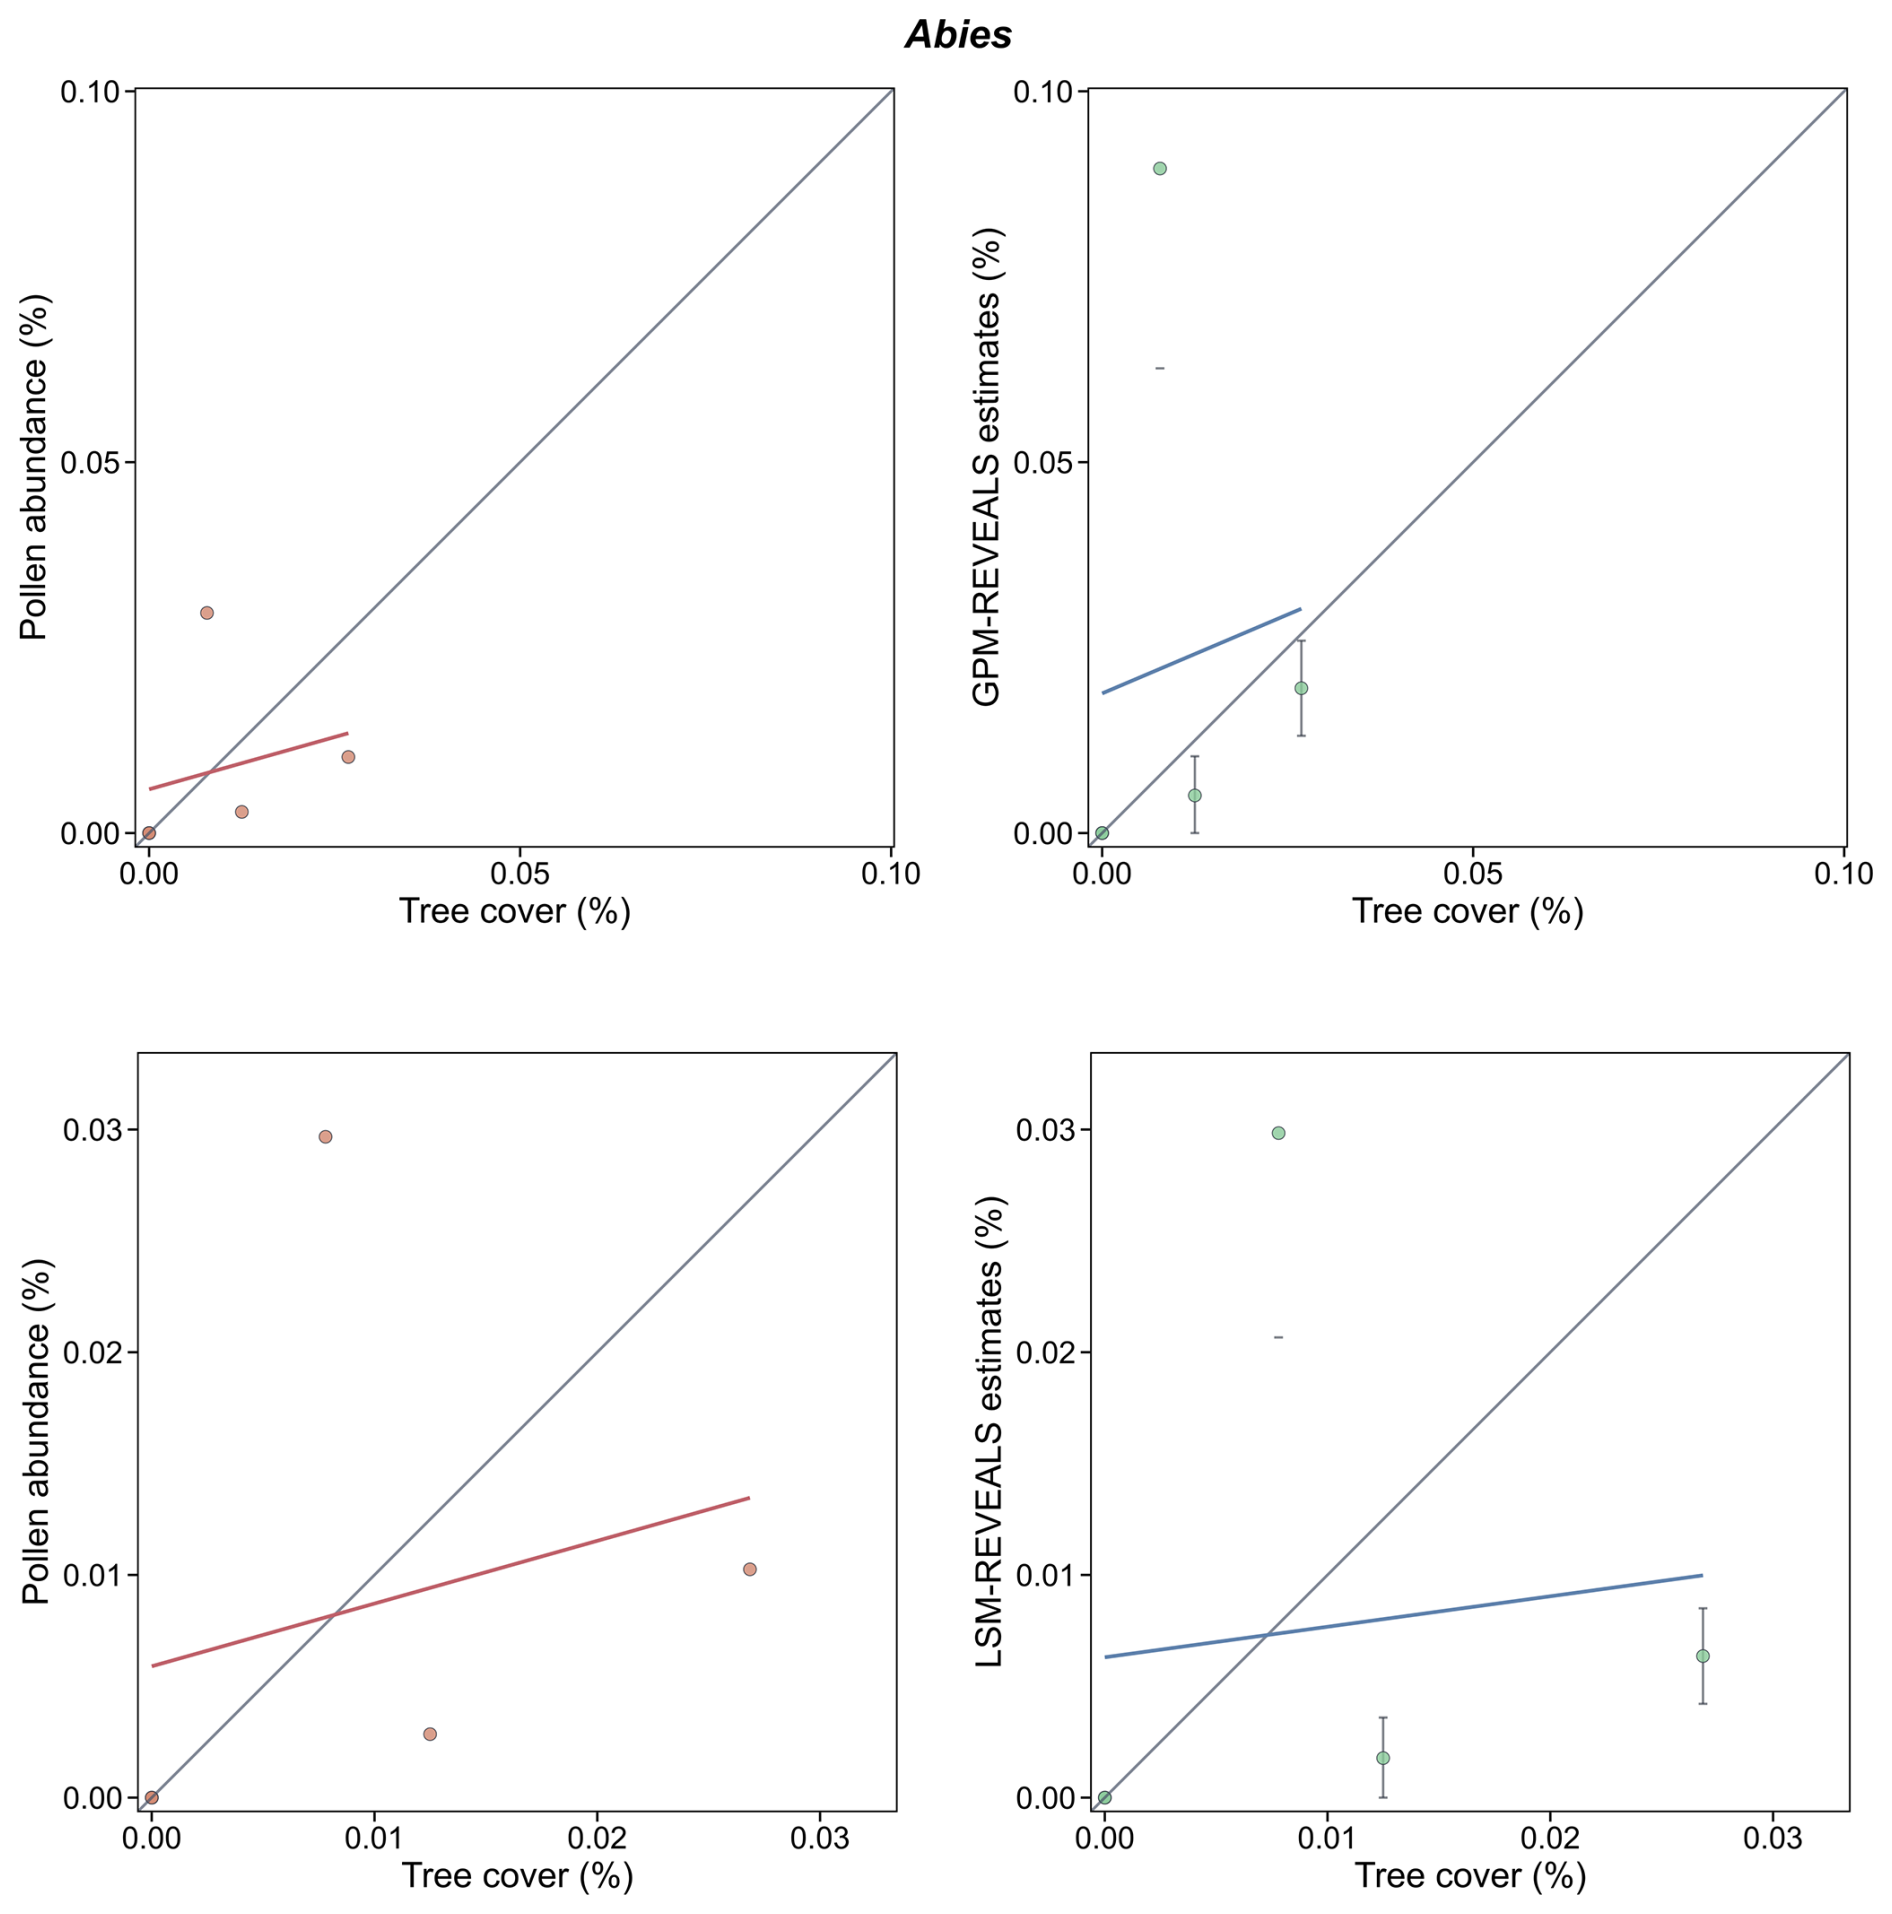
Figure B3Relationship between tree cover (%) at 45 km and pollen abundance (left) and with the REVEALS estimates (right) of GPM-RPPs (up) and LSM-RPPs (bottom) for Abies.
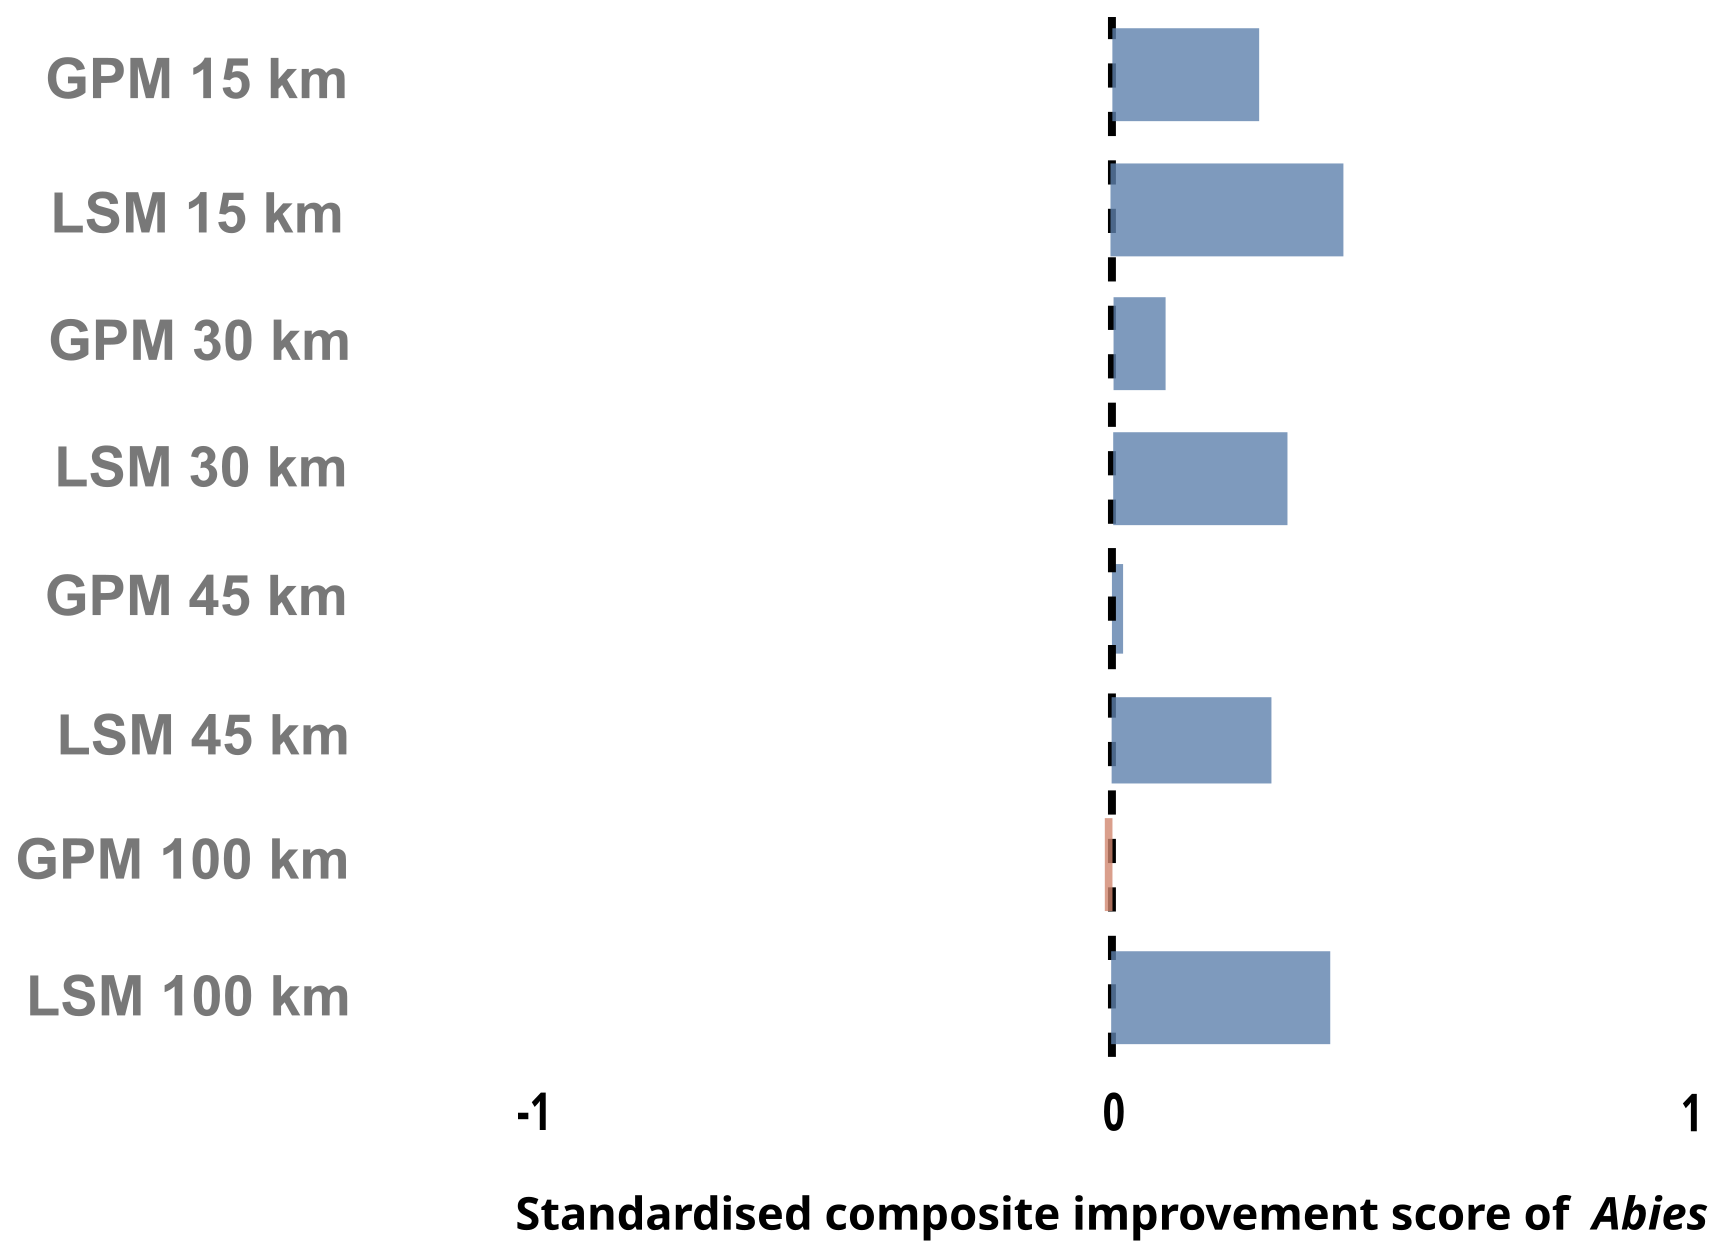
Figure B4Multimetric analysis comparing performance of Abies at different distances, using GPM- and LSM-REVEALS estimates. Blue bars refer to positive values (better performance of GPM-REVEALS); red bars refer to negative values (better performance of pollen percentages).
The numerical workflow and the new RPP dataset for the Spanish Territory of Iberia are publicly available at https://doi.org/10.5281/zenodo.17927544 (Jungkeit-Milla et al., 2025). Users can access and download the code, as well as reproduce the figures presented in this manuscript, using the data provided in Jungkeit-Milla et al. (2025). Data included are: (1) processed pollen counts and regional vegetation proportions for continental Spain, (2) present-day coretops pollen assemblages, REVEALS estimates and rings used for validation, and (3) RPP values from different studies in Europe, in order to proceed with the comparison.
The supplement related to this article is available online at https://doi.org/10.5194/bg-23-6119-2026-supplement.
Conceptualisation: GGR, PGS. Methodology: VA, KJM, GGR, PGS. Software: KJM, VA. Validation: KJM, MM. Formal analysis: VA, KJM. Investigation: KJM, GGR, PGS. Data curation: KJM, VA. Resources: GGR, PGS, XF, MF, FM, FFM, HSO. Writing – Original Draft: KJM, VA, GGR, PGS, HR, EGP. Writing – Review & Editing: MS, JA, ML, MF, FFM, MM, PGS, GGR. Visualisation: KJM, VA, MS. Funding acquisition: GGR, PGS, KJM.
The contact author has declared that none of the authors has any competing interests.
Publisher's note: Copernicus Publications remains neutral with regard to jurisdictional claims made in the text, published maps, institutional affiliations, or any other geographical representation in this paper. The authors bear the ultimate responsibility for providing appropriate place names. Views expressed in the text are those of the authors and do not necessarily reflect the views of the publisher.
Numerous people helped guide this work over the last years. The authors would like to acknowledge Scientific and Technique Analysis Services in Pyrenean Institute of Ecology-CSIC in Zaragoza (Spain) for their technical and analytical support, especially Elena Royo and Aida Adsuar for the laboratory work. We also thank Pedro Sánchez Navarrete and Antonio Vallejo for their help in the field campaigns. We are grateful to Jane Bunting for initial support on the use of ERV models. We thank Alastair Wills for his suggestions regarding regionalisation, as well as for the discussions that helped us to improve this manuscript. We are grateful to the European Pollen Database and Neotoma communities for their altruistic work that fosters free, open palaeo-science. We acknowledge that AI has been used to assist in the revision of the final code.
This research has been supported by the Agencia Estatal de Investigación (grant nos. CORREDORAS (PID2022-141558NB-100) and PYCACHU (PID2019-106050RB-100)), the Agencia Estatal de Investigación, Secretaría de Estado de Investigación, Desarrollo e Innovación (grant nos. DINAMO 3 (CGL2015-69160-R), DINAMO 2 (CGL2012-33063), and DINAMO 1 (CGL2009-07992)), and the Ministerio de Ciencia, Innovación y Universidades (grant no. FPU22/01191).
The article processing charges for this open-access publication were covered in part by the CSIC Open Access Publication Support Initiative through its Unit of Information Resources for Research (URICI).
This paper was edited by Niels de Winter and reviewed by Nathalie Van der Putten and one anonymous referee.
Abraham, V. and Kozáková, R.: Relative pollen productivity estimates in the modern agricultural landscape of Central Bohemia (Czech Republic), Rev. Palaeobot. Palynol., 179, 1–12, https://doi.org/10.1016/j.revpalbo.2012.04.004, 2012.
Abraham, V., Oušková, V., and Kuneš, P.: Present-Day Vegetation Helps Quantifying Past Land Cover in Selected Regions of the Czech Republic, PLoS ONE, 9, e100117, https://doi.org/10.1371/journal.pone.0100117, 2014
Abrantes, F., Voelker, A., Sierro, F. J., Naughton, F., Rodrigues, T., Cacho, I., Ariztegui, D., Brayshaw, D., Sicre, M.-A., and Batista, L.: Paleoclimate Variability in the Mediterranean Region, in: The Climate of the Mediterranean Region, Elsevier, 1–86, https://doi.org/10.1016/B978-0-12-416042-2.00001-X, 2012.
Andersen, M.: Mechanistic Models for the Seed Shadows of Wind-Dispersed Plants, Am. Nat., 137, 476–497, https://doi.org/10.1086/285178, 1991.
Andersen, S. T.: The Relative Pollen Productivity and Pollen Representation of North European Trees, and Correction Factors for Tree Pollen Spectra. Determined by Surface Pollen Analyses from Forests, Dan. Geol. Unders. II Række, 96, 1–99, https://doi.org/10.34194/raekke2.v96.6887, 1970.
Aranbarri, J., González-Sampériz, P., Valero-Garcés, B., Moreno, A., Gil-Romera, G., Sevilla-Callejo, M., García-Prieto, E., Di Rita, F., Mata, M. P., Morellón, M., Magri, D., Rodríguez-Lázaro, J., and Carrión, J. S.: Rapid climatic changes and resilient vegetation during the Lateglacial and Holocene in a continental region of south-western Europe, Glob. Planet. Change, 114, 50–65, https://doi.org/10.1016/j.gloplacha.2014.01.003, 2014.
Aranbarri, J., Alcolea, M., Badal, E., Vila, S., Allué, E., Iriarte-Chiapusso, M. J., Sebastián, M., Magri, D., and González-Sampériz, P.: Holocene history of Aleppo pine (Pinus halepensis Mill.) woodlands in the Ebro Basin (NE Spain): Climate-biased or human-induced?, Rev. Palaeobot. Palynol., 279, 104240, https://doi.org/10.1016/j.revpalbo.2020.104240, 2020.
Baker, A. G., Zimny, M., Keczyński, A., Bhagwat, S. A., Willis, K. J., and Latałowa, M.: Pollen productivity estimates from old-growth forest strongly differ from those obtained in cultural landscapes: Evidence from the Białowieża National Park, Poland, Holocene, 26, 80–92, https://doi.org/10.1177/0959683615596822, 2016.
Bradshaw, R. and Mitchell, F. J. G.: The palaeoecological approach to reconstructing former grazing–vegetation interactions, For. Ecol. Manag., 120, 3–12, https://doi.org/10.1016/S0378-1127(98)00538-6, 1999.
Broström, A., Sugita, S., and Gaillard, M.-J.: Pollen productivity estimates for the reconstruction of past vegetation cover in the cultural landscape of southern Sweden, Holocene, 14, 368–381, https://doi.org/10.1191/0959683604hl713rp, 2004.
Broström, A., Sugita, S., Gaillard, M.-J., and Pilesjö, P.: Estimating the spatial scale of pollen dispersal in the cultural landscape of southern Sweden, Holocene, 15, 252–262, https://doi.org/10.1191/0959683605hl790rp, 2005.
Broström, A., Nielsen, A. B., Gaillard, M.-J., Hjelle, K., Mazier, F., Binney, H., Bunting, J., Fyfe, R., Meltsov, V., Poska, A., Räsänen, S., Soepboer, W., von Stedingk, H., Suutari, H., and Sugita, S.: Pollen productivity estimates of key European plant taxa for quantitative reconstruction of past vegetation: a review, Veg. Hist. Archaeobotany, 17, 461–478, https://doi.org/10.1007/s00334-008-0148-8, 2008.
Bunting, M. J., Armitage, R., Binney, H. A., and Waller, M.: Estimates of`relative pollen productivity' and`relevant source area of pollen' for major tree taxa in two Norfolk (UK) woodlands, Holocene, 15, 459–465, https://doi.org/10.1191/0959683605hl821rr, 2005.
Calcote, R.: Pollen Source Area and Pollen Productivity: Evidence from Forest Hollows, J. Ecol., 83, 591, https://doi.org/10.2307/2261627, 1995.
Cañellas-Boltà, N., Rull, V., Vigo, J., and Mercadé, A.: Modern pollen – vegetation relationships along an altitudinal transect in the central Pyrenees (southwestern Europe), Holocene, 19, 1185–1200, https://doi.org/10.1177/0959683609345082, 2009.
Carrión, J. S., Munuera, M., Ochando, J., et al.: Paleoflora y Paleovegetación Ibérica III: Holoceno, edited by: Fundación Séneca, Ministerio de Ciencia e Innovación, 1095 pp., ISBN 978-84-09-44691-9, 2022.
Carrión, J. S., Yll, E. I., Willis, K. J., and Sánchez, P.: Holocene forest history of the eastern plateaux in the Segura Mountains (Murcia, southeastern Spain), Rev. Palaeobot. Palynol., 132, 219–236, https://doi.org/10.1016/j.revpalbo.2004.07.002, 2004.
Carrión, J. S., Fernández, S., González-Sampériz, P., Gil-Romera, G., Badal, E., Carrión-Marco, Y., López-Merino, L., López-Sáez, J. A., Fierro, E., and Burjachs, F.: Expected trends and surprises in the Lateglacial and Holocene vegetation history of the Iberian Peninsula and Balearic Islands, Rev. Palaeobot. Palynol., 162, 458–475, https://doi.org/10.1016/j.revpalbo.2009.12.007, 2010a.
Carrión, Y., Ntinou, M., and Badal, E.: Olea europaea L. in the North Mediterranean Basin during the Pleniglacial and the Early–Middle Holocene, Quat. Sci. Rev., 29, 952–968, https://doi.org/10.1016/j.quascirev.2009.12.015, 2010b.
Carroll, R. J. and Ruppert, D.: Transformation and Weighting in Regression, Chapman and Hall, New York, https://doi.org/10.1201/9780203735268, 1988.
Castroviejo, S. (Coord.): Flora ibérica. Plantas vasculares de la Península Ibérica e Islas Baleares, vols. 1–8, 10–15, 17–18 y 21. Madrid: Real Jardín Botánico, CSIC, 1986–2012.
Chaput, M. A. and Gajewski, K.: Relative pollen productivity estimates and changes in Holocene vegetation cover in the deciduous forest of southeastern Quebec, Canada, Botany, 96, 299–317, https://doi.org/10.1139/cjb-2017-0193, 2018.
Chazarra, A., Flórez-García, E., Peraza-Sánchez, B., Tohá-Rebull, T., Lorenzo-Mariño, B., Criado-Pinto, E., Moreno-García, J. V., Romero-Fresneda, R., and Botey-Fullat, R.: Mapas climáticos de España (1981–2010) y ETo (1996–2016), Agencia Estatal de Meteorología, https://doi.org/10.31978/014-18-004-2, 2018.
Cheddadi, R., Lamb, H. F., Guiot, J., and Van Der Kaars, S.: Holocene climatic change in Morocco: a quantitative reconstruction from pollen data, Clim. Dynam., 14, 883–890, https://doi.org/10.1007/s003820050262, 1998.
Commerford, J. L., McLauchlan, K. K., and Sugita, S.: Calibrating vegetation cover and grassland pollen assemblages in the Flint Hills of Kansas, USA, Am. J. Plant Sci., 4, 1–10, https://doi.org/10.4236/ajps.2013.47A1001, 2013.
Connor, S. E., Vannière, B., Colombaroli, D., Anderson, R. S., Carrión, J. S., Ejarque, A., Gil Romera, G., González-Sampériz, P., Hoefer, D., Morales-Molino, C., Revelles, J., Schneider, H., Van Der Knaap, W. O., Van Leeuwen, J. F., and Woodbridge, J.: Humans take control of fire-driven diversity changes in Mediterranean Iberia's vegetation during the mid–late Holocene, Holocene, 29, 886–901, https://doi.org/10.1177/0959683619826652, 2019.
Costa, M., Morla, C., and Sainz-Ollero, H.: Los bosques ibéricos. Una interpretación geobotánica., Planeta, 598 pp., ISBN 978-84-08-05820-5, 1998.
Cowling, R. M., Rundel, P. W., Lamont, B. B., Kalin Arroyo, M., and Arianoutsou, M.: Plant diversity in mediterranean-climate regions, Trends Ecol. Evol., 11, 362–366, https://doi.org/10.1016/0169-5347(96)10044-6, 1996.
Davis, B. A. S., Chevalier, M., Sommer, P., Carter, V. A., Finsinger, W., Mauri, A., Phelps, L. N., Zanon, M., Abegglen, R., Åkesson, C. M., Alba-Sánchez, F., Anderson, R. S., Antipina, T. G., Atanassova, J. R., Beer, R., Belyanina, N. I., Blyakharchuk, T. A., Borisova, O. K., Bozilova, E., Bukreeva, G., Bunting, M. J., Clò, E., Colombaroli, D., Combourieu-Nebout, N., Desprat, S., Di Rita, F., Djamali, M., Edwards, K. J., Fall, P. L., Feurdean, A., Fletcher, W., Florenzano, A., Furlanetto, G., Gaceur, E., Galimov, A. T., Gałka, M., García-Moreiras, I., Giesecke, T., Grindean, R., Guido, M. A., Gvozdeva, I. G., Herzschuh, U., Hjelle, K. L., Ivanov, S., Jahns, S., Jankovska, V., Jiménez-Moreno, G., Karpińska-Kołaczek, M., Kitaba, I., Kołaczek, P., Lapteva, E. G., Latałowa, M., Lebreton, V., Leroy, S., Leydet, M., Lopatina, D. A., López-Sáez, J. A., Lotter, A. F., Magri, D., Marinova, E., Matthias, I., Mavridou, A., Mercuri, A. M., Mesa-Fernández, J. M., Mikishin, Y. A., Milecka, K., Montanari, C., Morales-Molino, C., Mrotzek, A., Muñoz Sobrino, C., Naidina, O. D., Nakagawa, T., Nielsen, A. B., Novenko, E. Y., Panajiotidis, S., Panova, N. K., Papadopoulou, M., Pardoe, H. S., Pędziszewska, A., Petrenko, T. I., Ramos-Román, M. J., Ravazzi, C., Rösch, M., Ryabogina, N., Sabariego Ruiz, S., Salonen, J. S., Sapelko, T. V., Schofield, J. E., Seppä, H., Shumilovskikh, L., Stivrins, N., Stojakowits, P., Svobodova Svitavska, H., Święta-Musznicka, J., Tantau, I., Tinner, W., Tobolski, K., Tonkov, S., Tsakiridou, M., Valsecchi, V., Zanina, O. G., and Zimny, M.: The Eurasian Modern Pollen Database (EMPD), version 2, Earth Syst. Sci. Data, 12, 2423–2445, https://doi.org/10.5194/essd-12-2423-2020, 2020.
Davis, M. B.: On the theory of pollen analysis, Am. J. Sci., 261, 897–912, 1963.
Dawson, A., Paciorek, C. J., McLachlan, J. S., Goring, S., Williams, J. W., and Jackson, S. T.: Quantifying pollen-vegetation relationships to reconstruct ancient forests using 19th-century forest composition and pollen data, Quat. Sci. Rev., 137, 156–175, https://doi.org/10.1016/j.quascirev.2016.01.012, 2016.
Duffin, K. I. and Bunting, M. J.: Relative pollen productivity and fall speed estimates for southern African savanna taxa, Veg. Hist. Archaeobotany, 17, 507–525, https://doi.org/10.1007/s00334-007-0101-2, 2008.
Ellenberg, H.: Vegetation ecology of Central Europe, 4. edn., Cambridge Univ. Press, Cambridge, 731 pp., ISBN 9780521236423, 1988.
Ellis, E. C.: Land Use and Ecological Change: A 12,000-Year History, Annu. Rev. Environ. Resour., 46, 1–33, https://doi.org/10.1146/annurev-environ-012220-010822, 2021.
Ergin, E., Marquer, L., Mazier, F., Bisson, U., and Dalfes, H. N.: Relative Pollen Productivity Estimates for Mediterranean Plant Taxa: A New Study Region in Turkey, Land, 13, 591, https://doi.org/10.3390/land13050591, 2024.
European Environment Agency: CORINE Land Cover 2018 (vector), Europe, 6-yearly – version 2020_20u1, May 2020 (20.01), EEA [data set], https://doi.org/10.2909/71C95A07-E296-44FC-B22B-415F42ACFDF0, 2019.
Ezquerra, F. J., Cañas, I., Oria-de-Rueda, J. A., and Rubiales, J. M.: Late-Holocene fossil evidence and the interpretation of the vegetation in NW Iberia: management issues in the light of palaeoecological findings, Veg. Hist. Archaeobotany, 28, 35–50, https://doi.org/10.1007/s00334-018-0684-9, 2019.
Fang, Y., Ma, C., and Bunting, M. J.: Novel methods of estimating relative pollen productivity: A key parameter for reconstruction of past land cover from pollen records, Prog. Phys. Geogr. Earth Environ., 43, 731–753, https://doi.org/10.1177/0309133319861808, 2019.
Fernández, S., Fuentes, N., Carrión, J. S., González-Sampériz, P., Montoya, E., Gil, G., Vega-Toscano, G., and Riquelme, J. A.: Holocene and Upper Pleistocene pollen sequence of Carihuela Cave, southern Spain, Geobios, 40, 75–90, https://doi.org/10.1016/j.geobios.2006.01.004, 2007.
Fernández-Rodríguez, S., Skjøth, C. A., Tormo-Molina, R., Brandao, R., Caeiro, E., Silva-Palacios, I., Gonzalo-Garijo, Á., and Smith, M.: Identification of potential sources of airborne Olea pollen in the Southwest Iberian Peninsula, Int. J. Biometeorol., 58, 337–348, https://doi.org/10.1007/s00484-012-0629-4, 2014.
Folashade, D., Ooi, H., Callaway, R., Microsoft Corporation, and Weston, S.: foreach: Provides Foreach Looping Construct, CRAN [code], https://doi.org/10.32614/CRAN.package.foreach, 2009.
Folashade, D., Microsoft Corporation, Weston, S., and Tenenbaum, D.: doParallel: Foreach Parallel Adaptor for the “parallel” Package, CRAN [code], https://doi.org/10.32614/CRAN.package.doParallel, 2011.
Font, X., Balcells, L., and Mora, B.: The Plot-Based Databases of the Iberian Vegetation, in: The Vegetation of the Iberian Peninsula, vol. 13, edited by: Loidi, J., Springer International Publishing, Cham, 565–579, https://doi.org/10.1007/978-3-319-54867-8_13, 2017.
Fyfe, R. M., Woodbridge, J., and Roberts, N.: From forest to farmland: pollen–inferred land cover change across Europe using the pseudobiomization approach, Glob. Change Biol., 21, 1197–1212, https://doi.org/10.1111/gcb.12776, 2015.
Garreta, V., Guiot, J., Mortier, F., Chadœuf, J., and Hély, C.: Pollen-based climate reconstruction: Calibration of the vegetation–pollen processes, Ecol. Model., 235–236, 81–94, https://doi.org/10.1016/j.ecolmodel.2012.03.031, 2012.
Gavilán, R. G., Vilches, B., Gutiérrez-Girón, A., Blanquer, J. M., and Escudero, A.: Sclerophyllous Versus Deciduous Forests in the Iberian Peninsula: A Standard Case of Mediterranean Climatic Vegetation Distribution, in: Geographical Changes in Vegetation and Plant Functional Types, edited by: Greller, A. M., Fujiwara, K., and Pedrotti, F., Springer International Publishing, Cham, 101–116, https://doi.org/10.1007/978-3-319-68738-4_5, 2018.
Gil-Romera, G., González-Sampériz, P., Lasheras-Álvarez, L., Sevilla-Callejo, M., Moreno, A., Valero-Garcés, B., López-Merino, L., Carrión, J. S., Pérez Sanz, A., Aranbarri, J., and García-Prieto Fronce, E.: Biomass-modulated fire dynamics during the Last Glacial–Interglacial Transition at the Central Pyrenees (Spain), Palaeogeogr. Palaeocl., 402, 113–124, https://doi.org/10.1016/j.palaeo.2014.03.015, 2014.
Githumbi, E., Fyfe, R., Gaillard, M.-J., Trondman, A.-K., Mazier, F., Nielsen, A.-B., Poska, A., Sugita, S., Woodbridge, J., Azuara, J., Feurdean, A., Grindean, R., Lebreton, V., Marquer, L., Nebout-Combourieu, N., Stančikaitė, M., Tanţău, I., Tonkov, S., Shumilovskikh, L., and LandClimII data contributors: European pollen-based REVEALS land-cover reconstructions for the Holocene: methodology, mapping and potentials, Earth Syst. Sci. Data, 14, 1581–1619, https://doi.org/10.5194/essd-14-1581-2022, 2022.
Gomes, S. D., Fletcher, W. J., Rodrigues, T., Stone, A., Abrantes, F., and Naughton, F.: Time-transgressive Holocene maximum of temperate and Mediterranean forest development across the Iberian Peninsula reflects orbital forcing, Palaeogeogr. Palaeocl., 550, 109739, https://doi.org/10.1016/j.palaeo.2020.109739, 2020.
González-Sampériz, P., Valero-Garcés, B. L., Moreno, A., Jalut, G., García-Ruiz, J. M., Martí-Bono, C., Delgado-Huertas, A., Navas, A., Otto, T., and Dedoubat, J. J.: Climate variability in the Spanish Pyrenees during the last 30,000 yr revealed by the El Portalet sequence, Quat. Res., 66, 38–52, https://doi.org/10.1016/j.yqres.2006.02.004, 2006.
González-Sampériz, P., Leroy, S. A. G., Carrión, J. S., Fernández, S., García-Antón, M., Gil-García, M. J., Uzquiano, P., Valero-Garcés, B., and Figueiral, I.: Steppes, savannahs, forests and phytodiversity reservoirs during the Pleistocene in the Iberian Peninsula, Rev. Palaeobot. Palynol., 162, 427–457, https://doi.org/10.1016/j.revpalbo.2010.03.009, 2010.
González-Sampériz, P., Gil-Romera, G., García-Prieto, E., Aranbarri, J., Moreno, A., Morellón, M., Sevilla-Callejo, M., Leunda, M., Santos, L., Franco-Múgica, F., Andrade, A., Carrión, J. S., and Valero-Garcés, B. L.: Strong continentality and effective moisture drove unforeseen vegetation dynamics since the last interglacial at inland Mediterranean areas: The Villarquemado sequence in NE Iberia, Quat. Sci. Rev., 242, 106425, https://doi.org/10.1016/j.quascirev.2020.106425, 2020.
Gregory, P. H.: The microbiology of the atmosphere, 2nd edn., Leonard Hill, Aylesbury, London, ISBN 978-0249441109, 1961
Grindean, R., Nielsen, A. B., Tanţău, I., and Feurdean, A.: Relative pollen productivity estimates in the forest steppe landscape of southeastern Romania, Rev. Palaeobot. Palynol., 264, 54–63, https://doi.org/10.1016/j.revpalbo.2019.02.007, 2019.
Han, Y., Liu, H., Hao, Q., Liu, X., Guo, W., and Shangguan, H.: More reliable pollen productivity estimates and relative source area of pollen in a forest-steppe ecotone with improved vegetation survey, Holocene, 27, 1567–1577, https://doi.org/10.1177/0959683617702234, 2017.
He, F., Li, Y., Wu, J., and Xu, Y.: A comparison of relative pollen productivity from forest steppe, typical steppe and desert steppe in Inner Mongolia, Chin. Sci. Bull., 61, 3388–3400, https://doi.org/10.1360/N972016-00482, 2016.
Hellman, S., Gaillard, M.-J., Broström, A., and Sugita, S.: The REVEALS model, a new tool to estimate past regional plant abundance from pollen data in large lakes: validation in southern Sweden, J. Quat. Sci., 23, 21–42, https://doi.org/10.1002/jqs.1126, 2008.
Hjelle, K. L.: Herb pollen representation in surface moss samples from mown meadows and pastures in western Norway, Veg. Hist. Archaeobotany, 7, 79–96, https://doi.org/10.1007/BF01373926, 1998.
Hjelle, K. L. and Sugita, S.: Estimating pollen productivity and relevant source area of pollen using lake sediments in Norway: How does lake size variation affect the estimates?, Holocene, 22, 313–324, https://doi.org/10.1177/0959683611423690, 2012.
Huntley, B.: European vegetation history: Palaeovegetation maps from pollen data – 13 000 yr BP to present, J. Quat. Sci., 5, 103–122, https://doi.org/10.1002/jqs.3390050203, 1990.
IPCC: Climate Change 2022 – Impacts, Adaptation and Vulnerability: Working Group II Contribution to the Sixth Assessment Report of the Intergovernmental Panel on Climate Change, 1st edn., Cambridge University Press, https://doi.org/10.1017/9781009325844, 2023.
Jackson, S. T. and Lyford, M. E.: Pollen dispersal models in Quaternary plant ecology: Assumptions, parameters, and prescriptions, Bot. Rev., 65, 39–75, https://doi.org/10.1007/BF02856557, 1999.
Jiang, F., Xu, Q., Zhang, S., Li, F., Zhang, K., Wang, M., Shen, W., Sun, Y., and Zhou, Z.: Relative pollen productivities of the major plant taxa of subtropical evergreen–deciduous mixed woodland in China, J. Quat. Sci., 35, 526–538, https://doi.org/10.1002/jqs.3197, 2020.
Jungkeit-Milla, K., Abraham, V., González-Sampériz, P., and Gil-Romera, G.: Novel relative pollen productivity estimates for the Western Mediterranean – Code and dataset, Zenodo [code and data set], https://doi.org/10.5281/zenodo.17927544, 2025.
Katul, G. G., Porporato, A., Nathan, R., Siqueira, M., Soons, M. B., Poggi, D., Horn, H. S., and Levin, S. A.: Mechanistic Analytical Models for Long–Distance Seed Dispersal by Wind, Am. Nat., 166, 368–381, https://doi.org/10.1086/432589, 2005.
Knight, C. A., Battles, J. J., Bunting, M. J., Champagne, M., Wanket, J. A., and Wahl, D. B.: Methods for robust estimates of tree biomass from pollen accumulation rates: Quantifying paleoecological reconstruction uncertainty, Front. Ecol. Evol., 10, 956143, https://doi.org/10.3389/fevo.2022.956143, 2022.
Kuneš, P., Abraham, V., Werchan, B., Plesková, Z., Fajmon, K., Jamrichová, E., and Roleček, J.: Relative pollen productivity estimates for vegetation reconstruction in central-eastern Europe inferred at local and regional scales, Holocene, 29, 1708–1719, https://doi.org/10.1177/0959683619862026, 2019.
Kuparinen, A.: Mechanistic models for wind dispersal, Trends Plant Sci., 11, 296–301, https://doi.org/10.1016/j.tplants.2006.04.006, 2006.
Kuparinen, A., Markkanen, T., Riikonen, H., and Vesala, T.: Modeling air-mediated dispersal of spores, pollen and seeds in forested areas, Ecol. Model., 208, 177–188, https://doi.org/10.1016/j.ecolmodel.2007.05.023, 2007.
Langgut, D., Cheddadi, R., Carrión, J. S., Cavanagh, M., Colombaroli, D., Eastwood, W. J., Greenberg, R., Litt, T., Mercuri, A. M., Miebach, A., Roberts, C. N., Woldring, H., and Woodbridge, J.: The origin and spread of olive cultivation in the Mediterranean Basin: The fossil pollen evidence, Holocene, 29, 902–922, https://doi.org/10.1177/0959683619826654, 2019.
Leunda, M., González-Sampériz, P., Gil-Romera, G., Aranbarri, J., Moreno, A., Oliva-Urcia, B., Sevilla-Callejo, M., and Valero-Garcés, B.: The Late-Glacial and Holocene Marboré Lake sequence (2612 m a.s.l., Central Pyrenees, Spain): Testing high altitude sites sensitivity to millennial scale vegetation and climate variability, Glob. Planet. Change, 157, 214–231, https://doi.org/10.1016/j.gloplacha.2017.08.008, 2017.
Leunda, M., Gil-Romera, G., Daniau, A.-L., Benito, B. M., and González-Sampériz, P.: Holocene fire and vegetation dynamics in the Central Pyrenees (Spain), CATENA, 188, 104411, https://doi.org/10.1016/j.catena.2019.104411, 2020.
Li, F., Gaillard, M.-J., Xie, S., Huang, K., Cui, Q., Fyfe, R., Marquer, L., and Sugita, S.: Evaluation of relative pollen productivities in temperate China for reliable pollen-based quantitative reconstructions of Holocene plant cover, Front. Plant Sci., 14, 1240485, https://doi.org/10.3389/fpls.2023.1240485, 2023.
Li, Y., Bunting, M. J., Xu, Q., Jiang, S., Ding, W., and Hun, L.: Pollen-vegetation-climate relationships in some desert and desert-steppe communities in northern China, Holocene, 21, 997–1010, https://doi.org/10.1177/0959683611400202, 2011.
Liu, M., Shen, Y., González-Sampériz, P., Gil-Romera, G., ter Braak, C. J. F., Prentice, I. C., and Harrison, S. P.: Holocene climates of the Iberian Peninsula: pollen-based reconstructions of changes in the west–east gradient of temperature and moisture, Clim. Past, 19, 803–834, https://doi.org/10.5194/cp-19-803-2023, 2023.
Liu, Y., Ogle, K., Lichstein, J. W., and Jackson, S. T.: Estimation of pollen productivity and dispersal: How pollen assemblages in small lakes represent vegetation, Ecol. Monogr., https://doi.org/10.1002/ecm.1513, 2022.
López-Orozco, R., García-Mozo, H., Oteros, J., and Galán, C.: Long-term trends and influence of climate and land-use changes on pollen profiles of a Mediterranean oak forest, Sci. Total Environ., 897, 165400, https://doi.org/10.1016/j.scitotenv.2023.165400, 2023.
Maestre, F. T., Benito, B. M., Berdugo, M., Concostrina-Zubiri, L., Delgado-Baquerizo, M., Eldridge, D. J., Guirado, E., Gross, N., Kéfi, S., Le Bagousse-Pinguet, Y., Ochoa-Hueso, R., and Soliveres, S.: Biogeography of global drylands, New Phytol., 231, 540–558, https://doi.org/10.1111/nph.17395, 2021.
Magri, D., Di Rita, F., Aranbarri, J., Fletcher, W., and González-Sampériz, P.: Quaternary disappearance of tree taxa from Southern Europe: Timing and trends, Quat. Sci. Rev., 163, 23–55, https://doi.org/10.1016/j.quascirev.2017.02.014, 2017.
Mariani, M., Connor, S. E., Theuerkauf, M., Kuneš, P., and Fletcher, M.-S.: Testing quantitative pollen dispersal models in animal-pollinated vegetation mosaics: An example from temperate Tasmania, Australia, Quat. Sci. Rev., 154, 214–225, https://doi.org/10.1016/j.quascirev.2016.10.020, 2016.
Mariani, M., Connor, S. E., Fletcher, M., Theuerkauf, M., Kuneš, P., Jacobsen, G., Saunders, K. M., and Zawadzki, A.: How old is the Tasmanian cultural landscape? A test of landscape openness using quantitative land–cover reconstructions, J. Biogeogr., 44, 2410–2420, https://doi.org/10.1111/jbi.13040, 2017.
Mariani, M., Connor, S. E., Theuerkauf, M., Herbert, A., Kuneš, P., Bowman, D., Fletcher, M., Head, L., Kershaw, A. P., Haberle, S. G., Stevenson, J., Adeleye, M., Cadd, H., Hopf, F., and Briles, C.: Disruption of cultural burning promotes shrub encroachment and unprecedented wildfires, Front. Ecol. Environ., 20, 292–300, https://doi.org/10.1002/fee.2395, 2022.
Marquer, L., Mazier, F., Sugita, S., Galop, D., Houet, T., Faure, E., Gaillard, M.-J., Haunold, S., de Munnik, N., Simonneau, A., De Vleeschouwer, F., and Le Roux, G.: Pollen-based reconstruction of Holocene land-cover in mountain regions: Evaluation of the Landscape Reconstruction Algorithm in the Vicdessos valley, northern Pyrenees, France, Quat. Sci. Rev., 228, 106049, https://doi.org/10.1016/j.quascirev.2019.106049, 2020.
Martín-Puertas, C., Valero-Garcés, B. L., Pilar Mata, M., González-Sampériz, P., Bao, R., Moreno, A., and Stefanova, V.: Arid and humid phases in southern Spain during the last 4000 years: the Zoñar Lake record, Córdoba, Holocene, 18, 907–921, https://doi.org/10.1177/0959683608093533, 2008.
Matthias, I., Nielsen, A. B., and Giesecke, T.: Evaluating the effect of flowering age and forest structure on pollen productivity estimates, Veg. Hist. Archaeobotany, 21, 471–484, https://doi.org/10.1007/s00334-012-0373-z, 2012.
Mazier, F., Broström, A., Gaillard, M.-J., Sugita, S., Vittoz, P., and Buttler, A.: Pollen productivity estimates and relevant source area of pollen for selected plant taxa in a pasture woodland landscape of the Jura Mountains (Switzerland), Veg. Hist. Archaeobotany, 17, 479–495, https://doi.org/10.1007/s00334-008-0143-0, 2008.
Médail, F. and Quézel, P.: Biodiversity Hotspots in the Mediterranean Basin: Setting Global Conservation Priorities, Conserv. Biol., 13, 1510–1513, https://doi.org/10.1046/j.1523-1739.1999.98467.x, 1999.
Ministerio para la Transición Ecológica y el Reto Demográfico (MITECO): Mapa Forestal de España (MFE) de máxima actualidad, MITECO, Madrid, Spain [data set], https://www.miteco.gob.es/es/biodiversidad/servicios/banco-datos-naturaleza/informacion-disponible/cartografia_informacion_disp.html (last access: 28 August 2026), 2024.
Moreno, A., González-Sampériz, P., Morellón, M., Valero-Garcés, B. L., and Fletcher, W. J.: Northern Iberian abrupt climate change dynamics during the last glacial cycle: A view from lacustrine sediments, Quat. Sci. Rev., 36, 139–153, https://doi.org/10.1016/j.quascirev.2010.06.031, 2012.
Morrison, K. D., Hammer, E., Boles, O., Madella, M., Whitehouse, N., Gaillard, M.-J., Bates, J., Vander Linden, M., Merlo, S., Yao, A., Popova, L., Hill, A. C., Antolin, F., Bauer, A., Biagetti, S., Bishop, R. R., Buckland, P., Cruz, P., Dreslerová, D., Dusseldorp, G., Ellis, E., Filipovic, D., Foster, T., Hannaford, M. J., Harrison, S. P., Hazarika, M., Herold, H., Hilpert, J., Kaplan, J. O., Kay, A., Klein Goldewijk, K., Kolář, J., Kyazike, E., Laabs, J., Lancelotti, C., Lane, P., Lawrence, D., Lewis, K., Lombardo, U., Lucarini, G., Arroyo-Kalin, M., Marchant, R., Mayle, F., McClatchie, M., McLeester, M., Mooney, S., Moskal-del Hoyo, M., Navarrete, V., Ndiema, E., Góes Neves, E., Nowak, M., Out, W. A., Petrie, C., Phelps, L. N., Pinke, Z., Rostain, S., Russell, T., Sluyter, A., Styring, A. K., Tamanaha, E., Thomas, E., Veerasamy, S., Welton, L., and Zanon, M.: Mapping past human land use using archaeological data: A new classification for global land use synthesis and data harmonization, PLOS ONE, 16, e0246662, https://doi.org/10.1371/journal.pone.0246662, 2021.
Múgica, F. F., Antón, M. G., Ruiz, J. M., Juaristi, C. M., and Ollerol, H. S.: Holocene history of Pinnus forests in the Spanish Northern Meseta, Holocene, 11, 343–358, https://doi.org/10.1191/095968301669474913, 2001.
Mullen, K., Ardia, D., Gil, D., Windover, D., and Cline, J.: DEoptim : An R Package for Global Optimization by Differential Evolution, J. Stat. Softw., 40, https://doi.org/10.18637/jss.v040.i06, 2011.
Mutke, S., Gordo, J., Chambel, M. R., Prada, M. A., Álvarez, D., Iglesias, S., and Gil, L.: Phenotypic plasticity is stronger than adaptative differentiation among Mediterranean stone pine provenances, For. Syst., 19, 354–366, https://doi.org/10.5424/fs/2010193-9097, 2010.
Nielsen, A. B.: Modelling pollen sedimentation in Danish lakes at c. ad 1800: an attempt to validate the POLLSCAPE model, J. Biogeogr., 31, 1693–1709, https://doi.org/10.1111/j.1365-2699.2004.01080.x, 2004.
Niemeyer, B., Klemm, J., Pestryakova, L. A., and Herzschuh, U.: Relative pollen productivity estimates for common taxa of the northern Siberian Arctic, Rev. Palaeobot. Palynol., 221, 71–82, https://doi.org/10.1016/j.revpalbo.2015.06.008, 2015.
Nikulina, A., MacDonald, K., Zapolska, A., Serge, M. A., Roche, D. M., Mazier, F., Davoli, M., Svenning, J.-C., van Wees, D., Pearce, E. A., Fyfe, R., Roebroeks, W., and Scherjon, F.: Hunter-gatherer impact on European interglacial vegetation: A modelling approach, Quat. Sci. Rev., 324, 108439, https://doi.org/10.1016/j.quascirev.2023.108439, 2024.
Ninyerola, M., i Fernández, X. P., and Roure, J. M.: Atlas climático digital de la Península Ibérica: metodología y aplicaciones en bioclimatología y geobotánica, ISBN 84-932860-8-7, 2005.
Paciorek, C. J. and McLachlan, J. S.: Mapping Ancient Forests: Bayesian Inference for Spatio-Temporal Trends in Forest Composition Using the Fossil Pollen Proxy Record, J. Am. Stat. Assoc., 104, 608–622, https://doi.org/10.1198/jasa.2009.0026, 2009.
Parsons, R. W. and Prentice, I. C.: Statistical approaches to R-values and the pollen – vegetation relationship, Rev. Palaeobot. Palynol., 32, 127–152, https://doi.org/10.1016/0034-6667(81)90001-4, 1981.
Pearce, E. A., Mazier, F., Normand, S., Fyfe, R., Andrieu, V., Bakels, C., Balwierz, Z., Bińka, K., Boreham, S., Borisova, O. K., Brostrom, A., de Beaulieu, J.-L., Gao, C., González-Sampériz, P., Granoszewski, W., Hrynowiecka, A., Kołaczek, P., Kuneš, P., Magri, D., Malkiewicz, M., Mighall, T., Milner, A. M., Möller, P., Nita, M., Noryśkiewicz, B., Pidek, I. A., Reille, M., Robertsson, A.-M., Salonen, J. S., Schläfli, P., Schokker, J., Scussolini, P., eirienė, V., Strahl, J., Urban, B., Winter, H., and Svenning, J.-C.: Substantial light woodland and open vegetation characterized the temperate forest biome before Homo sapiens, Sci. Adv., 9, eadi9135, https://doi.org/10.1126/sciadv.adi9135, 2023.
Pearce, E. A., Mazier, F., Davison, C. W., Baines, O., Czyżewski, S., Fyfe, R., Bińka, K., Boreham, S., De Beaulieu, J.-L., Gao, C., Granoszewski, W., Hrynowiecka, A., Malkiewicz, M., Mighall, T., Noryśkiewicz, B., Pidek, I. A., Strahl, J., Winter, H., and Svenning, J.-C.: Beyond the closed-forest paradigm: Cross-scale vegetation structure in temperate Europe before the late-Quaternary megafauna extinctions, Earth Hist. Biodivers., 3, 100022, https://doi.org/10.1016/j.hisbio.2025.100022, 2025a.
Pearce, E. A., Davison, C. W., Mazier, F., Normand, S., Fyfe, R., Serge, M., Scussolini, P., and Svenning, J.: Drivers of Vegetation Structure Differ Between Proposed Natural Reference Conditions for Temperate Europe, Glob. Ecol. Biogeogr., 34, https://doi.org/10.1111/geb.70020, 2025b.
Pérez-Obiol, R., Jalut, G., Julià, R., Pèlachs, A., Iriarte, M. J., Otto, T., and Hernández-Beloqui, B.: Mid-Holocene vegetation and climatic history of the Iberian Peninsula, Holocene, 21, 75–93, https://doi.org/10.1177/0959683610384161, 2011.
Peterken, G. F.: Natural woodland: ecology and conservation in northern temperate regions, Reprinted., Cambridge Univ. Press, New York, 522 pp., ISBN 978-0-521-36792-9, 2001.
Pirzamanbein, B., Lindström, J., Poska, A., Sugita, S., Trondman, A.-K., Fyfe, R., Mazier, F., Nielsen, A. B., Kaplan, J. O., Bjune, A. E., Birks, H. J. B., Giesecke, T., Kangur, M., Latałowa, M., Marquer, L., Smith, B., and Gaillard, M.-J.: Creating spatially continuous maps of past land cover from point estimates: A new statistical approach applied to pollen data, Ecol. Complex., 20, 127–141, https://doi.org/10.1016/j.ecocom.2014.09.005, 2014.
Pirzamanbein, B., Poska, A., and Lindström, J.: Bayesian Reconstruction of Past Land Cover From Pollen Data: Model Robustness and Sensitivity to Auxiliary Variables, Earth Space Sci., 7, e2018EA00057, https://doi.org/10.1029/2018EA000547, 2020.
Poska, A., Meltsov, V., Sugita, S., and Vassiljev, J.: Relative pollen productivity estimates of major anemophilous taxa and relevant source area of pollen in a cultural landscape of the hemi-boreal forest zone (Estonia), Rev. Palaeobot. Palynol., 167, 30–39, https://doi.org/10.1016/j.revpalbo.2011.07.001, 2011.
Prentice, I. C. and Parsons, R. W.: Maximum Likelihood Linear Calibration of Pollen Spectra in Terms of Forest Composition, Biometrics, 39, 1051–1057, https://doi.org/10.2307/2531338, 1983.
Prentice, I. C. and Webb, T.: Pollen percentages, tree abundances and the Fagerlind effect, J. Quat. Sci., 1, 35–43, https://doi.org/10.1002/jqs.3390010105, 2009.
Räsänen, S., Suutari, H., and Nielsen, A. B.: A step further towards quantitative reconstruction of past vegetation in Fennoscandian boreal forests: Pollen productivity estimates for six dominant taxa, Rev. Palaeobot. Palynol., 146, 208–220, https://doi.org/10.1016/j.revpalbo.2007.04.004, 2007.
R Core Team: R: A Language and Environment for Statistical Computing, R Foundation for Statistical Computing, https://www.r-project.org/ (last access: 28 August 2026), 2025.
Reille, M.: Pollen et spores d’europe et d’afrique du nord, Laboratoire de Botanique historique et Palynologie, Marseille, ISBN 2-9507175-0-0, 1992.
Reille, M.: Pollen et spores d’europe et d’afrique du nord, supplement 1, Laboratoire de Botanique historique et Palynologie, Marseille, ISBN 2-9507175-1-9, 1995.
Roberts, N., Fyfe, R. M., Woodbridge, J., Gaillard, M.-J., Davis, B. A. S., Kaplan, J. O., Marquer, L., Mazier, F., Nielsen, A. B., Sugita, S., Trondman, A.-K., and Leydet, M.: Europe's lost forests: a pollen-based synthesis for the last 11,000 years, Sci. Rep., 8, 716, https://doi.org/10.1038/s41598-017-18646-7, 2018.
Rubiales, J. M., García-Amorena, I., Hernández, L., Génova, M., Martínez, F., Manzaneque, F. G., and Morla, C.: Late Quaternary dynamics of pinewoods in the Iberian Mountains, Rev. Palaeobot. Palynol., 162, 476–491, https://doi.org/10.1016/j.revpalbo.2009.11.008, 2010.
Serge, M., Mazier, F., Fyfe, R., et al.: Testing the Effect of Relative Pollen Productivity on the REVEALS Model: A Validated Reconstruction of Europe-Wide Holocene Vegetation, Land, 12, 986, https://doi.org/10.3390/land12050986, 2023.
Soepboer, W., Sugita, S., Lotter, A. F., van Leeuwen, J. F. N., and van der Knaap, W. O.: Pollen productivity estimates for quantitative reconstruction of vegetation cover on the Swiss Plateau, Holocene, 17, 65–77, https://doi.org/10.1177/0959683607073279, 2007.
Sugita, S.: Pollen representation of vegetation in Quaternary sediments: theory and method in patchy vegetation, J. Ecol., 82, 881–897, https://doi.org/10.2307/2261452, 1994.
Sugita, S.: Theory of Quantitative Reconstruction of Vegetation I: Pollen from Large Sites REVEALS Regional Vegetation Composition, Holocene, 17, 229–241, https://doi.org/10.1177/0959683607075837, 2007a.
Sugita, S.: Theory of Quantitative Reconstruction of Vegetation II: All You Need Is LOVE, Holocene, 17, 243–257, https://doi.org/10.1177/0959683607075838, 2007b.
Sugita, S., Gaillard, M.-J., and Broström, A.: Landscape openness and pollen records: a simulation approach, Holocene, 9, 409–421, https://doi.org/10.1191/095968399666429937, 1999.
Sugita, S., Parshall, T., Calcote, R., and Walker, K.: Testing the Landscape Reconstruction Algorithm for spatially explicit reconstruction of vegetation in northern Michigan and Wisconsin, Quat. Res., 74, 289–300, https://doi.org/10.1016/j.yqres.2010.07.008, 2010.
Svenning, J.-C.: A review of natural vegetation openness in north-western Europe, Biol. Conserv., 104, 133–148, https://doi.org/10.1016/S0006-3207(01)00162-8, 2002.
Tabares, X., Ratzmann, G., Kruse, S., Theuerkauf, M., Mapani, B., and Herzschuh, U.: Relative pollen productivity estimates of savanna taxa from southern Africa and their application to reconstruct shrub encroachment during the last century, Holocene, 31, 1100–1111, https://doi.org/10.1177/09596836211003193, 2021.
Theuerkauf, M.: Pollen productivity estimates, in: Encyclopedia of Quaternary Science, Elsevier, 387–401, https://doi.org/10.1016/B978-0-323-99931-1.00236-1, 2025.
Theuerkauf, M. and Couwenberg, J.: The extended downscaling approach: A new R-tool for pollen-based reconstruction of vegetation patterns, Holocene, 27, 1252–1258, https://doi.org/10.1177/0959683616683256, 2017.
Theuerkauf, M. and Couwenberg, J.: Comment on : Pollen-based reconstruction of Holocene land-cover in mountain regions: Evaluation of the landscape reconstruction algorithm in the Vicdessos valley, northern Pyrenees, France, Quat. Sci. Rev., 244, 106463, https://doi.org/10.1016/j.quascirev.2020.106463, 2020.
Theuerkauf, M. and Couwenberg, J.: Pollen productivity estimates strongly depend on assumed pollen dispersal II: Extending the ERV model, Holocene, 32, 1233–1250, https://doi.org/10.1177/09596836211041729, 2022.
Theuerkauf, M., Kuparinen, A., and Joosten, H.: Pollen productivity estimates strongly depend on assumed pollen dispersal, Holocene, 23, 14–24, https://doi.org/10.1177/0959683612450194, 2013.
Theuerkauf, M., Bos, J. A. A., Jahns, S., Janke, W., Kuparinen, A., Stebich, M., and Joosten, H.: Corylus expansion and persistent openness in the early Holocene vegetation of northern central Europe, Quat. Sci. Rev., 90, 183–198, https://doi.org/10.1016/j.quascirev.2014.03.002, 2014.
Theuerkauf, M., Dräger, N., Kienel, U., Kuparinen, A., and Brauer, A.: Effects of changes in land management practices on pollen productivity of open vegetation during the last century derived from varved lake sediments, Holocene, 25, 733–744, https://doi.org/10.1177/0959683614567881, 2015.
Theuerkauf, M., Couwenberg, J., Kuparinen, A., and Liebscher, V.: A matter of dispersal: REVEALSinR introduces state-of-the-art dispersal models to quantitative vegetation reconstruction, Veg. Hist. Archaeobotany, 25, 541–553, https://doi.org/10.1007/s00334-016-0572-0, 2016.
Trachsel, M., Dawson, A., Paciorek, C. J., Williams, J. W., McLachlan, J. S., Cogbill, C. V., Foster, D. R., Goring, S. J., Jackson, S. T., Oswald, W. W., and Shuman, B. N.: Comparison of settlement-era vegetation reconstructions for STEPPS and REVEALS pollen–vegetation models in the northeastern United States, Quat. Res., 95, 23–42, https://doi.org/10.1017/qua.2019.81, 2020.
Trondman, A.-K., Gaillard, M.-J., Mazier, F., Sugita, S., Fyfe, R., Nielsen, A. B., Twiddle, C., Barratt, P., Birks, H. j. B., Bjune, A. E., Björkman, L., Broström, A., Caseldine, C., David, R., Dodson, J., Dörfler, W., Fischer, E., van Geel, B., Giesecke, T., Hultberg, T., Kalnina, L., Kangur, M., van der Knaap, P., Koff, T., Kuneš, P., Lagerås, P., Latałowa, M., Lechterbeck, J., Leroyer, C., Leydet, M., Lindbladh, M., Marquer, L., Mitchell, F. j. G., Odgaard, B. V., Peglar, S. M., Persson, T., Poska, A., Rösch, M., Seppä, H., Veski, S., and Wick, L.: Pollen-based quantitative reconstructions of Holocene regional vegetation cover (plant functional types and land-cover types) in Europe suitable for climate modelling, Glob. Change Biol., 21, https://doi.org/10.1111/gcb.12737, 2014.
Trondman, A.-K., Gaillard, M.-J., Mazier, F., Sugita, S., Fyfe, R., Nielsen, A. B., Twiddle, C., Barratt, P., Birks, H. J. B., Bjune, A. E., Björkman, L., Broström, A., Caseldine, C., David, R., Dodson, J., Dörfler, W., Fischer, E., van Geel, B., Giesecke, T., Hultberg, T., Kalnina, L., Kangur, M., van der Knaap, P., Koff, T., Kuneš, P., Lagerås, P., Latałowa, M., Lechterbeck, J., Leroyer, C., Leydet, M., Lindbladh, M., Marquer, L., Mitchell, F. J. G., Odgaard, B. V., Peglar, S. M., Persson, T., Poska, A., Rösch, M., Seppä, H., Veski, S., and Wick, L.: Pollen-based quantitative reconstructions of Holocene regional vegetation cover (plant-functional types and land-cover types) in Europe suitable for climate modelling, Glob. Change Biol., 21, 676–697, https://doi.org/10.1111/gcb.12737, 2015.
Twiddle, C. L., Jones, R. T., Caseldine, C. J., and Sugita, S.: Pollen productivity estimates for a pine woodland in eastern Scotland: The influence of sampling design and vegetation patterning, Rev. Palaeobot. Palynol., 174, 67–78, https://doi.org/10.1016/j.revpalbo.2011.12.006, 2012.
Veeken, A., Santos, M. J., McGowan, S., Davies, A. L., and Schrodt, F.: Pollen–based reconstruction reveals the impact of the onset of agriculture on plant functional trait composition, Ecol. Lett., 25, 1937–1951, https://doi.org/10.1111/ele.14063, 2022.
Vera, F. W. M.: Grazing ecology and forest history, CABI Pub, Wallingford, Oxon; New York, NY, 506 pp., ISBN 978-0-85199-442-0, 2000.
Von Post, L.: Skogsträdpollen i sydsvenska torvmosselagerföljder, Forhandlinger ved de Skandinaviske Naturforskeres, 16, 433–465, 1918.
Von Stedingk, H., Fyfe, R. M., and Allard, A.: Pollen productivity estimates from the forest–tundra ecotone in west-central Sweden: implications for vegetation reconstruction at the limits of the boreal forest, Holocene, 18, 323–332, https://doi.org/10.1177/0959683607086769, 2008.
Wan, Q., Zhang, X., Huang, K., Zheng, H., Zhang, Y., Yang, X., and Zheng, Z.: Validation of relative pollen productivities for major tropical plant taxa: An empirical test using the REVEALS model in Hainan, China, Quat. Int., 641, 106–114, https://doi.org/10.1016/j.quaint.2022.04.006, 2022.
Wieczorek, M. and Herzschuh, U.: Compilation of relative pollen productivity (RPP) estimates and taxonomically harmonised RPP datasets for single continents and Northern Hemisphere extratropics, Earth Syst. Sci. Data, 12, 3515–3528, https://doi.org/10.5194/essd-12-3515-2020, 2020.
Woodbridge, J., Roberts, C. N., Palmisano, A., Bevan, A., Shennan, S., Fyfe, R., Eastwood, W. J., Izdebski, A., Çakırlar, C., Woldring, H., Broothaerts, N., Kaniewski, D., Finné, M., and Labuhn, I.: Pollen-inferred regional vegetation patterns and demographic change in Southern Anatolia through the Holocene, Holocene, 29, 728–741, https://doi.org/10.1177/0959683619826635, 2019.
Xiang, Y., Gubian, S., Suomela, B., and Hoeng, J.: Generalized Simulated Annealing for Global Optimization: The GenSA Package, R J., 5, 13, https://doi.org/10.32614/RJ-2013-002, 2013.
Xu, Q., Cao, X., Tian, F., Zhang, S., Li, Y., Li, M., Li, J., Liu, Y., and Liang, J.: Relative pollen productivities of typical steppe species in northern China and their potential in past vegetation reconstruction, Sci. China Earth Sci., 57, 1254–1266, https://doi.org/10.1007/s11430-013-4738-7, 2014.
Zanon, M., Davis, B. A. S., Marquer, L., Brewer, S., and Kaplan, J. O.: European Forest Cover During the Past 12,000 Years: A Palynological Reconstruction Based on Modern Analogs and Remote Sensing, Front. Plant Sci., 9, 253, https://doi.org/10.3389/fpls.2018.00253, 2018.
- Abstract
- Introduction
- Material and methods
- Results
- Discussion
- Conclusions
- Appendix A: Estimation of GPM-RPPs
- Appendix B: Validation of the GPM-RPPs
- Code and data availability
- Author contributions
- Competing interests
- Disclaimer
- Acknowledgements
- Financial support
- Review statement
- References
- Supplement
- Abstract
- Introduction
- Material and methods
- Results
- Discussion
- Conclusions
- Appendix A: Estimation of GPM-RPPs
- Appendix B: Validation of the GPM-RPPs
- Code and data availability
- Author contributions
- Competing interests
- Disclaimer
- Acknowledgements
- Financial support
- Review statement
- References
- Supplement