
the Creative Commons Attribution 4.0 License.
the Creative Commons Attribution 4.0 License.
 | 17 Sep 2026
Towards circularity in shellfish aquaculture: stimulating mussel shell dissolution in marine sediments
Cedric Goossens

Steven Bouillon
Filip J. R. Meysman
Sebastiaan J. van de Velde
Ocean alkalinity enhancement (OAE) is receiving considerable attention as a carbon dioxide (CO2) removal strategy, and novel approaches to increase the total alkalinity (AT) of the surface ocean are being explored. In bivalve aquaculture, calcification during shell growth consumes AT, thus leading to CO2 emissions. After consumption, shells are typically landfilled or incinerated, which can generate additional CO2 emissions. Here, we investigate how the CO2 footprint of shellfish aquaculture can be reduced by using bivalve shells as a resource for mineral-based OAE. The idea is to grind the calcium carbonate (CaCO3) shells to increase the reactive surface area and distribute them into permeable, oxygen-rich sediments, where their dissolution produces AT that could then compensate the CO2 emitted during calcification. To evaluate this concept, we conducted microcosm incubations of sediments amended with crushed mussel shells (∼ 8 wt %), and monitored the sediment geochemistry and sediment-water exchange over 24 weeks. Control sediments exhibited low and constant CaCO3 dissolution rates (Rdiss = 0.9 ± 0.5 ) and AT fluxes (FAT = 3.2 ± 1.1 ). In contrast, shell-amended sediments showed markedly higher Rdiss and FAT values, which exhibited a transient response modulated by oxygen and organic matter availability. Initially, shell dissolution was restricted, most likely by oxygen availability due to the intense mineralization of shell-associated organic matter. Subsequently, following gradual sediment reoxygenation, dissolution rates increased, reaching a maximum Rdiss of 22.7 ± 2.6 after 9 weeks, corresponding to a measured FAT of 43.0 ± 6.0 . After that, CaCO3 dissolution rates declined as organic matter availability decreased, approaching control rates, with a slightly elevated Rdiss of 2.2 ± 1.1 at the end of the experiment. After 24 weeks, ∼ 6 % of the initial shell mass had dissolved, and extrapolation of the dissolution rate at the end of the experiment suggests that complete dissolution would require ∼ 38 years. Our results suggest that organic matter availability limits CaCO3 dissolution in the permeable sediment investigated. This constraint, however, can be alleviated by targeting environments with high organic matter deposition for in-situ applications, such as sediments beneath mussel farms, thereby promoting mussel aquaculture circularity.
- Article
(1832 KB) - Full-text XML
-
Supplement
(1792 KB) - BibTeX
- EndNote


Climate stabilization requires direct carbon dioxide removal (CDR) from the atmosphere alongside conventional mitigation strategies that prevent new emissions (Gasser et al., 2015; IPCC, 2023; Sanderson et al., 2016). As a consequence, CDR research has gained considerable traction over the last few years (Lück et al., 2025; Minx et al., 2024). Marine CDR options are receiving increased attention due to the large CO2 buffering capacity of the ocean, which has taken up about 26 % of the global anthropogenic emissions since 1850 (Friedlingstein et al., 2025). The amount of CO2 that can be stored in the ocean is largely controlled by total alkalinity (AT), which is a measure of the excess of proton acceptors (bases) over proton donors (acids) in solution (Dickson, 1981; Zeebe and Wolf-Gladrow, 2001). An increase in AT causes the carbonate system to respond by dissociating dissolved CO2 to bicarbonate () and carbonate (), resulting in an increased uptake of atmospheric CO2. Ocean alkalinity enhancement (OAE) represents one of the proposed marine CDR methods, and aims to establish higher oceanic CO2 uptake by artificially increasing AT levels in the surface ocean (Oschlies et al., 2023; Renforth and Henderson, 2017).
In recent years, a number of OAE approaches have been investigated in which minerals (silicates and carbonates) are added to coastal sediments (Fuhr et al., 2022, 2023, 2024, 2025). These minerals subsequently undergo a slow weathering process, which releases AT. Up until now, most attention has gone towards purposely mined minerals, such as the silicate mineral olivine (e.g., Flipkens et al., 2023; Geerts et al., 2025; Hangx and Spiers, 2009; Meysman and Montserrat, 2017; Montserrat et al., 2017). Yet, mining operations require energy, generate environmental impacts, and are challenging to rapidly scale, as new mining sites require long permitting trajectories. Therefore, an alternative option is to consider minerals for OAE that are sourced from side and waste streams from existing industrial activities (Bullock et al., 2021). One such activity is bivalve aquaculture. During shell formation, bivalves remove dissolved inorganic carbon (DIC) from the water to form calcium carbonate (CaCO3). Yet, like any form of carbonate formation, this process also removes AT, as the precipitation of 1 mol of CaCO3 consumes 2 mol of AT and 1 mol of DIC:
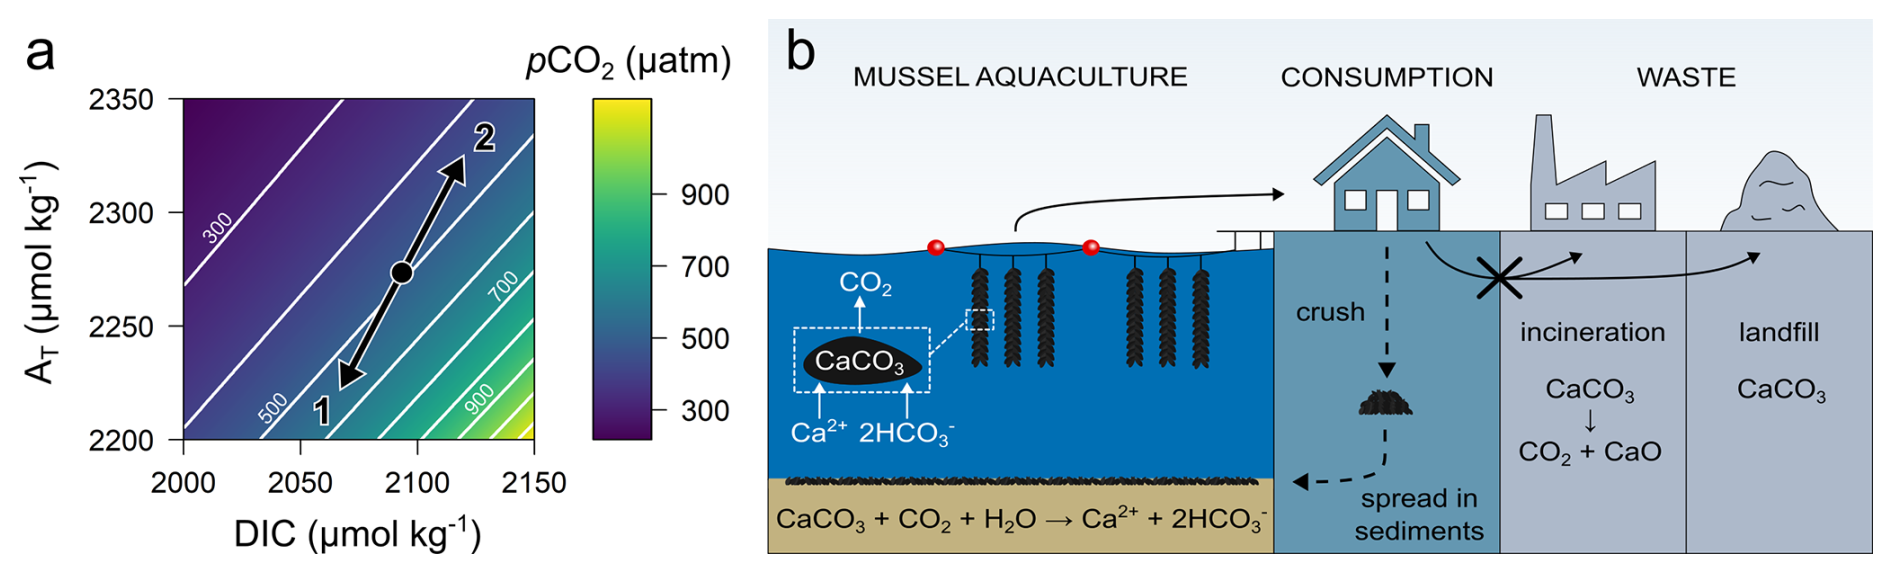
Figure 1(a) Thermodynamic equilibrium plot of alkalinity (AT) as a function of dissolved inorganic carbon (DIC) superimposed on contours of partial pressure of CO2 (pCO2) at 15 °C and a salinity of 35. Black dot: initial seawater concentration. Calcification (vector 1) reduces AT and DIC in a 2:1 ratio, which increases pCO2 and leads to CO2 degassing to the atmosphere. Carbonate dissolution (vector 2) increases AT and DIC in a 2:1 ratio, which decreases pCO2 and leads to CO2 uptake from the atmosphere. (b) Conceptual scheme illustrating the life cycle of bivalve shells from aquaculture (using mussels as example). Bivalves remove AT and dissolved inorganic carbon (DIC) from seawater to form calcium carbonate shells (CaCO3), a process that releases CO2. After harvest and consumption, shell waste is typically incinerated (with associated CO2 emission and landfill of CaO-containing ashes) or directly landfilled. The dashed arrows depict the circular route investigated here. Crushed shells are spread onto shallow sediments, where CaCO3 dissolution generates AT and leads to atmospheric CO2 uptake. The overall process offsets the CO2 released during shell growth.
Overall, carbonate formation results in an increase in the partial pressure of CO2 (pCO2) in seawater (Fig. 1a; Frankignoulle et al., 1994, 1995). In shallow coastal environments, where bivalve aquaculture typically takes place, rapid equilibration of the elevated pCO2 with the atmosphere will result in outgassing of most of the CO2 produced during CaCO3 formation. As such, bivalve production induces a release of CO2 into the atmosphere (Pernet et al., 2025).
With a current global production of over 17 million t of bivalves per year (FAO, 2024, 2025), bivalve aquaculture generates considerable CO2 emissions associated with calcification (∼ 4 million t CO2 yr−1). Life cycle assessments (LCAs) of bivalve aquaculture typically do not account for CO2 emissions from calcification (see Ray et al., 2018 and references therein), thus resulting in an underestimation of its climate impact. When taken into account, calcification may account for up to 90 % of the total emissions (Ray et al., 2018; Thrane, 2004). Moreover, shell waste is typically disposed of as general waste, either through landfilling or incineration. While landfilling retains the CaCO3 mineral phase, incineration can result in additional CO2 emissions because CaCO3 thermally decomposes into calcium oxide (CaO, quicklime) and CO2 at high temperatures (Fig. 1b):
Following incineration, the resulting ash may be disposed of in landfill sites. Under these conditions, some CaO may subsequently react with CO2 to reform CaCO3; however, the extent of this carbonation remains uncertain and depends strongly on landfill conditions.
In this study, we explore an alternative destination for the CaCO3-containing shells after consumption. The core idea is to offset CO2 emissions associated with calcification (Eq. 1) by reintroducing mussel shells into the marine environment and stimulating shell dissolution (Fig. 1b). The key question is whether the mussel shells will effectively dissolve, and if so, under which conditions and over which timeframes. The precipitation and dissolution of CaCO3 are controlled by the CaCO3 saturation state of seawater (Zeebe and Wolf-Gladrow, 2001) and the reactive surface area of the CaCO3 minerals. Since surface waters are typically oversaturated with respect to CaCO3, dissolution generally does not occur in the water column (Kleypas, 2011; Morse and Mackenzie, 1990). However, CaCO3 dissolution is possible in the pore water of marine sediments under specific conditions, in a process referred to as metabolic carbonate dissolution, in which CO2 generated by aerobic mineralization of organic matter builds up in the pore water until undersaturation is achieved and CaCO3 starts to dissolve (Aller, 1982; Archer et al., 1989; Emerson and Bender, 1981; Lunstrum and Berelson, 2022; Morse et al., 1985; Subhas et al., 2022):
The above reaction equation also succinctly summarizes the conditions that promote metabolic CaCO3 dissolution: (1) permeable sediments that enable deep oxygen penetration; (2) sediments sufficiently rich in organic matter, which drives metabolic dissolution; and (3) low ambient CaCO3 concentration, thereby limiting buffering from background CaCO3 (Goossens et al., 2026). Dissolution efficiency could further be improved by grinding shells to a finer size to increase their reactive surface area and enhance their intrinsic dissolution rate. Likewise, the sediments should be located within shallow waters with a well-mixed water column as to allow rapid CO2 equilibration with the atmosphere.
Here, we assessed the potential for enhanced sedimentary dissolution of CaCO3 shells derived from the blue mussel (Mytilus edulis), a species that dominates shellfish aquaculture in Belgium and the Netherlands (FAO, 2025). Previous studies on biogenic shell dissolution (see Gazeau et al., 2013 for an overview) have considered a range of taxa, including oysters (Waldbusser et al., 2011; Welladsen et al., 2010), clams (Green et al., 2004, 2009; McClintock et al., 2009), limpets (McClintock et al., 2009), and snails (Nienhuis et al., 2010), but only a limited number focused on sedimentary environments (Green et al., 2004, 2009). Furthermore, relatively little attention has been given to mussel shells; the few studies that address their dissolution primarily focus on ocean acidification experiments using chemically altered (sea)water conditions (Carlson et al., 2025; Cubillas et al., 2005; Ericson and Ragg, 2022; Gazeau et al., 2007; Melzner et al., 2011). Here, we address this gap by performing laboratory flux incubations with permeable, CaCO3-poor coastal sediments amended with crushed blue mussel shells.
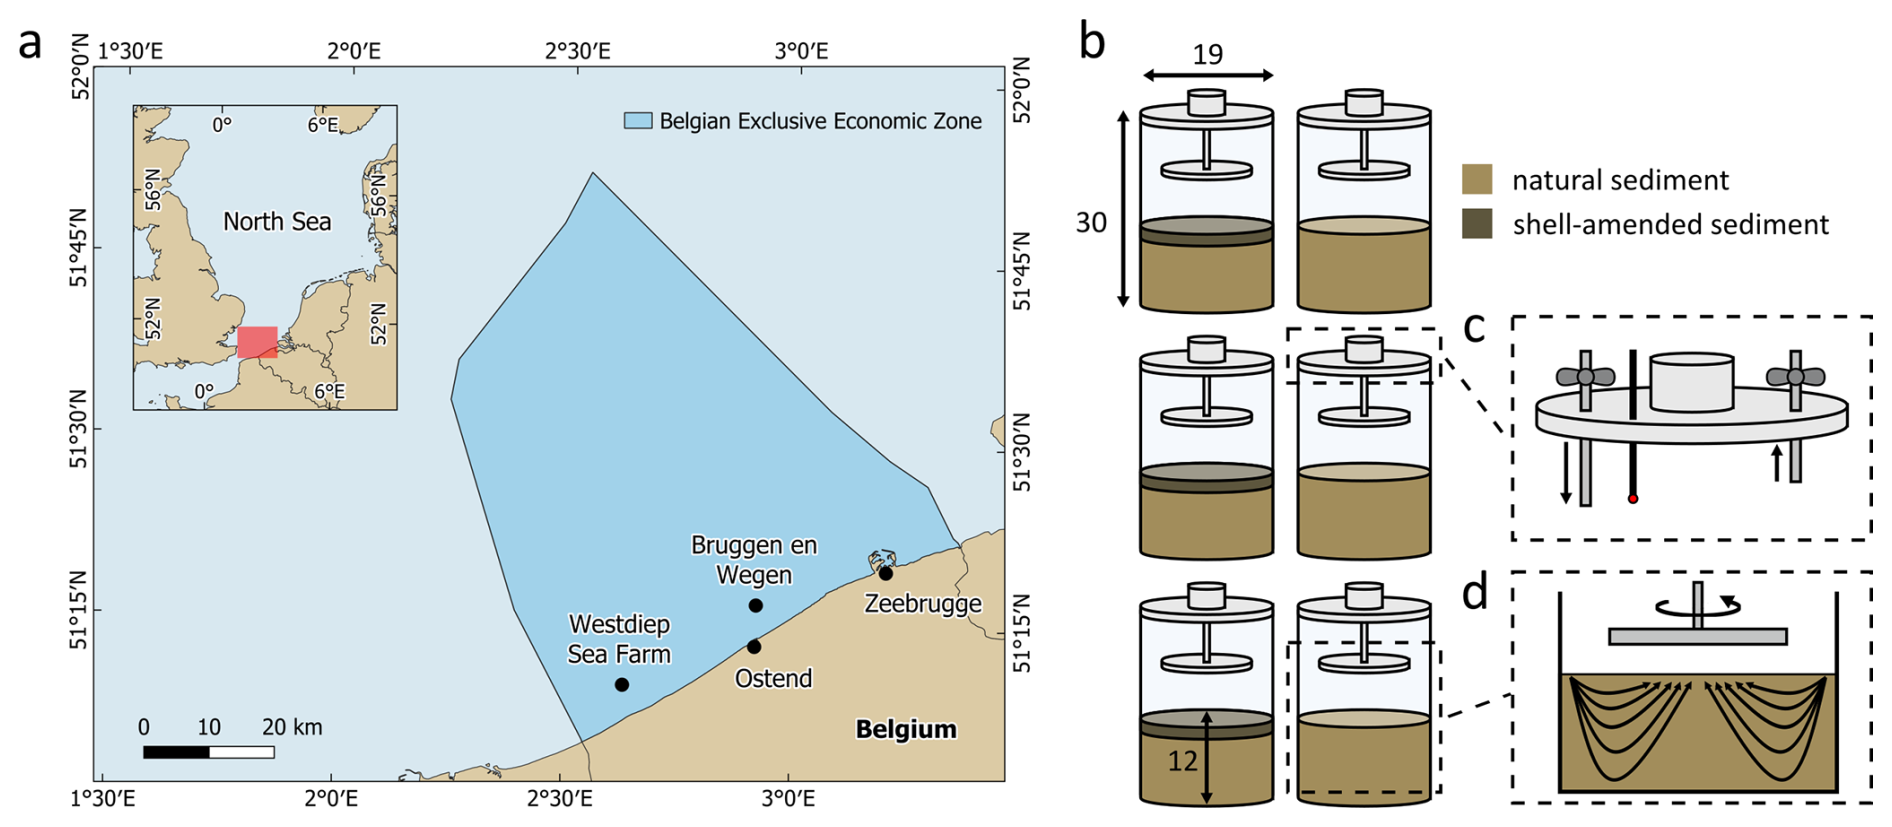
Figure 2(a) Map of the Belgian part of the North Sea (BPNS), showing the sediment collection site (Bruggen en Wegen) and the mussel farming site (Westdiep Sea Farm). An overview map of the North Sea is provided with the location of the BPNS in red. (b) Experimental setup, consisting of 3 control chambers and 3 treatment chambers amended with crushed mussel shells. Chamber and sediment dimensions are displayed in cm. (c) Chamber top lids contained 3 sampling ports: one was used for an oxygen probe, and the other two for subsampling of the overlying water. Arrows indicate water flow during subsampling: subsamples were taken from one port, while replacement water was added through the other port. (d) Stirring disk rotation induced pore-water exchange through a radial pressure gradient. Arrows indicate pore-water flow through the sediment column.
2.1 Sediment collection and incubation setup
Sediment was collected from a shallow site in the southern North Sea along the Belgian coast (station “Bruggen en Wegen Oostende”, 51.28300° N 2.92133° E; Fig. 2a) on 20 March 2023. The location is a dredge deposit site characterized by permeable sediment. Sediment was collected using a Van Veen grab sampler, transported to the laboratory, homogenized and stored in the dark at stable room temperature (18–22 °C) with 20 cm of overlying seawater until further use. While the sediment was not sieved prior to incubation, visual inspection during homogenization and sediment sampling did not reveal any presence of macrofauna. Air pumps were installed to keep the overlying seawater oxygenated. A subsample of sediment was taken for analysis of grain size distribution and porosity. Natural seawater was used as overlying water in the sediment incubations. This seawater was collected from the Eastern Scheldt (The Netherlands) and filtered through a sand filter (0.5 mm) to remove macrofauna. Blue mussels (Mytilus edulis) were sourced from the supermarket and originated from a hanging culture at the Westdiep Sea Farm, a mussel farming site ∼ 5 km off the Belgian coast at 15 m water depth in the southern North Sea (51.16975° N, 2.63104° E; Fig. 2a). Mussel tissue was manually removed, shells were rinsed with fresh water and dried overnight in a drying oven at 60 °C. Dried shells were ground with an ultra-centrifugal mill (ZM 200, Retsch) and the fraction that passed a 0.25 mm sieve was retained. The potential influence of fine shell particles on sediment permeability therefore cannot be completely ruled out. Ground shell samples were collected for analysis of organic and inorganic carbon concentration.
The sediment microcosms were adapted for the closed incubation of permeable sediments following a well-known flux chamber design (Huettel and Gust, 1992). The flux chambers consisted of polymethyl methacrylate (PMMA) core barrels (19 cm inner diameter, 30 cm height) fitted with a top and bottom lid (Fig. 2b and c). Top lids were equipped with a stirring disk (14 cm diameter), which mixes the overlying seawater and also creates a radial pressure gradient that drives advective pore-water exchange in the permeable sediment (Fig. 2d; Huettel and Gust, 1992). Three sampling ports were installed in the top lids (Fig. 2c): one was used for a fiber-optical oxygen probe (FireSting OXROB10, PyroScience), and the other two for subsampling of the overlying seawater during the incubation.
The experimental setup consisted of 6 flux chambers: 3 replicate control chambers were filled solely with natural sediment (∼ 13 cm), while 3 replicate treatment chambers were filled with a base layer of natural sediment (∼ 11 cm) and a top layer of natural sediment (∼ 2 cm) mixed with 100 g of ground shells, to achieve a concentration of ∼ 8 wt % of added shell material in the mixed top layer. Solid-phase samples for the analysis of total, organic, and inorganic carbon (and its stable isotope composition, i.e. δ13C values) were collected from the surface sediment in the control and treatment chambers. Oxygenated filtered seawater (∼ 4.2 L) was added to the chambers at the start of the incubation. Top lids were installed and chambers were placed in a closed container filled with water to ensure a dark and stable environment.
2.2 Solute flux incubation
Consecutive flux sessions were performed to quantify the uptake or release of solutes across the sediment-water interface by monitoring their accumulation in the overlying water. A total of 11 flux incubation sessions were conducted over the course of 24 weeks (each flux session lasted ∼ 10 d). Before each flux session, the overlying water in the flux chamber was replaced in order to start a new monitoring period of solute accumulation. Each flux session consisted of two parts: a short “closed” part (∼ 3 d) and a longer “open” part (∼ 7 d), as further detailed below. Throughout the session, the rotating disks were set at 80 rounds per minute (rpm) to stimulate advective pore-water exchange with the overlying water while not disturbing the sediment (i.e., no resuspension). The total time of a single incubation was adjusted to prevent excessive solute concentration build-up (i.e., to avoid saturation effects and secondary mineral precipitation). Before each session, oxygen optodes were calibrated using a two-point calibration with seawater at 0 % (saturated with Na2SO3) and 100 % (bubbled with air pumps) O2 saturation.
In the first “closed” part of the incubation session, atmospheric exchange was prevented by closing the gas-tight top lids. The aim was to obtain O2 and DIC fluxes, which necessitate isolation from the atmosphere. Closed incubations lasted until the O2 saturation had dropped from ∼ 100 % at the start to ∼ 60 % to prevent excessive disturbance of the balance between aerobic and anaerobic processes in the sediment (which may influence CaCO3 dissolution). Water samples (25 mL) were taken from one sampling port, while simultaneously replacing the sampled volume with stock seawater through the other port (Fig. 2c). Sampling was done at variable time intervals (5 time points), with samples collected after every ∼ 8 % decrease in O2 saturation. Oxygen concentrations were continuously monitored at one-second intervals with the optode. Samples for dissolved inorganic carbon (DIC, 12 mL) and the stable isotope composition of DIC (δ13C-DIC, 6 mL) were filtered (Acrodisc Syringe Filter, 0.8/0.2 µm) and collected in glass exetainers, poisoned with 10 µL HgCl2, and stored upside down in the dark at 4 °C.
After the closed incubation, chambers were opened and allowed to reoxygenate, and salinity was measured in the overlying water. In the subsequent “open” incubation, atmospheric exchange was enabled by opening the top lids and placing small bars between the chambers and the lids to keep the overlying water oxygenated. Water samples (60 mL) were taken directly from the overlying water at fixed time intervals (∼ 24 h in between) with 5–6 time points in total. At every time point, salinity was measured in the overlying water (as to track potential evaporation). Samples for AT (50 mL) and nutrients (9 mL; and ) were filtered through a dual-layer filter (Acrodisc Syringe Filter, 0.8/0.2 µm), collected in plastic vials, and stored unpoisoned in the dark at 4 and −20 °C, respectively. Both AT and DIC samples were analyzed within the same week of collection or, at most, during the following week to ensure accurate monitoring of fluxes and minimize potential changes in sample composition during storage.
2.3 Pore-water sampling
At the end of the final flux session, 2 small core liners were inserted into the sediment and recovered for pore-water analysis. Cores were sectioned in an anaerobic glove box at 0.5 cm intervals for the 0–2 cm depth range, 1 cm intervals for the 2–6 cm depth range, and 2 cm intervals for the remaining depth. Pore water was extracted from sediment slices using rhizon samplers. Pore-water samples from one core liner were collected for Inductively Coupled Plasma Optical Emission Spectroscopy (ICP-OES) analysis (Ca2+; 0.5 mL), stored in plastic tubes, diluted 10 times with 0.7 M HNO3, and stored in the dark at 4 °C. Pore-water samples from the second core liner were collected for DIC and δ13C-DIC (only samples ≥ 1 mL were retained), poisoned with 10 µL HgCl2, and stored upside down in exetainers in the dark at 4 °C.
2.4 Analytical methods
Grain size distribution was determined using a laser diffraction particle size analyzer (Malvern 2000, Malvern Panalytical) with a precision of < 3 % relative standard deviation (RSD) for D50, and < 5 % for D10 and D90. Porosity was derived from weight loss after freeze-drying, accounting for salt content in the pore water, which was assumed to be equal to the salt content in the overlying water.
Solid-phase samples were analyzed for total carbon and organic carbon content as well as δ13C values through combustion using an elemental analyzer (EA 1110, CE Instruments), connected via a Conflo IV Universal Continuous Flow Interface (Thermo Fisher Scientific) to an Isotope Ratio Mass Spectrometer (IRMS; Thermo Delta V Advantage, Thermo Fisher Scientific). Calibration was done using certified reference material IAEA-600 (δ13C = −27.77 ‰; carbon content = 49.49 %) and in-house standards Leucine (δ13C = −13.73 ‰; carbon content = 54.72 %) and Tuna (δ13C = −17.96 ‰; carbon content = 45.24 %), which were calibrated against IAEA-600. Values of δ13C are expressed relative to the international standard Vienna PeeDee Belemnite (VPDB), with a precision for carbon content of < 2 % (RSD) and < 0.08 ‰ (1 SD) for δ13C. To determine organic carbon content and δ13C, subsamples were weighed into Ag cups and acidified with HCl (10 %, 40 µL or until no further reaction was observed) to remove inorganic carbon. Solid-phase samples were analyzed for inorganic carbon content and associated δ13C composition using a Gasbench II coupled to an IRMS (Thermo Delta Plus XP, Thermo Fisher Scientific). Calibration was done using certified reference materials LSVEC (δ13C = −46.60 ‰) and NBS19 (δ13C = 1.95 ‰) and in-house standards Merck (δ13C = −9.65 ‰) and Fluka (δ13C = +2.36 ‰), which were calibrated against LSVEC and NBS19. Values were expressed relative to VPDB, with a precision of < 0.1 ‰ (1 SD).
Nutrients were analyzed using a continuous flow analyzer (SAN++, Skalar Analytical). Calibration was done using stock solutions made with NH4Cl and NaNO3, verified with diluted standard quality control solutions for (Merck Millipore, reference 1.19812.0500) and (Merck Millipore, reference 1.19811.0500), respectively. The precision (RSD) was 5.9 % (low range) and 0.8 % (high range) for , and 1.5 % (low range) and 1.4 % (high range) for . Dissolved inorganic carbon was analyzed using a DIC analyzer (AS-C6L, Apollo SciTech) coupled to a trace gas analyzer (LI-7810, LICOR). Calibration was done using Dickson certified reference material (batch 209; DIC = 2060.05 µmol kg−1) with a precision (RSD) of 0.16 %. Alkalinity was analyzed using a titrator (Titrando 888, Metrohm) with a 1 mL buret. Calibration was done using Dickson certified reference material (batch 209; AT = 2210.40 µmol kg−1) with a precision (RSD) of 0.08 %. Dissolved pore-water Ca2+ was analyzed using an ICP-OES elemental analyzer (AVIO500; Perkin Elmer), using indium as internal standard and the precision was generally < 2.5 % (RSD).
2.5 Solute flux calculations
Sediment-water flux calculations were performed using the R-based software FLUXER, which also provides robust data quality checks (Hylén and van de Velde, 2025). Solute fluxes (F, , normalized to sediment surface area) were determined from the linear regression of overlying water concentrations over time.
Vow is the volume of the overlying water, A is the surface area of the sediment, and Cow is the concentration of the solute in the overlying water. The term can be replaced by the height How of the overlying water, which was measured once during each session (as the mean of 4 different locations along the circumference of the chamber). Solute concentrations were corrected for dilution resulting from sample volume replacement in both types of incubations before flux calculations. Daily measurement of salinity during open incubations indicated no effect of evaporation.
FLUXER assumes simple linear regression by default, but can switch to a quadratic regression model when non-linear trends are detected, for example due to saturation effects from dissolved compound buildup (Devol et al., 1997; Forja and Gómez-Parra, 1998). To evaluate whether a linear of quadratic regression model is appropriate, FLUXER uses the corrected Akaike Information Criterion (cAIC; Hurvich and Tsai, 1989). The regression model with the lowest cAIC was selected, and a difference of > 2 was considered to be meaningful (Burnham and Anderson, 2004).
For each model, FLUXER displayed five diagnostic graphs to ensure good model fit and assess whether assumptions for linear regression were fulfilled (Montgomery et al., 2012): (1) residuals versus fitted values, which provided information about data linearity; (2) scale-location plot, which provided information about homoscedasticity; (3) residuals versus time, which provided information about the randomness of errors; (4) normal Q-Q (quantile-quantile) plot, which provided information about the error distribution; and (5) influence plot, which helped to identify points that had a high influence on the model (i.e., outliers) using studentized deleted residuals (SDR), hat values and Cook's distance values as indicators. We refer the reader to the theoretical background section of FLUXER for a detailed discussion of how to interpret the diagnostic graphs (Hylén and van de Velde, 2025).
2.6 CaCO3 dissolution rates
Carbonate dissolution rates were calculated using the Keeling plot method (Keeling, 1958, 1961; Pataki et al., 2003), which is based on an isotope mass balance. In closed incubations, the DIC concentration (µmol L−1) of the overlying water (DICow) is the sum of the background DIC concentration at the start of the incubation (DICb) and the source DIC concentration (DICs), which is added to the overlying water by sedimentary processes:
Combining Eqs. (5) and (6) gives a first-order equation in the measured values of δ13C-DIC (‰) of overlying water (δ13C-DICow) over .
The isotope ratios of source and background can be obtained by a linear regression. The intercept yields δ13C-DICs. Since there are two sedimentary processes that generate DIC, i.e., organic matter mineralization and CaCO3 dissolution, that each have a distinct isotopic signature, the relative contribution of each process to the total DIC can be derived.
The fraction of DIC generated by carbonate dissolution hence becomes:
In these equations, fcarb and fOM are the fractions of total DIC derived from CaCO3 dissolution and organic matter mineralization, respectively, while δ13CPIC and δ13CPOC are the isotopic compositions of CaCO3 and organic matter. At saturation (Ω = 1), the theoretical maximum fcarb is 0.5 (50 %), corresponding to fully efficient metabolic carbonate dissolution, where half of the total DIC pool originates from organic matter mineralization and the other half from CaCO3 dissolution (Eq. 3). Finally, the CaCO3 dissolution rate (Rdiss, , normalized to sediment surface area) and metabolic CaCO3 dissolution efficiency (MCDE, %) can be calculated from fcarb and the measured DIC flux (FDIC) via:
Note that our experimental setup precludes any external methane sources.
Table 1Particulate organic carbon (POC), particulate inorganic carbon (PIC), and calcium carbonate (CaCO3) concentrations (assuming all PIC is CaCO3) of the sediments in the control and treatment chambers, as well as the added mussel shells. The δ13C isotopic compositions are also provided. Values for treatment chambers are based on the top layer (2 cm) composition (sediment mixed with crushed mussel shells). Uncertainties of the chamber values are standard deviations based on triplicate chambers. Uncertainties of the mussel shell values are standard deviations based on 4 samples.

3.1 Sediment properties
The natural sediment had a median grain size of 262 µm and porosity of 0.45 ± 0.03 (n=3) and can be classified as medium sand according to the Wentworth scale. Consistent with a permeable sediment, the organic carbon content was low (0.08 %), while the background level of inorganic carbon was also moderate (0.95 %). Particulate organic carbon (POC) and particulate inorganic carbon (PIC) concentrations of the different substrates used in the experiments (including the added mussel shells) and their corresponding δ13C values are summarized in Table 1.
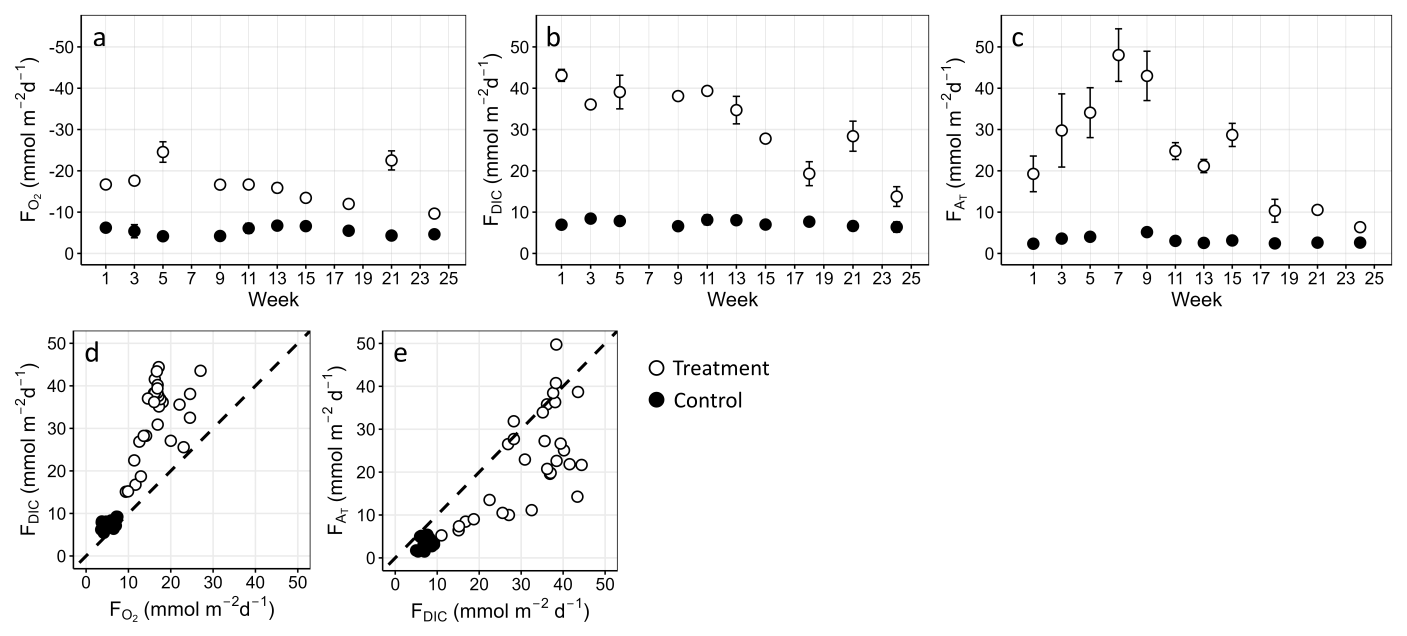
Figure 3(a) Oxygen fluxes (). (b) Dissolved inorganic carbon fluxes (FDIC). (c) Alkalinity fluxes (FAT). Positive fluxes indicate fluxes into the overlying water (i.e., net production by the sediment), negative fluxes indicate fluxes into the sediment (i.e., net consumption by the sediment). Means are plotted with error bars representing standard deviations based on three replicate chambers. No O2 and DIC data were available for week 7, as only open incubations were performed during that week. (d) 1:1 plot, comparing FDIC and . (e) 1:1 plot, comparing FAT and FDIC.
3.2 Sediment-water exchange fluxes
Most incubations showed linear changes in overlying water solute concentrations over time (Figs. S1–S5 in the Supplement). An exception was observed during week 1, where AT accumulation in the treatment chambers was nonlinear, with the accumulation rate decreasing halfway through the incubation (Fig. S3). Similarly, and concentrations in the treatment chambers displayed nonlinear trends during week 1 (Figs. S4 and S5): concentrations of remained constant in the beginning of the incubation, after which they increased, while concentrations increased at the beginning and decreased at the end.
Fluxes of O2, DIC and AT were calculated by regression of overlying water concentrations with time, and showed good replication between replicates at each time point (Fig. 3a–c). Fluxes showed a clear difference between control ( = −5.4 ± 1.2 , FDIC = 7.4 ± 1.0 , FAT = 3.2 ± 1.1 ; mean flux ± standard deviation over all replicate chambers and flux sessions) and treatment chambers ( = −16.8 ± 4.3 , FDIC = 32.0 ± 9.4 , FAT = 25.1 ± 13.5 ; Table S1 in the Supplement). While fluxes in the control chambers showed little variation over time, the treatment chambers displayed a clear temporal pattern. Both O2 (Fig. 3a) and DIC (Fig. 3b) fluxes were initially markedly higher than those of the control chambers, and gradually decreased over the course of the experiment, approaching fluxes of the controls towards the end. Fluxes of AT first increased with time until a maximum value of 48.0 ± 6.4 was reached at week 7, after which they decreased and approached the fluxes of the controls towards the end (Fig. 3c). Fluxes of and in the control chambers were negligible throughout all flux sessions (Table S1). In the treatment chambers, elevated effluxes were only observed during the first part of week 1 ( = 5.1 ± 1.5 ), after which they dropped below the detection limit (Table S1). A positive efflux was observed in the second part of week 1 ( = 5.8 ± 1.0 ; Table S1), and in weeks 3 and 5, fluxes were still observed, although they were substantially lower (∼ 1 ). Finally, flux scatter plots revealed a clear additional DIC source in the treatment chambers beyond mineralization-derived DIC (Fig. 3d), as well as a proportionally greater increase in AT relative to DIC (Fig. 3e).
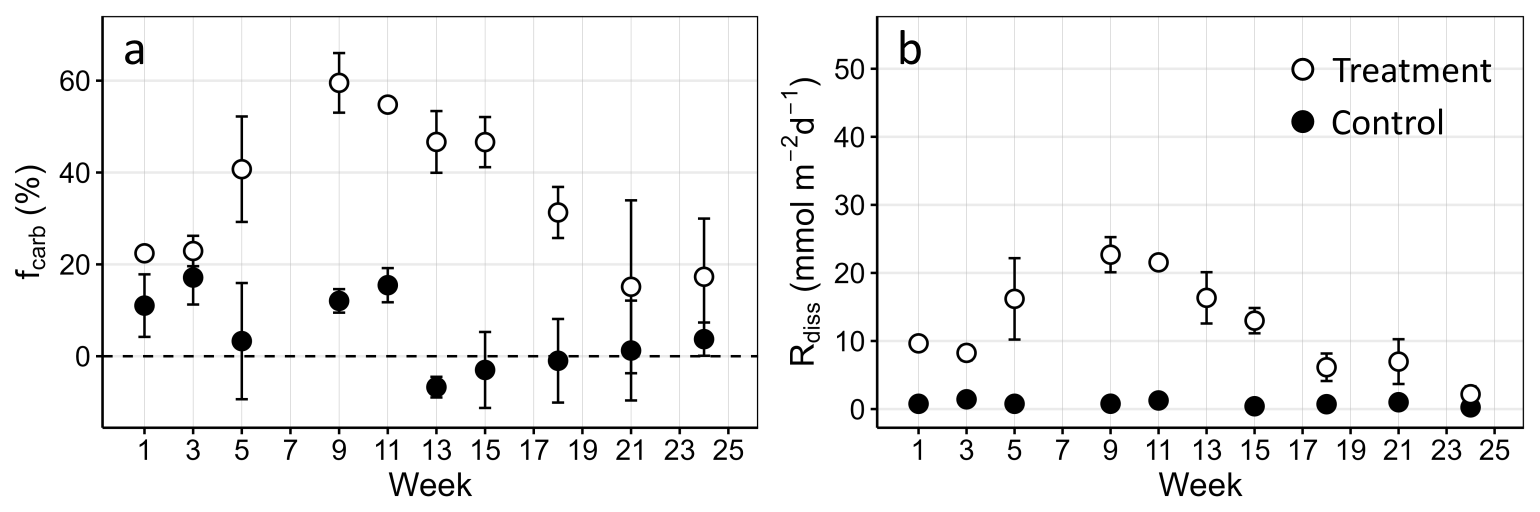
Figure 4(a) Mean fraction of total DIC derived from CaCO3 dissolution (fcarb) as determined using the Keeling plot method. Values are expressed as percentages. (b) Corresponding mean CaCO3 dissolution rates (Rdiss). Values of Rdiss were only calculated for positive values of fcarb, as discussed in the main text. Error bars are standard deviations based on three replicate chambers.
3.3 CaCO3 dissolution rates
Figure 4a and b and Table S2 show the derived fcarb and corresponding Rdiss values across the experiment, while the corresponding MCDE values are provided in Table S2 (see Fig. S6 for all Keeling plots and Table S2 for all model intercepts and p values). A temporal pattern was observed in the treatment chambers over the course of the experiment, with fcarb and Rdiss increasing over time, reaching a maximum of fcarb = 59.5 ± 6.5 % (Rdiss = 22.7 ± 2.6 ) in week 9, followed by a gradual decrease towards a final fcarb of 17.3 ± 12.7 % (Rdiss = 2.2 ± 1.1 ). In the control chambers, fcarb remained relatively stable over time, although some variability was observed both among replicate chambers and across incubation weeks. As the Keeling plot method combines measurements of both DIC and δ13C-DIC, each with associated uncertainties, such variability is expected, particularly in control chambers, where concentration and isotopic composition changes over time are relatively small. The occurrence of negative fcarb values in some control chambers indicated that the regression intercept fell outside the isotopic range defined by the CaCO3 and organic matter end-members. This has no geochemical meaning, other than suggesting that little to no CaCO3 dissolution is occurring, and underscores the uncertainty that the Keeling plot approach inherently incorporates when variations in DIC and/or δ13C-DIC are relatively modest. For this reason, Rdiss was only calculated for chambers with positive fcarb values (Fig. 4b).
3.4 Pore-water geochemistry
We tracked the color changes in the sediment over time by taking photographs throughout the experimental period (Fig. S7). These images reveal a markedly different color evolution in control versus treatment, thus suggesting a different development of the geochemistry. In the controls, the sediment remained light-grey colored, and the only color change observed was the development of a thin (∼ 5 mm) orange layer just below the sediment-water interface (Fig. S7). This feature suggests remobilization of ferrous iron in deeper layers, which then precipitates out as iron (hydr)oxide upon upward diffusion and contact with O2. In contrast, in the treatments, there was a far more notable color change, as the entire layer with mussel shell fragments became black over the course of the first 3 weeks, after which it gradually became grey again as the experiment progressed (Fig. S7).
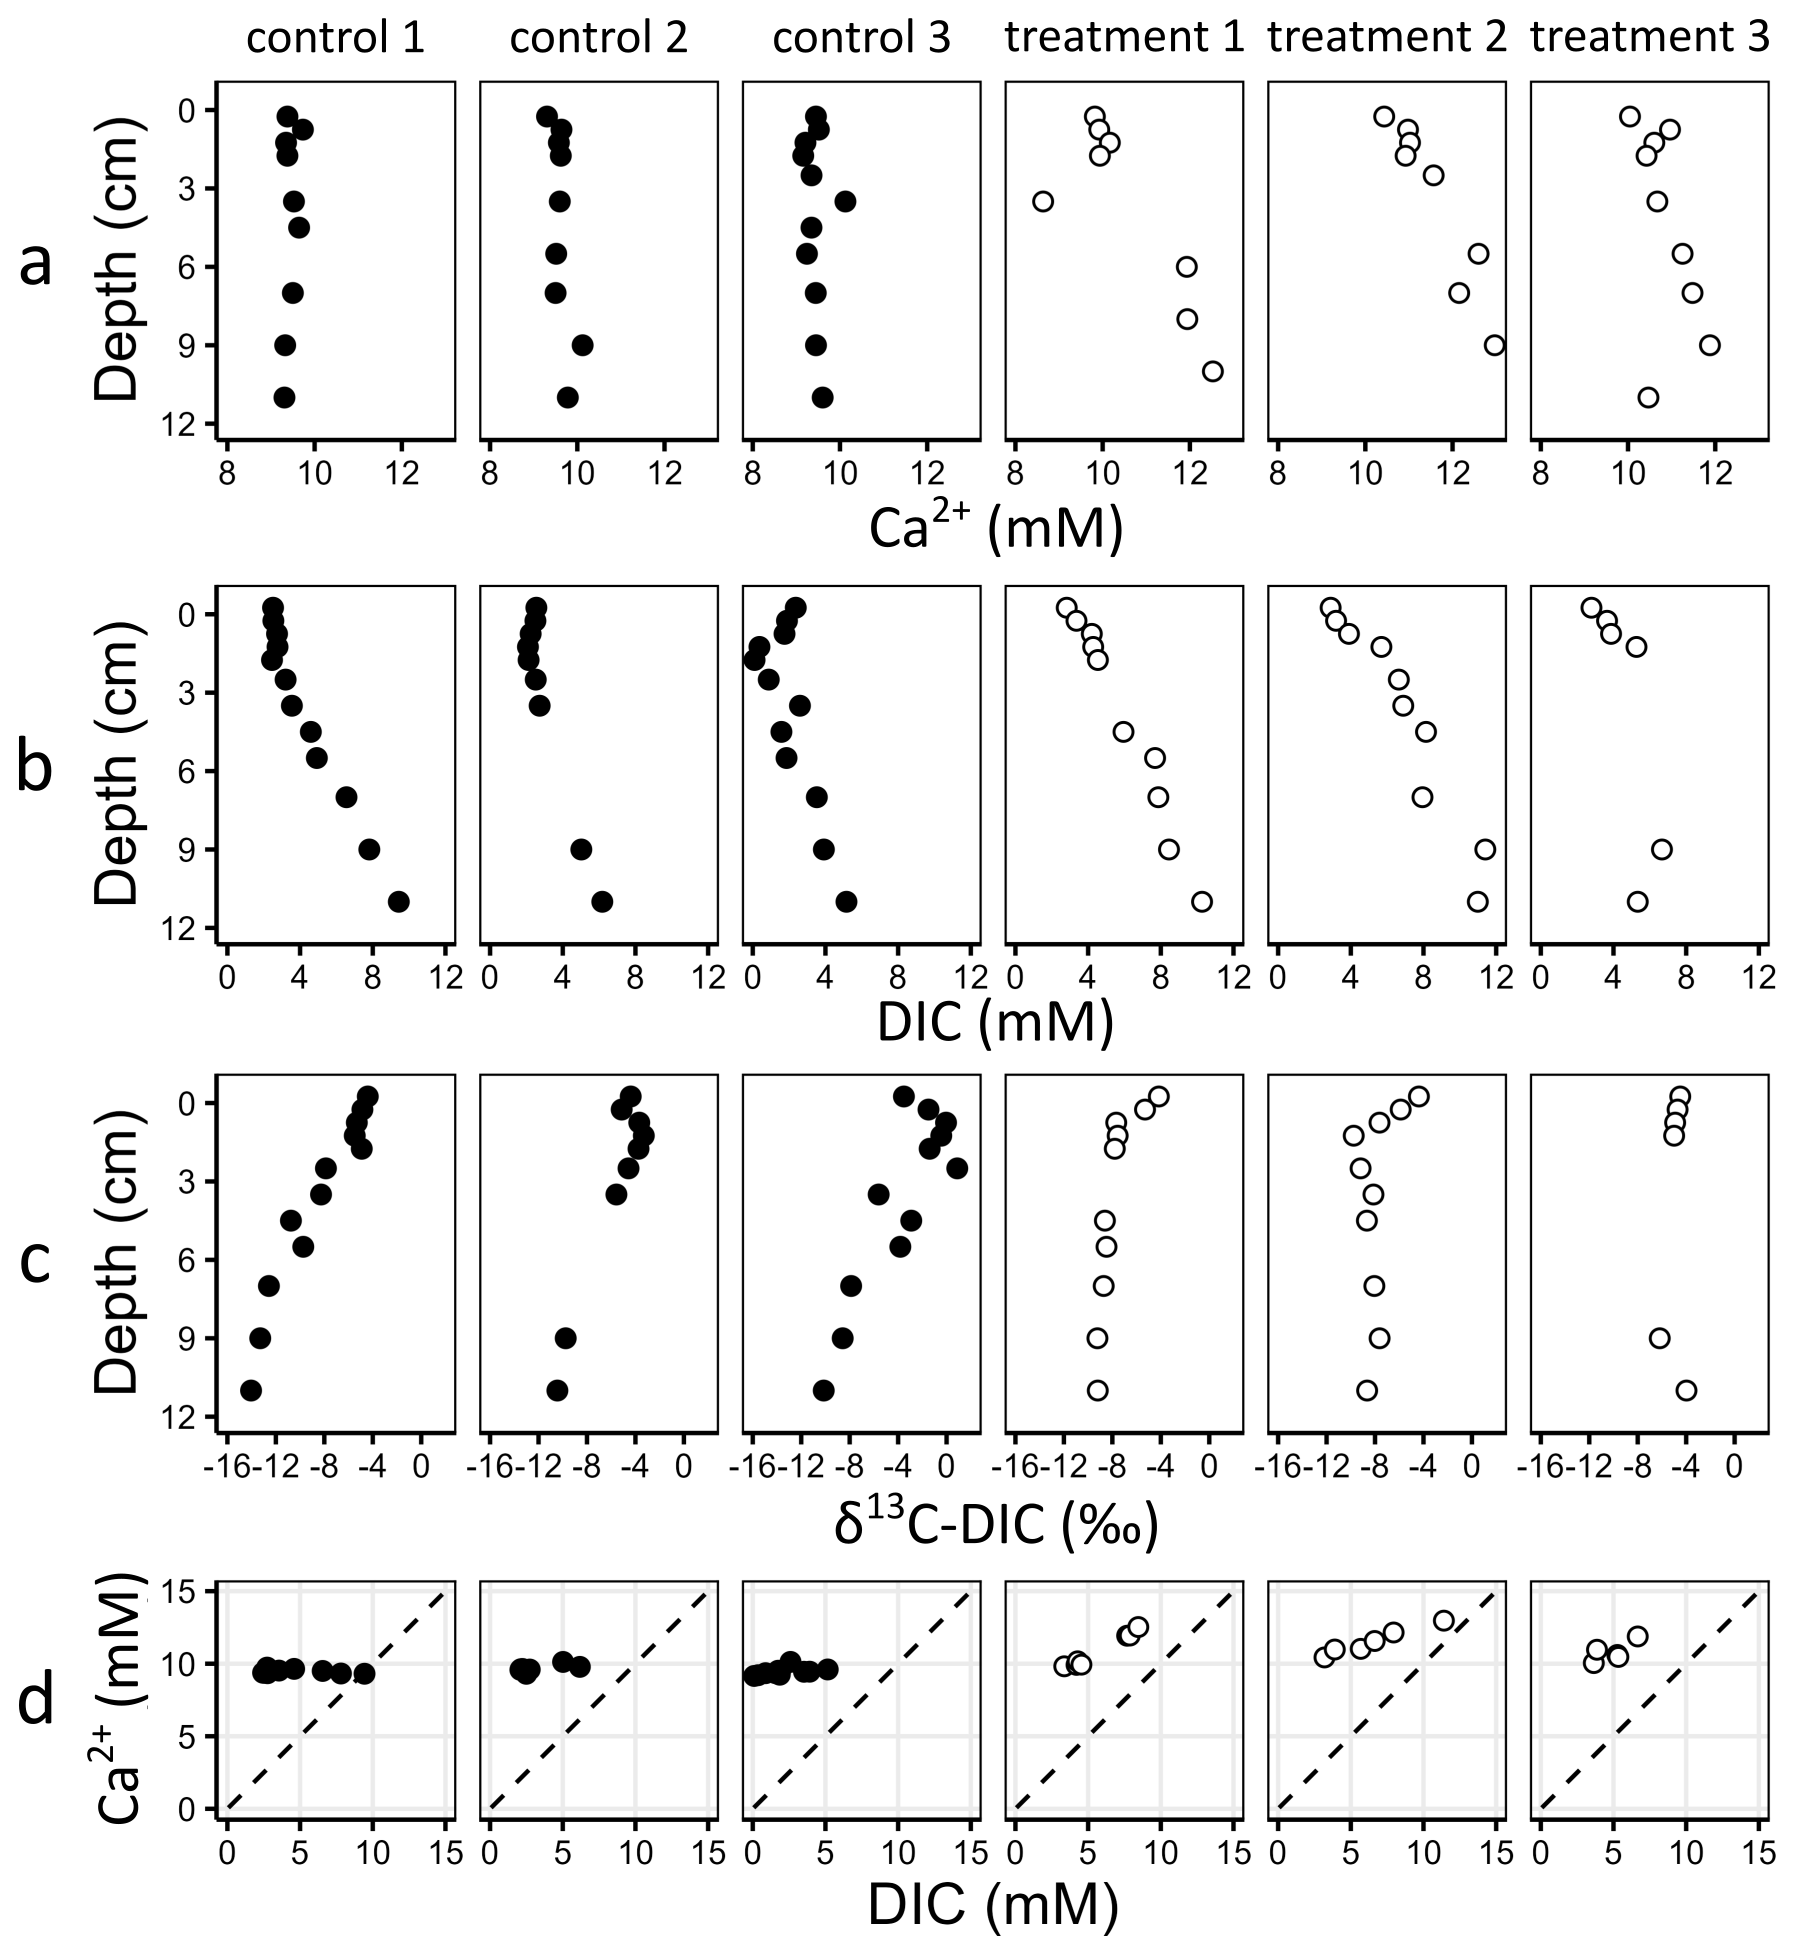
Figure 5Pore-water profiles. (a) Calcium (Ca2+). (b) Dissolved inorganic carbon (DIC). (c) Isotopic DIC composition (δ13C-DIC). (d) 1:1 plot, comparing Ca2+ and DIC concentrations. Pore-water samples were only taken once at the end of the experiment, explaining the buildup of solutes in deeper anoxic layers, as further discussed in the main text.
Figure 5 displays the depth profiles of pore-water concentrations (Ca2+, DIC) and isotopic composition (δ13C-DIC) recorded at the end of the experiment. Higher pore-water Ca2+ concentrations were observed in the treatment chambers as compared to the control chambers (Fig. 5a). In the control chambers, pore-water Ca2+ concentrations remained constant with depth, and were similar to the concentration of ∼ 9.5 mM of the overlying seawater. In contrast, in the treatment chambers, dissolved Ca2+ markedly increased with depth, reaching 12–13 mM at 12 cm depth. Pore-water DIC profiles showed an increasing trend with sediment depth for both control and treatment chambers, but with a different shape and higher DIC concentrations observed in the treatment chambers (Fig. 5b). Profiles of δ13C-DIC showed a decreasing trend in δ13C values with sediment depth in the control chambers. In the treatment chambers, however, δ13C values decreased in the top layer but then remained relatively stable below a depth of ∼ 1 cm (Fig. 5c). Pore-water 1:1 plots of Ca2+ and DIC concentrations revealed a clear Ca2+ source in the treatment chambers, alongside higher DIC production (Fig. 5d).
4.1 Mussel shell dissolution provides a significant additional AT source
Metabolic CaCO3 dissolution is thought to occur more efficiently in oxygenated sediments, where the aerobic mineralization of organic matter produces the CO2 that drives the pore water towards undersaturation (Archer et al., 1989; Emerson and Bender, 1981; Lunstrum and Berelson, 2022; Morse et al., 1985). To meet this condition, permeable sediment (medium sand; porosity 0.45) was used here in the experiment. While the natural sediment employed does contain a sizeable baseline amount of PIC (0.95 ± 0.20 %; Table 1), low AT fluxes were observed in the control chambers (Fig. 3c). Likewise, the Keeling plot analysis indicated low rates of metabolic carbonate dissolution (Fig. 4b). The mean CaCO3 dissolution rate of 0.9 ± 0.5 as observed in the controls, corresponds to an AT flux 1.8 ± 1.0 , thus providing ∼ 56 % of the total measured AT flux of 3.2 ± 1.1 . The low organic carbon content of the natural sediment (0.08 ± 0.02 wt %; Table 1) resulted in low mineralization rates, as indicated by the low O2 consumption rates (Fig. 3a), which are a proxy for total sedimentary organic matter mineralization (Glud, 2008; Jørgensen et al., 2022). The low CO2 production from mineralization thus constrained metabolic CaCO3 dissolution in the natural sediment.
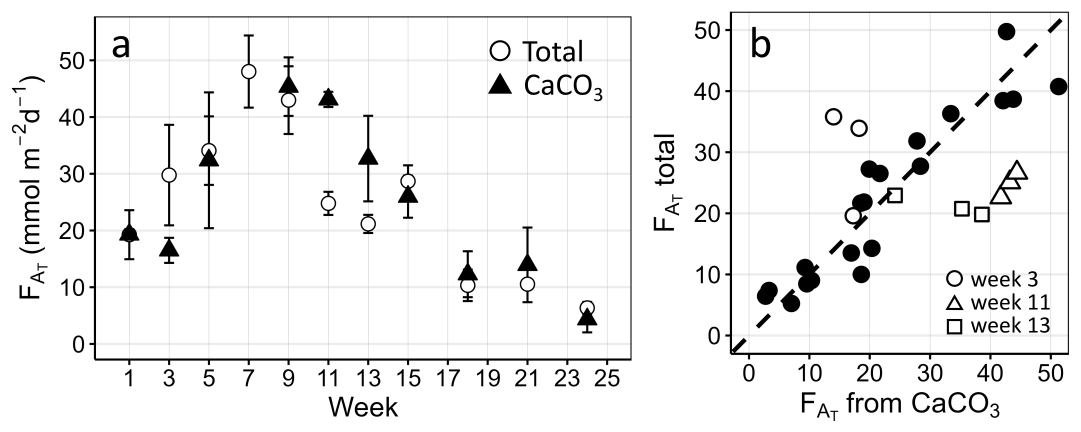
Figure 6Shell-amended chamber flux comparison of total AT, which was measured directly in the overlying water, and CaCO3 AT, which was derived using the Keeling plot analysis. (a) Mean weekly fluxes with standard deviations based on three replicate chambers. (b) 1:1 plot, comparing the individual weekly total and CaCO3-derived AT fluxes per chamber.
In the treatment chambers, more favorable conditions for metabolic dissolution were established, as the added mussel shells still had a considerable amount of associated organic matter (2.20 wt %; Table 1), which stimulated organic matter mineralization, as reflected in the O2, DIC and AT fluxes (Fig. 3a–c). First, elevated O2 fluxes in the treatment chambers suggest high mineralization rates driven by the organic matter associated with the shells, and thus an increased metabolic dissolution potential. Second, elevated DIC fluxes in the treatment chambers confirmed increased metabolic dissolution driven by the more intense mineralization (Fig. 3d). The Keeling plot analysis demonstrates there is a clear additional DIC source coming from CaCO3 dissolution in the treatment chambers (Fig. 4b), which is further supported by the higher Ca2+ and DIC pore-water concentrations observed in the treatment chambers (Fig. 5a, b, and d). It should be noted that pore-water samples were only taken once at the end of the experiment (24 weeks), which allowed for the downward buildup of these solutes over time. While enhanced CaCO3 dissolution only occurred in the shell-amended top layer in the treatment chambers, downward diffusion likely resulted in the elevated concentrations in the deeper anoxic layers. Likewise, the overlying water was replaced after every incubation, which enabled upward diffusive and advective transport of Ca2+ into the overlying water, thus resulting in a lower buildup in the top layer. Third, high AT fluxes in the treatment chambers (Fig. 3c and e) also provide support for substantial CaCO3 dissolution, as 2 mol of AT are produced per mol of CaCO3 dissolved (Eq. 1). In addition, comparison of the AT fluxes attributed to CaCO3 dissolution (as derived from the Keeling plot analysis) with the total AT fluxes (as measured in the overlying water) revealed a strong linear correlation for nearly all flux sessions (Fig. 6a and b), demonstrating that CaCO3 dissolution was the dominant AT source in the treatment chambers. A small number of flux sessions (weeks 3, 11, and 13) deviated from this relationship, indicating the presence of additional AT-generating or AT-consuming processes. These processes are discussed in the following section.
4.2 Factors controlling metabolic CaCO3 dissolution
The observed geochemistry in the treatment chambers carries a clear signature of metabolic CaCO3 dissolution. Given that metabolic CaCO3 dissolution is constrained by the availability of oxygen, organic matter, and CaCO3 (Eq. 3), an important question is which of these three factors acts as the primary limiting factor. Metabolic carbonate dissolution efficiencies (MCDE, Eq. 12) offer a useful metric to assess this issue. Efficiencies < 100 % can be due to different processes: (1) the CaCO3 pool is either too small or not reactive enough for dissolution to fully utilize the potential of mineralization, (2) the pore water receives AT from anaerobic mineralization processes, which suppresses the undersaturation with respect to CaCO3 (Soetaert et al., 2007), or (3) the acid (i.e. CO2) produced by aerobic mineralization is flushed out of the pore water by advective transport before it can drive the pore water towards undersaturation (Goossens et al., 2026). We now discuss these different factors in more detail.
4.2.1 Limitation by CaCO3 availability and reactivity
To assess whether CaCO3 availability limited dissolution in the treatment chambers, the total amount of CaCO3 dissolved over the course of the experiment was calculated by integrating the Rdiss values obtained from the Keeling plot analysis over their respective incubation periods and the sediment surface area (Fig. 4b). This resulted in a total of 6.1 ± 1.2 g of CaCO3 dissolved, corresponding to 6.1 ± 1.2 % of the initial shell mass that was added. These results suggest that CaCO3 availability most likely did not limit dissolution.
In addition to CaCO3 content, CaCO3 dissolution efficiency can also be limited by reactivity. When pore waters transition from over- to undersaturated conditions, carbonate minerals dissolve more readily at high-energy surface sites such as steps and kinks, which are more reactive than smoother surfaces (Adkins et al., 2021). In this experiment, mussel shells were freshly crushed, resulting in more high-energy surface sites relative to the natural CaCO3 present in the sediment. This suggests that CaCO3 reactivity was unlikely to be limiting carbonate dissolution in the shell-amended chambers.
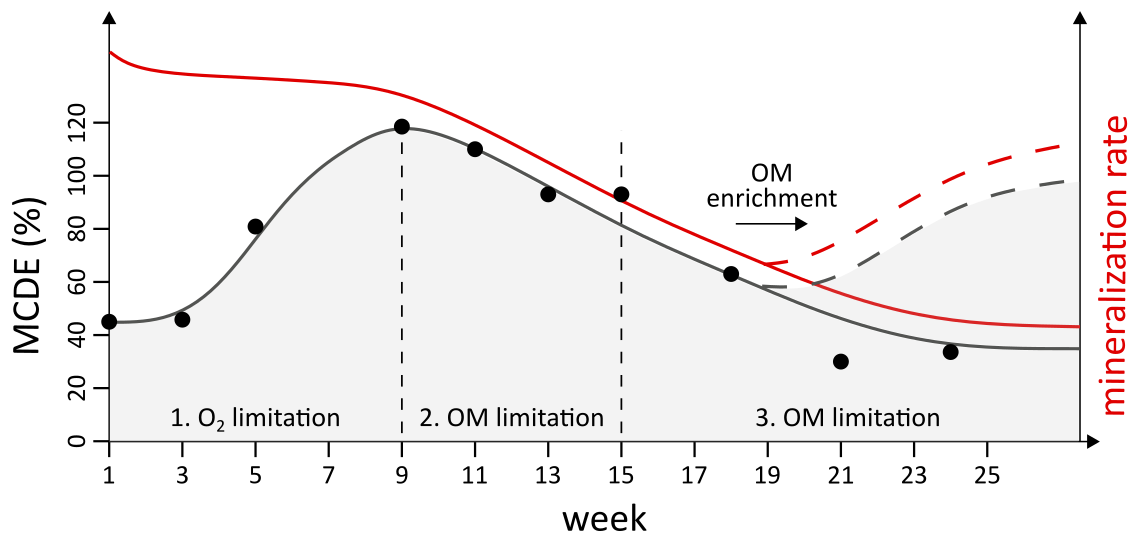
Figure 7Conceptual figure illustrating the three distinct phases observed after mussel shell amendment. Black dots represent mean metabolic CaCO3 dissolution efficiencies (MCDE) determined using the Keeling plot method. During phase 1, MCDE is limited by oxygen (O2) availability. During phase 2, CaCO3 dissolution is limited by organic matter (OM) availability while occurring at maximum efficiency. During phase 3, dissolution efficiency is limited by OM availability, and both dissolution efficiencies and rates gradually approach those observed in sediments without added shells. In a real-world shell amendment scenario, however, metabolic CaCO3 dissolution would be continuously fueled by the supply of fresh OM from the water column, potentially driving the system back towards maximum efficiency.
4.2.2 Limitation by anaerobic mineralization and pore-water flushing
Undersaturation of pore waters with respect to CaCO3 is promoted by oxic conditions, which drive CO2 production through aerobic mineralization. In coarse sediments, this is stimulated by advection, which allows deeper oxygen penetration (Huettel and Gust, 1992) and increases the zone in which CaCO3 undersaturation can develop. The degree of undersaturation is further controlled by the pore-water residence time (PRT), which is the mean time that seawater remains within the sediment before being replaced by new overlying water. If the PRT is too short, acid produced by aerobic mineralization is flushed out before it can drive the pore water towards undersaturation. If the PRT is too long, AT from CaCO3 dissolution will accumulate and drive the pore water back towards saturation (Goossens et al., 2026).
Below the oxic zone, anaerobic mineralization generates AT instead of acidity, along with reduced metabolites (Soetaert et al., 2007). However, these reduced compounds are typically transported upward into the oxic zone, where their reoxidation produces acidity that lowers the CaCO3 saturation state of the pore water. This means that metabolic carbonate dissolution can occur directly via aerobic mineralization and indirectly via anaerobic mineralization coupled to reoxidation in the oxic zone (Dale et al., 2024). Iron sulfide precipitation, however, represents an exception to this process.
During sulfate reduction, hydrogen sulfide (H2S) is produced (Eq. 13). When H2S reacts with reactive iron generated through iron reduction (Eq. 14), iron sulfides can precipitate (Eq. 15, shown for pyrite formation). This prevents the upward transport of H2S and its subsequent reoxidation, resulting in a net source of AT (Hu and Cai, 2011; Middelburg et al., 2020). Under such conditions, the efficiency of metabolic carbonate dissolution is reduced since a potential source of acidity from mineralization is removed.
Ultimately, the interplay between aerobic/anaerobic mineralization and pore-water exchange dictates whether pore waters become under- or oversaturated, thus controlling the MCDE. Throughout the experiment, three distinct phases can be distinguished (Fig. 7): phase one (weeks 1–9) was characterized by initially low MCDE values that gradually increased over time; phase two (weeks 9–15) was characterized by maximum MCDE values (∼ 100 %); and phase three (weeks 15–24) was characterized by decreasing MCDE values over time.
During the first phase of the experiment (weeks 1–9), intense mineralization took place, likely driven by the fresh organic matter associated with the mussel shells. This process was immediately visibly apparent, as during the first week, the top layer of the shell-amended sediment (where the mussel shell fragments had been added) turned black, indicative of sediment anoxia and potential iron sulfide formation (Fig. S7). The oxygen consumption in the treatment chambers was high, suggesting that the oxic zone was likely strongly diminished. Week 1 was also the only week during which we observed accumulation in the overlying water, suggesting that nitrification was inhibited, most likely by a lack of oxygen. In all ensuing flux sessions, the efflux from the sediment remained negligible (Table S1). In the latter part of week 1, oxic conditions apparently reestablished, as nitrification initiated, leading to a depletion of (Fig. S5) and a buildup of (Fig. S4). Nitrification consumes AT by releasing protons, which likely contributed to the observed nonlinear AT accumulation in week 1. Anaerobic mineralization generates AT, which elevates the CaCO3 saturation state in the pore water and thus likely contributed to the low MCDE (∼ 45 %) observed in week 1.
In the rest of the first phase (after week 1), the mineralization remained high (as indicated by high O2 and DIC fluxes; Fig. 3a and b), but the pore waters recovered from the initial “mineralization burst” and became gradually more oxygenated, stimulating metabolic CaCO3 dissolution (Eq. 3). As a result, the MCDE increased with time, until reaching its maximum value in week 9.
During the second phase (weeks 9–15), carbonate dissolution occurred at maximum efficiency in the shell layer. The δ13C-DIC pore-water profiles taken at the end of the experiment indicated that organic matter (δ13C = −21.8 ‰) and CaCO3 (δ13C = −0.7 ‰) contributed approximately equally to the pore-water DIC pool, as reflected by the constant δ13C-DIC value of ∼ −10 ‰ in the deeper sediment layers (Fig. 5c). While this end-point profile does not reveal when these processes occurred, it indicates that, overall, metabolic dissolution contributed substantially to the accumulated pore-water DIC. Given that Rdiss values were highest during the second phase, this integrated signal is expected to be dominated by this period, during which the dissolution efficiency was highest (MCDE ≈ 100 %; Fig. 7). Maximum efficiencies also indicate that Rmin in the shell layer was sufficiently large to overwhelm any potential effect of iron sulfide formation below the oxic layer on fcarb.
In weeks 9–11, the MCDE even exceeded 100 % (Fig. 7). Theoretically, this is not possible when only metabolic dissolution is at play, but it can occur when an additional acid source is present. The observed MCDE > 100 % are hence either related to uncertainty in their estimation, or they can also result from the transient reoxidation of a pool of iron sulfides, a process which generates acid and consumes AT (Rimstidt and Vaughan, 2003). After week 9, the intensity of mineralization decreased, which may have caused an increased and deeper oxygenation, and hence, a reoxidation of previously accumulated iron sulfides, consistent with the observed offset between total AT fluxes and AT fluxes attributed to CaCO3 dissolution (Fig. 6). The observed continuous transition of the sediment color from black to light grey is also consistent with this interpretation, as it suggests potential reoxidation of iron sulfides (Fig. S7).
During the third phase (weeks 15–24), MCDE decreased with time (Fig. 7). At this point, the most labile fraction of organic matter had been mineralized, leading to reduced mineralization rates and decreased O2 consumption rates (Fig. 3a). At this point, CaCO3 dissolution likely became limited by organic matter availability, and dissolution rates decreased accordingly (Fig. 4b). The decreasing Rmin could not generate sufficient acidity to drive the pore water fully towards undersaturation before being flushed, thereby reducing Rdiss, fcarb and MCDE. Eventually, the treatment chambers appeared to evolve towards the control rates, with Rdiss remaining slightly higher than in the control chambers (Fig. 4b).
At the end of the experiment, CaCO3 dissolution appeared limited by organic matter availability. We hence speculate that the addition of new fresh organic matter could again increase the dissolution rate and associated MCDE (Fig. 7). The latter aspect was not examined in the current experiment but provides a testable hypothesis for future studies.
4.3 Enhanced CaCO3 dissolution in the global aquaculture context
The flux incubations performed here provide an estimate for the areal CaCO3 dissolution rate and AT flux induced by enhanced mussel shell dissolution. These values can be used to arrive at a first-order estimate of the potential of bivalve dissolution approaches within an OAE context. When extrapolating our results to the global aquaculture context, we need to consider both CO2 emissions associated with mussel shell aquaculture as well as CO2 sequestration obtained from a shell amendment scenario.
Global yearly CO2 emissions (; t CO2 yr−1) associated with calcification in mussel aquaculture can be calculated as:
In this, mmussel represents the total mass of harvested mussels from aquaculture (t yr−1), xshell denotes the shell fraction of the total mussel mass (∼ 29 %; Adler et al., 2024), represents the CaCO3 fraction of shells (92.65 %; Table 1), ψ is the molar ratio of CO2 released versus CaCO3 precipitated (Frankignoulle, 1994; Frankignoulle et al., 1994), and and are the molar masses of CO2 (44.01 g mol−1) and CaCO3 (100.01 g mol−1), respectively. Calculation of ψ was done using the CRAN:seacarb package in R software (Gattuso et al., 2024), with input parameters representative of surface seawater conditions: DIC = 2100 µmol kg−1, salinity = 35, temperature = 15 °C, and atmospheric pCO2 = 427 µatm (Lan et al., 2023). This yielded a value of ψ = 0.72. Blue mussel aquaculture has a global production of approximately 132 kt yr−1 (FAO, 2025), and so, the CO2 emissions linked to calcification are ∼ 11.2 kt CO2 yr−1. Using the results obtained here, 6.1 ± 1.2 % of the initial shell mass was dissolved after 24 weeks, and so the corresponding CO2 compensation over the same time period would be 6.1 % of the calcification-related emissions incurred during the growth phase (representing 686 ± 135 t CO2 globally). It should be noted, however, that at the end of the experimental period, the CaCO3 dissolution rate and corresponding AT flux in the treatment chambers were still higher than those in the control chambers, thus indicating that enhanced shell dissolution would still continue for a longer period. Assuming the dissolution rate stays constant in time, it would take ∼ 38 years to completely dissolve the added mussel shell fragments, if we use the dissolution rate measured at the end of the experiment. Alternatively, if we use the average dissolution rate over the experiment, the dissolution timescale reduces to ∼ 7 years. However, the extent to which crushed shells remain exposed to oxic conditions over these timescales depends on sediment accumulation rates, which typically range between 0.1 and 1 cm yr−1 in shelf environments (Restreppo et al., 2020), and oxygen penetration depths. Assuming an oxygen penetration depth of 2 cm, corresponding to the thickness of the amended sediment layer in our experiment, this suggests that crushed shells may remain exposed to oxic conditions for ∼ 2–20 years. Once buried below the oxic layer, precipitation may become favored again in oversaturated pore waters, thereby reducing the potential for continued enhanced mussel shell dissolution. Bioturbation, however, can substantially increase the depth of oxygen penetration through bio-irrigation (Aller, 1980; Meysman et al., 2006), and extend the residence time of crushed shells within the oxygenated zone. Considering an average bioturbated layer depth of 10 cm (Boudreau, 1998), the residence time of crushed shells within this zone increases to ∼ 10–100 years (Kuderer and Middelburg, 2024). Therefore, in bioturbated sediments, crushed shells may remain exposed to conditions favorable for metabolic dissolution long enough to approach complete dissolution.
Furthermore, our results clearly indicate that carbonate dissolution was limited by organic matter availability from week ∼ 15 onward in our experimental setup, leading to lowered mineralization rates and decreased metabolic CaCO3 dissolution. Such a depletion of fresh organic matter is a direct consequence of the incubation procedure. In real-world application scenarios, fresh organic matter would be continuously supplied from the water column, especially during spring blooms. This would fuel metabolic CaCO3 dissolution, as conceptually illustrated in Fig. 7, and hence reduce the dissolution time of bivalve shell material. Consequently, dissolution under field conditions may proceed considerably faster than suggested by the estimates derived from our laboratory experiment, increasing the likelihood that complete dissolution occurs before permanent burial, even in sediments with limited bioturbation. As such, the potential of mussel-shell amendment as a strategy to compensate for aquaculture CO2 emissions could be greater than suggested by our laboratory experiment. This interpretation is supported by a recent study, which simulated an application scenario of two types of biominerals to coastal sediments by means of a reactive transport model. These simulations showed that enhanced AT production from shell dissolution could be sustained for over 30 years before transitioning back to steady state (Biçe et al., 2025). Sensitivity analysis also confirmed the limiting effect of lowered mineralization rates on CaCO3 dissolution rates, supporting our findings that shell amendment would be most effective in environments with high organic matter degradation (Biçe et al., 2025).
Enhanced bivalve shell dissolution is most promising in CaCO3-poor permeable sediments residing in shallow areas with high local primary production. Globally, ∼ 70 % of the continental shelf sediments are classified as sandy (i.e. permeable; Burdige, 2007), while ∼ 88 % is classified as CaCO3-poor (Smith and Mackenzie, 2016), thus showing that the coastal environment has a large areal potential for OAE applications based on enhanced bivalve shell dissolution. Bivalve aquaculture produces approximately 12 million t of shell material per year (FAO, 2025), which at the concentrations employed here (8 % addition) would require ∼ 5000 km2 of new application area per year. This area only represents 0.04 % of the CaCO3-poor, sandy sediments found on the global continental shelf, and hence, the space for application does not appear to be limiting.
Still, the selection of an application site for enhanced bivalve shell dissolution requires judicious consideration. Sandy sediments are generally low in organic matter content, and so their potential for metabolic CaCO3 dissolution is highly dependent on a continuous local input of organic matter (de Beer et al., 2005; Goossens et al., 2026). Therefore, sandy sites with a suitably increased flux of organic matter towards the seabed seem preferential. When the organic matter input is too low, metabolic carbonate dissolution becomes limited by organic matter. Likewise, when organic matter inputs are too high, metabolic carbonate dissolution can become oxygen limited. Intensified mineralization can deplete sediment oxygen and create sulfidic conditions, which may remove the presence of bioturbating infauna (Christensen et al., 2003), and promotes AT production by iron sulfide formation. Under such circumstances, CaCO3 dissolution shifts from being organic-matter-limited to being oxygen-limited. Finally, hydrodynamic conditions will determine the fate of added shell material. Resuspension events are common in shallow coastal environments, but their frequency and intensity depend strongly on local wave and current forcing (Guillén et al., 2002; Miles et al., 2013). Resuspension may have contrasting effects on shell dissolution: while physical disturbance can increase oxygen exposure and abrasion of shelf particles, it also increases exposure to oversaturated water and may redistribute particles away from the application area into environments with less favorable conditions for dissolution. Therefore, local sediment transport dynamics should be considered when selecting suitable application sites.
One potential application scenario could be to redistribute shell waste in or near mussel aquaculture environments, which are known to have induced high organic matter deposition rates (Christensen et al., 2003; Hargrave et al., 2008; Lavoie et al., 2024). This would also create direct compensation for the calcifying-induced CO2 emissions that are locally generated (i.e. within-project offsetting). Moreover, it could potentially also improve aquaculture conditions by releasing AT and increasing the seawater pH, although this effect will strongly depend on the residence time of the water at the site. Previous studies have investigated organic matter accumulation beneath mussel farms and its effect on the local sediment geochemistry, showing that the magnitude of the impact depends on multiple factors. While the mussel density determines the total organic matter flux from the water column, the distance from the farm and the local hydrodynamics control how much of this material is deposited within the sediment (e.g., Christensen et al., 2003; Cranford et al., 2007; Hargrave et al., 2008; Lacoste et al., 2018; Lavoie et al., 2024; McKindsey et al., 2011; Wilson and Vopel, 2015). This emphasizes the need to carefully characterize sediment conditions prior to mussel shell waste application. Optimal sites could be areas with low hydrodynamic forcing that are located near but not directly beneath mussel farms, allowing elevated organic matter deposition without inducing anoxia, or areas with high hydrodynamic forcing directly beneath mussel farms, where organic matter fluxes are high but sufficiently dispersed to prevent highly localized deposition.
In this study, we investigated the dissolution of mussel shell waste in permeable sediments as a novel type of OAE approach, which aims for enhanced circularity and reduced emissions in bivalve aquaculture operation. While mussels (and bivalves in general) already have a low CO2 footprint per gram of protein compared to other food sources, this CO2 footprint could be lowered by dissolving the shells in marine conditions. Permeable sediment amended with crushed mussel shells exhibited significantly higher dissolution rates, driven by aerobic mineralization linked to organic matter associated with the shells. A transient dissolution pattern was observed, where initial oxygen limitation was followed by organic matter limitation. After 24 weeks of sediment incubation, 6.1 ± 1.2 % of the initial shell mass had dissolved, which upon extrapolation provides a dissolution timescale of ∼ 38 years. Deploying mussel shell waste in natural sediments with high and continuous organic matter deposition, however, could increase the compensation potential and shorten the dissolution timescale. Potential application areas include mussel farms, which would allow for direct in-project CO2 compensation, with the potential of improving aquaculture conditions. Careful characterization of the sediment geochemistry prior to mussel shell waste application is crucial to ensure optimal conditions for CaCO3 dissolution.
While enhanced mussel shell dissolution seems feasible, it should be noted that the results presented here are derived from a controlled laboratory experiment. In contrast, natural sediments experience seasonal variation in temperature and organic matter deposition, are subject to variable hydrodynamic forcing (including storms), and experience infaunal activity such as bioturbation and bio-irrigation, all of which can influence oxygen availability or benthic mineralization rates. Bridging the gap between laboratory and field conditions will require experiments conducted under more realistic settings, such as large-scale mesocosms and eventually field trials. To date, OAE studies are heavily inclined towards modeling approaches. While models are crucial for exploring large-scale scenarios, their predictive capacity ultimately depends on experimental data, which is currently still largely lacking. In this study, we tested a single mussel shell loading in a single sediment type under controlled conditions. It remains unknown whether higher shell concentrations could yield a higher CO2 compensation potential, or how this potential might change in coarser sediments with deeper oxygen penetration. Future research exploring a range of shell waste types, loadings and sediment grain sizes in realistic field conditions is needed to identify the optimal conditions for enhanced shell dissolution. Finally, future assessments should integrate a full life-cycle perspective on shell reuse pathways, including emissions associated with shell collection, processing, transport, and application, to determine the net CO2 benefit of enhanced shell dissolution under realistic deployment scenarios.
The code used for analysis in this study is available upon request. Interested parties may contact the corresponding author.
The source data is publicly available on GitHub and archived on Zenodo at https://doi.org/10.5281/zenodo.19632016 (Goossens, 2026).
The supplement related to this article is available online at https://doi.org/10.5194/bg-23-6447-2026-supplement.
CG conducted the experiment and was responsible for the data collection, analysis, and writing of the manuscript. SJVDV and FJRM were responsible for the conceptualization and supervision of the study. SB supervised analysis of solid phase and δ13C-DIC samples. All authors contributed to the final manuscript.
At least one of the (co-)authors is a member of the editorial board of Biogeosciences. The peer-review process was guided by an independent editor, and the authors also have no other competing interests to declare.
Publisher's note: Copernicus Publications remains neutral with regard to jurisdictional claims made in the text, published maps, institutional affiliations, or any other geographical representation in this paper. The authors bear the ultimate responsibility for providing appropriate place names. Views expressed in the text are those of the authors and do not necessarily reflect the views of the publisher.
The authors thank Gunter Flipkens and Nada Nasri for assistance during pore-water sampling, Greet Lembregts for assistance during pore-water sampling and analysis of samples, and Yannick Stroobandt for analysis of samples.
This research was supported by the RV/21/DEHEAT project from the Belgian Science Policy Office (BELSPO), a Strategic Basic Research (SBO) project (no. S000619N) from Research Foundation Flanders (FWO), and the Blue Cluster project (project no. HBC.2023.0496) from Flanders Innovation & Entrepreneurship (VLAIO). Cedric Goossens was supported by a University Research Fund (BOF) of the University of Antwerp. Sebastiaan J. van de Velde acknowledges the New Zealand MBIE Strategic Science Investment Fund for support via the ESNZ Ocean-Climate Interaction programme.
This paper was edited by Tyler Cyronak and reviewed by three anonymous referees.
Adkins, J. F., Naviaux, J. D., Subhas, A. V., Dong, S., and Berelson, W. M.: The Dissolution Rate of CaCO3 in the Ocean, Annu. Rev. Mar. Sci., 13, 57–80, https://doi.org/10.1146/annurev-marine-041720-092514, 2021.
Adler, I., Kotta, J., Robal, M., Humayun, S., Vene, K., and Tuvikene, R.: Valorization of Baltic Sea farmed blue mussels: Chemical profiling and prebiotic potential for nutraceutical and functional food development, Food Chem. X, 23, 101736, https://doi.org/10.1016/j.fochx.2024.101736, 2024.
Aller, R. C.: Quantifying solute distributions in the bioturbated zone of marine sediments by defining an average microenvironment, Geochim. Cosmochim. Ac., 44, 1955–1965, https://doi.org/10.1016/0016-7037(80)90195-7, 1980.
Aller, R. C.: Carbonate dissolution in nearshore terrigenous muds: the role of physical and biological reworking, J. Geol., 90, 79–95, https://doi.org/10.1086/628652, 1982.
Archer, D., Emerson, S., and Reimers, C.: Dissolution of calcite in deep-sea sediments: pH and O2 microelectrode results, Geochim. Cosmochim. Ac., 53, 2831–2845, https://doi.org/10.1016/0016-7037(89)90161-0, 1989.
Biçe, K., Myers Stewart, T., Waldbusser, G. G., and Meile, C.: The effect of carbonate mineral additions on biogeochemical conditions in surface sediments and benthic–pelagic exchange fluxes, Biogeosciences, 22, 641–657, https://doi.org/10.5194/bg-22-641-2025, 2025.
Boudreau, B. P.: Mean mixed depth of sediments: The wherefore and the why, Limnol. Oceanogr., 43, 524–526, https://doi.org/10.4319/lo.1998.43.3.0524, 1998.
Bullock, L. A., James, R. H., Matter, J., Renforth, P., and Teagle, D. A. H.: Global Carbon Dioxide Removal Potential of Waste Materials From Metal and Diamond Mining, Front. Clim., 3, 694175, https://doi.org/10.3389/fclim.2021.694175, 2021.
Burdige, D. J.: Preservation of organic matter in marine sediments: Controls, mechanisms, and an imbalance in sediment organic carbon budgets?, Chem. Rev., 107, 467–485, https://doi.org/10.1021/cr050347q, 2007.
Burnham, K. P. and Anderson, D. R. (Eds.): Model Selection and Multimodel Inference, Springer New York, New York, NY, https://doi.org/10.1007/b97636, 2004.
Carlson, R. R., Lewis, M. A., Ninokawa, A. T., Saley, A. M., Hill, T. M., and Gaylord, B.: Shell dissolution rates differ fourfold between mussel species, R. Soc. Open Sci., 12, 250664, https://doi.org/10.1098/rsos.250664, 2025.
Christensen, P. B., Glud, R. N., Dalsgaard, T., and Gillespie, P.: Impacts of longline mussel farming on oxygen and nitrogen dynamics and biological communities of coastal sediments, Aquaculture, 218, 567–588, https://doi.org/10.1016/S0044-8486(02)00587-2, 2003.
Cranford, P., Strain, P., Dowd, M., Hargrave, B., Grant, J., and Archambault, M.: Influence of mussel aquaculture on nitrogen dynamics in a nutrient enriched coastal embayment, Mar. Ecol. Prog. Ser., 347, 61–78, https://doi.org/10.3354/meps06997, 2007.
Cubillas, P., Köhler, S., Prieto, M., Chaïrat, C., and Oelkers, E. H.: Experimental determination of the dissolution rates of calcite, aragonite, and bivalves, Chem. Geol., 216, 59–77, https://doi.org/10.1016/j.chemgeo.2004.11.009, 2005.
Dale, A. W., Geilert, S., Diercks, I., Fuhr, M., Perner, M., Scholz, F., and Wallmann, K.: Seafloor alkalinity enhancement as a carbon dioxide removal strategy in the Baltic Sea, Commun. Earth Environ., 5, 452, https://doi.org/10.1038/s43247-024-01569-3, 2024.
de Beer, D., Wenzhöfer, F., Ferdelman, T. G., Boehme, S. E., Huettel, M., Van Beusekom, J. E. E., Böttcher, M. E., Musat, N., and Dubilier, N.: Transport and mineralization rates in North Sea sandy intertidal sediments, Sylt-Rømø Basin, Wadden Sea, Limnol. Oceanogr., 50, 113–127, https://doi.org/10.4319/lo.2005.50.1.0113, 2005.
Devol, A. H., Codispoti, L. A., and Christensen, J. P.: Summer and winter denitrification rates in western Arctic shelf sediments, Cont. Shelf Res., 17, 1029–1050, https://doi.org/10.1016/S0278-4343(97)00003-4, 1997.
Dickson, A. G.: An exact definition of total alkalinity and a procedure for the estimation of alkalinity and total inorganic carbon from titration data, Deep-Sea Res., 28A, 609–623, https://doi.org/10.1016/0198-0149(81)90121-7, 1981.
Emerson, S. and Bender, M.: Carbon fluxes at the sediment-water interface of the deep-sea: Calcium carbonate preservation, J. Mar. Res., 39, 139–162, 1981.
Ericson, J. A. and Ragg, N. L. C.: Effects of crushed mussel, Perna canaliculus, shell enrichment on seawater carbonate buffering and development of conspecific larvae exposed to near-future ocean acidification, J. World Aquac. Soc., 53, 271–289, https://doi.org/10.1111/jwas.12779, 2022.
FAO: The State of World Fisheries and Aquaculture 2024 – Blue Transformation in action, FAO, Rome, https://doi.org/10.4060/cd0683en, 2024.
FAO: FishStat: Global aquaculture production 1950–2023, in: FishStatJ, FAO, https://www.fao.org/fishery/statistics/software/fishstatj/en (last access: 28 March 2025), 2025.
Flipkens, G., Fuhr, M., Fiers, G., Meysman, F. J. R., Town, R. M., and Blust, R.: Enhanced olivine dissolution in seawater through continuous grain collisions, Geochim. Cosmochim. Ac., 359, 84–99, https://doi.org/10.1016/j.gca.2023.09.002, 2023.
Forja, J. and Gómez-Parra, A.: Measuring nutrient fluxes across the sediment-water interface using benthic chambers, Mar. Ecol. Prog. Ser., 164, 95–105, https://doi.org/10.3354/meps164095, 1998.
Frankignoulle, M.: A complete set of buffer factors for acid/base CO2 system in seawater, J. Mar. Syst., 5, 111–118, https://doi.org/10.1016/0924-7963(94)90026-4, 1994.
Frankignoulle, M., Canon, C., and Gattuso, J.: Marine calcification as a source of carbon dioxide: Positive feedback of increasing atmospheric CO2, Limnol. Oceanogr., 39, 458–462, https://doi.org/10.4319/lo.1994.39.2.0458, 1994.
Frankignoulle, M., Pichon, M., and Gattuso, J.-P.: Aquatic Calcification as a Source of Carbon Dioxide, in: Carbon Sequestration in the Biosphere, edited by: Beran, M. A., Springer Berlin Heidelberg, Berlin, Heidelberg, 265–271, https://doi.org/10.1007/978-3-642-79943-3_18, 1995.
Friedlingstein, P., O'Sullivan, M., Jones, M. W., Andrew, R. M., Bakker, D. C. E., Hauck, J., Landschützer, P., Le Quéré, C., Li, H., Luijkx, I. T., Peters, G. P., Peters, W., Pongratz, J., Schwingshackl, C., Sitch, S., Canadell, J. G., Ciais, P., Aas, K., Alin, S. R., Anthoni, P., Barbero, L., Bates, N. R., Bellouin, N., Benoit-Cattin, A., Berghoff, C. F., Bernardello, R., Bopp, L., Brasika, I. B. M., Chamberlain, M. A., Chandra, N., Chevallier, F., Chini, L. P., Collier, N. O., Colligan, T. H., Cronin, M., Djeutchouang, L. M., Dou, X., Enright, M. P., Enyo, K., Erb, M., Evans, W., Feely, R. A., Feng, L., Ford, D. J., Foster, A., Fransner, F., Gasser, T., Gehlen, M., Gkritzalis, T., Goncalves De Souza, J., Grassi, G., Gregor, L., Gruber, N., Guenet, B., Gürses, Ö., Harrington, K., Harris, I., Heinke, J., Hurtt, G. C., Iida, Y., Ilyina, T., Ito, A., Jacobson, A. R., Jain, A. K., Jarníková, T., Jersild, A., Jiang, F., Jones, S. D., Kato, E., Keeling, R. F., Klein Goldewijk, K., Knauer, J., Kong, Y., Korsbakken, J. I., Koven, C., Kunimitsu, T., Lan, X., Liu, J., Liu, Z., Liu, Z., Lo Monaco, C., Ma, L., Marland, G., McGuire, P. C., McKinley, G. A., Melton, J. R., Monacci, N., Monier, E., Morgan, E. J., Munro, D. R., Müller, J. D., Nakaoka, S.-I., Nayagam, L. R., Niwa, Y., Nutzel, T., Olsen, A., Omar, A. M., Pan, N., Pandey, S., Pierrot, D., Qin, Z., Regnier, P., Rehder, G., Resplandy, L., Roobaert, A., Rosan, T. M., Rödenbeck, C., Schwinger, J., Skjelvan, I., Smallman, T. L., Spada, V., Sreeush, M. G., Sun, Q., Sutton, A. J., Sweeney, C., Swingedouw, D., Séférian, R., Takao, S., Tatebe, H., Tian, H., Tian, X., Tilbrook, B., Tsujino, H., Tubiello, F., van Ooijen, E., van der Werf, G. R., van de Velde, S. J., Walker, A. P., Wanninkhof, R., Yang, X., Yuan, W., Yue, X., and Zeng, J.: Global Carbon Budget 2025, Earth Syst. Sci. Data, 18, 3211–3288, https://doi.org/10.5194/essd-18-3211-2026, 2026.
Fuhr, M., Geilert, S., Schmidt, M., Liebetrau, V., Vogt, C., Ledwig, B., and Wallmann, K.: Kinetics of Olivine Weathering in Seawater: An Experimental Study, Front. Clim., 4, 831587, https://doi.org/10.3389/fclim.2022.831587, 2022.
Fuhr, M., Wallmann, K., Dale, A. W., Diercks, I., Kalapurakkal, H. T., Schmidt, M., Sommer, S., Böhnke, S., Perner, M., and Geilert, S.: Disentangling artificial and natural benthic weathering in organic rich Baltic Sea sediments, Front. Clim., 5, 1245580, https://doi.org/10.3389/fclim.2023.1245580, 2023.
Fuhr, M., Wallmann, K., Dale, A. W., Kalapurakkal, H. T., Schmidt, M., Sommer, S., Deusner, C., Spiegel, T., Kowalski, J., and Geilert, S.: Alkaline mineral addition to anoxic to hypoxic Baltic Sea sediments as a potentially efficient CO2-removal technique, Front. Clim., 6, 1338556, https://doi.org/10.3389/fclim.2024.1338556, 2024.
Fuhr, M., Dale, A. W., Wallmann, K., Bährle, R., Kalapurakkal, H. T., Sommer, S., Spiegel, T., Dobashi, R., Buchholz, B., Schmidt, M., Perner, M., and Geilert, S.: Calcite is an efficient and low-cost material to enhance benthic weathering in shelf sediments of the Baltic Sea, Commun. Earth Environ., 6, 106, https://doi.org/10.1038/s43247-025-02079-6, 2025.
Gasser, T., Guivarch, C., Tachiiri, K., Jones, C. D., and Ciais, P.: Negative emissions physically needed to keep global warming below 2 °C, Nat. Commun., 6, 7958, https://doi.org/10.1038/ncomms8958, 2015.
Gattuso, J.-P., Epitalon, J.-M., Lavigne, H., and Orr, J.: seacarb: Seawater Carbonate Chemistry, R package version 3.3.3, Comprehensive R Archive Network (CRAN) [code], https://doi.org/10.32614/CRAN.package.seacarb, 2024.
Gazeau, F., Quiblier, C., Jansen, J. M., Gattuso, J., Middelburg, J. J., and Heip, C. H. R.: Impact of elevated CO2 on shellfish calcification, Geophys. Res. Lett., 34, 2006GL028554, https://doi.org/10.1029/2006GL028554, 2007.
Gazeau, F., Parker, L. M., Comeau, S., Gattuso, J.-P., O'Connor, W. A., Martin, S., Pörtner, H.-O., and Ross, P. M.: Impacts of ocean acidification on marine shelled molluscs, Mar. Biol., 160, 2207–2245, https://doi.org/10.1007/s00227-013-2219-3, 2013.
Geerts, L. J. J., Hylén, A., and Meysman, F. J. R.: Review and syntheses: Ocean alkalinity enhancement and carbon dioxide removal through marine enhanced rock weathering using olivine, Biogeosciences, 22, 355–384, https://doi.org/10.5194/bg-22-355-2025, 2025.
Glud, R. N.: Oxygen dynamics of marine sediments, Mar. Biol. Res., 4, 243–289, https://doi.org/10.1080/17451000801888726, 2008.
Goossens, C.: CGoossens/Enhanced-mussel-shell-dissolution: Raw data file (Version v2), Zenodo [code and data set], https://doi.org/10.5281/zenodo.19632016, 2026.
Goossens, C., Van De Velde, S. J., and Meysman, F. J. R.: A Revised Estimate of Calcium Carbonate Dissolution in Coastal and Shelf Sediments Suggests Large Shelf Exports in the Marine CaCO3 Cycle, Global. Biogeochem. Cy., 40, e2025GB008936, https://doi.org/10.1029/2025GB008936, 2026.
Green, M. A., Jones, M. E., Boudreau, C. L., Moore, R. L., and Westman, B. A.: Dissolution mortality of juvenile bivalves in coastal marine deposits, Limnol. Oceanogr., 49, 727–734, https://doi.org/10.4319/lo.2004.49.3.0727, 2004.
Green, M. A., Waldbusser, G. G., Reilly, S. L., Emerson, K., and O'Donnell, S.: Death by dissolution: Sediment saturation state as a mortality factor for juvenile bivalves, Limnol. Oceanogr., 54, 1037–1047, https://doi.org/10.4319/lo.2009.54.4.1037, 2009.
Guillén, J., Jiménez, J. A., Palanques, A., Gracia, V., Puig, P., and Sánchez-Arcilla, A.: Sediment resuspension across a microtidal, low-energy inner shelf, Cont. Shelf Res., 22, 305–325, https://doi.org/10.1016/S0278-4343(01)00059-0, 2002.
Hangx, S. J. T. and Spiers, C. J.: Coastal spreading of olivine to control atmospheric CO2 concentrations: A critical analysis of viability, Int. J. Greenh. Gas Control, 3, 757–767, https://doi.org/10.1016/j.ijggc.2009.07.001, 2009.
Hargrave, B., Doucette, L., Cranford, P., Law, B., and Milligan, T.: Influence of mussel aquaculture on sediment organic enrichment in a nutrient-rich coastal embayment, Mar. Ecol. Prog. Ser., 365, 137–149, https://doi.org/10.3354/meps07636, 2008.
Hu, X. and Cai, W.-J.: An assessment of ocean margin anaerobic processes on oceanic alkalinity budget, Global. Biogeochem. Cy., 25, https://doi.org/10.1029/2010GB003859, 2011.
Huettel, M. and Gust, G.: Impact of bioroughness on interfacial solute exchange in permeable sediments, Mar. Ecol. Prog. Ser., 89, 253–267, https://doi.org/10.3354/meps089253, 1992.
Hurvich, C. M. and Tsai, C.-L.: Regression and time series model selection in small samples, Biometrika, 76, 297–307, https://doi.org/10.1093/biomet/76.2.297, 1989.
Hylén, A. and van de Velde, S.: FLUXER, Zenodo [code], https://doi.org/10.5281/zenodo.14758689, 2025.
IPCC: Climate Change 2023: Synthesis Report. Contribution of Working Groups I, II and III to the Sixth Assessment Report of the Intergovernmental Panel on Climate Change, edited by: Lee, H. and Romero, J. (Core Writing Team), Intergovernmental Panel on Climate Change, https://doi.org/10.59327/IPCC/AR6-9789291691647, 2023.
Jørgensen, B. B., Wenzhöfer, F., Egger, M., and Glud, R. N.: Sediment oxygen consumption: Role in the global marine carbon cycle, Earth-Sci. Rev., 228, 103987, https://doi.org/10.1016/j.earscirev.2022.103987, 2022.
Keeling, C. D.: The concentration and isotopic abundances of atmospheric carbon dioxide in rural areas, Geochim. Cosmochim. Ac., 13, 322–334, https://doi.org/10.1016/0016-7037(58)90033-4, 1958.
Keeling, C. D.: The concentration and isotopic abundances of carbon dioxide in rural and marine air, Geochim. Cosmochim. Ac., 24, 277–298, https://doi.org/10.1016/0016-7037(61)90023-0, 1961.
Kleypas, J. A.: Ocean Acidification, Effects on Calcification, in: Encyclopedia of Modern Coral Reefs, edited by: Hopley, D., Springer Dordrecht, 733–737, https://doi.org/10.1007/978-90-481-2639-2_118, 2011.
Kuderer, M. and Middelburg, J. J.: Organic Carbon Reaction Kinetics in Bioturbated Sediments, Geophys. Res. Lett., 51, e2024GL110404, https://doi.org/10.1029/2024GL110404, 2024.
Lacoste, É., Drouin, A., Weise, A., Archambault, P., and McKindsey, C.: Low benthic impact of an offshore mussel farm in Îles-de-la-Madeleine, eastern Canada, Aquac. Environ. Interact., 10, 473–485, https://doi.org/10.3354/aei00283, 2018.
Lan, X., Tans, P., Thoning, K., and NOAA Global Monitoring Laboratory: Trends in globally-averaged CO2 determined from NOAA Global Monitoring Laboratory measurements, NOAA Global Monitoring Laboratory, https://doi.org/10.15138/9N0H-ZH07, 2023.
Lavoie, M.-F., Lacoste, É., Weise, A. M., and McKindsey, C. W.: Benthic responses to organic enrichment under a mussel (Mytilus edulis) farm, Front. Mar. Sci., 11, 1433365, https://doi.org/10.3389/fmars.2024.1433365, 2024.
Lück, S., Callaghan, M., Borchers, M., Cowie, A., Fuss, S., Gidden, M., Hartmann, J., Kammann, C., Keller, D. P., Kraxner, F., Lamb, W. F., Mac Dowell, N., Müller-Hansen, F., Nemet, G. F., Probst, B. S., Renforth, P., Repke, T., Rickels, W., Schulte, I., Smith, P., Smith, S. M., Thrän, D., Troxler, T. G., Sick, V., Van Der Spek, M., and Minx, J. C.: Scientific literature on carbon dioxide removal revealed as much larger through AI-enhanced systematic mapping, Nat. Commun., 16, 6632, https://doi.org/10.1038/s41467-025-61485-8, 2025.
Lunstrum, A. and Berelson, W. M.: CaCO3 dissolution in carbonate-poor shelf sands increases with ocean acidification and porewater residence time, Geochim. Cosmochim. Ac., 329, 168–184, https://doi.org/10.1016/j.gca.2022.04.031, 2022.
McClintock, J. B., Angus, R. A., Mcdonald, M. R., Amsler, C. D., Catledge, S. A., and Vohra, Y. K.: Rapid dissolution of shells of weakly calcified Antarctic benthic macroorganisms indicates high vulnerability to ocean acidification, Antarct. Sci., 21, 449–456, https://doi.org/10.1017/S0954102009990198, 2009.
McKindsey, C. W., Archambault, P., Callier, M. D., and Olivier, F.: Influence of suspended and off-bottom mussel culture on the sea bottom and benthic habitats: a review, Can. J. Zool., 89, 622–646, https://doi.org/10.1139/z11-037, 2011.
Melzner, F., Stange, P., Trübenbach, K., Thomsen, J., Casties, I., Panknin, U., Gorb, S. N., and Gutowska, M. A.: Food Supply and Seawater pCO2 Impact Calcification and Internal Shell Dissolution in the Blue Mussel Mytilus edulis, PLoS ONE, 6, e24223, https://doi.org/10.1371/journal.pone.0024223, 2011.
Meysman, F. J. R. and Montserrat, F.: Negative CO2 emissions via enhanced silicate weathering in coastal environments, Biol. Lett., 13, 20160905, https://doi.org/10.1098/rsbl.2016.0905, 2017.
Meysman, F. J. R., Galaktionov, O. S., Gribsholt, B., and Middelburg, J. J.: Bioirrigation in permeable sediments: Advective pore-water transport induced by burrow ventilation, Limnol. Oceanogr., 51, 142–156, https://doi.org/10.4319/lo.2006.51.1.0142, 2006.
Middelburg, J. J., Soetaert, K., and Hagens, M.: Ocean alkalinity, buffering and biogeochemical processes, Rev. Geophys., 58, https://doi.org/10.1029/2019RG000681, 2020.
Miles, T., Glenn, S. M., and Schofield, O.: Temporal and spatial variability in fall storm induced sediment resuspension on the Mid-Atlantic Bight, Cont. Shelf Res., 63, S36–S49, https://doi.org/10.1016/j.csr.2012.08.006, 2013.
Minx, J., Burke, J., Schulte, I., Probst, B., Müller-Hansen, F., Roe, S., Buck, H., Smith, S., Injy Johnstone, Nemet, G. F., Edwards, M., Gidden, M., Schenuit, F., Fuss, S., Lamb, W. F., Geden, O., Pongratz, J., Vaughan, N., and Cox, E.: The State of Carbon Dioxide Removal – 2nd edition, University of Oxford's Smith School of Enterprise and the Environment, https://doi.org/10.17605/OSF.IO/F85QJ, 2024.
Montgomery, D. C., Peck, E. A., and Vining, G. G.: Introduction to linear regression analysis, Wiley, ISBN 978-0-470-54281-1, 2012.
Montserrat, F., Renforth, P., Hartmann, J., Leermakers, M., Knops, P., and Meysman, F. J. R.: Olivine Dissolution in Seawater: Implications for CO2 Sequestration through Enhanced Weathering in Coastal Environments, Environ. Sci. Technol., 51, 3960–3972, https://doi.org/10.1021/acs.est.6b05942, 2017.
Morse, J. W. and Mackenzie, F. T.: Geochemistry of sedimentary carbonates, Elsevier, ISBN 978-0-444-87391-0, 1990.
Morse, J. W., Zullig, J. J., Bernstein, L. D., Millero, F. J., Milne, P. J., Mucci, A., and Choppin, G. R.: Chemistry of calcium carbonate-rich shallow water sediments in the Bahamas, Am. J. Sci., 285, 147–185, https://doi.org/10.2475/ajs.285.2.147, 1985.
Nienhuis, S., Palmer, A. R., and Harley, C. D. G.: Elevated CO2 affects shell dissolution rate but not calcification rate in a marine snail, Proc. R. Soc. B Biol. Sci., 277, 2553–2558, https://doi.org/10.1098/rspb.2010.0206, 2010.
Oschlies, A., Bach, L. T., Rickaby, R. E. M., Satterfield, T., Webb, R., and Gattuso, J.-P.: Climate targets, carbon dioxide removal, and the potential role of ocean alkalinity enhancement, in: Guide to Best Practices in Ocean Alkalinity Enhancement Research, edited by: Oschlies, A., Stevenson, A., Bach, L. T., Fennel, K., Rickaby, R. E. M., Satterfield, T., Webb, R., and Gattuso, J.-P., Copernicus Publications, State Planet, 2-oae2023, 1, https://doi.org/10.5194/sp-2-oae2023-1-2023, 2023.
Pataki, D. E., Ehleringer, J. R., Flanagan, L. B., Yakir, D., Bowling, D. R., Still, C. J., Buchmann, N., Kaplan, J. O., and Berry, J. A.: The application and interpretation of Keeling plots in terrestrial carbon cycle research, Global. Biogeochem. Cy., 17, https://doi.org/10.1029/2001GB001850, 2003.
Pernet, F., Dupont, S., Gattuso, J., Metian, M., and Gazeau, F.: Cracking the myth: Bivalve farming is not a CO2 sink, Rev. Aquac., 17, https://doi.org/10.1111/raq.12954, 2025.
Ray, N. E., O'Meara, T., Wiliamson, T., Izursa, J.-L., and Kangas, P. C.: Consideration of carbon dioxide release during shell production in LCA of bivalves, Int. J. Life Cycle Assess., 23, 1042–1048, https://doi.org/10.1007/s11367-017-1394-8, 2018.
Renforth, P. and Henderson, G.: Assessing ocean alkalinity for carbon sequestration, Rev. Geophys., 55, 636–674, https://doi.org/10.1002/2016RG000533, 2017.
Restreppo, G. A., Wood, W. T., and Phrampus, B. J.: Oceanic sediment accumulation rates predicted via machine learning algorithm: towards sediment characterization on a global scale, Geo-Mar. Lett., 40, 755–763, https://doi.org/10.1007/s00367-020-00669-1, 2020.
Rimstidt, J. D. and Vaughan, D. J.: Pyrite oxidation: a state-of-the-art assessment of the reaction mechanism, Geochim. Cosmochim. Ac., 67, 873–880, https://doi.org/10.1016/S0016-7037(02)01165-1, 2003.
Sanderson, B. M., O'Neill, B. C., and Tebaldi, C.: What would it take to achieve the Paris temperature targets?, Geophys. Res. Lett., 43, 7133–7142, https://doi.org/10.1002/2016GL069563, 2016.
Smith, S. V. and Mackenzie, F. T.: The role of CaCO3 reactions in the contemporary oceanic CO2 cycle, Aquat. Geochem., 22, 153–175, https://doi.org/10.1007/s10498-015-9282-y, 2016.
Soetaert, K., Hofmann, A. F., Middelburg, J. J., Meysman, F. J. R., and Greenwood, J.: The effect of biogeochemical processes on pH, Mar. Chem., 105, 30–51, https://doi.org/10.1016/j.marchem.2006.12.012, 2007.
Subhas, A. V., Dong, S., Naviaux, J. D., Rollins, N. E., Ziveri, P., Gray, W., Rae, J. W. B., Liu, X., Byrne, R. H., Chen, S., Moore, C., Martell-Bonet, L., Steiner, Z., Antler, G., Hu, H., Lunstrum, A., Hou, Y., Kemnitz, N., Stutsman, J., Pallacks, S., Dugenne, M., Quay, P. D., Berelson, W. M., and Adkins, J. F.: Shallow Calcium Carbonate Cycling in the North Pacific Ocean, Global. Biogeochem. Cy., 36, https://doi.org/10.1029/2022GB007388, 2022.
Thrane, M.: Energy Consumption in the Danish Fishery: Identification of Key Factors, J. Ind. Ecol., 8, 223–239, https://doi.org/10.1162/1088198041269427, 2004.
Waldbusser, G. G., Steenson, R. A., and Green, M. A.: Oyster Shell Dissolution Rates in Estuarine Waters: Effects of pH and Shell Legacy, J. Shellfish Res., 30, 659–669, https://doi.org/10.2983/035.030.0308, 2011.
Welladsen, H. M., Southgate, P. C., and Heimann, K.: The effects of exposure to near-future levels of ocean acidification on shell characteristics of Pinctada fucata (Bivalvia: Pteriidae), Molluscan Res., 30, https://doi.org/10.11646/mr.30.3.2, 2010.
Wilson, P. S. and Vopel, K.: Assessing the Sulfide Footprint of Mussel Farms with Sediment Profile Imagery: A New Zealand Trial, PLOS ONE, 10, e0129894, https://doi.org/10.1371/journal.pone.0129894, 2015.
Zeebe, R. E. and Wolf-Gladrow, D.: CO2 in seawater: equilibrium, kinetics, isotopes, Elsevier, Amsterdam, ISBN 978-0-444-50579-8, 2001.