
the Creative Commons Attribution 4.0 License.
the Creative Commons Attribution 4.0 License.
 | 24 Sep 2026
High nitrous oxide isotopic variability during denitrification by Pseudomonas species bearing NirK and NirS

Paul M. Magyar
Jakob Zopfi
Claudia Frey
Thomas Kuhn
Moritz F. Lehmann
Nitrous oxide (N2O) isotopocules provide key insights into microbial nitrogen cycling, but their interpretation requires well-constrained values for both oxygen isotope signatures (δ18O–N2O) and intramolecular 15N site preference (SP) associated with N2O production pathways. Site preference is widely used to distinguish N2O formation pathways because bacterial denitrification is generally assumed to yield SP values near 0 ‰ through canonical NorB-mediated NO reduction. However, the extent to which SP remains stable across physiological states and changing NO reduction pathways remains poorly constrained. Likewise, interpretation of δ18O–N2O associated with denitrification requires understanding the relative contributions of branching kinetic isotope effects and oxygen atom exchange between nitrite and water during N2O formation.
Here, we investigated N2O isotopic signatures during denitrification by Pseudomonas aureofaciens (NirK-bearing) and Pseudomonas chlororaphis (NirS-bearing) under active-growth and resuspension conditions using quantum cascade laser absorption spectroscopy (QCLAS) and isotope ratio mass spectrometry (IRMS). SP tracked canonical NorB-mediated NO reduction but transiently increased above +10 ‰ during early N2O production, suggesting temporary activity of alternative NO reductases. These dynamics were only resolved through continuous QCLAS measurements, highlighting the importance of time-resolved isotopic observations. While SP remains a useful indicator of NO reduction mechanisms, these results show that even within denitrification, shifts between NO reduction pathways may lead to variable SP signatures.
In parallel, we quantified oxygen atom exchange between nitrite and water using incubations prepared in natural-abundance and 18O-enriched water. Contrary to expectations from denitrifier-method studies, P. aureofaciens exhibited substantial and highly variable oxygen-atom exchange (38 %–100 %), far exceeding previously reported values (<9 %). In contrast, P. chlororaphis showed consistently high but less variable exchange (∼ 66 %). Resuspension experiments reproduced the characteristic low- and high-exchange behavior reported for these strains under denitrifier-method conditions, demonstrating that these exchange values are specific to the methodological framework and not representative of actively growing systems. These results show that oxygen atom exchange is not governed solely by nitrite reductase identity (NirS vs. NirK) but is strongly modulated by physiological state and metabolic context, including active growth versus stationary-phase resuspension and differences in nitrite turnover. As a result, δ18O–N2O cannot be interpreted as a fixed tracer of denitrification pathways outside the constrained conditions of the denitrifier method.
Together, these findings suggest that denitrifying bacteria may generate N2O with a broader range of δ18O–N2O and SP than previously assumed. This calls for a reassessment of N2O isotopocule interpretations and emphasizes the need to integrate isotopic measurements with physiological and biochemical constraints.
- Article
(1256 KB) - Full-text XML
-
Supplement
(1151 KB) - BibTeX
- EndNote


The intensification of agriculture and fossil fuel combustion over the past century has fundamentally altered the global nitrogen (N) cycle, leading to increased emissions of nitrous oxide (N2O), a potent greenhouse gas and stratospheric ozone-depleting substance (IPCC, 2023; WMO, 2024). Microbial processes, particularly denitrification – the sequential reduction of nitrate (NO) to dinitrogen (N2) via nitrite (NO), nitric oxide (NO), and N2O – account for most anthropogenic N2O emissions (Denman et al., 2007; Reay et al., 2012). However, apportioning N2O sources among microbial and abiotic pathways remains challenging due to the diversity of processes involved (Yu et al., 2020).
Stable isotope analysis of N2O provides an important tool to trace microbial processes and identify N2O sources. Bulk δ15N and δ18O values integrate information on substrate origin and isotope fractionation during N2O formation (Sutka et al., 2006; Toyoda et al., 2005; Denk et al., 2016). In multistep pathways such as denitrification, the apparent isotope effect reflects the combined influence of multiple enzymatic reactions (Ostrom and Ostrom, 2011). The intramolecular site preference (SP), defined as the difference in 15N abundance between the central (α) and terminal (β) positions in N2O (Yoshida and Toyoda, 2000), is widely used to distinguish microbial formation pathways as it is considered to be largely substrate-independent. Bacterial denitrification typically yields SP values near 0 ‰, whereas fungal denitrification, hydroxylamine oxidation, and abiotic nitrite reactions, including chemodenitrification, can produce higher or more variable SP values (Toyoda et al., 2005; Frame and Casciotti, 2010; Ostrom and Ostrom, 2011; Jones et al., 2015; Toyoda et al., 2017; Wei et al., 2019; Yu et al., 2020). Recent work has further highlighted the importance of Fe(II)-mediated nitrite transformations and their potential contribution to abiotic N2O formation under environmentally relevant conditions (Visser et al., 2020). These low SP values are generally attributed to NO reduction by the canonical nitric oxide reductase NorB. However, recent work has shown that alternative NO detoxification pathways, particularly via flavohemoglobins (Fhp), can produce elevated SP values under high-NO conditions (Wang et al., 2024). These reactions do not represent a separate environmental pathway, but rather an alternative enzymatic fate of NO within denitrifying organisms. Together, these findings demonstrate that while SP remains a powerful discriminator of broad N2O formation mechanisms, its expression may be more sensitive to which enzymes are involved and to physiological state than is typically assumed.
In contrast, the oxygen isotopic composition of N2O (δ18O–N2O) reflects both NO reduction by NorB and the preceding transformations of nitrate and nitrite, and depends on the balance between nitrate-derived oxygen, nitrite–water exchange, and branching isotope effects. The extent of oxygen atom exchange between nitrite and water prior to NO reduction is a particular point of variation. Among denitrifiers, two structurally distinct nitrite reductases are found: the cytochrome cd1-type NirS and the copper-containing NirK. Differences in oxygen isotope exchange between nitrogen oxide intermediates and ambient water have often been attributed to Nir identity, largely based on observations from the denitrifier method developed for nitrate and isotope analysis (Casciotti et al., 2002). Under these stationary-phase, washed-cell conditions, Pseudomonas chlororaphis subsp. chlororaphis (NirS) incorporates a large fraction of oxygen from water into N2O (39 %–76 %), whereas the closely related Pseudomonas chlororaphis subsp. aureofaciens (NirK) shows minimal exchange (∼ 6 %). This contrast has often been interpreted as evidence that NirS and NirK differ systematically in their influence on δ18O–N2O expression (Kool et al., 2007; Gruber et al., 2022). However, this inference is based on a narrow experimental framework and has not been systematically tested under active growth conditions. Earlier microbiological studies (e.g., Ye et al., 1991) and more recent work in soils and pure cultures report substantial variability in oxygen atom exchange behavior that cannot be explained by a simple NirK–NirS dichotomy (Lewicka-Szczebak et al., 2016; Rohe et al., 2017; Yu et al., 2020). Whether observed δ18O–N2O variability reflects intrinsic enzyme properties or instead arises from physiological state, substrate availability, and reaction dynamics therefore remains unresolved.
The denitrifier method not only provides well-established information on the behavior of NirS- and NirK-bearing denitrifiers but also serves as a calibration framework for isotopic analyses. Complete conversion of nitrate to N2O allows direct determination of δ15N–NO from δ15N–N2O (Sigman et al., 2001). For oxygen isotopes, however only one of the six oxygen atoms originally present in the combined nitrate pool is retained in N2O, while the others are abstracted and transferred to water during reduction. Under controlled conditions where oxygen atom exchange is low and invariant, the offset between δ18O–NO and δ18O–N2O remains constant, enabling correction of δ18O–N2O measurements (Casciotti et al., 2002). This approach implicitly assumes that oxygen atom exchange remains stable across experimental conditions. If exchange varies with physiological state or reaction dynamics, the δ18O–N2O offset is no longer constant, and δ18O–N2O cannot be interpreted as a fixed tracer of nitrite reductase identity. Understanding the controls on oxygen atom exchange during denitrification is therefore important both for interpreting δ18O–N2O signatures and for evaluating the growth conditions under which the denitrifier method yields reliable results.
In this study, we investigate how nitrite reductase type, substrate availability, and growth phase influence N2O isotopic signatures in two closely related denitrifier strains, P. aureofaciens and P. chlororaphis, both lacking NosZ and therefore accumulating N2O. We combine (i) real-time measurements of δ15N, δ18O, and SP using quantum cascade laser absorption spectroscopy (QCLAS) with (ii) isotope ratio mass spectrometry (IRMS) analysis of the accumulated product in closed batch incubations to compare active growth and resuspension conditions. This experimental design allows us to separate the effects of physiological state during active growth from those associated with washed-cell resuspension conditions during N2O production.
Together, this approach addresses a central question: to what extent do N2O isotopic signatures reflect intrinsic enzyme properties versus differences associated with physiological state and experimental conditions? Resolving this distinction is critical for evaluating the validity and limitations of widely used interpretive frameworks, including the proposed relationship between nitrite reductase identity (NirK/NirS) and the degree of oxygen atom exchange with water and the broader applicability of the denitrifier method, and the interpretation of SP as a stable proxy for NorB-mediated NO reduction.
2.1 General experimental framework
2.1.1 Bacterial strains
Pseudomonas chlororaphis subsp. aureofaciens (formerly P. aureofaciens, ATCC 13985) and Pseudomonas chlororaphis subsp. chlororaphis (formerly P. chlororaphis, ATCC 9446) were obtained from the University of Basel Aquatic and Isotope Biogeochemistry culture collection. Growth protocols were adapted from the denitrifier method (Sigman et al., 2001; Casciotti et al., 2002; Weigand et al., 2016).
2.1.2 Overview of the experiments
Two complementary incubation approaches were used to determine how species identity and physiological state influence N2O isotopic signatures. All experiments were performed in either natural-abundance water (nat) or 18O-enriched water (en), and all media are described in Sect. 2.1.3.
Experiment codes follow the structure X_species_water, where X can be GF for gas flushed incubations or CB denotes closed-batch incubation, CB-R denotes a resuspension assay in which actively grown cultures were harvested by centrifugation and resuspended in a defined nitrate-containing medium, following an approach adapted from the denitrifier method used to analyse the N and O isotopic composition of nitrate (Sigman et al., 2001; Casciotti et al., 2002; Weigand et al., 2016), CB-RS indicates a resuspension assay using nitrate reference standards. Species can be aur or chlor, which denotes P. aureofaciens and P. chlororaphis, respectively, and water can be nat and en indicating natural-abundance or 18O-enriched water.
Table 1Overview of experimental conditions for gas-flushed (GF) and closed-batch (CB) incubations. Experiments were conducted with P. aureofaciens (P. aur) and P. chlororaphis (P. chlor) using natural-abundance (nat) or 18O-enriched (en) water. Gas flushed incubations (GF_aur_nat, GF_aur_en, GF_chlor_nat) were performed during active growth under continuous N2 stripping. Closed-batch incubations include: (i) active-growth experiments in natural-abundace or 18O-enriched water (CB_aur_nat, CB_chlor_nat, CB_aur_en, CB_chlor_en); (ii) stationary-phase resuspension experiments in natural-abundance or 18O-enriched water (CB-R_aur_nat, CB-R_chlor_nat, CB-R_aur_en, CB-R_chlor_en); and (iii) nitrate-standard resuspension assays (CB-RS_aur, CB-RS_chlor) using USGS32, USGS34, IAEA-N3, and 18O-enriched IAEA-N3 (IAEA-N3-spiked).
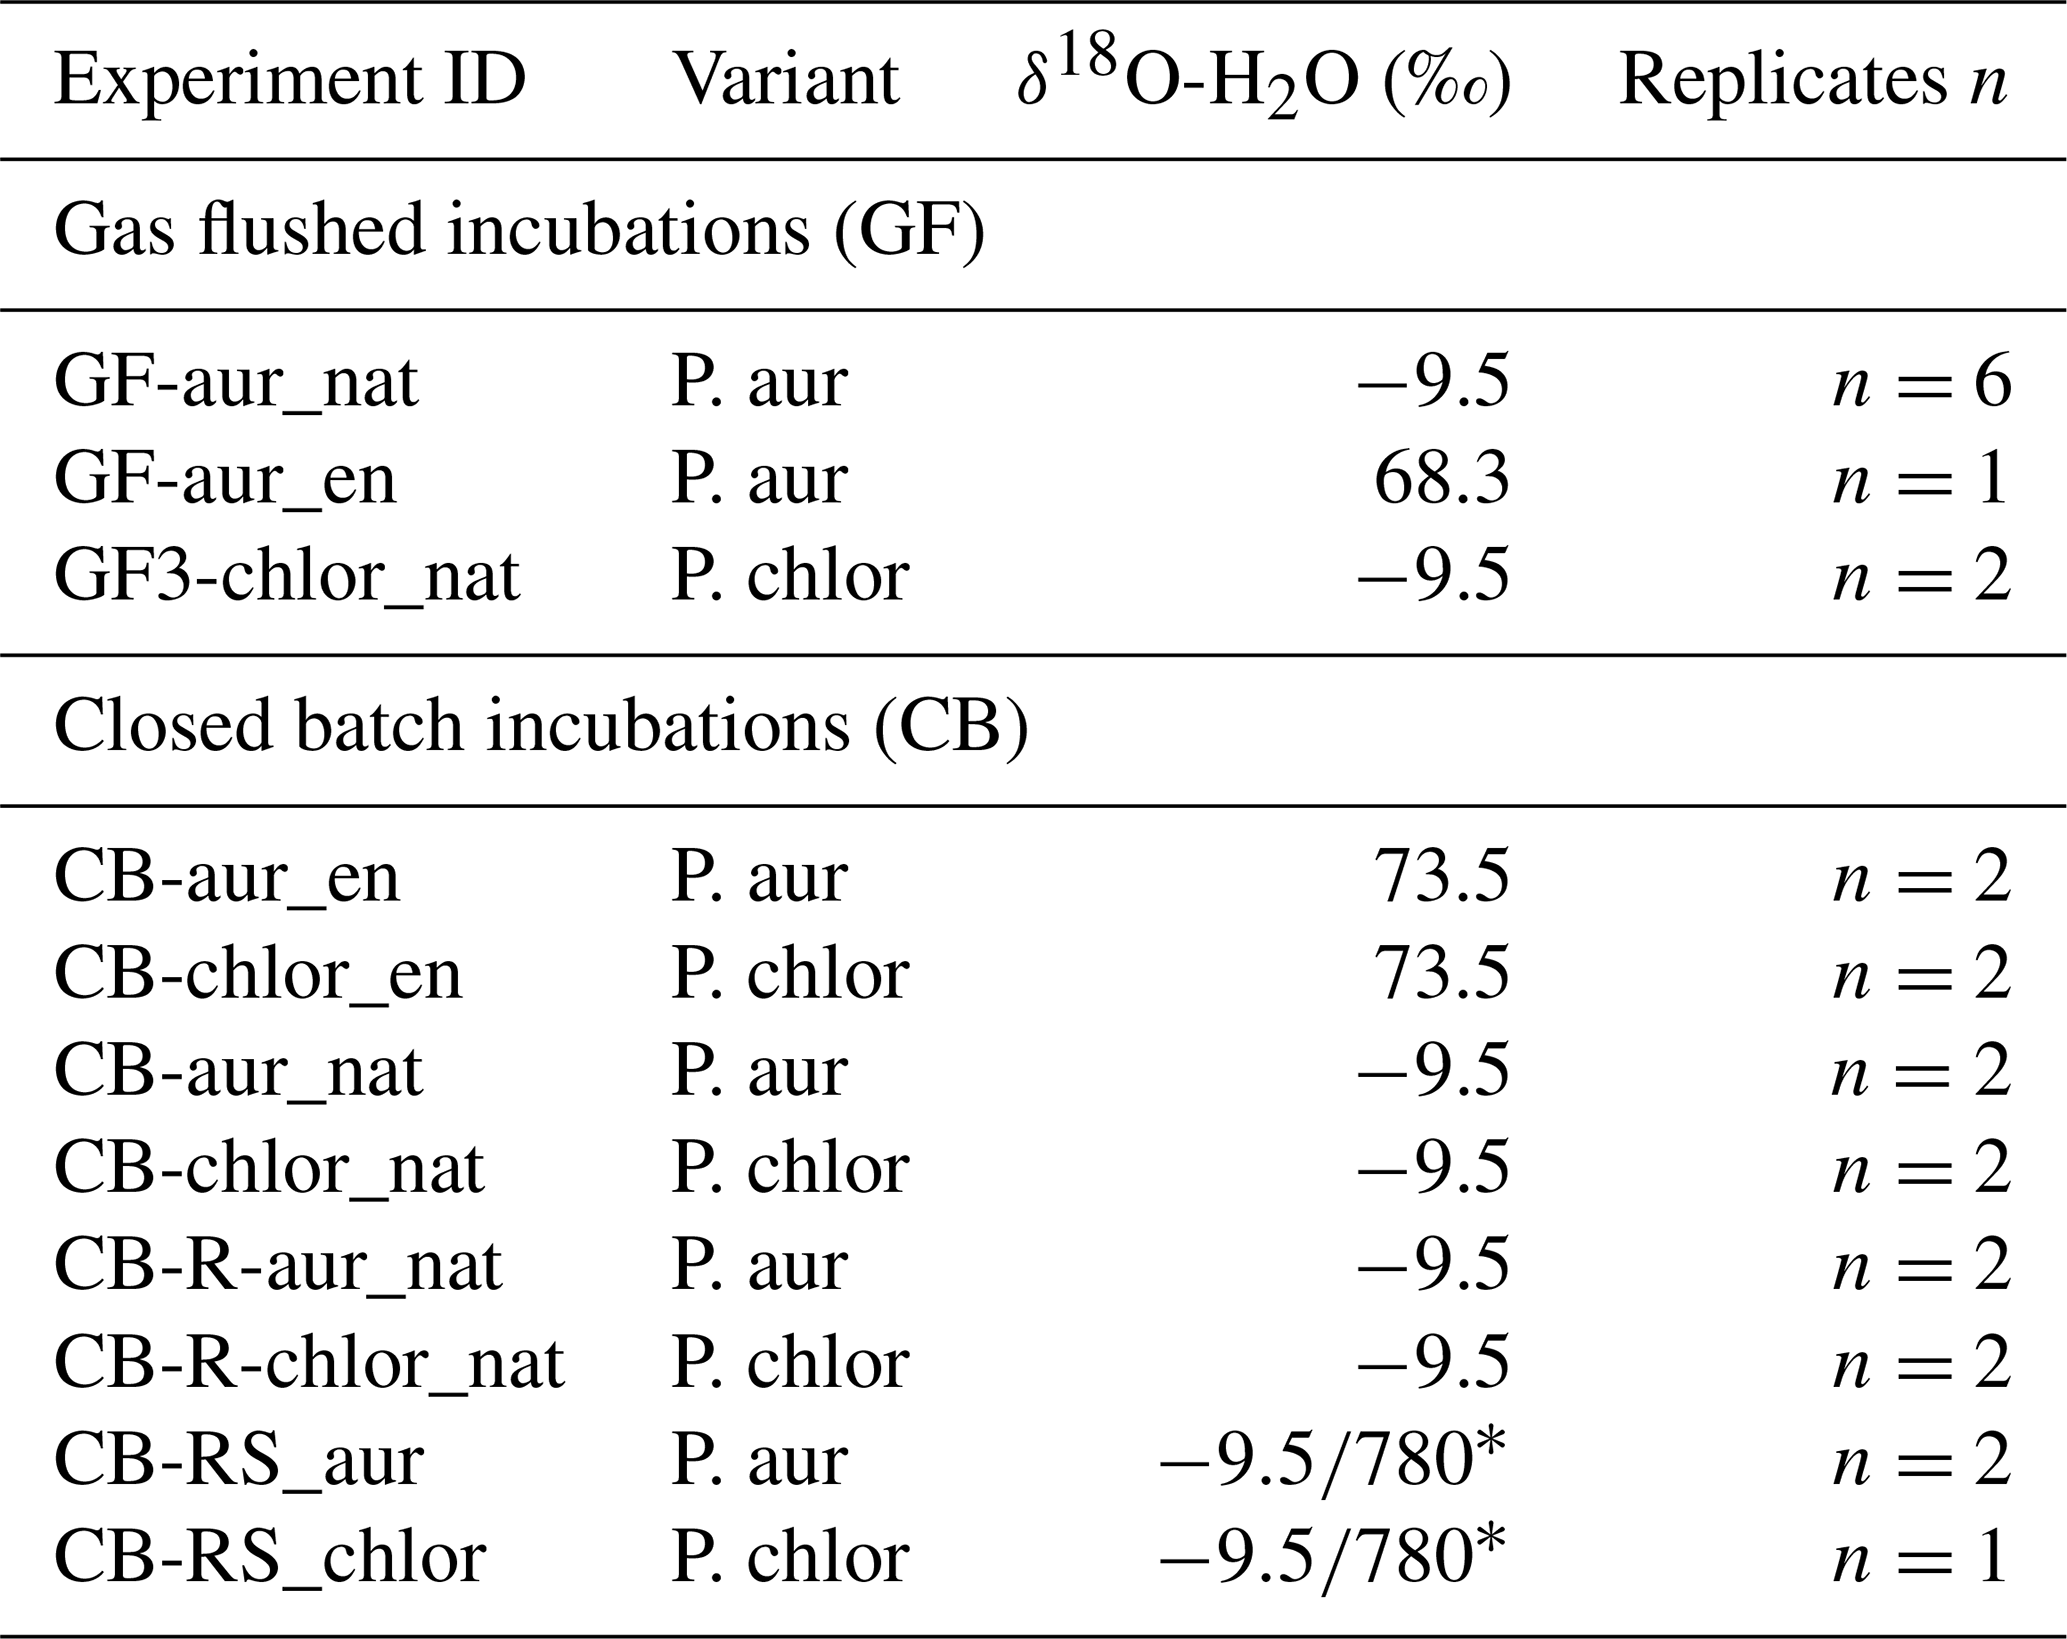
* For 18O-enriched resuspension assays with IAEA-N3-spiked, incubation water was prepared by mixing natural water (δ18O = −9.5 ‰) with 18O-enriched water (δ18O ≈ +780 ‰), yielding a final δ18O–H2O of +187.8 ‰ (see Sect. 2.1.4).
Gas-flushed (GF) incubations (GF_aur_nat, GF_aur_en, GF_chlor_nat) were conducted in a temperature-controlled bioreactor under continuous N2 stripping, allowing real-time quantification of N2O concentration and isotopic composition during active growth (Fig. 1).
Closed-batch (CB) incubations (CB_aur_nat, CB_chlor_nat, CB_aur_en, CB_chlor_en, CB-R_aur_nat, CB-R_chlor_nat, CB-RS_aur, CB-RS_chlor) were conducted in sealed vials and served three purposes. First, active-growth closed-batch incubations (CB_aur_nat, CB_chlor_nat, CB_aur_en, CB_chlor_en) were conducted in active-growth medium to generate cumulative N2O for quantifying water–nitrite oxygen exchange during growth. Second, for stationary-phase resuspension incubations (CB-R_aur_nat, CB-R_chlor_nat), cultures were harvested by centrifugation (4700 rpm, 10 min) and resuspended in a defined nitrate medium prepared in natural-isotope-abundance water. Third, nitrate-standard resuspension assays (CB-RS_aur, CB-RS_chlor) replaced KNO3 with USGS32, USGS34, IAEA-N3, or 18O-enriched IAEA-N3 (see Sect. 2.1.4).
2.1.3 Media composition and resuspension procedure
Two distinct media formulations were used depending on experimental objective: an active-growth medium for gas-flushed and closed-batch incubations, and a defined resuspension medium for stationary-phase assays and nitrate-standard experiments. Active growth was carried out in a denitrifier-method medium formulation (Weigand et al., 2016) containing final concentrations of 10 mM KNO3, 15 mM NH supplied as (NH4)2SO4, 30 g L−1 tryptic soy broth (TSB, Merck Germany), and 5 g L−1 K2HPO4. Cultures grown in this medium reduced nitrate quantitatively and produced N2O for isotopic analysis.
For stationary-phase resuspension incubations, actively grown cultures were harvested by centrifugation and resuspended in a simplified medium (Weigand et al., 2016) containing 7.5 mM NH supplied as NH4Cl, 30 g L−1 TSB, and 5 g L−1 K2HPO4 in the final solution. Cell pellets were resuspended in 3 mL of this medium in 20 mL crimp-sealed vials. Vials were purged with N2 for ∼ 1 h to establish an anoxic headspace and to remove pre-existing gaseous products (including N2O) prior to initiating the incubation. The resuspension protocol was adapted from the denitrifier method; after purging, 20 nmol KNO3 was added, and cultures were incubated overnight to allow quantitative conversion to N2O. Thereafter, N2O was analyzed by GC-IRMS from the vial headspace.
For CB_RS_aur and CB_RS_chlor (closed-batch resuspension assays converting nitrate reference standards with P. aureofaciens and P. chlororaphis, respectively; experiment codes defined in Sect. 2.1.3 and Table 1), the same resuspension procedure was used, except that the nitrate substrate (20 nmol KNO3) was replaced with 20 nmol of an international nitrate isotope reference standard (USGS32, USGS34, IAEA-N3, or 18O-enriched IAEA-N3-spike).
2.1.4 Characterization of 18O-labelled water
Oxygen exchange between reaction intermediates and water in both GF and CB experiments was assessed using replicate incubations in natural-abundance and 18O-enriched water. The natural water used for all baseline incubations had a δ18O–H2O = −9.51 ± 0.22 ‰. Two batches of 18O-enriched water were prepared and used: one with δ18O–H2O = +68.31 ± 0.17 ‰, and a second with δ18O–H2O = +73.53 ± 0.29 ‰ (Table 1). For nitrate-standard experiments (CB-RS-aur and CB-RS-chlor, Table 1), an 18O-enriched IAEA-N3 spike was prepared by mixing 1 mL of 18O-enriched water (δ18O–H2O ≈ +780 ‰) with 3 mL of natural water (δ18O–H2O = −9.5 ‰), yielding a solution with δ18O–H2O ≈ +187.8 ‰.
The δ18O isotopic composition of both natural and 18O-enriched waters was measured using a cavity ring-down spectroscopy (CRDS) analyzer (L2130-i, Picarro Inc., USA). Measurements were calibrated on the VSMOW–SLAP scale using three international reference waters: VSMOW2 (δ18O = 0.00 ± 0.02 ‰), SLAP2 (−55.50 ± 0.02 ‰), and IAEA-607 (+99.02 ± 0.13 ‰), which were measured together with the samples during each analytical run to establish a three-point isotope calibration.
2.1.5 Endpoint N2O isotopic analysis (IRMS)
Accumulated N2O produced during incubations was analyzed using gas chromatography coupled to isotope ratio mass spectrometry (GC-IRMS; Delta V Plus coupled to a GasBench system for N2O purification, Thermo Fisher Scientific, Germany). Isotopic composition was referenced to AIR–N2 (δ15N) and VSMOW (δ18O) using three laboratory N2O reference gases (STD1–STD3; ∼ 90 ppm N2O in N2) measured alongside samples. Assigned delta values (in ‰) were: STD1: δ15Nα = −22.21 ± 0.39, δ15Nβ = −49.28 ± 0.40, SP = 27.08 ± 0.56, δ15Nbulk = −35.74 ± 0.07, δ18O = 26.94 ± 0.23; STD2: δ15Nα = 1.71 ± 0.47, δ15Nβ = 94.44 ± 0.70, SP = −92.73 ± 0.84, δ15Nbulk = 48.09 ± 0.23, δ18O = 36.01 ± 0.27; STD3: δ15Nα = 17.11 ± 0.12, δ15Nβ = −3.43 ± 0.17, SP = 20.54 ± 0.21, δ15Nbulk = 6.85 ± 0.06, δ18O = 35.39 ± 0.17. Data processing, including scale normalization and correction for ion-source scrambling effects, was performed using the PyIsotopomer package (Kelly et al., 2023).
2.2 Gas-flushed (GF) incubations and online isotope monitoring
2.2.1 Experimental setup for gas-flushed incubations
For continuous N2O isotope monitoring under cultivation conditions, strains were grown in the active-growth medium described in Sect. 2.1.2 (Fig. 1). Incubations were performed at 30 ± 1 °C for P. aureofaciens and 20 ± 1 °C for P. chlororaphis, reflecting optimal conditions for growth and N2O production. Cultures were stirred using a magnetic stirrer to ensure homogeneous mixing, and maintained anaerobic by continuous N2 flushing (100 mL min−1). Dissolved oxygen, pH (Mettler-Toledo, Switzerland), and optical density (OD550) were monitored throughout the experiments. Substrate consumption was monitored by daily nitrite measurements. Incubations were typically completed within 5–8 d. Isotopic measurements were stopped when N2O concentrations dropped below 50 ppm, whereas concentration measurements by FTIR continued until N2O levels dropped below detection limits (0.0075 ppm N2O), confirming complete turnover of nitrogen substrates (Fig. 2). Gas exiting the bioreactor was conditioned prior to analysis; carbon dioxide and water vapor were removed using two consecutive washing bottles containing 1 M NaOH, followed by permeation drying (Perma Pure, USA) (Fig. 1). The CO2-free, dehumidified sample gas was subsequently filtered through a sintered metal filter (2 µm pore size) and analyzed for trace gas concentrations (N2O, NO) using an online FTIR analyzer (CX-4000 or CX-4015, Gasmet Technologies, Finland) (Wunderlin et al., 2012). Three-minute average N2O concentration values were used to calculate dilution ratios and regulate the MFC settings to maintain an approximately constant N2O concentration (∼ 50 ppm) in the diluted sample gas, which minimized concentration effects on isotope ratio measurements by QCLAS (Wunderlin et al., 2013). Choosing 50 ppm as target concentration for N2O isotope analysis was a compromise between data coverage and response time of the experimental setup but does not represent a lower threshold of the analytics.
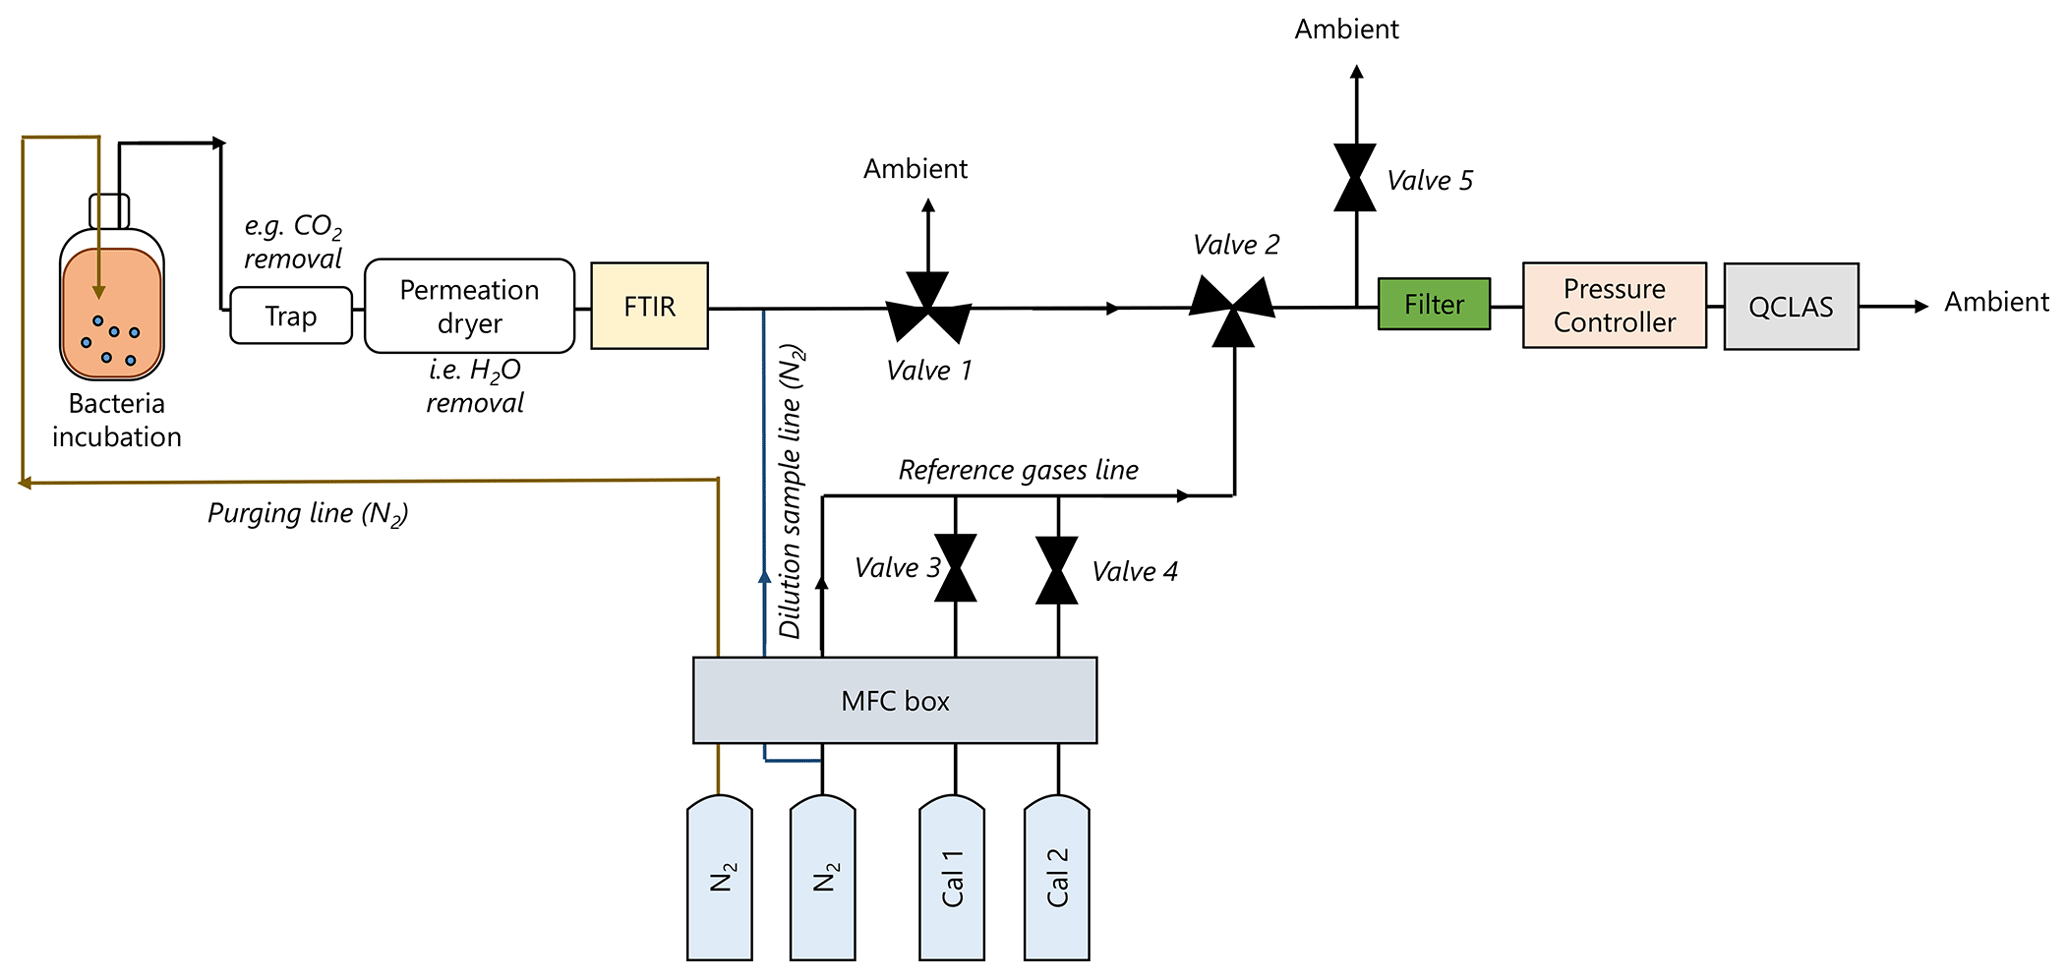
Figure 1Schematic of the setup applied for bacterial incubations, continuous gas sampling, and real-time analysis of trace gases and N2O isotopologues. N2 is used to purge reaction products from the liquid phase via the headspace of the incubation vessel toward the analyzers. Trace gas concentrations (N2O, NO, residual CO2 and H2O) are determined in the CO2-free and dehumidified sample gas by FTIR spectroscopy. The N2O concentration is used to set the MFC for N2 dilution and stabilize the N2O concentration for QCLAS analysis to 50 ppm. Downstream of the FTIR, the gas is directed to the QCLAS for isotopic analysis of N2O. Calibration of the QCLAS is conducted via automated switching between sample gas and reference standards (valves 1–5). Calibration gas (Cal 1, Cal 2) flows are regulated with mass flow controllers (MFC). During calibration phases, the sample gas is vented to the atmosphere (valve 1); during measurement phases valves 1, 2 and 5 are switched in parallel, directing the sample gas toward the QCLAS. A pressure controller upstream of the QCLAS stabilizes the multipath cell pressure and ensures stable flow conditions.
Automated sample gas dilution and calibration of the QCLAS system were controlled via a LabVIEW interface (National Instruments Corp., USA) connected to mass flow controllers (Vögtlin Instruments Inc., Switzerland) and electromagnetic valves (Series 9, Parker Hannifin, USA).
2.2.2 Online analysis of N2O isotopic composition (QCLAS)
Temporally-resolved (1 Hz) N2O isotopic analysis in the diluted sample gas was performed using a compact quantum cascade laser absorption spectrometer (mini-TILDAS, pathlength 76 m, Aerodyne Research Inc., USA), operated in flow-through mode at a sample pressure of 26.6 hPa (20 Torr) (Ibraim et al., 2018). The instrument simultaneously quantified the concentrations of the four most abundant N2O isotopologues in the ν3 absorption band (2203 cm−1): 14N14N16O, 14N15N16O (15Nα), 15N14N16O (15Nβ), and 14N14N18O. Raw concentrations were logged in ASCII format. Time series for each isotopologue were averaged to 60 s intervals as the first step in the data-processing workflow, prior to any correction or calibration. Isotopologue ratios (14N15N16ON14N16O, 15N14N16ON14N16O, and 14N14N18ON14N16O) were then calculated from these averaged concentrations using a customized R script. Allan deviations at a 60 s averaging time were used to propagate uncertainties in isotope delta values (see Appendix A).
Two N2O isotope reference gases diluted in N2 were used (Mohn et al., 2022); CG1 (RM1A, anchor gas, in ‰): δ15Nα = −0.22 ± 0.46, δ15Nβ = 0.84 ± 0.46, δ18O = 39.22 ± 0.15; and CG2 (RM3A, span gas, in ‰): δ15Nα = 50.96 ± 0.47, δ15Nβ = 53.06 ± 0.47, δ18O = 103.04 ± 0.16. CG1 was measured every 40 min for 10 min, to correct for instrumental drift, while the calibration span was determined twice daily analyzing CG1 and CG2. From the measured delta values, the following parameters were calculated: δ15N-bulk = (δ15Nα + δ15Nβ) and SP = δ15Nα−δ15Nβ, following the nomenclature of Yoshida and Toyoda (2000). Data processing steps are detailed in Appendix A.
For validation an independent N2O isotope reference gas (RM3B) with assigned values of δ15N-bulk = 16.08 ± 0.0 5 ‰, δ18O = 55.17 ± 0.15 ‰, and SP = −0.68 ± 0.91 ‰, was diluted using a two-step diluter (METAS, Switzerland) to a target concentration of 50 ppm N2O. Measurements were conducted during a short validation campaign in April–May 2024. RM3B was analyzed within the existing CG1/CG2 calibration framework, and the measured values agreed with assigned values within <0.5 ‰ across all isotope parameters.
2.2.3 Isotopic Fractionation Analysis (Rayleigh Model – QCLAS Time Series)
Isotope fractionation during denitrification was assessed using a Rayleigh-type cumulative product model, following the definitions of enrichment factors (ε) provided by Mariotti et al. (1981) and Sutka et al. (2006), which describe the isotopic discrimination between the substrate and the accumulated product over the course of the reaction.
Changes in the isotopic composition of N2O were modeled as a function of nitrate reduction using the equation:
where y is the isotopic composition (δ value) of the N2O product, a and b are fitted coefficients, and [x] represents the reaction progress. The variable [x] was calculated using the Rayleigh equation (Sutka et al., 2006):
Here, f is the fraction of remaining nitrate, calculated as:
where n denotes the molar quantities of accumulated N2O and initial NO, respectively. The slope b corresponds to the apparent enrichment factor ε (in ‰), while the intercept a represents the initial isotopic composition of the product pool. This interpretation assumes Rayleigh-type fractionation behavior, i.e. a closed substrate pool with unidirectional consumption and negligible back-reaction. Microbial incubations featuring multistep processes may deviate from these conditions, particularly when O isotope exchange with water or partial recycling of intermediates occurs. Nevertheless, the Rayleigh model provides a useful first-order approximation for comparing fractionation patterns across experiments.
More complex Rayleigh formulations have been proposed to explicitly account for intramolecular isotope effects during N2O formation, including site-specific treatments of δ15Nα and δ15Nβ (e.g., Rivett et al., 2025). In the present study, Rayleigh modeling was applied only to δ15N-bulk, for which the standard cumulative product formulation is sufficient.
Fractionation calculations were performed using a custom R pipeline that included uncertainty propagation for N2O gas concentration, sample gas flow, and the initial substrate amount (NO). Full computational details are provided in the Appendix A.
2.2.4 Monitoring of nitrate and nitrite during GF incubations and nitrate isotope characterization
During gas-flushed incubations, NO and NO concentrations were monitored daily to track substrate depletion and the progression of nitrate reduction. Nitrite was measured spectrophotometrically immediately after sampling using the Griess assay (Hansen and Koroleff, 1999). For nitrate concentration analysis, 1 mL samples were collected daily, filtered through 0.22 µm syringe filters, and stored in Eppendorf tubes at −18 °C prior to analysis. Nitrate concentrations were determined by quantitative reduction to nitric oxide (NO) using acidic vanadium(III), followed by chemiluminescence detection (Braman and Hendrix, 1989).
The isotopic composition of the nitrate substrates used to prepare incubation media was determined prior to the experiments. In addition, selected samples from GF incubations were analyzed to assess changes in the isotopic composition of the residual nitrate pool during denitrification. Nitrate isotope analyses were not performed for closed-batch incubations.
For nitrate isotopic analysis, aliquots containing 20 nmol N were converted to N2O using the denitrifier method (Sigman et al., 2001; Casciotti et al., 2002). The nitrate stock solution used for all active-growth media had a δ15N–NO = +5.7 ± 0.3 ‰ and a δ18O–NO = +12.4 ± 0.3 ‰ (n=3).
Calibration was performed against international nitrate reference materials USGS32 (KNO3, δ15N = +180 ‰, δ18O = +25.4 ± 0.2 ‰), USGS34 (KNO3, δ15N = −1.8 ± 0.1 ‰, δ18O = −27.78 ± 0.37 ‰), and IAEA-N3 (KNO3, δ15N = +4.7 ± 0.2 ‰, δ18O = +25.6 ± 0.4 ‰). Additional reference materials included UBN-1 (δ15N = +14.15 ‰, δ18O = +25.7 ‰), Deep Pacific nitrate (δ15N ≈ +5.0 ‰, δ18O ≈ +2.0 ‰), and an IAEA-N3-spike standard (IAEA-N3 dissolved in water with δ18O–H2O = +780 ‰, see Sect. 2.1.4).
2.3 Closed batch (CB) incubations
2.3.1 Active-growth incubations (natural-water and enriched-water)
Closed-batch incubations were used to generate cumulative N2O under controlled growth conditions. All experiments were conducted in 500 mL Wheaton bottles containing 400 mL of active-growth medium (Sect. 2.1.2) and incubated at 23 °C for 7 d. Experiments performed in natural-abundance water (CB_aur_nat, CB_chlor_nat) and 18O-enriched-water (CB_aur_en, CB_chlor_en) differed only in the isotopic composition of the water used to prepare the medium. The enriched-water incubations produced δ18O–N2O endpoint values that were regressed against δ18O–H2O to quantify oxygen atom exchange between nitrite and water. After complete nitrate reduction, accumulated N2O was analyzed by GC-IRMS (Sect. 2.1.5).
2.3.2 Resuspension incubations in defined nitrate medium (stationary phase)
To obtain stationary-phase δ18O–N2O endpoint values, actively grown cultures were pelleted and resuspended in the defined nitrate medium described in Sect. 2.1.2. These resuspension assays (CB-R_aur_nat, CB-R_chlor_nat) were performed with stationary-phase cultures resuspended in fresh nitrate medium. The experiments were conducted only in natural-abundance water. After overnight nitrate reduction, the accumulated N2O was analyzed by GC-IRMS (Sect. 2.1.5).
2.3.3 Resuspension incubations with nitrate isotope standards (quantification of oxygen isotope exchange)
Additional stationary-phase incubations were performed to quantify oxygen-atom exchange between nitrite and water using nitrate standards with contrasting δ18O–NO values (CB-RS_aur, CB-RS_chlor): USGS32, USGS34, IAEA-N3. These were accompanied by an 18O-enriched IAEA-N3-spike to match the typical approach for quantifying oxygen-atom exchange in the denitrifier method (Sect. 2.1.2). Following quantitative reduction of the added nitrate, δ18O–N2O was measured by GC-IRMS (Sect. 2.1.5). The resulting δ18O–N2O values were regressed against the known δ18O–NO values of the standards. The δ18O–N2O versus δ18O–NO relationship was applied to derive stationary-phase oxygen-exchange fractions.
This nitrate-standard approach provides an independent estimate of oxygen exchange complementary to the enriched-water experiments (Sect. 2.3.1). Whereas regressions of δ18O–N2O versus δ18O H2O quantify exchange from the sensitivity of N2O to water isotopic composition, regressions of δ18O–N2O versus δ18O–NO quantify the O-atom exchange from the degree of scale compression relative to nitrate isotope standards. Under conditions of no oxygen exchange, δ18O–N2O scales directly with δ18O–NO (slope ≈ 1), whereas increasing exchange reduces this dependence (slope < 1). The fraction of oxygen atoms in N2O derived from water can therefore be estimated from the regression slope (Casciotti et al., 2002; Snider et al., 2009; Lewicka-Szczebak et al., 2016).
3.1 Denitrifying growth and near-quantitative N2O production in gas-flushed and closed-batch incubations
Both P. chlororaphis (NirS-bearing) and P. aureofaciens (NirK-bearing) showed consistent denitrifying behavior under anoxic conditions, with N2O production closely coupled to nitrate reduction. Biomass accumulation and substrate consumption followed the expected progression of anoxic denitrifying growth, indicating that the incubation conditions supported stable and active metabolism throughout.
Biomass increased during the phase of active N2O production and stabilized as nitrate became limiting, while NO concentrations decreased in parallel with N2O formation (Fig. 2C, D). This tight coupling indicates efficient conversion of nitrate to N2O, with only transient accumulation of nitrite (Fig. 2E). This tight coupling indicates efficient conversion of nitrate to N2O with no substantial accumulation of intermediates. Accordingly, cumulative N2O yields indicated efficient denitrification (Fig. 2A), although they varied between incubations, indicating that N2O was not always the sole nitrogen oxide produced (Appendix B, Fig. B1).
Across gas-flushed incubations, N2O yields ranged from 60 %–100 % for P. aureofaciens (n=6) and 50 %–100 % for P. chlororaphis (n=2). These results demonstrate that both incubation approaches supported efficient denitrification and provided well-constrained systems for isotopic interpretation. Dissolved O2 concentrations remained below detection (<1 µM), and pH varied only slightly (6.5–7.5), confirming stable anoxic conditions throughout the experiments. Nitrite accumulated transiently during active nitrate reduction but did not persist, indicating rapid turnover within the denitrification pathway.
While such growth dynamics are well established for denitrifying systems (Zumft, 1997), the present gas-flushed setup enables direct observation of N2O production dynamics under continuous stripping, providing a temporally resolved view that is not accessible in conventional closed systems.
In closed-batch incubations, near-complete nitrate reduction was similarly observed, as indicated by the absence of residual NO and NO and the cessation of N2O production. These results demonstrate that both incubation approaches achieved near-quantitative conversion of nitrate to N2O under the conditions applied, providing well-constrained systems for isotopic interpretation. N2O isotopic compositions were determined from endpoint measurements and are discussed in Sect. 3.3 and 3.4.
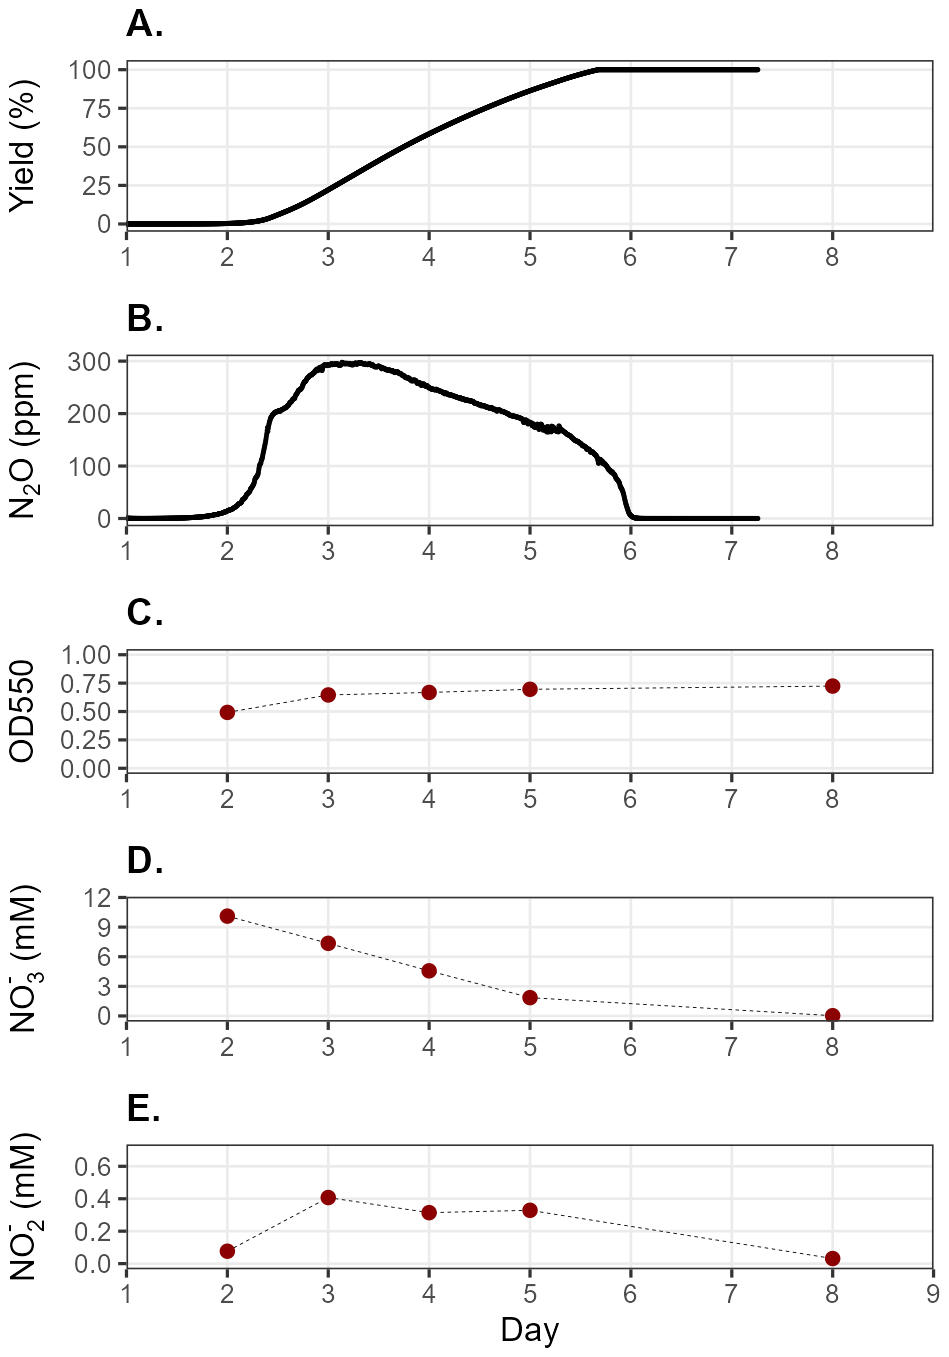
Figure 2Representative temporal dynamics of N2O production over days, cumulative N2O yield, and culture characteristics during incubation of P. aureofaciens (GF_aur). (A) Cumulative N2O yield (% of initial nitrate converted to N2O); (B) Instantaneous N2O formation, measured in N2 purge gas; (C) Optical density at 550 nm (OD550, circles), as a proxy for biomass accumulation; (D) Residual nitrate concentration; (E) Nitrite concentration over the course of the experiment.
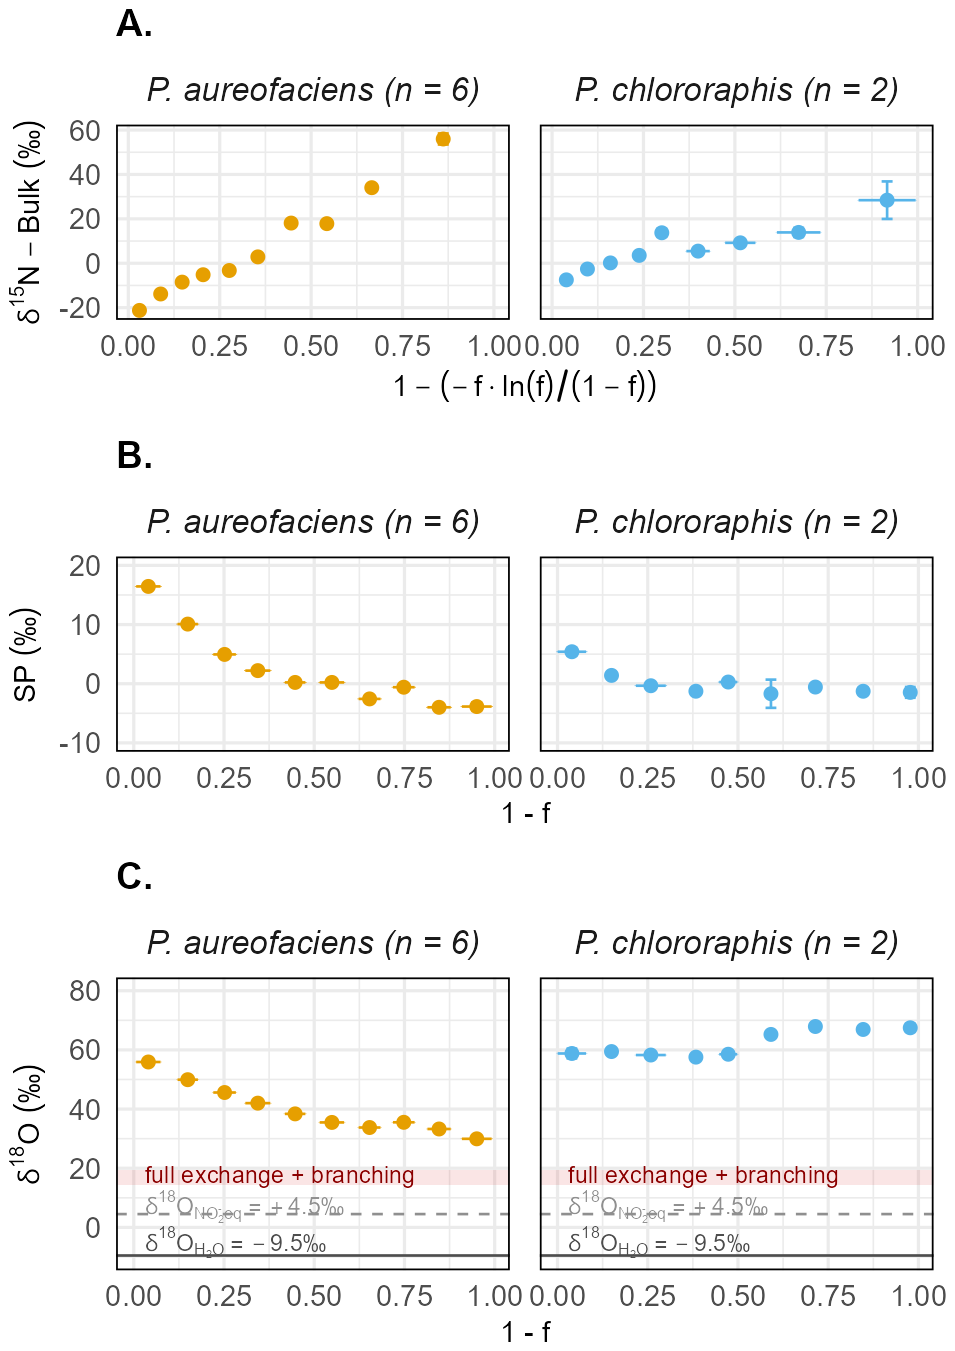
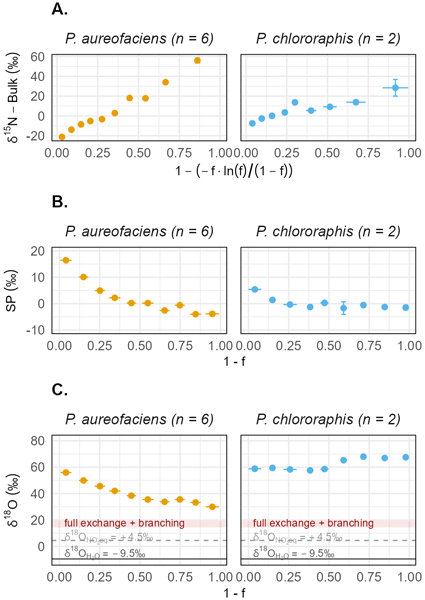
Figure 3Temporal evolution of N2O isotopic composition during gas-flushed incubations in natural-abundance water (GF_aur_nat, GF_chlor_nat). Panels show isotopic composition as a function of reaction progress for P. aureofaciens (n=6) (Nirk) and P. chlororaphis (n=2) (NirS). Reaction progress (f) was calculated from cumulative N2O production and rescaled for each incubation such that the first sampled point corresponds to f=0 and the final point to f=1, allowing comparison across experiments with different final yields. Measurements were grouped into equally spaced bins of reaction progress, and isotopic values were averaged within each bin. Points therefore represent bin-averaged values, with vertical error bars indicating within-bin variability and horizontal error bars indicating the spread in reaction progress of contributing measurements. (A) δ15N–Bulk versus the Rayleigh coordinate , which linearizes Rayleigh-type isotope fractionation during substrate consumption. (B) Site preference (SP) versus reaction progress (1−f). (C) δ18O–N2O versus reaction progress (1−f). Panels (B) and (C) use the simpler (1−f) coordinate to directly visualize temporal trends, whereas panel (A) uses the Rayleigh transformation to resolve fractionation behavior. In panel (C), horizontal lines indicate (−9.5 ‰; solid grey) and (+4.5 ‰; dashed grey). The shaded red band (+14.5 to +19.5 ‰) represents the expected δ18O–N2O range under full nitrite–water equilibration with branching fractionation.
3.2 Rayleigh-type 15N enrichment in the N2O pool during nitrate reduction
The δ15N-bulk of accumulated N2O increased linearly over the course of nitrate reduction in all incubations when expressed against the reaction coordinate using the Rayleigh equation as presented in Mariotti et al. (1981) and Sutka et al. (2006) (Fig. 3A). The isotopic composition of the accumulated reaction product N2O was calculated from the amount and isotopic composition of instantaneously formed and analysed N2O. This pattern is consistent with Rayleigh-type enrichment expected during unidirectional substrate consumption under closed-system conditions. Enrichment factors (ε15N) were estimated for each incubation by linear regression of δ15N-bulk against the reaction coordinate using the specific reaction progress of each experiment (individual experiment regressions are shown in Appendix B Fig. B1). The rescaling and binning shown in Fig. 3A serve only to visualize common trajectories across incubations.
Enrichment factors (ε15N) derived from this linear Rayleigh approximation ranged from +16 to +55 ‰ (35.5 ± 12 ‰) for P. aureofaciens (n=6) and from +13 ‰ to +45 ‰ (25.4 ± 14 ‰) for P. chlororaphis (n=2). Variability across replicate incubations likely reflects differences in nitrate turnover rates and additional biological variability, although no systematic relationship between nitrate reduction rate and ε15N could be resolved with the present dataset.
The applicability of the linear Rayleigh model is supported by the consistent increase in δ15N-bulk over the reaction coordinate, which reflects the expected kinetic isotope enrichment pattern during progressive substrate consumption (Mariotti et al., 1981). Nevertheless, the linear Rayleigh approximation represents an idealized description when applied to multistep microbial pathways such as denitrification. In such systems, intrinsic isotope effects may be modulated by intermediate pool dynamics, diffusion limitation, or partial reversibility, potentially leading to deviations from a single kinetic fractionation factor. These complexities have been discussed in detail by Haslun et al. (2018) and are not explicitly resolved here. Rather, the Rayleigh analysis is used as a first-order framework to derive apparent ε15N values from the cumulative N2O product pool, allowing comparison across strains.
To place the ε15N estimates obtained in this study in context, we compared them with a compilation of fractionation factors for N2O production from a range of denitrifying organisms and environmental systems (Fig. 4). This dataset, largely derived from Denk et al. (2016), includes enrichment factors determined under diverse experimental conditions and using different formulations of the Rayleigh model applied to either the instantaneous or accumulated product, or to the substrate. Nonetheless these enrichment factors provide a context for comparing the magnitude of isotope fractionation observed in the present study. The ε15N values obtained here fall within the broader range reported in the literature and align particularly well with previous results for Pseudomonas spp. under nitrate-reducing conditions. Additionally, we include instantaneous isotope effects derived from non-linear Rayleigh formulations, reported as η15N values by Haslun et al. (2018). Although expressed using a different notation, these values are conceptually analogous to ε15N and allow comparison with the fractionation factors derived here. Taken together, these comparisons show that the magnitude of fractionation observed here falls well within the established range for denitrifying systems, indicating that the gas-flushed setup does not introduce atypical isotope effects.
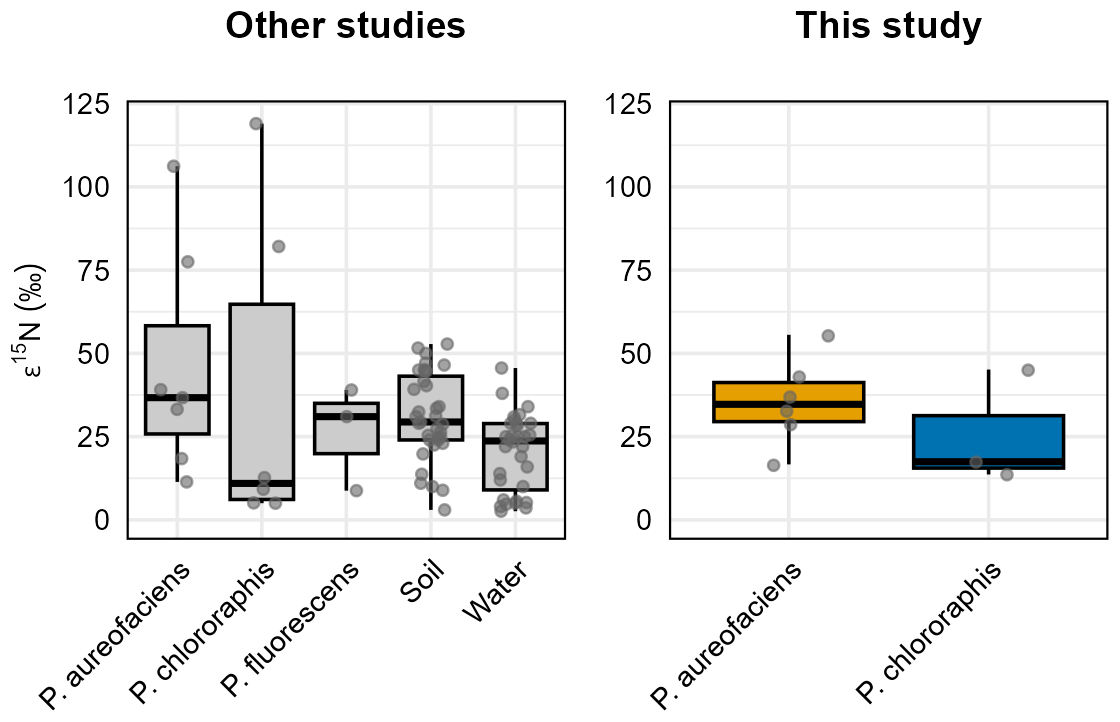
Figure 4Isotopic enrichment factors (ε15N) for N2O production across denitrifying microbial communities reported in the literature and observed in this study. Most literature values are compiled from Table S1 of Denk et al. (2016), which integrates enrichment factors derived from different experimental systems and using different mathematical formulations (e.g., soils, aqueous environments, and pure-culture incubations). Instantaneous isotope effects reported as η15N by Haslun et al. (2018) for P. aureofaciens, and P. chlororaphis, as well as ε15N for P. fluorescens (Toyoda et al., 2005) are also included for comparison. For clarity and comparability, all values shown here are expressed using a common sign convention, where positive ε15N indicates normal isotope effects, i.e., preferential reaction of the light isotope.
3.3 Transient elevated SP suggests variable NO reduction pathways
SP values measured at the endpoint of closed-batch incubations clustered near 0 ‰ for both P. aureofaciens and P. chlororaphis (Fig. 5B), within the canonical range reported for bacterial denitrification (−8 ‰ to +10 ‰; Yu et al., 2020). This outcome is consistent with the common assumption that SP during bacterial denitrification is invariant and reflects NO reduction by the nitric oxide reductase NorB, which yields values near 0 ‰. This interpretation is supported by measurements from intact denitrifying cultures and by direct assays of purified NorB enzyme (Sutka et al., 2006; Yamazaki et al., 2014; Wang et al., 2024; Rivett et al., 2025; Fig. 5A). Because these measurements integrate N2O produced over the full course of the reaction, they represent time-averaged isotopic signatures. When assessed using these conventional accumulated-product approaches, N2O formation appears broadly consistent with NorB-mediated denitrification, although such temporal integration may obscure short-lived deviations from canonical SP behavior.
In contrast to such endpoint observations, our time-resolved dataset shows that elevated SP values (+8 ‰ to +20 ‰) arise transiently but reproducibly during the early stages of N2O formation under gas-flushed conditions (Figs. 3B; 5B). Elevated SP values have occasionally been reported in denitrifying cultures. Toyoda et al. (2005), for example, observed SP values up to +22 ‰ in P. fluorescens, which they attributed to an abiotic pathway of unknown mechanism. Over the course of nitrate reduction, SP subsequently converged toward ∼ 0 ‰ as the reaction progressed (Fig. 3B). When averaged over the full reaction progress, gas-flushed incubations yielded SP values near 0 ‰, with a slightly elevated median and broader variability compared to closed-batch endpoint values (Fig. 5B), yet still within the canonical range reported for bacterial denitrification. This convergence toward canonical SP values, despite pronounced early-stage elevations (Fig. 3B), indicates that accumulated N2O in closed-batch systems integrates over temporally variable production pathways and thereby masks transient deviations in SP. These transient SP elevations are most clearly expressed in P. aureofaciens (n=6). In P. chlororaphis (n=2) they are less apparent in the binned averages due to limited replication and experiment-to-experiment variability, but they are evident in individual incubation trajectories (Appendix B Fig. B1).
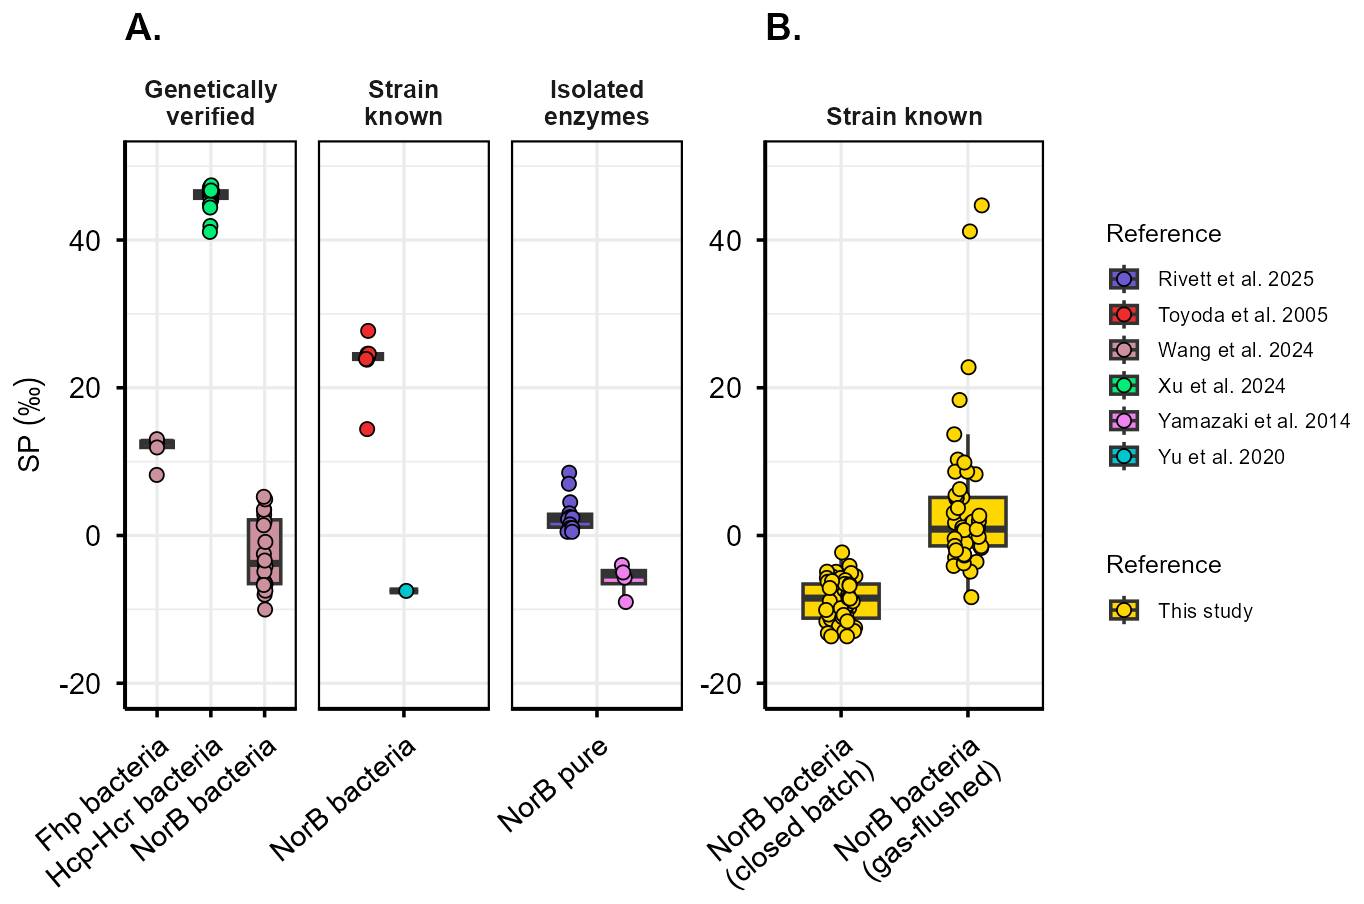
Figure 5Site preference (SP) of N2O produced by three classes of N2O-forming systems. (A) Literature-derived SP values grouped by system type: left, intact denitrifiers with genetically verified N2O-forming enzymes, where both strain identity and the active enzyme system (NorB, Hcp–Hcr, or Fhp) were confirmed (Xu et al., 2024; Wang et al., 2024); center, intact denitrifiers, strains are known but additional N2O-forming pathways cannot be excluded (Toyoda et al., 2005; Yu et al., 2020); and right, isolated enzyme assays, in which purified NorB was studied directly, yielding enzyme-specific SP values (Yamazaki et al., 2014; Rivett et al., 2025). (B) SP values obtained in this study for intact denitrifiers with known strain background, shown separately for closed-batch and gas-flushed incubation modes. Boxplots show the distribution of SP values within each category; horizontal bars indicate mean ± standard deviation. Gas-flushed incubations represent time-resolved SP measurements, whereas closed-batch incubations reflect SP integrated over the accumulated N2O pool.
Although still within the broader isotopic space reported for bacterial denitrification and related enzyme systems (Fig. 5; Toyoda et al., 2005; Yamazaki et al., 2014; Haslun et al., 2018; Wang et al., 2024; Xu et al., 2024), the consistent early-stage SP elevations suggest that NorB may not be the sole contributor to N2O formation during the onset of denitrification. One plausible explanation is that rapid NO accumulation during early Nar/Nir activity initially exceeds the capacity of NorB, such that NO is partially reduced by alternative enzymes until NorB becomes transcriptionally or functionally dominant. Recent work by Wang et al. (2024) directly demonstrated that SP depends on NO reductase identity: NorB activity produced SP values near 0 ‰, whereas flavohemoglobin (Fhp) activity under high-NO conditions yielded elevated SP values of approximately +10 ‰ (Fig. 5A). Using Δfhp mutants and inducible norB expression systems, the authors further showed that the balance between these enzymes shifts with growth phase and NO availability. Although the experimental conditions in that study differ from ours, it is plausible that early nitrate respiration in actively growing cultures similarly produces transient NO accumulation combined with low NorB expression, allowing temporary Fhp activity to elevate SP at the onset of denitrification. Future transcriptomic or proteomic analyses would help confirm which NO reductases are expressed during this early phase.
Importantly, several of the transient SP values observed here (Fig. 5B) exceed not only the typical NorB range but also the Fhp-associated values reported by Wang et al. (2024), motivating consideration of additional NO-reducing pathways. Beyond Fhp, other NO detoxification systems may contribute to transient SP variability. Xu et al. (2024) reported N2O production during dissimilatory nitrate reduction to ammonium (DNRA) and attributed it to the hybrid cluster protein–hybrid cluster reductase (Hcp–Hcr) system based on genomic and transcriptomic evidence (Fig. 5A). While this attribution remains less firmly established than for NorB or Fhp, it defines a distinct high-SP isotopic signature that broadens the reference space for interpreting transient SP behavior. Flavodiiron proteins, which reduce NO to N2O via asymmetric diiron intermediates (Caranto et al., 2014a, b), are also encoded in many Pseudomonas genomes, although their SP signatures remain uncharacterized.
Future work integrating SP-resolved N2O measurements with transcriptomics, proteomics, or targeted inhibitor assays will be essential to determine which NO reductases are active, when they operate, and how their expression depends on metabolic state and environmental conditions. Taken together, these observations indicate that SP expression during denitrification can be more dynamic than implied by static reference ranges derived from endpoint measurements.
3.4 δ18O systematics during denitrification across strains and incubation conditions
While site preference primarily reflects the identity of NO reductases operating during N2O formation, the oxygen isotopic composition of N2O integrates upstream processes, particularly the extent of oxygen atom exchange between nitrite and water prior to NO reduction. Because nitrite is the immediate precursor to NO, its isotopic composition reflects both oxygen inherited from nitrate reduction and any subsequent equilibration with ambient water. As a result, δ18O–N2O does not represent a fixed enzymatic property, but rather a composite signal that depends on the relative contributions of nitrate-derived oxygen, nitrite–water exchange, and branching isotope effects. Consequently, its interpretation as a tracer of nitrite reductase identity requires that these processes remain constant – an assumption that has not been tested. Accordingly, δ18O–N2O patterns are interpreted relative to reference scenarios spanning nitrate-dominated signatures, full nitrite–water equilibration, and intermediate exchange. In the following sections, we examine how δ18O–N2O varies across strains and incubation conditions as an observational framework, before explicitly quantifying oxygen exchange in Sect. 3.4.2.
3.4.1 Strain-dependent δ18O–N2O patterns during active growth
A wide range of δ18O–N2O endpoint values was observed in natural-abundance water incubations under the two active-growth modes (gas-flushed and closed-batch), as summarized in Fig. 6A. In closed-batch incubations, P. aureofaciens produced relatively low δ18O–N2O values (∼ 9 ‰), whereas P. chlororaphis yielded substantially higher values (∼ 47 ‰). Under gas-flushed conditions, δ18O–N2O endpoint values shifted in a strain-specific manner: values for P. aureofaciens increased to an intermediate range (26 ‰–42 ‰), while P. chlororaphis produced consistently elevated values (57 ‰–67 ‰). These contrasts indicate a strong incubation-mode sensitivity in P. aureofaciens, whereas P. chlororaphis maintained consistently elevated δ18O–N2O values with a less pronounced response to incubation configuration. Time-resolved δ18O–N2O trajectories during gas-flushed incubations further highlights this strain-dependent behavior (Fig. 3C). In P. aureofaciens, δ18O–N2O starts at high values (∼ 50 ‰–60 ‰) early in nitrate reduction and declines progressively toward ∼ 30 ‰ as the reaction proceeds. In contrast, P. chlororaphis maintains elevated δ18O–N2O values throughout the reaction, varying within a narrow band around 60 ‰. Thus, under identical conditions, P. aureofaciens shows strong variability in δ18O–N2O, whereas P. chlororaphis maintains consistently high values with comparatively little temporal change.
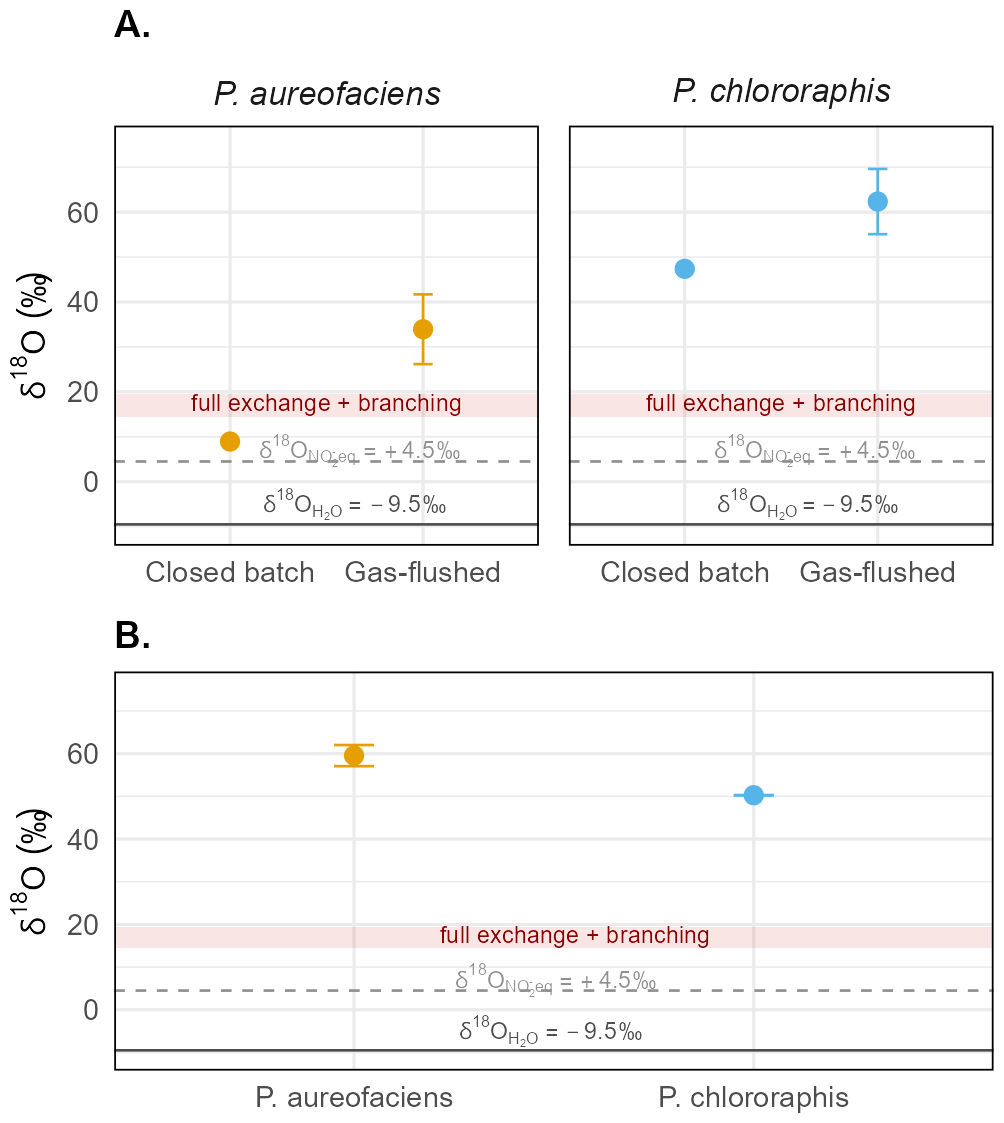
Figure 6δ18O–N2O signatures for Pseudomonas aureofaciens (NirK) and P. chlororaphis (NirS) incubations in natural-abundance water. (A) Active-growth incubations. Closed-batch experiments show δ18O–N2O of the accumulated N2O pool (n=2 per strain; mean ± SD). Gas-flushed experiments show final δ18O–N2O values from time-resolved incubations (P. aureofaciens, n=6; P. chlororaphis, n= 2; mean ± SD). (B) Resuspension closed-batch incubations following transfer of actively grown cells into fresh nitrate medium (n=2 per strain; mean ± SD). Gas-flushed experiments show the final (endpoint) δ18O–N2O values from the time-resolved incubations (P. aureofaciens, n=6; P. chlororaphis, n=2; mean ± SD), whereas closed-batch experiments show the δ18O–N2O of the accumulated N2O pool. Horizontal reference lines in both panels indicate (−9.5 ‰; solid grey) and (+4.5 ‰; dashed grey). The shaded red band (+14.5 ‰ to +19.5 ‰) represents the expected δ18O–N2O range assuming complete oxygen atom equilibration between nitrite and water and a branching isotope effect of approximately 10–15 ‰ (Casciotti et al., 2002; 2007).
To interpret the observed variability in δ18O–N2O, three reference scenarios can be defined. Following the framework of Casciotti et al. (2002, 2007), nitrate reduction to nitrite is associated with an oxygen isotope fractionation of approximately 25 ‰–30 ‰, while NO reduction to N2O is associated with a branching isotope effect of approximately 10 ‰–15 ‰. In the absence of oxygen atom exchange between nitrite and water, δ18O–N2O is therefore expected to be approximately 50 ‰, reflecting the nitrate-source signature (δ18O–NO = +12.4 ± 0.3 ‰) shifted by the combined isotope effects described above. If nitrite fully equilibrates with water prior to reduction, its isotopic composition approaches δ18O–NOeq = δ18O–H2O + ε18eq (here +4.5 ‰), resulting in δ18O–N2O values of +14.5 ‰ to +19.5 ‰ after addition of the branching isotope effect (Casciotti et al., 2002; 2007). The δ18O of water itself (−9.5 ‰) represents a conceptual lower limit approached only by direct incorporation of O atoms from water with no kinetic isotope effects or equilibrium exchange. Because oxygen exchange requires sufficient residence time of nitrite, the transient NO accumulation observed during active growth (Fig. 2E) provides a mechanistic basis for such exchange.
Against this framework, the two strains exhibit contrasting behavior. P. aureofaciens, in closed-batch incubations, yields δ18O–N2O values below the full exchange plus branching range, indicating extensive oxygen exchange, while gas-flushed conditions produce intermediate values (26 ‰–42 ‰), consistent with reduced but still substantial exchange. In contrast, P. chlororaphis yields consistently high δ18O–N2O values under both incubation modes (≈47 ‰–67 ‰), clustering near the nitrate-dominated regime and indicating limited equilibration with water.
These patterns are consistent with previous observations under comparable active-growth conditions (Rohe et al., 2017; Haslun et al., 2018), but here can be interpreted explicitly in terms of oxygen exchange dynamics. Taken together, these results show that δ18O–N2O reflects the combined influence of nitrate-derived oxygen, oxygen-atom exchange with water, and branching fractionation, which vary with strain and incubation mode. To quantify these contributions, we derived oxygen exchange rates using 18O-enriched water experiments (Sect. 3.4.2).
3.4.2 Quantifying oxygen exchange with water during active growth
To quantify oxygen exchange between nitrite and water during active growth under gas-flushed conditions, P. aureofaciens (NirK) was incubated in 18O-enriched water (GF_aur_en; Table 1). δ18O–N2O values began near ∼ 40 ‰, well below the δ18O of the enriched water (+68 ‰; Fig. 7). As nitrate reduction progressed, δ18O–N2O increased steadily, crossed the δ18O-H2O level, and approached 80 ‰ toward the end of the incubation. Throughout the experiment, δ18O–N2O remained below values, anticipated for δ18O-NO under the nitrite–water equilibrium (δ18O-NO2eq ≈ +82 ‰) and well below the expected range for δ18O-N2O derived from fully equilibrated nitrite water combined with branching fractionation (δ18O-NOeq + ≈ +91 ‰ to +97 ‰; Fig. 7).
This trajectory – beginning below δ18O-H2O, rising above it, and stabilizing below δ18O-NO2eq – indicates that the N2O product contains a mixture of nitrate-derived and water-exchanged O atoms, with incomplete approach to full nitrite–water equilibration. The initial δ18O–N2O values reflect expression of the branching isotope effect under minimal water exchange, whereas the later 18O enrichment reflects the combined influence of branching fractionation and increasing nitrite–water exchange. This behavior is consistent with the elevated δ18O–N2O endpoints observed for gas-flushed incubations in natural-abundance water (Figs. 3C; 6A).
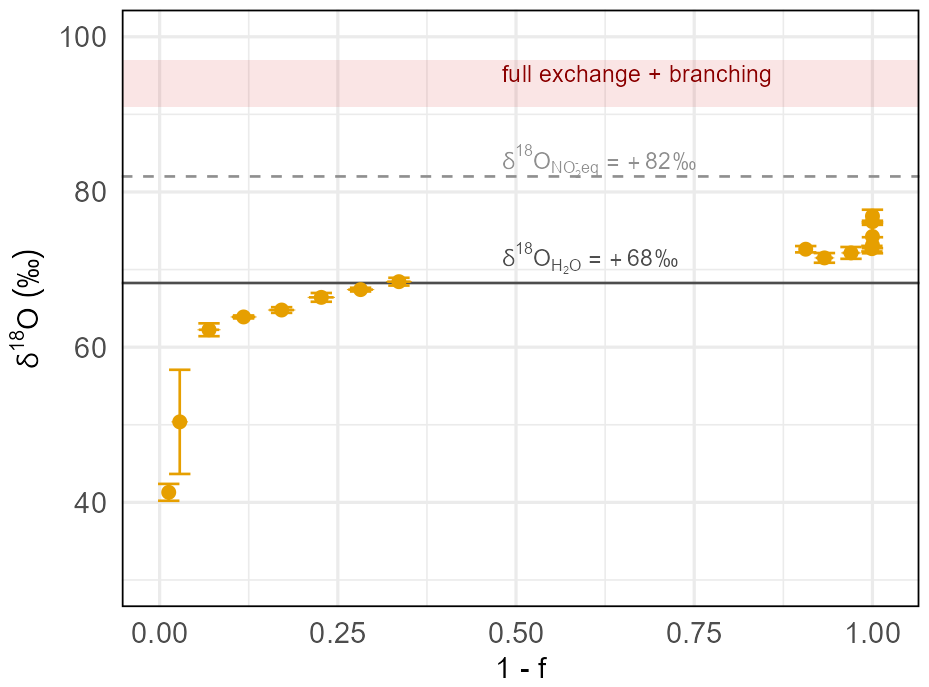
Figure 7δ18O–N2O time series as a function of reaction progress (1−f) for incubation of P. aureofaciens (NirK) in 18O-enriched water. Horizontal reference lines indicate (+68 ‰; solid grey) and (+82 ‰; dashed grey). The shaded red band (+92 ‰ to +97 ‰) represents the expected δ18O–N2O range under full nitrite–water equilibration with branching fractionation. These references provide a framework to distinguish nitrate-derived oxygen, oxygen-atom exchange between nitrite–water, and branching-related 18O enrichment.
To quantify these processes, δ18O–N2O values from natural-water and 18O-enriched incubations were combined in δ18O–N2O vs. δ18O–H2O regressions (Fig. 8), following the framework of Casciotti et al. (2002). In this approach, the regression slope represents the fraction of oxygen atoms in N2O derived from water during nitrite reduction, whereas the y-intercept at δ18O–H2O = 0 ‰ isolates the component of the N2O oxygen isotope signature independent of water isotopic composition. Under conditions of complete nitrite–water equilibration prior to reduction, the intercept approximates the sum of the nitrite–water equilibrium isotope effect and the branching isotope effect (i.e., b ≈ ε18eq + ε18B; Casciotti et al., 2002, 2007). Deviations from this expectation indicate incomplete equilibration and/or retention of nitrate-derived oxygen in the N2O product.
Closed-batch incubations with P. chlororaphis (NirS) exhibited a slope of 0.67 ± 0.05, consistent with partial water exchange (Fig. 8). Its intercept (53.7 ± 4.1 ‰) is strongly elevated relative to ε18eq + ε18B (+24 ‰ to +30 ‰), reflecting combined contributions from nitrate-derived oxygen, incomplete exchange, and branching effects.
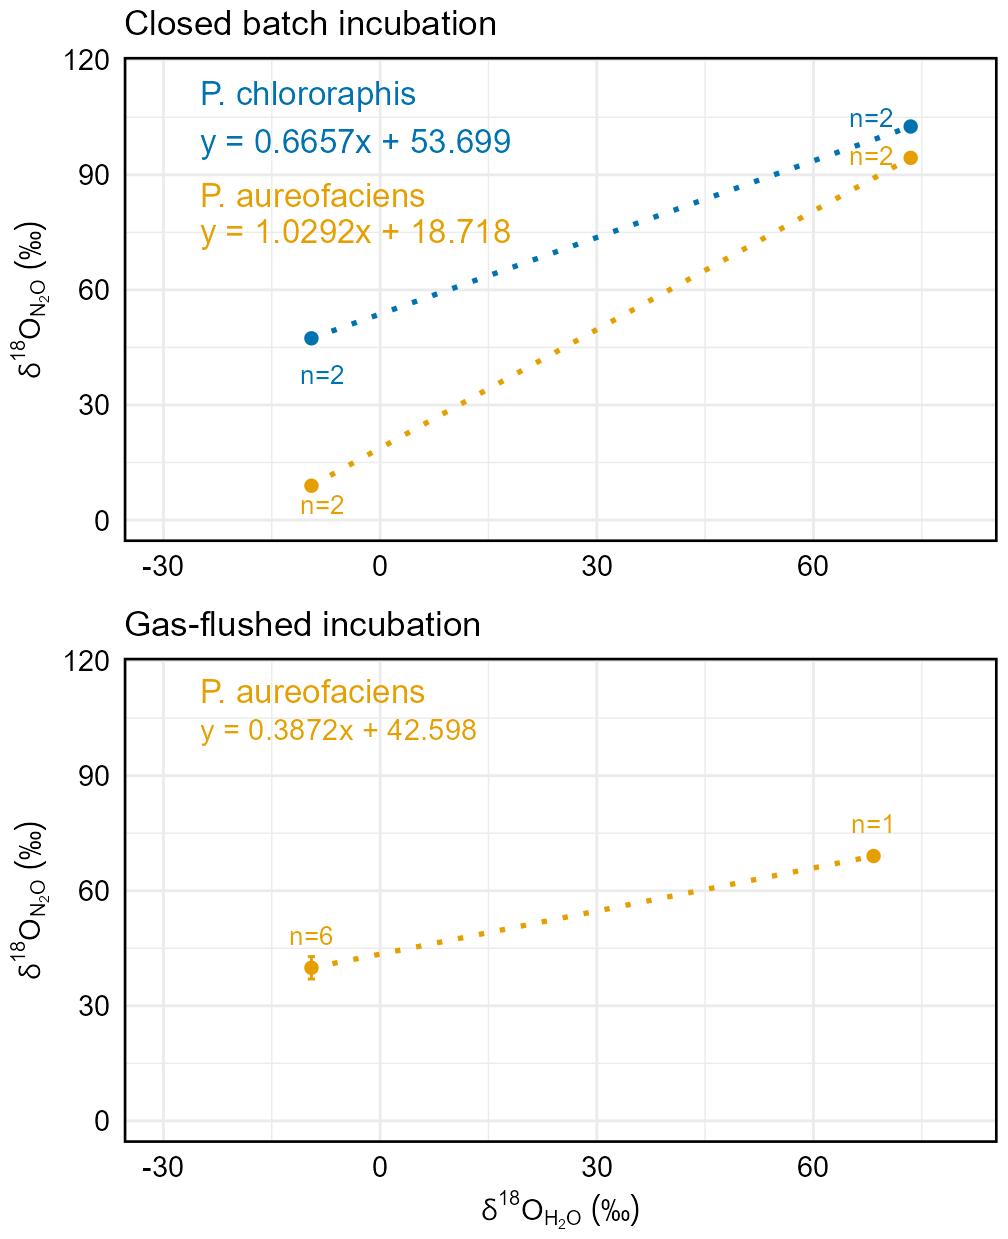
Figure 8δ18O–N2O as a function of δ18O–H2O for both endpoint (closed batch) and gas-flushed incubations of P. aureofaciens (NirK) and P. chlororaphis (NirS). The regression slope from incubations in natural-abundance (δ18O–H2O ≈ –9.5 ‰) and 18O-enriched water (δ18O–H2O ≈ +68.3 ‰ or +73.5 ‰) reflects the extent of oxygen-atom exchange between nitrite and water during stepwise N2O formation. The intercept represents the δ18O–N2O value expected for incubation in water with δ18O–H2O = 0 ‰, and thus reflects the combined effects of the nitrite–water equilibrium isotope effect and the branching isotope effect for the reaction of NO → N2O, plus any contribution from nitrate-derived oxygen that is not removed by nitite-water exchange. The slope for P. aureofaciens in gas-flushed incubation (0.38) indicates partial exchange (38 %), whereas endpoint incubations for P. aureofaciens and P. chlororaphis suggest near-complete (≈ 100 %) and partial exchange (≈ 66 %), respectively.
For P. aureofaciens, closed-batch incubations yielded a slope of 1.03 ± 0.06, indicating complete oxygen-atom exchange of nitrite with water during active growth. The corresponding intercept (18.7 ± 4.5 ‰) is at the lower end of values expected for ε18eq + ε18B. In contrast, gas-flushed incubation of P. aureofaciens yielded a slope of 0.38 ± 0.01, indicating only partial oxygen-atom exchange. The intercept (42.6 ± 1.4 ‰) is substantially higher than both the ε18eq + ε18B expectation and the fully exchanged closed-batch intercept, indicating strong retention of nitrate-derived oxygen and enhanced expression of branching fractionation under gas-flushed conditions.
These results demonstrate that oxygen isotope exchange in P. aureofaciens during active growth is highly sensitive to incubation conditions, spanning from complete to strongly limited exchange. In contrast, P. chlororaphis maintained consistently high oxygen-atom exchange across the experimental conditions investigated. These contrasts suggest that the canonical low-exchange behavior attributed to NirK is not an intrinsic property of the enzyme, but instead a condition-specific outcome of the denitrifier method.
3.4.3 Stationary-phase resuspension incubations recover canonical Nir-dependent oxygen exchange
To assess whether exchange patterns observed during active growth reflect intrinsic enzyme behavior or experimental conditions, we performed resuspension experiments in which actively grown cultures were pelleted and transferred into a defined nitrate medium. This setup places both strains into a stationary-phase reduction regime closely resembling the denitrifier method (Casciotti et al., 2002; Weigand et al., 2016).
Resuspension in natural-abundance water produced high and strain-specific δ18O–N2O endpoints (Fig. 6B): 59.6 ± 2.5 ‰ for P. aureofaciens and 50.3 ± 0.04 ‰ for P. chlororaphis. These values lie well above the range expected under full nitrite–water equilibration (∼ 14.5 ‰–19.5 ‰), indicating limited oxygen exchange and strong retention of nitrate-derived oxygen, consistent with denitrifier-method observations.
Because endpoint values do not directly constrain exchange, nitrate standards spanning a range of δ18O–NO values can be applied to quantify exchange from δ18O–N2O vs. δ18O–NO regressions. Across both nitrate-standard pairs (USGS32–USGS34 and IAEA-N3–18O-enriched IAEA-N3), the two strains reproduced the canonical low- versus high-exchange behavior reported previously (Casciotti et al., 2002; Appendix B Fig. B2). P. aureofaciens exhibited low oxygen exchange (1.5 %–4.3 %), whereas P. chlororaphis showed substantially higher exchange (64.7 %–76.6 %), in close agreement with published ranges. These results confirm that resuspension experiments recover the expected strain-specific exchange behavior under denitrifier-method conditions.
3.5 Physiological controls on N2O isotopic signatures: implications for the denitrifier method and interpretation of N2O isotopocules
The combined isotopic evidence presented here demonstrates that δ18O–N2O is strongly controlled by physiological state and experimental conditions, rather than reflecting fixed enzyme-specific properties. Oxygen isotope signatures are modulated by the balance between nitrate-derived oxygen, nitrite–water equilibration, and branching processes, all of which vary with metabolic activity and reaction environment.
A direct comparison across incubation regimes (Fig. 9) reveals a clear contrast. During active growth, oxygen exchange is highly variable: P. aureofaciens spans from partial to near-complete exchange (∼ 38 % under gas-flushed conditions to ∼ 100 % in closed-batch incubations), whereas P. chlororaphis exhibits consistently higher but more stable exchange (≈ 66 %). In contrast, under stationary-phase resuspension conditions, both strains reproduce the characteristically low- versus high-exchange behavior reported for the denitrifier method, with P. aureofaciens showing low exchange (≈ 2 %–4 %) and P. chlororaphis high exchange (∼ 65 %–75 %).
This contrast demonstrates that the widely used δ18O–N2O signatures commonly associated with NirK and NirS are not intrinsic enzyme properties, but arise under the constrained conditions of the denitrifier method. Outside this experimental framework, oxygen-atom exchange is dynamic and reflects physiological state rather than nitrite reductase identity alone.
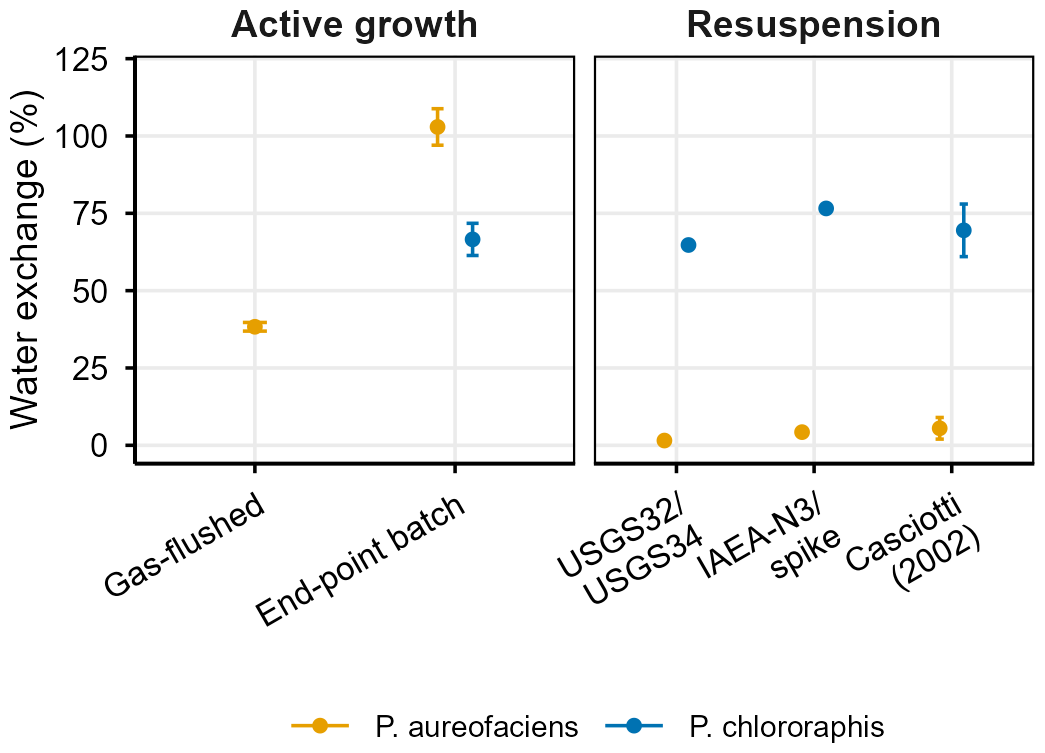
Figure 9Compilation of water exchange (%) for P. aureofaciens (NirK) and P. chlororaphis (NirS) under active growth and resuspension conditions. Exchange during active growth was derived from δ18O–N2O versus δ18O–H2O relationships using 18O-enriched water (Fig. 8). Under resuspension conditions, exchange was quantified from δ18O–N2O versus δ18O–NO regressions using nitrate standards spanning a range of δ18O values (USGS32/34, IAEA-N3 ± spike), based on the degree of scale compression. These two independent approaches provide consistent constraints on oxygen exchange. For active growth, P. aureofaciens showed 38.3 ± 1.4 % (gas-flushed) and 102.9 ± 5.9 % (end-point batch) exchange, whereas P. chlororaphis showed 66.6 ± 5.2 % (end-point batch). Closed triangles indicate reference values from Casciotti et al. (2002), plotted at the midpoint of reported ranges (2 %–9 % for P. aureofaciens, 61 %–78 % for P. chlororaphis).
A mechanistic explanation for this variability likely lies in the dynamics of the nitrite intermediate pool (Casciotti et al., 2007). Oxygen exchange between nitrite and water requires sufficient residence time of NO to approach isotopic equilibration. During active growth, differences in nitrate reduction rates, nitrite accumulation, and consumption can alter both the size and lifetime of this intermediate pool, thereby modulating the extent of exchange. In addition, because actively growing cultures simultaneously undergo biomass synthesis and enzyme expression, nitrate reduction and downstream nitrite reduction may be less tightly coupled than in resuspension assays, allowing nitrite to persist longer before reduction. In contrast, under resuspension conditions, fully induced cells rapidly reduce the supplied nitrate, and tighter coupling between nitrate and nitrite reduction likely limits nitrite accumulation and, consequently, oxygen isotope exchange. Additional physiological factors, such as pH-dependent exchange kinetics (Buchwald and Casciotti, 2013) or changes in the cellular microenvironment, might also contribute but could not be resolved in the present study and therefore warrant future investigation. These observations indicate that oxygen exchange reflects system-level metabolic dynamics rather than fixed enzymatic behavior.
Consistent strain-specific differences in δ18O–N2O under active-growth conditions have been reported previously (Rohe et al., 2017; Haslun et al., 2018; Sect. 3.4.1). Their agreement with the patterns observed here suggests that such behavior may be more general but has not been systematically evaluated within a process-based framework.
These findings have important implications for the interpretation of N2O isotopocules. Application of fixed δ18O–N2O endmember ranges assumes that oxygen exchange is stable and pathway-specific. The results presented here demonstrate instead that δ18O–N2O is condition-dependent, and that variability in oxygen isotope signatures reflects changes in exchange dynamics rather than differences in nitrite reductase type. As a result, δ18O–N2O does not provide a reliable tracer of nitrite reductase identity (NirK vs. NirS) outside the constrained conditions of the denitrifier method. Consequently, exchange characteristics derived from denitrifier-method experiments should not be extrapolated to microbial systems without accounting for physiological context. These findings do not imply that isotopic signatures currently used to identify N2O produced by denitrification should be replaced by a single, much broader range of delta values. Rather, they demonstrate that physiological state of the microbial community should be considered explicitly when defining and applying isotopic signatures for environmental interpretation. . More generally, accurate interpretation of δ18O–N2O requires frameworks that explicitly incorporate metabolic state, intermediate dynamics, and environmental conditions, rather than relying on static enzyme-based classifications.
The results presented here demonstrate that N2O isotopic signatures are strongly controlled by physiological state and experimental conditions, rather than reflecting fixed enzyme-specific properties. In particular, δ18O–N2O varies extensively with oxygen atom exchange between nitrite and water, which depends on metabolic activity and reaction context. Only under stationary-phase resuspension conditions do enriched-water and nitrate-standard approaches reproduce the characteristic exchange behavior reported in classical denitrifier-method studies. This shows that the widely used δ18O–N2O exchange rates are specific to the denitrifier method and do not represent general physiological behavior, but instead reflect the constrained conditions under which the method operates. As a result, δ18O–N2O cannot be interpreted as a reliable tracer of nitrite reductase identity outside these conditions.
Site preference (SP) measurements provide complementary, time-resolved insight into N2O formation pathways during active growth. SP trajectories exhibit a reproducible pattern, with early high values (+10 ‰ to +20 ‰) followed by a transition toward values near 0 ‰. These dynamics suggest transient activity of alternative NO reductases, such as flavohemoglobins, during the onset of denitrification, before canonical NorB-mediated NO reduction dominates. Importantly, these shifts occur within the same denitrifying microorganisms and suggest that temporary engagement of NO detoxification pathways may contribute to N2O formation during phases of elevated NO stress.
These findings have important implications for environmental interpretation of N2O isotopocules. The application of fixed δ18O–N2O or SP endmember ranges assumes that isotopic signatures are stable and pathway-specific constants. Our results demonstrate instead that isotopic expression is conditional. For example, SP values in the range of ∼ 5 ‰–15 ‰, are often interpreted as an evidence for mixed or non-denitrification sources when using fixed endmember frameworks (e.g., Opdyke et al., 2008). However, they could arise entirely from denitrification through shifts in NO reduction pathways. Similarly, variability in δ18O–N2O may reflect changes in oxygen exchange dynamics rather than differences in nitrite reductase type, and denitrification may give rise to N2O with a broader range in δ18O–N2O than is typically assumed. Moreover, abiotic nitrite reactions, including chemodenitrification and reactions between nitrite and organic matter, have also been shown to produce a broad range of SP values overlapping those of biological pathways (Jones et al., 2015; Visser et al., 2020; Wei et al., 2019). Together, these findings further emphasize that N2O isotopocules should be interpreted within their physiological and environmental context rather than as unique process-specific fingerprints.
Accurate interpretation of N2O isotopocules therefore requires frameworks that explicitly account for physiological state, intermediate dynamics, and environmental context, rather than relying on static metabolism or enzyme-based classifications. Instead of defining and interpreting isotopic signatures as fixed constants, our results demonstrate that they should be interpreted in the context of the physiological and environmental conditions under which they were established. Constraining process signatures under more realistic environmental conditions (Strubbe et al., 2026) will be essential for improving the interpretation of N2O isotopic signatures in natural systems. Integrating isotopocule measurements with approaches that resolve metabolic activity and enzyme expression may further help link isotopic signatures to specific microbial processes.
A1 Calibration of isotopic data provided by Quantum Cascade Laser Absorption Spectroscopy (QCLAS)
Isotopic composition (δ15Nα, δ15Nβ, δ18O) of N2O was derived from uncorrected QCLAS output values (TDL Wintel, Aerodyne Research, USA) using a dedicated R script (IsotopeRead 2.0, N. Chénier, Empa). The processing pipeline includes (i) temporal averaging, (ii) extraction of sample and calibration-gas intervals via external command language (ECL) indices, (iii) drift correction to reference gas CG1, (iv) calibration-factor determination from CG1–CG2 differences, and (v) uncertainty propagation based on Allan deviation and signal intensity.
A1.1 Data averaging and ratio calculation
QCLAS output data are reported using HITRAN-style shorthand (e.g., 446 equivalent to 14N14N16O) and averaged over 1 min time intervals. Isotopologue ratios (e.g. R448) are computed from the concentration of the minor isotopologue (e.g. i448) to the 446 isotopologue:
-
R448 = i448/i446
-
R456 = i456/i446
-
R546 = i546/i446
Temperature stability of the laser and optical cell was verified through automated plotting.
A1.2 Identification of gas sample and calibration intervals
ECL indices assigned during acquisition were used to identify sample blocks and the two calibration gases (CG1 and CG2). Only intervals with the correct predefined length were retained to ensure consistent calibration.
A1.3 Calibration gases and normalization
Two N2O isotope reference gases diluted in N2 and calibrated to international isotope-ratio scales (Air–N2 for , VSMOW for ) by several expert laboratories were used (Mohn et al., 2022):
-
CG1 (RM1A; anchor gas): δ15Nα = −0.22 ± 0.46 ‰, δ15Nβ = 0.84 ± 0.46 ‰, δ18O = 39.22 ± 0.15 ‰
-
CG2 (RM3A; span gas): δ15Nα = 50.96 ± 0.47 ‰, δ15Nβ = 53.06 ± 0.47 ‰, δ18O = 103.04 ± 0.16 ‰
For each sample block, isotopologue ratios were normalized by dividing the sample ratio by the mean CG1 ratio measured immediately before and after the sample:
A1.4 Calibration-factor determination
Calibration factors (ax) were calculated from the measured ratio differences between CG1 and CG2 and the known isotopic differences:
Uncertainty in ax incorporates both the assigned uncertainty of CG1 and CG2 and the variance of their measured ratios.
Corrected delta values were computed as:
A1.5 Uncertainty estimation
Instrumental precision was assessed using the Allan deviation at 60 s spectral averaging and was better than 0.1 ‰ for all δ values.
Uncertainty in δ15Nα, δ15Nβ, and δ18O was assessed by propagating contributions from (i) Allan deviation of the relevant isotopologue ratios, (ii) signal-intensity variability (i446 and minor isotopologues), and (iii) variability in calibration-factors.
The uncertainty for derived quantities was calculated using standard error-propagation rules. For example, site preference (SP = δ15Nα − δ15Nβ) uncertainty was calculated as:
Uncertainty in δ15N-bulk and δ18O was propagated analogously from their respective isotopologue components.
A1.6 Data output
Corrected delta values with propagated uncertainties were exported as .csv files. Diagnostic plots (SP, δ15N-bulk, δ18O) were automatically generated for quality assurance.
All processing was performed in RStudio (R Core Team, 2020). The full script (IsotopeRead 2.0) is available upon request.
A2 Calculation of N2O yield and fractionation factors
N2O yield and isotopic fractionation as well as their uncertainties were calculated using a customized R script.
The molar amounts of N2O (n N2O) produced during each time interval ΔT were calculated from FTIR-derived concentrations (C_gas in ppm; 10−6 L L−1) and nitrogen gas flow rates (Q in mL min−1), using a molar volume of 22.4 L mol−1. NO was treated analogously (n_NO), considering concentrations which exceed the analytical detection limit. For intervals where NO remained below detection, n_NO was not calculated, and no NO yield was reported.
Uncertainties in N2O production were calculated by propagation through partial derivatives of the above expression, incorporating both flow and concentration uncertainties. The uncertainty of the measured N2O and NO concentrations was attributed to either the instrumental detection limit (0.0075 ppm for N2O and 0.133 ppm for NO), or a relative uncertainty of 10 % for both N2O and NO, with the larger value used at each time point. Uncertainty in the nitrogen flow rate was assumed to be 0.3 % based on mass flow controller specifications (Vögtlin Instruments Inc., Switzerland).
The N2O yield (in %) was calculated from the molar amount of N2O produced over the experiment related to the molar amount of nitrogen substrate (KNO3, molar mass 101.1 g mol−1). Associated uncertainty was propagated from balance precision (±0.01 g) and purity (≥99 %, conservatively estimated at ±0.5 %).
To calculate Rayleigh-type enrichment factors (ε), the isotopic composition of the accumulated N2O product gas (δcum) is required. This was calculated as a weighted average from temporal trends in delta values (δi) weighted by the molar amount of N2O (niN2O) emitted in the respective time interval. Calculations were performed on synchronized data averaged over 15 min time intervals:
Uncertainties in δcumwere computed from uncertainties in individual δ-values and the associated molar amount of N2O. Uncertainties in δcum were propagated by summing the individual variances associated with δ-values and their corresponding N2O fluxes. At each time step, the square root of the cumulative variance yielded the standard error used to construct time-resolved confidence intervals for δ15N-bulk, δ18O, and SP.
The fraction of remaining substrate (f) in the Rayleigh reaction progress variable was calculated as:
Uncertainties in f and x were propagated from uncertainties in the molar amount of substrate (nNO3−), calculated from the nitrate mass and its molecular mass, and the cumulative molar amount of N2O.
Enrichment factors (ε) were obtained by Rayleigh-type regressions, plotting δ values of the accumulated N2O product gas against the transformed progress variable.
Daily averages, cumulative profiles, and model fits were exported as CSV files. Summary statistics include regression intercept, slope, standard errors, and confidence intervals for each isotopic parameter.
The datasets generated and analysed during this study are provided as supplementary Excel files on Zenodo (https://doi.org/10.5281/zenodo.21534019, Chénier et al., 2026). Custom analysis scripts are available from the corresponding author upon request.
The supplement related to this article is available online at https://doi.org/10.5194/bg-23-6705-2026-supplement.
Conceptualization: NC, PMM, JM, MFL. Methodology: NC, PMM, CF, TK, MFL, JM. Investigations: NC. Resources: JM, TK, MFL, CF, JZ. Formal analysis: NC, PMM, JM. Visualization: NC. Writing: all authors.
The contact author has declared that none of the authors has any competing interests.
Publisher's note: Copernicus Publications remains neutral with regard to jurisdictional claims made in the text, published maps, institutional affiliations, or any other geographical representation in this paper. The authors bear the ultimate responsibility for providing appropriate place names. Views expressed in the text are those of the authors and do not necessarily reflect the views of the publisher.
This work was supported by the Swiss National Science Foundation (SNSF; grant no. 200020_204907). We thank Tim Paulus for help in learning the methods, Béla Tuzson for support with the laser spectrometer, André Kupferschmid for support with LabView, and Simone Brunamonti for support with the instrument system buildup. We used artificial intelligence tools for code development for data analysis and figure generation, as well as for text editing, paragraph polishing, and grammar correction during the manuscript preparation. All scientific interpretation, analytical decisions, and final manuscript content were reviewed and verified by the authors.
This work was supported by the Swiss National Science Foundation (SNSF; grant no. 200020_204907).
This paper was edited by Nicolas Brüggemann and reviewed by Dominika Lewicka-Szczebak and one anonymous referee.
Braman, R. S. and Hendrix, S. A.: Nanogram nitrite and nitrate determination in environmental and biological materials by vanadium(III) reduction with chemiluminescence detection, Anal. Chem., 61, 2715–2718, https://doi.org/10.1021/ac00199a007, 1989.
Buchwald, C. and Casciotti, K. L.: Isotopic ratios of nitrite as tracers of the sources and age of oceanic nitrite, Nat. Geosci., 6, 308–313, https://doi.org/10.1038/ngeo1745, 2013.
Caranto, J. D., Weitz, A., Giri, N., Hendrich, M. P., and Kurtz Jr., D. M.: A Diferrous-Dinitrosyl Intermediate in the N2O-Generating Pathway of a Deflavinated Flavo-Diiron Protein, ACS Biochem., 53, 5631–5637, https://doi.org/10.1021/bi500836z, 2014a.
Caranto, J. D., Weitz, A., Hendrich, M. P., and Kurtz Jr., D. M: The Nitric Oxide Reductase Mechanism of a Flavo-Diiron Protein: Identification of Active-Site Intermediates and Products, J. Am. Chem. Soc., 136, 7981–7992, https://doi.org/10.1021/ja5022443, 2014b.
Casciotti, K. L., Sigman, D. M., Hastings, M. G., Böhlke, J. K., and Hilkert, A.: Measurement of the oxygen isotopic composition of nitrate in seawater and freshwater using the denitrifier method, Anal. Chem., 74, 4905–4912, https://doi.org/10.1021/ac020113w, 2002.
Casciotti, K. L., Böhlke, J. K., McIlvin, M., Mroczkowski, S., and Hannon, J.: Oxygen Isotopes in Nitrite: Analysis, Calibration, and Equilibration, Anal. Chem., 79, 2427–2436, https://doi.org/10.1021/ac061598h, 2007.
Chénier, N., Magyar, P. M., Zopfi, J., Frey, C., Lehmann, M. F., and Mohn, J.: High nitrous oxide isotopic variability during denitrification by Pseudomonas species bearing NirK and NirS, Zenodo [data set], https://doi.org/10.5281/zenodo.21534019, 2026.
Denk, T. R. A., Mohn, J., Decock, C., Lewicka-Szczebak, D., Harris, E., Butterbach-Bahl, K., Kiese, R., and Well, R.: The nitrogen cycle: A review of isotope effects and isotope modeling approaches, Soil Biol. Biochem., 105 121e137, https://doi.org/10.1016/j.soilbio.2016.11.015, 2016.
Denman, K. L., Brasseur, G., Chidthaisong, A., Ciais, P., Cox, P. M., Dickinson, R. E., Hauglustaine, D., Heinze, C., Holland, E., Jacob, D., Lohmann, U., Ramachandran, S., da Silva Dias, P. L., Wofsy, S. C., and Zhang, X.: Couplings Between Changes in the Climate System and Biogeochemistry, Climate Change: The Physical Science Basis. Contribution of Working Group I to the Fourth Assessment Report of the Intergovernmental Panel on Climate Change Cambridge University Press, Cambridge, United Kingdom and New York, NY, USA, https://www.ipcc.ch/site/assets/uploads/2018/02/ar4-wg1-chapter7-1.pdf (last access: 22 September 2026), 2007.
Frame, C. H. and Casciotti, K. L.: Biogeochemical controls and isotopic signatures of nitrous oxide production by a marine ammonia-oxidizing bacterium, Biogeosciences, 7, 2695–2709, https://doi.org/10.5194/bg-7-2695-2010, 2010.
Gruber, W., Magyar, P.M., Mitrovic, I., Zeyer, K., Vogel, M., von Känel, L., Biolley, L., Werner, R. A., Morgenroth, E., Lehmann, M. F., and Braun, D.: Tracing N2O formation in full-scale wastewater treatment with natural abundance isotopes indicates control by organic substrate and process settings, Water Research X, 15, 100130, https://doi.org/10.1016/j.wroa.2022.100130, 2022.
Hansen, H. P. and Koroleff, F.: Determination of nutrients, Methods of Seawater Analysis, 159–228, https://doi.org/10.1002/9783527613984, 1999.
Haslun, J. A., Ostrom, N. E., Hegg, E. L., and Ostrom, P. H.: Estimation of isotope variation of N2O during denitrification by Pseudomonas aureofaciens and Pseudomonas chlororaphis: implications for N2O source apportionment, Biogeosciences, 15, 3873–3882, https://doi.org/10.5194/bg-15-3873-2018, 2018.
Ibraim, E., Harris, E., Eyer, S., Tuzson, B., Emmenegger, L., Six, J., and Mohn, J.: Development of a field-deployable method for simultaneous, real-time measurements of the four most abundant N2O isotopocules, Isot. Environ. Healt. S., 54, https://doi.org/10.1080/10256016.2017.1345902, 2018.
IPCC: Climate Change 2023: Synthesis Report. Contribution of Working Groups I, II and III to the Sixth Assessment Report of the Intergovernmental Panel on Climate Change, IPCC, Geneva, Switzerland, https://doi.org/10.59327/IPCC/AR6-9789291691647, 2023.
Jones, L. C., Peters, B., Lezama Pacheco, J. S., Casciotti, K. L., and Fendorf, S.: Stable isotopes and iron oxide mineral products as markers of chemodenitrification, Environ. Sci. Technol., 49, 3444–3452, https://doi.org/10.1021/es504862x, 2015.
Kelly, C. L., Manning, C., Frey, C., Kaiser, J., Gluschankoff, N., and Casciotti, L. L.: Pyisotopomer: A Python package for obtaining intramolecular isotope ratio differences from mass spectrometric analysis of nitrous oxide isotopocules, Rapid Commun. Mass Spectrom., 1097–0231, https://doi.org/10.1002/rcm.9513, 2023.
Kool, D. M., Wrage, N., Oenema, O., Dolfing, J., and Van Groenigen, J. W.: Oxygen exchange between (de) nitrification intermediates and H2O and its implications for source determination of NO and N2O: a review, Rapid Commun. Mass Sp., 21, 3569–3578, https://doi.org/10.1002/rcm.3249, 2007.
Lewicka-Szczebak, D., Dyckmans, J., Kaiser, J., Marca, A., Augustin, J., and Well, R.: Oxygen isotope fractionation during N2O production by soil denitrification, Biogeosciences, 13, 1129–1144, https://doi.org/10.5194/bg-13-1129-2016, 2016.
Mariotti, A., Leclerc, A., and Germon, J. C.: Nitrogen isotope fractionation associated with the NO → N2O step of denitrification in soils, Can. J. Soil Sci., 62, 227–241, https://doi.org/10.1007/BF02374138, 1981.
Mohn, J., Biasi, C., Bodé, S., Boeckx, P., Brewer, P. J., Eggleston, S., Geilmann, H., Guillevic, M., Kaiser, J., Kantnerová, K., and Moossen, H.: Isotopically characterised N2O reference materials for use as community standards, Rapid Commun. Mass Specrom., 36, 13, e9296, https://doi.org/10.1002/rcm.9296, 2022.
Opdyke, M. R., Ostrom, N. E., and Ostrom, P. H.: Evidence for the predominance of denitrification as a source of N2O in temperate agricultural soils based on isotopologue measurements, Global Biogeochem. Cy., 23, 4, https://doi.org/10.1029/2009GB003523, 2008.
Ostrom, N. E. and Ostrom, P. H.: The isotopomers of nitrous oxide: analytical considerations and application to resolution of microbial production pathways, Handbook of Environmental Isotope Geochemistry, Vol. I, Berlin, Heidelberg: Springer Berlin Heidelberg, 453–476, https://doi.org/10.1007/978-3-642-10637-8_23, 2011.
R Core Team: R: A language and environment for statistical computing. R Foundation for Statistical Computing, Vienna, Austria, https://www.R-project.org/ (last access: 21 September 2026), 2020.
Reay, D. S., Davidson, E. A., Smith, K. A., Smith, P., Melillo, J. M., Dentener, F., and Crutzen, P. J.: Global agriculture and nitrous oxide emissions, Nat. Clim. Change, 2, 410–416, https://doi.org/10.1038/nclimate1458, 2012.
Rivett, E. D., Finders, C. M., Haslun, J. A., Gandhi, H., Kahle, M., Ädelroth, P., Ostrom, P. H., Ostrom, N. E., and Hegg E. L.: Isotopic Fractionation and Kinetic Isotope Effects of a Purified Bacterial Nitric Oxide Reductase (NOR), Biochemistry, 64, 4327–4340, https://doi.org/10.1021/acs.biochem.5c00417, 2025.
Rohe, L., Well, R., and Lewicka‐Szczebak, D.: Use of oxygen isotopes to differentiate between nitrous oxide produced by fungi or bacteria during denitrification, Rapid Commun. Mass Spectrom., 31, 1297–1312, https://doi.org/10.1002/rcm.7909, 2017.
Sigman, D. M., Casciotti, K. L., Andreani, M., Barford, C., Galanter, M., and Böhlke, J. K.: A bacterial method for the nitrogen isotopic analysis of nitrate in seawater and freshwater, Anal. Chem., 73, 4145–4153, https://doi.org/10.1021/ac010088e, 2001.
Snider, D. M., Schiff, S. L., and Spoelstra, J.: and stable isotope ratios of nitrous oxide produced during denitrification in temperate forest soils, Geochim. Cosmochim. Ac., 73, 877–888, 2009.
Strubbe, L., Keck, H., Magyar, P. M., Mohn, J., Joss, A., and Froemelt, A.: Activating specific N2O production pathways to understand emission dynamics in wastewater treatment, Water Res., 296, 125580, https://doi.org/10.1016/j.watres.2026.125580, 2026.
Sutka, R. L., Ostrom, N. E., Ostrom, P. H., Breznak, J. A., Gandhi, H., Pitt, A. J., and Li, F.: Distinguishing nitrous oxide production from nitrification and denitrification using N2O isotopomers, Appl. Environ. Microbiol., 72, 638–644, https://doi.org/10.1128/AEM.72.1.638-644.2006, 2006.
Toyoda, S., Mutobe, H., Yamagishi, H., Yoshida, N., and Tanji, Y.: Fractionation of N2O isotopomers during production by denitrifier bacteria, Soil Biol. Biochem., 37, 1535–1545, https://doi.org/10.1016/j.soilbio.2005.01.009, 2005.
Toyoda, S., Yoshida, N., and Koba, K. Isotopocule analysis of biologically produced nitrous oxide in various environments, Mass Spectrom. Rev., 36, 135–160, https://doi.org/10.1002/mas.21459, 2017.
Visser, A.-N., Wankel, S. D., Niklaus, P. A., Byrne, J. M., Kappler, A. A., and Lehmann, M. F.: Impact of reactive surfaces on the abiotic reaction between nitrite and ferrous iron and associated nitrogen and oxygen isotope dynamics, Biogeosciences, 17, 4355–4374, https://doi.org/10.5194/bg-17-4355-2020, 2020.
Wang, R. Z., Lonergan, Z. R., Wilbert, S. A., Eiler, J. M., and Newman, D. K.: Widespread detoxifying NO reductases impart a distinct isotopic fingerprint on N2O under anoxia, P. Natl. Acad. Sci. USA, 121, 25 e2319960121, https://doi.org/10.1073/pnas.2319960121, 2024.
Wei, J., Ibraim, E., Brüggemann, N., Vereecken, H., and Mohn, J.: First real-time isotopic characterisation of N2O from chemodenitrification, Geochim. Cosmochim. Ac., 267, https://doi.org/10.1016/j.gca.2019.09.018, 2019.
Weigand, M. A., Foriel, J., Barnett, B., Oleynik, S., and Sigman, D. M.: Updates to instrumentation and protocols for isotopic analysis of nitrate by the denitrifier method, Rapid Commun. Mass Sp., 30, 1365–1383, https://doi.org/10.1002/rcm.7570, 2016.
WMO: Greenhouse Gas Bulletin, World Meteorological Organization, https://library.wmo.int/idurl/4/69057 (last access: 7 September 2026), 2024.
Wunderlin, P., Mohn, J., Joss, A., Emmenegger, L., and Siegrist, H.: Mechanisms of N2O production in biological wastewater treatment under nitrifying and denitrifying conditions, Water Res., 46, 1027–1037, https://doi.org/10.1016/j.watres.2011.11.080, 2012.
Wunderlin, P., Lehmann, M. F., Siegrist, H., Tuzson, B., Joss, A., Emmenegger, L., and Mohn, J.: Isotope signatures of N2O in a mixed microbial population system: constraints on N2O producing pathways in wastewater treatment, Environ. Sci Technol., 47, 1339–1348, https://doi.org/10.1021/es303174x, 2013.
Xu, Z., Hattori, S., Masuda, Y., Toyoda, S., Koba, K., Yu, P., and Senoo, K.: Unprecedented N2O production by nitrate-ammonifying Geobacteraceae with distinctive N2O isotopocule signatures, mBio, 15, e02540-24, https://doi.org/10.1128/mbio.02540-24, 2024.
Yamazaki, T., Hozuki, T., Arai, K., Toyoda, S., Koba, K., Fujiwara, T., and Yoshida, N.: Isotopomeric characterization of nitrous oxide produced by reaction of enzymes extracted from nitrifying and denitrifying bacteria, Biogeosciences, 11, 2679–2689, https://doi.org/10.5194/bg-11-2679-2014, 2014.
Ye, R. W., Averill, B. A., and Tiedje, J. M.: Denitrification: production and consumption of nitric oxide, Appl. Environ. Microb., 60, 1053–1058, https://doi.org/10.1128/aem.60.4.1053-1058.1994, 1991.
Yoshida, N. and Toyoda, S.: Constraining the atmospheric N2O budget from intramolecular site preference, Nature, 405, 330–334, https://doi.org/10.1038/35012558, 2000.
Yu, L., Harris, E., Lewicka-Szczebak, D., Barthel, M., Blomberg, M. R. A., Harris, S. J., Johnson, M. S., Lehmann, M. F., Liisberg, J., Müller, C., Ostrom, N. E., Six, J., Toyoda, S., Yoshida, N., and Mohn, J.: What can we learn from N2O isotope data? – Analytics, processes and modelling, Rapid Commun. Mass Sp., 34, e8858, https://doi.org/10.1002/rcm.8858, 2020.
Zumft, W. G.: Cell biology and molecular basis of denitrification, Microbiol. Mol. Biol. Rev., 61, 533–616, 1997.