
the Creative Commons Attribution 4.0 License.
the Creative Commons Attribution 4.0 License.
 | 24 Sep 2026
Balancing nitrogen use efficiency, losses and soil nitrogen depletion to evaluate national scale agri-environmental performance over 40 years

Lenny H. E. Winkel
Chloé Wüst-Galley
Daniel Bretscher
Magdalena Necpalova
Andrea Stenke
Johan Six
Nitrogen (N) is essential for agricultural productivity, but excessive N inputs result in substantial losses to the environment. Conducting N assessments at national scales is challenging because observational data are limited, especially over long time periods. Here we compiled detailed datasets and performed high-resolution biogeochemical modelling to quantify N budgets for Switzerland's diverse agricultural ecosystems over four decades, with a focus on croplands and grasslands (i.e., permanent managed meadows used for livestock feed). Between the 1980s and the 2010s, N use efficiency improved from 47 % to 57 % in croplands and from 63 % to 71 % in grasslands, while losses through leaching and gas emissions decreased by 24 % in croplands and 4 % in grasslands. These improvements are closely linked to the implementation of national-scale agri-environmental policies that reduced fertilizer use in the 1990s. However, despite increased efficiency, cropland soils experienced substantial N depletion between 1995 and 2011 (−23 ) in croplands. Our results demonstrate that policy reforms have improved agricultural system functioning and reduced losses, but also reveal risks associated with unbalanced soil N, underscoring the need for integrated N management for sustainable agriculture.
- Article
(10165 KB) - Full-text XML
-
Supplement
(5191 KB) - BibTeX
- EndNote


Nitrogen (N) is a vital element supporting life. Before synthetic fertilizers were developed, N was often a limiting factor for agricultural productivity (Vitousek and Howarth, 1991). The discovery of the Haber–Bosch process in the early 20th century enabled inert di-nitrogen (N2) gas to be converted to biologically available N (in the form of ammonia), so-called “reactive nitrogen” (Nr) (Erisman et al., 2008), and boosted fertilizer production. Since the 1970s, the rapid increase of synthetic fertilizer use has greatly facilitated crop production (Fowler et al., 2013; Galloway et al., 2013). Nearly half of the global population are nourished by the N fertilizer produced using the Haber-Bosch process (Erisman et al., 2008). However, large amounts of N are unintentionally lost to the environment, causing a wide range of environmental damages (Galloway et al., 2003; Sutton et al., 2011). These N losses comprise gaseous emissions to the atmosphere, such as ammonia (NH3), nitric oxide (NO), nitrous oxide (N2O) and N2, and leaching of nitrate () into groundwater; these losses negatively affect air, water and soil quality (Anderson et al., 2003; Dodds and Smith, 2016; Moldanová et al., 2011; Sutton et al., 2013); damage ecosystems and biodiversity (Krupa, 2003; Sutton et al., 2020); and contribute to climate warming (Stocker et al., 2013; Zhu et al., 2025).
To evaluate the N performance of a system and the associated environmental impacts, N use efficiency (NUE) is a widely used indicator. NUE is defined as the ratio of N outputs to N inputs, with higher NUE indicating more of the inputs going towards their intended use. For cropping systems, NUE is calculated as the N in harvested products divided by total N input (i.e., synthetic and organic fertilizers, biological N fixation and atmospheric N deposition). It is usually reported with other indicators describing the magnitude of N use, such as N yield or N surplus (difference between the N inputs and outputs). The NUE approach can be extended to the national and global level to track efficiency changes over time. It has been reported that global average NUE declined from 68 % to 45 % between 1961 and 1980 and subsequently stabilized over the next three decades (Lassaletta et al., 2014). In many countries, marked reductions in NUE resulted from intensified fertilization, which also led to elevated N losses (Lassaletta et al., 2014). These issues underscore the need for evaluation of agri-environmental performance by means of robust N indicators and advanced methodologies. A common approach is N budgets (Oberson et al., 2024; Oenema et al., 2003; Zhang et al., 2015, 2021), which offer an insightful understanding of N sources and fates by quantifying N inputs (i.e., synthetic and organic fertilizers, biological N fixation and atmospheric N deposition) and outputs (i.e., N removed in harvest and various loss pathways). This approach is increasingly recognized by researchers, farmers, policy makers and other stakeholders as a critical tool for understanding the N cycle, informing decision-making and promoting better management practices for pollution mitigation (Quemada et al., 2020; Zhang et al., 2021). However, a major limitation of existing N budget studies is the lack of spatial and temporal data to estimate N budgets at regional scale over time. Hence, understanding how N budgets, and soil N changes, especially at large spatial and temporal scales, remains a critical research need. One way to overcome this lack of spatial and temporal data is to use well-calibrated and validated state-of-the-art biogeochemical ecosystems models, such as DayCent, DNDC, EPIC, etc., to provide reliable estimate on ecosystem-wide N budgets across space and time.
Swiss agriculture is fundamentally shaped by pronounced topographic heterogeneity, broad climatic gradients and long traditions of agro-pastoral management. The country's agricultural landscape covers approximately 1.5 million ha (BFS, 2024) and can be structurally classified into three primary land use categories: cropland, managed grassland (meadow and pasture), and summer pasture (seasonal alpine pasture). Each of these systems fulfils distinct functional roles and exhibits unique spatial distributions. Croplands provide the basis for intensive arable production and grasslands constitute the primary resource base for Switzerland's ruminant livestock sector. From 1950 onwards, agricultural intensification generated substantial productivity gains but also exacerbated environmental problems (Spiess, 2011). Nitrate leaching from farmland, for example, has increased N loads not only to local lakes and rivers (Gächterr et al., 2004; Müller et al., 2022), but also to the river Rhine, contributing to eutrophication in the North Sea (Prasuhn and Sieber, 2005). These adverse impacts prompted revisions of Swiss agricultural and agri-environmental policies to mitigate N pollution (Decrem et al., 2007; Herzog et al., 2008).
In this study, we used the biogeochemical model DayCent to simulate N cycling for agricultural land, with Swiss agriculture as an exemplary case. We assembled spatially explicit datasets of N inputs, meteorological variables, soil properties, land use, crop rotations and local management practices at the national scale. Applying DayCent at a high spatial resolution of 1 km × 1 km, we constructed N budgets and calculated soil N changes for two major agricultural ecosystems (croplands and grasslands; hereafter “grasslands” means “managed meadow”) over the period 1981–2020. We developed an informative analytical diagram that holistically evaluates NUE, N losses and soil N stocks. We found improved NUE and decreased N losses, as well as a heightened risk of soil N depletion in Swiss agriculture. This result points to the need for a more integrated N assessment to balance agroecosystem performance, losses to the environment and soil resource maintenance at regional and national scales.
2.1 DayCent model
DayCent is a process-based biogeochemical model that simulates the dynamics of both nitrogen and carbon cycling across various terrestrial ecosystems (Del Grosso et al., 2001). DayCent integrates environmental drivers to predict plant growth, soil organic matter (SOM) decomposition, trace gases and changes in other ecosystem parameters within the soil-plant-atmosphere continuum on a daily timestep. With intermediate complexity and the feasibility to be calibrated to local conditions, DayCent is widely used for evaluating ecosystem responses to land use change, management practices and climate variability (Del Grosso et al., 2005; Gurung et al., 2020, 2021; Laub et al., 2024; McClelland et al., 2025).
In this study, we used the DayCent17centEVI model version to quantify N budgets for two Swiss agricultural ecosystems: (a) croplands and (b) grasslands. The SOM in DayCent is split into three compartmental pools, namely active, slow and passive, with different potential decomposition rates. These SOM pools receive plant materials from above and belowground litter. Simulated N flows follow C flows depending on the C:N ratio which varies from 15 to 3 for the active pool, from 20 to 12 for the slow pool, and from 10 to 7 for the passive pool. For newly formed surface biomass, the C:N ratio is a function of the N content of the decomposed material, with higher C:N ratio for lower N content. The model accounts for both organic and mineral N and the relevant processes, including mineralization–immobilization turnover, nitrification and denitrification. These transformations are regulated by environmental factors such as temperature, soil moisture, soil texture, SOM content and oxygen availability. Nitrogen inputs are modelled through simulated atmospheric deposition and biological N fixation, and through input data to the model that record application of both organic and synthetic fertilizers. Simulated losses are outgassing of N2O, N2, NO and NH3 to the atmosphere and leaching (e.g., nitrate and organic forms). It is crucial to acknowledge that NH3 volatilization in DayCent is not sophisticated, which may lead to underestimation of NH3 emissions and overestimation of nitrate leaching.
DayCent enables explicit parameterization of agricultural management practices. It can dynamically accommodate crop systems (e.g., crop types and rotations), cultivation, irrigation, nutrient inputs (e.g., fertilization) and harvest, with the timing of each management event specified on a daily basis in simulations.
2.2 Model input data
DayCent is driven by weather data and soil data. Three basic meteorological variables include: daily maximum and minimum temperature, and precipitation. We used the 1 km × 1 km resolution weather data from the Federal Office of Meteorology and Climatology (MeteoSwiss, 2025). Inputs of site-specific soil properties such as soil texture (sand, silt, clay), soil pH and SOM were obtained from a recently developed national soil database by the National Competence Center for Soil (“Kompetenzzentrum Boden”) (Stumpf et al., 2024). Soil properties originally available at 30 m × 30 m resolution were aggregated to the 1 km model grid using conservative remapping implemented in the Climate Data Operator (CDO) (Schulzweida, 2023). This approach preserves area-weighted means and is useful in upscaling environmental datasets to coarser modelling resolutions (Hashimoto et al., 2025). Because the model operates at 1 km spatial resolution, harmonization of all input datasets was required to ensure consistency across input variables. While this aggregation inevitably smooths fine-scale heterogeneity in soil properties, the most prominent features of the geospatial distribution of soil variables at the national scale are preserved. Other required soil properties including bulk density, field capacity, wilting point and saturated hydraulic conductivity were determined by the pedotransfer functions embedded in the DayCent utility programme (Saxton et al., 1986; Saxton and Rawls, 2006), and root fractions were used the default values in DayCent.
In addition to meteorological and soil inputs, DayCent also needs data of land use and management practices. Our modelling simulations focused on two major Swiss land use categories: croplands and grasslands. Historical land use and areas of croplands and grasslands were from Federal Statistical Office (“Bundesamt für Statistik”, BFS) (BFS, 2024). Grasslands in Switzerland are categorised into three major types: (1) meadows, (2) pastures and (3) summer pastures. In this study, we focused on permanent meadows, which are managed for grass production for livestock feed. According to the definitions used for agricultural subsidies and the national fertilizer guidelines (Sinaj et al., 2017), meadows are further divided into intensively-managed, less intensively-managed and extensively-managed meadows, depending on the intensity of management practices (fertilization level and mowing events). These categories correspond to categories defined for agricultural subsidies and the national fertilizer guidelines (Sinaj et al., 2017), meaning category-specific data are available. Annual areas of different cropping systems and grasslands are provided for 24 agri-climatic zones. These are defined in Wüst-Galley et al. (2020) and have similar broad climatic conditions and agricultural management; they incorporate geographical (i.e., regions) as well as topographical differences in Switzerland (i.e., valley, hill, mountain and summer pastures).
A crucial input for DayCent simulations is the amount of C and N applied to soils from both organic and synthetic fertilizers. Organic fertilizers comprise animal manure as well as compost, sewage sludge and digestates as assessed by the Swiss National Greenhouse Gas Inventory (NIR, https://www.bafu.admin.ch/bafu/en/home/topics/climate/state/data/climate-reporting/ghg-inventories/latest.html, last access: 28 October 2024). Animal manure, which represents by far the largest amount of organic fertilizer, is assessed considering livestock numbers, livestock species specific excretion rates for C and N and respective losses from stables and manure storage systems. The allocation of organic fertilizers to different crops or grasslands is carried out in according with the following factors, as described in Wüst-Galley et al. (2020): the tendency of farms to apply manure, slurry or poultry manure to different broad crop groups, from Kupper et al. (2022); the relative fertilizer requirements of different grassland types, across different elevation zones, as indicated in Sinaj et al. (2017). For synthetic fertilizer, we used the fertilizer import data from the NIR. We assumed that all imported fertilizer was applied to the fields in the corresponding year as ammonium nitrate which is the major type of synthetic fertilizer. Other management data such as cultivation, planting, fertilization and harvest were taken from the national “Principles for the fertilisation of agricultural crops in Switzerland” book (Sinaj et al., 2017) and modelling setups (Lee et al., 2020b, a).
During the 1990s in Switzerland, important nationwide agri-environmental policy reforms introduced subsidy schemes in order to mitigate nutrient losses. Meanwhile, there was a significant increase in livestock productivity (i.e., milk yield) during this period and in line with decreased livestock population without lowering production, resulting in decreased N inputs from livestock manure. These led to substantial reductions in synthetic and organic fertilizer application to agricultural soils. The fertilizer input data we used reflect these changes. In addition, the use of cover crops also forms part of the agri-environmental policy that was implemented in the late 1990s, with the aim of reducing soil erosion and nutrient leaching, particularly in winter months. However, this potentially relevant measure was not covered by our study due to insufficient statistical data. Other agricultural practices were also assumed to remain unchanged.
2.3 Model simulations
The DayCent model that we used has been calibrated and tested by previous modelling studies (Dos Reis Martins et al., 2022, 2024; Necpalova et al., 2018). We used reported values of parameters controlling plant growth (both C and N yields) and N processes (e.g., nitrification and denitrification) by these studies which evaluated against measurement data from several Swiss long-term experiments for croplands (Emmel et al., 2018; Hüppi et al., 2015; Krauss et al., 2017; Mayer et al., 2015) and Swiss Fluxnet sites for grasslands (Feigenwinter et al., 2023b). In this study, the regional simulations for Switzerland were performed at 1 km × 1 km grids for the time period from 1981 to 2020. In total, there are 14 926 and 36 140 simulated grids for croplands and grasslands, respectively. A complete round of DayCent simulations had two stages: historical spin-up and present baseline. We followed Lee et al. (2020a, b) and assumed five spin-up phases characterised in Swiss agriculture: (1) native forest (between 0 and 1399; until equilibrium), (2) emergence of agriculture (between 1400 and 1750), (3) agricultural revolution (between 1751 and 1850), (4) agricultural intensification (between 1851 and 1950), and (5) modern agriculture (from 1950 to 1980). After the historical runs, DayCent was kept running for the studied time period (i.e., 1981 to 2020).
2.3.1 Simulations for croplands and crop rotation scheme
We included 15 crops in the simulations for croplands, which together account for over 95 % of Swiss croplands. These crops are grass-clover ley (i.e., temperate grassland in crop rotation), winter wheat, silage maize, winter barley, rapeseed, sugar beet, grain maize, potato, triticale, spelt, sunflower, pea, rye, soybean and oat. Among these simulated crops, grass-clover ley and cereals (winter wheat, maize, barley) account for a dominant share of over 60 % of cropland areas. In Switzerland, crop rotation is a common practice that is based on pedoclimatic conditions and production need. For example, a forage-crop rotation with 2 years of temporary grass followed by maize and winter wheat in the next 2 years is a common sequence. However, national crop rotations data at fine spatial scale (e.g., 1 km × 1 km) are not currently available. Therefore, we derived the crop rotations using the probability scheme in Lee et al. (2020a, b) for the entire country, which is developed from survey, existing literature, long-term experiments in the country and expert judgement (see Table S1 in the Supplement). This crop rotation scheme incorporates nationwide guidance and recommendations for “best practice” aiming to avoid harmful development such as pests, diseases or pathogens. On the other hand, it also reflects what happened in real farming practices that were sourced from surveys of farmers. The purpose of developing such a scheme is to ensure that our simplified rotation in the model can replicate the reality as much as possible, given the limited information and resources. We then used this probability rotational scheme to predict sequences and determine the most likely crop rotation through an iterative process, while ensuring our modelling results for the areas of crops consistent with statistical data at both the national level and regional level (i.e., 24 agro-climatic zones) (Wüst-Galley et al., 2020). This approach distributed the crop types following a ranked order based on crop areas, i.e., the crop type with the largest area is selected first, then the crop type with the second largest area, until all crop types are selected.
2.3.2 Simulations for grasslands
For grassland (meadow) simulations, the number of mowing events and timing were sourced from grassland-use intensity maps for Switzerland (Weber et al., 2024). These grassland-use intensity maps were generated from Sentinel-2 and Landsat 8 satellite data for Switzerland using a rule-based algorithm that identifies drops in vegetation index time series (Weber et al., 2024). Since these maps were mainly produced for 2018–2021, we chose the data of year 2020 as the baseline because year 2020 has been assessed by independent publicly available reference data. In principle, fertilization levels such as number of fertilization and application rates are influenced by the management intensity (more mowing events, higher fertilizer inputs) and negatively related to altitude, with less fertilizer inputs in more elevated places (Sinaj et al., 2017). Fertilizer application is assumed to take place within a 2-week window after a mowing event. We developed a fertilization timing scheme based on management practices between 2005 and 2020 of an intensively-managed grassland reported by Feigenwinter et al. (2023a, b) and Hörtnagl et al. (2025) and applied to the whole country (see Fig. S1 in the Supplement). Grazing is not simulated in this study, of which deposited livestock excretion has been accounted in the C and N data we used.
2.3.3 Sensitivity tests and scenario simulations
To better understand the sensitivity of simulated N dynamics to environmental conditions, we conducted a series of one-factor-at-a-time sensitivity tests using the baseline simulation as a reference. To assess the influence of meteorological drivers, we applied uniform changes of (i) ± 2 °C in air temperature and (ii) ± 20 % in precipitation, while keeping all other inputs unchanged. Air temperature and precipitation were selected because they are the primary meteorological drivers controlling plant growth and soil C and N cycling in DayCent.
In addition, we performed three fertilizer management scenarios: (i) replacement of all organic fertilizer with synthetic fertilizer while maintaining the same total N application rate, (ii) replacement of all synthetic fertilizer with organic fertilizer while maintaining the same total N application rate, and (iii) a 20 % reduction in both synthetic and organic fertilizer application rates. Each scenario was simulated independently, with all other model inputs and management practices identical to those of the baseline simulation. Changes in total N input, N harvest, NUE, total N losses and soil N stock change were evaluated relative to the baseline simulation.
2.4 Nitrogen budgets construction
We analysed total N inputs, N outputs, N surplus, NUE, N losses and soil N balance from the DayCent simulations, and quantified N budgets. The total N inputs (Nin) to agricultural systems (croplands and grasslands) include organic (Norg) and synthetic fertilizers (Nsyn), biological N fixation (NBNF) and atmospheric N deposition (Ndep). As mentioned in Sects. 2.1 and 2.2, BNF (including both non-symbiotic soil N fixation and symbiotic plant N fixation) and atmospheric deposition are simulated by the DayCent model, whereas organic and synthetic fertilizers are model inputs.
Total N outputs (Nout) include N yields of harvested products (Nyield) and all forms of N losses (Nloss).
N surplus is total N inputs minus N yields.
The NUE is defined as the harvested crop or grass N (Nyield) divided by total N inputs (Lassaletta et al., 2014; Zhang et al., 2021)
For N losses (Nloss), we included gaseous losses (Ngas; NH3, NO, N2O and N2) and leaching (Nleaching; e.g., nitrate and organic N compounds)
The soil N balance (Δ soil N) is calculated by subtracting all N outputs including harvested crop N and N losses from total N input
Specifically, N flows expressed as percentages of total N inputs were calculated as:
Similarly, the relative changes in soil N stock were calculated as:
These results are shown in Figs. 5 and 6.
2.5 Uncertainty evaluation
We used a Monte Carlo ensemble approach (200 iterations) to quantify the uncertainty in simulated N losses, NUE and soil N balance arising from key processes represented in DayCent. Nine model parameters regulating N leaching, nitrification and denitrification were selected for the analysis (details are presented in Table S2 in the Supplement). Parameter ranges were defined using probability distributions based on the default values and calibrated ranges reported in previous studies (Dos Reis Martins et al., 2022, 2024). Because these parameters also influence plant N uptake through their effects on N loss pathways, plant-specific parameters were not evaluated separately.
To reduce the computational burden associated with the large number of simulations, we created a representative subset of grid cells using Conditioned Latin Hypercube Sampling (cLHS). This subset (n=400) preserved the spatial variability of climate, soil properties and fertilization intensity across Switzerland. For each Monte Carlo iteration, DayCent was run for all selected grid cells using a unique set of parameter values. Simulated N losses, NUE and soil N balance were then calculated and compared with the baseline simulation. Uncertainty in national-scale estimates was quantified from the distribution of ensemble results and reported as 95 % confidence intervals (CI).
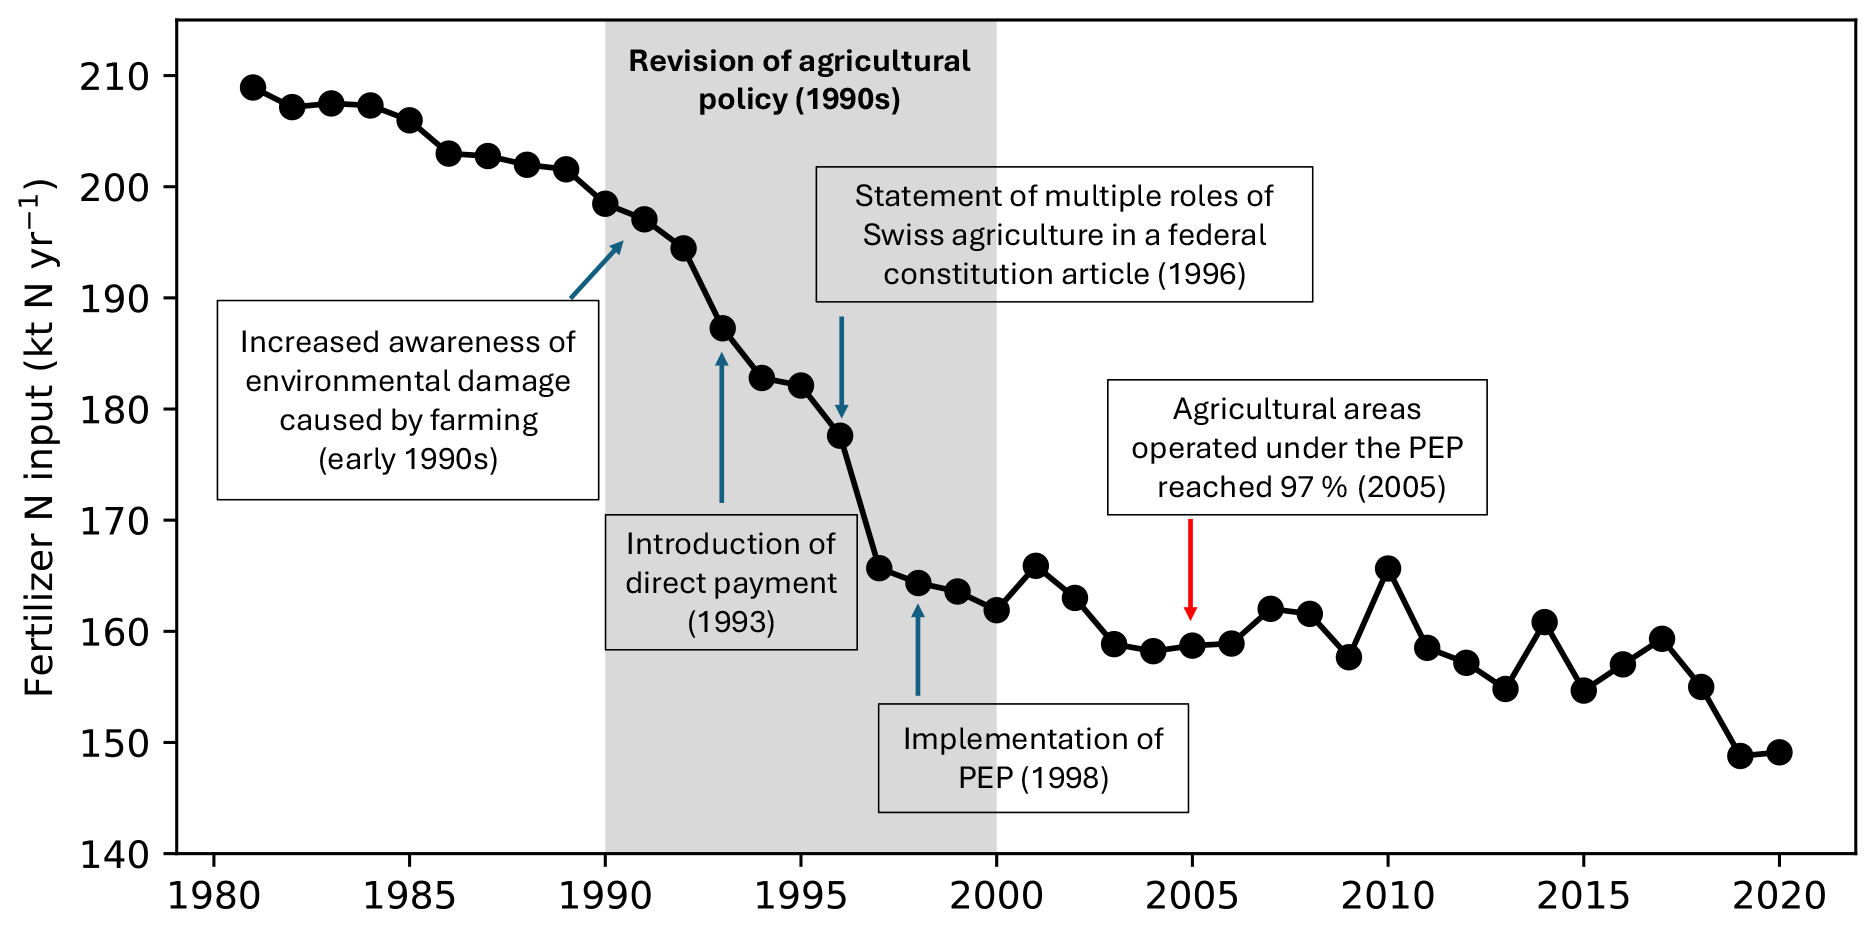
Figure 1Nitrogen inputs from fertilizers to agricultural land in Switzerland. Fertilizers include livestock manure and synthetic fertilizers. Values from compiled datasets (see Methods). Shaded grey area represents the period in the 1990s when national policies and measures were implemented in the agricultural sector. Important events are shown along the timeseries of fertilizer N inputs. Values in the parenthesis are corresponding years. Note that the y-axis starts from 140 kt N yr−1. PEP is Proof of Ecological Performance.
3.1 Nitrogen inputs through fertilization decreased in the 1990s
Our compiled N datasets show that livestock manure and synthetic fertilizers, the dominant N sources for crop and grass production in Switzerland, decreased substantially from 204 to 156 kt N yr−1 between the 1980s and the 2010s. This result reflects policy interventions introduced in the 1990s to reduce agricultural N losses. In Switzerland, this period marked a broader societal and political shift, moving priorities from a narrow focus on maximizing food production to more sustainable and environmentally responsible farming approaches. In 1993, agricultural policy was reframed (Decrem et al., 2007; Herzog et al., 2008; Spiess, 2011), with direct payments (subsidies) introduced within an agri-environmental scheme, replacing the earlier model of guaranteed government purchases (Herzog et al., 2008). Moreover, integrated and organic production systems were promoted by additional incentives, organic farming and other ecological programmes. The constitutional amendment in 1996 further reinforced this direction by formally recognizing the multiple roles of agriculture, including ecological stewardship. Cross-compliance were confirmed in 1998 through the Proof of Ecological Performance (PEP) (Decrem et al., 2007; Herzog et al., 2008; Spiess, 2011), which made direct payments conditional to farms maintaining balanced nutrient budgets. These reforms collectively led to a ∼ 25 % reduction in average synthetic N fertilizer consumption during the 1990s (Herzog et al., 2008), accompanied by a comparable decline in manure application due to decreased livestock numbers. By 2005, 97 % of agricultural land in Switzerland was reported being managed in accordance with PEP standards (Herzog et al., 2008).
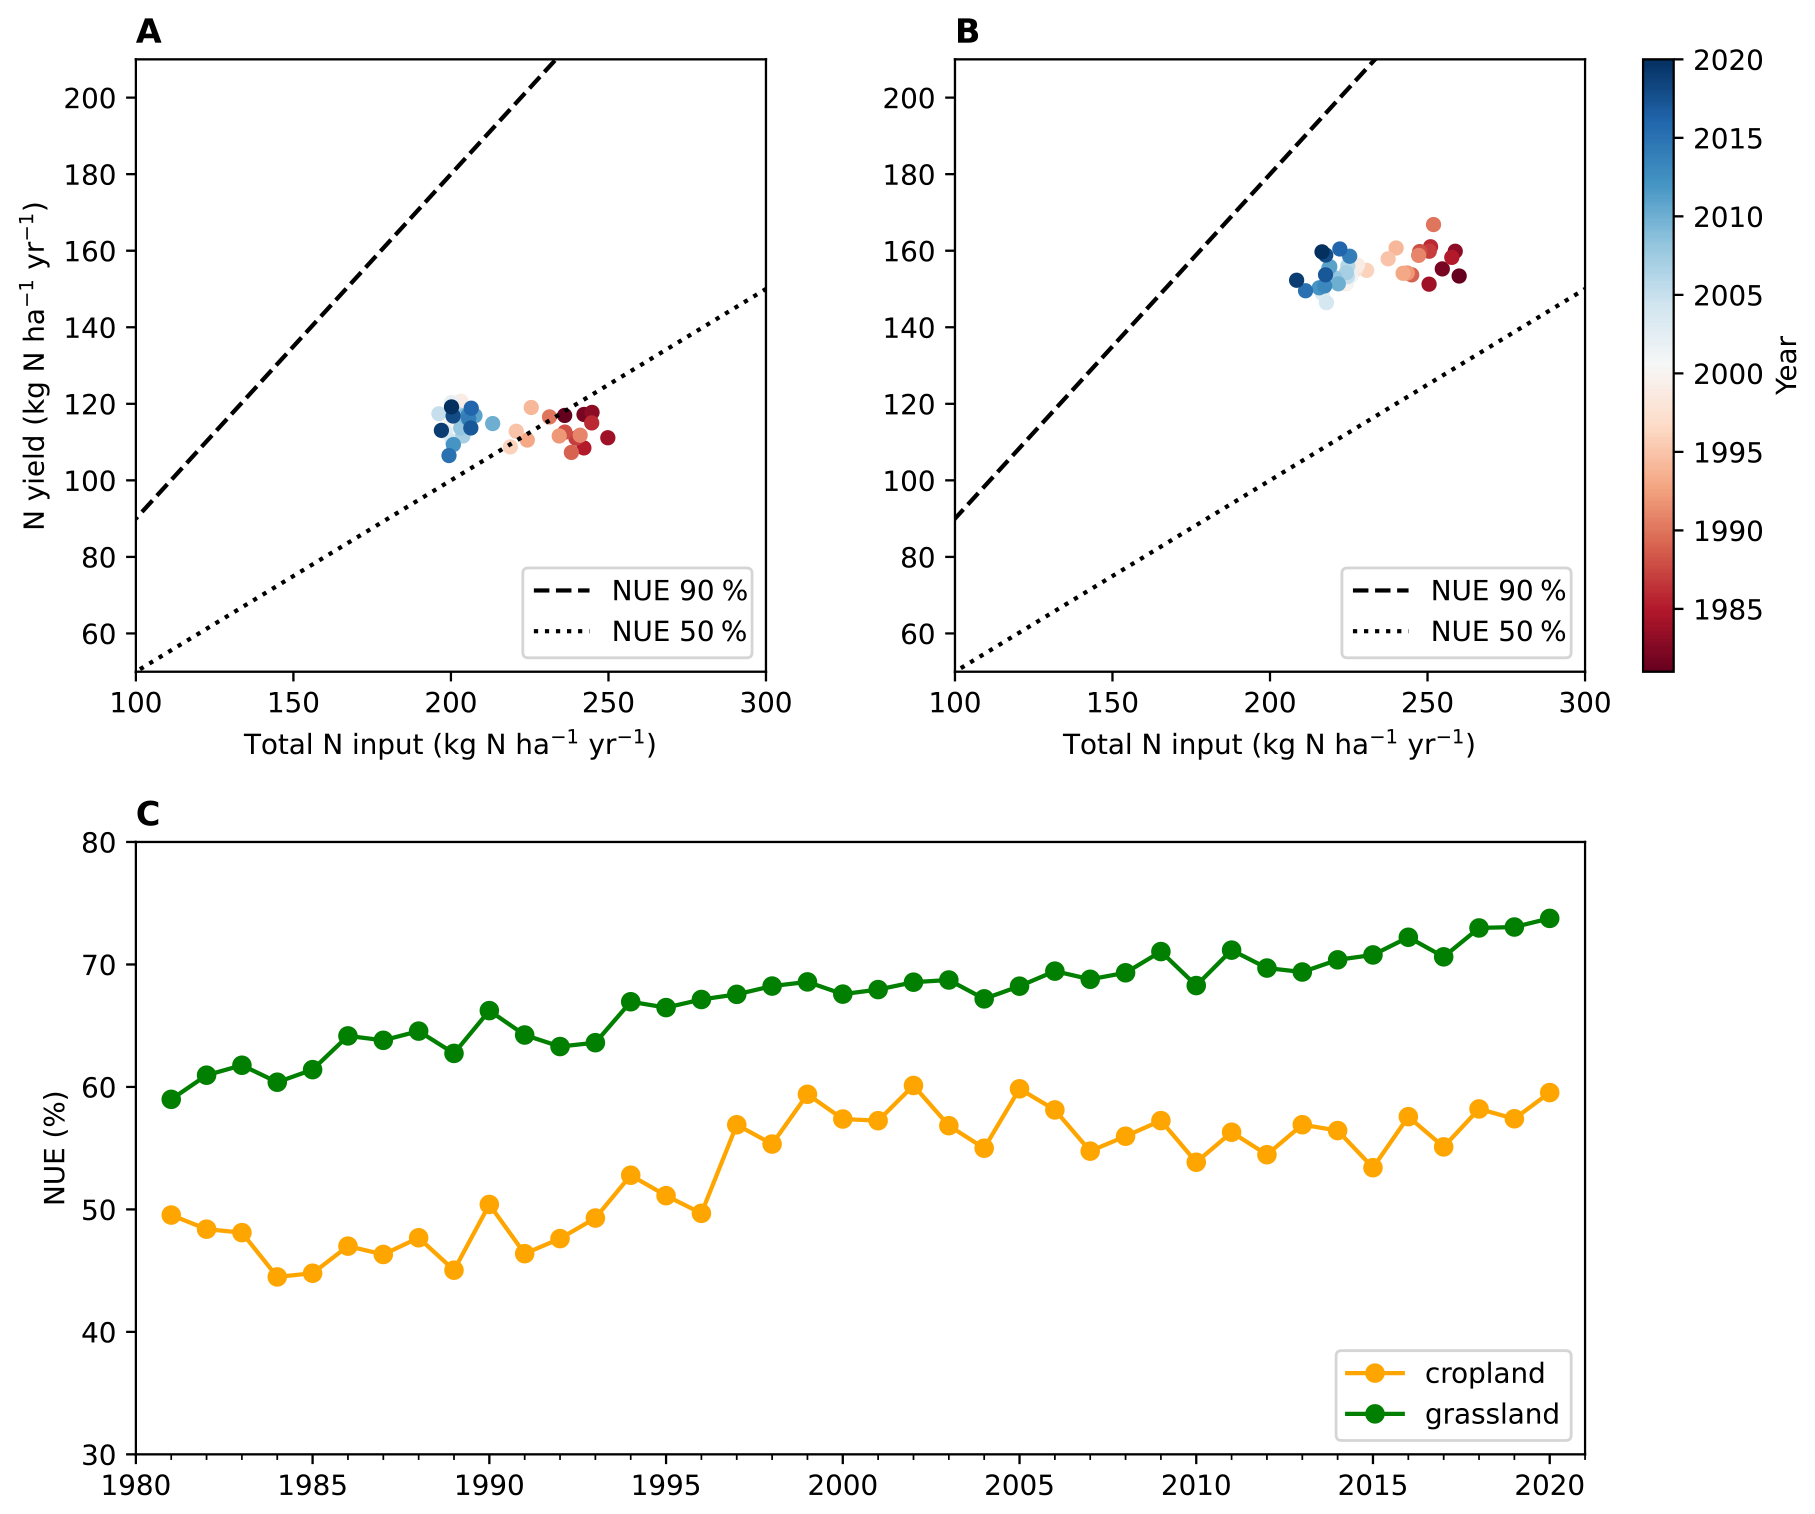
Figure 2Modelled annual mean total N input, N yield and NUE of Swiss croplands and grasslands from 1981 to 2020. Total N input and N yield of croplands (A) and grasslands (B). In panels (A) and (B), the dashed black lines and dotted black lines represent 90 % and 50 % NUE, respectively and the red-blue scale shows the year. Note the axes do not start from zero. (C) NUE of croplands (yellow) and grasslands (green). Note the y-axis starts from 30 %.
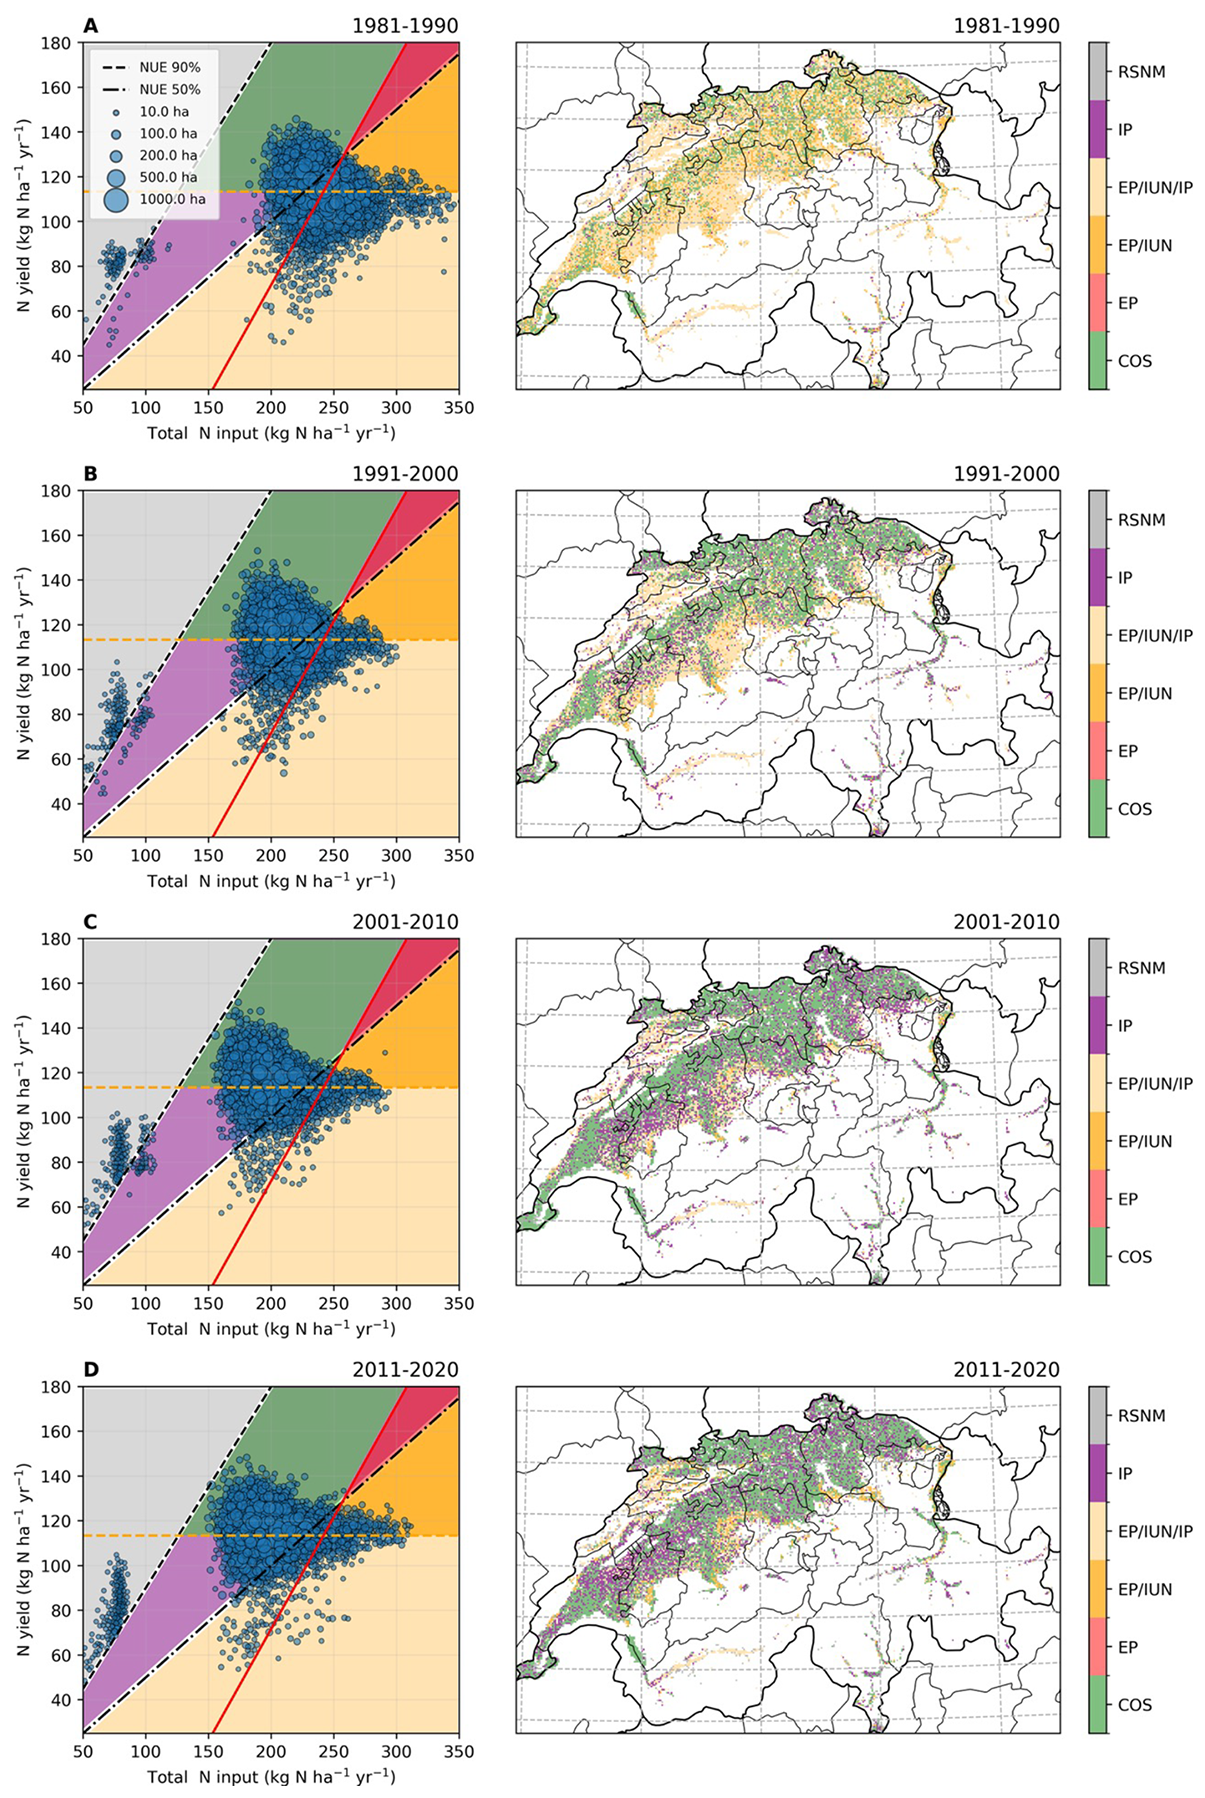
Figure 3The EUNEP Framework of the NUE indicator diagram of Swiss croplands and decadal geographical distributions of six categorised agricultural land. (A) 1981–1990, (B) 1991–2000, (C) 2001–2010, (D) 2011–2020. For the NUE diagram, the dashed black lines are 90 % NUE, and dotted black lines are 50 % NUE. The solid red lines and dashed orange lines represent desired maximum N surplus and desired minimum N yield, which are the mean values of simulated N surplus and N yield for each agroecosystem in the 1980s, which set goals for improvement in the following decades. Six regimes are (note the colour scheme is different from the originally proposed diagram; EU Nitrogen Expert Panel, 2016): characteristic operating space (COS – shaded green area), excessive pollution (EP – shaded red area), insufficient productivity (IP – shaded purple area), EP and inefficient use of nitrogen (EP/IUN – shaded orange area), EP/IUN/IP (shaded light yellow area), risk of soil nitrogen mining (RSNM – shaded grey area). The dark blue and light blue circles represent data from 1981–1990 and 2011–2020, respectively. The size of the circle is proportional to the summed area of croplands or grasslands that is aggregated by N yield and total N input (precision at 0.1 kg N ha−1), with legends shown in the figure.
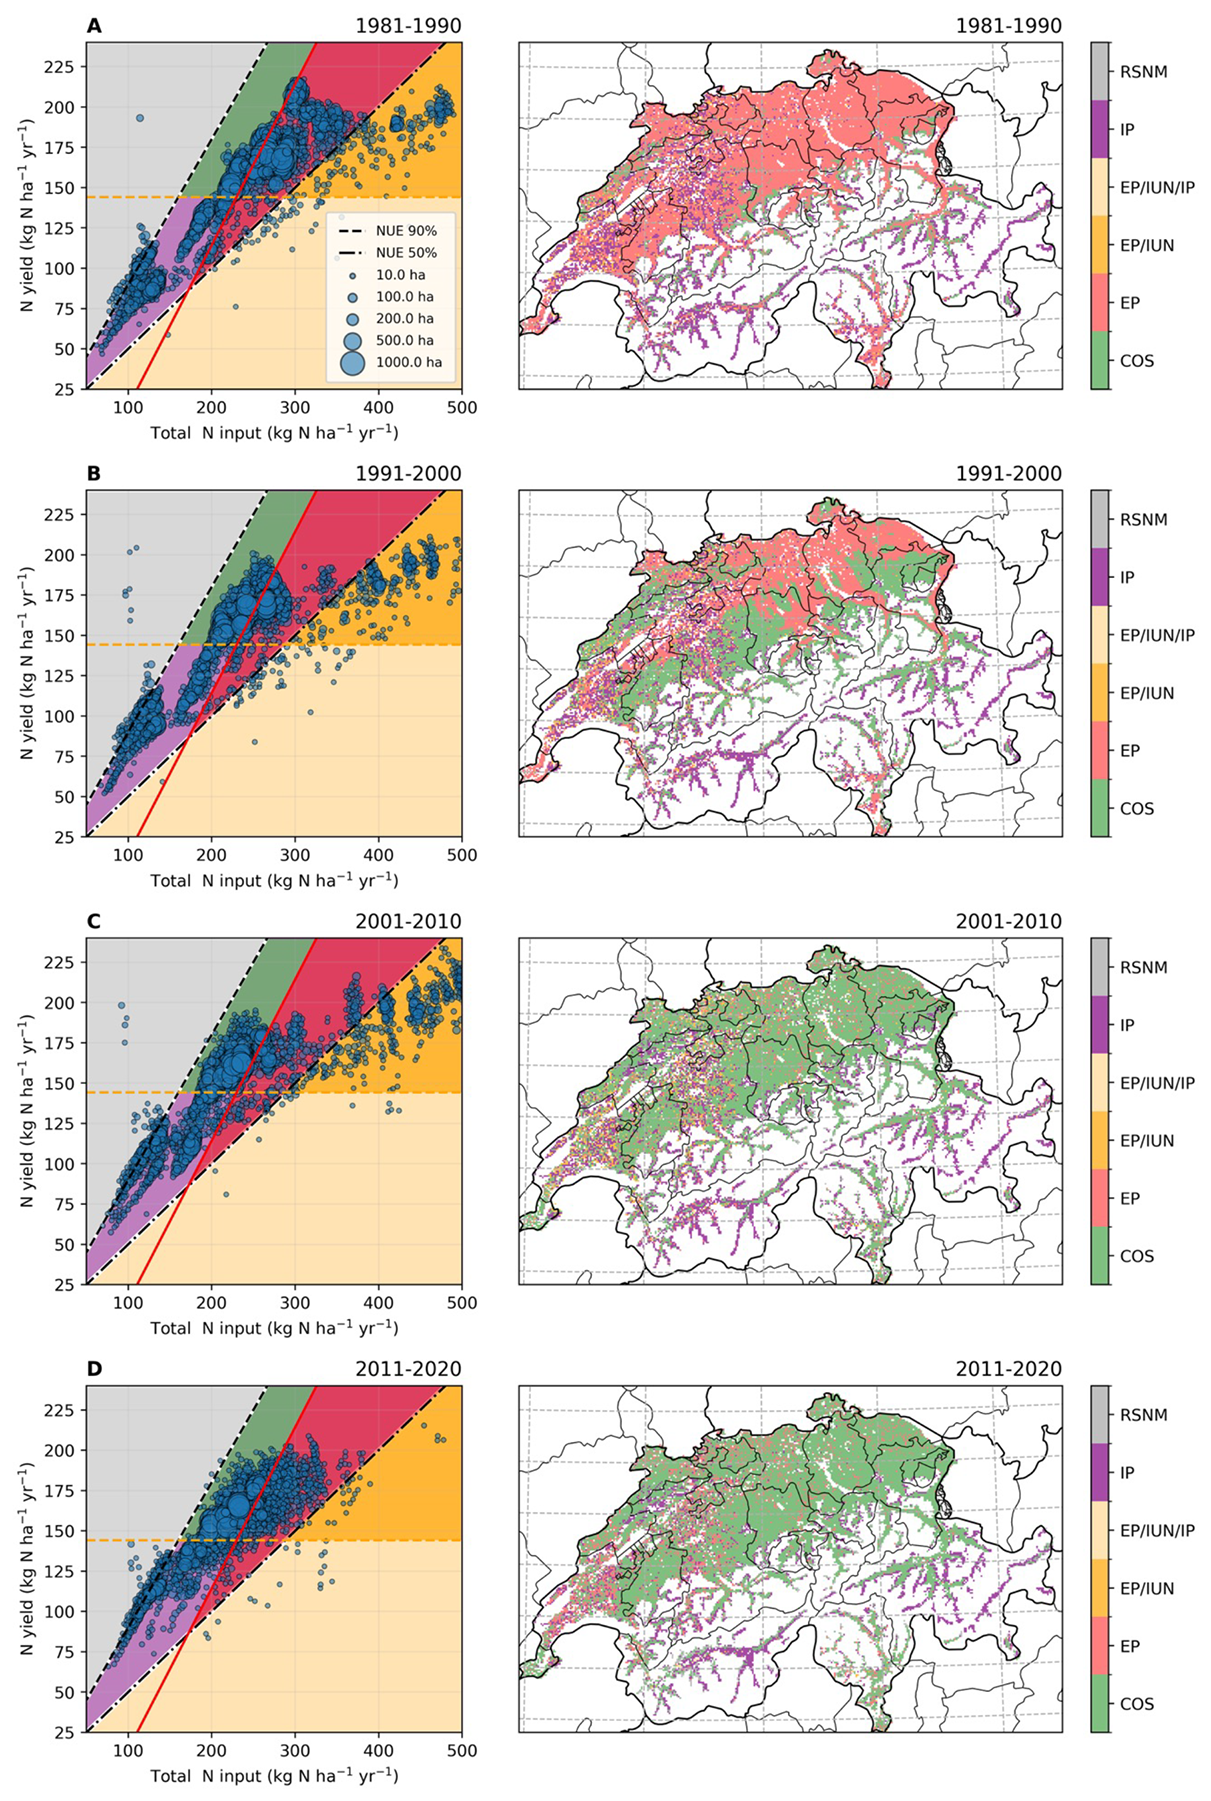
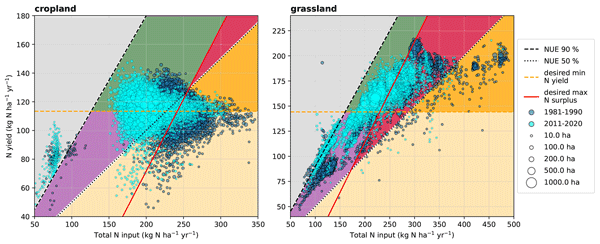
Figure 4The EUNEP Framework of the NUE indicator diagram of Swiss grasslands and decadal geographical distributions of six categorised agricultural land. (A) 1981–1990, (B) 1991–2000, (C) 2001–2010, (D) 2011–2020. Grasslands refer to managed meadows only, while managed pastures and summer pastures for grazing are not included.
3.2 Nitrogen use efficiency of croplands and grasslands
DayCent simulations suggest that NUE increased in both croplands and grasslands over the simulated 40 years. Nitrogen yields in both agricultural ecosystems remained stable from 1981 to 2020, despite a decline in N inputs, resulting in notable increases in NUE (Figs. 2–4). The model results are consistent with data reported by the Swiss Farmers' Union, which showed stable yields for major crops between 1991 and 2013 (Figs. S2 and S3 in the Supplement). The most pronounced improvements occurred in the 1990s, coinciding with the implementation of policy measures aimed at controlling agricultural N surplus. Grasslands show higher N yields and NUE compared with croplands, with a steady increasing trend with relatively low inter-annual variability (Fig. 2C).
Table 1Categorised agricultural land in Switzerland based on the EUNEP framework. Total areas of croplands and grasslands∗ and percentage of areas that belong to six EUNEP categories in the 1980s and 2010s. ∗ Grasslands refer to managed meadows only, while managed pastures and summer pastures for grazing are not included.

To further evaluate NUE, we applied the European Nitrogen Experts Panel (EUNEP) framework (Nitrogen Use Efficiency (NUE) an Indicator for the Utilization of Nitrogen in Food Systems) to assess improvements across four decades (from 1981 to 2020). The EUNEP framework classifies agricultural land into six regimes (Figs. 3, 4 and A1 in Appendix), with the characteristic operating space (COS) representing the optimal agri-environmental performance. COS is defined by: (1) efficient use of nitrogen (NUE between 50 % to 90 %), (2) satisfactory N yield, and (3) controllable N surplus (total N input minus N yield). Other regimes outside the COS correspond to distinct agri-environmental issues (see Fig. 3 caption for details). Our results indicate remarkable progress in both croplands and grasslands: in the 1980s, only 26 % of croplands and 15 % of grasslands fell within COS. By the 2010s, these percentages increased to 56 % and 77 %, respectively (Table 1). Extremely high N inputs to grasslands (> 350 ) were largely abolished after 2011 (Figs. 4D and A1B in Appendix), and COS areas expanded geographically (into the central plateau where intensive crop production takes place) between 1981 and 2020, gradually becoming the dominant regime in both ecosystems (Figs. 3 and 4).
Croplands and grasslands show distinct NUE patterns (Figs. 3, 4 and A1 in Appendix). In grasslands, N yields generally increase with N inputs, whereas in croplands, higher N inputs often lead to larger N surplus and excessive pollution (Fig. A1 in Appendix). Croplands exhibit mixed improvements: although COS areas expanded in the 2010s, areas with insufficient productivity (IP) also became more prevalent (Table 1), primarily due to a shift from the excessive pollution/inefficient use of nitrogen/insufficient productivity (EP/IUN/IP) regime to the IP regime. By contrast, grasslands exhibit more consistent improvement, with higher percentage of COS areas and reduced prevalence of EP, EP/IUN and IP regimes (Table 1).
Table 2Nitrogen budgets and soil N balance of Swiss agroecosystems. Nitrogen inputs include livestock manure, synthetic fertilizers, BNF and atmospheric N deposition. Nitrogen outputs include N removal through harvest, gaseous emissions and leaching. Soil N balance is N inputs minus N outputs. All variables are decadal mean for the 1980s and the 2010s, and have the unit . Values in parenthesis are uncertainty (95 % confidence interval) due to model parameters estimated from the Monte Carlo approach (200 iterations). ∗ Grasslands refer to managed meadows only, while managed pastures and summer pastures for grazing are not included.

Risk of soil nitrogen mining (RSNM) is considered negligeable (< 1 %) across Switzerland according to the EUNEP framework (Figs. 3, 4, and A1 in Appendix and Table 1). A distinct cluster of cropland points shows low total N inputs (50–100 ) but very high NUE (> 90 %) (Figs. 3 and A1A in Appendix). In the simulations this pattern reflects land use changes. Throughout the whole simulation period, if land use change took place, we assumed in the model that these areas were covered by grass-clover mixtures during the non-cropland years. This assumption keeps the model running in a consistent way. Fertilization was assumed to be absent for these non-cropland vegetated periods, with N inputs only from BNF and atmospheric deposition. Consequently, N yields are low because of no additional anthropogenic N sources, while NUE is high, reflecting efficient N use under near-natural conditions.

Figure 5Spatial maps of N budgets and soil N balance of Swiss croplands over 1981–2020. (A) total N input, (B) fertilizer N including manure and synthetic fertilizers, (C) atmospheric N deposition, (D) BNF, (E) NUE, (F) N leaching, (G) gaseous emissions, (H) soil N balance. Total N inputs have the unit , and other variables are expressed as percentage relative to total N inputs (note the difference in scales). See Fig. S6 in the Supplement for maps showing absolute values.
3.3 Nitrogen losses and soil nitrogen stock changes
Aggregated N losses (gaseous emissions and leaching) from Switzerland's croplands decreased markedly over the past four decades, from 131 in the 1980s to 100 in the 2010s (Table 2 and Fig. S4A in the Supplement), with leaching accounting for ∼ 80 % of total losses and for more than 40 % of total N inputs (Fig. 5F). By comparison, N losses from grasslands are roughly half as much as croplands (Table 2 and Fig. S4A in the Supplement), but only decreased slightly, from 58 to 55 , despite a substantial reduction in fertilizer inputs.
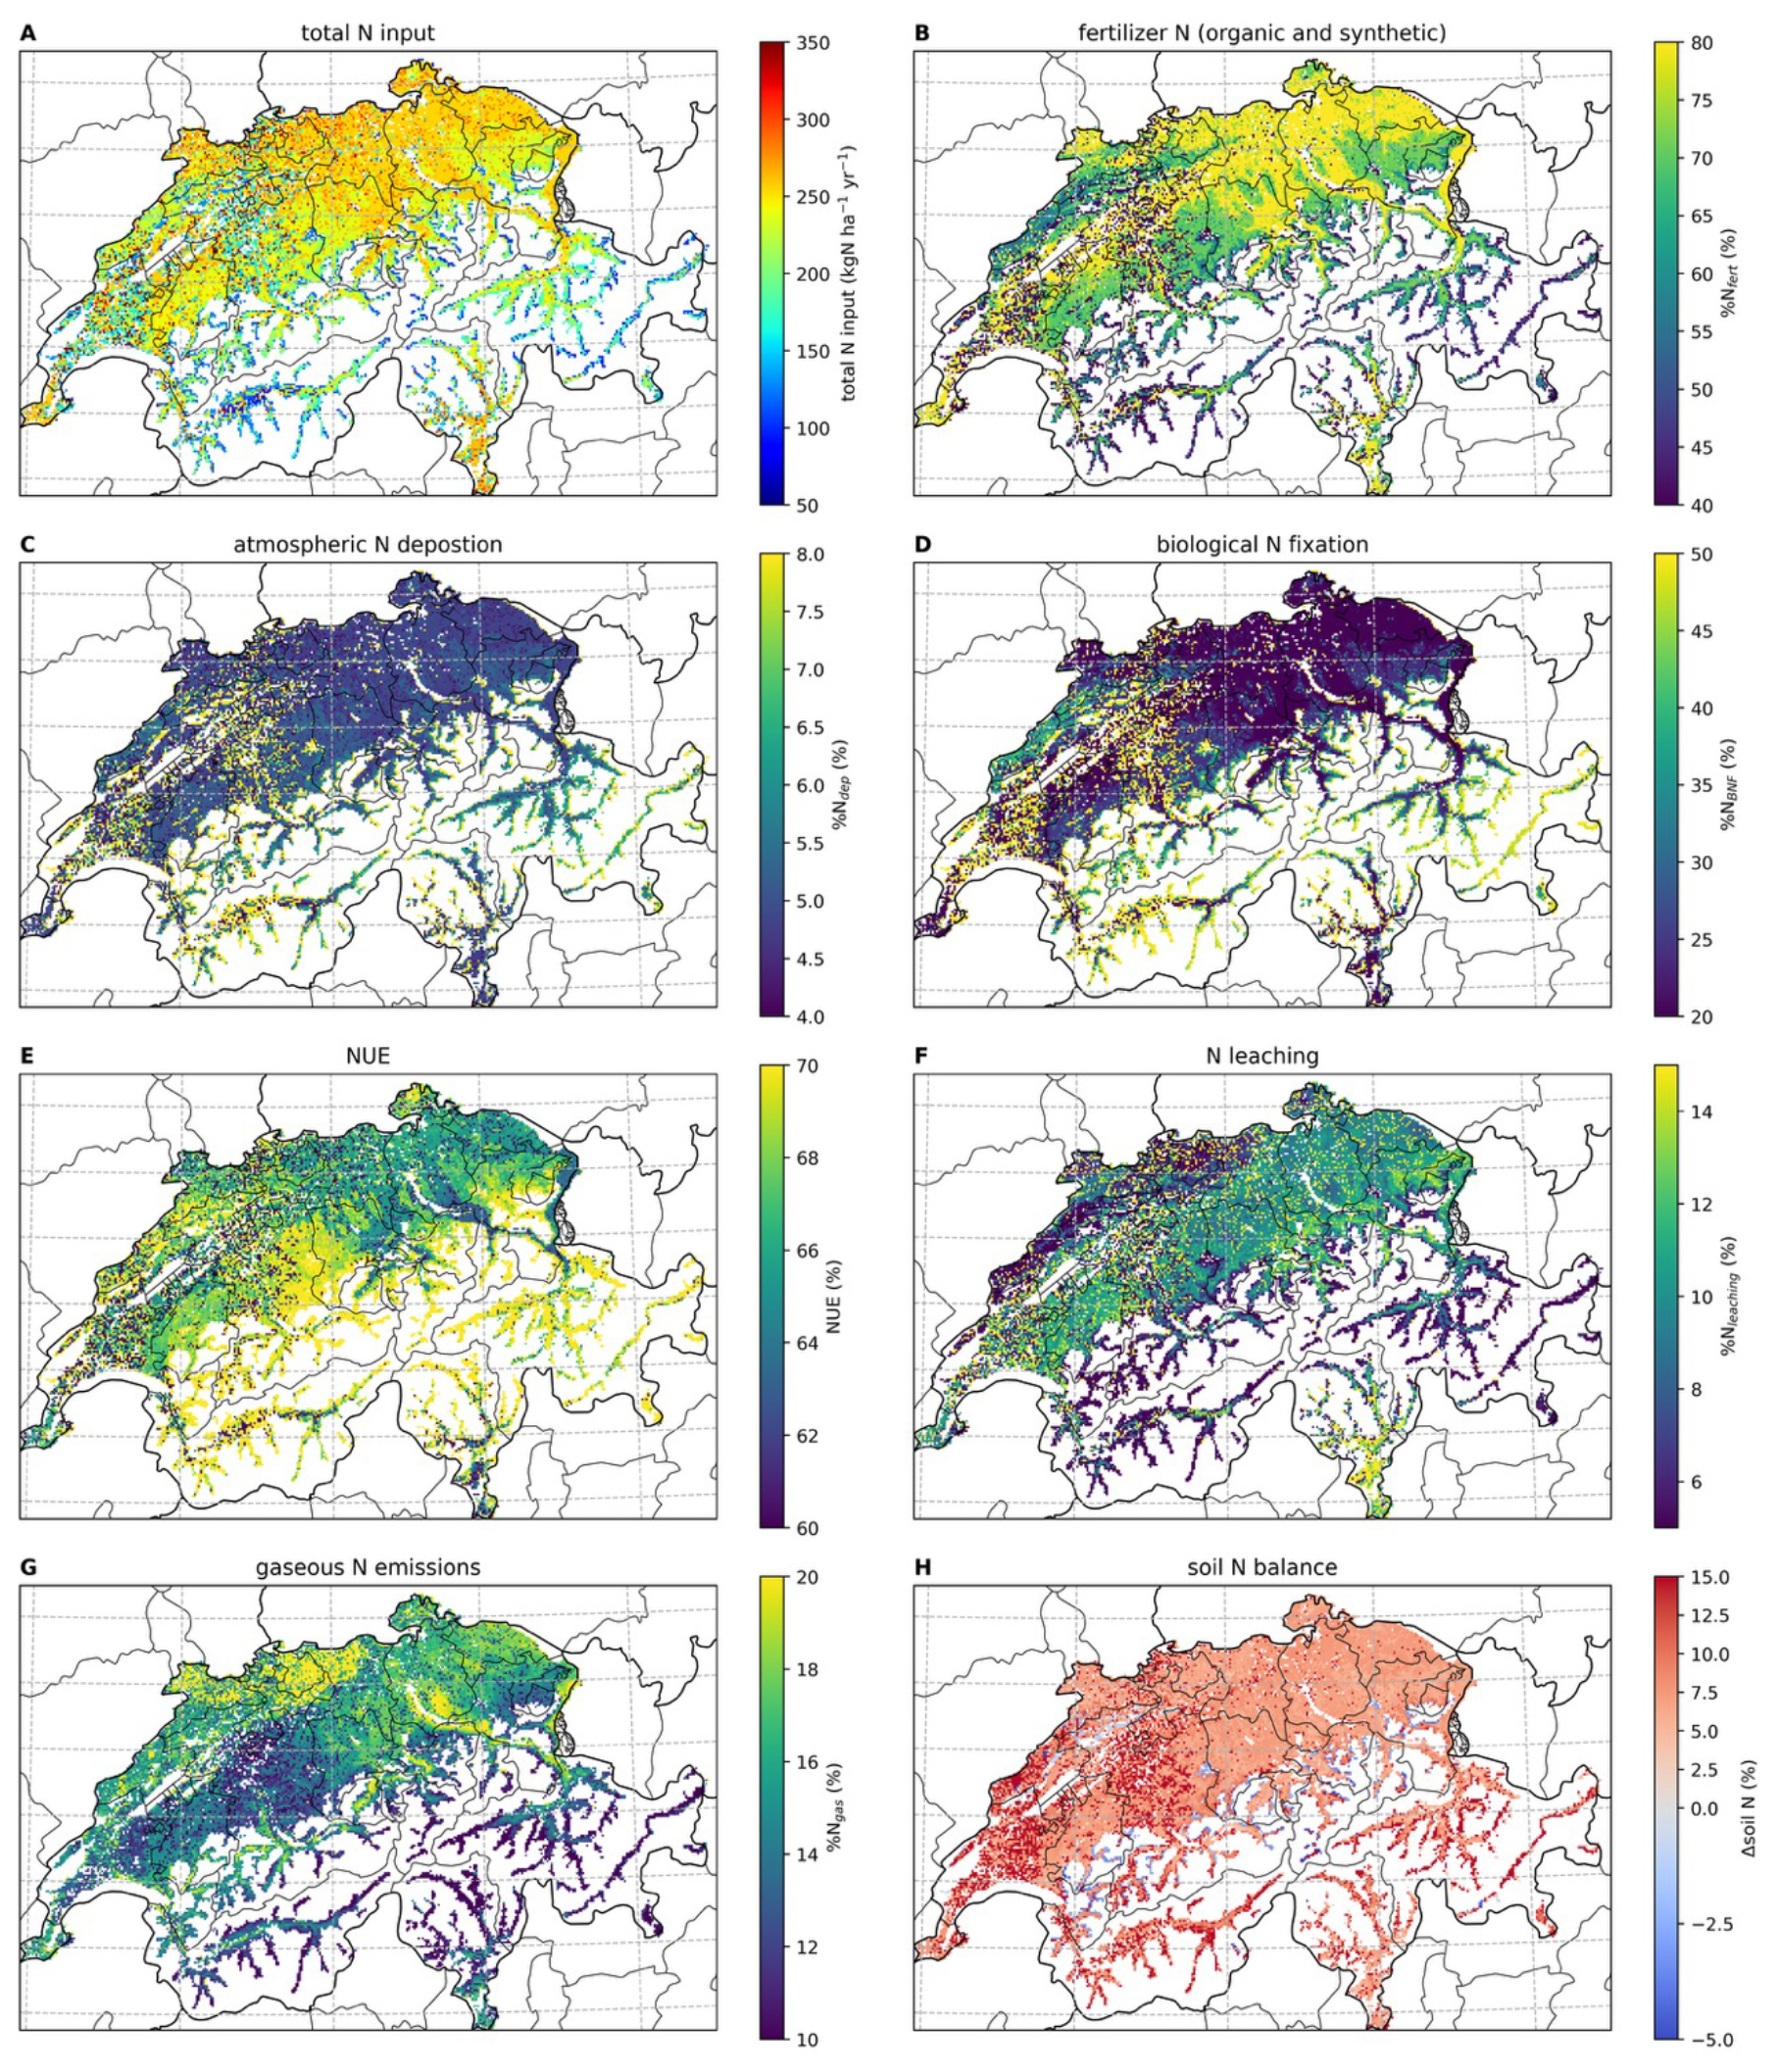
Figure 6Spatial maps of N budgets and soil N balance of Swiss grasslands over 1981–2020. (A) total N input, (B) fertilizer N including manure and synthetic fertilizers, (C) atmospheric N deposition, (D) BNF, (E) NUE, (F) N leaching, (G) gaseous emissions, (H) soil N balance. Total N inputs have the unit , and other variables are expressed as percentage relative to total N inputs (note the difference in scales). See Fig. S7 in the Supplement for maps shown absolute values.
Soil N stock dynamics of croplands and grasslands show contrasting characteristics (Fig. S4B in the Supplement). Widespread soil N depletion is found in croplands (Fig. 5H), resulting from larger N outputs (through harvest and losses) than inputs (as described in Methods). It is estimated that croplands have lost a cumulative 537 kg N ha−1 between 1981 and 2020. The most rapid depletion at −23 occurred between 1995 and 2011. Long-term field monitoring also shows soil N depletion at several arable sites (Fig. S5 in the Supplement). At the same time, nationwide long-term monitoring of soil C stocks reported that topsoil (0–20 cm) total organic carbon (TOC) in Swiss croplands have declined from 62 to 55 t TOC ha−1 between 1985–1989 and 2015–2019 (Wollmann et al., 2025). These substantial decreases in soil TOC over time may indirectly provide some evidence for accompanied soil N depletion as pointed out by our modelling results. By contrast, grassland soils showed positive N balance (Fig. 6H) and accumulated 728 kg N ha−1 over the same period. The accumulation was the fastest in the 1980s and then gradually slowed down. In the final 5 years of the simulations, the soil N stocks in both ecosystems stabilized, suggesting that national mean soil N pools are approaching an equilibrium.
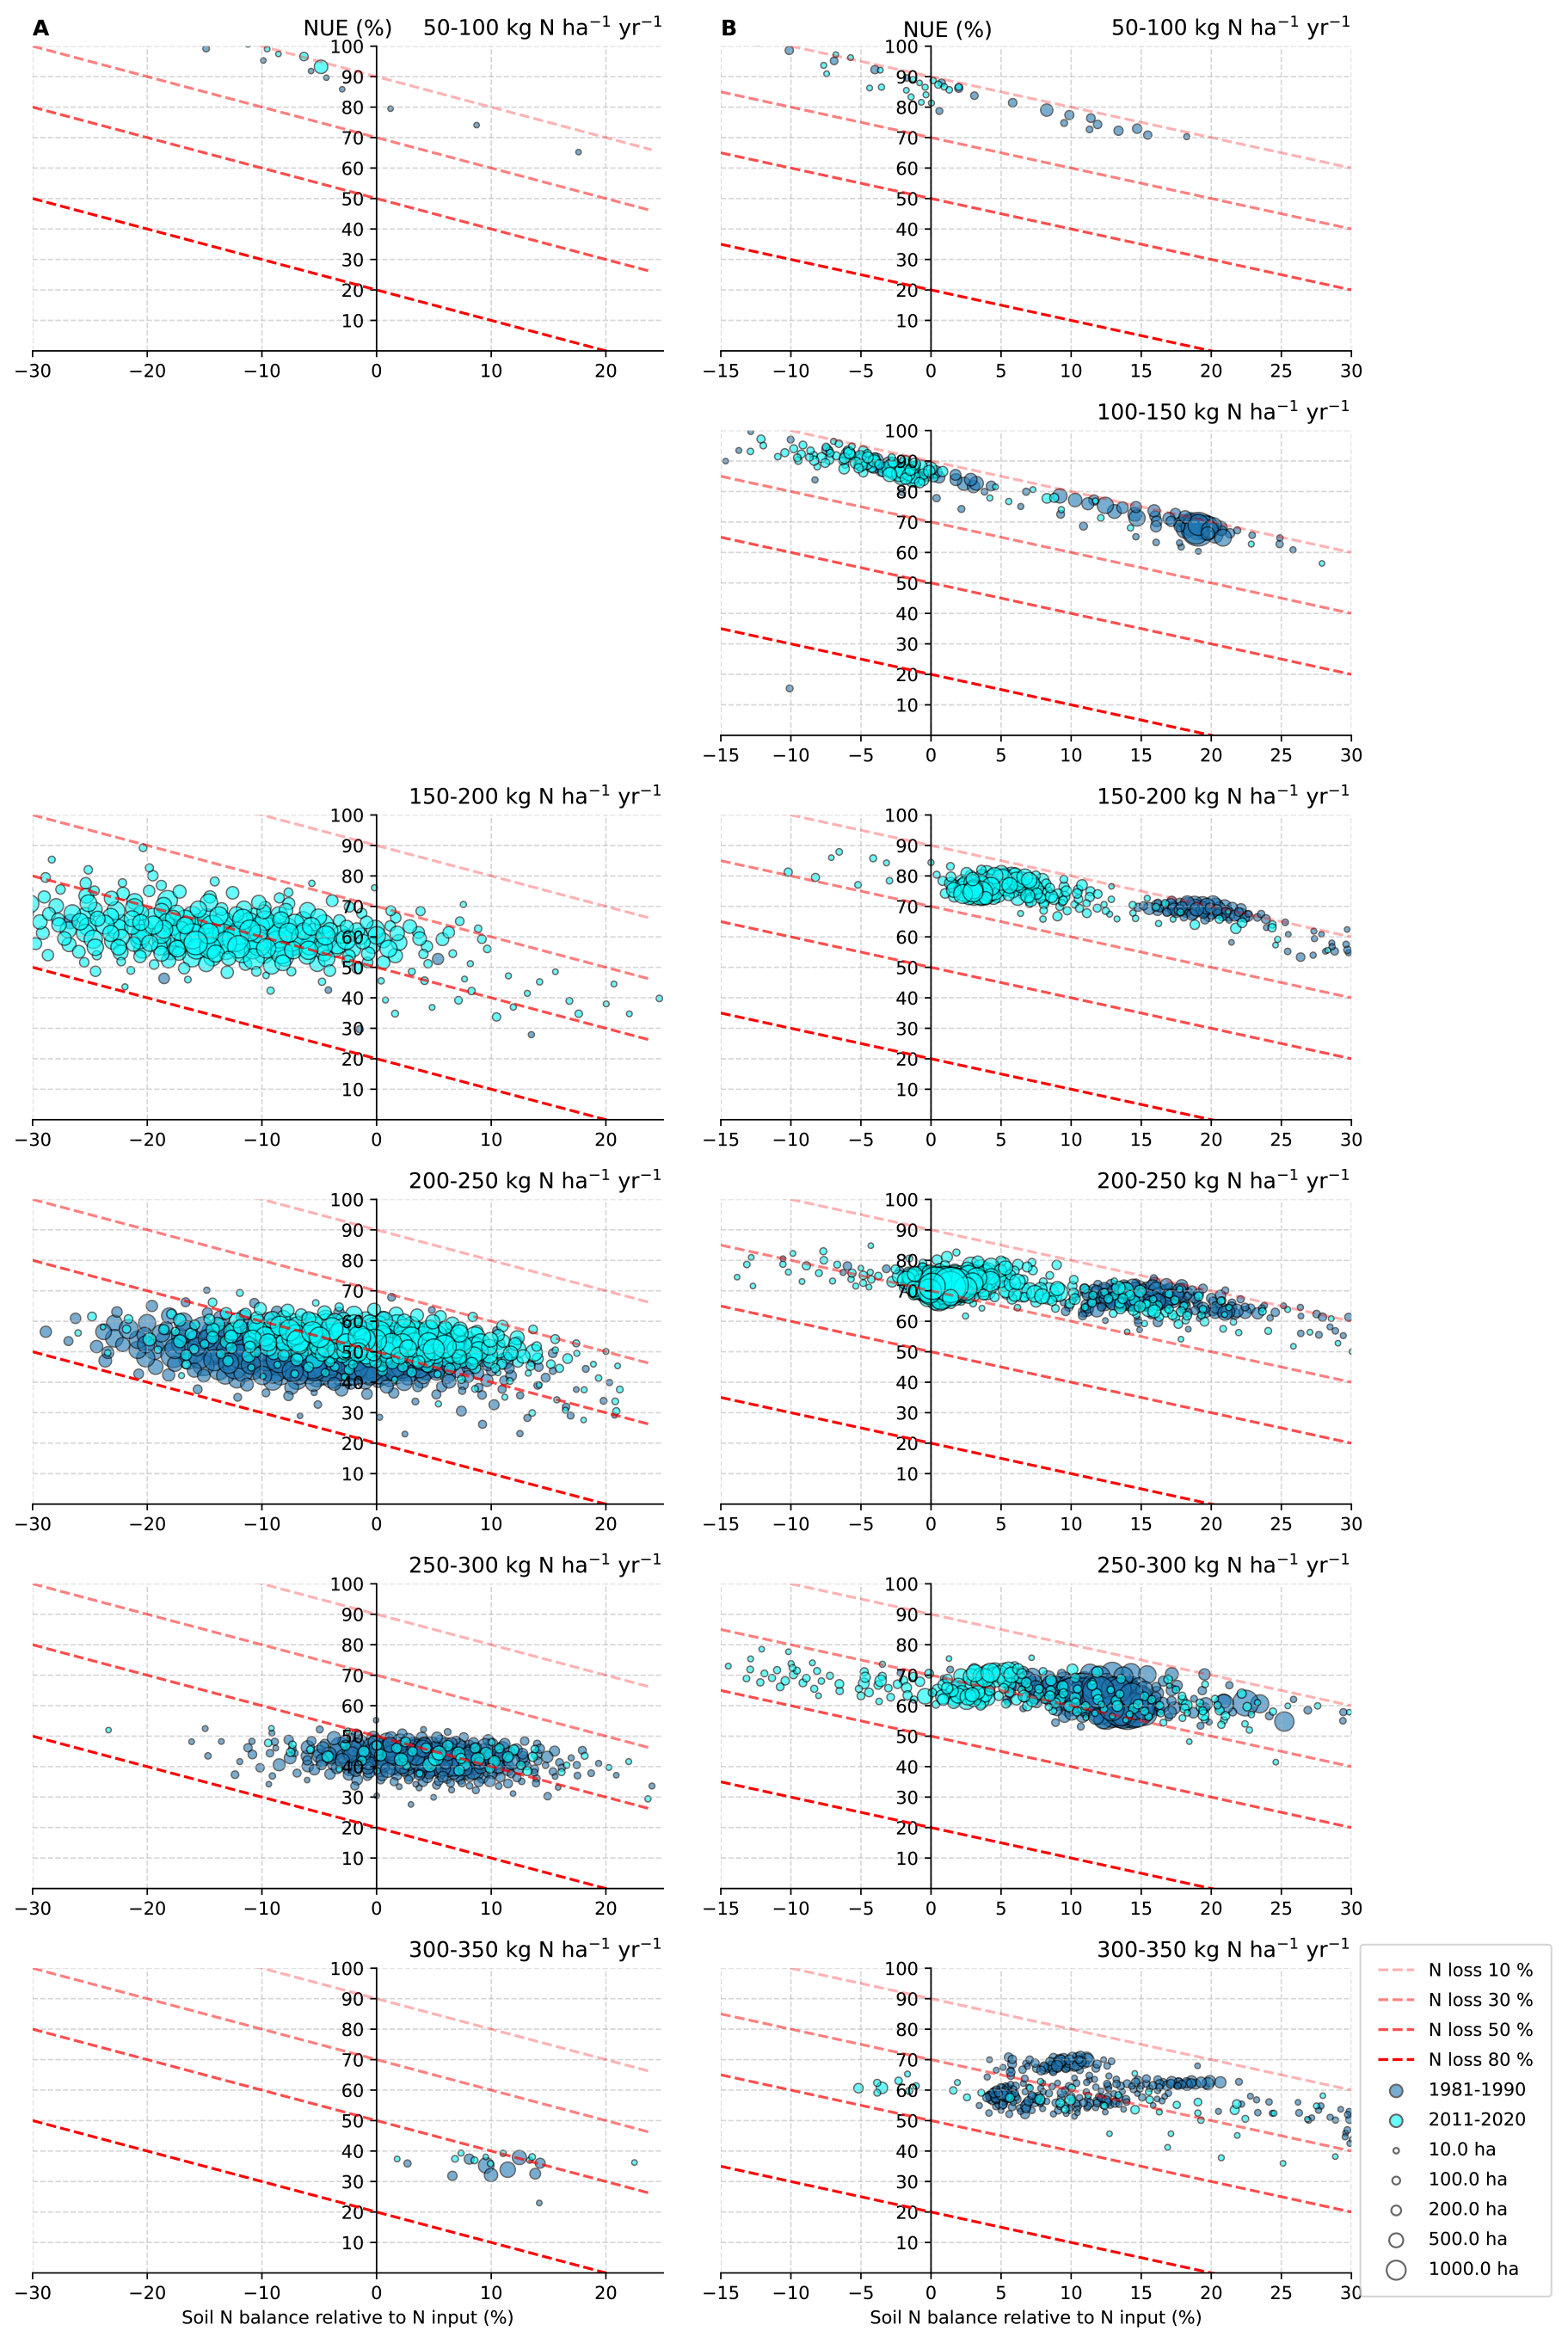
Figure 7An integrated N assessment framework of Swiss agroecosystems. NUE, N loss and soil N balance of croplands (A) and grasslands (B) under different levels of N inputs. N loss and soil N balance are expressed as percentage of total N inputs. In each individual panel, from top to bottom, the dashed red lines represent N loss at 10 %, 30 %, 50 % and 90 %. The dark blue and light blue circles represent data from 1981–1990 and 2011–2020, respectively. The size of the circle is proportional to the areas, with legends shown in the figure.
To synthesize N dynamics and assess agri-environmental performance of croplands and grasslands in Switzerland, we use a novel analytical framework that jointly evaluates N inputs, NUE, N losses and soil N balance, with the latter two expressed relative to total inputs. Compared with the EUNEP framework, this framework explicitly shows the magnitude of N losses and soil N changes. In both agricultural ecosystems, NUE declines with increasing N inputs, while higher N inputs are associated with larger N losses and shifts in the soil N balance (Fig. 7). At N inputs < 100 , the two systems operate efficiently: NUE largely exceeds 80 %, N losses remain around 10 %, and soil N pools are minimally disturbed. As N inputs increase (150–200 ), croplands frequently lose more than half of N inputs and experience substantial soil N depletion, with decreases in soil N stocks reaching up to 30 % of total inputs (45–60 ). These N depletions in croplands were not explicitly reflected in the EUNEP framework. At high inputs (> 200 ), outcomes diverge: some sites accumulate N in soils when losses are < 50 %, while other places deplete soil N stocks. Under such high N inputs, the magnitude of N losses affects the soil N balance, with positive soil N balance associated with lower N losses. Croplands receiving > 250 N inputs were common in the 1980s but rare in the 2010s, reflecting the decline of input-intensive practices. Grasslands consistently outperform croplands under comparable input levels, with higher NUE, lower losses and predominantly positive soil N balances (Fig. 7B). Grassland soils retained more N in the 1980s than in the 2010s, suggesting diminishing accumulation rates over time due to less fertilizer N inputs (see also Figs. 2, A1 in Appendix, and S4 in the Supplement).
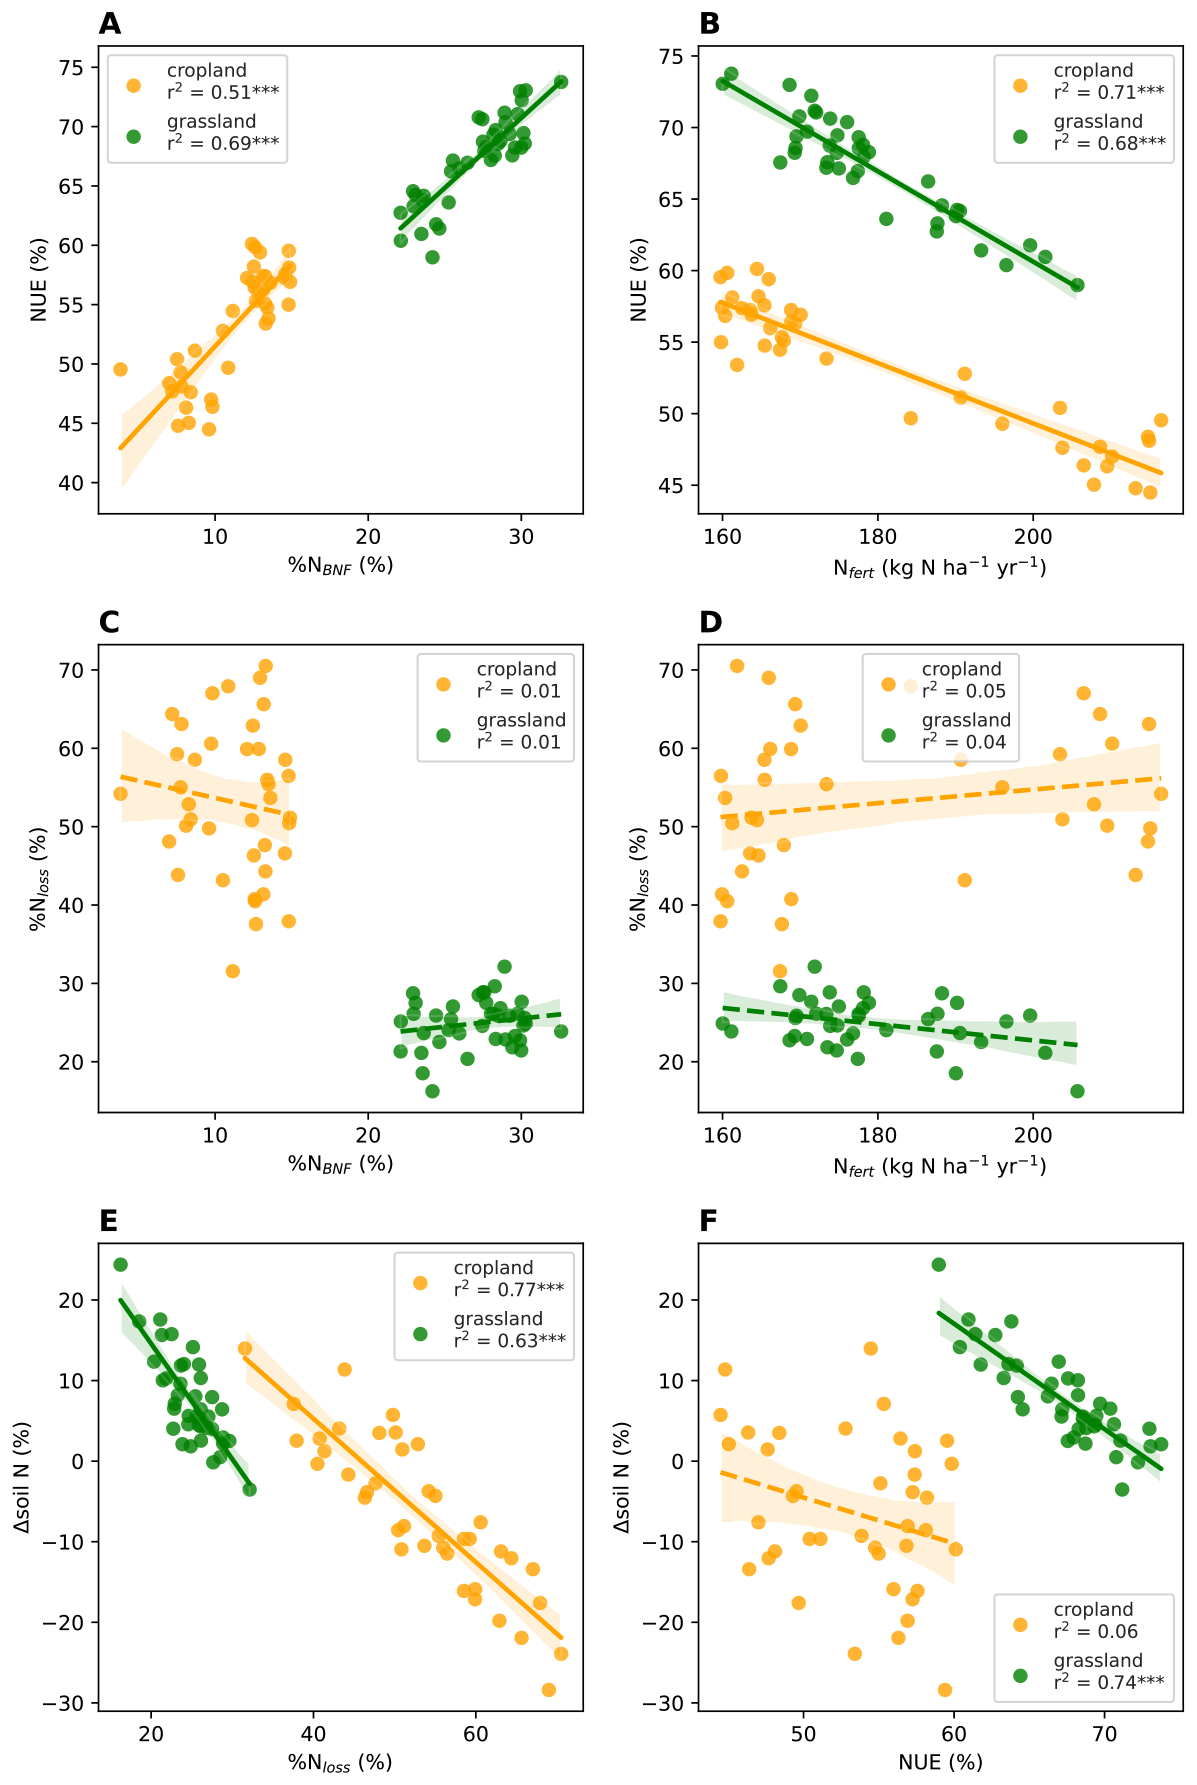
Figure 8Analysis of N inputs, N loss and soil N balance of Swiss agroecosystems. Response of NUE to (A) relative BNF (% NBNF) and (B) fertilizer N inputs (Nfert). No significant relationships between (C) relative BNF (D) fertilizer N inputs and relative N loss (% Nloss). Relationships between (E) relative N loss, (F) NUE and soil N balance (Δ soil N). BNF, N loss and soil N balance are expressed as percentage relative to total N input. The points represent annual mean values. Croplands are shown in yellow colour, and grasslands are shown in green colour. Solid lines show significant relationships with significance level P < 0.001, and dashed lines indicate insignificant relationships.
Within the current model framework, our simulation results demonstrate at the national scale that NUE increases with a greater contribution of BNF-derived N and decreases with increasing fertilizer N (Fig. 8A ans B). In DayCent, symbiotic N fixation occurs only when mineral N is insufficient to satisfy plant demand, leading to an inverse relationship between BNF-derived N and fertilizer N inputs. Although the model does not distinguish the source of mineral N during plant uptake or loss processes, the scenario simulations indicate that replacing fertilizer sources by only applying a single type of fertilizer results in modest changes in total N losses (ranging from −7 % to 3 %), whereas reducing the total fertilizer input substantially decreases N losses by ∼ 20 % (as presented in Table S3 in the Supplement). These findings suggest that the amount of N input is a stronger determinant of N losses than the source of N input.
Although lower simulated relative N losses were associated with more positive soil N balances (Fig. 8E), the scenario simulations demonstrate that soil N stock changes are determined by the combined effects of N inputs, harvest removal and N losses (Table S3). A 20 % reduction in fertilizer application decreased total N inputs by 12 %–14 % because increased BNF partially compensated for lower fertilizer inputs (Table S3). Nevertheless, soil N depletion in croplands increased and soil N accumulation in grasslands declined, indicating that reductions in N losses alone are insufficient to maintain soil N stocks if accompanied by reduced N inputs. These findings highlight the need to optimize both N inputs and N retention when improving N management.
This study presents an in-depth N assessment of two land ecosystems in Switzerland's agriculture. Using national-scale simulations evaluated against observational data (Figs. S2, S3 and S5 in the Supplement), we construct spatially explicit N budgets over the past four decades and show that Switzerland's cropland and grassland systems have undergone profound transformations. During 1981–2020, the simulations reproduced stable agricultural production despite declining fertilizer N inputs, accompanied by increasing NUE and reduced N losses, particularly in croplands. The timing of these changes is consistent with the implementation of agricultural policies promoting less fertilizer use during the 1990s. However, the responses differed between ecosystems. In croplands, fertilizer reductions primarily involved synthetic fertilizers (Table 2), which likely contributed to the marked increase in NUE and decline in N losses. In contrast, grasslands experienced little change in N losses. This can be partly explained by fertilizer reductions dominated by decreases in organic fertilizer, while synthetic fertilizer inputs remained relatively stable (Table 2).
Determined through the EUNEP framework, agri-environmental performance of the two ecosystems shifted towards more efficient and sustainable regimes. These findings highlight the importance of policy intervention for agricultural N management. However, we identify prevalent negative soil N balance in Swiss croplands. Such soil N depletion problems have been studied but not linked to the N budgets approach, and are usually reported only at the site scale (Joris et al., 2020; Mulvaney et al., 2009; Schlingmann et al., 2020). Therefore, long-term monitoring of soil N stock with larger spatial coverage (e.g., regional/national scale), and more comprehensive N assessments and integrated N management are needed to address the risks of further N depletion in agricultural soils. Excessive soil N resulting from past overfertilization can be depleted through careful management, but having more agricultural land with negative a soil N balance should be avoided to ensure the long-term sustainability of agriculture.
4.1 Impacts of nitrogen inputs on yields
Swiss agriculture relies heavily on livestock manure (Table 2), which can supply much of crop and forage N demand. However, the heterogeneous distribution of manure across agricultural landscapes causes mismatches between supply and demand in space and time, and logistical constraints such as storage capacity and weather conditions complicate timely application. Hence, synthetic fertilizers remain a crucial supplementary N source to bridge these gaps, offering readily available N for plant uptake (Figs. 5B and 6B).
In addition to fertilizers, BNF is an important N input. In croplands, our simulations suggest that legumes and grass-clover mixtures in the crop rotation contribute 4 %–15 % of total N inputs (Fig. 5D), while in grasslands BNF accounts for 22 %–33 % (Fig. 6D). In both agroecosystems, we find that relying more on BNF and less on fertilizer tend to achieve higher NUE. Compared to fertilizers and BNF, atmospheric N deposition constitutes a smaller share of N inputs in our simulations (Figs. 5D, 6D and Table 2), and has less significant impacts on agricultural production at the national scale.
At the national scale, the simulations reproduced a progressive decoupling between crop yields and fertilizer N inputs from the 1980s to the 2010s. The simulated increasing NUE over recent decades reflects not only improvements in N management but also the diminishing marginal yield response to additional fertilizer inputs that exceed the agronomic optimum. This pattern is consistent with the well-established nonlinear response of crop yield to N fertilization, which indicates that further increases in fertilizer inputs are unlikely to translate into significant yield gains, suggesting that Switzerland has moved beyond the stage of input-driven intensification. The scenario simulations further support this interpretation: reducing fertilizer application rates by 20 % results in only modest reductions in simulated N harvest (3 %–6 %) while substantially decreasing N losses (∼ 20 %), suggesting considerable opportunity to further improve environmental performance without compromising agricultural production. Our findings place Switzerland among the “type III” countries described in global analyses (Lassaletta et al., 2014) – those capable of maintaining (or increasing) productivity while reducing N inputs.
4.2 Nitrogen losses and soil nitrogen depletion remain challenges
While NUE improvements in Swiss agriculture are encouraging, the caveats are the persistent N losses (especially in grasslands) and negative soil N balance (in cropland). Although absolute N losses declined with decreasing fertilizer inputs, relative N losses showed only modest reductions in croplands and even increased in grasslands. Our sensitivity analysis suggests that the weaker reduction in relative N losses in grasslands may partly reflect the greater sensitivity of grassland N cycling to increasing temperatures, which offset part of the reduction expected from lower fertilizer inputs. A uniform 2 °C increase in air temperature increased simulated N losses by approximately 6 % in croplands and 16 % in grasslands, indicating that warming enhances soil N turnover and gaseous N emissions in DayCent. Consequently, the reduction in N losses resulting from lower fertilizer inputs may have been partially offset by temperature-driven increases in N cycling, particularly in grasslands. In addition, reducing fertilizer application substantially decreased absolute N losses but also altered BNF and soil N dynamics in DayCent, demonstrating that relative N losses are governed by the interaction among N inputs, plant response and internal soil N cycling rather than by fertilizer inputs alone.
Most national- and regional-scale studies focus on N inputs, outputs or surplus, often neglecting soil N stock dynamics. Current knowledge suggests that N surplus is usually larger than changes in soil N stocks (Zhang et al., 2015) and that only countries with insufficient N inputs have been found to undergo soil mining and soil fertility loss (Lassaletta et al., 2014; Zhang et al., 2021), so regional-scale soil N balance is understudied, especially in places with high N inputs. Our modelling results reveal that soil N depletion can occur in cropland soils despite high N inputs and thus highlights that also in places with high N inputs the soil N balance should be evaluated, because negative soil N balances in croplands represents a waste of valuable nutrient resources and a threat to future soil fertility and productivity.
The spatially explicit simulations showed that higher N losses and negative soil N balances were mainly associated with intensively managed agricultural regions dominated by croplands, where fertilizer inputs and harvest removal were higher (Fig. 5). In contrast, grassland generally exhibited lower N losses and mostly positive soil N balance (Fig. 6), consistent with higher N retention associated with continuous vegetation cover. Although the simulations were conducted at a fine spatial resolution that enables analysis of regional differences across Switzerland, the primary objective of this study was to assess national-scale temporal trends and compare two agricultural systems. A more detailed investigation of regional hotspots of NUE, N losses and soil N changes represents an important direction for future research.
Our simulations, supported by sensitivity analyses, indicate that soil N dynamics are governed by the combined effects of N inputs, harvest removal, climate and internal N cycling, rather than by any single environmental or management factor. Maintaining soil N stocks therefore requires balancing N inputs with harvest removal against N losses. Sensitivity analyses further showed that although reducing fertilizer application substantially decreased N losses, the accompanying reduction in total N inputs slightly accelerated soil N depletion in croplands. Moreover, increasing temperature enhanced simulated N losses, suggesting that climate warming may have partially offset improvements associated with reduced fertilizer use. Our simulations identified nitrate leaching as the dominant N loss pathway (Fig. 5F, Table 2; Fig. S6 in the Supplement), explaining the persistence of N losses despite declining fertilizer inputs. This simulated pattern is consistent with previous studies showing that cropland systems are particularly susceptible to N losses because annual cultivation disturbs soil structure and periods of bare soil increase vulnerability to nitrate leaching (Porwollik et al., 2022; Rupp et al., 2024). Excessive fertilizer application, especially in the form of nitrate, significantly increases leaching risk and thereby degrades groundwater quality (Misselbrook et al., 1996; Shepherd et al., 2001; Vinten et al., 1994), reflected by the widespread (∼ 35 %) exceedance of groundwater nitrate guidelines (> 25 mg L−1) across the Swiss Plateau (Covatti et al., 2025). In addition, wheat as the most widely cultivated crop in Switzerland (and the second most common use of cropland), is known to extract large amounts of soil N (Kraaijvanger and Veldkamp, 2020), suggesting that harvested crops can represent a substantial pathway of N export. Together, these factors can contribute to a negative N balance in croplands. Compared with croplands, grasslands with a more continuous plant cover sustain year-round N uptake. Diverse plant communities in grasslands also improve nutrient retention (De Vries and Bardgett, 2016; Leimer et al., 2016), resulting in higher NUE and lower N losses (Fig. 6, Table 2 and Fig. S7 in the Supplement). Extensive and deep rooting systems can also reduce leaching in grassland (Misselbrook et al., 1996).
4.3 Future nitrogen management for sustainable agriculture
For decades, agronomy has centred on enhancing crop productivity, but the adverse environmental consequences resulting from elevated N losses have shifted the paradigm towards agronomic sustainability, emphasizing ecological performance alongside yield optimization. The challenge, however, lies in simultaneously improving NUE and reducing N losses without inducing significant disturbances to soil N stocks. We propose that a robust framework for future N management must rest on the three interlinked pillars: NUE, N loss and soil N stock dynamics. NUE serves as an indicator of input efficiency, N losses capture environmental externalities, and soil N stocks indicate long-term system stability and resilience. By considering these dimensions together, policy makers and practitioners can design strategies that secure productivity without undermining ecological integrity.
This study demonstrates the effectiveness of coordinated policy intervention that resulted in improvements in NUE and reductions in losses. A successful case was also found in China, where targeted N management programmes between 2007 and 2017 led to simultaneous gains in agricultural and environmental outcomes (Duan et al., 2024). These examples underscore that system-level change is possible within decades when science, practice and policy are aligned.
Many high-income countries face similar challenges as Switzerland of balancing productivity with environmental goals, while low- and middle-income countries risk soil N depletion if inputs remain insufficient or face environmental penalties due to unsustainable intensification (Falconnier et al., 2023). In this study, we provide a transferable analytical approach that integrates NUE, N losses and soil N changes for evaluating agri-environmental performance at the national scale. Context-specific application of this framework could help identify “win–win” strategies that support food security while benefiting ecosystems functioning and resilience. Looking forward, future policy frameworks should encourage integrated N management that explicitly addresses productivity-pollution-soils nexus, possibly coupled with financial incentives to stimulate adoption of advanced nutrient management technologies.
4.4 Uncertainty, limitations and outlook
The Monte Carlo analysis showed that the uncertainty associated with simulated NUE, N losses and soil N stock changes was generally smaller than the observed long-term trends, increasing confidence that the simulated temporal changes are robust. Nonetheless, the quantified N budgets in this study were estimated primarily using a modelling approach so that the results should be interpreted with caution. In addition to the evaluated model parameters, other sources of uncertainty were not quantified, such model inputs (e.g., livestock C and N data, and soil data). It is also worths noting that DayCent uses a simple “tipping bucket” module to represent water movement in soil layers, which can overestimate percolation fluxes (i.e., predict quicker drainage). This influences soil water content and consequently affects water-dependent processes (such as crop N uptake, leaching and N2O production). Moreover, DayCent lacks a sophisticated scheme for NH3 volatilization, leading to substantially underestimated NH3 fluxes. This can result in a larger soil nitrate pool because more ammonium is available for nitrification, subsequently enhancing nitrate leaching. Another uncertainty is related to absence of representing cover crops in the model, which have been found to improve multiple ecosystem functions, including total soil N (Liu et al., 2025) at a global level. For Switzerland, Herzog et al. (2005) estimated that the increased use of cover crops since the late 1990s reduced farm-level nutrient balances by 10 % until 2005. The impact of not including them in this study is that we potentially underestimated the reduction in nitrate leaching and therefore also in NUE, but based on the above-mentioned study, the impact is not high.
Overall, our results and findings are robust and provide valuable insights for agricultural policy implementation and the assessment of agri-environmental performance. This work also demonstrates the feasibility of spatially explicit N flow quantification. Future work on monitoring national N use (e.g., constructing N budgets and calculate N balance) can incorporate biogeochemical modelling as part of the methodology.
In this study, we applied high-resolution, spatio-temporal process-based biogeochemical modelling to reconstruct four decades of N budgets across two major agricultural systems in Switzerland. Using this integrated modelling approach, we showed that agri-environmental policy interventions successfully reduced agricultural N losses while maintaining crop yields and substantially improving NUE. These improvements were largely driven by less fertilizer use throughout the 1990s. However, our modelling work also revealed a possibly nationwide depletion of cropland soil N stocks occurring despite continued high fertilizer inputs, which is not reported in previous studies. This central finding may expose a critical vulnerability within intensively managed food-production systems: efficiency gains and pollution control can mask an overlooked issue of unbalanced soil N stock that underpins long-term productivity and resilience.
Using Switzerland as an exemplary case, the analytical framework used in this study and our policy-relevant findings are transferable to many agro-food systems with high nutrient inputs worldwide that are pursuing N loss mitigation targets while seeking to maintain food production. By jointly assessing productivity, N pollution and soil N stocks, our case provides a systems-level diagnostic tool for evaluating the performance and sustainability of contemporary food-production systems.
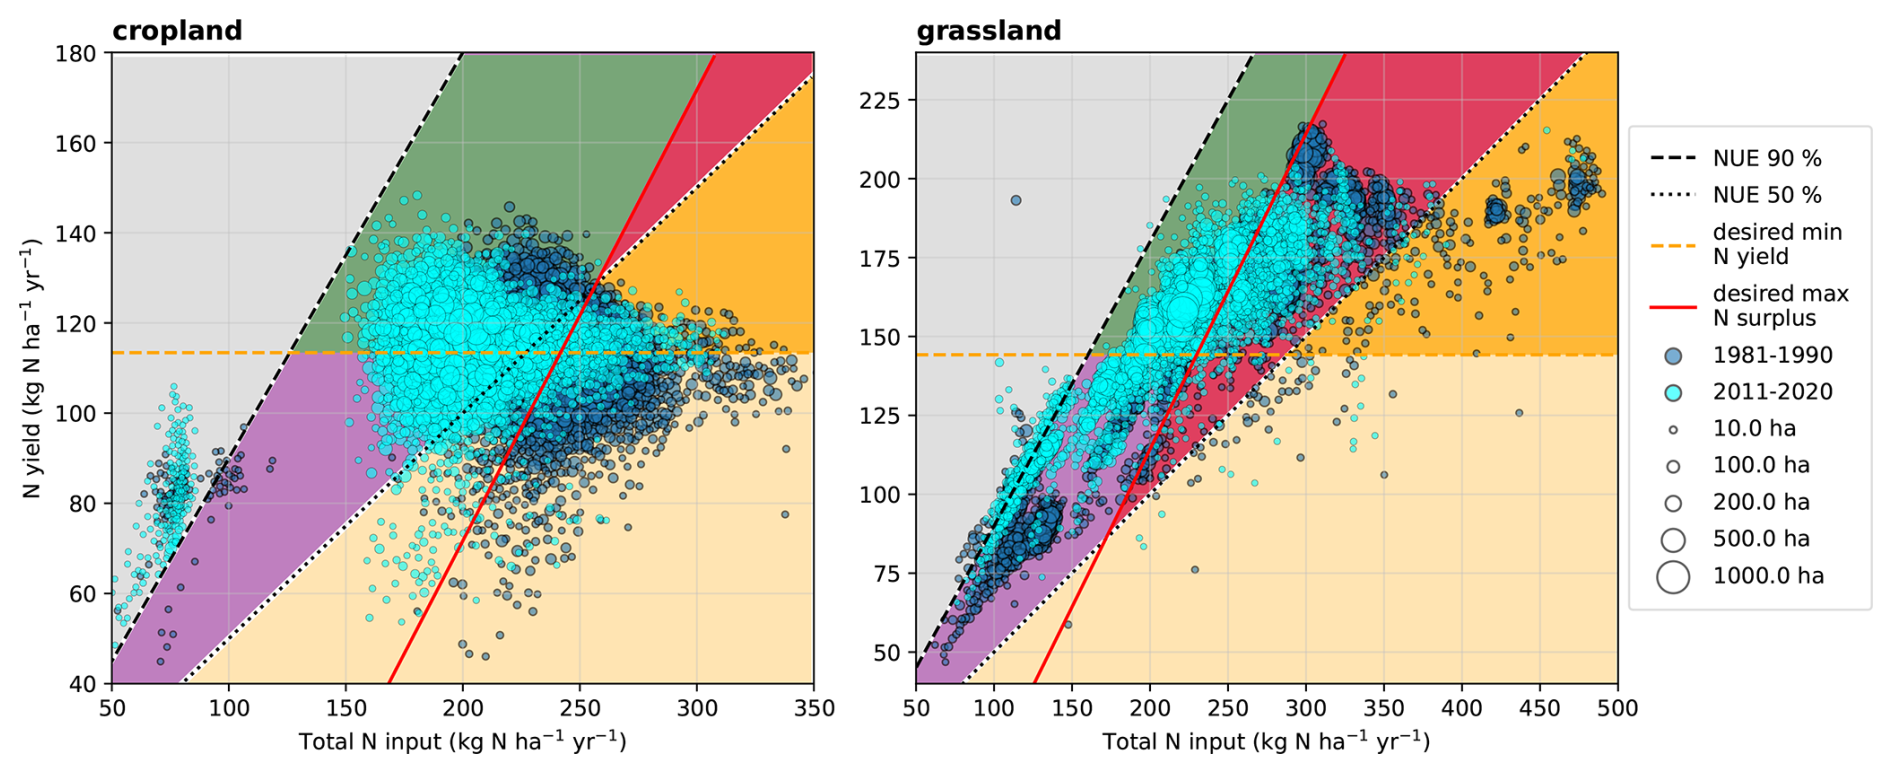
Figure A1The EUNEP Framework of the NUE indicator diagram for Swiss agroecosystems. Modelled total N input and N yield of croplands and grasslands.
Modelling results of the nitrogen budgets presented in this study are in netCDF format and are deposited at https://doi.org/10.3929/ethz-c-000788419 (Jiang, 2025). Code of the DayCent model is publicly available at https://www.soilcarbonsolutionscenter.com/daycent (last access: 21 December 2023). For specific versions, please contact the developers directly.
The supplement related to this article is available online at https://doi.org/10.5194/bg-23-6741-2026-supplement.
JJ conceived of the study. JJ performed the simulations and analysed the data. CW and DB developed carbon and nitrogen data and provided model input. JJ, CW and DB compiled datasets. MN and AS assisted with software and modelling. JJ wrote the original draft of paper. LHEW and JS supervised the project and acquired funding. All authors contributed to interpretation of results and critical revision of the paper.
The contact author has declared that none of the authors has any competing interests.
Publisher's note: Copernicus Publications remains neutral with regard to jurisdictional claims made in the text, published maps, institutional affiliations, or any other geographical representation in this paper. The authors bear the ultimate responsibility for providing appropriate place names. Views expressed in the text are those of the authors and do not necessarily reflect the views of the publisher.
We thank Melannie Hartman for helping with software and DayCent modelling. We thank the ETH Zurich high-performance cluster Euler.
This research is part of the ReCLEAN Joint Initiative supported by the ETH Board under the Joint Initiatives scheme in the Strategic Area Energy, Climate and Environmental Sustainability.
This paper was edited by Ying Sun and reviewed by Zimeng Wang and one anonymous referee.
Anderson, N., Strader, R., and Davidson, C.: Airborne reduced nitrogen: ammonia emissions from agriculture and other sources, Environ. Int., 29, 277–286, https://doi.org/10.1016/S0160-4120(02)00186-1, 2003.
BFS: Arealstatistik: Variablenliste, Swiss Federal Statistical Office, https://www.bfs.admin.ch/bfs/en/home/services/geostat/swiss-federal-statistics-geodata/land-use-cover-suitability/swiss-land-use-statistics.assetdetail.32376296.html (last access: 3 February 2023), 2024.
Covatti, G., Li, K.-Y., Podgorski, J., Winkel, L. H. E., and Berg, M.: Nitrate contamination in groundwater across Switzerland: Spatial prediction and data-driven assessment of anthropogenic and environmental drivers, Sci. Total Environ., 973, 179121, https://doi.org/10.1016/j.scitotenv.2025.179121, 2025.
Decrem, M., Spiess, E., Richner, W., and Herzog, F.: Impact of Swiss agricultural policies on nitrate leaching from arable land, Agron. Sustain. Dev., 27, 243–253, https://doi.org/10.1051/agro:2007012, 2007.
Del Grosso, S. J., Parton, W. J., Mosier, A. R., Hartman, M. D., Brenner, J., Ojima, D. S., and Schimel, D. S.: Simulated inter-action of carbon dynamics and nitrogen trace gas fluxes using the DayCent model, in: Modeling carbon and nitrogen dynamics for soil management, edited by: Shaffer, M. J., Ma, L., and Hansen, S., CRC Press, Boca Raton, 303–332, 2001.
Del Grosso, S. J., Parton, W. J., Mosier, A. R., Holland, E. A., Pendall, E., Schimel, D. S., and Ojima, D. S.: Modeling soil CO2 emissions from ecosystems, Biogeochemistry, 73, 71–91, https://doi.org/10.1007/s10533-004-0898-z, 2005.
De Vries, F. T. and Bardgett, R. D.: Plant community controls on short-term ecosystem nitrogen retention, New Phytol., 210, 861–874, https://doi.org/10.1111/nph.13832, 2016.
Dodds, W. and Smith, V.: Nitrogen, phosphorus, and eutrophication in streams, Inland Waters, 6, 155–164, https://doi.org/10.5268/IW-6.2.909, 2016.
Dos Reis Martins, M., Necpalova, M., Ammann, C., Buchmann, N., Calanca, P., Flechard, C. R., Hartman, M. D., Krauss, M., Le Roy, P., Mäder, P., Maier, R., Morvan, T., Nicolardot, B., Skinner, C., Six, J., and Keel, S. G.: Modeling N2O emissions of complex cropland management in Western Europe using DayCent: Performance and scope for improvement, Eur. J. Agron., 141, 126613, https://doi.org/10.1016/j.eja.2022.126613, 2022.
Dos Reis Martins, M., Ammann, C., Boos, C., Calanca, P., Kiese, R., Wolf, B., and Keel, S. G.: Reducing N fertilization in the framework of the European Farm to Fork strategy under global change: Impacts on yields, N2O emissions and N leaching of temperate grasslands in the Alpine region, Agricultural Systems, 219, 104036, https://doi.org/10.1016/j.agsy.2024.104036, 2024.
Duan, J., Liu, H., Zhang, X., Ren, C., Wang, C., Cheng, L., Xu, J., and Gu, B.: Agricultural management practices in China enhance nitrogen sustainability and benefit human health, Nat. Food, 5, 378–389, https://doi.org/10.1038/s43016-024-00953-8, 2024.
Emmel, C., Winkler, A., Hörtnagl, L., Revill, A., Ammann, C., D'Odorico, P., Buchmann, N., and Eugster, W.: Integrated management of a Swiss cropland is not sufficient to preserve its soil carbon pool in the long term, Biogeosciences, 15, 5377–5393, https://doi.org/10.5194/bg-15-5377-2018, 2018.
Erisman, J. W., Sutton, M. A., Galloway, J., Klimont, Z., and Winiwarter, W.: How a century of ammonia synthesis changed the world, Nat. Geosci., 1, 636–639, https://doi.org/10.1038/ngeo325, 2008.
EU Nitrogen Expert Panel: Nitrogen Use Efficiency (NUE) – Guidance Document for Assessing NUE at Farm Level, Wageningen University, https://go.nature.com/3TtCxIV (last access: 22 August 2024), 2016.
Falconnier, G. N., Cardinael, R., Corbeels, M., Baudron, F., Chivenge, P., Couëdel, A., Ripoche, A., Affholder, F., Naudin, K., Benaillon, E., Rusinamhodzi, L., Leroux, L., Vanlauwe, B., and Giller, K. E.: The input reduction principle of agroecology is wrong when it comes to mineral fertilizer use in sub-Saharan Africa, Outlook Agric., 52, 311–326, https://doi.org/10.1177/00307270231199795, 2023.
Feigenwinter, I., Hörtnagl, L., Zeeman, M. J., Eugster, W., Fuchs, K., Merbold, L., and Buchmann, N.: Large inter-annual variation in carbon sink strength of a permanent grassland over 16 years: Impacts of management practices and climate, Agr. Forest Meteorol., 340, 109613, https://doi.org/10.1016/j.agrformet.2023.109613, 2023a.
Feigenwinter, I., Hörtnagl, L., and Buchmann, N.: N2O and CH4 fluxes from intensively managed grassland: The importance of biological and environmental drivers vs. management, Sci. Total Environ., 903, 166389, https://doi.org/10.1016/j.scitotenv.2023.166389, 2023b.
Fowler, D., Coyle, M., Skiba, U., Sutton, M. A., Cape, J. N., Reis, S., Sheppard, L. J., Jenkins, A., Grizzetti, B., Galloway, J. N., Vitousek, P., Leach, A., Bouwman, A. F., Butterbach-Bahl, K., Dentener, F., Stevenson, D., Amann, M., and Voss, M.: The global nitrogen cycle in the twenty-first century, Philos. T. R. Soc. B, 368, 20130164, https://doi.org/10.1098/rstb.2013.0164, 2013.
Gächterr, R., Steingruber, S. M., Reinhardt, M., and Wehrli, B.: Nutrient transfer from soil to surface waters: Differences between nitrate and phosphate, Aquat. Sci., 66, 117–122, https://doi.org/10.1007/s00027-003-0661-x, 2004.
Galloway, J. N., Aber, J. D., Erisman, J. W., Seitzinger, S. P., Howarth, R. W., Cowling, E. B., and Cosby, B. J.: The Nitrogen Cascade, BioScience, 53, 341, https://doi.org/10.1641/0006-3568(2003)053[0341:TNC]2.0.CO;2, 2003.
Galloway, J. N., Leach, A. M., Bleeker, A., and Erisman, J. W.: A chronology of human understanding of the nitrogen cycle, Philos. T. R. Soc. B, 368, 20130120, https://doi.org/10.1098/rstb.2013.0120, 2013.
Gurung, R. B., Ogle, S. M., Breidt, F. J., Williams, S. A., and Parton, W. J.: Bayesian calibration of the DayCent ecosystem model to simulate soil organic carbon dynamics and reduce model uncertainty, Geoderma, 376, 114529, https://doi.org/10.1016/j.geoderma.2020.114529, 2020.
Gurung, R. B., Ogle, S. M., Breidt, F. J., Parton, W. J., Del Grosso, S. J., Zhang, Y., Hartman, M. D., Williams, S. A., and Venterea, R. T.: Modeling nitrous oxide mitigation potential of enhanced efficiency nitrogen fertilizers from agricultural systems, Sci. Total Environ., 801, 149342, https://doi.org/10.1016/j.scitotenv.2021.149342, 2021.
Hashimoto, S., Ito, A., and Nishina, K.: Harmonized global soil carbon and respiration datasets with derived turnover time and temperature sensitivity, Sci. Data, 12, 2005, https://doi.org/10.1038/s41597-025-06254-4, 2025.
Herzog, F., Richner, W., and Walter, T.: Moderat positive Wirkung der Ökomassnahmen, Agrarforschung Schweiz, 12, 454–459, 2005.
Herzog, F., Prasuhn, V., Spiess, E., and Richner, W.: Environmental cross-compliance mitigates nitrogen and phosphorus pollution from Swiss agriculture, Environ. Sci. Policy, 11, 655–668, https://doi.org/10.1016/j.envsci.2008.06.003, 2008.
Hörtnagl, L., Feigenwinter, I., Wang, Y., and Buchmann, N.: Ecosystem fluxes measured by the eddy covariance method (CO2, H2O, H, N2O, CH4), meteorological data and detailed management information for the intensively managed grassland site Chamau in Switzerland, collected between 2005 and 2024, ETH Zurich, https://doi.org/10.3929/ethz-b-000747025, 2025.
Hüppi, R., Felber, R., Neftel, A., Six, J., and Leifeld, J.: Effect of biochar and liming on soil nitrous oxide emissions from a temperate maize cropping system, SOIL, 1, 707–717, https://doi.org/10.5194/soil-1-707-2015, 2015.
Jiang, J.: Modelling of nitrogen budgets of Swiss agricultural lands, ETH Zurich [data set], https://doi.org/10.3929/ethz-c-000788419, 2025.
Joris, H. A. W., Vitti, A. C., Ferraz-Almeida, R., Otto, R., and Cantarella, H.: Long-term N fertilization reduces uptake of N from fertilizer and increases the uptake of N from soil, Sci. Rep., 10, 18834, https://doi.org/10.1038/s41598-020-75971-0, 2020.
Kraaijvanger, R. G. and Veldkamp, T.: Evaluating Resource Use Efficiency and Stock Balances of Nitrogen and Phosphorus Fertilizer Inputs: The Effect of Soil Supply Capacity in Tigray (Ethiopia), in: Just Enough Nitrogen, edited by: Sutton, M. A., Mason, K. E., Bleeker, A., Hicks, W. K., Masso, C., Raghuram, N., Reis, S., and Bekunda, M., Springer, Cham, 203–219, https://doi.org/10.1007/978-3-030-58065-0, 2020.
Krauss, M., Ruser, R., Müller, T., Hansen, S., Mäder, P., and Gattinger, A.: Impact of reduced tillage on greenhouse gas emissions and soil carbon stocks in an organic grass-clover ley – winter wheat cropping sequence, Agr. Ecosyst. Environ., 239, 324–333, https://doi.org/10.1016/j.agee.2017.01.029, 2017.
Krupa, S. V.: Effects of atmospheric ammonia (NH3) on terrestrial vegetation: a review, Environ. Pollut., 124, 179–221, https://doi.org/10.1016/S0269-7491(02)00434-7, 2003.
Kupper, T., Häni, C., Bretscher, D., and Zaucker, F.: Ammoniakemissionen der schweizerischen Landwirtschaft 1990 bis 2020, Hochschule für Agrar-, Forst- und Lebensmittelwissenschaften, Zollikofen, Switzerland, 2022.
Lassaletta, L., Billen, G., Grizzetti, B., Anglade, J., and Garnier, J.: 50 year trends in nitrogen use efficiency of world cropping systems: the relationship between yield and nitrogen input to cropland, Environ. Res. Lett., 9, 105011, https://doi.org/10.1088/1748-9326/9/10/105011, 2014.
Laub, M., Necpalova, M., Van de Broek, M., Corbeels, M., Ndungu, S. M., Mucheru-Muna, M. W., Mugendi, D., Yegon, R., Waswa, W., Vanlauwe, B., and Six, J.: Modeling integrated soil fertility management for maize production in Kenya using a Bayesian calibration of the DayCent model, Biogeosciences, 21, 3691–3716, https://doi.org/10.5194/bg-21-3691-2024, 2024.
Lee, J., Necpálová, M., and Six, J.: Biophysical potential of organic cropping practices as a sustainable alternative in Switzerland, Agr. Syst., 181, 102822, https://doi.org/10.1016/j.agsy.2020.102822, 2020a.
Lee, J., Necpálová, M., Calitri, F., and Six, J.: Simulation of a regional soil nitrogen balance in Swiss croplands, Nutr. Cycl. Agroecosys., 118, 9–22, https://doi.org/10.1007/s10705-020-10078-6, 2020b.
Leimer, S., Oelmann, Y., Eisenhauer, N., Milcu, A., Roscher, C., Scheu, S., Weigelt, A., Wirth, C., and Wilcke, W.: Mechanisms behind plant diversity effects on inorganic and organic N leaching from temperate grassland, Biogeochemistry, 131, 339–353, https://doi.org/10.1007/s10533-016-0283-8, 2016.
Liu, J., Olhnuud, A., Li, Z., Li, H., Fornara, D., Zhang, W., and Liu, Y.: Cover crop mixtures enhance multiple ecosystem functions: A global meta-analysis, J. Appl. Ecol., 62, 1914–1928, https://doi.org/10.1111/1365-2664.70089, 2025.
Mayer, J., Gunst, L., Mäder, P., Samson, M.-F., Carcea, M., Narducci, V., Thomsen, I. K., and Dubois, D.: Productivity, quality and sustainability of winter wheat under long-term conventional and organic management in Switzerland, Eur. J. Agron., 65, 27–39, https://doi.org/10.1016/j.eja.2015.01.002, 2015.
McClelland, S. C., Bossio, D., Gordon, D. R., Lehmann, J., Hayek, M. N., Ogle, S. M., Sanderman, J., Wood, S. A., Yang, Y., and Woolf, D.: Managing for climate and production goals on crop-lands, Nat. Clim. Change, 15, 642–649, https://doi.org/10.1038/s41558-025-02337-7, 2025.
MeteoSwiss: MeteoSwiss spatial climate analyses: documentation of datasets for users, Swiss Federal Office of Meteorology and Climatology, https://opendatadocs.meteoswiss.ch/c-climate-data (last access: 12 January 2024), 2025.
Misselbrook, T. H., Shepherd, M. A., and Pain, B. F.: Sewage sludge applications to grassland: influence of sludge type, time and method of application on nitrate leaching and herbage yield, J. Agr. Sci., 126, 343–352, https://doi.org/10.1017/S0021859600074906, 1996.
Moldanová, J., Grennfelt, P., Jonsson, Å., Simpson, D., Spranger, T., Aas, W., Munthe, J., and Rabl, A.: Nitrogen as a threat to European air quality, in: The European Nitrogen Assessment, edited by: Sutton, M. A., Howard, C. M., Erisman, J. W., Billen, G., Bleeker, A., Grennfelt, P., Van Grinsven, H., and Grizzetti, B., Cambridge University Press, 405–433, https://doi.org/10.1017/CBO9780511976988.021, 2011.
Müller, B., Meyer, J. S., and Gächter, R.: Denitrification and Nitrogen Burial in Swiss Lakes, Environ. Sci. Technol., 56, 2794–2802, https://doi.org/10.1021/acs.est.1c07602, 2022.
Mulvaney, R. L., Khan, S. A., and Ellsworth, T. R.: Synthetic Nitrogen Fertilizers Deplete Soil Nitrogen: A Global Dilemma for Sustainable Cereal Production, J. Env. Quality, 38, 2295–2314, https://doi.org/10.2134/jeq2008.0527, 2009.
Necpalova, M., Lee, J., Skinner, C., Büchi, L., Wittwer, R., Gattinger, A., Van Der Heijden, M., Mäder, P., Charles, R., Berner, A., Mayer, J., and Six, J.: Potentials to mitigate greenhouse gas emissions from Swiss agriculture, Agr. Ecosyst. Environ., 265, 84–102, https://doi.org/10.1016/j.agee.2018.05.013, 2018.
Oberson, A., Jarosch, K. A., Frossard, E., Hammelehle, A., Fliessbach, A., Mäder, P., and Mayer, J.: Higher than expected: Nitrogen flows, budgets, and use efficiencies over 35 years of organic and conventional cropping, Agr. Ecosyst. Environ., 362, 108802, https://doi.org/10.1016/j.agee.2023.108802, 2024.
Oenema, O., Kros, H., and De Vries, W.: Approaches and uncertainties in nutrient budgets: implications for nutrient management and environmental policies, Eur. J. Agron., 20, 3–16, https://doi.org/10.1016/S1161-0301(03)00067-4, 2003.
Porwollik, V., Rolinski, S., Heinke, J., von Bloh, W., Schaphoff, S., and Müller, C.: The role of cover crops for cropland soil carbon, nitrogen leaching, and agricultural yields – a global simulation study with LPJmL (V. 5.0-tillage-cc), Biogeosciences, 19, 957–977, https://doi.org/10.5194/bg-19-957-2022, 2022.
Prasuhn, V. and Sieber, U.: Changes in diffuse phosphorus and nitrogen inputs into surface waters in the Rhine watershed in Switzerland, Aquat. Sci., 67, 363–371, https://doi.org/10.1007/s00027-005-0774-5, 2005.
Quemada, M., Lassaletta, L., Jensen, L. S., Godinot, O., Brentrup, F., Buckley, C., Foray, S., Hvid, S. K., Oenema, J., Richards, K. G., and Oenema, O.: Exploring nitrogen indicators of farm performance among farm types across several European case studies, Agr. Syst., 177, 102689, https://doi.org/10.1016/j.agsy.2019.102689, 2020.
Rupp, H., Tauchnitz, N., and Meissner, R.: The influence of increasing mineral fertilizer application on nitrogen leaching of arable land and grassland – results of a long-term lysimeter study, Front. Soil Sci., 4, 1345073, https://doi.org/10.3389/fsoil.2024.1345073, 2024.
Saxton, K. E. and Rawls, W. J.: Soil Water Characteristic Estimates by Texture and Organic Matter for Hydrologic Solutions, Soil Sci. Soc. Am. J., 70, 1569–1578, https://doi.org/10.2136/sssaj2005.0117, 2006.
Saxton, K. E., Rawls, W. J., Romberger, J. S., and Papendick, R. I.: Estimating Generalized Soil-water Characteristics from Texture, Soil Sci. Soc. Am. J., 50, 1031–1036, https://doi.org/10.2136/sssaj1986.03615995005000040039x, 1986.
Schlingmann, M., Tobler, U., Berauer, B., Garcia-Franco, N., Wilfahrt, P., Wiesmeier, M., Jentsch, A., Wolf, B., Kiese, R., and Dannenmann, M.: Intensive slurry management and climate change promote nitrogen mining from organic matter-rich montane grassland soils, Plant Soil, 456, 81–98, https://doi.org/10.1007/s11104-020-04697-9, 2020.
Schulzweida, U.: CDO user guide (2.3.0), Max Planck Institute for Meteorology, 2023.
Shepherd, M. A., Hatch, D. J., Jarvis, S. C., and Bhogal, A.: Nitrate leaching from reseeded pasture, Soil Use Manage., 17, 97–105, https://doi.org/10.1111/j.1475-2743.2001.tb00014.x, 2001.
Sinaj, S., Charles, R., Baux, A., Dupuis, B., Hiltbrunner, J., Levy, L., Pellet, D., Blanchet, G., and Jeangros, B.: 8/ Düngung von Ackerkulturen: Grundlagen für die Düngung landwirtschaftlicher Kulturen in der Schweiz (GRUD), Agrarforsch. Schweiz+, 8, 1–46, 2017.
Spiess, E.: Nitrogen, phosphorus and potassium balances and cycles of Swiss agriculture from 1975 to 2008, Nutr. Cycl. Agroecosys., 91, 351–365, https://doi.org/10.1007/s10705-011-9466-9, 2011.
Stocker, B. D., Roth, R., Joos, F., Spahni, R., Steinacher, M., Zaehle, S., Bouwman, L., Xu-Ri, and Prentice, I. C.: Multiple greenhouse-gas feedbacks from the land biosphere under future climate change scenarios, Nat. Clim. Change, 3, 666–672, https://doi.org/10.1038/nclimate1864, 2013.
Stumpf, F., Behrens, T., Schmidt, K., and Keller, A.: Exploiting Soil and Remote Sensing Data Archives for 3D Mapping of Multiple Soil Properties at the Swiss National Scale, Remote Sens., 16, 2712, https://doi.org/10.3390/rs16152712, 2024.
Sutton, M. A., Oenema, O., Erisman, J. W., Leip, A., Van Grinsven, H., and Winiwarter, W.: Too much of a good thing, Nature, 472, 159–161, https://doi.org/10.1038/472159a, 2011.
Sutton, M. A., Reis, S., Riddick, S. N., Dragosits, U., Nemitz, E., Theobald, M. R., Tang, Y. S., Braban, C. F., Vieno, M., Dore, A. J., Mitchell, R. F., Wanless, S., Daunt, F., Fowler, D., Blackall, T. D., Milford, C., Flechard, C. R., Loubet, B., Massad, R., Cellier, P., Personne, E., Coheur, P. F., Clarisse, L., Van Damme, M., Ngadi, Y., Clerbaux, C., Skjøth, C. A., Geels, C., Hertel, O., Wichink Kruit, R. J., Pinder, R. W., Bash, J. O., Walker, J. T., Simpson, D., Horváth, L., Misselbrook, T. H., Bleeker, A., Dentener, F., and De Vries, W.: Towards a climate-dependent paradigm of ammonia emission and deposition, Philos. T. R. Soc. B, 368, 20130166, https://doi.org/10.1098/rstb.2013.0166, 2013.
Sutton, M. A., Van Dijk, N., Levy, P. E., Jones, M. R., Leith, I. D., Sheppard, L. J., Leeson, S., Sim Tang, Y., Stephens, A., Braban, C. F., Dragosits, U., Howard, C. M., Vieno, M., Fowler, D., Corbett, P., Naikoo, M. I., Munzi, S., Ellis, C. J., Chatterjee, S., Steadman, C. E., Móring, A., and Wolseley, P. A.: Alkaline air: changing perspectives on nitrogen and air pollution in an ammonia-rich world, Philos. T. R. Soc. A., 378, 20190315, https://doi.org/10.1098/rsta.2019.0315, 2020.
Vinten, A. J. A., Vivian, B. J., Wright, F., and Howard, R. S.: A comparative study of nitrate leaching from soils of differing textures under similar climatic and cropping conditions, J. Hydrol, 159, 197–213, https://doi.org/10.1016/0022-1694(94)90256-9, 1994.
Vitousek, P. M. and Howarth, R. W.: Nitrogen limitation on land and in the sea: How can it occur?, Biogeochemistry, 13, https://doi.org/10.1007/BF00002772, 1991.
Weber, D., Schwieder, M., Ritter, L., Koch, T., Psomas, A., Huber, N., Ginzler, C., and Boch, S.: Grassland-use intensity maps for Switzerland based on satellite time series: Challenges and opportunities for ecological applications, Remote Sens. Ecol. Conserv., 10, 312–327, https://doi.org/10.1002/rse2.372, 2024.
Wollmann, I., Klaudy, N., Suter, D., Zimmermann, R., Shavit, N., and Hirte, J.: The development of carbon stocks in topsoil and subsoil at national soil monitoring sites over 30 years, Agroscope Science, 216, https://doi.org/10.34776/AS216E, 2025.
Wüst-Galley, C., Keel, S. G., and Leifeld, J.: A model-based carbon inventory for Switzerland's mineral agricultural soils using RothC, Agroscope Science, 105, https://doi.org/10.34776/AS105E, 2020.
Zhang, X., Davidson, E. A., Mauzerall, D. L., Searchinger, T. D., Dumas, P., and Shen, Y.: Managing nitrogen for sustainable development, Nature, 528, 51–59, https://doi.org/10.1038/nature15743, 2015.
Zhang, X., Zou, T., Lassaletta, L., Mueller, N. D., Tubiello, F. N., Lisk, M. D., Lu, C., Conant, R. T., Dorich, C. D., Gerber, J., Tian, H., Bruulsema, T., Maaz, T. M., Nishina, K., Bodirsky, B. L., Popp, A., Bouwman, L., Beusen, A., Chang, J., Havlík, P., Leclère, D., Canadell, J. G., Jackson, R. B., Heffer, P., Wanner, N., Zhang, W., and Davidson, E. A.: Quantification of global and national nitrogen budgets for crop production, Nat. Food, 2, 529–540, https://doi.org/10.1038/s43016-021-00318-5, 2021.
Zhu, G., Shi, H., Zhong, L., He, G., Wang, B., Shan, J., Han, P., Liu, T., Wang, S., Liu, C., Zhang, N., Jiang, L., Yu, L., Zhan, C., Tang, Z., Wen, T., Ma, B., Su, X., Zhang, S., Zhang, J., Di, H., Hou, L., Krichels, A. H., Trimmer, M., Jetten, M. S. M., Peng, Y., Löffler, F. E., Tian, H., and Zhu, Y.-G.: Nitrous oxide sources, mechanisms and mitigation, Nat. Rev. Earth. Environ., https://doi.org/10.1038/s43017-025-00707-5, 2025.