
the Creative Commons Attribution 4.0 License.
the Creative Commons Attribution 4.0 License.
 | 05 Oct 2026
Variations in Arctic aerosol iron solubility in relation to leaching methodology, air mass characteristics, and seasonality

Alina M. Ebling
Peter L. Morton
William M. Landing
Clifton S. Buck
Atmospheric deposition of the essential micronutrient, iron (Fe), can have an important influence on primary production and marine biogeochemistry. In the Arctic Ocean, the ongoing shift towards seasonal ice coverage means that summertime atmospheric deposition increasingly takes place directly to the surface ocean, rather than onto sea ice. As a result, atmospheric deposition of material emitted from natural and anthropogenic sources may become a more relevant Fe input to the region. As part of the U.S. GEOTRACES GN01 section, aerosols and precipitation samples were collected to quantify the atmospheric delivery of Fe and other trace elements to the Arctic Ocean. Aerosol Fe solubility was assessed using three different leaching approaches. The readily soluble fraction, determined by rapid exposure leaches with ultrapure water (UPW) and filtered seawater (SW) was low throughout GN01, averaging 0.7 % and 1.6 %, respectively. Solubility determined using a more aggressive acetic acid (HAc) leach as an upper limit estimate of post-deposition aerosol Fe bioavailability averaged 44 %. Comparison to Fe UPW-solubility data from winter (median 6.5 %) and springtime (median 1.9 %) aerosol samples collected during the MOSAiC expedition suggests a strong seasonality to Arctic aerosol Fe solubility, potentially associated with winter/springtime Arctic haze. Summertime bulk deposition fluxes, calculated by applying the beryllium-7 method to GN01 data, were estimated at 0.9 ± 1.3 UPW-soluble Fe, 2.4 ± 1.9 SW-soluble Fe, and 46 ± 48 HAc-soluble Fe. Thus, the UPW-soluble Fe flux during GN01 was around an order of magnitude lower than that measured during the winter months despite bulk deposition velocity being almost twice as fast during the summer.
- Article
(2516 KB) - Full-text XML
-
Supplement
(4733 KB) - BibTeX
- EndNote


Supply of the crucial micronutrient, iron (Fe), to the surface ocean can influence the magnitude of primary productivity (de Baar et al., 1995; Martin et al., 1989; Martin and Fitzwater, 1988), algal community structure (Bruland et al., 2001; Moore et al., 2009), and biogeochemical cycles of carbon and major nutrients (Browning and Moore, 2023; Martin, 1990; Tagliabue et al., 2014, 2017). Deposition of continentally derived material from the atmosphere (either through gravitational settling or carried by precipitation) is an important supply mechanism of Fe to the surface ocean (Jickells et al., 2005; Jickells and Moore, 2015), and observational and experimental evidence indicates that this input can promote increased productivity by relieving iron limitation (Han et al., 2011; Achterberg et al., 2013; Tang et al., 2021). Globally, this input is dominated by continental emissions of mineral aerosol, particularly from arid midlatitude regions such as northern Africa and central Asia (Mahowald et al., 2005; Prospero et al., 2002; Shao et al., 2011). But other natural and anthropogenic sources, including volcanic eruptions, wildfires, fossil fuel combustion, and industrial activities such as smelting, also emit aerosol Fe and can make significant contributions to total aerosol Fe load (Hamilton et al., 2022; Ito, 2011; Luo et al., 2008; Olgun et al., 2011; Rathod et al., 2024; Rauch and Pacyna, 2009).
Not all the iron delivered to the ocean by atmospheric deposition is accessible to phytoplankton within the residence time of particles in the euphotic zone. A fraction of aerosol Fe is rapidly released into solution upon deposition, while further, gradual dissolution (assisted through complexation by dissolved organic ligands) competes with non-biogenic removal of dissolved Fe by scavenging and aggregation to modify the net aerosol Fe solubilization before material sinks below the euphotic zone (Baker and Croot, 2010; Boyd et al., 2010; Tagliabue et al., 2023). Understanding the degree to which atmospherically supplied Fe is bioavailable once in the ocean is crucial for modelling the impact of atmospheric deposition upon the marine ecosystem and the carbon cycle (Boyd and Ellwood, 2010; Tagliabue et al., 2016). However, directly measuring aerosol Fe bioavailability is complicated by variability of the surface ocean microbial community structure and water column properties, including the presence of different organic ligands that can complex Fe to increase its solubility above its very low inorganic solubility in oxic seawater (Baker and Croot, 2010; Gledhill and Buck, 2012). As such, various chemical leaching approaches have been developed to measure the operationally defined solubility of aerosol Fe as a proxy for its bioavailability – see Baker and Croot (2010) and Perron et al. (2020) for an overview of some of the approaches used.
Although comparison of data across different studies is complicated by the range of leaching methodologies used, there is a consensus that source and mineralogy are more important controls on Fe solubility than nuances of leach approach (Aguilar-Islas et al., 2010; Mackey et al., 2015). Iron in clays and glacial sediments is typically more soluble than Fe hydr-(oxides), while Fe associated with combustion aerosols is more soluble than that in mineral aerosols (Desboeufs et al., 2005; Journet et al., 2008; Schroth et al., 2009). Thus, anthropogenic aerosol Fe is thought to make an outsized contribution to atmospheric soluble Fe supply (Hamilton et al., 2020; Luo et al., 2008). Chemical processing and physical sorting of aerosols during transport are also thought to influence Fe solubility, through internal mixing of aerosol Fe with acidic inorganic aerosols and organic ligands, as well as an increase in surface area to volume ratio during transport due to more rapid settling of coarser particles (Baker and Jickells, 2006; Buck et al., 2013; McDaniel et al., 2019; Paris and Desboeufs, 2013). However, the relative importance of these various mechanisms remains uncertain (e.g., Baker et al., 2006; Shi et al., 2011).
Atmospheric Fe supply is thought to be less important for productivity in the Arctic Ocean, compared to more remote ocean regions. Dust deposition to the region is expected to be low due to its distance from major dust emission areas (Kok et al., 2021). A handful of studies measuring aerosol Fe concentrations in the central Arctic Ocean (primarily in summer months) support this (Gao et al., 2019; Guan et al., 2026; Kadko et al., 2016; Maenhaut et al., 1996; Marsay et al., 2018a, 2025). Instead, the broad continental shelves surrounding the ocean, significant river inflow into the basin, and transport of material across the basin by the Transpolar Drift are thought to be more important inputs of dissolved Fe to surface waters (Charette et al., 2020; Kadko et al., 2019; Klunder et al., 2012a, b). In addition, extensive (though increasingly seasonal) sea ice coverage means that atmospheric deposition does not occur directly to the ocean for much of the year and has the potential for further (photo)chemical and biological processing of Fe before being released into surface waters (Marsay et al., 2018b). Nevertheless, studying Arctic aerosols can provide useful information for understanding controls on aerosol Fe solubility and ground-truthing model predictions of the total and soluble Fe supply from atmospheric deposition.
Composition and concentration of aerosols in the Arctic atmosphere are characterized by strong seasonality. In the winter and spring, long-range transport to the Arctic from lower latitudes, combined with low precipitation rates, leads to a build-up of anthropogenic aerosols known as Arctic haze, characterized by higher concentrations of organic and acidic aerosols (Barrie, 1986; Schmale et al., 2022; Shaw, 1995). This transport includes mineral aerosol carried from distant sources to the south, which contribute more to dust loading during the spring, whereas locally sourced mineral aerosol dominates in the summer and autumn months (Groot Zwaaftink et al., 2016).
In this study, we discuss aerosol Fe solubility during the summertime U.S. GEOTRACES GN01 section, including a comparison of solubility using different leaching methods and the influence that different air masses have on our observations. Together with data from a separate study conducted in the Arctic winter and spring, we assess the seasonality of aerosol Fe solubility over the Arctic Ocean in the context of Arctic haze influence, and the implications of this phenomenon for atmospheric deposition of soluble Fe over the course of the year.
2.1 Sample collection
Aerosol and precipitation samples were collected during the U.S. GEOTRACES Western Arctic (GN01) Section on USCGC Healy between 9 August and 12 October 2015. The cruise track consisted of a northward transect from Dutch Harbor across the Bering Sea and Makarov Basin to the North Pole and return transect across the Canada Basin towards the northern coast of Alaska, before returning to Dutch Harbor (Fig. 1).
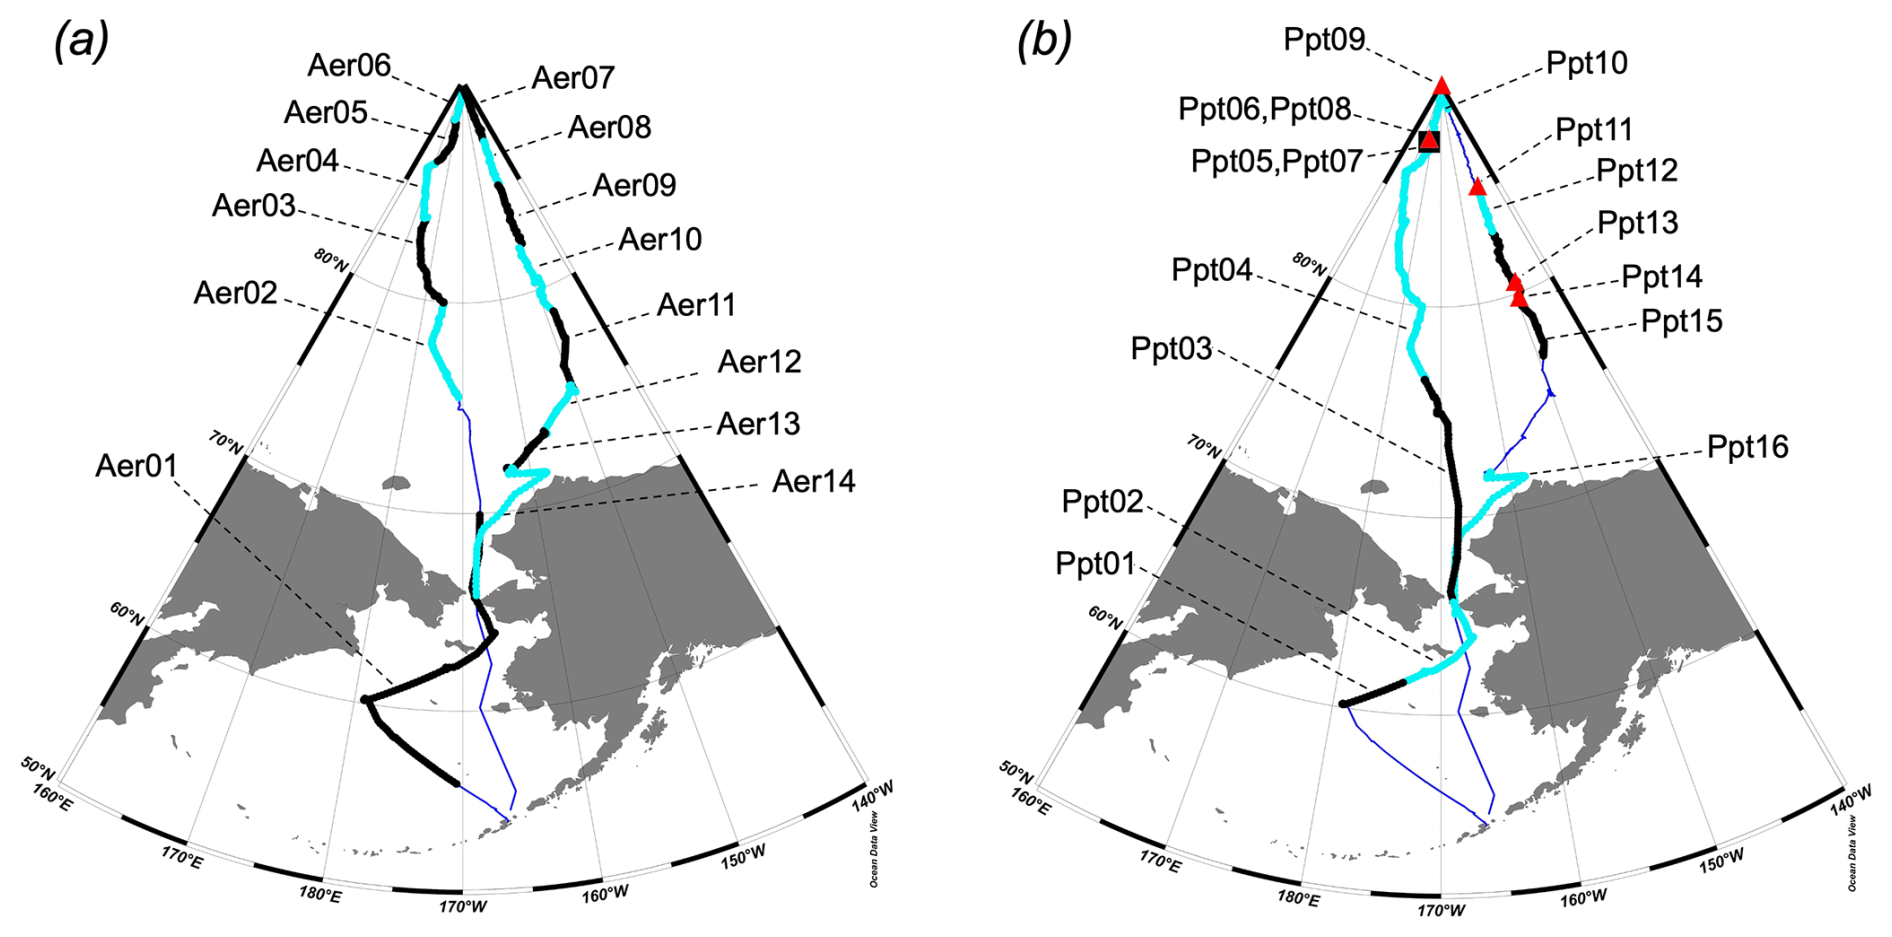
Figure 1Locations of (a) bulk aerosol and (b) precipitation samples collected during GN01. Cruise track is shown by thin blue line with aerosol or N-CON precipitation sample collections overlain in black and cyan on each map. Red triangles in (b) indicate locations of blowing snow samples collected with cutoff bottles, while the black square indicates two N-CON samples (Ppt06, Ppt08) collected close to each other and to cutoff bottle samples Ppt05 and Ppt07. The figure was created using Ocean Data View (ODV), version 5.7.2, developed by Schlitzer (2025).
Bulk aerosol samples (i.e., with no size fractionation) for trace element (TE) analyses were collected on three high volume aerosol samplers (∼1.2 m3 air min−1; Tisch Environmental, model 5170V-BL) installed above the ship's bridge, approximately 23 m above sea level. Each sampler was loaded with a set of twelve open-face filter holders loaded with 47 mm diameter acid-washed cellulose Whatman 41 filters (Marsay et al., 2018a). Thus, each deployment produced up to 36 near-replicate filters – assuming synchronised start and end times, there would be only slight differences in the volume of air filtered between different samplers. To avoid potential contamination from stack exhaust emissions, the samplers were interfaced with an anemometer and wind vane installed nearby, which restricted sampling to periods when the wind was blowing from forward of the ship for at least five continuous minutes.
Aerosol deployment times ranged from 2–7 d, with the prevalence of “in-sector” conditions dictating run time and the volume of air sampled. Across 14 deployments the average amount of air pulled through each filter was 165 m3. Power issues during Aer01 resulted in uncertainties about sampler runtime and therefore volume of air filtered, along with significant differences between individual samplers, while technical problems during Aer05 resulted in only 13 m3 of air being drawn through each filter. As such, data for Aer05 are not discussed here. Aerosol deployments are represented in Fig. 1a, while full details (dates and locations of sample deployments and recoveries) are listed in Table 1 of Marsay et al. (2018a), which describes total TE aerosol loading during GN01.
Table 1Details of GN01 precipitation samples, listed by time of recovery. “*” denotes sample collected using cut-off bottles. Due to low sample volumes for bucket (N-CON) samples, many included a rinse of the funnel and bottle with UPW (see footnotes). Where two volumes are given, first is for unfiltered sample and second is for filtered sample.
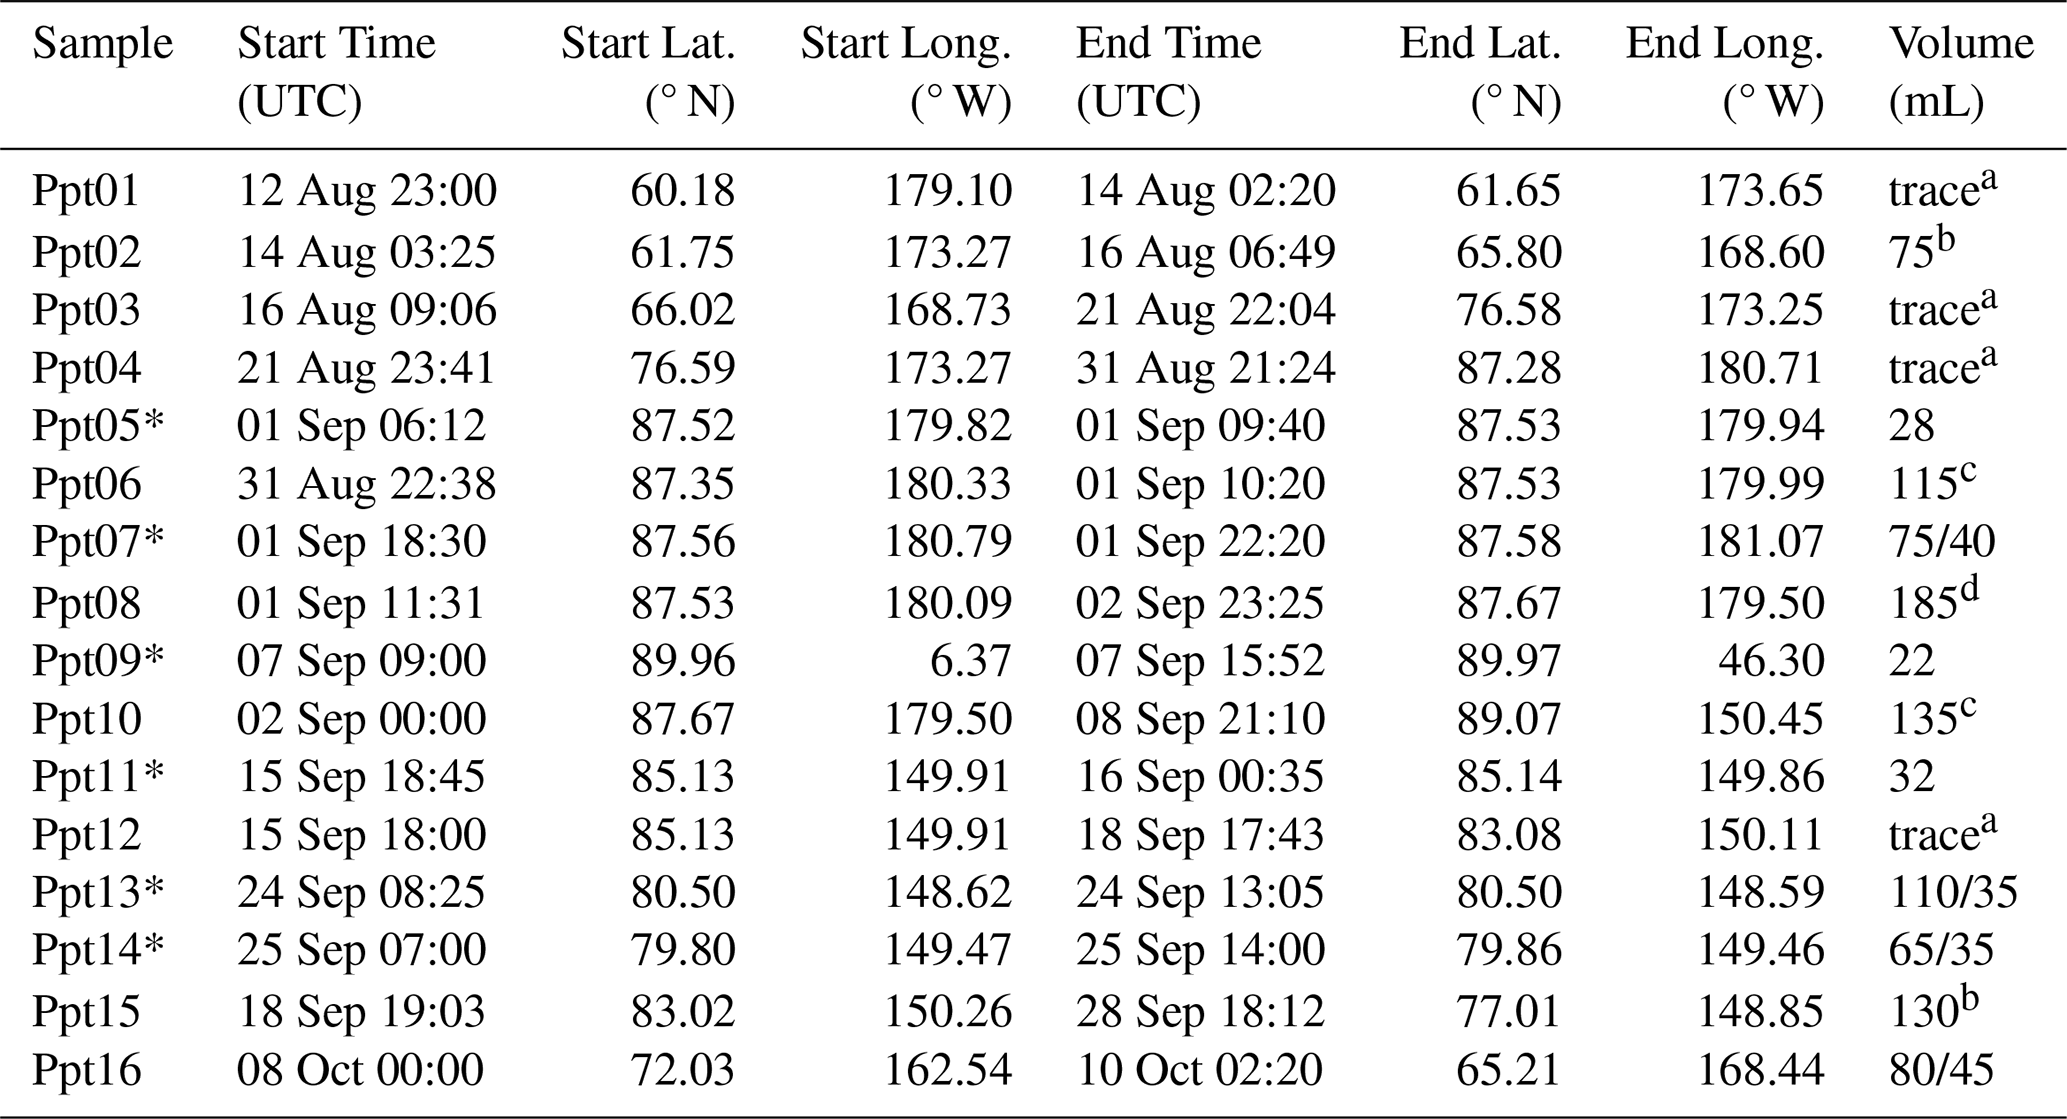
a No measurable volume. Funnel and bottle rinsed with 100 mL of UPW. b Volume includes 50 mL of UPW rinse. c Volume includes 100 mL of UPW rinse. d Volume includes 75 mL of UPW rinse.
An automated wet deposition sampler (N-CON Systems, model 120 ADS) was deployed alongside the aerosol samplers to collect rain and/or snow samples. The sampler was outfitted with a bucket that contained a funnel connected to a polyethylene bottle, both acid-cleaned for trace element use prior to the expedition. After each sample recovery a fresh funnel and receiving bottle were installed and samples were processed underneath a HEPA-blower inside a “bubble” constructed for TE work inside the ship's main laboratory. Recovered funnels and bottles were rinsed with 0.1 M distilled hydrochloric acid (HCl) and ultrapure water (UPW, 18.2 MΩ cm) before being reused. Only one significant rain event (Ppt16) took place during GN01. During the remainder of the cruise, any rainfall was typically light and of short duration, while the wet deposition sampler proved inefficient at sampling snow during windy conditions, and so individual N-CON precipitation samples were often deployed for several days, opening intermittently for small precipitation events, and thus represent temporally and spatially integrated samples (Fig. 1b).
In addition to the wet deposition sampler, snow samples were collected during blizzard conditions on six occasions. For this, two 2 L high-density polyethylene (HDPE) bottles had their bases removed to create a wide opening. The two cut-off bottles, which had also been acid-cleaned before their initial deployment, were uncapped and secured in place above the bridge during blizzard events, oriented with the wide opening facing the wind so that snow collected on the inside surface of each bottle. After the blizzard, the bottles were removed, recapped and placed upside down in resealable plastic bags, then transferred to the “bubble” where the collected snow was allowed to melt over the space of a few minutes. The cut-off bottles were thoroughly rinsed with 0.1 M HCl and UPW between deployments. Details of all wet deposition samples are provided in Table 1, while sampling locations are summarized in Fig. 1b.
2.2 Aerosol sample processing
After sample recovery, filters were stored frozen (−20 °C) until further processing. Replicate filters from each deployment were designated for strong acid digestion for total TE measurements, or for leaching with UPW, filtered seawater or an acetic acid solution. All UPW and seawater leaches were carried out at sea, inside the “bubble” and underneath a HEPA-filtered air blower, while total digests and acetic acid leaches were carried out back on land, at Florida State University. All plasticware used during sample processing was acid-washed in advance using TE clean protocols.
2.2.1 Total TE determination
Total TE concentrations in GN01 aerosol samples have been published previously (Marsay et al., 2018a). Briefly, 1–3 replicate sample filters were fully digested using a three-step strong acid digestion procedure that combined concentrated acids (HNO3, HF) and heating on a hotplate at 140 °C (Morton et al., 2013). After the third digestion step, samples were dried down and redissolved in 4 mL of 0.32 M quartz-distilled HNO3.
2.2.2 Ultrapure water (UPW) leach
Three replicate filters from each deployment were leached with UPW using a protocol adapted from Buck et al. (2006). Each filter was loaded on a perfluoroalkoxy (PFA) filter rig (Savillex) attached to a custom-built acrylic vacuum chamber containing a 100 mL low-density polyethylene (LDPE) bottle. A 0.4 µm polycarbonate membrane, previously acid-washed following procedures described in Planquette and Sherrell (2012), was loaded on the filter rig beneath the aerosol filter as a backing filter to prevent any particles being washed through into the collection bottle. After applying a gentle vacuum to the chamber, 100 mL of UPW was poured over the aerosol filter and quickly drawn through into the collection bottle. Samples were processed in four separate batches throughout the cruise. For each batch at least three unused, acid-washed W41 filters were also leached with UPW to provide filter blanks.
From each UPW leach, a 5 mL subsample was poured into a HDPE vial for analysis of major inorganic cations and anions and water-soluble organic species. Major ions subsamples were stored frozen (−20 °C) and the remaining leachate volumes were acidified to 0.024 M HCl using 6 M quartz-distilled HCl. Measurements of major inorganic ions and water-soluble organic species during GN01 have been reported previously (Mukherjee et al., 2021).
2.2.3 Filtered seawater (SW) leach
A further three replicate filters from every deployment were each leached with 100 mL of 0.2 µm-filtered seawater (SW) using the same setup and procedure described for the UPW leach. Samples were leached at sea in three separate batches, each time using filtered seawater that had been recently collected using trace metal clean protocols (Whitmore et al., 2019; see Table S1 in the Supplement for collection details), and at least three unused filters were leached with the same seawater each time to provide filter blanks specific to the batch of filtered SW. All leachates were acidified to 0.024 M HCl using 6 M quartz-distilled HCl.
2.2.4 Acetic acid (HAc) leach
Between one and three replicate filters from each deployment were treated with a more aggressive acetic acid (HAc) leach that also included a reducing agent and a heating step. The procedure, originally developed for determining biologically available TEs in marine particles (Berger et al., 2008), was slightly modified for aerosol samples (Ebling and Landing, 2015). Briefly, each filter was folded and added to a centrifuge tube, to which 5 mL of 4.4 M HAc with 0.02 M hydroxylamine hydrochloride was added. Samples were heated for ten minutes at 90 °C in a water bath, then cooled to room temperature for 12–16 h. The leachate solution was decanted off into a sample bottle, along with a UPW rinse, and diluted to a final concentration of 0.44 M acetic acid.
2.3 Wet deposition sample processing
Rain and snow samples were processed as soon as samples were recovered and any snow had melted. For samples collected using the N-CON sampler, the sample was transferred directly to a 100 mL LDPE bottle if sufficient volume was present. For smaller volumes, a known volume of UPW was poured into the collection bottle via the funnel and then the mixture of sample and rinse were poured into a sample bottle. In such cases, a UPW blank was also kept to correct for any potential rinse contribution to measured TE concentrations (generally <1 % for Fe measurements). For snow samples collected with cut-off bottles, the melted snow was poured directly into a 100 mL LDPE bottle. Subsamples (5 mL) were taken from each precipitation sample and stored frozen for major ions analyses. In addition, subsamples from one large rain event and three snow samples were filtered through a 0.2 µm polycarbonate membrane and transferred to separate 100 mL bottles (Table 1). All unfiltered and filtered precipitation samples for TE analyses were acidified to 0.024 M HCl within an hour of sample recovery.
2.4 Trace element determination
All UPW and SW leaches and precipitation samples were analysed for Fe and other TEs at Skidaway Institute of Oceanography by inductively coupled plasma mass spectrometry (ICP-MS; Perkin-Elmer NexION 300D) following in-line pre-concentration on a cation exchange column (Nobias Chelate-PA1 resin) incorporated into a seaFAST S3 flow-injection system (Elemental Scientific Inc). Precipitation samples were stored acidified for at least six months before analysis. Samples were analysed alongside external multi-element standards. HAc leaches were analysed at the National High Magnetic Field Lab (NHMFL) on a Thermo-Element 2 high resolution ICP-MS, as were aerosol digests (Marsay et al., 2018a).
For all leach and digest samples, measured concentrations (ppb) were converted to ng values by multiplying by the mass of solution analysed. For UPW and SW leaches, this was the mass of leaching agent used (seawater mass was calculated as volume used × 1.025 g mL−1 for the density of seawater), while for HAc leaches and acid digests, it was the mass of solution after redissolving and/or diluting the leachate/digest. For replicate treatments, the average and one standard deviation (1σ) of replicates were then calculated, and the average filter blank subtracted from the sample value. For UPW and HAc leaches, an overall filter blank was applied, while batch-specific filter blanks were applied for SW leaches due to greater variability between batches (Table S2 in the Supplement). Blank-corrected values were converted to moles and divided by the volume of air filtered through each filter to give pmol m−3 values.
For UPW and SW leaches, triplicate samples were processed for all deployments. For digests and HAc leaches, only a subset of deployments had triplicate subsamples processed. The average precision (as relative standard deviation) from these replicate measurements was then applied to all other deployments. In all cases, reported uncertainties of blank-corrected aerosol concentrations represent propagation of the precision (1σ) from samples and filter blanks.
3.1 Arctic aerosol Fe solubility determined using different approaches
One of the difficulties in quantifying the impact of atmospheric Fe deposition on marine biogeochemistry is determining the fraction of total aerosol Fe that is available for biological uptake in the surface ocean. Operationally defined Fe solubility is used as a proxy for bioavailability, but a multitude of approaches are used, using different leaching agents, conditions (temperature, pH, etc.), and exposure times (e.g., Li et al., 2023, 2024; Tang et al., 2025). Each method represents a trade-off between accurate characterization of natural processes and practical and logistical constraints.
Soluble aerosol Fe concentrations determined in GN01 samples using UPW, SW, and HAc leaches are displayed by deployment number in Fig. 2, along with total aerosol Fe concentrations and are also provided in Table S3 in the Supplement. Concentrations for Aer05 are excluded because of the low volume of air sampled, while no SW leach was carried out for Aer14. Low aerosol loading and low Fe solubility throughout GN01 resulted in an average filter blank/sample ratio of 58 % for UPW leaches and 60 % for SW leaches (Table S4 in the Supplement), with leachate Fe concentrations less than the average filter blank for Aer08 (UPW and SW) and Aer13 (SW only).
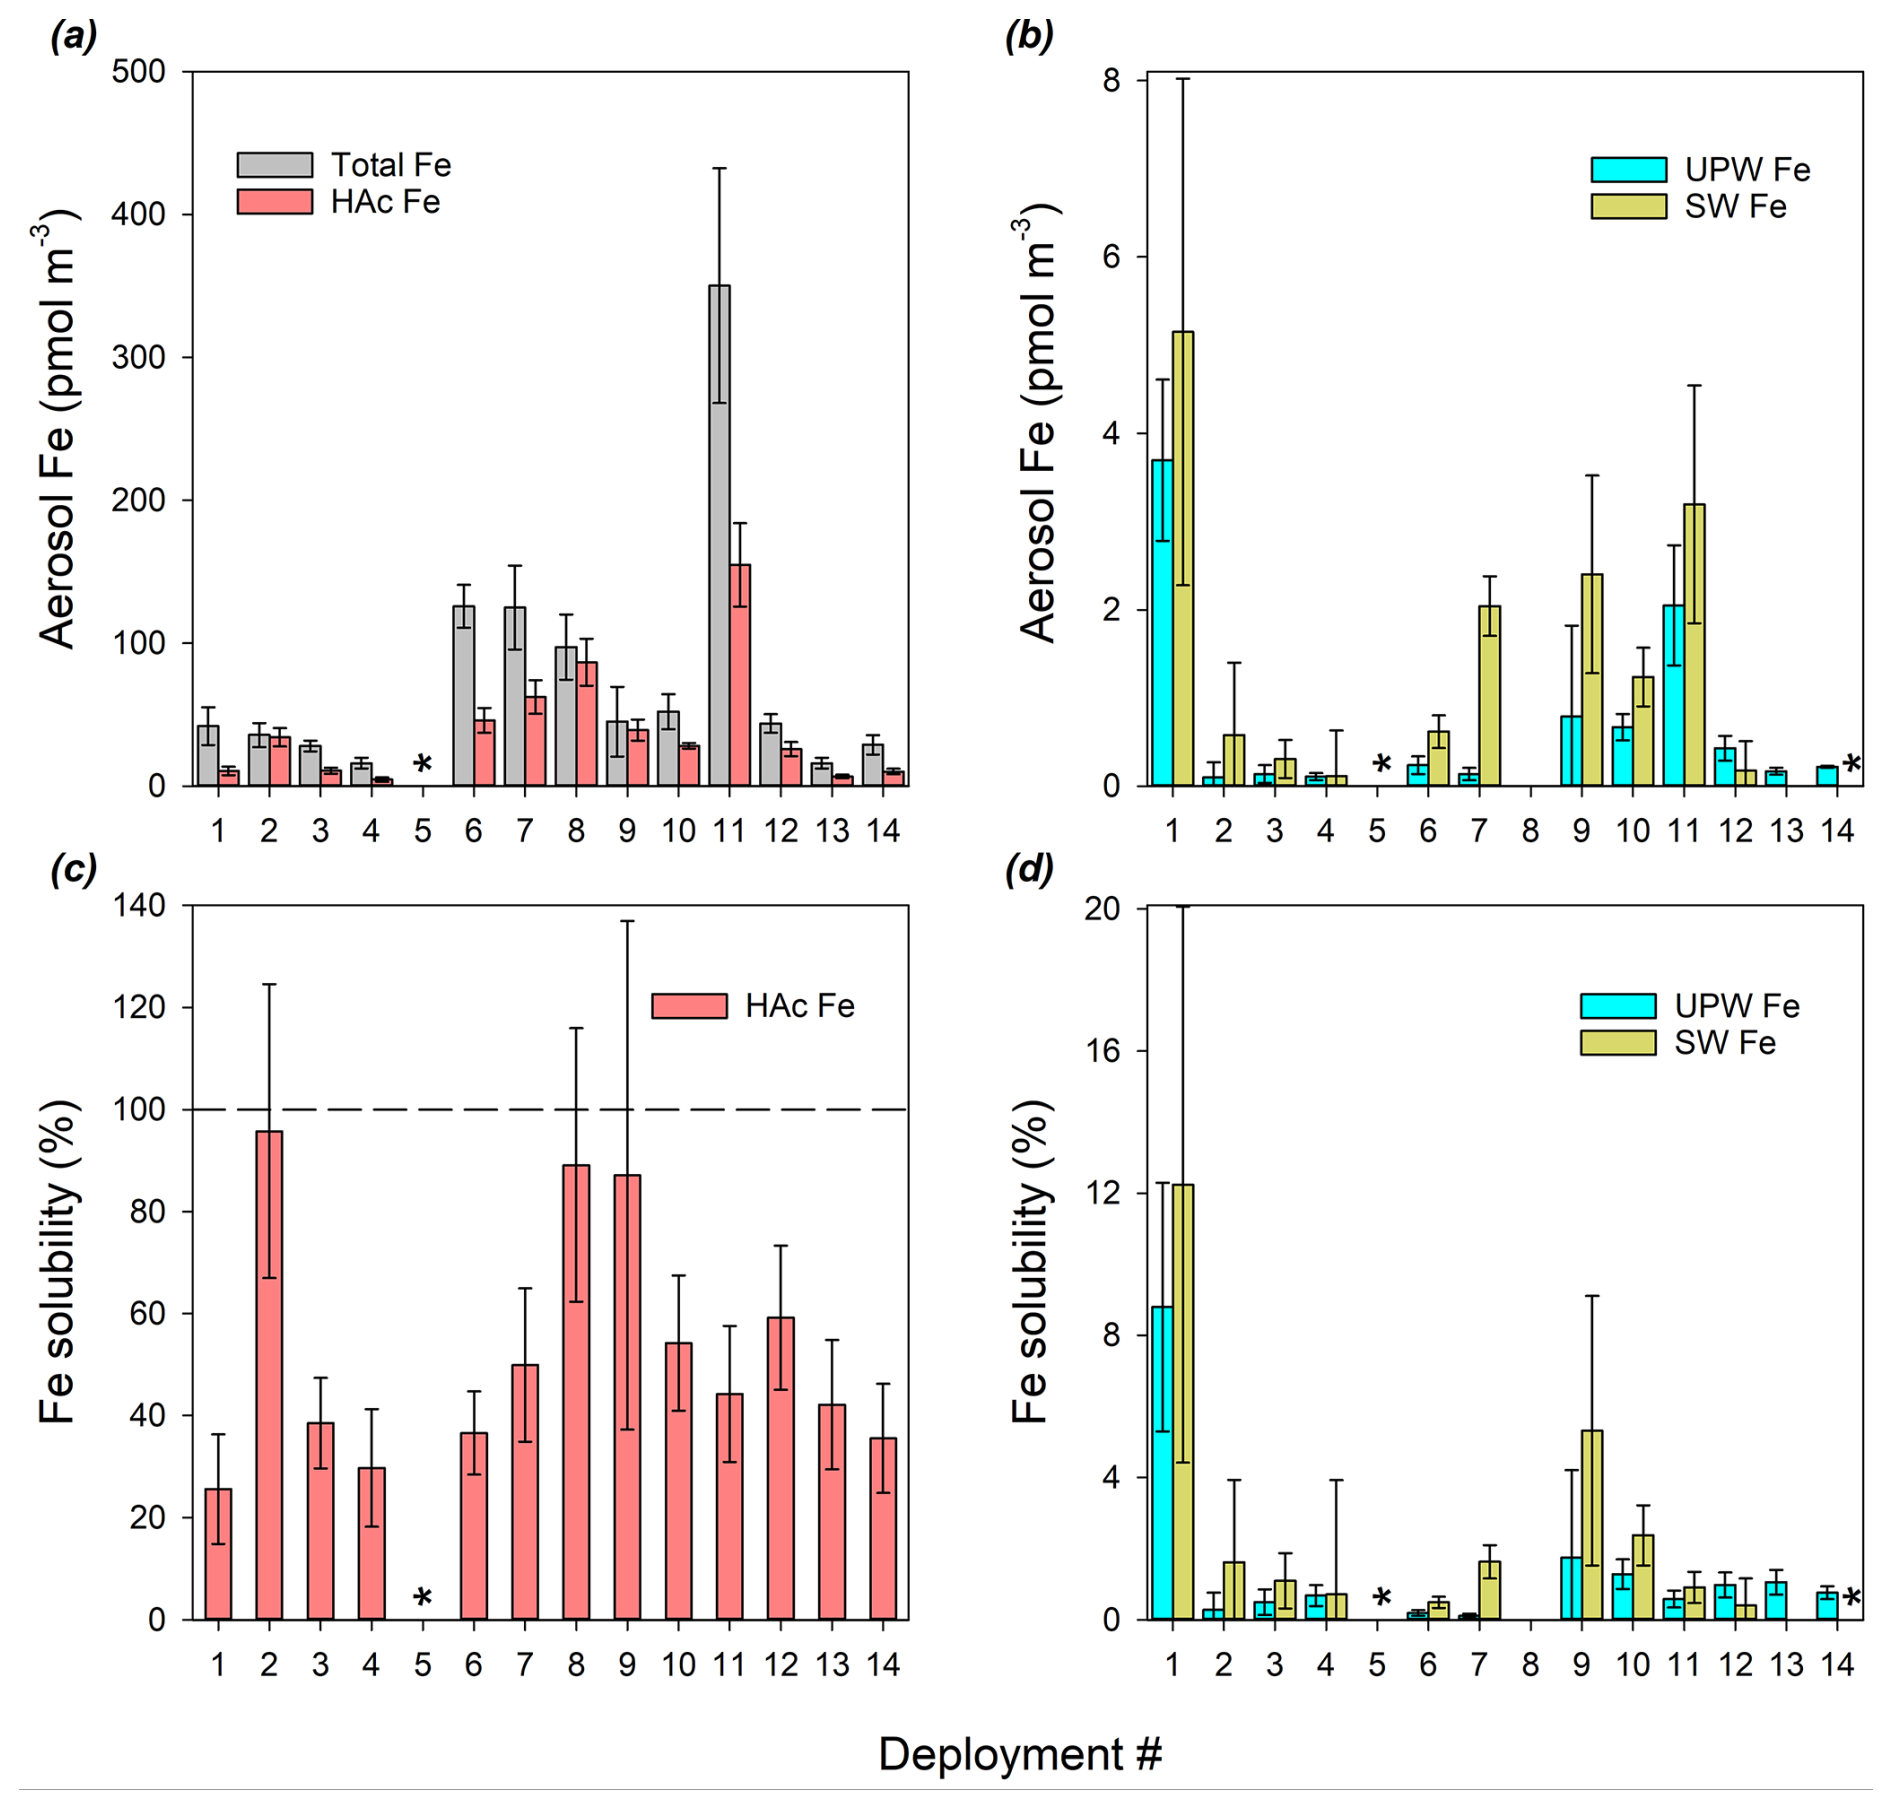
Figure 2Aerosol Fe concentrations and Fe fractional solubility in GN01 aerosols, where fractional solubility is the ratio of soluble to total Fe, expressed as a percentage. (a) Concentrations of total Fe and HAc-soluble Fe, (b) concentrations of UPW-soluble and SW-soluble Fe, (c) fractional solubility of Fe in the HAc leach, (d) fractional solubility of Fe in the UPW and SW leaches. Asterisks indicate no data (Aer05, SW leach of Aer14). Values for Aer08 (UPW and SW leaches) and Aer13 (SW leach only) were less than average filter blank. Error bars are propagated error as described in the text and include air volume uncertainty for Aer01. Dashed line in (c) marks 100 %.
UPW-soluble aerosol Fe concentrations ranged from 0.1–3.7 pmol m−3 (Fig. 2b), with concentrations <1 pmol m−3 measured for all deployments except Aer01 (3.7 pmol m−3), collected while traversing the Bering Sea and Chukchi Sea, and Aer11 (2.1 pmol m−3), collected between 75–78° N in the Canada Basin (Fig. 1). One sample (Aer08) was measured at less than the filter blank, while two others (Aer02, Aer09) were indistinguishable from zero within propagated uncertainty once blank-corrected. Concentrations of SW-soluble aerosol Fe ranged from 0.1–5.1 pmol m−3 (Fig. 2b), with the highest concentration again measured in Aer01. Higher filter blanks for the SW leach, which included an Fe contribution dependent upon the SW batch used (Tables S1 and S2), resulted in two samples (Aer08, Aer13) being measured at less than the filter blank and three others (Aer02, Aer04, Aer12) indistinguishable from the blank within measurement uncertainty. Concentrations of HAc-soluble aerosol Fe were notably higher, ranging from 4.8–155 pmol m−3 (Fig. 2a), with the highest value associated with Aer11.
Fractional solubility of Fe determined by each of the three leaching schemes is also presented in Fig. 2, calculated as the amount of Fe released by the leach divided by the total Fe released by strong acid digestion. Solubility in the UPW leach ranged from 0.1 %–8.8 % (Fig. 2d), with a median value (excluding Aer02, Aer08, Aer09) of 0.7 %. Aer01 had the highest fractional solubility, with no other sample being higher than 1.7 %, and the lowest value was determined for Aer07, collected near the North Pole. Fractional solubility in SW spanned a similar range (0.5 %–12.2 %; Fig. 2d), with a median value of 1.6 %, excluding five values less than or indistinguishable from the filter blank. As with the UPW leach, highest Fe solubility in SW leaches was measured for Aer01. Iron solubility in the HAc leach was significantly higher than in either the UPW or SW leaches, ranging from 26 %–96 % (Fig. 2c), with a median value of 44 %. In contrast to the flow-through leaches, Aer01 had the lowest HAc solubility, while the highest value was determined for Aer02.
The SW and UPW leaches used here were both developed as a way of determining the fraction of Fe “instantaneously” released from aerosols following deposition to the air/sea interface or during scavenging of aerosol particles by rainfall (Buck et al., 2006). Using filtered surface seawater is more representative of the sea surface environment to which atmospheric deposition takes place, but as an extraction medium it is also highly variable in terms of organic ligand concentration and dissolved Fe concentration (and therefore leach blanks; Table S2), making comparison between studies using SW more difficult. The benefit of using UPW is that it can provide a more standardized approach, allowing for easier intercomparison between different studies. It's lower pH (∼5.6), relative to seawater (pH∼8.1), is also more representative of the lower pH of rainfall (typically in the range of pH 4 to pH 6), which can play a major role in atmospheric deposition in some regions (Duce et al., 1991; Spokes et al., 1994). In addition, direct comparison of the two leaches (i.e., using the same flow-through method but with UPW or SW) has previously demonstrated that, although Fe solubility is typically slightly higher in the UPW leach than in SW, aerosol source typically has a greater influence on variability in Fe solubility than the choice of UPW or SW as leaching agent (Aguilar-Islas et al., 2010; Buck et al., 2006, 2010; Shelley et al., 2018).
Reports in previous studies of generally higher Fe solubility in UPW, relative to SW, have been attributed to the lower pH of UPW versus seawater (Buck et al., 2006, 2010, 2013; Shelley et al., 2018). Such a relationship was not found in the GN01 aerosols, with Fe solubility significantly higher in SW leaches than in paired UPW leaches (Wilcoxon Signed Rank, p=0.014) (Fig. 2d). However, this may simply reflect the combination of low aerosol loading and low Fe solubility in GN01 samples, resulting in relatively high blank/sample ratios and thus relatively high uncertainty in soluble Fe loading determined by the two approaches (Fig. 2b and d). Power issues while sampling Aer01 also resulted in a much lower volume of air filtered by sampler 2 (from which filters for SW leaches were taken) versus sampler 1 (from which filters for total digests and UPW and HAc leaches were taken) for that sample. Thus, the higher solubility calculated for the SW leach in Aer01 may also reflect differences in the integrated aerosol load of the two samplers.
The higher solubility measured in all samples using the HAc leach, relative to UPW and SW leaches, is expected given the more aggressive leaching conditions involved – a significantly lower pH of 2, a short heating step at 90–95 °C, the inclusion of a reducing agent, and a longer total contact time of 12–16 h. The approach was based on a protocol to assess labile forms of Fe and other metals in pelagic sediments (Chester and Hughes, 1967) and adapted to quantify the bioavailable fraction of particulate trace metals in seawater samples, with the aim of solubilizing the fraction of metals that would be available to phytoplankton in the timeframe of days through grazing, photochemistry, redox processes, and ligand-assisted dissolution (Berger et al., 2008). This fraction would include biogenic material, metals bound to the surface of aluminosilicate clays, and some oxyhydroxide phases. The fact that aerosols had and close to (and often less than) crustal averages throughout GN01 suggests that although the aerosol Fe concentration was low it was dominated by mineral aerosol loading (Marsay et al., 2018a). Thus, the high Fe solubility in the HAc leach (averaging 53 % ± 23 %) suggests that a substantial fraction of mineral aerosol Fe was accessible to the leach, potentially due to the material being relatively weathered either before or during atmospheric transport.
3.2 Comparison to other Arctic aerosol Fe solubility data
There are few previous studies of Fe solubility in Arctic aerosols. Fractional Fe solubility determined for GN01 aerosols using the different methods is summarized in Table 2, alongside previously reported values. These include bulk aerosol samples collected during another GEOTRACES study (GN02; De Vera et al., 2021) and the Multidisciplinary drifting Observatory for the Study of Arctic Climate (MOSAiC) Expedition (Marsay et al., 2025) using similar UPW and HAc leaching approaches; a bulk aerosol time-series study in Kevo, Finland (69.8° N), using a UPW leach with a longer exposure time (Laing et al., 2014a); and size-fractionated samples collected using a low-volume Micro-Orifice Uniform Deposition Impactor (MOUDI) sampler during GN01, which were leached using ammonium acetate (Gao et al., 2019).
Table 2Comparison of Arctic aerosol Fe solubility (%Fesol) determined in this and other studies. Aerosol leaching approach is described as Bulk or size-fractionated (SF) samples, UPW, SW, ammonium acetate (NH4Ac), or HAc leach, flow through (FT) or batch leaching. CAA refers to Canadian Arctic Archipelago. “NA” indicates not available.
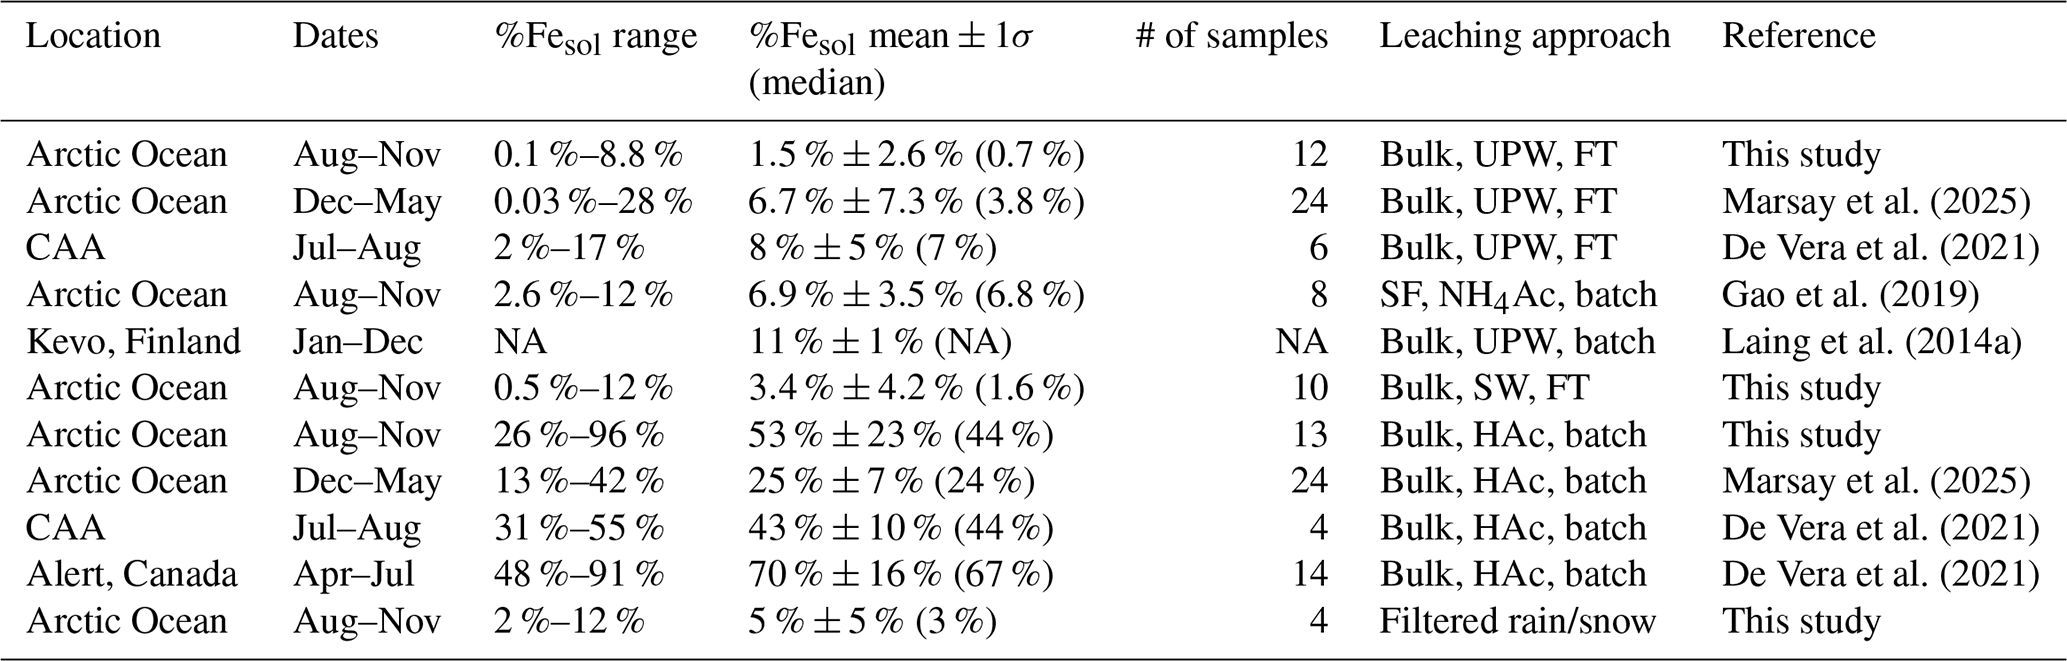
Reported UPW Fe solubility for six aerosol samples collected between 49–74° N during GN02 in summer 2015 (2 %–17 %, averaging 8 %; De Vera et al., 2021) was higher than that during GN01, despite total Fe concentration covering a similar range (41–269 pmol m−3, median 99 pmol m−3) to the GN01 samples (16–350 pmol m−3, median 43 pmol m−3). It is unclear to what extent the solubility differences between the two studies reflect natural variability versus slight differences in the leaching protocol. Although total Fe and Al concentrations measured during GN02 were similar to those measured during GN01, V concentrations in the former were approximately five times higher (Marsay et al., 2018a; De Vera et al., 2021). This suggests a greater contribution from fossil fuel combustion aerosols that have been linked to higher aerosol Fe solubility (Sedwick et al., 2007) and may reflect the GN02 cruise track being generally further south and potentially more influenced by anthropogenic emissions. However, GN02 samples were also leached with 3×30 mL aliquots of UPW, rather than a single 100 mL aliquot as used during GN01, while there is no mention of a backing filter being used during leaching for the GN02 study (De Vera et al., 2021). While several studies assessing Fe release into multiple aliquots of UPW have reported >90 % of soluble Fe being leached by the first aliquot (Buck et al., 2006; Fishwick et al., 2014; Winton et al., 2015), an experiment by Winton et al. (2016) using multiple sequential leaches with 50 mL aliquots of UPW reported only 30 %–70 % of soluble Fe was released into the initial aliquot. A recent intercomparison study observed generally higher Fe solubility from the UPW flow-through approach if no backing filter was used (Tang et al., 2025). Thus, it is possible that the slight difference in approach may also have influenced results.
Aerosol Fe solubility determined by UPW leach during the MOSAiC Expedition between December 2019 and May 2020 was also typically higher than during GN01 (<0.1 %–28.1 %, median 3.8 %). In this case, the same leaching approach was used as during GN01 (i.e., one 100 mL UPW leach, using a backing filter), and so we can be confident that the differences are due to aerosol properties. Comparison of UPW-leachable Fe between GN01 and MOSAiC aerosols is discussed more in Sect. 3.4.
Laing et al. (2014a) measured aerosol Fe solubility in UPW for a time-series of aerosols collected at Kevo, in the Finnish Arctic. Average Fe solubility reported for that study (11 % ± 1 %) was also higher than during GN01, though it was measured using a 24 h extraction with UPW rather than a rapid flow-through leach. The Kevo samples were also collected in a continental region with significantly higher loading of anthropogenic aerosols (Laing et al., 2014a, b) which is likely to have influenced aerosol Fe solubility. In addition, the authors noted that Fe fractional solubility calculations may have been biased upwards due to incomplete digestion of aluminosilicates (Laing et al., 2014a).
Iron solubility determined using the HAc approach during GN01 was similar to that of a small number of samples treated during GN02 (averaging 43 % ± 10 %), and during spring and early summer at Alert, Canada (70 % ± 16 %), but was higher than that during MOSAiC (25 % ± 7 %), despite UPW solubility during GN01 being lower than during MOSAiC. This difference may arise because of total contact time between sample and leaching agent, which was restricted to two hours during MOSAiC, but lasted for 12–16 h during the GEOTRACES studies. In addition, MOSAiC samples were leached using UPW and HAc methods sequentially, without the backing filter from the UPW leach being subject to the HAc leach. Thus, it is possible that the MOSAiC HAc solubility was underestimated (Marsay et al., 2025).
MOUDI samples collected during GN01 were collected over ten size fractions using a lower flow rate (30 L min−1) than the bulk samplers, and a portion of filter for each size fraction was leached with 0.5 mM ammonium acetate (pH 5.3) for one hour (Gao et al., 2019). The values in Table 2 represent weight-averaged solubility by deployment, which masks variability between different aerosol size classes. For example, within the same dataset, Fe solubility of coarse particles (i.e., averaged for all size-classes >1 µm for each sample) ranged from 0.8 %–8.7 %, while fine particle (<1 µm) Fe solubility was generally higher, spanning 4.1 %–17 % (Gao et al., 2019). Unsurprisingly, weight-averaged Fe solubility determined on MOUDI samples during GN01 fell between that assessed by UPW and HAc leaches, as also observed during a recent intercomparison of leaching protocols (Tang et al., 2025). This reflects the longer contact time between sample and solution compared to the UPW leach, along with the presence of the acetate ligand in the leaching solution, but higher pH, lower temperature, and shorter contact time compared to the HAc leach applied to bulk aerosols.
Solubility of Fe in GN01 wet deposition samples is also included in Table 2. Concentrations of Fe in rain and snow samples during GN01 are presented in Fig. 3, along with the percent of Fe in the dissolved (<0.2 µm) phase immediately after recovery for four samples (concentrations of other TEs in precipitation samples are summarized in Fig. S1 in the Supplement). From these four precipitation samples, average Fe solubility was roughly 4 times higher than for aerosol Fe UPW-solubility (Table 2), though this drops to 2 times higher if we exclude Ppt13, which had a notably higher dissolved Fe percentage than the other three filtered precipitation samples (Fig. 3b). This trend was shared by other measured TEs, with average solubility determined for precipitation samples typically being higher than that measured for the UPW leach of aerosols by a factor of 2 to 5, but by as much as 12 times for Ti (Fig. S2 in the Supplement). This could potentially be due to precipitation samples incorporating different populations of aerosols (from the free troposphere as well as the boundary layer) during deposition compared to aerosols collected within the boundary layer (Church et al., 1990), or due to a lower pH in precipitation samples compared to the UPW leach (pH 5.6) facilitating greater solubilisation of Fe (e.g., Spokes et al., 1994). Unfortunately, this cannot be checked as pH was not measured in GN01 precipitation samples.
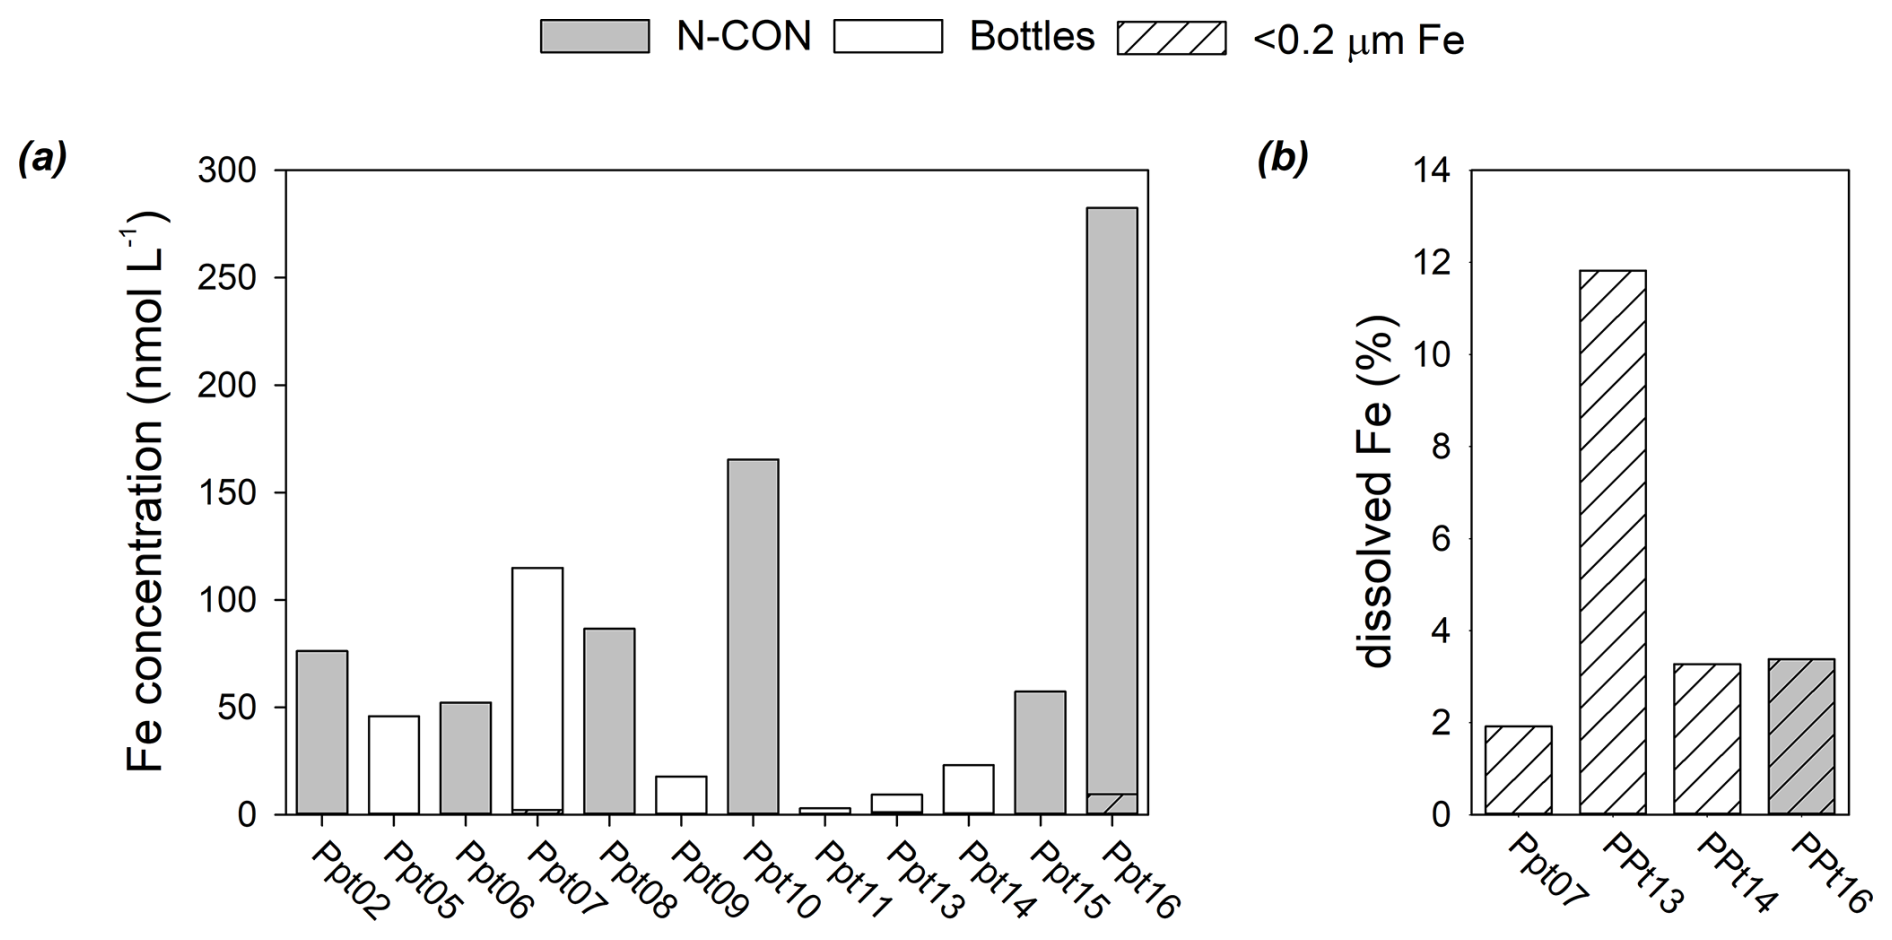
Figure 3Iron concentration and solubility in GN01 precipitation samples. (a) Total dissolvable and dissolved Fe concentrations in precipitation samples collected by N-CON sampler and cut-off bottles, with dissolved Fe contributions to four samples indicated by hatching. (b) Percent of total dissolvable Fe in the dissolved fraction at the time of sample recovery for four samples where a subsample was filtered.
However, it may also represent incomplete solubilization of refractory particles collected in unfiltered precipitation samples, which were acidified to 0.024 M HCl and stored for over six months before analysis, whereas aerosol sample replicates were fully digested with a multi-step, strong acid digestion (Marsay et al., 2018a). A comparison of North Atlantic rain samples treated with a strong acid digest to corresponding samples acidified as described here found that the latter typically recovered less than 30 % of total Fe, albeit in a region with high mineral aerosol loading (Tian et al., 2008). For this reason, previous studies using a similar acidification approach to the GN01 precipitation sampling have identified Fe and other TEs measured in unfiltered rain samples as “total dissolvable” rather than “total” (e.g., Sedwick et al., 2007). This would suggest that the estimated Fe solubility from GN01 precipitation samples is likely an overestimate.
3.3 Spatial and air mass related variations in GN01 aerosol Fe solubility
Air mass provenance and transport time can each play a significant role in determining aerosol characteristics, and air mass back trajectories are often used to assess potential source regions for sampled aerosols. Mukherjee et al. (2021) discussed water-soluble inorganic and organic aerosol species during GN01 by grouping samples together based on shared characteristics of air mass influences. Using the NOAA HYSPLIT model (Rolph et al., 2017; Stein et al., 2015), they calculated 100 h air mass back trajectories (AMBTs) at 6 h intervals for every aerosol deployment and grouped them together to produce a density plot showing relative spatial frequency of back trajectories. Group 1 (consisting of sample Aer01 only) was assessed to have been dominated by air masses that had spent time over the North Pacific and Bering Sea, with smaller contributions from marine Arctic air (air masses that had remained over the Arctic Ocean for the previous ∼4 d) and coastal Arctic air masses that had spent time over continental North America and Russia around the margins of the Arctic Ocean. Samples Aer02–Aer09 were grouped together (Group 2) as being dominated by marine Arctic air masses, while Aer10–Aer14 were grouped together (Group 3) as including a mix of Arctic continental influence (from both North America and eastern Russia) and marine Arctic air masses (Mukherjee et al., 2021).
A similar comparison of the distribution of AMBTs for these three groups is presented in Fig. S3 in the Supplement. Aerosol Fe concentration and solubility for each of the three groups are summarized in Table 3. Also included are concentrations of some major inorganic aerosol components for bulk aerosols (Mukherjee et al., 2021) and Fe solubility data for MOUDI samples, which typically spanned one or two bulk aerosol sample deployments (Gao et al., 2019).
Table 3Summary of GN01 aerosol characteristics based on air mass influence. Values are the mean and standard deviation of the deployments listed except for Group 1 (Aer01 only).
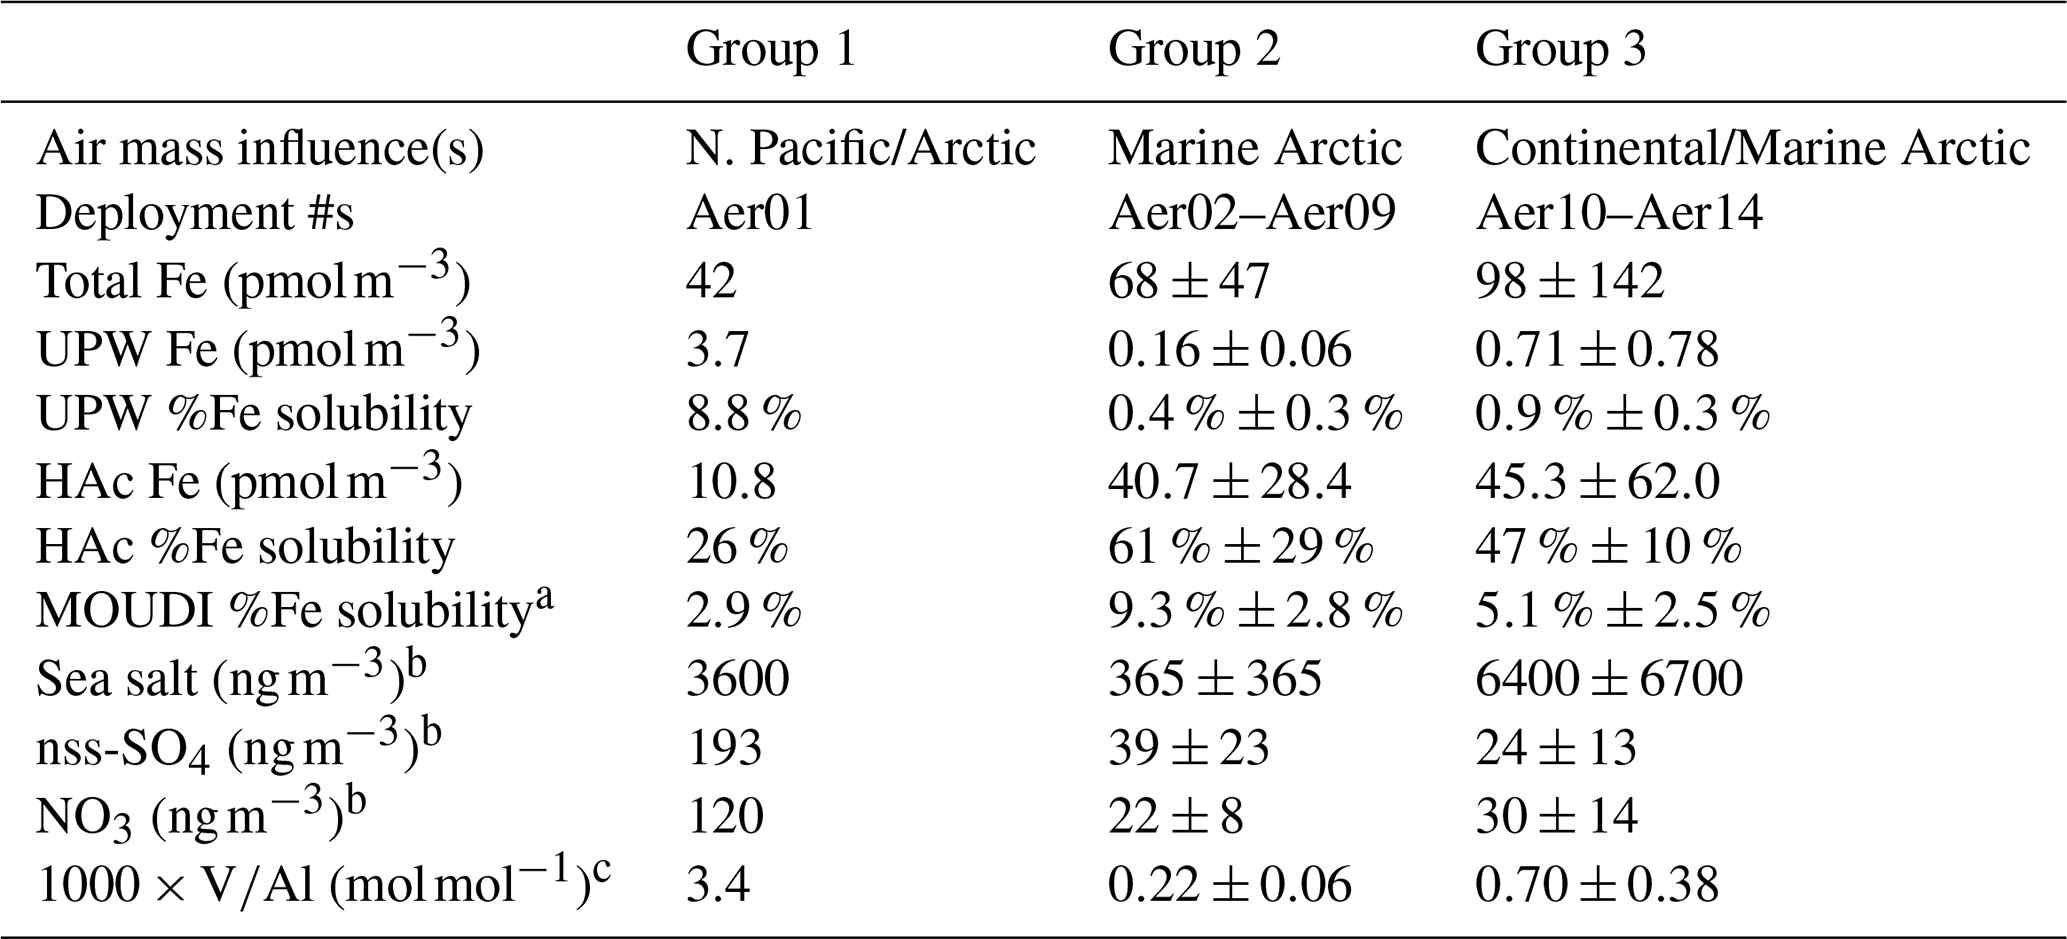
a Gao et al. (2019); Group 1 includes MOUDI sample M1, Group 2 is M2–M5, Group 3 is M6–M8. b Mukherjee et al. (2021); excludes values less than detection limit. c Marsay et al. (2018a).
There are no significant differences in total Fe concentration between the three groups due to significant variability between individual samples (Fig. 2). For example, among the Group 3 samples, Fe concentration measured during Aer11 (350 pmol m−3) was six to eight times higher than the samples collected immediately before and after it. This is likely because that sample coincided with direct atmospheric transport to the region from northern Canada and/or Siberia, which brought with it a relatively high dust load (Marsay et al., 2018a). Differences in UPW-soluble Fe concentration and Fe solubility between the three groups were more distinct, with the highest concentration (3.7 pmol m−3) measured during the single deployment contributing to Group 1 (Aer01). As that sample did not have a particularly high total Fe load, calculated UPW-Fe solubility for Group 1 (8.8 %) was notably higher than for Groups 2 (0.4 % ± 0.3 %) and 3 (0.9 % ± 0.3 %). In contrast, the second highest UPW-soluble Fe concentration (2.1 pmol m−3, Aer11) represents only 0.6 % solubility due to the relatively high total Fe load also measured in that sample.
The higher UPW-Fe solubility of Aer01 coincided with higher non-sea-salt sulfate (nss-) and nitrate () concentrations (Mukherjee et al., 2021) and a higher molar ratio in that sample (Marsay et al., 2018a) relative to Group 2 and 3 samples (Table 3). All three have been used as tracers of anthropogenic aerosol influence, and particularly fossil fuel combustion emissions (e.g., Schmale et al., 2022; Sedwick et al., 2007; Yang et al., 2020), and so the higher UPW-Fe solubility of the sample may reflect greater impact from anthropogenic contributions to the aerosol load of Aer01, presumably from emissions around the Bering Sea or further south. Previous studies have determined that Fe associated with carbonaceous combustion aerosols is present as adsorbed impurities or ferric sulphate salts, rather than within a ferric (oxy)hydroxide matrix, and is thus highly soluble regardless of solution pH and with rapid dissolution rates (Desboeufs et al., 2005; Schroth et al., 2009).
AMBTs for Group 2 suggest little recent (i.e., within 100 h) transport from continental areas during the time samples were collected, which suggests that any contributions from mineral aerosol (or other terrestrial sources) would be relatively aged, while low and ratios in these samples (Marsay et al., 2018a) suggest little influence from non-crustal Fe sources. Indeed, and ratios of Group 2 samples were significantly lower than average crustal values (Gao et al., 2019; Marsay et al., 2018a), which suggests either a mineral aerosol contribution sourced from low Fe-content minerals or an in situ loss of Fe relative to Al and Ti. Studies in the remote Pacific Ocean have encountered similarly low ratios along with a distinct heavy stable Fe isotope signature, which has led to speculation that this may be due to loss of a soluble fraction of Fe during transport, along with isotope fractionation (Kurisu et al., 2021; Camin et al., 2025). This would explain the low Fe solubility in Group 2 samples. However, more work is needed to verify how the soluble fraction could be separated, and whether Al and Ti would undergo similar processing. Notably, the similarly low Fe solubility in Group 3 samples was associated in some cases with more direct transport from terrestrial sources (e.g., Aer11; Marsay et al., 2018a), rather than material that had been airborne for a long period.
In contrast to the UPW leach data, Gao et al. (2019) described a general increase in aerosol Fe solubility towards higher latitudes for samples treated with ammonium acetate, with Group 2 samples having the highest average solubility of 9.3 % ± 2.8 % (Table 3). Fan et al. (2023) linked the pattern of ammonium acetate Fe solubility in MOUDI samples to a combination of Fe mineralogy and atmospheric processing during long range transport: Aer01 Fe was dominated by biotite and hematite, whereas Group 2 samples were dominated by ferrihydrite and ilmenite, and Group 3 contributions were more variable, but with significant contributions from hematite, biotite, Fe(III) phosphate and ferrihydrite (Fan et al., 2023). The HAc leach data roughly follows the same trend as for the ammonium acetate leach, with Group 2 sample solubilities being generally higher than Group 3 (61 % ± 29 % and 47 % ± 10 %, respectively), and Group 1 solubility being lower than both (26 %).
That the same trend is not seen in UPW leachable Fe may reflect the shorter contact time between leachate and sample for UPW, and the increased effectiveness of the ligand-containing ammonium acetate leach and the HAc leach at accessing some mineral-associated Fe relative to the UPW leach. This suggests that differences in UPW solubility were driven more by the relative importance of lithogenic versus anthropogenic Fe contributions, while differences in Fe solubility in the longer leaches also reflect differences in mineralogy of mineral aerosol Fe. This is not meant to imply that mineralogy has no effect on UPW solubility of Fe, as it has been demonstrated previously that the method can differentiate differences in Fe solubility of biotite-rich glacial flour versus ferrihydrite-dominated arid soils (Schroth et al., 2009). That higher UPW solubility is not mirrored by higher HAc solubility of Fe in the same samples is consistent with the UPW-soluble Fe fraction being readily and rapidly released (Desboeufs et al., 2005), such that the HAc leach would not be expected to release significant additional Fe from any combustion aerosols.
Comparison between patterns for UPW and ammonium acetate derived Fe solubility is, however, also complicated by differences for the samples constituting Group 1, where UPW-determined Fe solubility in Aer01 was higher (8.8 %) than ammonium acetate-determined solubility for the corresponding MOUDI sample (2.9 %). This is likely a result of a mismatch between sampling duration, as power issues during the first deployment resulted in differences in operating periods between samplers. Thus, the MOUDI sampler may have not been operating at a time when aerosol with more soluble Fe was collected by the bulk aerosol sampler.
3.4 A wider perspective of Arctic aerosol Fe solubility – combining GN01 and MOSAiC data
Although the late summertime GN01 cruise provided only a small dataset of Arctic aerosol samples, the same sample collection and UPW-leaching approach was also used during the MOSAiC expedition in winter and spring of 2019/20 (Marsay et al., 2025). The two projects therefore provide an opportunity to investigate Arctic aerosol Fe solubility in a larger dataset and in contrasting seasons, with the caveat that GN01 was conducted on the Amerasian side of the Arctic Ocean, while MOSAiC sampling took place on the Eurasian side, between 80–89° N. However, with the exceptions of Aer01 and Aer14 (which are excluded from the following assessment), all GN01 samples were collected north of 70° N and wholly within the Arctic Ocean, as were the MOSAiC samples.
3.4.1 Aerosol loading versus Fe solubility
Previous Atlantic and Pacific Ocean studies have highlighted an inverse hyperbolic relationship between Fe solubility and total Fe or dust loading, with low solubility associated with high total Fe loading and higher solubility when aerosol Fe concentrations are lower (Jickells et al., 2016; Shelley et al., 2018; Sholkovitz et al., 2012; Yang et al., 2020). This has been suggested to result from mixing of two types of aerosols – relatively fresh mineral aerosol with low Fe solubility and anthropogenic aerosol with high Fe solubility (Sedwick et al., 2007). Alternatively, the relationship has been hypothesized to represent the combined effects of aerosol removal by deposition during atmospheric transport and physicochemical processing of the remaining material. In this scenario, Fe solubility increases as mineral aerosol undergoes increasing interaction with other aerosol components, including acidic species and organic ligands (Mahowald et al., 2018), as observed during laboratory experiments (Maters et al., 2022).
In Fig. 4, fractional Fe solubility is plotted against total Fe loading for Arctic Ocean (GN01 and MOSAiC) aerosols collected north of 70° N, along with data from several other studies in which the same short-exposure UPW leach was used to assess Fe solubility in Atlantic and Pacific Ocean aerosols. Whereas the overall dataset reflects the previously described inverse relationship between total Fe concentration and Fe solubility (Sholkovitz et al., 2012), there is no clear relationship for the Arctic aerosol data. This is presumably due to the limited range in Fe loading in these Arctic aerosol samples (16–350 pmol m−3 during GN01 and 54–1091 pmol m−3 during MOSAiC). In contrast, most of the datapoints with >20 nmol m−3 Fe loading and low Fe solubility in Fig. 4 are samples collected in the North Atlantic and strongly influenced by Saharan dust outbreaks (Buck et al., 2010; Sedwick et al., 2007; Shelley et al., 2018). Time-series data of total Fe loading at Alert, Canada (82.5° N) (Gong and Barrie, 2005) suggests that such high concentrations are rarely encountered in the high Arctic. Instead, significant variability in Fe solubility is seen over a relatively small concentration range.
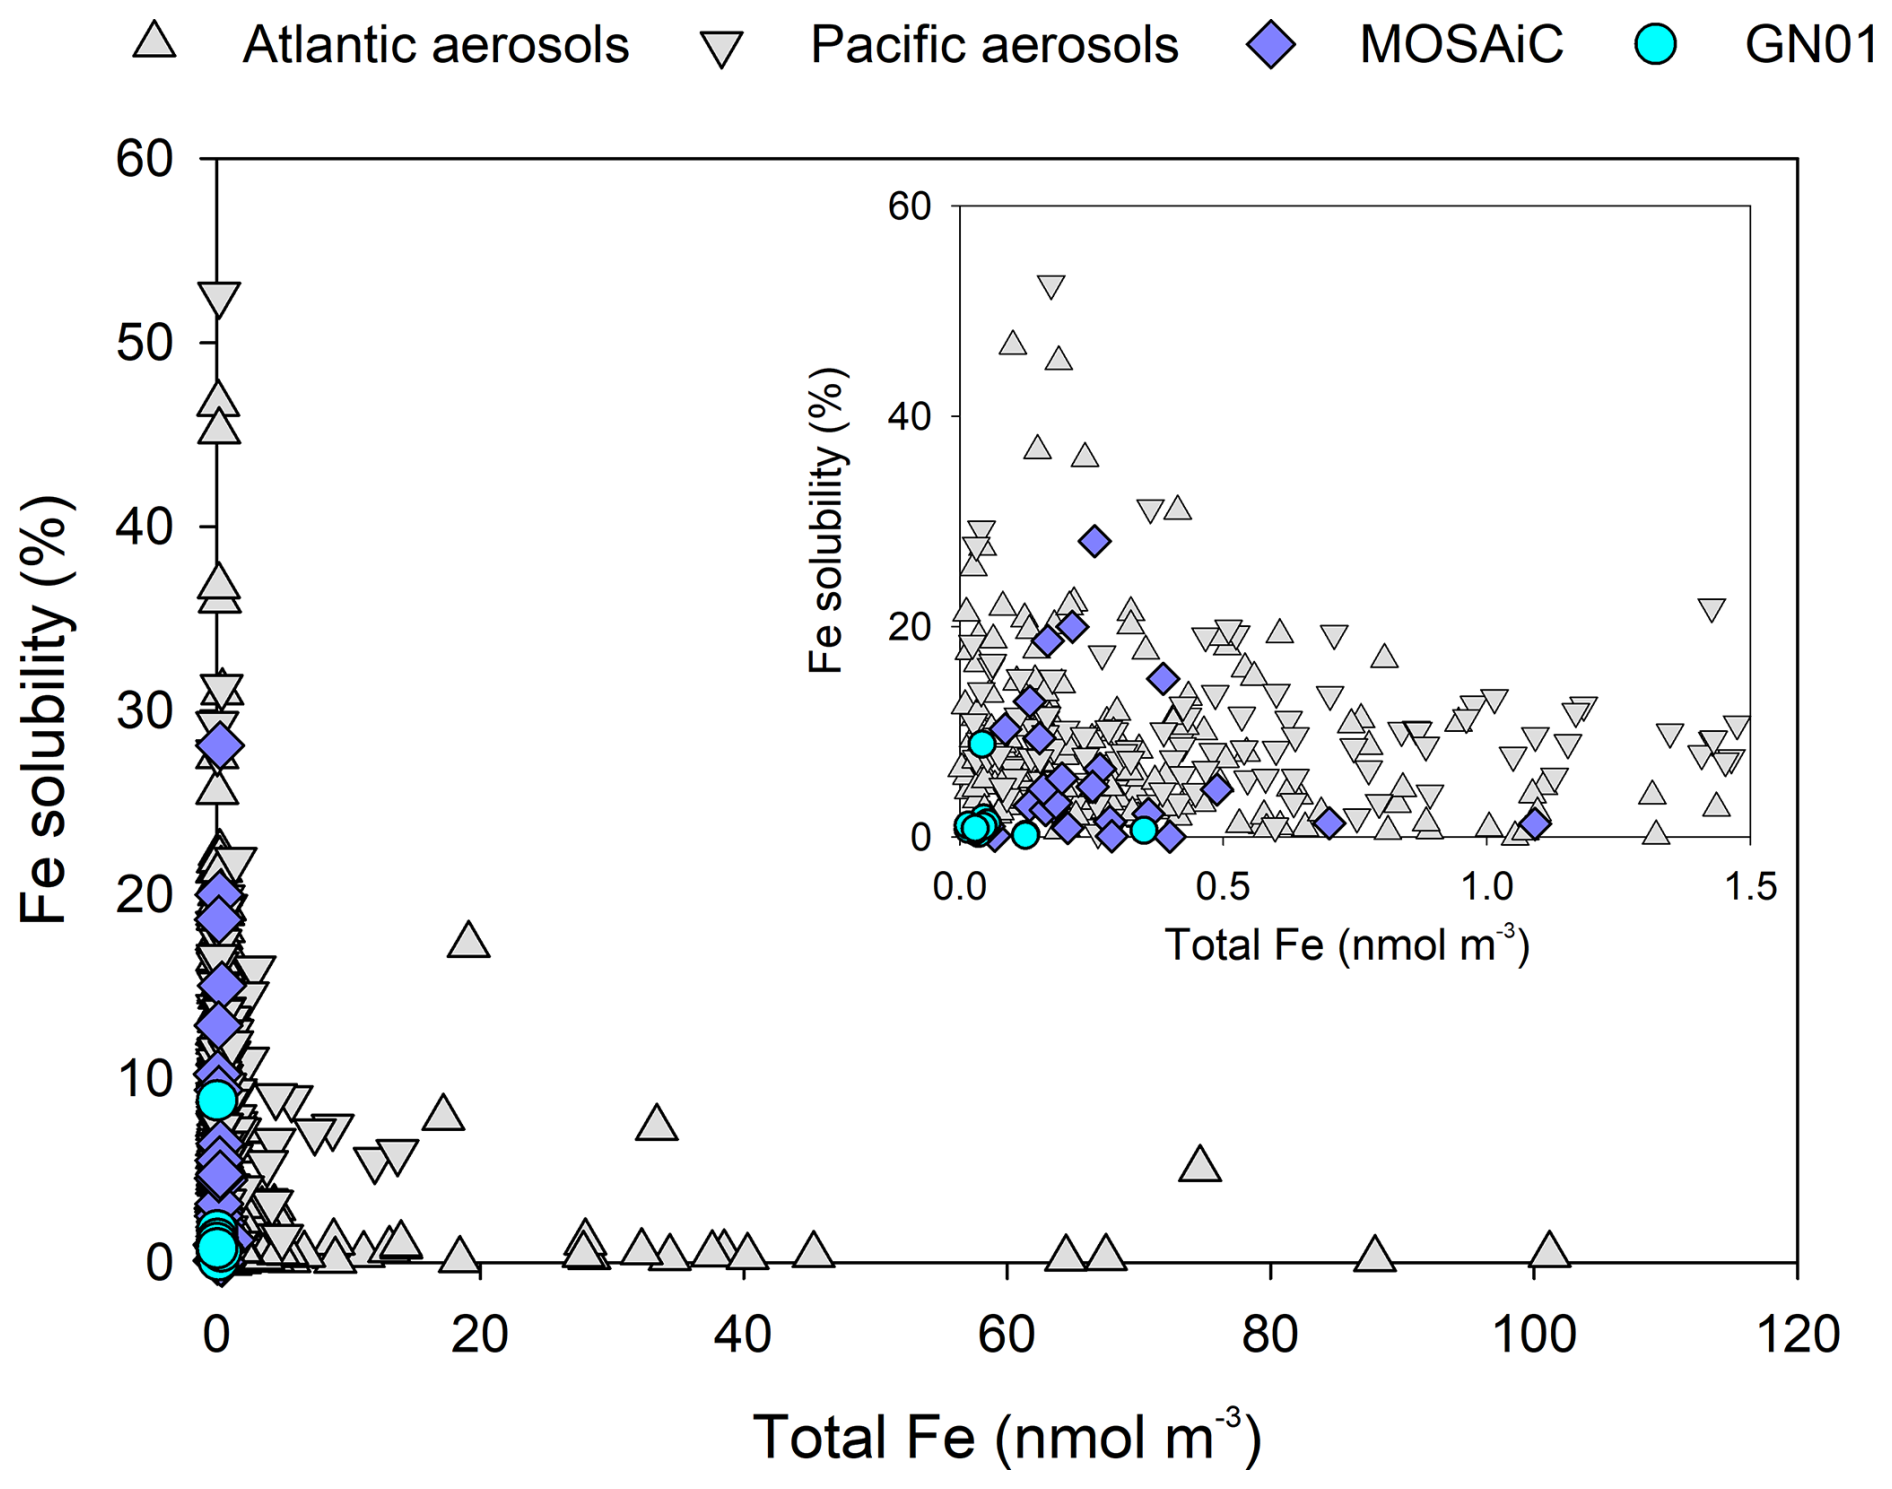
Figure 4Comparison of aerosol Fe solubility to total Fe loading. Iron solubility assessed using a flow-through UPW leach is plotted against total Fe for GN01 samples (cyan circles) versus MOSAiC samples (purple diamonds) and samples collected over the Atlantic (grey triangles) and Pacific (grey inverted triangles) Oceans. Inset shows expanded view of low total Fe concentrations that includes all GN01 and MOSAiC data. MOSAiC data are from Marsay et al. (2025); Atlantic data are from Buck et al. (2010), Shelley et al. (2018), and Sholkovitz et al. (2012); Pacific data are from Buck et al. (2006, 2013).
3.4.2 Seasonality of aerosol Fe solubility
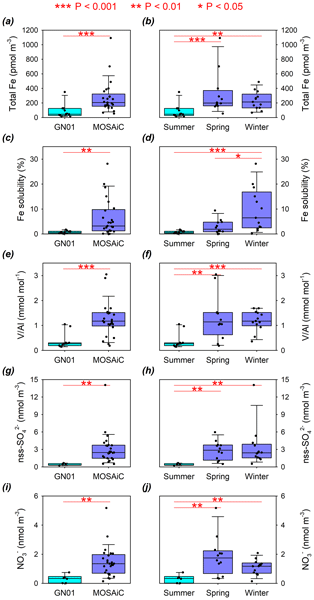
Data from MOSAiC indicated higher aerosol Fe solubility in winter (median=6.5 %) than in spring (median=1.9 %) (Marsay et al., 2025). We extend this seasonal comparison for total Fe concentration and Fe solubility in Fig. 5, with comparisons of GN01 and MOSAiC data, and of GN01 summertime data to MOSAiC winter and spring data separately. Both total Fe loading and Fe (UPW) solubility were significantly lower during GN01 than during MOSAiC (Mann-Whitney Rank Sum Test, p<0.01) (Fig. 5a and c). Total Fe loading during GN01 was significantly lower than both the winter and spring MOSAiC datasets (Fig. 5b). Iron solubility seemed to show a seasonal progression, being highest during winter, lower in spring, and lowest during the summertime GN01 data, although the small datasets available prevent the spring/summer comparison from being statistically significant at the p<0.05 level (Fig. 5d). This seasonality broadly agrees with time-series data from Kevo, Finland, which indicated a peak in median aerosol Fe solubility in April, but with highest individual measurements of solubility in February and March (Laing et al., 2014a).
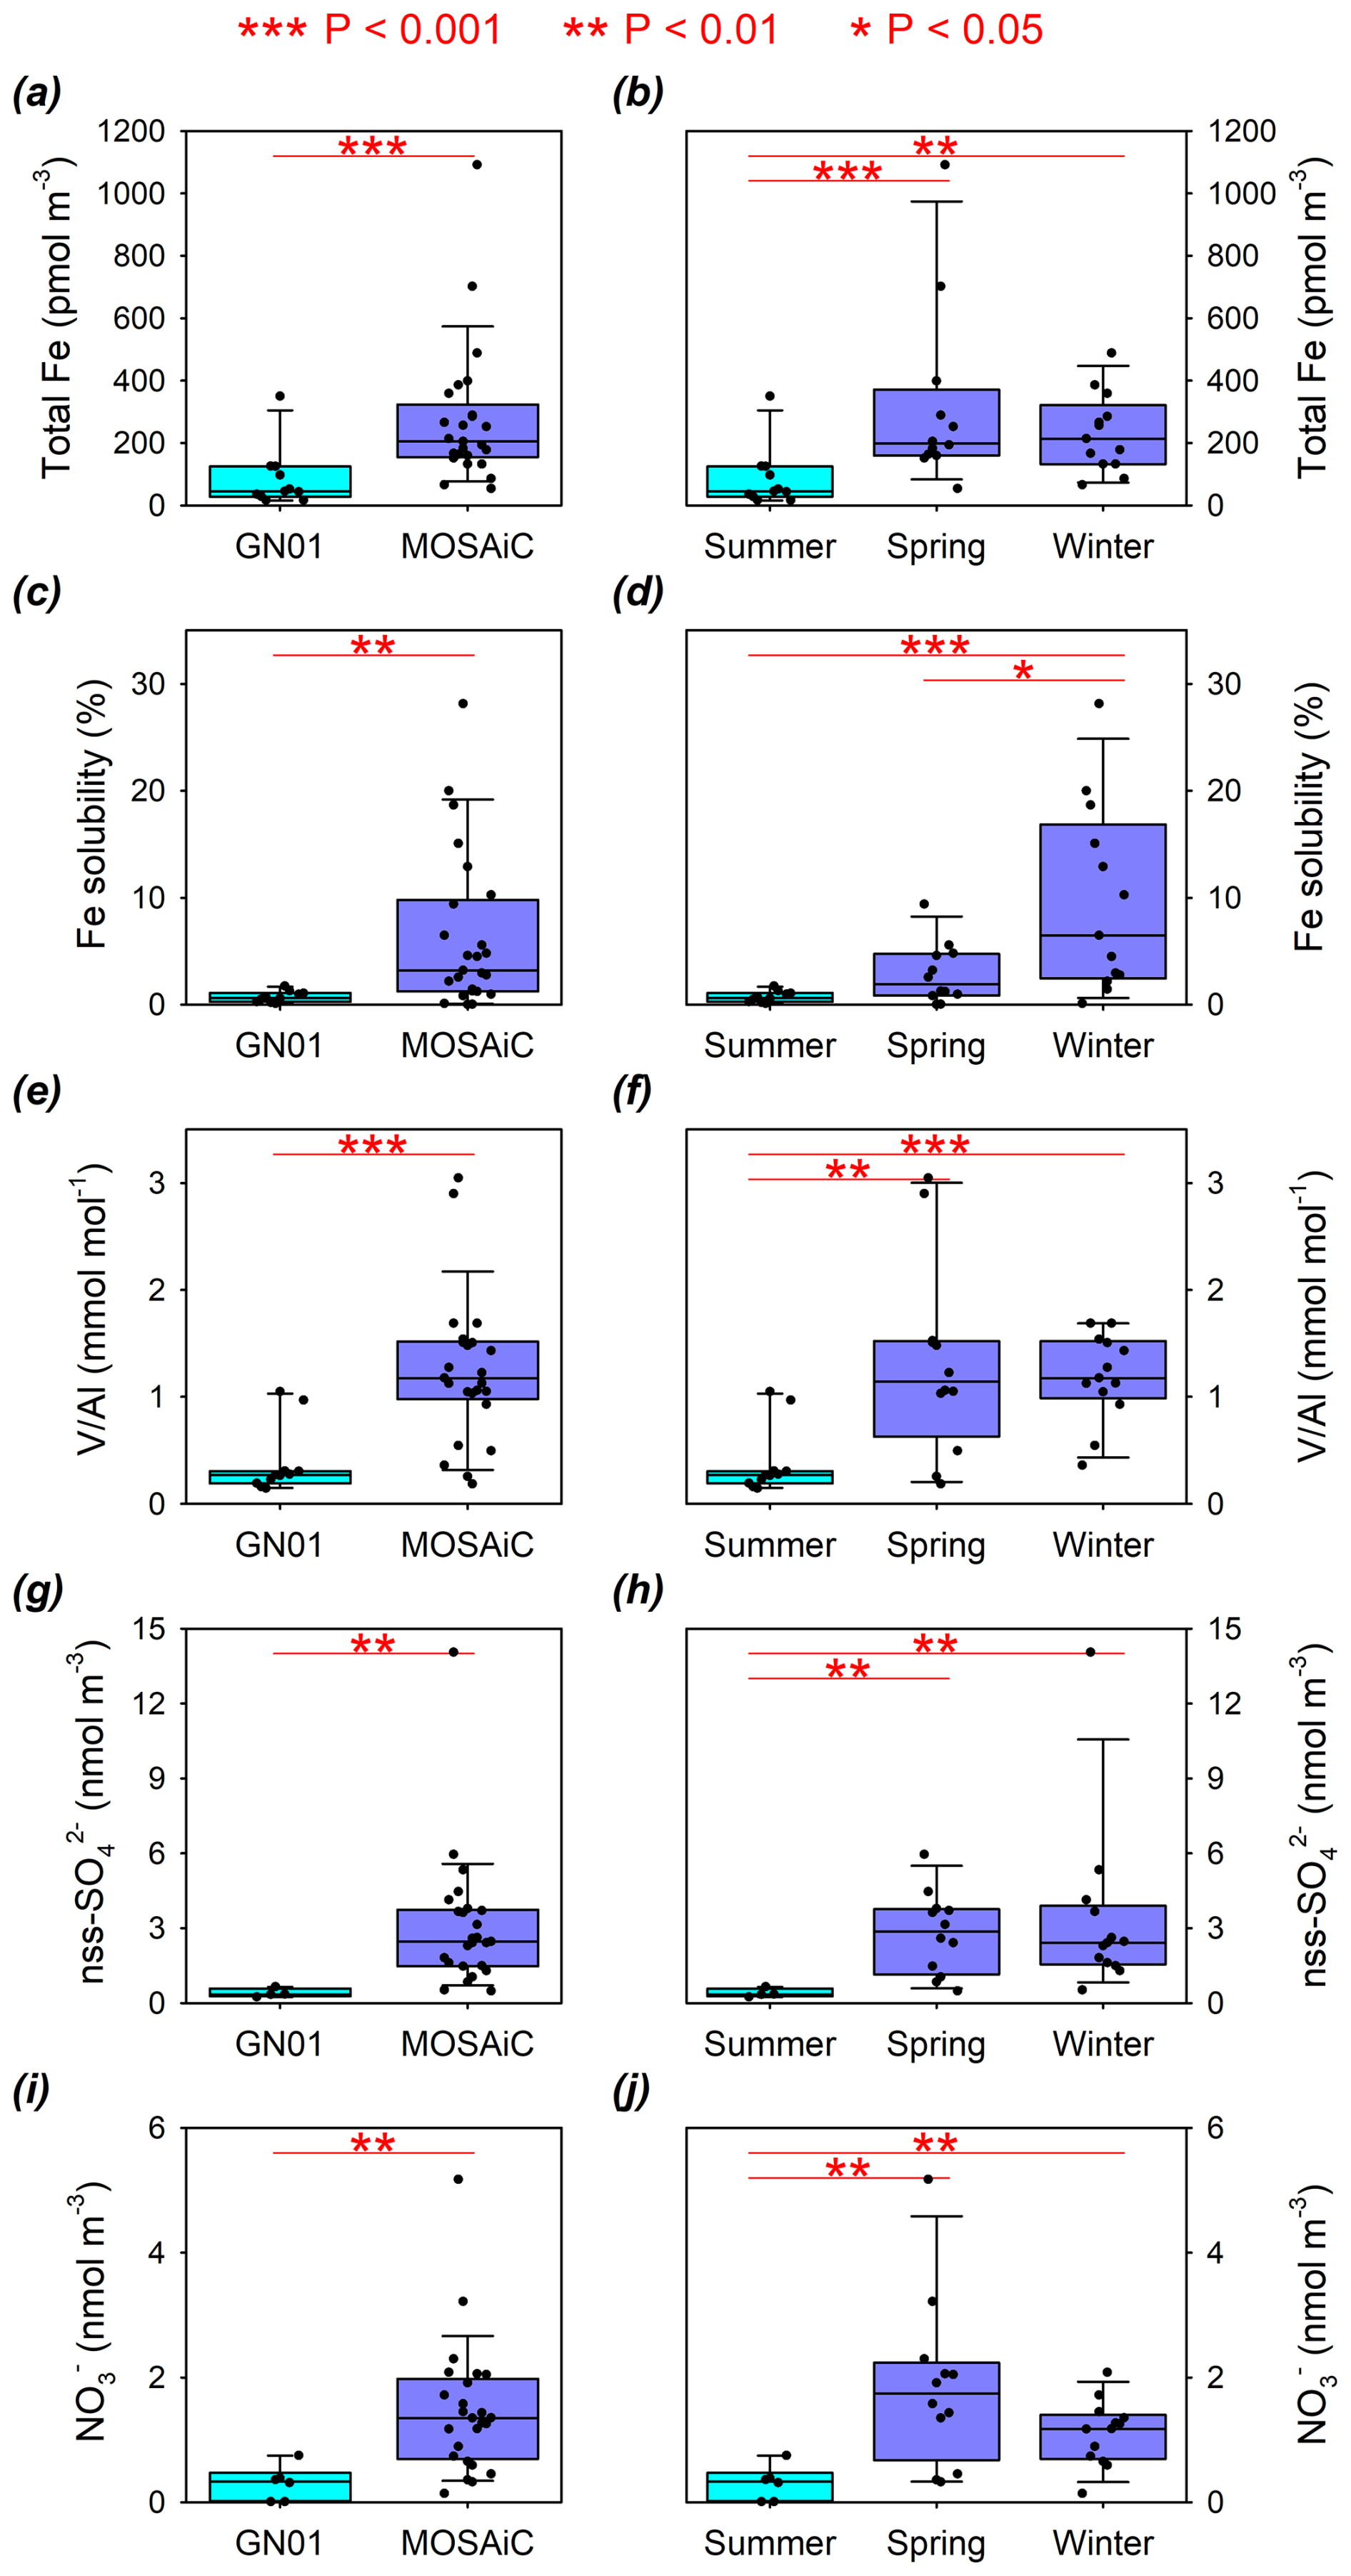
Figure 5Comparison of aerosol characteristics between GN01 (cyan) and MOSAiC (purple). (a, b) Total aerosol Fe concentration, (c, d) Fe UPW-solubility, (e, f) molar ratio, (g, h) nss-sulfate concentration, and (i, j) nitrate concentration. Comparisons are made between the two projects (left column) and between seasonal datasets (right column), with MOSAiC data (n=26) split between winter (deployments 1–13, n=13) and spring (deployments 14–26, n=13). GN01 data excludes samples collected south of 70° S (Aer01, Aer14; n=11, or less where some measurements are below detection). Each box spans 25th to 75th percentiles of data and is bisected by the median, with whiskers extending to 10th and 90th percentiles. Individual datapoints are superimposed as black dots. Red lines indicate statistically significant differences between datasets (Mann-Whitney Rank Sum Test), with level of significance indicated by asterisks.
Higher Fe solubility during MOSAiC than GN01 was mirrored by a higher ratio and higher nss- and concentrations during MOSAiC (Fig. 5e, g, and i). These seasonal differences are consistent with the Arctic haze phenomenon, resulting from a buildup of anthropogenic aerosols in the Arctic atmosphere, being most pronounced in winter and spring (Barrie, 1986; Schmale et al., 2022; Shaw, 1995). Some previous studies have identified relationships between Fe solubility and tracers of anthropogenic aerosols such as ratio (Sedwick et al., 2007; Sholkovitz et al., 2009) and nss- (Yang et al., 2020), while in other cases, no significant correlation has been identified (Baker et al., 2006; Buck et al., 2006, 2010, 2013). This disparity likely reflects regional variability in aerosol source and transport patterns, which in turn could influence the degree of internal mixing of aerosols from different sources. Aerosol nss- and concentrations are often considered to be associated with acidic conditions within the atmosphere because they imply the presence of acidic precursors (e.g., H2SO4, HNO3), formed from gaseous SO2 and NOx emissions, which could interact with surficial aerosol iron and enhance its potential solubility. In this case, the shared seasonality between Fe solubility and anthropogenic aerosol tracers suggests that the acidic aerosol components of Arctic haze play a role in influencing Fe solubility.
Indeed, the combined GN01 and MOSAiC dataset exhibits a positive correlation between Fe solubility and nss- concentration (Spearman Rank Order Correlation, ρ=0.75, p<0.001; Fig. 6), albeit with little contribution from GN01, for which all but four of the samples collected north of 70° N had nss- below the detection limit (Mukherjee et al., 2021). Closer examination of the data suggests seasonality to the relationship between nss- and Fe solubility (Fig. 6). For the summertime (GN01) data, the limited dataset and low nss- concentrations make it difficult to identify any relationship between the two. Both winter and spring datasets exhibit significant correlations between Fe solubility and nss-. With the exclusion of one sample (MOSAiC Aer03) that had very high nss- concentration – more than twice as high as any other sample during MOSAiC – the winter MOSAiC samples present a much stronger increase in Fe solubility with increasing nss- concentration, relative to samples collected during the spring transition period (Fig. 6). However, there was no significant difference in nss- concentration between winter and spring (Fig. 5h). Instead, a similar range in nss- concentration was associated with higher Fe solubility in winter than in spring (Fig. 6).
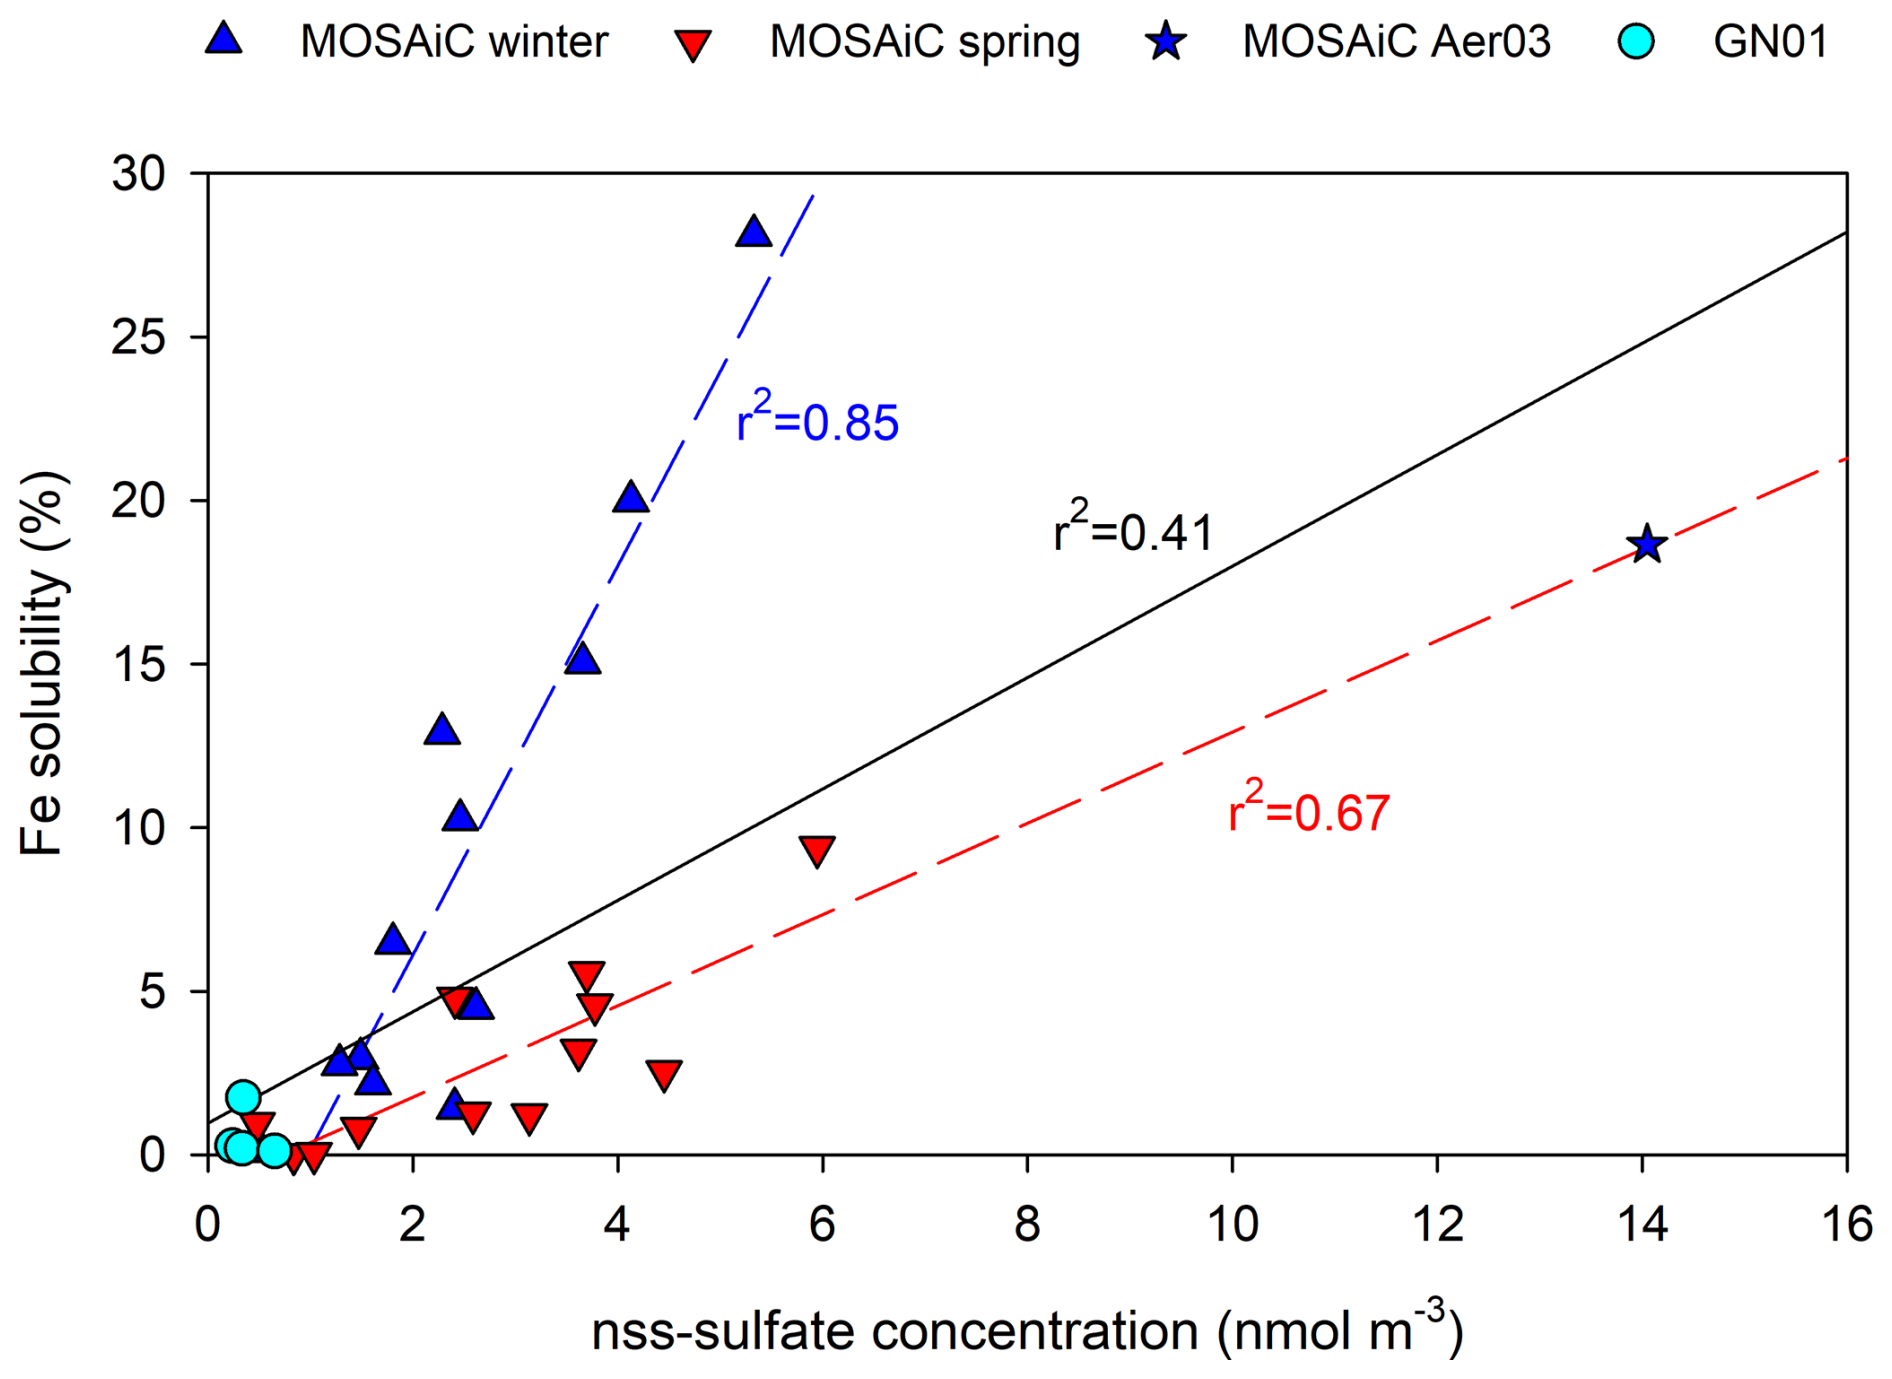
Figure 6Relationship between aerosol Fe solubility and nss-sulfate concentration. Fe solubility is plotted against nss-sulfate concentration for GN01 (cyan circles), MOSAiC Winter (blue triangles), and MOSAiC Spring (red inverted triangles). Dashed regression lines are included where statistically significant correlations exist for seasonal data (Aer03 excluded from MOSAiC winter data due to unusually high nss-sulfate). Solid black regression line indicates significant correlation for all data.
Baker et al. (2006) have interpreted a missing relationship between nss- and Fe solubility as evidence of a lack of internal mixing between coarse, Fe-bearing mineral grains and fine, combustion-derived particles. The seasonality observed between Fe solubility and nss- concentrations could therefore result from differences in residence time for aerosols in the Arctic atmosphere and the related potential for interactions between aerosol types. Arctic haze is characterized by a buildup of aerosols during the winter months, due in part to lower precipitation rates removing material less efficiently than in the summer (Barrie, 1986). Potentially, the longer wintertime atmospheric residence times for particles would allow for greater internal mixing of crustal aerosols and anthropogenic emissions, resulting in greater solubilization of crustal Fe by acidic species. However, bulk deposition velocities determined during MOSAiC from beryllium-7 data were found to be reasonably stable between December and late May (613 ± 153 m d−1 over the entire period, Marsay et al., 2025), suggesting no significant difference in atmospheric residence time for winter and spring samples.
An alternative explanation is that the steeper relationship between Fe solubility and nss- during winter may arise from the influence of additional aerosol components. The highest Fe solubility values in the MOSAiC data were measured in samples collected during January–February (Marsay et al., 2025), a period that also saw the highest black carbon aerosol concentrations during MOSAiC (Boyer et al., 2023). Black carbon is a tracer of emissions from fossil fuel and biomass combustion (Luo et al., 2008; Winiger et al., 2019) and the peak during MOSAiC was attributed to anthropogenic aerosols transported primarily from northern Asia/Siberia (Boyer et al., 2023). Presumably this also coincided with relatively high concentrations of primary and secondary organic aerosols that have also been attributed partially to combustion emissions (Kawamura and Kaplan, 1987; Narukawa et al., 1999; Nguyen et al., 2014; van Pinxteren et al., 2015). Previous work has linked loading of water-soluble organic compounds, and oxalate in particular, to aerosol Fe solubility (Ito and Shi, 2016; Paris and Desboeufs, 2013; Wozniak et al., 2015). Thus, the generally higher Fe solubility and greater increase in Fe solubility relative to nss- loading during winter may be due to interactions between mineral aerosol, nss-, and higher concentrations of oxalate (and potentially other organic aerosols) derived from combustion emissions. Time-series data from multiple sites around the Arctic indicate that black carbon has an annual cycle similar to nss-, with peak concentrations during the January–March period and minimum concentrations during the September–October period in which GN01 took place (Boyer et al., 2023; Schmale et al., 2022). This may not, however, be true of oxalate, which is also produced by photochemical reactions of organic precursors but also thought to be decomposed by photochemistry (Kawamura et al., 2010), and more work is undoubtedly needed to pick apart the relative importance of acidic species versus organic ligands in influencing aerosol Fe solubility.
3.4.3 Seasonality of bulk deposition flux of soluble Fe to the Arctic Ocean
Aerosol concentration of a chemical species, Ci, can be used to calculate its bulk atmospheric deposition flux, Fi, by combining the data with a bulk deposition velocity, Vbulk (Eq. 1):
During both GN01 and MOSAiC, bulk deposition velocity was calculated based on measurements of the short-lived radioisotope, beryllium-7 (Be-7; half-life = 53.3 d) (Marsay et al., 2018a, 2025). Be-7 is produced in the stratosphere and upper troposphere and quickly becomes associated with aerosol particles. Due to the long residence time of aerosols in the stratosphere relative to the short half-life of Be-7, tropospheric production dominates Be-7 deposition, by gravitational settling and particularly scavenging by precipitation (Kadko and Swart, 2004). For large areas of the open ocean, the only processes significantly influencing the distribution of Be-7 are its deposition from the atmosphere and its natural decay (Kadko et al., 2015). During GN01, the deposition flux of Be-7 was determined both from its inventory in snow samples collected on sea ice and from falling snow collected directly. The average value was combined with aerosol Be-7 activity data to calculate an average bulk deposition velocity of 1140 ± 490 m d−1, which was then used with minimum and maximum measured aerosol TE concentrations to calculate a range in bulk deposition flux for each element (Marsay et al., 2018a).
The same Vbulk value of 1140 m d−1 is applied to UPW, SW, and HAc soluble Fe concentrations in bulk aerosols collected north of 70° N to provide estimates of soluble and labile Fe flux to the Arctic Ocean during GN01 (Table 4). Also included in the table are spring and winter fluxes of UPW-soluble Fe to the Arctic Ocean, based on concentrations during MOSAiC and a Vbulk of 613 ± 153 m d−1, similarly calculated from Be-7 data during that study (Marsay et al., 2025). The same deposition velocity was applied to both spring and winter subsets of soluble concentration data.
Table 4Bulk deposition fluxes of total and soluble Fe to the Arctic Ocean (>70° N) calculated from GN01 data. Also included are UPW-soluble Fe fluxes in spring and winter based on data from MOSAiC. All values are in .

∗ Marsay et al. (2025).
The data indicate a strong seasonal variation in UPW-soluble Fe deposition to the Arctic Ocean, with higher solubility in spring and particularly in winter, during the Arctic haze period, compensating for the lower bulk deposition velocity during that period resulting from less precipitation. Thus, the greatest deposition flux of UPW-soluble Fe to the Arctic Ocean takes place during winter (15 ± 14 ), when much of the sea surface is ice-covered and primary production is light limited. Although summertime has a much lower deposition flux (0.9 ± 1.3 ), this supply is more likely to be available for immediate biological uptake, due to abundant sunlight and a greater proportion of deposition taking place directly to the surface ocean.
Winter and springtime deposition is also eventually released to surface waters during seasonal melting, albeit potentially after post-depositional photochemical and biogeochemical changes in Fe chemistry while deposited material is on snow cover or during transfer to surface waters via melt ponds (Marsay et al., 2018b). Thus, the labile (HAc-soluble) Fe deposition flux may be a more relevant estimate of atmospheric Fe supply to the Arctic region. The HAc-soluble Fe deposition flux calculated during GN01 is more comparable to that calculated during MOSAiC – a median of 32 during GN01 versus 31 during MOSAiC (Marsay et al., 2025). However, these estimates are not as directly comparable between the two studies due to slight differences in the HAc-leaching protocol.
3.4.4 Potential changes in atmospheric Fe supply in a changing climate and their impact
The Arctic climate is rapidly warming, leading to a 43 % decrease in summertime sea ice extent since satellite observations began in 1979 and a smaller decrease in winter maximum ice coverage (AMAP, 2021). Thus, atmospheric deposition is increasingly taking place directly to surface waters, particularly in summer. While the Arctic Ocean is typically not considered to be Fe limited due to the influence upon Fe supply of shelf processes, fluvial inputs, and the Transpolar Drift, there is some evidence that low dissolved Fe concentration can become important for limiting productivity in the summer (Rijkenberg et al., 2018). Thus, the magnitude and relative solubility of atmospheric Fe deposition (either direct or from seasonally melting sea ice) could become increasingly important in the future.
The combined GN01 and MOSAiC datasets suggest that acidic inorganic aerosol species from fossil fuel combustion emissions, represented by nss-, influence Fe solubility in Arctic aerosols during the Arctic haze period, but less so during the summer months. An ongoing trend in declining Arctic haze nss- concentrations due to emissions regulations in areas south of the Arctic (Schmale et al., 2022) may therefore lead to a reduction in Arctic aerosol soluble Fe deposition during the winter months. However, summertime aerosol Fe solubility may increase due to expected increases in local anthropogenic emissions (from increased marine traffic and industrial activity) as the Arctic region continues to warm. The frequency and intensity of large boreal wildfires is also predicted to increase, which will likely increase emission and atmospheric transport to the Arctic Ocean of nutrients, including soluble Fe (Ardyna et al., 2022; Bergas-Masso et al., 2025; Cunningham et al., 2024).
Changes in atmospheric transport patterns and an increase in wet deposition, driven primarily by an increase in rain, are also predicted due to ongoing climate change (AMAP, 2021). A shift to a wetter Arctic will likely influence aerosol residence time and efficiency of deposition (Sharma et al., 2013), with scavenging by rainfall thought to more efficiently remove aerosols than that by snow (Browse et al., 2012). Thus, soluble Fe will be delivered more efficiently from the atmosphere. But the shorter atmospheric residence time will reduce the potential for internal mixing of mineral aerosol with acidic and organic aerosols that would act to increase solubility. As such, further studies investigating the relative importance of atmospheric processing versus emission type (e.g., soluble combustion emissions, refractory mineral aerosol) are needed to predict how changing atmospheric weather patterns will influence the supply of bioavailable iron from the atmosphere to the Arctic Ocean in the future.
The solubility of Fe in late summertime Arctic aerosols and precipitation samples was assessed by several approaches. Iron solubility in short exposure, flow-through leaching approaches using ultrapure water and filtered seawater produced similar results, given the relative uncertainty in measurements, while the more aggressive approach of heating the aerosol samples with acetic acid and a reducing agent provided an upper estimate of Fe solubility. Using the UPW leaching approach, Fe solubility was low throughout GN01, except for one sample collected while traversing the Bering Sea, which chemical tracers and air mass back trajectories indicate was more influenced by anthropogenic emission contributions.
A seasonal comparison of the (summertime) GN01 UPW-derived Fe solubility to that measured in winter and springtime samples using the same approach suggests a strong seasonality to Arctic aerosol Fe solubility, connected with the Arctic haze phenomenon and potentially influenced by interactions of both inorganic and organic aerosol species with Fe. As a result, bulk deposition of soluble Fe to the Arctic region is higher in winter and spring than in summer, despite slower rates of aerosol removal during the winter months due to the dominance of dry over wet deposition. This means that a significant fraction of the annual atmospheric supply of soluble Fe to the Arctic Ocean likely occurs onto sea ice and during the Arctic winter, rather than directly to the sea surface. As such, any post-depositional processes that occur to material deposited onto the sea ice, along with the timing of release of meltwater from the sea ice to the surface ocean, will play an important role in determining the impact of atmospherically supplied Fe in winter/spring to Arctic Ocean surface waters in summer.
The combined GN01 and MOSAiC datasets suggest that acidic inorganic aerosol species from fossil fuel combustion emissions influence Fe solubility in Arctic aerosols during the Arctic haze period. An ongoing trend in declining Arctic nss- concentrations due to emissions regulations (Schmale et al., 2022) may therefore lead to a reduction in winter/spring Arctic aerosol Fe solubility in the future. In contrast, summertime concentrations of soluble aerosol Fe may well increase in the future due to expected growth in emissions from local marine traffic and industrial activity as the Arctic region continues to become more accessible. The contribution of wildfire aerosols to Fe loading and their potential to influence Fe solubility during summer and winter is poorly constrained at present but is expected to increase. The ongoing shift to a warmer, wetter Arctic will presumably increase efficiency of atmospheric deposition in the region but may also decrease the residence time of aerosols in the Arctic atmosphere, thus reducing the potential for solubilisation of aerosol Fe before deposition.
GN01 total and UPW-soluble aerosol trace element concentrations presented here are available for download from the Biological and Chemical Oceanography Data Management Office (BCO-DMO) via https://www.bco-dmo.org/dataset/725905 (Buck et al., 2020a) and https://www.bco-dmo.org/dataset/728472 (Buck et al., 2020b), respectively, and are included in GEOTRACES IDP2025. Concentrations of total, UPW-soluble, SW-soluble, and HAc-soluble Fe are provided in Table S3 of this paper, and trace element concentrations in GN01 precipitation samples are provided in Table S5 in the Supplement.
The supplement related to this article is available online at https://doi.org/10.5194/bg-23-6857-2026-supplement.
Writing (original draft): CMM; Writing (review and editing): all authors; Sample collection: CMM, WML, PLM; Sample preparation and analysis: CMM, AME, PLM, WML; Conceptualization and Funding acquisition: CSB, WML, PLM.
The contact author has declared that none of the authors has any competing interests.
Publisher's note: Copernicus Publications remains neutral with regard to jurisdictional claims made in the text, published maps, institutional affiliations, or any other geographical representation in this paper. The authors bear the ultimate responsibility for providing appropriate place names. Views expressed in the text are those of the authors and do not necessarily reflect the views of the publisher.
This article is part of the special issue “RUSTED: Reducing Uncertainty in Soluble aerosol Trace Element Deposition (AMT/ACP/AR/BG inter-journal SI)”. It is not associated with a conference.
This work was supported by National Science Foundation grants OCE-1438047 to CSB, OCE-1437266 to WML, and OCE-1436019 to PLM, as well as the GN01 management grant, OCE-1355833 to WML. PLM was also supported by an FSU Planning Grant 2015–2016. A portion of this work was performed at the National High Magnetic Field Laboratory, which is supported by NSF Cooperative Agreements nos. DMR-1157490, DMR-1644779 and DMR-2128556 and the State of Florida. The authors gratefully acknowledge officers and crew of the USCGC Healy, chief scientists David Kadko and Greg Cutter, and other members of the science team for their support during U.S. GEOTRACES GN01. In particular, Mark Stephens, Brent Summers, Pami Mukherjee, and Yuan Gao produced ancillary data used in this work. We thank three anonymous reviewers whose constructive comments helped to improve this manuscript.
This research has been supported by the National Science Foundation, Directorate for Geosciences (grant nos. OCE-1438047, OCE-1437266, OCE-1436019, and OCE-1355833), the National Science Foundation, Directorate for Mathematical and Physical Sciences (grant nos. DMR-1157490, DMR-1644779, and DMR-2128556), and the Florida State University (grant no. Planning Grant 2015–2016).
This paper was edited by David Janssen and reviewed by three anonymous referees.
Achterberg, E. P., Moore, C. M., Henson, S. A., Steigenberger, S., Stohl, A., Eckhardt, S., Avendano, L. C., Cassidy, M., Hembury, D., Klar, J. K., Lucas, M. I., Macey, A. I., Marsay, C. M., and Ryan-Keogh, T. J.: Natural iron fertilization by the Eyjafjallajökull volcanic eruption, Geophys. Res. Lett., 40, 921–926, https://doi.org/10.1002/grl.50221, 2013.
Aguilar-Islas, A. M., Wu, J., Rember, R., Johansen, A. M., and Shank, L. M.: Dissolution of aerosol-derived iron in seawater: leach solution chemistry, aerosol type, and colloidal iron fraction, Mar. Chem., 120, 25–33, https://doi.org/10.1016/j.marchem.2009.01.011, 2010.
AMAP: AMAP Arctic Climate Change Update 2021: Key Trends and Impacts, Arctic Monitoring and Assessment Programme (AMAP), Tromso, Norway, viii + 148 pp., ISBN 978-82-7971-201-5, 2021.
Ardyna, M., Hamilton, D. S., Harmel, T., Lacour, L., Bernstein, D. N., Laliberté, J., Horvat, C., Laxenaire, R., Mills, M. M., van Dijken, G., Polyakov, I., Claustre, H., Mahowald, N., and Arrigo, K. R.: Wildfire aerosol deposition likely amplified a summertime Arctic phytoplankton bloom, Commun. Earth Environ., 3, 201, https://doi.org/10.1038/s43247-022-00511-9, 2022.
Baker, A. R. and Croot, P. L.: Atmospheric and marine controls on aerosol iron solubility in seawater, Mar. Chem., 120, 4–13, https://doi.org/10.1016/j.marchem.2008.09.003, 2010.
Baker, A. R. and Jickells, T. D.: Mineral particle size as a control on aerosol iron solubility, Geophys. Res. Lett., 33, L17608, https://doi.org/10.1029/2006GL026557, 2006.
Baker, A. R., Jickells, T. D., Witt, M., and Linge, K. L.: Trends in the solubility of iron, aluminium, manganese and phosphorus in aerosol collected over the Atlantic Ocean, Mar. Chem., 98, 43–58, https://doi.org/10.1016/j.marchem.2005.06.004, 2006.
Barrie, L. A.: Arctic air chemistry: an overview, in: Arctic Air Pollution, edited by: Stonehouse, B., Cambridge University Press, Cambridge, UK, 5–23, https://doi.org/10.1017/CBO9780511565496.004, 1986.
Bergas-Masso, E., Hamilton, D. S., Myriokefalitakis, S., Rathod, S., Gonçalves Ageitos, M., and Pérez García-Pando, C.: Future climate-driven fires may boost ocean productivity in the iron-limited North Atlantic, Nat. Clim. Change, 15, 784–792, https://doi.org/10.1038/s41558-025-02356-4, 2025.
Berger, C. J. M., Lippiatt, S. M., Lawrence, M. G., and Bruland, K. W.: Application of a chemical leach technique for estimating labile particulate aluminum, iron and manganese in the Columbia River plume and coastal waters off Oregon and Washington, J. Geophys. Res.-Oceans, 113, C00B01, https://doi.org/10.1029/2007JC004703, 2008.
Boyd, P. W. and Ellwood, M. J.: The biogeochemical cycle of iron in the ocean, Nat. Geosci., 3, 675–682, https://doi.org/10.1038/NGEO964, 2010.
Boyd, P. W., Mackie, D. S., and Hunter, K. A.: Aerosol iron deposition to the surface ocean – Modes of iron supply and biological responses, Mar. Chem., 120, 128–143, https://doi.org/10.1016/j.marchem.2009.01.008, 2010.
Boyer, M., Aliaga, D., Pernov, J. B., Angot, H., Quéléver, L. L. J., Dada, L., Heutte, B., Dall'Osto, M., Beddows, D. C. S., Brasseur, Z., Beck, I., Bucci, S., Duetsch, M., Stohl, A., Laurila, T., Asmi, E., Massling, A., Thomas, D. C., Nøjgaard, J. K., Chan, T., Sharma, S., Tunved, P., Krejci, R., Hansson, H. C., Bianchi, F., Lehtipalo, K., Wiedensohler, A., Weinhold, K., Kulmala, M., Petäjä, T., Sipilä, M., Schmale, J., and Jokinen, T.: A full year of aerosol size distribution data from the central Arctic under an extreme positive Arctic Oscillation: insights from the Multidisciplinary drifting Observatory for the Study of Arctic Climate (MOSAiC) expedition, Atmos. Chem. Phys., 23, 389–415, https://doi.org/10.5194/acp-23-389-2023, 2023.
Browning, T. J. and Moore, C. M.: Global analysis of ocean phytoplankton nutrient limitation reveals high prevalence of co-limitation, Nat. Commun., 14, 5014, https://doi.org/10.1038/s41467-023-40774-0, 2023.
Browse, J., Carslaw, K. S., Arnold, S. R., Pringle, K., and Boucher, O.: The scavenging processes controlling the seasonal cycle in Arctic sulphate and black carbon aerosol, Atmos. Chem. Phys., 12, 6775–6798, https://doi.org/10.5194/acp-12-6775-2012, 2012.
Bruland, K. W., Rue, E. L., and Smith, G. J.: Iron and macronutrients in California coastal upwelling regimes: implications for diatom blooms, Limnol. Oceanogr., 46, 1661–1674, https://doi.org/10.4319/lo.2001.46.7.1661, 2001.
Buck, C. S., Landing, W. M., Resing, J. A., and Lebon, G. T.: Aerosol iron and aluminum solubility in the northwest Pacific Ocean: results from the 2002 IOC cruise, Geochem. Geophy. Geosy., 7, Q04M07, https://doi.org/10.1029/2005GC000977, 2006.
Buck, C. S., Landing, W. M., Resing, J. A., and Measures, C. I.: The solubility and deposition of aerosol Fe and other trace elements in the North Atlantic Ocean: observations from the A16N CLIVAR/CO2 repeat hydrography section, Mar. Chem., 120, 57–70, https://doi.org/10.1016/j.marchem.2008.08.003, 2010.
Buck, C. S., Landing, W. M., and Resing, J.: Pacific Ocean aerosols: deposition and solubility of iron, aluminum, and other trace elements, Mar. Chem., 157, 117–130, https://doi.org/10.1016/j.marchem.2013.09.005, 2013.
Buck, C., Gao, Y., and Landing, W.: Concentrations of aerosol trace elements collected from bulk aerosol samples on the 2015 US GEOTRACES Western Arctic Transect cruise on USCGC Healy (HLY1502) from August to October 2015 (Version 2), Biological and Chemical Oceanography Data Management Office (BCO-DMO) [data set], https://www.bco-dmo.org/dataset/725905 (last access: 1 December 2025), 2020a.
Buck, C., Gao, Y., and Landing, W.: Concentrations of ultrapure water soluble aerosol trace elements collected from bulk aerosol samples on the 2015 US GEOTRACES Western Arctic Transect on USCGC Healy (HLY1502) August to October 2015 (Version 2), Biological and Chemical Oceanography Data Management Office (BCO-DMO) [data set], https://www.bco-dmo.org/dataset/728472 (last access: 1 December 2025), 2020b.
Camin, C., Lacan, F., Pradoux, C., Labatut, M., Johansen, A., and Murray, J. W.: Iron isotopes suggest significant aerosol dissolution over the Pacific Ocean, Atmos. Chem. Phys., 25, 8213–8228, https://doi.org/10.5194/acp-25-8213-2025, 2025.
Charette, M. A., Kipp, L. E., Jensen, L. T., Dabrowski, J. S., Whitmore, L. M., Fitzsimmons, J. N., Williford, T., Ulfsbo, A., Jones, E., Bundy, R. M., Vivancos, S. M., Pahnke, K., John, S. G., Xiang, Y., Hatta, M., Petrova, M. V., Heimbürger-Boavida, L. E., Bauch, D., Newton, R., Pasqualini, A., Agather, A. M., Amon, R. M. W., Anderson, R. F., Andersson, P. S., Benner, R., Bowman, K. L., Edwards, R. L., Gdaniec, S., Gerringa, L. J. A., González, A. G., Granskog, M., Haley, B., Hammerschmidt, C. R., Hansell, D. A., Henderson, P. B., Kadko, D. C., Kaiser, K., Laan, P., Lam, P. J., Lamborg, C. H., Levier, M., Li, X., Margolin, A. R., Measures, C., Middag, R., Millero, F. J., Moore, W. S., Paffrath, R., Planquette, H., Rabe, B., Reader, H., Rember, R., Rijkenberg, M. J. A., Roy-Barman, M., Rutgers van der Loeff, M., Saito, M., Schauer, U., Schlosser, P., Sherrell, R. M., Shiller, A. M., Slagter, H., Sonke, J. E., Stedmon, C., Woosley, R. J., Valk, O., van Ooijen, J., and Zhang, R.: The Transpolar Drift as a source of riverine and shelf-derived trace elements to the central Arctic Ocean, J. Geophys. Res.-Oceans, 125, e2019JC015920, https://doi.org/10.1029/2019JC015920, 2020.
Chester, R. and Hughes, M. J.: A chemical technique for the separation of ferro-manganese minerals, carbonate minerals and adsorbed trace elements from pelagic sediments, Chem. Geol., 2, 249–262, https://doi.org/10.1016/0009-2541(67)90025-3, 1967.
Church, T. M., Véron, A., Patterson, C. C., Settle, D., Erel, Y., Maring, H. R., and Flegal, A. R.: Trace elements in the North Atlantic troposphere: shipboard results of precipitation and aerosols, Global Biogeochem. Cy., 4, 431–443, https://doi.org/10.1029/GB004i004p00431, 1990.
Cunningham, C. X., Williamson, G. J., and Bowman, D. M. J. S.: Increasing frequency and intensity of the most extreme wildfires on Earth, Nat. Ecol. Evol., 8, 1420–1425, https://doi.org/10.1038/s41559-024-02452-2, 2024.
de Baar, H. J. W., de Jong, J. T. M., Bakker, D. C. E., Löscher, B. M., Veth, C., Bathmannt, U., and Smetacek, V.: Importance of iron for plankton blooms and carbon dioxide drawdown in the Southern Ocean, Nature, 373, 412–415, https://doi.org/10.1038/373412a0, 1995.
Desboeufs, K. V., Sofikitis, A., Losno, R., Colin, J. L., and Ausset, P.: Dissolution and solubility of trace metals from natural and anthropogenic aerosol particulate matter, Chemosphere, 58, 195–203, https://doi.org/10.1016/j.chemosphere.2004.02.025, 2005.
De Vera, J., Chandan, P., Landing, W. M., Stupple, G. W., Steffen, A., and Bergquist, B. A.: Amount, sources, and dissolution of aerosol trace elements in the Canadian Arctic, ACS Earth Space Chem., 5, 2686–2699, https://doi.org/10.1021/acsearthspacechem.1c00132, 2021.
Duce, R. A., Liss, P. S., Merrill, J. T., Atlas, E. L., Buat-Menard, P., Hicks, B. B., Miller, J. M., Prospero, J. M., Arimoto, R., Church, T. M., Ellis, W., Galloway, J. N., Hansen, L., Jickells, T. D., Knap, A. H., Reinhardt, K. H., Schneider, B., Soudine, A., Tokos, J. J., Tsunogai, S., Wollast, R., and Zhou, M.: The atmospheric input of trace species to the world ocean, Global Biogeochem. Cy., 5, 193–259, https://doi.org/10.1029/91GB01778, 1991.
Ebling, A. M. and Landing, W. M.: Sampling and analysis of the sea surface microlayer for dissolved and particulate trace elements, Mar. Chem., 177, 134–142, https://doi.org/10.1016/j.marchem.2015.03.012, 2015.
Fan, S., Lai, B., Elzinga, E. J., Ingall, E. D., Morton, P. L., and Gao, Y.: Spatial variability of aerosol iron mineralogy and oxidation states over the Arctic Ocean, Sci. Total Environ., 889, 164301, https://doi.org/10.1016/j.scitotenv.2023.164301, 2023.
Fishwick, M. P., Sedwick, P. N., Lohan, M. C., Worsfold, P. J., Buck, K. N., Church, T. M., and Ussher, S. J.: The impact of changing surface ocean conditions on the dissolution of aerosol iron, Global Biogeochem. Cy., 28, 1235–1250, https://doi.org/10.1002/2014GB004921, 2014.
Gao, Y., Marsay, C. M., Yu, S., Fan, S., Mukherjee, P., Buck, C. S., and Landing, W. M.: Particle-size variability of aerosol iron and impact on iron solubility and dry deposition fluxes to the Arctic Ocean, Sci. Rep.-UK, 9, 16653, https://doi.org/10.1038/s41598-019-52468-z, 2019.
Gledhill, M. and Buck, K. N.: The organic complexation of iron in the marine environment: a review, Front. Microbiol., 3, 69, https://doi.org/10.3389/fmicb.2012.00069, 2012.
Gong, S. L. and Barrie, L. A.: Trends of heavy metal components in the Arctic aerosols and their relationship to the emissions in the Northern Hemisphere, Sci. Total Environ., 342, 175–183, https://doi.org/10.1016/j.scitotenv.2004.12.031, 2005.
Groot Zwaaftink, C. D., Grythe, H., Skov, H., and Stohl, A.: Substantial contribution of northern high-latitude sources to mineral dust in the Arctic, J. Geophys. Res.-Atmos., 121, 13678–13697, https://doi.org/10.1002/2016JD025482, 2016.
Guan, W., Lan, M., Lee, Y. P., Huang, Y., Lin, H., Chen, M., Chen, J., and Zhang, R.: Trace elements in Arctic Ocean aerosols: contemporary status and decadal variability, J. Geophys. Res.-Atmos., 131, e2025JD045561, https://doi.org/10.1029/2025jd045561, 2026.
Hamilton, D. S., Scanza, R. A., Rathod, S. D., Bond, T. C., Kok, J. F., Li, L., Matsui, H., and Mahowald, N. M.: Recent (1980 to 2015) trends and variability in daily-to-interannual soluble iron deposition from dust, fire, and anthropogenic sources, Geophys. Res. Lett., 47, e2020GL089688, https://doi.org/10.1029/2020GL089688, 2020.
Hamilton, D. S., Perron, M. M. G., Bond, T. C., Bowie, A. R., Buchholz, R. R., Guieu, C., Ito, A., Maenhaut, W., Myriokefalitakis, S., Olgun, N., Rathod, S. D., Schepanski, K., Tagliabue, A., Wagner, R., and Mahowald, N. M.: Earth, wind, fire, and pollution: aerosol nutrient sources and impacts on ocean biogeochemistry, Annu. Rev. Mar. Sci., 14, 303–330, https://doi.org/10.1146/annurev-marine-031921-013612, 2022.
Han, Y., Zhao, T., Song, L., Fang, X., Yin, Y., Deng, Z., Wang, S., and Fan, S.: A linkage between Asian dust, dissolved iron and marine export production in the deep ocean, Atmos. Environ., 45, 4291–4298, https://doi.org/10.1016/j.atmosenv.2011.04.078, 2011.
Ito, A.: Mega fire emissions in Siberia: potential supply of bioavailable iron from forests to the ocean, Biogeosciences, 8, 1679–1697, https://doi.org/10.5194/bg-8-1679-2011, 2011.
Ito, A. and Shi, Z.: Delivery of anthropogenic bioavailable iron from mineral dust and combustion aerosols to the ocean, Atmos. Chem. Phys., 16, 85–99, https://doi.org/10.5194/acp-16-85-2016, 2016.
Jickells, T. and Moore, C. M.: The importance of atmospheric deposition for ocean productivity, Annu. Rev. Ecol. Evol. S., 46, 481–501, https://doi.org/10.1146/annurev-ecolsys-112414-054118, 2015.
Jickells, T. D., An, Z. S., Andersen, K. K., Baker, A. R., Bergametti, G., Brooks, N., Cao, J. J., Boyd, P. W., Duce, R. A., Hunter, K. A., Kawahata, H., Kubilay, N., LaRoche, J., Liss, P. S., Mahowald, N., Prospero, J. M., Ridgwell, A. J., Tegen, I., and Torres, R.: Global iron connections between desert dust, ocean biogeochemistry, and climate, Science, 308, 67–71, https://doi.org/10.1126/science.1105959, 2005.
Jickells, T. D., Baker, A. R., and Chance, R.: Atmospheric transport of trace elements and nutrients to the oceans, Philos. T. Roy. Soc. A, 374, 20150286, https://doi.org/10.1098/rsta.2015.0286, 2016.
Journet, E., Desboeufs, K. V., Caquineau, S., and Colin, J.-L.: Mineralogy as a critical factor of dust iron solubility, Geophys. Res. Lett., 35, L07805, https://doi.org/10.1029/2007GL031589, 2008.
Kadko, D. and Swart, P.: The source of the high heat and freshwater content of the upper ocean at the SHEBA site in the Beaufort Sea in 1997, J. Geophys. Res.-Oceans, 109, C01022, https://doi.org/10.1029/2002JC001734, 2004.
Kadko, D., Landing, W. M., and Shelley, R. U.: A novel tracer technique to quantify the atmospheric flux of trace elements to remote ocean regions, J. Geophys. Res.-Oceans, 120, 848–858, https://doi.org/10.1002/2014JC010314, 2015.
Kadko, D., Galfond, B., Landing, W. M., and Shelley, R. U.: Determining the pathways, fate, and flux of atmospherically derived trace elements in the Arctic ocean/ice system, Mar. Chem., 182, 38–50, https://doi.org/10.1016/j.marchem.2016.04.006, 2016.
Kadko, D., Aguilar-Islas, A., Bolt, C., Buck, C. S., Fitzsimmons, J. N., Jensen, L. T., Landing, W. M., Marsay, C. M., Rember, R., Shiller, A. M., Whitmore, L. M., and Anderson, R. F.: The residence times of trace elements determined in the surface Arctic Ocean during the 2015 US Arctic GEOTRACES expedition, Mar. Chem., 208, 56–69, https://doi.org/10.1016/J.MARCHEM.2018.10.011, 2019.
Kawamura, K. and Kaplan, I. R.: Motor exhaust emissions as a primary source for dicarboxylic acids in Los Angeles ambient air, Environ. Sci. Technol., 21, 105–110, https://doi.org/10.1021/es00155a014, 1987.
Kawamura, K., Kasukabe, H., and Barrie, L. A.: Secondary formation of water-soluble organic acids and α-dicarbonyls and their contributions to total carbon and water-soluble organic carbon: photochemical aging of organic aerosols in the Arctic spring, J. Geophys. Res.-Atmos., 115, D21306, https://doi.org/10.1029/2010JD014299, 2010.
Klunder, M. B., Laan, P., Middag, R., de Baar, H. J. W., and Bakker, K.: Dissolved iron in the Arctic Ocean: important role of hydrothermal sources, shelf input and scavenging removal, J. Geophys. Res.-Oceans, 117, C04014, https://doi.org/10.1029/2011JC007135, 2012a.
Klunder, M. B., Bauch, D., Laan, P., de Baar, H. J. W., van Heuven, S., and Ober, S.: Dissolved iron in the Arctic shelf seas and surface waters of the central Arctic Ocean: impact of Arctic river water and ice-melt, J. Geophys. Res.-Oceans, 117, C01027, https://doi.org/10.1029/2011JC007133, 2012b.
Kok, J. F., Adebiyi, A. A., Albani, S., Balkanski, Y., Checa-Garcia, R., Chin, M., Colarco, P. R., Hamilton, D. S., Huang, Y., Ito, A., Klose, M., Li, L., Mahowald, N. M., Miller, R. L., Obiso, V., Pérez García-Pando, C., Rocha-Lima, A., and Wan, J. S.: Contribution of the world's main dust source regions to the global cycle of desert dust, Atmos. Chem. Phys., 21, 8169–8193, https://doi.org/10.5194/acp-21-8169-2021, 2021.
Kurisu, M., Sakata, K., Uematsu, M., Ito, A., and Takahashi, Y.: Contribution of combustion Fe in marine aerosols over the northwestern Pacific estimated by Fe stable isotope ratios, Atmos. Chem. Phys., 21, 16027–16050, https://doi.org/10.5194/acp-21-16027-2021, 2021.
Laing, J. R., Hopke, P. K., Hopke, E. F., Husain, L., Dutkiewicz, V. A., Paatero, J., and Viisanen, Y.: Long-term particle measurements in Finnish Arctic: Part I – chemical composition and trace metal solubility, Atmos. Environ., 88, 275–284, https://doi.org/10.1016/j.atmosenv.2014.03.002, 2014a.
Laing, J. R., Hopke, P. K., Hopke, E. F., Husain, L., Dutkiewicz, V. A., Paatero, J., and Viisanen, Y.: Long-term particle measurements in Finnish Arctic: Part II – trend analysis and source location identification, Atmos. Environ., 88, 285–296, https://doi.org/10.1016/j.atmosenv.2014.01.015, 2014b.
Li, R., Dong, S., Huang, C., Yu, F., Wang, F., Li, X., Zhang, H., Ren, Y., Guo, M., Chen, Q., Ge, B., and Tang, M.: Evaluating the effects of contact time and leaching solution on measured solubilities of aerosol trace metals, Appl. Geochem., 148, 105551, https://doi.org/10.1016/j.apgeochem.2022.105551, 2023.
Li, R., Panda, P. P., Chen, Y., Zhu, Z., Wang, F., Zhu, Y., Meng, H., Ren, Y., Kumar, A., and Tang, M.: Aerosol trace element solubility determined using ultrapure water batch leaching: an intercomparison study of four different leaching protocols, Atmos. Meas. Tech., 17, 3147–3156, https://doi.org/10.5194/amt-17-3147-2024, 2024.
Luo, C., Mahowald, N., Bond, T., Chuang, P. Y., Artaxo, P., Siefert, R., Chen, Y., and Schauer, J.: Combustion iron distribution and deposition, Global Biogeochem. Cy., 22, GB1012, https://doi.org/10.1029/2007GB002964, 2008.
Mackey, K. R. M., Chien, C.-T., Post, A. F., Saito, M. A., and Paytan, A.: Rapid and gradual modes of aerosol trace metal dissolution in seawater, Front. Microbiol., 5, https://doi.org/10.3389/fmicb.2014.00794, 2015.
Maenhaut, W., Ducastel, G., Leck, C., Nilsson, E. D., and Heintzenberg, J.: Multi-elemental composition and sources of the high Arctic atmospheric aerosol during summer and autumn, Tellus B, 48, 300–321, https://doi.org/10.1034/j.1600-0889.1996.t01-1-00011.x, 1996.
Mahowald, N. M., Baker, A. R., Bergametti, G., Brooks, N., Duce, R. A., Jickells, T. D., Kubilay, N., Prospero, J. M., and Tegen, I.: Atmospheric global dust cycle and iron inputs to the ocean, Global Biogeochem. Cy., 19, GB4025, https://doi.org/10.1029/2004GB002402, 2005.
Mahowald, N. M., Hamilton, D. S., Mackey, K. R. M., Moore, J. K., Baker, A. R., Scanza, R. A., and Zhang, Y.: Aerosol trace metal leaching and impacts on marine microorganisms, Nat. Commun., 9, 2614, https://doi.org/10.1038/s41467-018-04970-7, 2018.
Marsay, C. M., Kadko, D., Landing, W. M., Morton, P. L., Summers, B. A., and Buck, C. S.: Concentrations, provenance and flux of aerosol trace elements during US GEOTRACES Western Arctic cruise GN01, Chem. Geol., 502, 1–14, https://doi.org/10.1016/j.chemgeo.2018.06.007, 2018a.
Marsay, C. M., Aguilar-Islas, A., Fitzsimmons, J. N., Hatta, M., Jensen, L. T., John, S. G., Kadko, D., Landing, W. M., Lanning, N. T., Morton, P. L., Pasqualini, A., Rauschenberg, S., Sherrell, R. M., Shiller, A. M., Twining, B. S., Whitmore, L. M., Zhang, R., and Buck, C. S.: Dissolved and particulate trace elements in late summer Arctic melt ponds, Mar. Chem., 204, 70–85, https://doi.org/10.1016/j.marchem.2018.06.002, 2018b.
Marsay, C. M., Stephens, M. P., Bucci, S., Landing, W. M., and Buck, C. S.: Concentrations, solubility, and deposition fluxes of aerosol trace elements in the central Arctic during winter and spring: results from the MOSAiC Expedition, Global Biogeochem. Cy., 39, e2025GB008642, https://doi.org/10.1029/2025GB008642, 2025.
Martin, J. H.: Glacial-interglacial CO2 change: the Iron Hypothesis, Paleoceanography, 5, 1–13, https://doi.org/10.1029/PA005i001p00001, 1990.
Martin, J. H. and Fitzwater, S. E.: Iron deficiency limits phytoplankton growth in the north-east Pacific subarctic, Nature, 331, 341–343, https://doi.org/10.1038/331341a0, 1988.
Martin, J. H., Gordon, R. M., Fitzwater, S., and Broenkow, W. W.: VERTEX: phytoplankton/iron studies in the Gulf of Alaska, Deep-Sea Res., 36, 649–680, https://doi.org/10.1016/0198-0149(89)90144-1, 1989.
Maters, E. C., Mulholland, D. S., Flament, P., de Jong, J., Mattielli, N., Deboudt, K., Dhont, G., and Bychkov, E.: Laboratory study of iron isotope fractionation during dissolution of mineral dust and industrial ash in simulated cloud water, Chemosphere, 299, 134472, https://doi.org/10.1016/j.chemosphere.2022.134472, 2022.
McDaniel, M. F. M., Ingall, E. D., Morton, P. L., Castorina, E., Weber, R. J., Shelley, R. U., Landing, W. M., Longo, A. F., Feng, Y., and Lai, B.: Relationship between atmospheric aerosol mineral surface area and iron solubility, ACS Earth Space Chem., 3, 2443–2451, https://doi.org/10.1021/acsearthspacechem.9b00152, 2019.
Moore, C. M., Mills, M. M., Achterberg, E. P., Geider, R. J., Laroche, J., Lucas, M. I., McDonagh, E. L., Pan, X., Poulton, A. J., Rijkenberg, M. J. A., Suggett, D. J., Ussher, S. J., and Woodward, E. M. S.: Large-scale distribution of Atlantic nitrogen fixation controlled by iron availability, Nat. Geosci., 2, 867–871, https://doi.org/10.1038/ngeo667, 2009.
Morton, P. L., Landing, W. M., Hsu, S. C., Milne, A., Aguilar-Islas, A. M., Baker, A. R., Bowie, A. R., Buck, C. S., Gao, Y., Gichuki, S., Hastings, M. G., Hatta, M., Johansen, A. M., Losno, R., Mead, C., Patey, M. D., Swarr, G., Vandermark, A., and Zamora, L. M.: Methods for the sampling and analysis of marine aerosols: results from the 2008 GEOTRACES aerosol intercalibration experiment, Limnol. Oceanogr.-Meth., 11, 62–78, https://doi.org/10.4319/lom.2013.11.62, 2013.
Mukherjee, P., Marsay, C. M., Yu, S., Buck, C. S., Landing, W. M., and Gao, Y.: Concentrations and size-distributions of water-soluble inorganic and organic species on aerosols over the Arctic Ocean observed during the US GEOTRACES Western Arctic Cruise GN01, Atmos. Environ., 261, 118569, https://doi.org/10.1016/j.atmosenv.2021.118569, 2021.
Narukawa, M., Kawamura, K., Takeuchi, N., and Nakajima, T.: Distribution of dicarboxylic acids and carbon isotopic compositions in aerosols from 1997 Indonesian forest fires, Geophys. Res. Lett., 26, 3101–3104, https://doi.org/10.1029/1999GL010810, 1999.
Nguyen, Q. T., Kristensen, T. B., Hansen, A. M. K., Skov, H., Bossi, R., Massling, A., Sørensen, L. L., Bilde, M., Glasius, M., and Nøjgaard, J. K.: Characterization of humic-like substances in Arctic aerosols, J. Geophys. Res.-Atmos., 119, 5011–5027, https://doi.org/10.1002/2013JD020144, 2014.
Olgun, N., Duggen, S., Croot, P. L., Delmelle, P., Dietze, H., Schacht, U., Óskarsson, N., Siebe, C., Auer, A., and Garbe-Schönberg, D.: Surface ocean iron fertilization: the role of airborne volcanic ash from subduction zone and hot spot volcanoes and related iron fluxes into the Pacific Ocean, Global Biogeochem. Cy., 25, GB4001, https://doi.org/10.1029/2009GB003761, 2011.
Paris, R. and Desboeufs, K. V.: Effect of atmospheric organic complexation on iron-bearing dust solubility, Atmos. Chem. Phys., 13, 4895–4905, https://doi.org/10.5194/acp-13-4895-2013, 2013.
Perron, M. M. G., Strzelec, M., Gault-Ringold, M., Proemse, B. C., Boyd, P. W., and Bowie, A. R.: Assessment of leaching protocols to determine the solubility of trace metals in aerosols, Talanta, 208, 120377, https://doi.org/10.1016/j.talanta.2019.120377, 2020.
Planquette, H. and Sherrell, R. M.: Sampling for particulate trace element determination using water sampling bottles: methodology and comparison to in situ pumps, Limnol. Oceanogr.-Meth., 10, 367–388, https://doi.org/10.4319/lom.2012.10.367, 2012.
Prospero, J. M., Ginoux, P., Torres, O., Nicholson, S. E., and Gill, T. E.: Environmental characterization of global sources of atmospheric soil dust identified with the Nimbus 7 Total Ozone Mapping Spectrometer (TOMS) absorbing aerosol product, Rev. Geophys., 40, 1002, https://doi.org/10.1029/2000RG000095, 2002.
Rathod, S. D., Hamilton, D. S., Nino, L., Kreidenweis, S. M., Bian, Q., Mahowald, N. M., Alastuey, A., Querol, X., Paytan, A., Artaxo, P., Herut, B., Gaston, C., Prospero, J., Chellam, S., Hueglin, C., Varrica, D., Dongarra, G., Cohen, D. D., Smichowski, P., Gomez, D., Lambert, F., Barraza, F., Bergametti, G., Rodríguez, S., Gonzalez-Ramos, Y., Hand, J., Kyllönen, K., Hakola, H., Chuang, P., Hopke, P. K., Harrison, R. M., Martin, R. V., Walsh, B., Weagle, C., Maenhaut, W., Morera-Gómez, Y., Chen, Y.-C., Pierce, J. R., and Bond, T. C.: Constraining present-day anthropogenic total iron emissions using model and observations, J. Geophys. Res.-Atmos., 129, e2023JD040332, https://doi.org/10.1029/2023JD040332, 2024.
Rauch, J. N. and Pacyna, J. M.: Earth's global Ag, Al, Cr, Cu, Fe, Ni, Pb, and Zn cycles, Global Biogeochem. Cy., 23, GB2001, https://doi.org/10.1029/2008GB003376, 2009.
Rijkenberg, M. J. A., Slagter, H. A., van der Loeff, M. R., van Ooijen, J., and Gerringa, L. J. A.: Dissolved Fe in the deep and upper Arctic Ocean with a focus on Fe limitation in the Nansen Basin, Front. Mar. Sci., 5, 88, https://doi.org/10.3389/fmars.2018.00088, 2018.
Rolph, G., Stein, A., and Stunder, B.: Real-time Environmental Applications and Display sYstem: READY, Environ. Modell. Softw., 95, 210–228, https://doi.org/10.1016/j.envsoft.2017.06.025, 2017.
Schlitzer, R.: Ocean Data View, https://odv.awi.de (last access: 18 September 2025), 2025.
Schmale, J., Sharma, S., Decesari, S., Pernov, J., Massling, A., Hansson, H.-C., von Salzen, K., Skov, H., Andrews, E., Quinn, P. K., Upchurch, L. M., Eleftheriadis, K., Traversi, R., Gilardoni, S., Mazzola, M., Laing, J., and Hopke, P.: Pan-Arctic seasonal cycles and long-term trends of aerosol properties from 10 observatories, Atmos. Chem. Phys., 22, 3067–3096, https://doi.org/10.5194/acp-22-3067-2022, 2022.
Schroth, A. W., Crusius, J., Sholkovitz, E. R., and Bostick, B. C.: Iron solubility driven by speciation in dust sources to the ocean, Nat. Geosci., 2, 337–340, https://doi.org/10.1038/ngeo501, 2009.
Sedwick, P. N., Sholkovitz, E. R., and Church, T. M.: Impact of anthropogenic combustion emissions on the fractional solubility of aerosol iron: evidence from the Sargasso Sea, Geochem. Geophy. Geosy., 8, Q10Q06, https://doi.org/10.1029/2007GC001586, 2007.
Shao, Y., Wyrwoll, K.-H., Chappell, A., Huang, J., Lin, Z., McTainsh, G. H., Mikami, M., Tanaka, T. Y., Wang, X., and Yoon, S.: Dust cycle: an emerging core theme in Earth system science, Aeolian Res., 2, 181–204, https://doi.org/10.1016/j.aeolia.2011.02.001, 2011.
Sharma, S., Ishizawa, M., Chan, D., Lavoué, D., Andrews, E., Eleftheriadis, K., and Maksyutov, S.: 16-year simulation of Arctic black carbon: transport, source contribution, and sensitivity analysis on deposition, J. Geophys. Res.-Atmos., 118, 943–964, https://doi.org/10.1029/2012JD017774, 2013.
Shaw, G. E.: The Arctic haze phenomenon, B. Am. Meteorol. Soc., 76, 2403–2413, https://doi.org/10.1175/1520-0477(1995)076<2403:TAHP>2.0.CO;2, 1995.
Shelley, R. U., Landing, W. M., Ussher, S. J., Planquette, H., and Sarthou, G.: Regional trends in the fractional solubility of Fe and other metals from North Atlantic aerosols (GEOTRACES cruises GA01 and GA03) following a two-stage leach, Biogeosciences, 15, 2271–2288, https://doi.org/10.5194/bg-15-2271-2018, 2018.
Shi, Z. B., Woodhouse, M. T., Carslaw, K. S., Krom, M. D., Mann, G. W., Baker, A. R., Savov, I., Fones, G. R., Brooks, B., Drake, N., Jickells, T. D., and Benning, L. G.: Minor effect of physical size sorting on iron solubility of transported mineral dust, Atmos. Chem. Phys., 11, 8459–8469, https://doi.org/10.5194/acp-11-8459-2011, 2011.
Sholkovitz, E. R., Sedwick, P. N., and Church, T. M.: Influence of anthropogenic combustion emissions on the deposition of soluble aerosol iron to the ocean: empirical estimates for island sites in the North Atlantic, Geochim. Cosmochim. Ac., 73, 3981–4003, https://doi.org/10.1016/j.gca.2009.04.029, 2009.
Sholkovitz, E. R., Sedwick, P. N., Church, T. M., Baker, A. R., and Powell, C. F.: Fractional solubility of aerosol iron: synthesis of a global-scale data set, Geochim. Cosmochim. Ac., 89, 173–189, https://doi.org/10.1016/j.gca.2012.04.022, 2012.
Spokes, L. J., Jickells, T. D., and Lim, B.: Solubilisation of aerosol trace metals by cloud processing: a laboratory study, Geochim. Cosmochim. Ac., 58, 3281–3287, https://doi.org/10.1016/0016-7037(94)90056-6, 1994.
Stein, A. F., Draxler, R. R., Rolph, G. D., Stunder, B. J. B., Cohen, M. D., and Ngan, F.: NOAA's HYSPLIT atmospheric transport and dispersion modeling system, B. Am. Meteorol. Soc., 96, 2059–2077, https://doi.org/10.1175/BAMS-D-14-00110.1, 2015.
Tagliabue, A., Aumont, O., and Bopp, L.: The impact of different external sources of iron on the global carbon cycle, Geophys. Res. Lett., 41, 920–926, https://doi.org/10.1002/2013GL059059, 2014.
Tagliabue, A., Aumont, O., DeAth, R., Dunne, J. P., Dutkiewicz, S., Galbraith, E., Misumi, K., Moore, J. K., Ridgewell, A., Sherman, E., Stock, C., Vichi, M., Völker, C., and Yool, A.: How well do global ocean biogeochemistry models simulate dissolved iron distributions?, Global Biogeochem. Cy., 30, 149–174, https://doi.org/10.1002/2015GB005289, 2016.
Tagliabue, A., Bowie, A. R., Boyd, P. W., Buck, K. N., Johnson, K. S., and Saito, M. A.: The integral role of iron in ocean biogeochemistry, Nature, 543, 51–59, https://doi.org/10.1038/nature21058, 2017.
Tagliabue, A., Buck, K. N., Sofen, L. E., Twining, B. S., Aumont, O., Boyd, P. W., Caprara, S., Homoky, W. B., Johnson, R., König, D., Ohnemus, D. C., Sohst, B., and Sedwick, P.: Authigenic mineral phases as a driver of the upper-ocean iron cycle, Nature, 620, 104–109, https://doi.org/10.1038/s41586-023-06210-5, 2023.
Tang, M., Perron, M. M. G., Baker, A. R., Li, R., Bowie, A. R., Buck, C. S., Kumar, A., Shelley, R., Ussher, S. J., Clough, R., Meyerink, S., Panda, P. P., Townsend, A. T., and Wyatt, N.: Measurement of soluble aerosol trace elements: inter-laboratory comparison of eight leaching protocols, Atmos. Meas. Tech., 18, 6125–6141, https://doi.org/10.5194/amt-18-6125-2025, 2025.
Tang, W., Llort, J., Weis, J., Perron, M. M. G., Basart, S., Li, Z., Sathyendranath, S., Jackson, T., Sanz Rodriguez, E., Proemse, B. C., Bowie, A. R., Schallenberg, C., Strutton, P. G., Matear, R., and Cassar, N.: Widespread phytoplankton blooms triggered by 2019–2020 Australian wildfires, Nature, 597, 370–375, https://doi.org/10.1038/s41586-021-03805-8, 2021.
Tian, Z., Ollivier, P., Véron, A., and Church, T. M.: Atmospheric Fe deposition modes at Bermuda and the adjacent Sargasso Sea, Geochem. Geophy. Geosy., 9, Q08007, https://doi.org/10.1029/2007GC001868, 2008.
van Pinxteren, M., Fiedler, B., van Pinxteren, D., Iinuma, Y., Körtzinger, A., and Herrmann, H.: Chemical characterization of sub-micrometer aerosol particles in the tropical Atlantic Ocean: marine and biomass burning influences, J. Atmos. Chem., 72, 105–125, https://doi.org/10.1007/s10874-015-9307-3, 2015.
Whitmore, L. M., Morton, P. L., Twining, B. S., and Shiller, A. M.: Vanadium cycling in the western Arctic Ocean is influenced by shelf-basin connectivity, Mar. Chem., 216, 103701, https://doi.org/10.1016/j.marchem.2019.103701, 2019.
Winiger, P., Barrett, T. E., Sheesley, R. J., Huang, L., Sharma, S., Barrie, L. A., Yttri, K. E., Evangeliou, N., Eckhardt, S., Stohl, A., Klimont, Z., Heyes, C., Semiletov, I. P., Dudarev, O. V., Charkin, A., Shakhova, N., Holmstrand, H., Andersson, A., and Gustafsson, Ö.: Source apportionment of circum-Arctic atmospheric black carbon from isotopes and modeling, Sci. Adv., 5, eaau8052, https://doi.org/10.1126/sciadv.aau8052, 2019.
Winton, V. H. L., Bowie, A. R., Edwards, R., Keywood, M., Townsend, A. T., van der Merwe, P., and Bollhöfer, A.: Fractional iron solubility of atmospheric iron inputs to the Southern Ocean, Mar. Chem., 177, 20–32, https://doi.org/10.1016/j.marchem.2015.06.006, 2015.
Winton, V. H. L., Edwards, R., Bowie, A. R., Keywood, M., Williams, A. G., Chambers, S. D., Selleck, P. W., Desservettaz, M., Mallet, M. D., and Paton-Walsh, C.: Dry season aerosol iron solubility in tropical northern Australia, Atmos. Chem. Phys., 16, 12829–12848, https://doi.org/10.5194/acp-16-12829-2016, 2016.
Wozniak, A. S., Shelley, R. U., McElhenie, S. D., Landing, W. M., and Hatcher, P. G.: Aerosol water soluble organic matter characteristics over the North Atlantic Ocean: implications for iron-binding ligands and iron solubility, Mar. Chem., 173, 162–172, https://doi.org/10.1016/j.marchem.2014.11.002, 2015.
Yang, T., Chen, Y., Zhou, S., Li, H., Wang, F., and Zhu, Y.: Solubilities and deposition fluxes of atmospheric Fe and Cu over the Northwest Pacific and its marginal seas, Atmos. Environ., 239, 117763, https://doi.org/10.1016/j.atmosenv.2020.117763, 2020.