
the Creative Commons Attribution 4.0 License.
the Creative Commons Attribution 4.0 License.
 | 08 Oct 2026
Precision of phytoplankton pigment analysis by high-performance liquid chromatography: an assessment of the global ocean color validation dataset analyzed by NASA
Joaquín E. Chaves

Crystal S. Thomas
Antonio Mannino
Space-borne ocean color sensors capable of measuring phytoplankton pigments, such as chlorophyll a, have greatly expanded our understanding of oceanic biological processes. The ability to generate such measurements in a way that satisfies the requirements of climate-quality data records is contingent in part on the quality of the in situ ground or sea truth observations that serve as datasets for vicarious calibration and algorithm validation activities. The National Aeronautics and Space Administration (NASA) has a mandate to collect and distribute in situ data of the highest quality to support data product validation for ocean color missions; hence the agency uses a centralized, quality-assured laboratory to perform high-performance liquid chromatography (HPLC) analysis of pigment samples collected by NASA-affiliated investigators. Since its establishment in 2011, the facility at NASA's Goddard Space Flight Center has processed over 30 000 samples collected in all the major ocean basins. We evaluated the replicate sample precision, measured as the percent coefficient of variation among replicates (CV %) derived predominantly from duplicate analyses, with a very small minority of triplicates and higher-order sets, for total chlorophyll a and all pigments examined to investigate the sources of variability in analytical measurements. Here, primary pigments refer to chlorophylls and carotenoids commonly analyzed in phytoplankton research, secondary pigments are individual compounds aggregated to quantitate the primary pigments, and tertiary pigments are less frequently reported compounds commonly present in smaller amounts. Mean analytical precision, expressed as the mean CV % for each pigment, ranged from 3.2 % (divinyl chlorophyll a) to 17.1 % (chlorophyllide a). The analytical precision performance benchmarks for total chlorophyll a (5 %) and primary pigments (8 %), established for legacy ocean color missions, were met for total chlorophyll a and for 10 of 12 primary pigments. Two primary pigments exceeded the 8 % benchmark: diatoxanthin (8.6 %) and peridinin (9.2 %). No performance benchmarks have been established for secondary or tertiary pigments. Precision was evaluated against average sample concentration, pigment mass injected into the HPLC instrument, filtered volume, estimated phytoplankton size-fractions (micro-, nano-, and picoplankton), and sample origin (coastal versus oceanic) using multivariate regression and non-parametric approaches. Neither concentration nor pigment mass appeared as significant drivers of precision variability across their ranges. Precision showed minimal variation across concentration ranges for total chlorophyll a and primary pigments but deteriorated toward detection limits for secondary and tertiary pigments when samples with invariant replicates (CV % = 0) were excluded from analysis. Filtration volumes > 1000 mL generally improved precision, though it degraded at higher volumes for some pigments in censored datasets, possibly attributable to a combination of physical stresses during extended filtration and to detection limit constraints whereby low abundance pigments may still fall near their limit of detection regardless of the volume filtered. For most pigments, sample precision was statistically poorer in coastal versus oceanic samples, though previous interlaboratory comparisons suggest this reflects methodological rather than biogeochemical factors. Multivariate regression models explained ≤ 3.0 % of precision variability in full datasets but up to 44 % when invariant replicates were excluded, indicating that analytical precision is primarily governed by methodological factors rather than systematic dependencies on sample characteristics. The distinction between analytical precision and sample heterogeneity emerged as a possible factor, with increased variability at low concentrations for rare taxa likely reflecting stochastic cell capture during filtration rather than analytical limitations. These findings demonstrate that rigorous quality assurance protocols achieve precision performance suitable for climate-quality ocean color validation, with pre-analytical sample processing and field replication strategies identified as priorities for further improvements.
- Article
(7298 KB) - Full-text XML
- BibTeX
- EndNote


Satellite ocean color sensors have expanded understanding of the biosphere by providing synoptic radiometric observations that can be translated into proxies for abundance, process rates, and physiological status of marine and terrestrial primary producers at a global scale (Behrenfeld et al., 2001, 2009; Field et al., 1998; Siegel et al., 2013). The accuracy of such measurements is however contingent on algorithm validation through in situ ground or sea truth observations. For marine applications, those measurements convey information about the in-water optical field, which is influenced by the presence of pigments in living phytoplankton cells, among other factors (Gordon and Morel, 1983; Siegel et al., 2005).
During the pre- and post-launch calibration and validation activities for the NASA Sea-Viewing Wide Field-of-View Sensor (SeaWiFS; 1997–2011) ocean color mission, which required satellite radiometric and total chlorophyll a concentration ([TChl a]; mg m−3) retrievals to be within 5 % and 35 %, respectively, over the life of the mission, considerable efforts were dedicated to evaluate the uncertainties for radiometric quantities through validation and intercalibration experiments (Hooker and Maritorena, 2000; McClain et al., 1992). A similar target was adopted with activities among laboratories specialized in measuring common phytoplankton pigments using high-performance liquid chromatography (HPLC). That effort was first carried out for TChl a within the Sensor Intercomparison and Merger for Biological and Interdisciplinary Oceanic Studies (SIMBIOS; Van Heukelem et al., 2002). Successive exercises under the SeaWiFS HPLC Analysis Round-Robin Experiments (SeaHARRE) then rendered a series of reports that established standards for quantitation of marine pigments at a quality level commensurate with calibration and validation objectives (Hooker et al., 2000, 2005, 2009, 2010, 2012).
The SeaHARRE activities followed a common model of distributing field samples and prepared pigment standards to the participating laboratories to verify that the requirements for ocean color remote sensing sea truth were being satisfied. Performance metrics to determine the quality of results were established during SeaHARRE-2 (Hooker et al., 2005) and expanded in the subsequent exercises. Two key metrics among those evaluated were accuracy and precision, which can have alternative definitions in different contexts. Because absolute truth cannot be established for any set of field samples, a proxy for truth was developed from a subset of validated methods, from which the results from all participating laboratories were evaluated. That group, called the quality-assured subset, represented the laboratories in each activity that met established performance metrics, while adhering to best practices for reducing uncertainty sources to produce uniform results across the broadest set of pigments (Hooker et al., 2012). Accuracy for each pigment was evaluated relative to the mean concentration from the quality-assured subset, and precision as the percent coefficient of variation (CV %) of the sample replicates with respect to their average concentration (Hooker et al., 2000). For TChl a, an upper accuracy benchmark was set at 25 %, with 15 % being desirable for algorithm refinement. Precision requirement was set to within 5 %. For the primary pigments, a group of 12 total chlorophylls and carotenoids, the accuracy and precision benchmarks were defined to within 25 % and 8 %, respectively (Hooker et al., 2005). In practice, all SeaHARRE exercises demonstrated that the quality-assured laboratory subset consistently exceeded ocean color performance benchmarks regardless of ocean basin or sampling location. Mean accuracy and precision for TChl a in replicate field samples analyzed by the quality-assured laboratories were 6.5 % and 4.4 %, respectively, across five SeaHARRE intercalibration activities, with maximum values of 7.8 % and 4.9 %, respectively.
Method validation is the process of verifying that an analytical procedure is appropriate for its intended purpose (Green, 1996; Van Heukelem and Hooker, 2011), such that it ensures the quality and defines the level of uncertainty associated with a reported data product (Araujo, 2009; Ellison and Williams, 2012; Ermer and Miller, 2006). Validation is an important component of a wider quality assurance plan (QAP), which additionally describes standardized procedures and metrics for sustained quality control (QC) and quality assurance (QA) of method performance. The development and implementation of a QAP for the HPLC measurement of pigments has been described by Van Heukelem and Hooker (2011), largely based on the insights gained during the intercalibration exercises and the accumulated experience at various US-based and international analytical facilities. Part of validation is assessing performance; while measuring standardized reference materials and participating in intercalibrations are complementary activities that should both be applied where possible, matrix-matched standardized reference materials for phytoplankton pigments do not currently exist in a form that captures the compositional complexity of natural phytoplankton samples (National Research Council, 2002). In this context, intercalibration exercises using natural field samples remain the most appropriate available tool for accuracy assessment. Precision assessment can also be accomplished by large-scale data reviews such as the work presented here.
NASA has a mandate to generate and distribute in situ data to support satellite vicarious calibration and data product validation, which requires measurements of the highest quality with quantified uncertainty to produce climate-quality data records (Hooker et al., 2007) . To that end, NASA established a centralized laboratory, currently at the Goddard Space Flight Center (GSFC), to analyze HPLC pigment samples collected in the field. This facility, run by the Field Support Group of GSFC's Ocean Ecology Laboratory, aims to ensure analytical integrity and traceability for NASA field observations. Since 2011, this facility has processed over 30 000 pigment samples from all major ocean basins, collected by NASA-affiliated investigators.
Table 1Photosynthetic phytoplankton pigments and their sums analyzed at the NASA GSFC HPLC facility evaluated in this study. Primary pigments are chlorophylls and carotenoids commonly analyzed in phytoplankton research; secondary pigments are the individual compounds that, when summed, constitute a primary pigment; tertiary pigments are less frequently analyzed compounds commonly present in smaller amounts. Where applicable, reported values represent the sum of a pure compound and its co-eluting derivatives, stereoisomers, epimers, or degradation products, as indicated in the Calculation column. The variable forms in square brackets used to indicate the concentration of each pigment are based on the nomenclature established by SCOR Working Group 78 (Jeffrey and Mantoura, 1997). Abbreviations are shown in parentheses.

The GSFC facility has implemented an HPLC QAP with QA and QC procedures that document average instrument precision for TChl a and primary pigments of 0.5 % and 1.8 %, respectively. Instrument precision provides a calculation independent of uncertainties associated with samples (collection, storage, and extraction). Replicate sample precision, understood here as the percent coefficient of variation among replicates, has not been evaluated as a function of broader field parameters in a way that may contribute to understanding sources of variability and uncertainty for the larger set of samples processed so far. For that reason, we performed a global assessment of precision for sample replicates analyzed from the laboratory's inception in 2011 through 2022. The objective was to define HPLC replicate sample precision in samples analyzed for the period examined, characterize the uncertainties and natural variability inherent in field samples, and understand any systemic biases or biogeographic influences, particularly at the lower concentration ranges of the analytical methods, to ultimately suggest recommendations or modifications to best practices of NASA protocols for the collection and analysis of field samples intended for calibration and validation of existing and future ocean color sensors.
Laboratories analyze various sets of pigments depending on their scientific objectives. GSFC's Field Support Group laboratory routinely reports 26 pigments, divided into subsets of primary, secondary, tertiary, and ancillary pigments (Table 1). The primary pigments refer to a set of chlorophylls and carotenoids commonly reported in phytoplankton research. Secondary pigments are those aggregated to quantitate the primary pigments. Tertiary pigments are a set of less frequently reported pigments and are commonly present in smaller amounts. The GSFC facility chromatographically resolves additional pigments beyond those reported here, including dinoxanthin, astaxanthin, myxoxanthophyll, and others, but does not calibrate for or report them as they are not routinely required for ocean color validation objectives. One exception is gyroxanthin diester, retained as an ancillary reported pigment due to its role as the primary diagnostic marker for peridinin-lacking toxic dinoflagellates such as Karenia brevis (Richardson and Pinckney, 2004); its presence in a sample has direct implications for pigment-based phytoplankton community assessments and ocean color validation in bloom-prone coastal regions. Because gyroxanthin diester is seldom observed in the global dataset examined here, it is excluded from the precision analyses presented. In addition to individual pigment concentrations, several pigment sums are routinely reported (Table 1). Chlorophyllide a (Chlide a), while included as a discrete reported value and incorporated into TChl a (Table 1), is largely an artifactual degradation product of monovinyl chlorophyll a formed during extraction when water retained in the filter reacts with acetone (Canjura, 1991). Its discrete reporting serves as a useful indicator of sample handling and extraction quality for data end users. The analysis presented here encompasses the primary, secondary, and tertiary pigments. The nomenclature and lexicon used are similar to the usage in SeaHARRE and are based on the recommendations of SCOR Working Group 78 (Claustre, 1994; Hooker and Van Heukelem, 2011; Jeffrey and Mantoura, 1997).
3.1 Analytical Methods
The measurement of phytoplankton pigments at the GSFC facility is routinely, and has been since its inception, performed following the method described by Van Heukelem and Thomas (2001) using an Agilent RR1200 (Agilent Technologies, Palo Alto, CA) with a programmable autoinjector with a 900 µL metering head and 900 µL sample loop, refrigerated autosampler and thermostatted column compartments, quaternary pump within-line vacuum degasser, and photo-diode array detector with deuterium and tungsten lamps. The deuterium lamp enables UV absorbance detection used for quantitation of the internal standard, while the tungsten lamp covers the visible range used for pigment quantitation; both detection ranges were used in the analytical procedure described below. The column was an Agilent 4.6×150 mm Eclipse XDB with a C8 stationary phase (3.5 µm particle size) maintained at 60 °C. The mobile phase consisted of two solvents: solvent A was 70 % methanol, 30 % 28 mmol L−1 tetrabutylammonium acetate (TbAA, pH 6.5) and solvent B was 100 % methanol. A linear gradient adjusted the mixture of the mobile phase from 5 % to 95 % solvent B over 27 minutes. The chromatographic output was quantified using discrete wavelengths at 450 (±10 nm) and 665 (±10 nm) with visible wavelength absorption spectra acquired between 350 and 750 nm. Beginning in September 2018, a reference wavelength at 700 nm (±10 nm) was included for online baseline correction of the 665 nm analytical signal. Thirty-six peaks were quantified that resulted in 26 pigments reported; some pigments comprise multiple components that are summed and reported as a single value (Table 1).
Samples consisted predominantly of 25 mm glass fiber filters (GF/F), alongside occasional 47 mm filters. The standard 25 mm filters were extracted by adding 2.5 mL of 100 % acetone (Fisher Scientific, No. A949) containing a dissolved vitamin E internal standard (α-tocopheryl acetate, C31H52O3; Sigma-Aldrich, No. T3376), plus 50–200 µL of water to achieve a final solvent concentration of approximately 90 % acetone. For the 47 mm filters, the procedure was adapted by using 5.0 mL of the acetone solution without additional water. The filter and solvent were then chilled at −20 °C for 1 h, after which pigments were liberated by ultrasonic probe sonication and soaked for 3–3.5 h at −20 °C. The resulting slurry was clarified using a 0.45 µm polytetrafluoroethylene (PTFE) syringe filter prior to injection. The effective extraction volume, which is the total amount of liquid (solvent + water) in which the pigment sample is processed for HPLC analysis, was calculated using the internal standard rather than assumed from nominal solvent additions. By comparing the known amount of vitamin E acetate added to the extract with its measured signal, small variations in filter water retention, extraction solvent addition, evaporation during extraction, and injection reproducibility were corrected, yielding a more accurate extraction volume for concentration calculations than a purely nominal assumed value would provide. With maximum absorbance at 222 nm, vitamin E does not interfere with pigment quantitation at 450 and 665 nm, allowing use at concentrations that achieve much higher signal-to-noise ratios than pigment-based internal standards, contributing to excellent injection repeatability averaging 0.6 %. Calibration was performed using individual dilution series of pigment standards whose concentrations had been determined spectrophotometrically using absorption coefficients in common with those used by most other laboratories (Hooker et al., 2005). Standards were acquired in solution with concentrations provided (DHI Water and Environment, Hørsholm, Denmark) or as a crystallized solid and prepared in solution in the laboratory (Sigma-Aldrich, St. Louis, Missouri) using methanol (Fisher Scientific, catalog No. A452) as solvent.
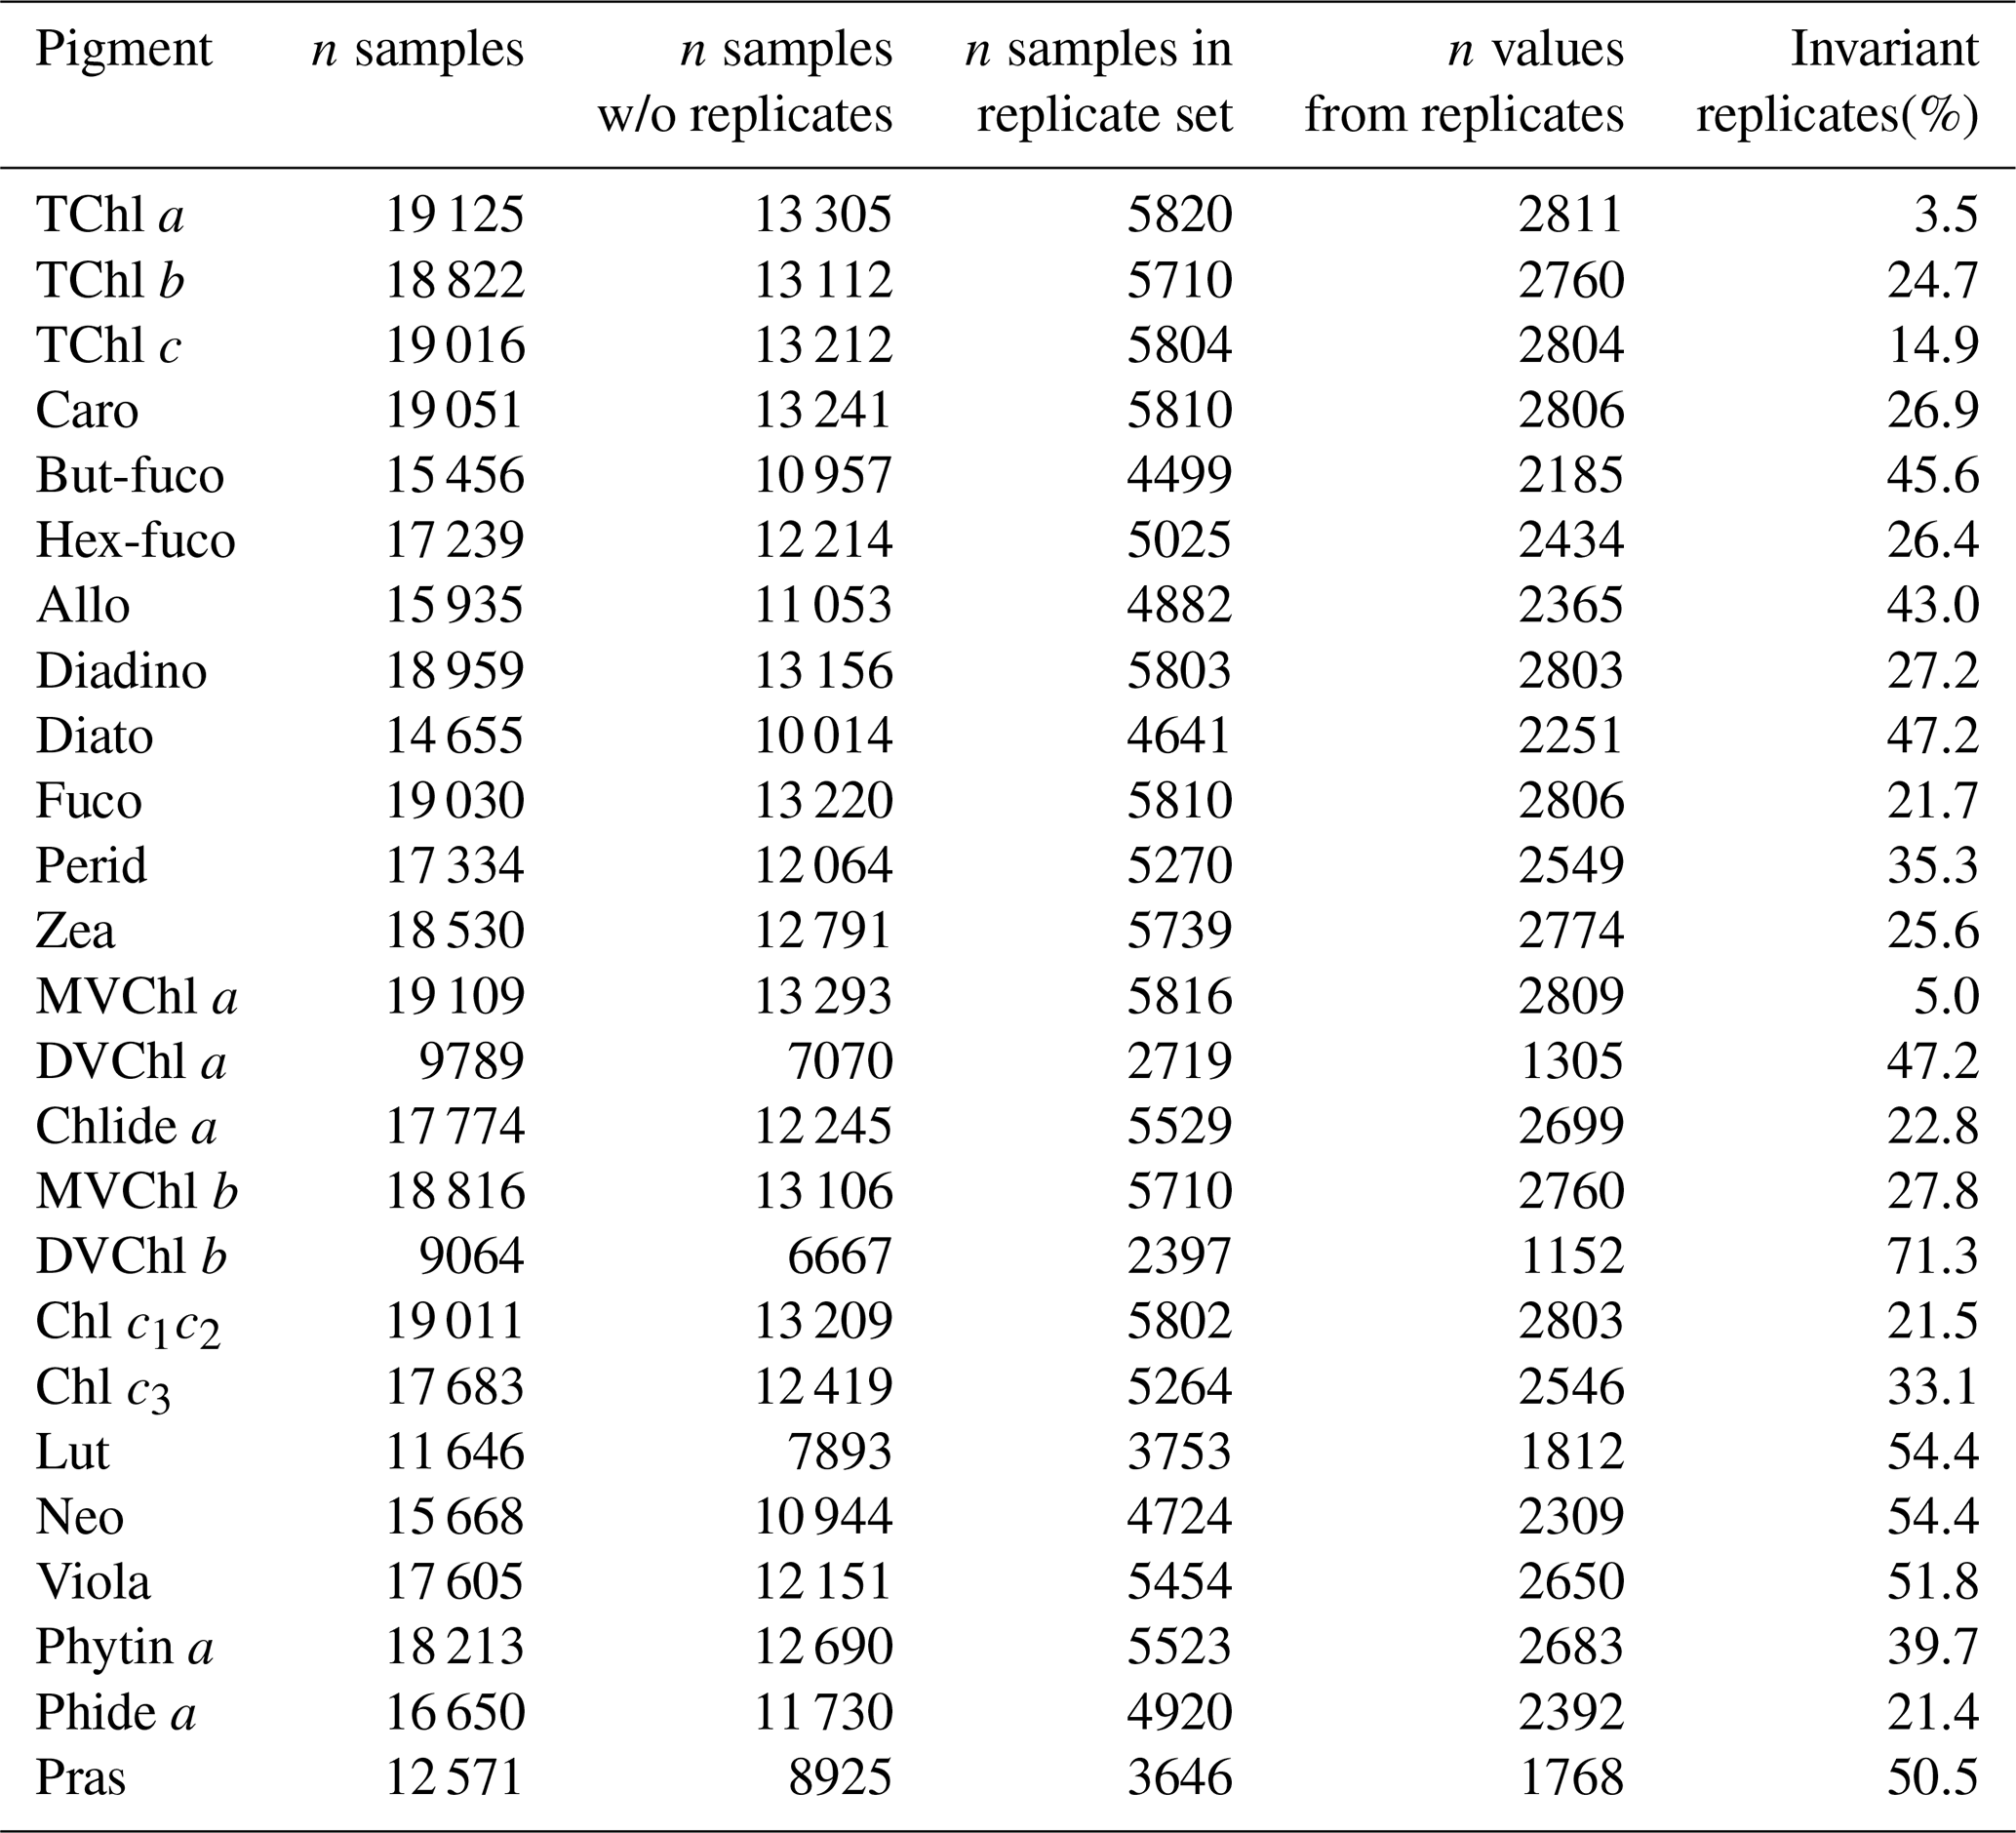
Table 2Summary of phytoplankton pigment samples analyzed at the NASA GSFC HPLC facility that were evaluated in this study. For each pigment, the total number of samples with values above the limit of quantitation (n samples), the number of unique samples without replicate measurements (n samples w/o replicates), the number of samples that are part of a replicate set (n samples in a replicate set), the total number of values obtained from the replicate measurements (n values from replicates), and the percentage of invariant replicate sets (i.e., sets with identical concentration values (i.e., standard deviation = 0).
3.2 Dataset
The pigment dataset analyzed consists of quality-controlled HPLC measurements from water samples collected globally by NASA-affiliated investigators from 2012–2022 (Table 2). Of the more than 30 000 samples processed by the NASA GSFC facility since its inception, 19 125 individual samples with TChl a concentrations above the limit of quantitation met the inclusion criteria for ocean color validation relevance described below and were retained for analysis, of which 5820 were part of a two or more replicate sample set, yielding 2811 concentration values usable for precision analyses. The replication structure of the dataset is overwhelmingly composed of duplicates: of the 2811 replicate sets, 2714 were duplicates (97.2 %), 76 were triplicates (2.7 %), 20 were quadruplicates (0.7 %), and 1 was a quintuplicate (< 0.1 %). For other measured pigments, the number of values were lower given their lower relative abundance compared to TChl a.
This dataset encompasses coastal, estuarine, and oceanic water types across all major ocean basins including some inland and riverine waters. Measurements included in this dataset were derived from whole water samples amenable to satellite validation activities, including natural phytoplankton populations from the photic zone (< 250 m depth). Excluded were experimental samples (nutrient manipulations, productivity assays), size-fractionated samples, phytoplankton cultures, deep water samples, and damaged samples. Samples were received at the GSFC facility stored in liquid nitrogen, as per field collection protocol recommendations, and transferred to −80 °C freezer storage upon arrival pending analysis. Samples identified as having thawed during shipping were excluded from the dataset. Analysis within one year of sample collection is the facility's target practice, consistent with recommended best practices for pigment preservation in frozen filters (Mantoura et al., 1997; Sosik, 1999; Van Heukelem et al., 2002). The effect of storage duration between collection and analysis on pigment precision was not evaluated in this study, as the metadata required to do so systematically across the full dataset were not uniformly available.
The NASA GSFC facility calculates and reports effective limit of quantitation (LOQ) values for each pigment on a per-sample basis, expressed in concentration units (µg L−1), accounting for the instrument-level LOQ (in ng per injection), the extraction volume, and the sample-specific filtration volumes. This per-sample approach gives more information to the data user, since the same instrumental LOQ translates to different concentration detection thresholds depending on the volume of seawater filtered. Each pigment has its own instrument-level LOQ, but a typical value of 0.06 ng per injection yields an effective LOQ of 0.001 µg L−1 when 1000 mL is filtered and the sample is extracted in 2.5 mL. That value rises to 0.006 µg L−1 when 200 mL is filtered, representing a sixfold difference arising solely from the difference in filtration volume. Concentration and effective LOQ values are both reported to three decimal places; for large filtration volumes typical of samples received at the GSFC facility (≥ 1000 mL), effective LOQ values for all pigments are ≤ 0.002 µg L−1. Pigments not detected in a given sample are flagged with a numeric replacement value rather than reported as zero or substituted with limit of detection (LOD) or LOQ values: the flag −111 was used prior to March 2016, updated to −8888 from March 2016 onward to align with conventions used by other oceanographic data repositories. In both cases the flag explicitly distinguishes “not detected” from missing values, the latter implying the measurement was not performed. All flagged non-detect values were excluded from analysis prior to any precision calculations, such that only values above the LOD were retained.
3.3 Data Analysis
Replicate filter precision was measured as the coefficient of variation of sample (S) replicates, expressed as the percent ratio of the standard deviation in the replicates (σ) with respect to the average sample concentration () for each pigment (P) evaluated:
To evaluate factors potentially influencing pigment measurement precision, individual coefficient of variation (CV %) values were computed for each pigment within each replicate filter set, across all replicate sets. Precision was assessed with respect to the following sample parameters: (1) average pigment concentration within replicate sample sets, (2) average pigment mass injected into the HPLC instrument for analysis, (3) average filtered sample volume (Vf), (4) geographic classification as either “coastal” (< 200 km from shore) or “oceanic” (> 200 km from shore) based on collection location, and (5) phytoplankton community size structure estimated from diagnostic pigment concentrations. The 200 km geographic criterion was adopted following Mélin and Vantrepotte (2015), who applied the same distance-to-coast threshold to define the coastal domain in a global optical classification of coastal waters. Our application of this criterion differs from those authors in that we did not apply their complementary 4000 m bottom depth exclusion criterion. Unlike the global satellite-derived dataset they analyzed, our dataset consists of discrete in situ samples that, despite global coverage, are heavily concentrated along the Eastern seaboard of North America. This region lacks near-shore deep-water trenches, making the omission of the depth exclusion criterion unlikely to have introduced meaningful misclassification in our dataset. A geographic rather than concentration-based classification was chosen deliberately to avoid the circularity of using pigment concentration as a proxy for sample origin and should not be interpreted as a direct proxy for trophic regime despite the tendency of coastal and oceanic waters toward higher and lower biomass conditions, respectively. Community structure was categorized into microplankton (> 20 µm), nanoplankton (2–20 µm), and picoplankton (< 2 µm) fractions following the approach of Uitz et al. (2006), which builds on the foundational framework developed by Claustre (1994) and Vidussi et al. (2001):
where [DP] represents the total diagnostic pigment concentration (Table 1). The use of diagnostic pigments to estimate size classes, while having some limitations, provides a reasonable first approximation of community structure (Uitz et al., 2010). Application here aimed to evaluate if taxonomic differences related to cell size and inferred fragility, particularly during filtration, affect sample measurement precision. Additional variables were initially assessed but ultimately excluded from analyses: Ocean basin showed severely imbalanced distribution among samples, preventing robust analysis. Additionally, ratios of pigment concentrations to TChl a degradation products did not improve the explanatory power for precision variability. Though informative analyses, these variables did not yield significant relationships or provide additional descriptive power.
Estimated pigment mass (MP; ng) injected into the HPLC instrument was calculated using the measured concentration value:
where, Vf is sample volume filtered in mL, Vinj is the volume of sample extract injected into the instrument, and Vx is the calculated extraction volume in mL, determined as described in Sect. 2.2. Due to changes in analytical report formatting during the study period, corresponding extracted volume values were available for only two-thirds of the replicate measurements, limiting pigment mass calculations to this subset of the data.
To evaluate precision distributions, exponential probability density functions were fitted to the observed CV % values for each pigment. Overall precision for each pigment was quantified as the mean (μ) of CV %. Pigment precision trends along continuous variables (concentration, mass, filtered volume) were estimated using locally estimated scatterplot smoothing (LOESS) regressions fitted to CV % vs continuous variable bins containing > 5 observations implemented in the language for statistical computing R (Cleveland et al., 1992; R Core Team, 2022).
Differences in precision between coastal and oceanic samples were assessed using the Mann-Whitney U test, which is suitable for comparing independent groups without requiring normality. Sample sizes were 884 oceanic and 1909 coastal samples for each pigment.
Ordinary least squares regression was used to assess the simultaneous effects of concentration, filtration volume, inferred phytoplankton size structure, and coastal versus oceanic influence on pigment measurement precision. CV % was modeled as a function of log10-transformed pigment concentration, log10-transformed filtered volume, estimated microplankton size fraction, and a binary indicator for sample provenance (coastal = 0, oceanic = 1). For statistically significant variables (α=0.05), their importance in the model was ranked based on the absolute value of the standardized coefficients (i.e., t-statistics). Pigment mass, Eq. (5), was excluded from the primary regression analyses for two reasons: (1) reduced sample size due to limited availability of corresponding calculated extraction volume data (only two-thirds of samples), and (2) severe multicollinearity concerns, as pigment mass is the product, among other parameters, of concentration and filtered volume. To evaluate the explanatory power of pigment mass relative to concentration, separate regressions using pigment mass instead of concentration were performed and are presented in Appendix B.
Factors influencing measurable replicate variability were examined by repeating analyses on a censored dataset (defined here as excluding samples with CV % = 0, or invariant replicates). This approach aimed to uncover drivers of precision that may be obscured when invariant measures are included.
To provide context for the in situ measurements, summary comparisons were made between the dataset's spatial and temporal coverage and that of relevant NASA ocean color satellite missions. These comparisons help interpret measurement uncertainties by showing how the in situ data represent the broader oceanographic conditions observed by satellites and inform recommendations for future sampling strategies to optimize sea-truth validation of satellite products.
All data processing was performed using the Python programming language. The complete analysis code and output are documented in a Jupyter notebook (Kluyver et al., 2016) hosted in a version-controlled repository (see Code and data availability).
The concentrations of all pigment samples analyzed followed a log-normal distribution with median values ranging from 0.470 to 2 × 10⁻³ mg m−3, for TChl a and DVChl b, respectively (Fig. 1). Although the geographic distribution of those samples encompasses all major ocean basins and some inland waters (Fig. 2a), they were highly skewed to coastal Eastern North America, with the region bounded at 17–47° N latitude, 60–100° W longitude containing 41 % of all samples (Fig. 2b). To assess how well the concentration range of the GSFC validation dataset represents the full dynamic range of TChl a observed from space, we compared its distribution against the complete MODISA global chlorophyll a record since mission onset in 2002 through 2023 (median = 0.19 mg m−3; Fig. 2c, d). This comparison was intended to characterize the overlap of the in situ dataset across the global TChl a range rather than as a temporal matchup; the higher relative frequency of in situ values above ∼ 0.2 mg m−3 reflects the coastal geographic bias of the dataset rather than any temporal difference between the two records.
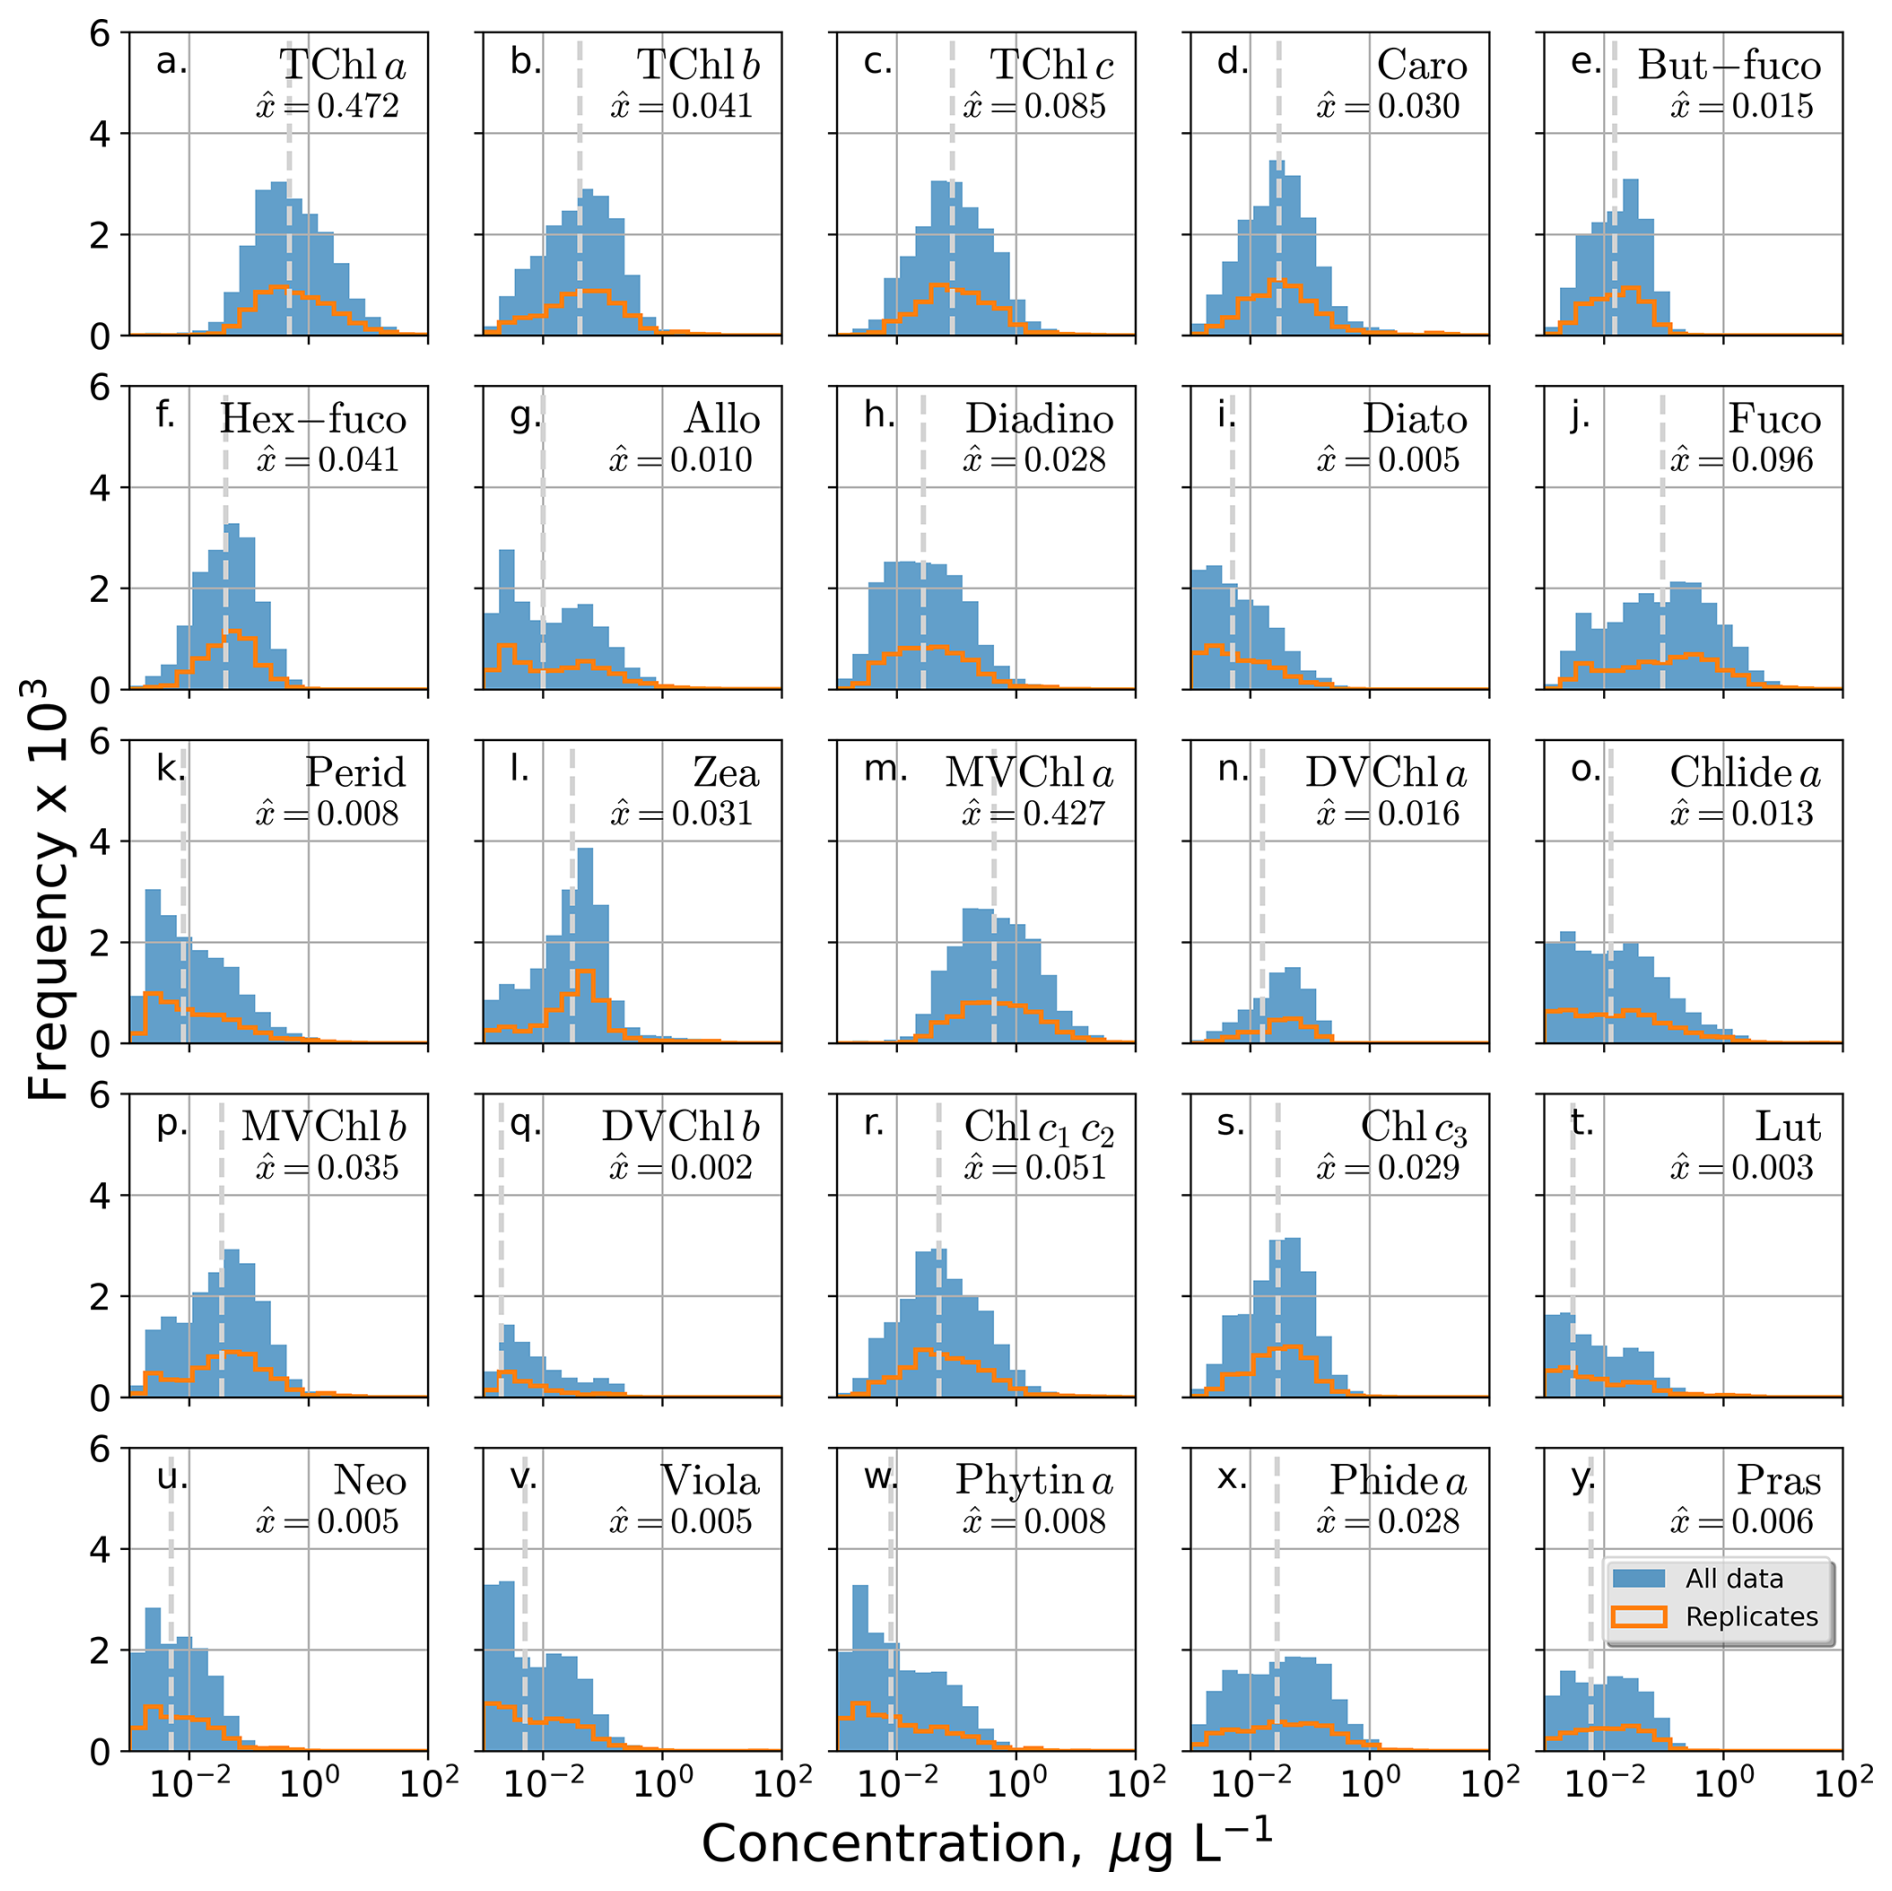
Figure 1Distribution of phytoplankton pigment concentrations (mg m−3) analyzed by HPLC at the NASA GSFC facility during 2011–2022. Bars indicate counts for all samples, while orange stairs show replicate sample fraction. Vertical lines denote the median concentration.

Figure 2(a) Sample spatial distribution (bin counts), and (b) by percent of total samples for the North American region, which contains 41 % of analyzed samples over the 2011–2022 period included in this study. (c) Satellite-derived global total chlorophyll a concentration from MODIS-Aqua at 9 km resolution, averaged from 2002–2023. (d) Histograms comparing of satellite chlorophyll a concentration from (c) versus in situ total chlorophyll a measurements from HPLC analysis of samples collected globally from 2011–2022. Vertical lines mark the median concentration for each dataset.
Analytical precision, measured as CV % of sample replicate sets, followed exponential probability distributions for all pigments with modes in the lowest bin (0 %–1.25 %; Fig. 3a–y). Mean precision ranged from 3.2 % for DVChl a to 17.1 % for Chlide a; every other pigment outperformed the latter with precision better than 10 %, including 11 that achieved ≤ 5 % (Fig. 3z). The analytical precision performance benchmarks established through SeaHARRE, 5 % for TChl a and 8 % for primary pigments, were met for TChl a (4.3 %) and 10 of 12 primary pigments. The two primary pigments that exceeded the 8 % benchmark were Diato (8.6 %) and Perid (9.2 %). No performance benchmarks have been established for secondary or tertiary pigments. Neither average pigment concentration nor pigment mass explained overall precision across pigments, as linear regressions were not statistically significant (concentration: p=0.58, R2=0.01; mass: p=0.15, R2=0.09; Fig. 4).
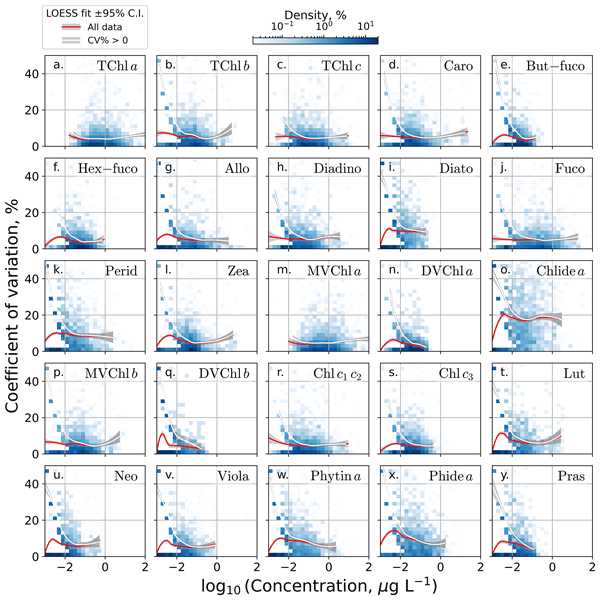
In the full dataset, which includes replicate sets with identical measurements (CV % = 0), LOESS fits of precision against concentration showed little variation across the concentration range for all primary pigments, despite some scatter in the data (Fig. 5a–l). LOESS estimates were more variable across the concentration ranges for the secondary and tertiary pigments, except for MVChl a (Fig. 5m–y). For most pigments (15), the LOESS fits showed the best precision towards their analytical detection limits. For TChl a and its primary component, MVChl a, there was no difference between the censored (i.e., CV % = 0 removed) and full datasets. In contrast, all other pigments showed large degradation in precision (i.e., higher CV %) in the censored datasets towards their lower detection limits. The LOESS fits of pigment mass versus precision followed very similar patterns as those for concentration (Fig. 6). Analytical precision along the filtered volume gradient showed no trends for volumes < 1000 mL for most pigments (Fig. 7). For filtration volumes > 1000 mL, precision generally improved to below 10 % for the majority of pigments. However, for a subset, including the primary pigments Allo, Diato, and Perid; the secondary Chlide a, and all the tertiary pigments, there was a marked and common pattern of deterioration in precision above 1000 mL for the censored subset, while the full dataset either improved or remained stable above that filtration volume (Fig. 7g, i, k, o, t–y).
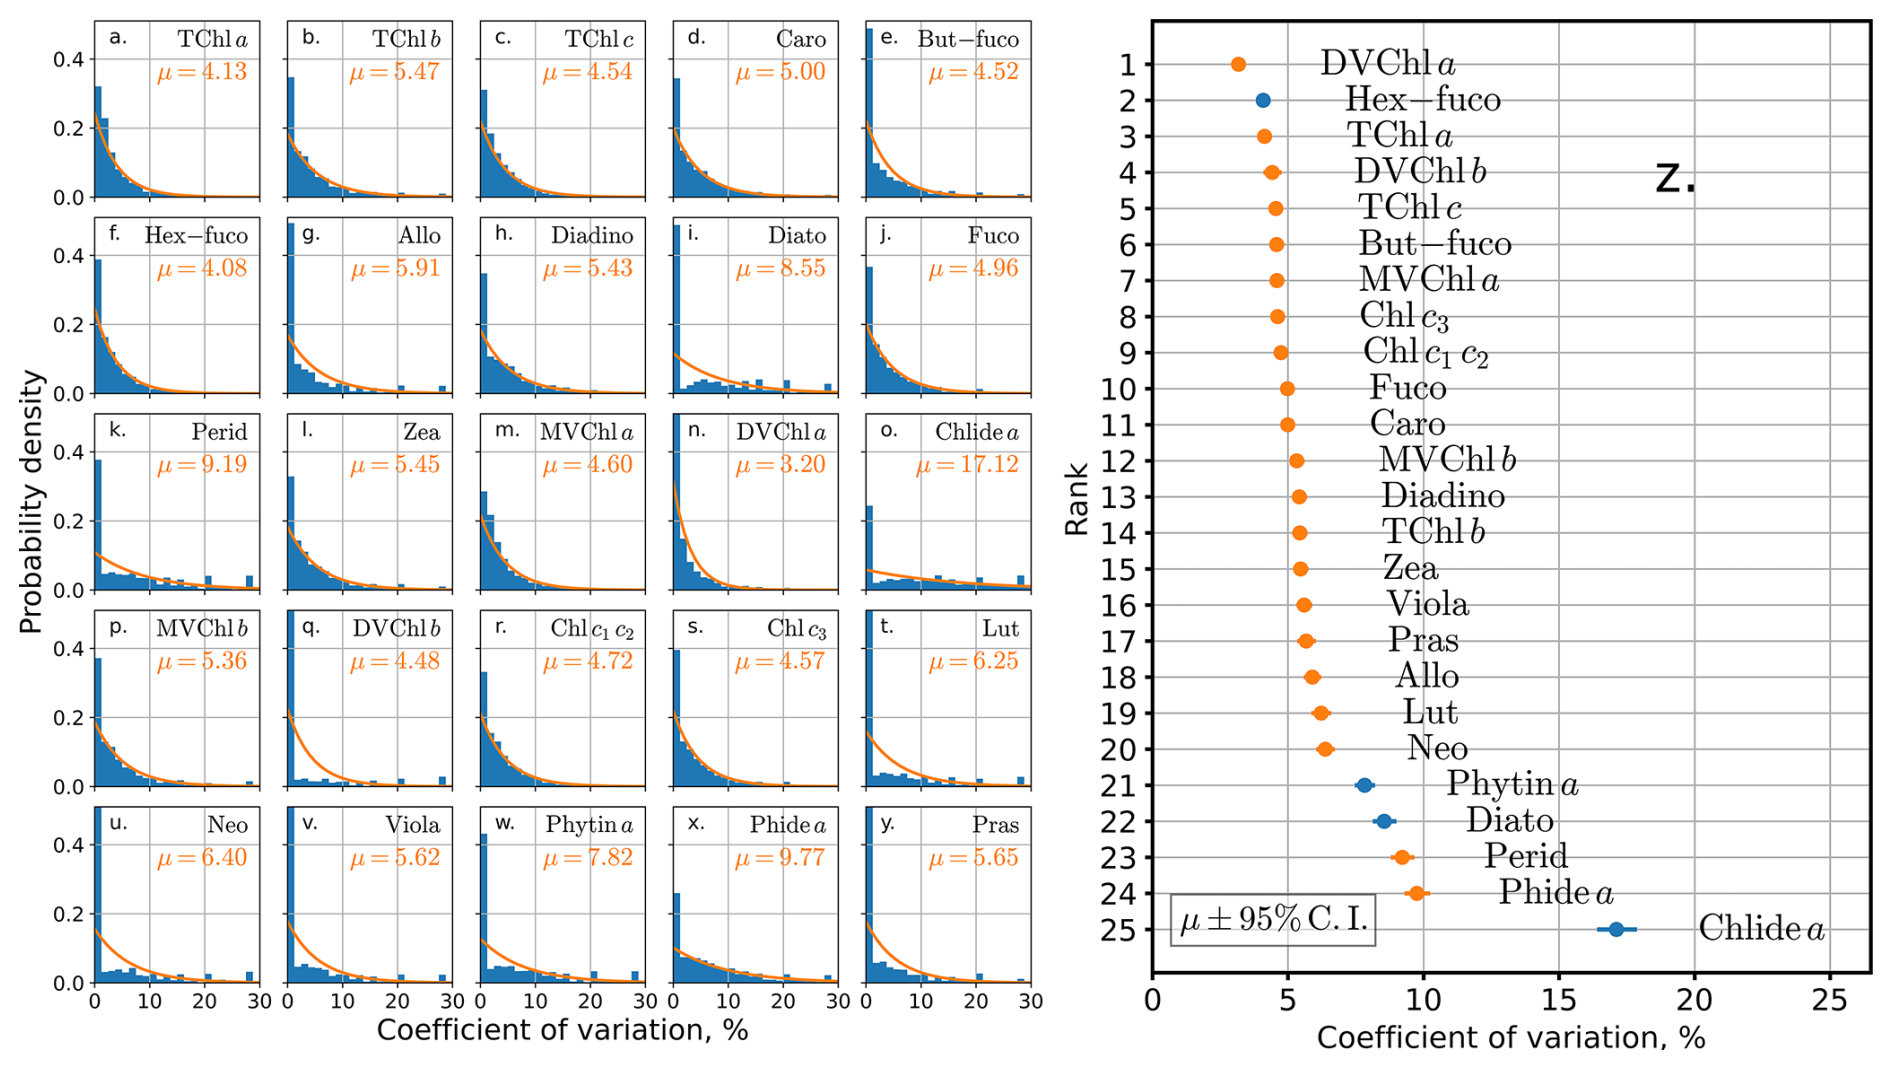
Figure 3(a–y) Histograms of replicate sample precision (CV %) calculated for each phytoplankton pigment analyzed by HPLC from 2011–2022. Overlaid in orange is the exponential probability density function for each pigment, and μ is mean precision. Panel (z) shows pigments ranked by precision. Blue symbols mark instances of non-overlapping confidence intervals with the next-lowest pigment.
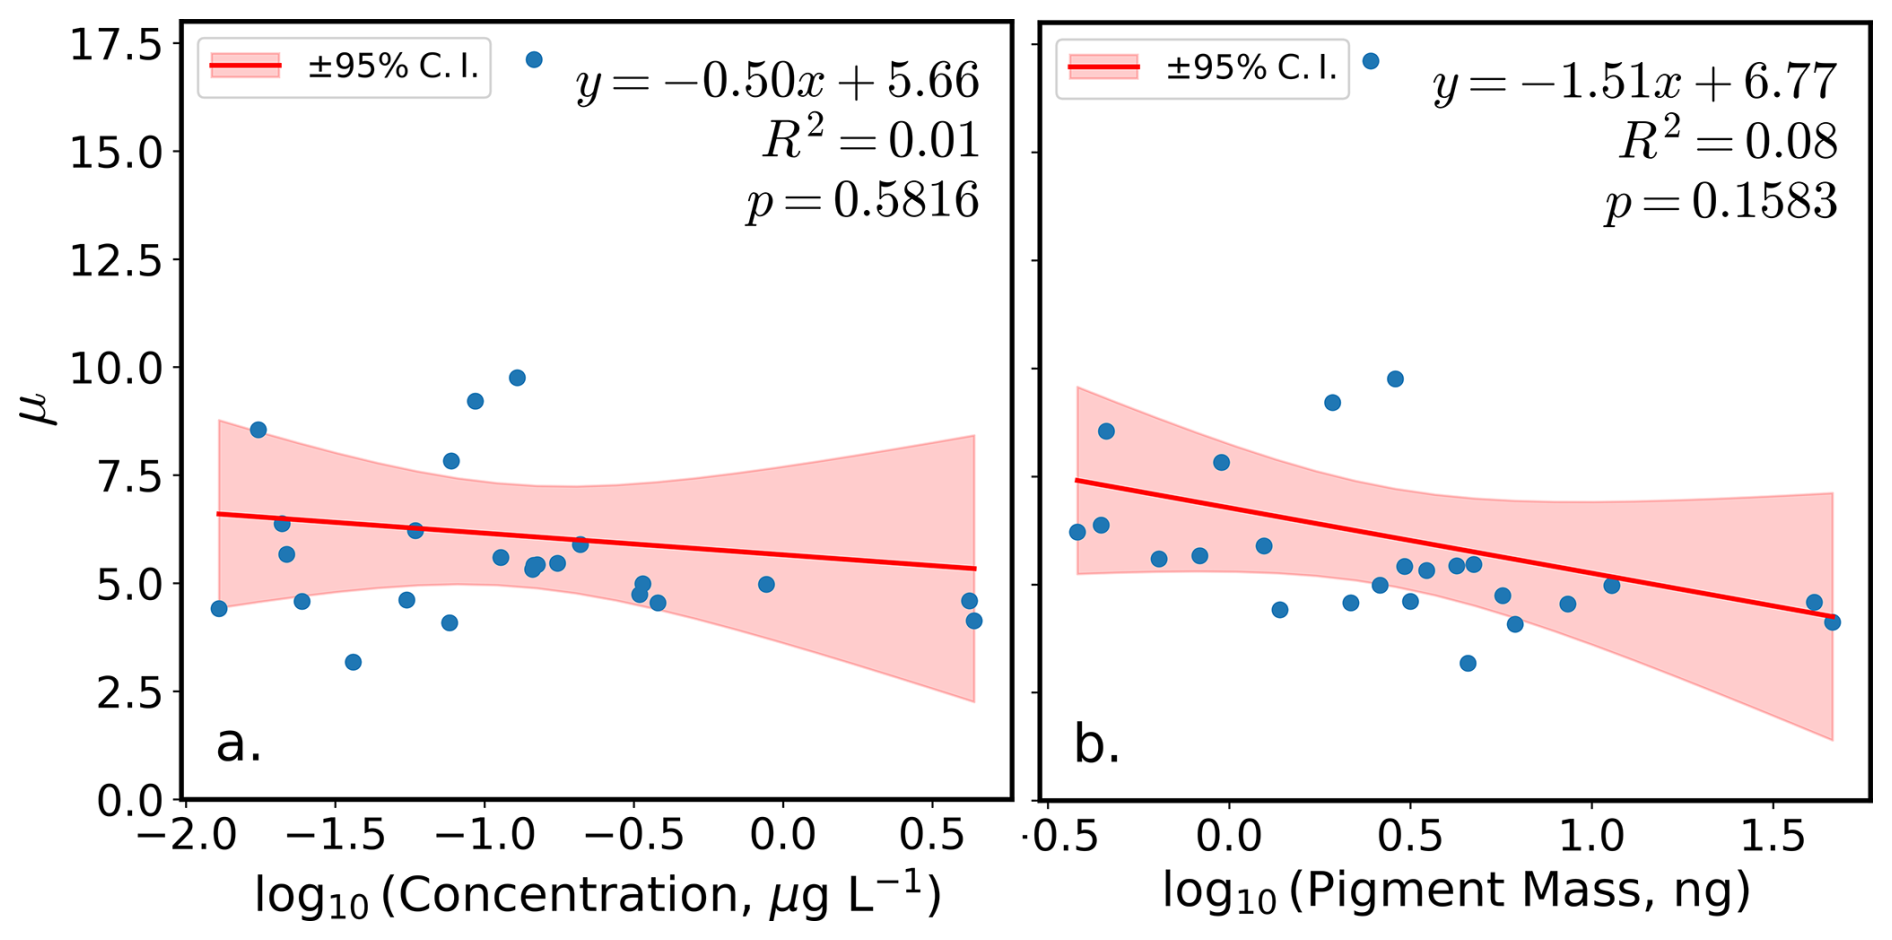
Figure 4Mean coefficient of variation percentage (CV %) precision versus (a) mean log10-transformed pigment concentration, and (b) log10-transformed mean pigment mass. The adjusted R2 quantifies goodness of fit, while the p-value tests significance of the slope.
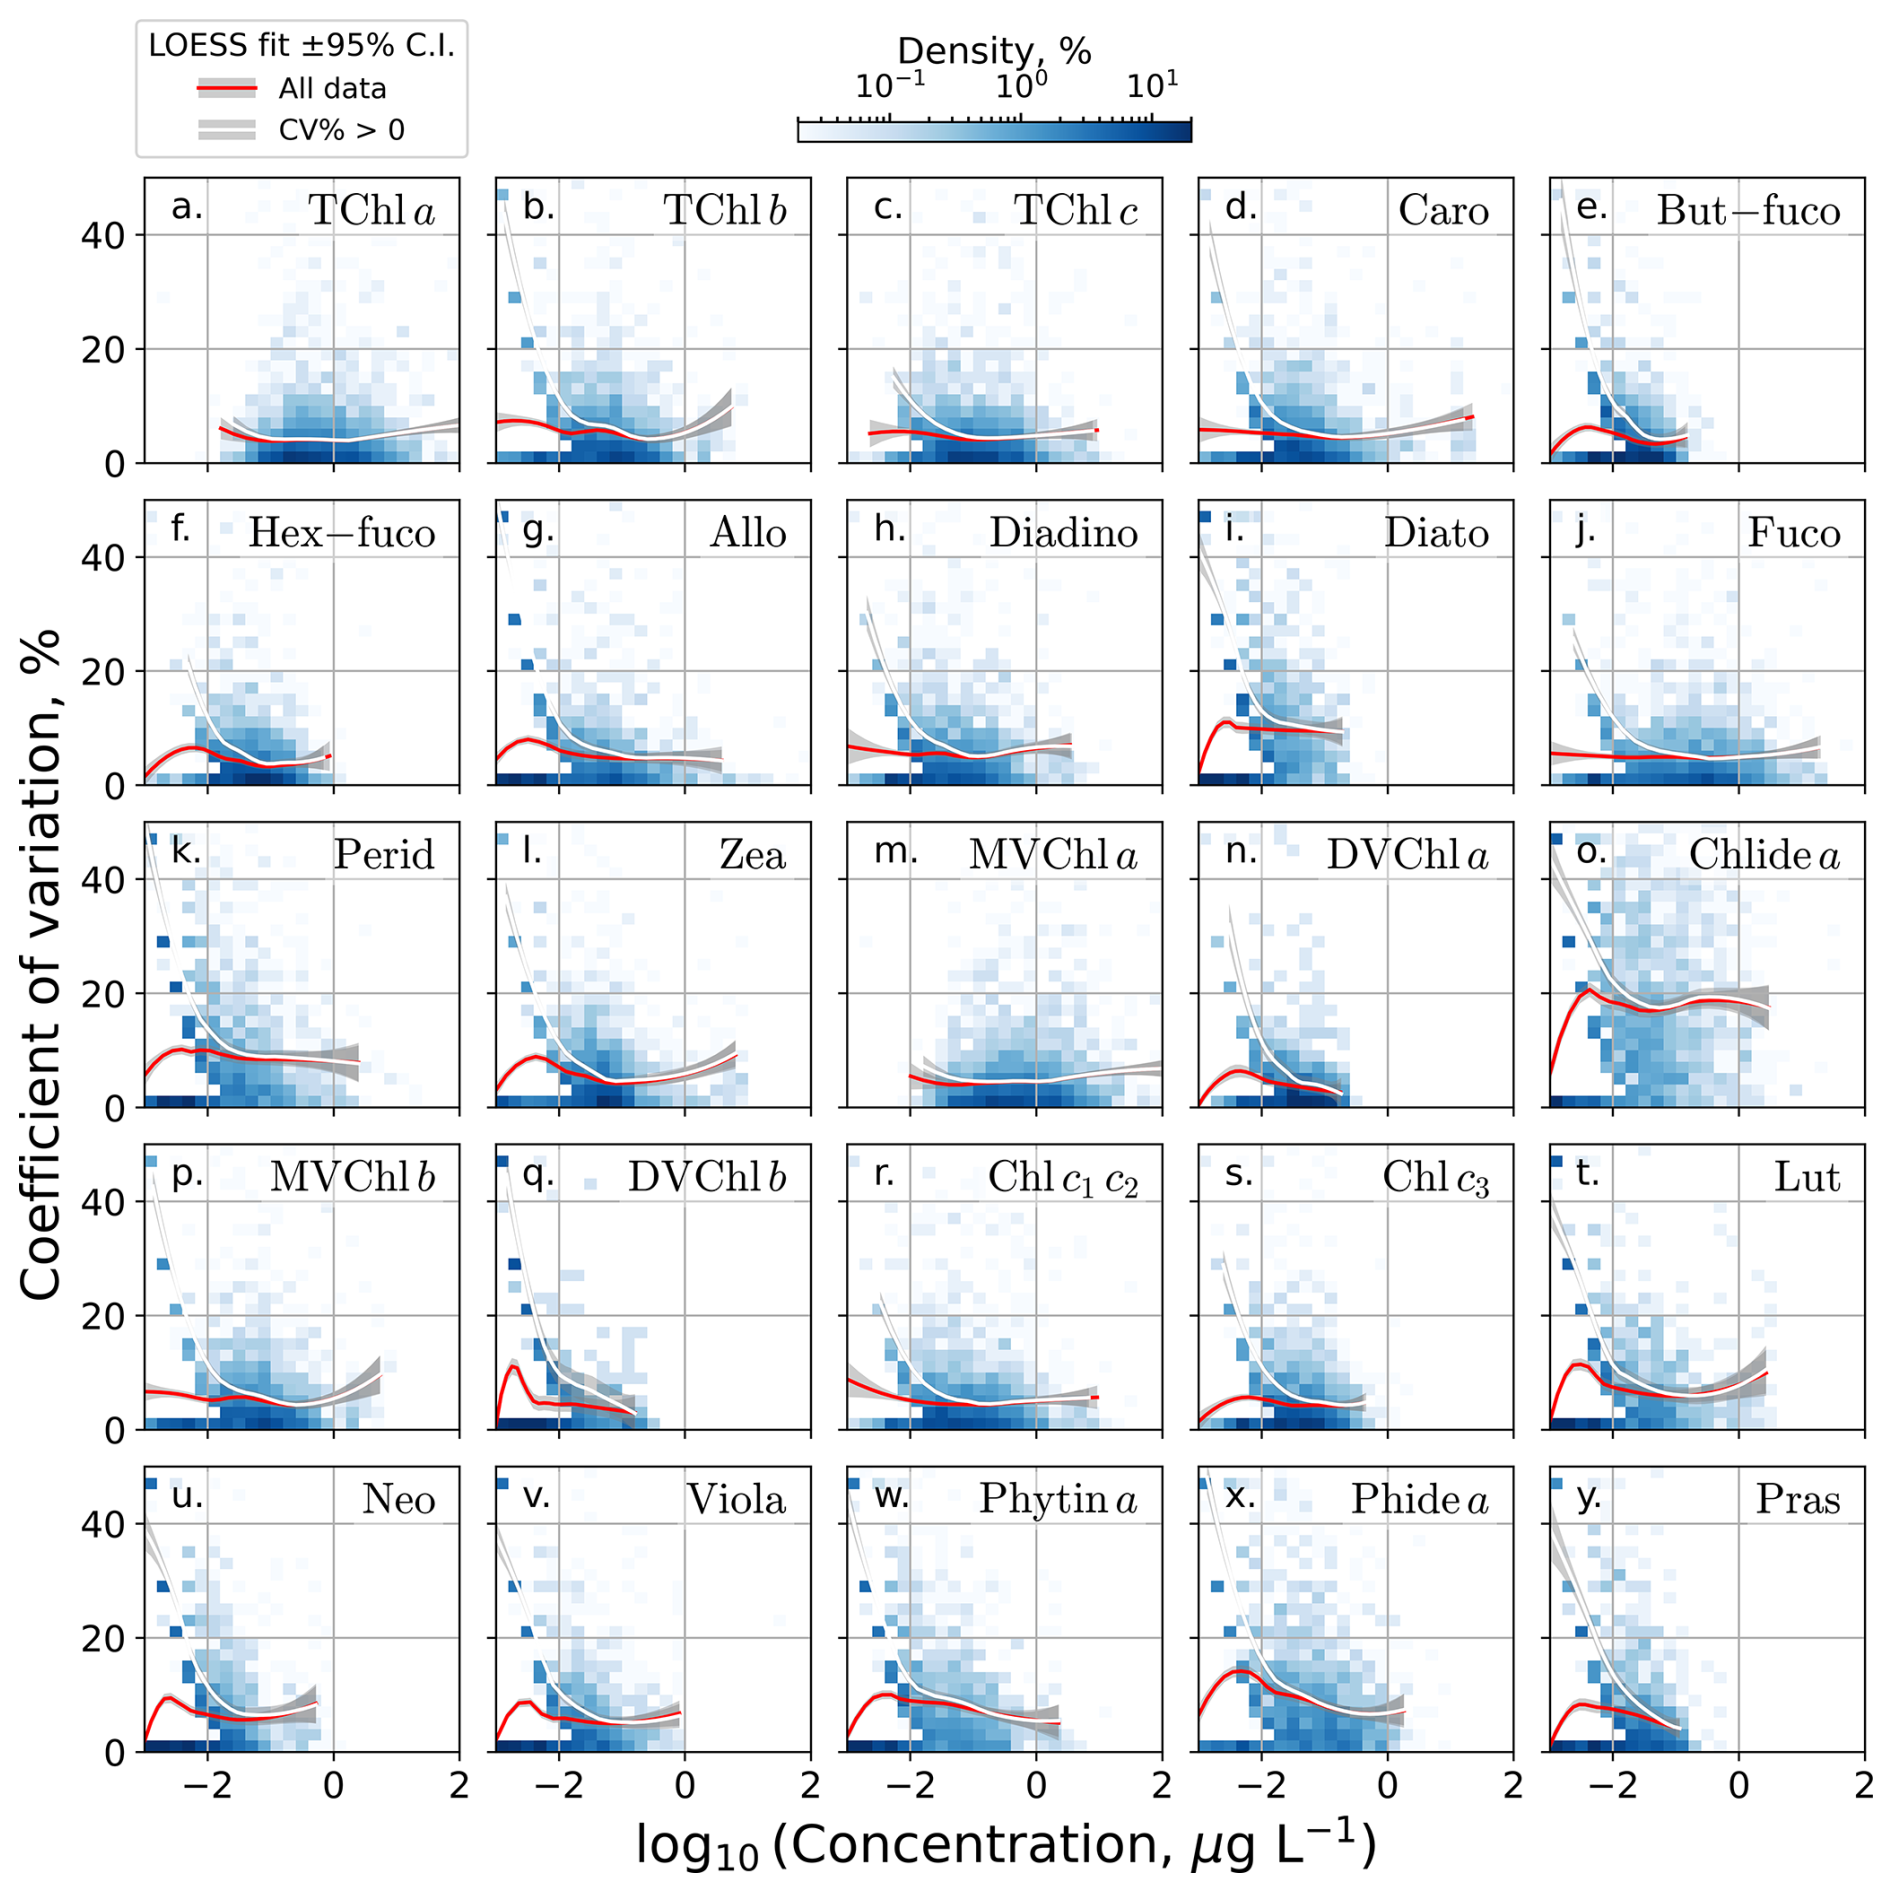
Figure 5Replicate sample precision (CV %) versus log10-transformed pigment concentration for each phytoplankton pigment. LOESS regression fits on all data (red line) and CV % > 0 only data (white line), with 95 % CIs shaded. 2D histograms display CV % sample density, with color bar showing percent sample density.
Table 3Results of ordinary least squares multiple regressions predicting phytoplankton pigment analysis precision as CV %, for all the data and for censored data (CV % > 0, excluding invariant replicates). The p-value tests if all coefficients equal zero; adjusted R2 shows variance explained by independent variables. Min and max R2 values are in bold in each column. The independent variables were: log10 of pigment concentration, log10 of filtered volume, estimated fraction of microplankton, and the categorical variable coastal or ocean, respectively.

Precision showed no discernable trend for most pigments along estimated phytoplankton size class fraction when LOESS was applied to the entire dataset (Fig. A1). For the CV % > 0 subset (Fig. 8) some primary (Allo, Diato, and Perid, and Diadino and Fuco), secondary (Chlide a), and for all tertiary pigments, LOESS fits showed an increase in CV % as the estimated fraction of microplankton in the sample fell below 0.5. The complementary pattern to this was seen as an increase in CV % as the estimated fraction of picoplankton increased above 0.5 for most of the above pigments. Nanoplankton LOESS fits exhibited a less defined trend relative to sample precision than the other two size-fractions but often resembled the picoplankton pattern.
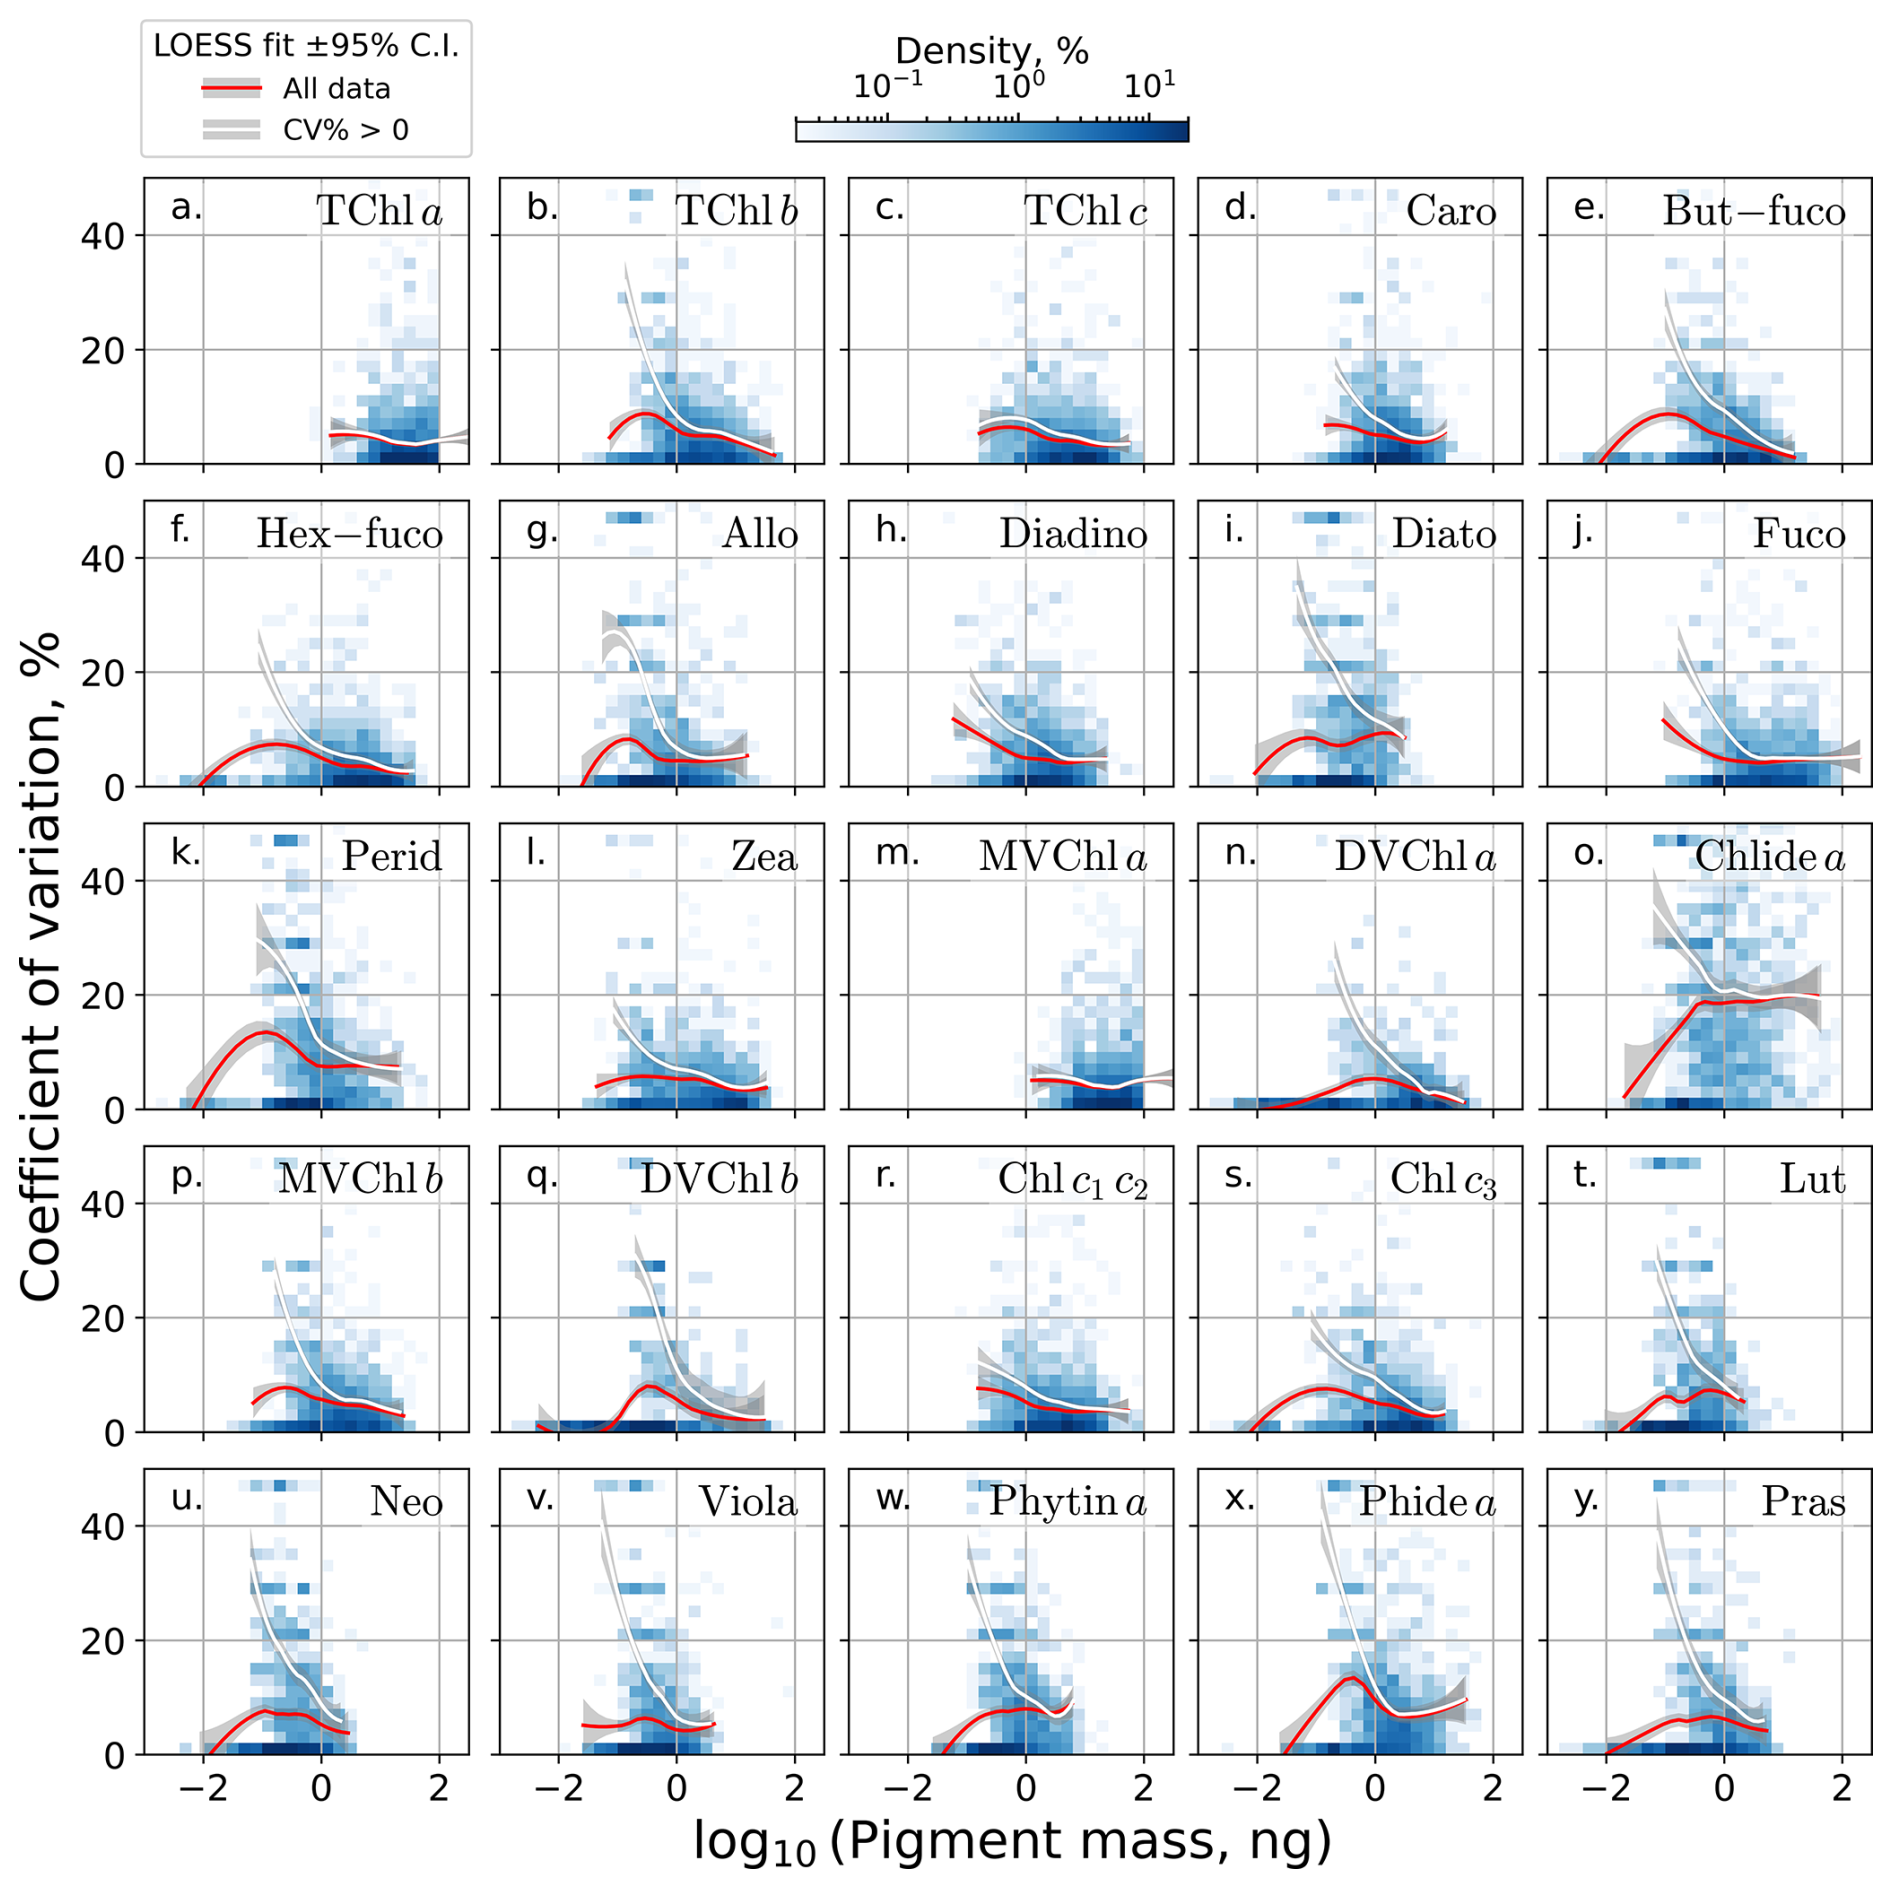
Figure 6Replicate sample precision (CV %) versus log10-transformed pigment mass injected for each phytoplankton pigment. LOESS regression fits on all data (red line) and CV % > 0 only data (white line), with 95 % CIs shaded. 2D histograms display CV % sample density, with color bar showing percent sample density.
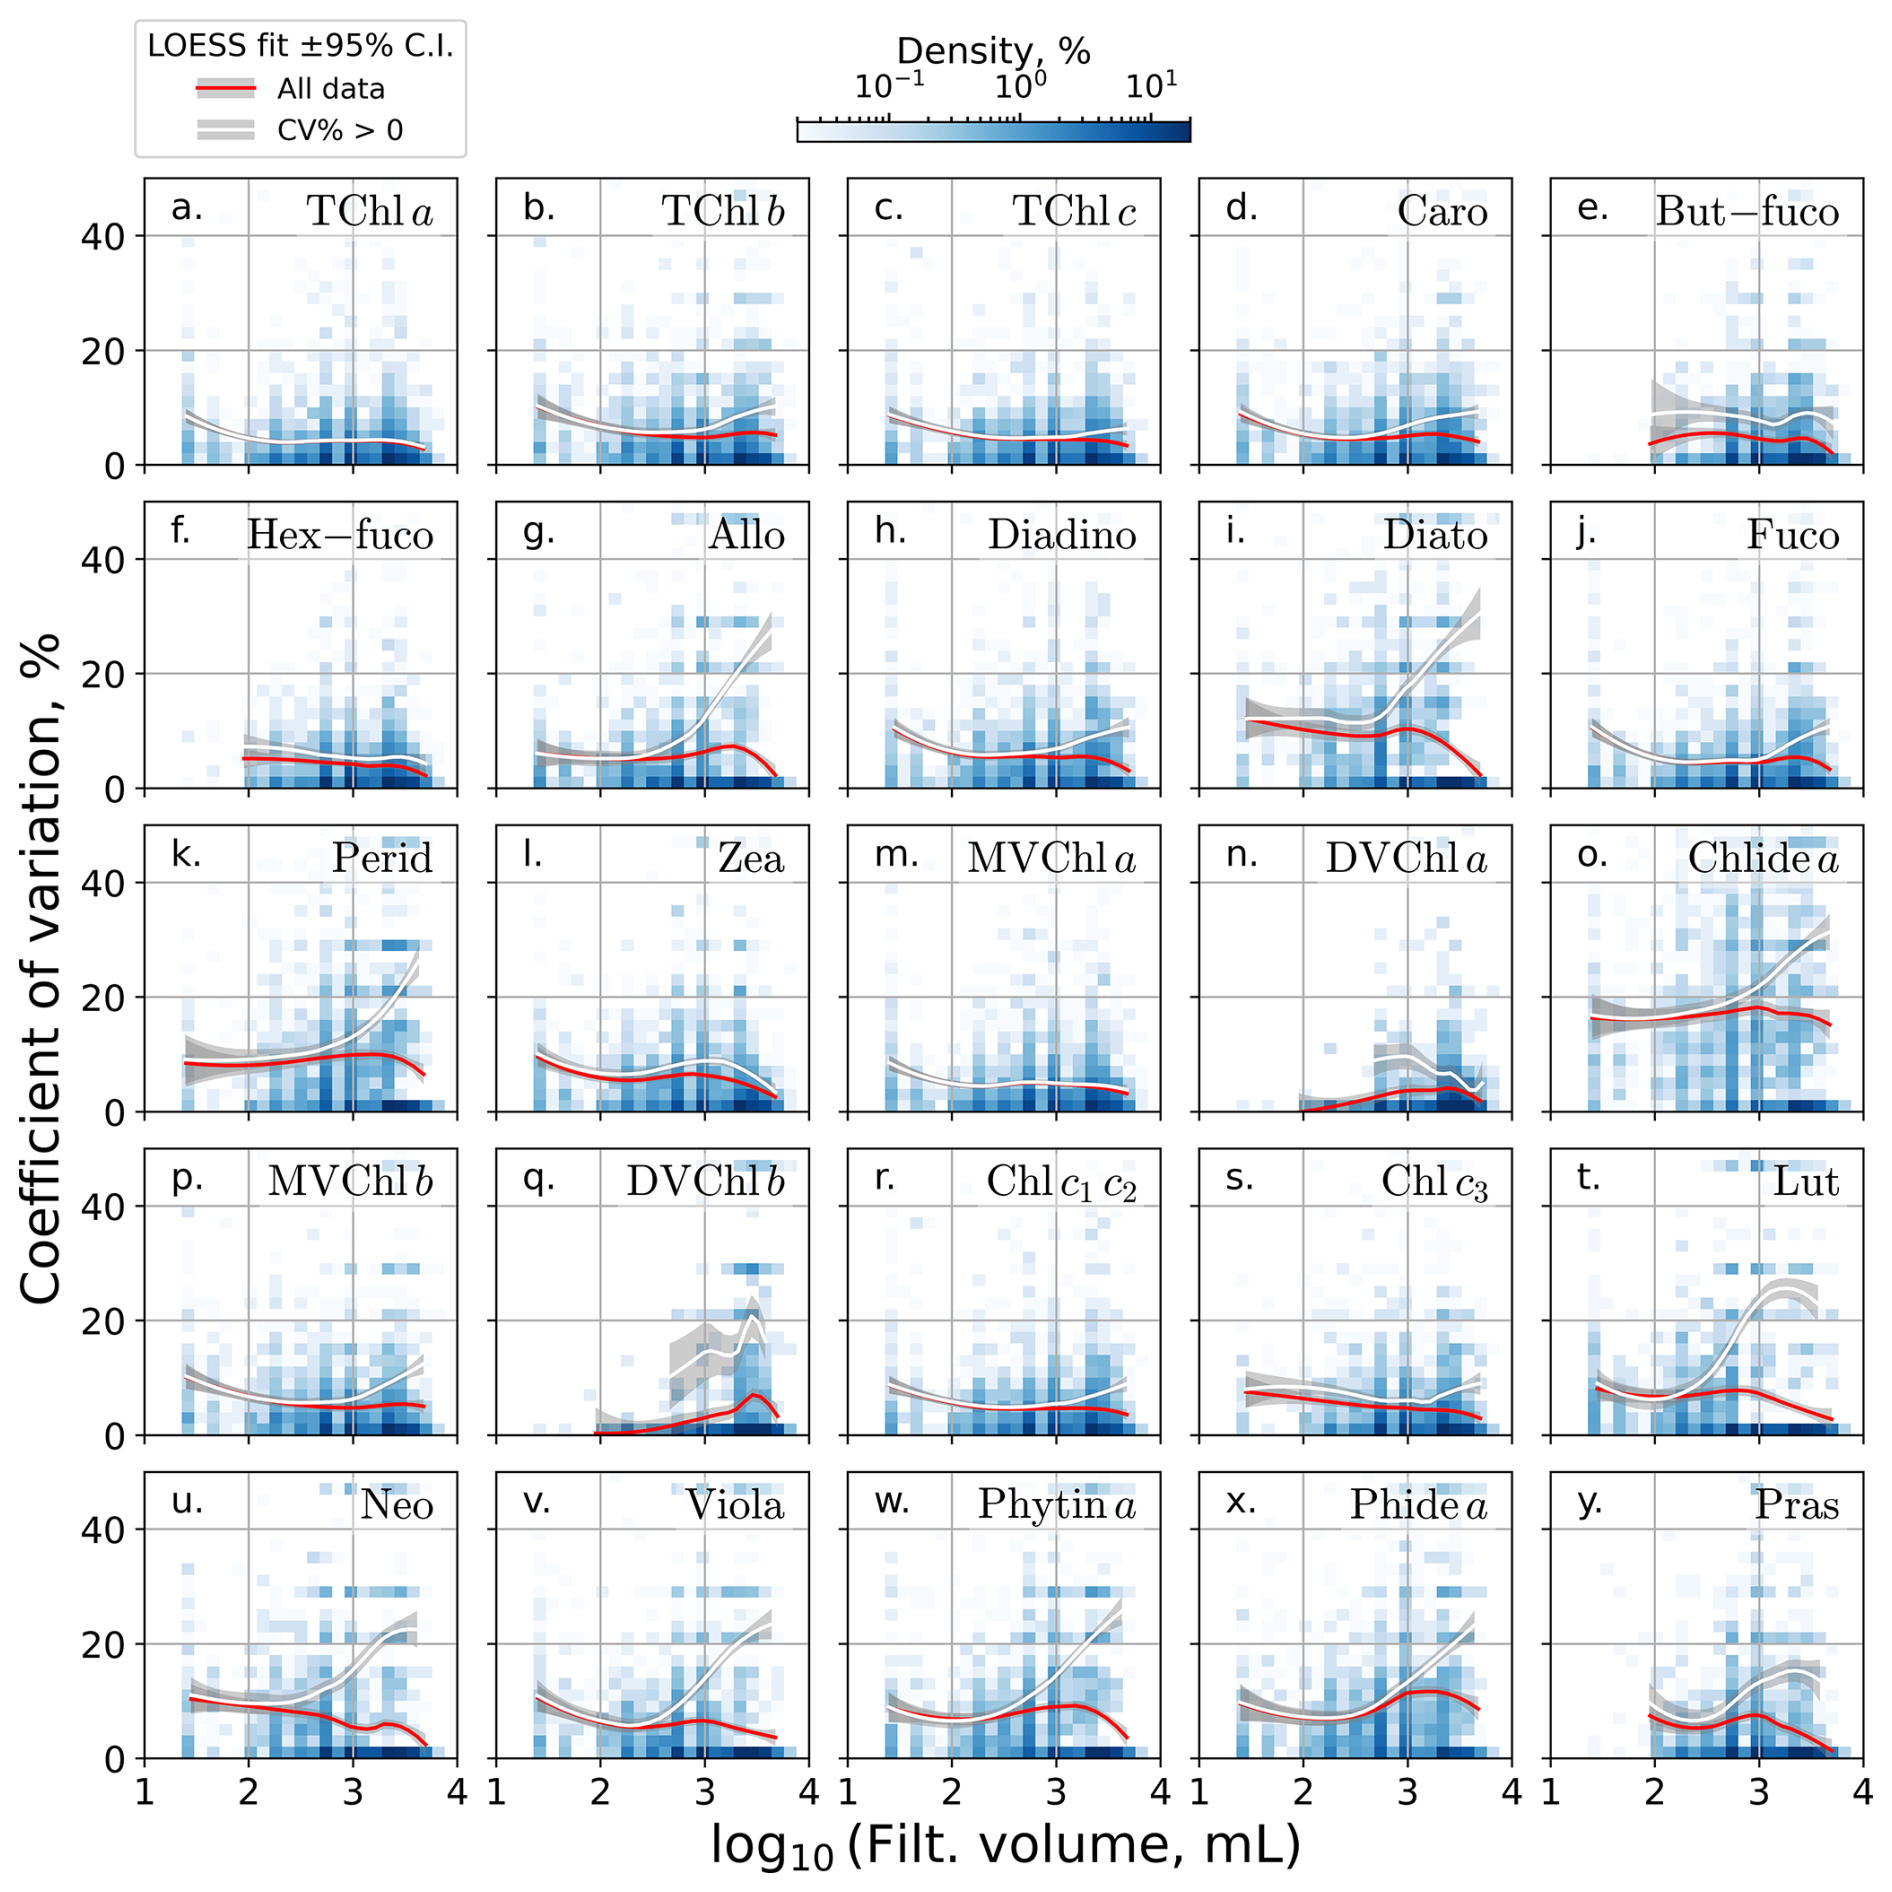
Figure 7Replicate sample precision (CV %) versus log10-transformed filtered volume for each phytoplankton pigment. LOESS regression fits on all data (red line) and CV % > 0 only data (white line), with 95 % CIs shaded. 2D histograms display CV % sample density, with color bar showing percent sample density.
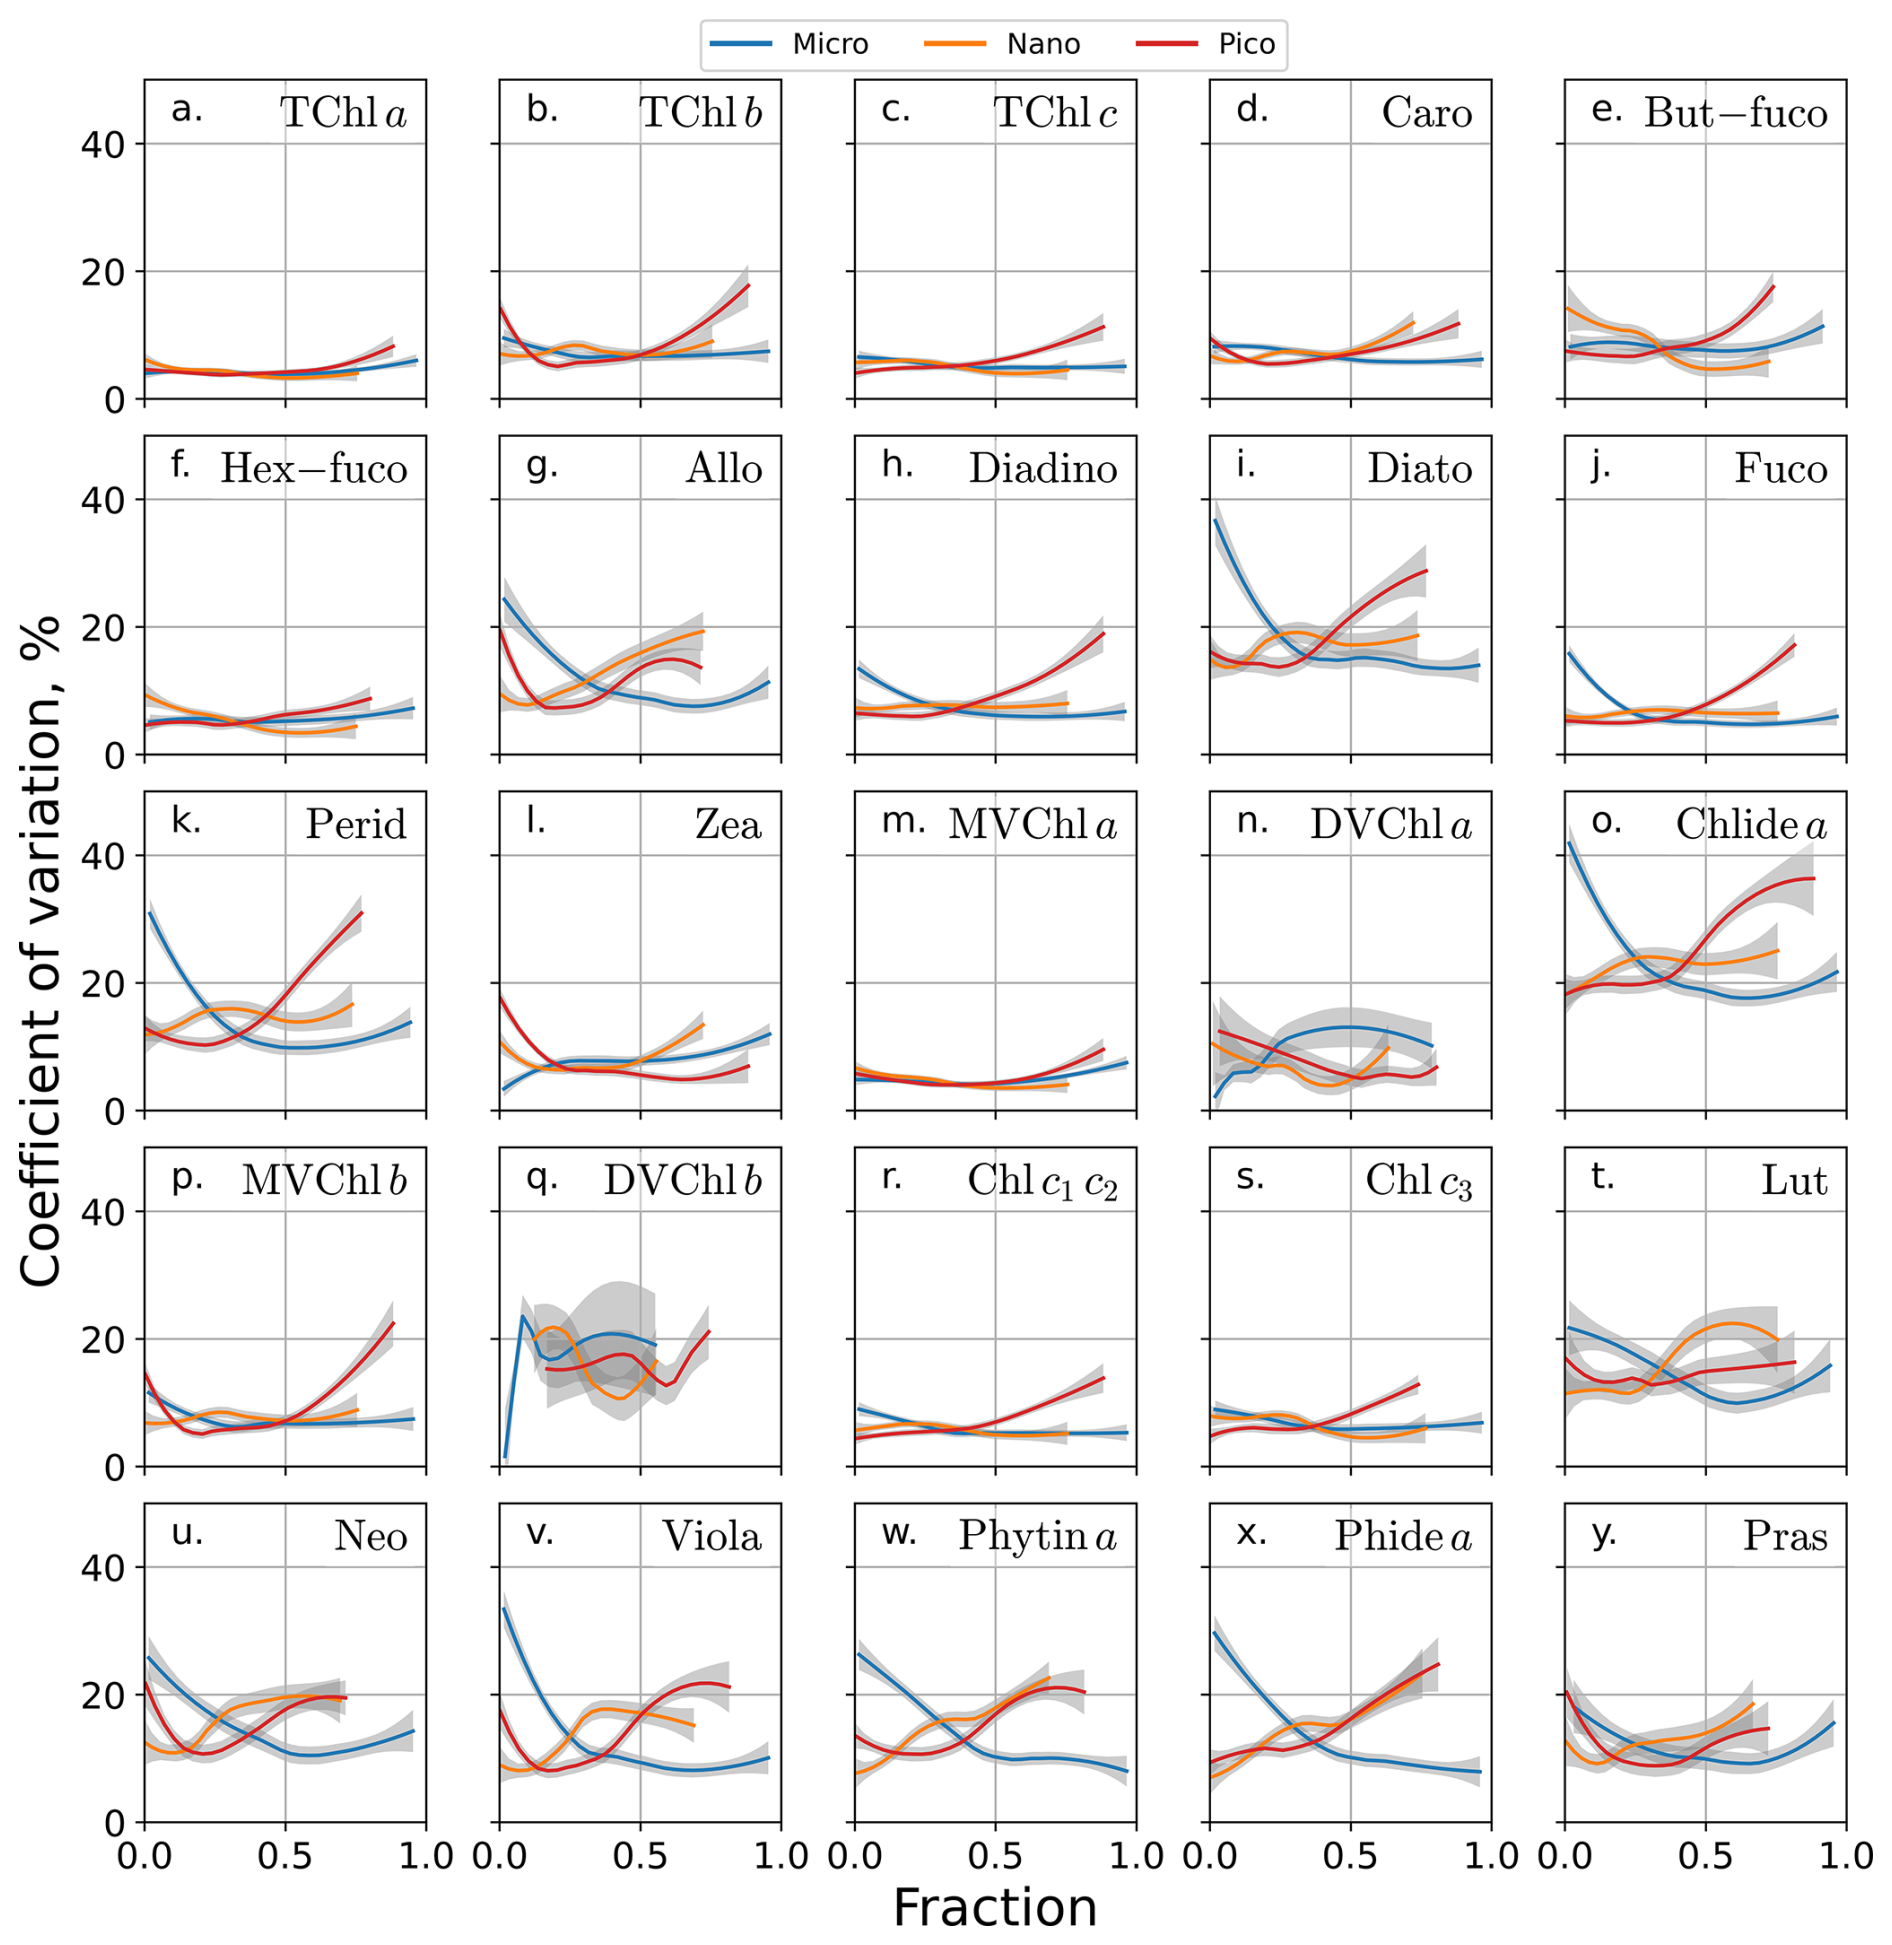
Figure 8LOESS regression fits of replicate sample precision (CV % > 0) versus estimated phytoplankton size fraction: micro (> 20 µm), nano (2–20 µm), and picoplankton (< 2 µm) Eqs. (2)–(4). Shaded area contains 95 % confidence bands.
Based on Mann-Whitney U tests, precision differed significantly between coastal and oceanic samples for most pigments, though patterns varied between datasets (Fig. 9). In the full dataset, all pigments except DVChl a and DVChl b showed significantly different precision between coastal and oceanic samples, with oceanic samples consistently exhibiting better precision. In the censored dataset, 21 of 25 pigments showed significant differences between coastal and oceanic samples (Zea, MVChl a, DVChl b, and Chl c1c2 showed no significant difference). The directionality of precision differences was more varied in the censored dataset: 16 pigments exhibited better precision in coastal samples versus six in oceanic samples. TChl a maintained better precision in oceanic samples in the censored dataset, while all tertiary pigments showed better precision in coastal regions.

Figure 9Lines depict the median sample precision (CV %) for phytoplankton pigments from coastal (< 200 km from shore) versus oceanic (> 200 km). Differences assessed using Mann-Whitney U test on full dataset (blue) and subset with CV > 0 only (orange). Violin plots depict CV % distribution per category. Comparisons marked “*” and “” indicate statistically significant precision differences between coastal and oceanic at α=0.05 and α=0.01, respectively.
The multivariate regression analyses showed that no model explained more than 3.0 % of the CV % variability for any pigment using the full datasets, as indicated by the adjusted R2 values ranging from −0.001 to 0.030 (Table 3). In contrast, for the CV % > 0 subset, the multivariate models explained substantially more variability, with R2 values exceeding 0.25 for six pigments (Allo, Diato, DVChl b, Lut, Neo, and Viola) and a maximum of 44 % for DVChl b. Phytin a showed no significant relationship in the full dataset (p = 0.74, R2 = −0.001) but became highly significant when restricted to CV % > 0 samples (p < 0.01, R2=0.29).
When variables were ranked by importance for explaining statistically significant precision variability, no single variable emerged as a clear driver across all pigments (Fig. 10). For the full dataset, filtered volume was the most important variable for 10 of 25 pigments, followed by coastal vs. oceanic origin (5 pigments), concentration (4 pigments), and microplankton fraction (3 pigments).
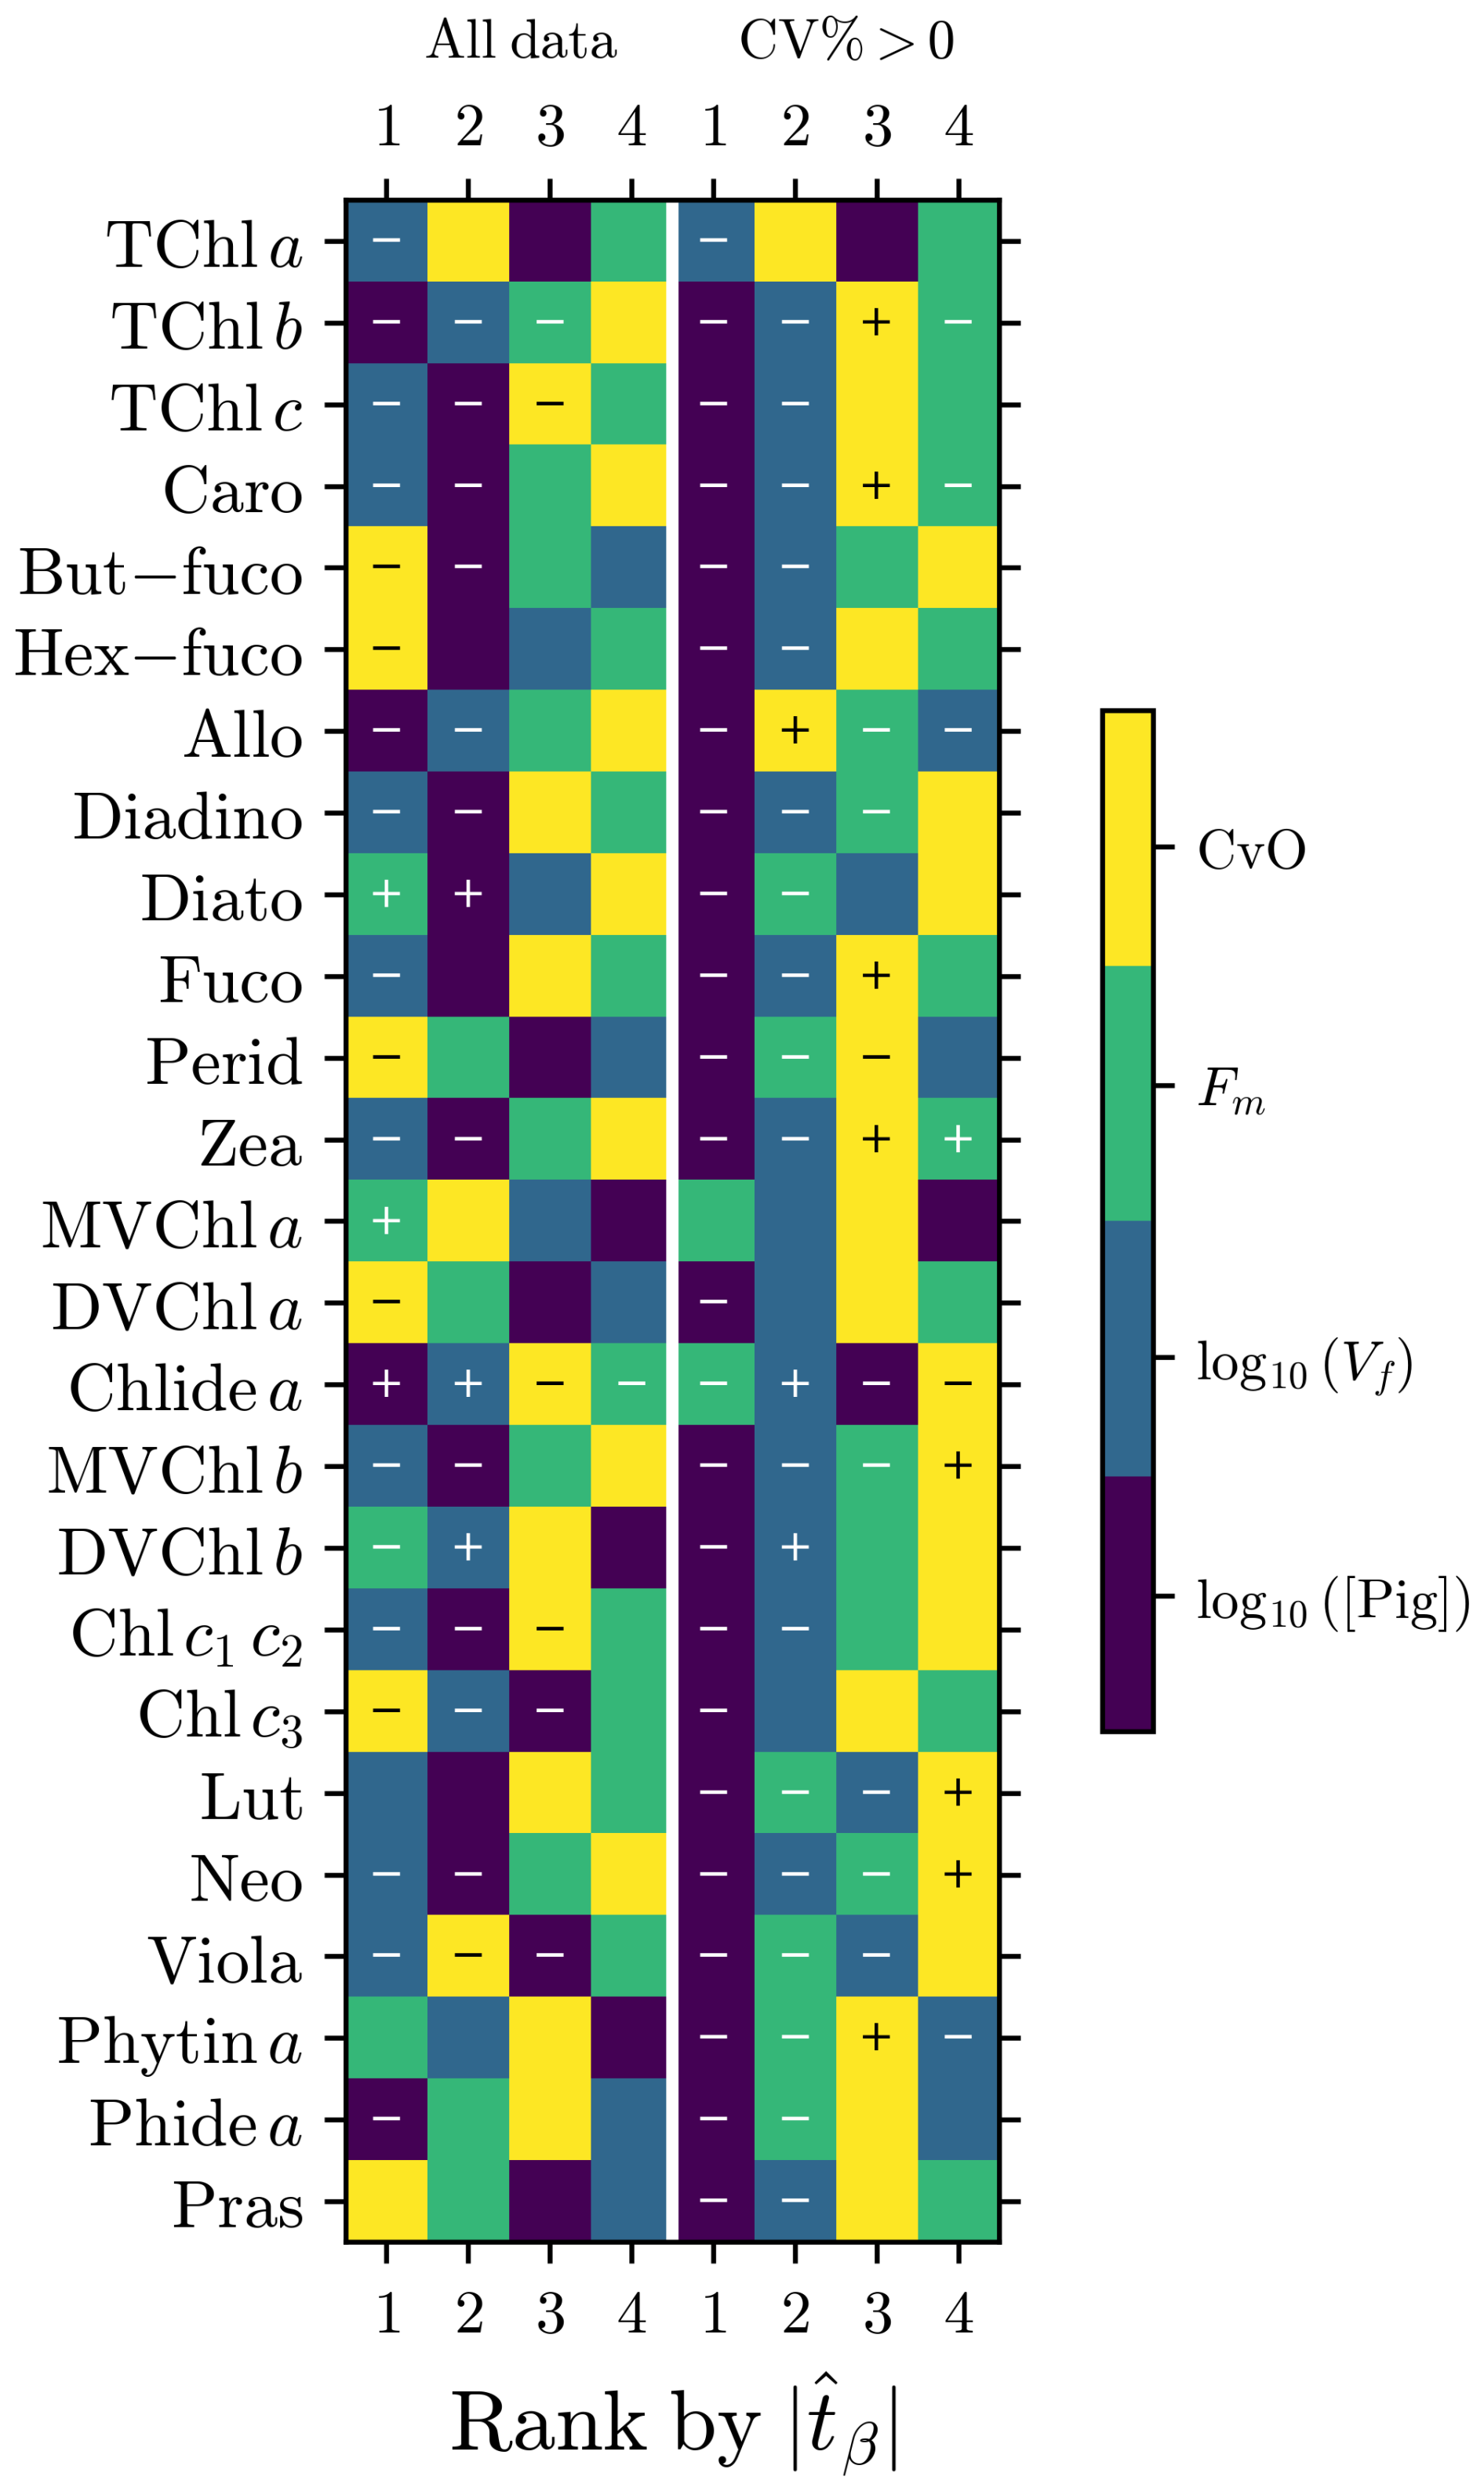
Figure 10Variable importance rankings (1–4, based on normalized regression coefficient magnitudes ) from multivariate models predicting pigment precision. Left: full dataset. Right: censored dataset (CV % > 0, excluding invariant replicates). Symbols show effect direction: “+” = increases CV % (worsens precision), “−” = decreases CV % (improves precision), blank = non-significant (α = 0.05). Variables [color-coded]: log10([Pig]) = pigment concentration, log10(Vf) = filtered volume, Fm = microplankton fraction, CvO = coastal vs. oceanic.
For the censored dataset, concentration emerged as the dominant variable, ranking most important for 22 of 25 pigments. Microplankton fraction and filtered volume were each most important for two and one pigment, respectively. Filtered volume ranked second in importance most frequently (14 instances).
Multiple lines of statistical evidence revealed no single variable as a dominant factor explaining HPLC analytical precision for phytoplankton pigments measured following validated protocols. Neither pigment concentration nor mass was a major driver of variability. This finding is particularly significant for TChl a, the foremost data product from ocean color satellite sensors, and its largest component MVChl a, as their analytical precision showed no strong dependence on concentration or pigment mass injected into the HPLC instrument. We had hypothesized that concentration would be an important, if not the major, driver of sample precision from the perspective of analytical method sensitivity limits. However, these results suggest that method validation and QA/QC procedures have resulted in robust, well-validated methods for pigment measurements across the entire target concentration range. Although TChl a met precision requirements, its secondary component, Chlide a, ranked last among all pigments (Fig. 3). As noted in Sect. 2.1, Chlide a is largely an artifactual degradation product of monovinyl chlorophyll a formed during extraction, and its discrete reporting serves primarily as an indicator of sample handling and extraction quality rather than as an independent biogeochemical quantity. Since Chlide a on average comprised only 3.4 % of TChl a in replicate samples (median: 1.5 %, 95th percentile: 12.6 %), this relatively poorer precision had minimal impact on overall TChl a uncertainty.
While most primary pigments met our precision criteria, Diato and Perid exhibited slightly elevated coefficients of variation (CV > 8 %). Two distinct mechanisms likely account for this: For Diato its role in one of the photoprotective reversible xanthophyll cycles (e.g., Fernández-Marín et al., 2021), where it is interconverted with Diadino as a photoprotective response, means it is typically present in relatively small amounts compared to its precursor. Notably, while not standard reporting practice, combining Diato and Diadino into a single sum often improves precision. For Perid, its elution position in the chromatogram is generally free from significant interferences; therefore, its slightly elevated CV is more likely attributable to the predominance of small pigment amounts in our samples (Fig. 1). For these two pigments, low concentrations approaching their LOQs likely increase instrumental quantitation uncertainty. However, once pigments are above these levels absolute concentration does not systematically drive precision variability across the broader dataset. In general, the lack of concentration dependence indicates that analytical uncertainty is dominated by factors other than instrumental sensitivity and repeatability, suggesting that future efforts to improve precision should focus on optimizing pre-laboratory sample processing procedures, such as collection, handling, filtration, and field cold storage.
While filtration volume appeared more frequently as the most important variable than concentration in the full dataset regression models, this must be interpreted in the context that no model explained more than 3.0 % of the variability (Table 3). LOESS fits suggested that sample volume has some importance regarding sample precision along that gradient. For most primary pigments, filtration volumes > 1000 mL generally improved precision to below 10 %, though for many pigments the LOESS fits suggest a precision plateau is reached well below that threshold, with minimal additional benefit from further increases in volume for the majority of pigments (Fig. 7). These precision-based observations must be considered alongside established accuracy requirements and filter retention efficiency characteristics. The NASA Ocean Optics Protocols (Bidigare et al., 2003) recommend filtering 3–4 L for oligotrophic waters, 1–2 L for mesotrophic waters, and 0.5–1 L for eutrophic waters, based on both analytical detection limits and filter retention efficiency mechanisms. At small volumes (100–300 mL), retention depends primarily on filter adsorption and electrostatic attractions, while at larger volumes (> 2 L) mechanical sieving dominates, with intermediate volumes showing reduced retention efficiency for GF/F filters. Our precision results suggest that when phytoplankton abundance is notably high under eutrophic conditions (e.g., estuarine, inland, coastal, or bloom scenarios), filtration volumes at the lower end of the recommended eutrophic range (200–500 mL) can achieve adequate precision while maintaining sufficient filter loading for accurate pigment quantification and avoiding the intermediate-volume retention efficiency reduction observed in previous studies. Volumes below 200 mL showed precision degradation in our dataset (Fig. 7) and may fall into the intermediate-volume regime where neither adsorptive nor sieving retention mechanisms dominate, while volumes well above 1 L provide minimal additional precision benefit for most pigments, with the notable exceptions of Allo, Diato, Zea, and the tertiary pigments, for which the LOESS fits suggest continued improvement above that threshold (Fig. 7). Larger volumes nonetheless remain important for ensuring detection of minor accessory pigments. For oligotrophic and mesotrophic environments, adherence to protocol-recommended larger volumes (1–4 L) remains critical for meeting detection limits and quantifying a minimum of four accessory pigments that indicate adequate sample concentration (Trees et al., 2000). The divergent behavior at high filtration volumes, where precision degrades despite greater sample volume for the subset of pigments identified above, could be explained by detection limit constraints. In oligotrophic waters, large volumes are filtered precisely because pigment concentrations are low; yet for minor pigments from low-abundance taxa, the amount of material collected may still fall near the LOD/LOQ regardless of the volume filtered. At these low signal levels, small absolute differences in peak area between replicates translate to large relative differences in quantified concentration, driving high CV % independently of the volume filtered. Physical stresses during extended filtration, such as cell lysis or filter overloading, may additionally contribute to precision degradation in some cases, though this mechanism is more speculative in the absence of direct evidence from this dataset. Regardless of the filtration volume selected, collecting multiple replicate samples remains essential for quantifying measurement precision and generating statistically robust datasets that enable uncertainty assessment and quality control.
Comparison of precision patterns for concentration (Fig. 5) versus pigment mass (Fig. 6) suggested sample heterogeneity as a variability source. For most carotenoids, particularly taxon-specific pigments (e.g., Perid in dinoflagellates, Fuco in diatoms), CV % increased at lower concentrations. However, this concentration-dependent pattern was less evident when precision was plotted against pigment mass, as revealed by examining the density distributions of observations rather than the LOESS fits. Purely instrumental analytical limitations would produce equally strong CV % relationships with both concentration and mass. The weaker mass relationship suggests that filtering larger volumes of low-concentration water improves precision by capturing more cells, pointing to stochastic sampling rather than instrumental sensitivity as the primary issue. When phytoplankton taxa are sparsely distributed in the water column, the stochastic capture of cells during filtration could introduce variability between replicates that reflects true environmental patchiness rather than measurement error. For example, if Perid-containing dinoflagellates are rare or less abundant, replicate filters may capture different numbers of cells, leading to higher CV % values even though the analytical method itself performs consistently. An additional contributing factor in such cases could be because low cell numbers result in small pigment peak areas near the LOD/LOQ, where quantitation uncertainty could be higher due to reduced signal-to-noise conditions, a mechanism that compounds the stochastic cell capture effect rather than operating independently of it. This stochastic sampling effect may represent a source of variability inherent to natural sample heterogeneity, distinct from methodological factors that can be controlled through improved protocols and highlights the importance of collecting sample replicates to capture the natural variability in the water column.
While the full dataset showed no apparent size class effects in the LOESS fits (Fig. A1), in the censored dataset for a subset of pigments, mostly tertiary but also including primary (e.g., Allo, Diato, Perid) and secondary (e.g., Chlide a, DVChl b), precision degraded at higher filtration volumes, suggesting preferential, taxonomic- or size-fraction-related loss as more material was retained on sample filters. These same pigments also showed increased CV % as the fraction of microplankton decreased and the fraction of picoplankton increased (Fig. 8). This pattern suggests an additional source of precision degradation beyond stochastic sampling effects. This error, however, must not be systematic (i.e., consistently affecting all samples in the same direction and magnitude), as it would affect accuracy rather than precision and thus would not be detectable in this analysis. If the loss of smaller, fragile cells containing these pigments occurred uniformly across samples, all replicates would carry the same systematic bias without affecting analytical precision. This finding highlights the importance of avoiding filter overloading and monitoring vacuum pressure during sample collection for pigment measurements and particulate organic matter (POM) in general to minimize preferential material loss. Recent protocol recommendations for POM collection provide guidance for implementing best practices to reduce these errors (IOCCG, 2021). Key recommendations include: monitoring and recording vacuum pressure throughout filtration to detect filter clogging or overloading to minimize cell lysis and pigment degradation; recording the volume filtered accurately using calibrated measurement devices to reduce relative volume measurement uncertainty, particularly at small volumes; immediately storing filters in liquid nitrogen following filtration and processing to preserve pigment integrity during cold storage; and maintaining an uninterrupted cold chain from sample collection through laboratory analysis. In the absence of universally adopted field collection standards, variability in adherence to these practices across research groups and programs, introduces systematic differences in pre-analytical sample quality that can be largely indistinguishable from biogeochemical variability in precision analyses such as the one presented here. Systematic documentation of field sampling conditions, including filtration, vacuum pressure, and time elapsed between collection and freezing, or any anomaly during sample processing, alongside the analytical data would improve the ability to diagnose and correct for pre-analytical sources of precision variability in future assessments.
The censored dataset revealed different patterns for some pigments from the full dataset analysis, but these differences should be interpreted within the context of overall precision performance. With invariant replicates comprising 3.5 % to 70.1 % of replicate sets across pigments, the statistical power and interpretability of the censored analyses varied considerably. For pigments like TChl a with only 3.5 % invariant replicates, the censored dataset was essentially unchanged from the full dataset, maintaining the same lack of systematic relationships. However, for pigments with high proportions of invariant replicates, such as DVChl b (70.1 %), removing zero-precision samples created datasets dominated by the small fraction of samples where analytical variability was detectable. The increase in explained variability for the censored subset (up to 44 % for DVChl b) reflects this statistical artifact rather than indicating fundamental differences in precision drivers. This reinforces that analytical precision remains primarily governed by methodological factors, with the apparent emergence of systematic relationships in censored datasets reflecting the statistical consequences of high invariant replicate proportions rather than true biogeochemical or concentration dependencies. Nevertheless, the censored dataset analyses did uncover valuable insights, particularly regarding phytoplankton size fractions (Fig. 8). The observed precision degradation when microplankton fraction decreases below 0.5 likely reflects multiple contributing factors: when larger taxa are sparsely represented, pigments diagnostic of those taxa will be present in small amounts, introducing quantitation uncertainty at low signal-to-noise levels analogous to the detection limit effects discussed above. Physical susceptibility of smaller, more fragile phytoplankton groups to filtration-induced errors may additionally contribute, warranting careful assessment of filtration practices for samples dominated by smaller cell sizes. These nuanced relationships, while modest, provide practical guidance for optimizing analytical protocols in different community composition scenarios. Additionally, it must be stated that the proportion of invariant replicates per se does not reflect analytical quality but rather the interaction between concentration range and analytical resolution for a given pigment. Those with narrow, low concentration ranges, such as DVChl b, have a much higher probability of yielding identical quantified values in replicate sets, particularly for duplicates, simply because the limited degrees of freedom near the analytical lower limit constrain the possible reported values. In contrast, pigments spanning wider concentration ranges, such as TChl a, have far more possible quantified values across their range, reducing the probability of invariant replicates occurring by chance alone. The high proportion of invariant replicates for certain pigments should therefore be interpreted as a consequence of their characteristically low and narrow concentration ranges rather than as evidence of superior analytical performance.
The proximal cause for the observed improvement in precision for TChl a and other pigments in oceanic samples does not appear to be related to the size-fraction estimates presented here. One contributing factor may be the larger sample filtration volumes typically required in oceanic waters due to lower pigment concentrations. LOESS fits show precision degradation for filtration volumes < 100 mL (Fig. 7), and oceanic samples likely require larger volumes to achieve adequate pigment mass for analysis. This is supported by observations from POM sampling across the South Pacific Gyre, where the uncertainty budget contribution from filtration volume increased substantially as samples transitioned from oceanic to coastal waters near the Peru-Chile upwelling region (IOCCG, 2021). In oligotrophic oceanic environments, larger filtration volumes reduce the relative measurement error in volume quantitation that is inherently larger at smaller volumes: when the same measurement device is used across the full range of filtration volumes, a fixed absolute measurement uncertainty translates to a substantially larger relative error at small volumes, which propagates directly into calculated pigment concentrations.
The SeaHARRE-4 and SeaHARRE-5 (Hooker et al., 2010, 2012) intercomparisons provide context for interpreting coastal versus oceanic precision and accuracy differences. Despite using exclusively coastal samples from eutrophic waters (Danish fjords and estuaries for SeaHARRE-4; New England and Tasmanian rivers and bays for SeaHARRE-5), the precision of quality-assured methods was largely indistinguishable from the three previous SeaHARRE activities conducted in open-ocean environments, with overall precision differences of only ∼ 1.4 %–2.4 % for TChl a among validated methods across both coastal exercises. This consistency across environmental settings suggests that coastal conditions do not inherently compromise analytical precision when proper methodological protocols are followed. However, both coastal exercises revealed significant precision degradation in non-quality-assured laboratories, showing substantially worse precision than in previous activities. In SeaHARRE-4 specifically, the standard deviation of method uncertainties, a measure of inter-method variability distinct from the replicate CV % used in the present study, was approximately 6- to 150-fold larger for the non-quality-assured subset compared to quality-assured methods across pigment data products (Hooker et al., 2010). In contrast to the robust precision results, accuracy patterns differed between the two coastal activities: SeaHARRE-4 exhibited the highest average uncertainties for primary pigments among all five SeaHARRE activities for both quality-assured and non-quality-assured method subsets while SeaHARRE-5 showed improved accuracy more consistent with oceanic activities; quality-assured methods in SeaHARRE-5 achieved primary pigment accuracy within the quantitative analysis goal of 15 %. This improvement in SeaHARRE-5, despite both exercises sampling eutrophic coastal waters, suggests that the elevated SeaHARRE-4 uncertainties could have been partially attributable to analytical challenges rather than fundamental limitations of coastal sample analysis. Across both coastal activities, Fuco and Diad were the only carotenoids maintaining state-of-the-art accuracy (within 10 % uncertainty) and showed minimal variation across all trophic regimes, while TChl a accuracy remained largely invariant to water type for quality-assured methods. The consistently robust performance of Fuco and Diad likely reflects not only their pigment-specific analytical characteristics but also their typically elevated concentrations in coastal phytoplankton assemblages, which place them well above LOD/LOQ conditions where peak area quantitation is most reliable. Their elution in chromatographically stable regions of the chromatogram, free from solvent front effects or peak broadening, may provide an additional analytical advantage contributing to their consistently good reproducibility across methods and laboratories. These results suggest that the coastal versus oceanic precision differences observed in our dataset likely reflect systematic differences in sampling procedures, filtration volumes, or other methodological factors, rather than laboratory analytical procedures, which are standardized across all samples processed at the GSFC facility. In the SeaHARRE inter-laboratory context, differences in the pigment selectivity of analytical methods chosen by participating laboratories may also have contributed, as coastal waters harbor a more diverse and complex pigment composition than oceanic waters, meaning that differences in chromatographic resolution among methods may manifest more prominently where a broader suite of pigments must be resolved simultaneously. We acknowledge, however, that the specific pre-analytical and methodological factors responsible for the coastal vs. oceanic differences in our dataset cannot be fully enumerated or verified, as the necessary metadata to directly test these hypotheses are not available, and we reflect this uncertainty in our interpretation. The accuracy differences, which we did not assess, may involve additional complexities including pigment composition, matrix effects, or extraction efficiency variations between coastal and oceanic biomes.
Globally, our results are consistent with recent interlaboratory comparisons that highlight the importance of quality-assurance standardization, though direct comparison requires careful distinction between accuracy as evaluated in SeaHARRE and others (inter-laboratory agreement) and precision as evaluated here (intra-laboratory replicate variability). Canuti (2023) assessed inter-laboratory accuracy, reporting mean percent differences of 10.8 % for TChl a and 16.9 % for primary pigments between two laboratories both using the Van Heukelem and Thomas (2001) method on 957 samples collected across multiple regions including the Mediterranean Sea, the Black Sea, and the Iberian area, spanning a wide concentration range (0.083–27.35 mg m−3). Similarly, Canuti et al. (2025) quantified inter-laboratory accuracy at 6.1 % for TChl a between two facilities using different HPLC methods on oligotrophic Mediterranean samples. In contrast, our study assessed intra-laboratory precision, achieving 4.3 % for TChl a and < 10 % for most pigments. While within-lab precision and between-lab accuracy are distinct metrics, our precision results falling well below the inter-laboratory differences reported by Canuti et al. (2025) suggest that systematic analytical or procedural differences between laboratories, rather than random analytical variance within laboratories, are a more dominant source of uncertainty in pigment intercomparisons. Both of those recent studies and our work converge on key findings: laboratories performed well across wide concentration ranges with no strong concentration dependence, uncertainty was pigment-specific (e.g., Chlide a) rather than systematic across all compounds, and methodological factors, whether differences between laboratories (accuracy) or adherence to protocols within laboratories (precision), were identified as primary drivers of variability rather than environmental conditions or sample matrix effects.
Canuti (2023) identified sample handling as a critical source of variability, observing that “inhomogeneity in the water sample preparation may affect the assumed equivalence of duplicates”. This parallels our distinction between analytical precision and sample heterogeneity. When field replicates are collected from a patchy or heterogeneous water parcel, or as discussed before, sample processing introduces differential cell capture or loss during filtration, the resulting variability reflects pre-analytical factors rather than instrumental limitations. This interpretation reinforces our observation that pre-analytical sample processing, including filtration protocols, handling procedures, and field collection practices, represents a primary opportunity for further precision improvements in ocean color validation activities.
The assessment of precision presented here showed that the analytical method meets legacy ocean color mission requirements for validation objectives for most pigments. These findings support the production of climate-quality data with quantified uncertainty estimates for validation of ocean color sensors and model outputs. Several key methodological recommendations emerged from this work: The value of replicate samples, particularly independent replicates collected from the same water mass rather than pseudo-replicates (i.e., multiple subsamples or extractions from a single water sample or Niskin bottle) should be emphasized for distinguishing analytical precision from environmental variability and sample heterogeneity. Notably, only 30 % of samples in this dataset were collected as replicates and among replicate sets, the dataset is overwhelmingly composed of duplicates (97.2 %; Table 2). It should be noted that CV % estimates derived from duplicate measurements carry inherently higher uncertainty than those derived from three or more replicates, as a single pair of measurements provides limited statistical power to characterize the true distribution of analytical variability. This limitation further motivates the recommendation below for collecting triplicate filters when logistically feasible. NASA's Ocean Biology and Biogeochemistry (OBB) program recommends that a minimum of 5 % of samples be collected in replicate to enable precision assessment; however, investigators should routinely incorporate field replication at rates substantially exceeding this minimum threshold into their sampling protocols to ensure robust uncertainty quantification. New field researchers and early-stage projects should prioritize even higher replication rates until sampling procedures are well-established and precision characteristics are thoroughly documented. As collectively demonstrated by the SeaHARRE exercises and more recent comparisons, replicate measurements provide the empirical basis for quantifying uncertainty and identifying sources of variability. We strongly encourage research programs to prioritize replication, including collecting triplicate filters when logistically feasible, as this practice not only enables robust precision assessment but also provides statistical power to detect environmental variability and outliers. Beyond replication improvements, optimized filtration volumes appropriate to phytoplankton abundance and careful vacuum pressure monitoring during filtration represent practical steps toward improving precision. While this study encompassed diverse oceanographic conditions, future work should investigate the influence of optically complex Case II waters (Morel and Prieur, 1977) on pigment extraction efficiency and analytical precision. Such environments, characterized by high suspended sediment loads, elevated chromophoric dissolved organic matter, or substantial contributions from non-algal particles, present additional challenges during sample filtration and extraction that can affect both accuracy and precision in ways not fully characterized. Continued adherence to validated protocols, regular participation in inter-laboratory comparison exercises, and systematic documentation of field sampling conditions and replication strategies will ensure sustained analytical quality to support current and future ocean color satellite missions with increasingly stringent calibration and validation requirements.
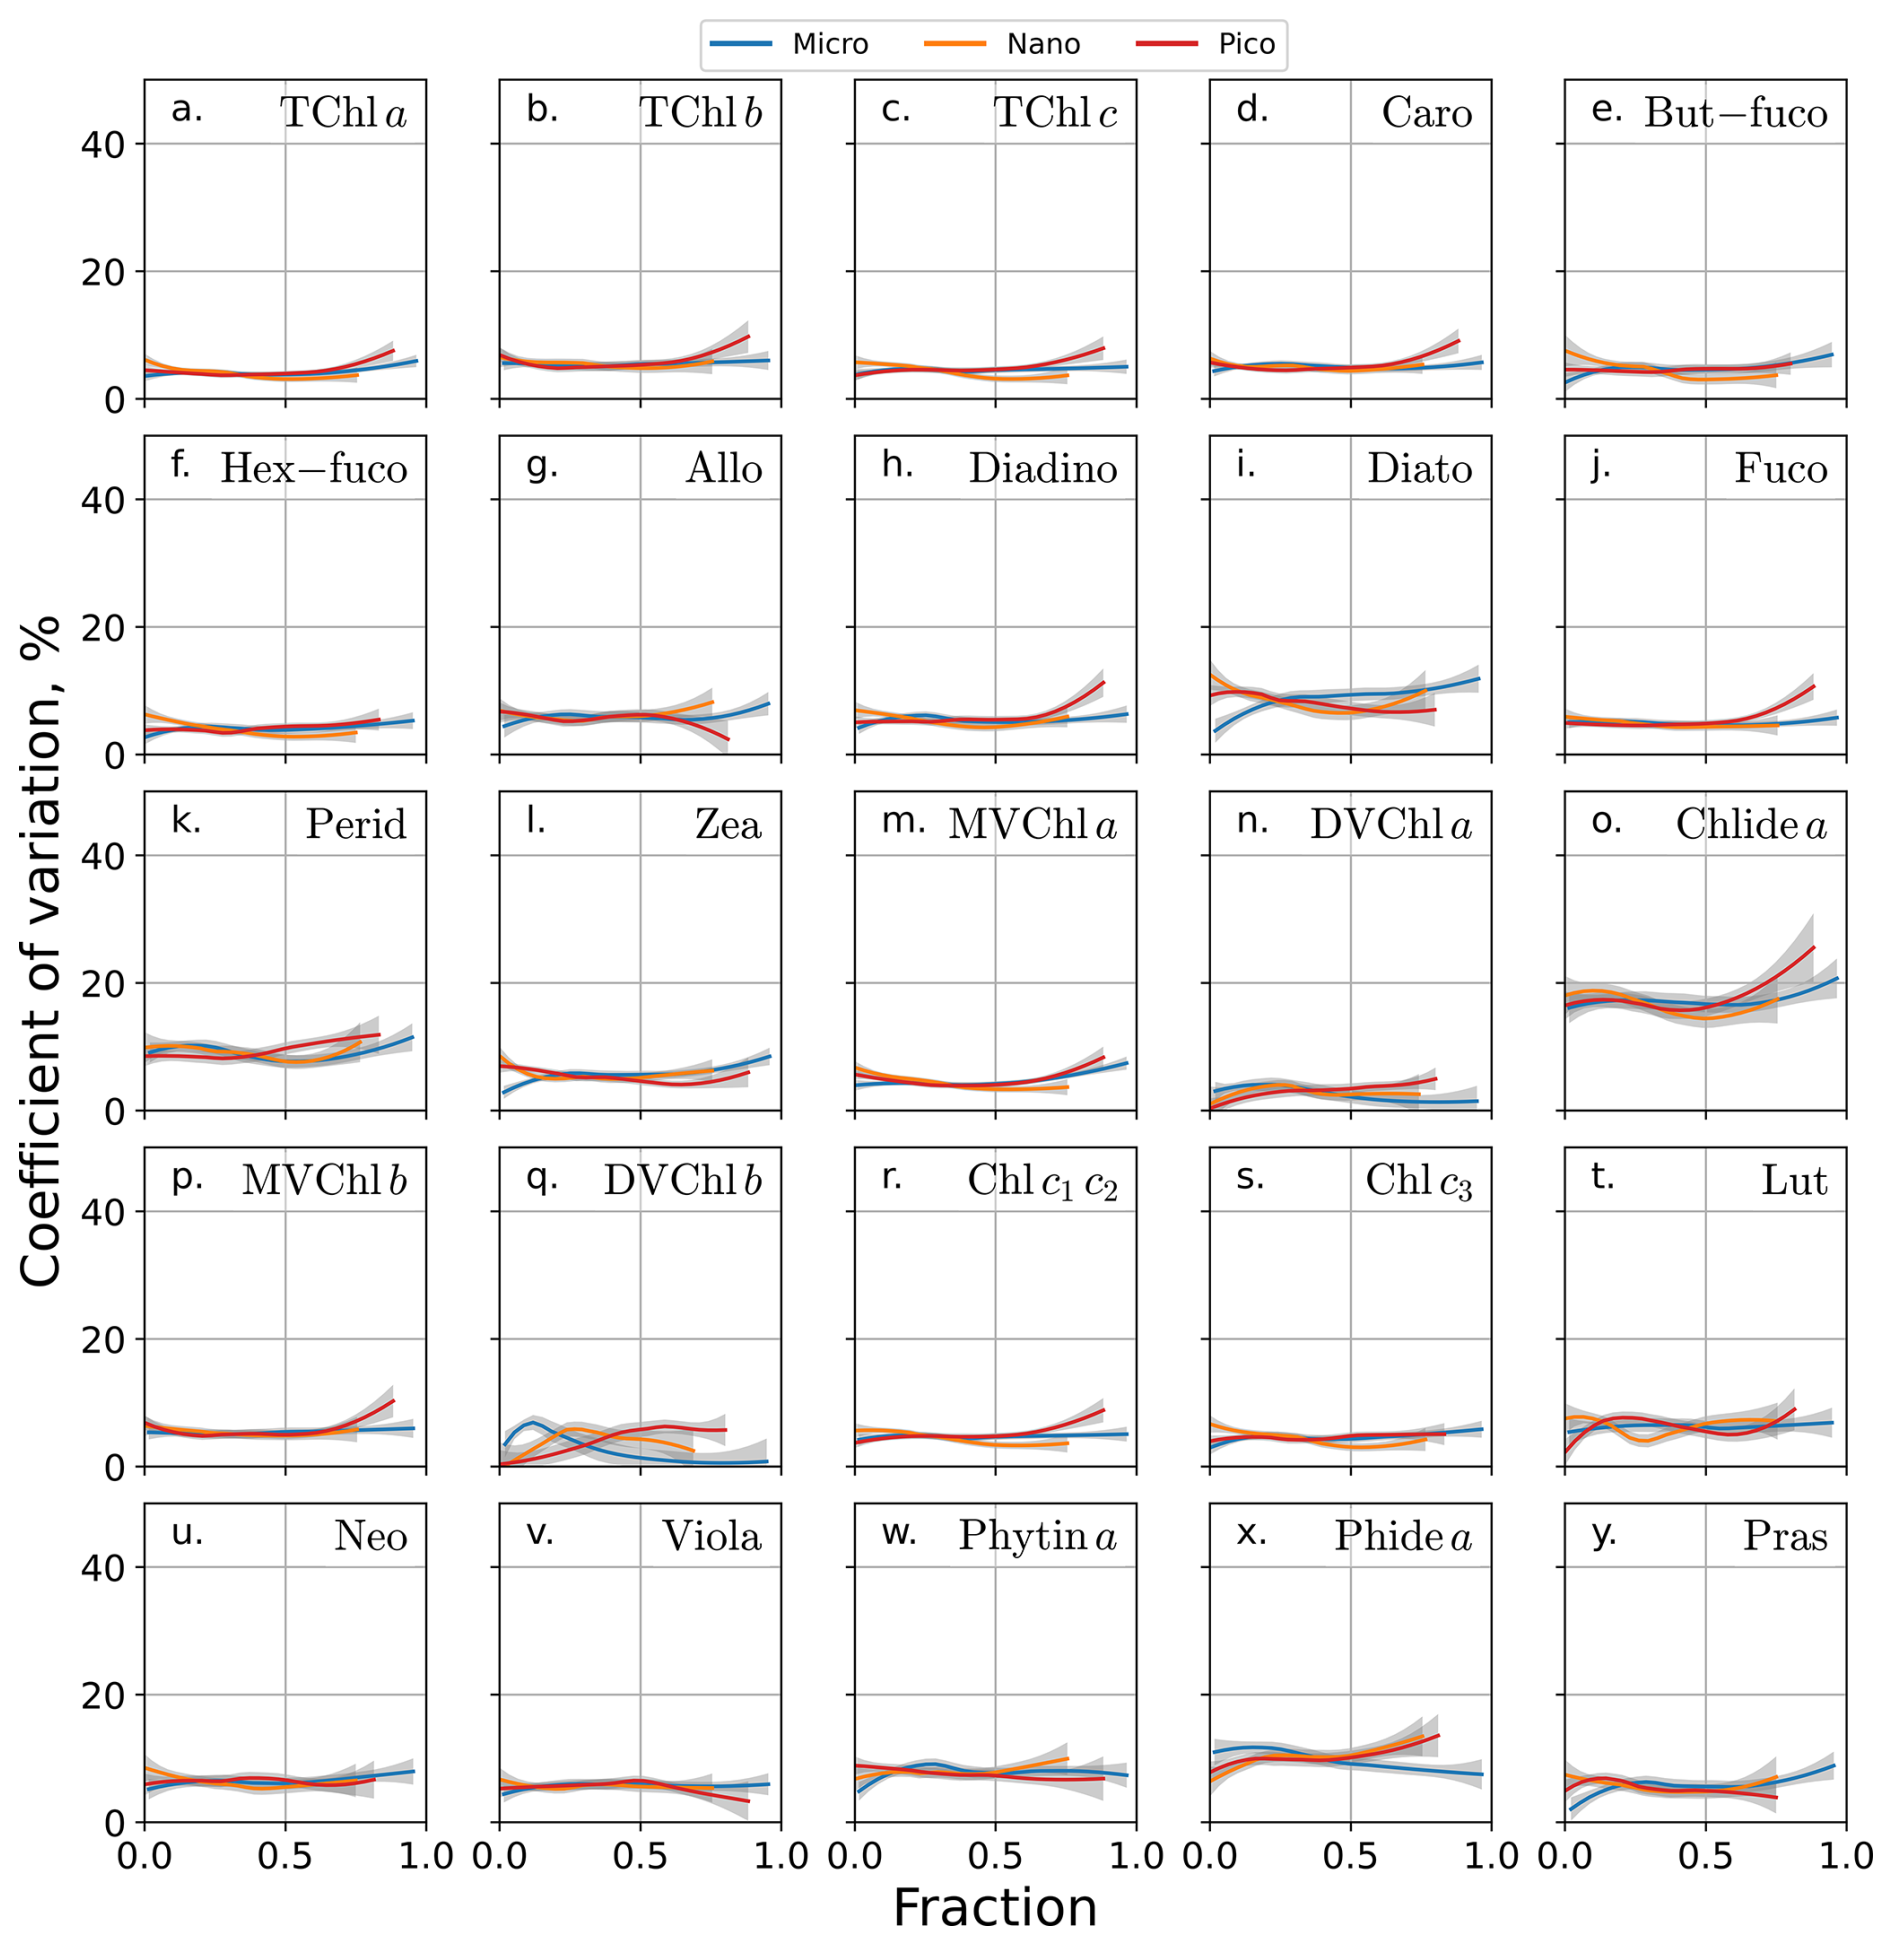
Figure A1LOESS regression fits of sample precision (all data) versus estimated phytoplankton size fraction: micro (> 20 µm), nano (2–20 µm), and picoplankton (< 2 µm) Eqs. (2)–(4). Shaded area contains 95 % confidence bands.
Substituting pigment mass for concentration in multivariate regression models revealed both similarities and key differences. Overall explanatory power remained low for the full dataset (maximum R2=0.047 vs. 0.030 for concentration models; Table B1), reinforcing that precision variability is predominantly random rather than systematic. However, coastal vs. oceanic origin emerged as the most important variable more frequently in mass-based models ( pigments) compared to concentration-based models (), suggesting that pigment mass captures additional variance related to sample provenance. This increased importance of geographic origin in mass-based models is consistent with the distinction between sample heterogeneity and analytical precision discussed in the main text: since mass inherently incorporates filtered volume (Eq. 5), it partially accounts for the compensatory effect of filtering larger volumes in oligotrophic waters, where stochastic cell capture would otherwise dominate concentration-based variability. The censored dataset results showed consistency between approaches, with concentration and mass each dominating approximately equal numbers of pigments (22 and 21 of 25, respectively).
For practical applications, concentration remains preferable to pigment mass for guiding analytical protocols and field sampling. Investigators can assess concentration in real-time through visual observations or preliminary measurements, enabling immediate adjustment of filtration volumes based on apparent phytoplankton abundance. In contrast, pigment mass is only determined after analysis and depends partly on laboratory protocols. Concentration-based results thus provide more actionable field guidance, though both approaches yield valuable insights into factors affecting analytical precision.
Table B1Results of ordinary least squares multiple regressions predicting phytoplankton pigment analysis precision as CV %, for all the data and CV % > 0. The p-value tests if all coefficients equal zero; adjusted R2 shows variance explained by independent variables. Min and max R2 values are underlined in each column. The independent variables were: log10 of pigment mass, log10 of filtered volume, estimated fraction of microplankton, and the categorical variable coastal or ocean, respectively.

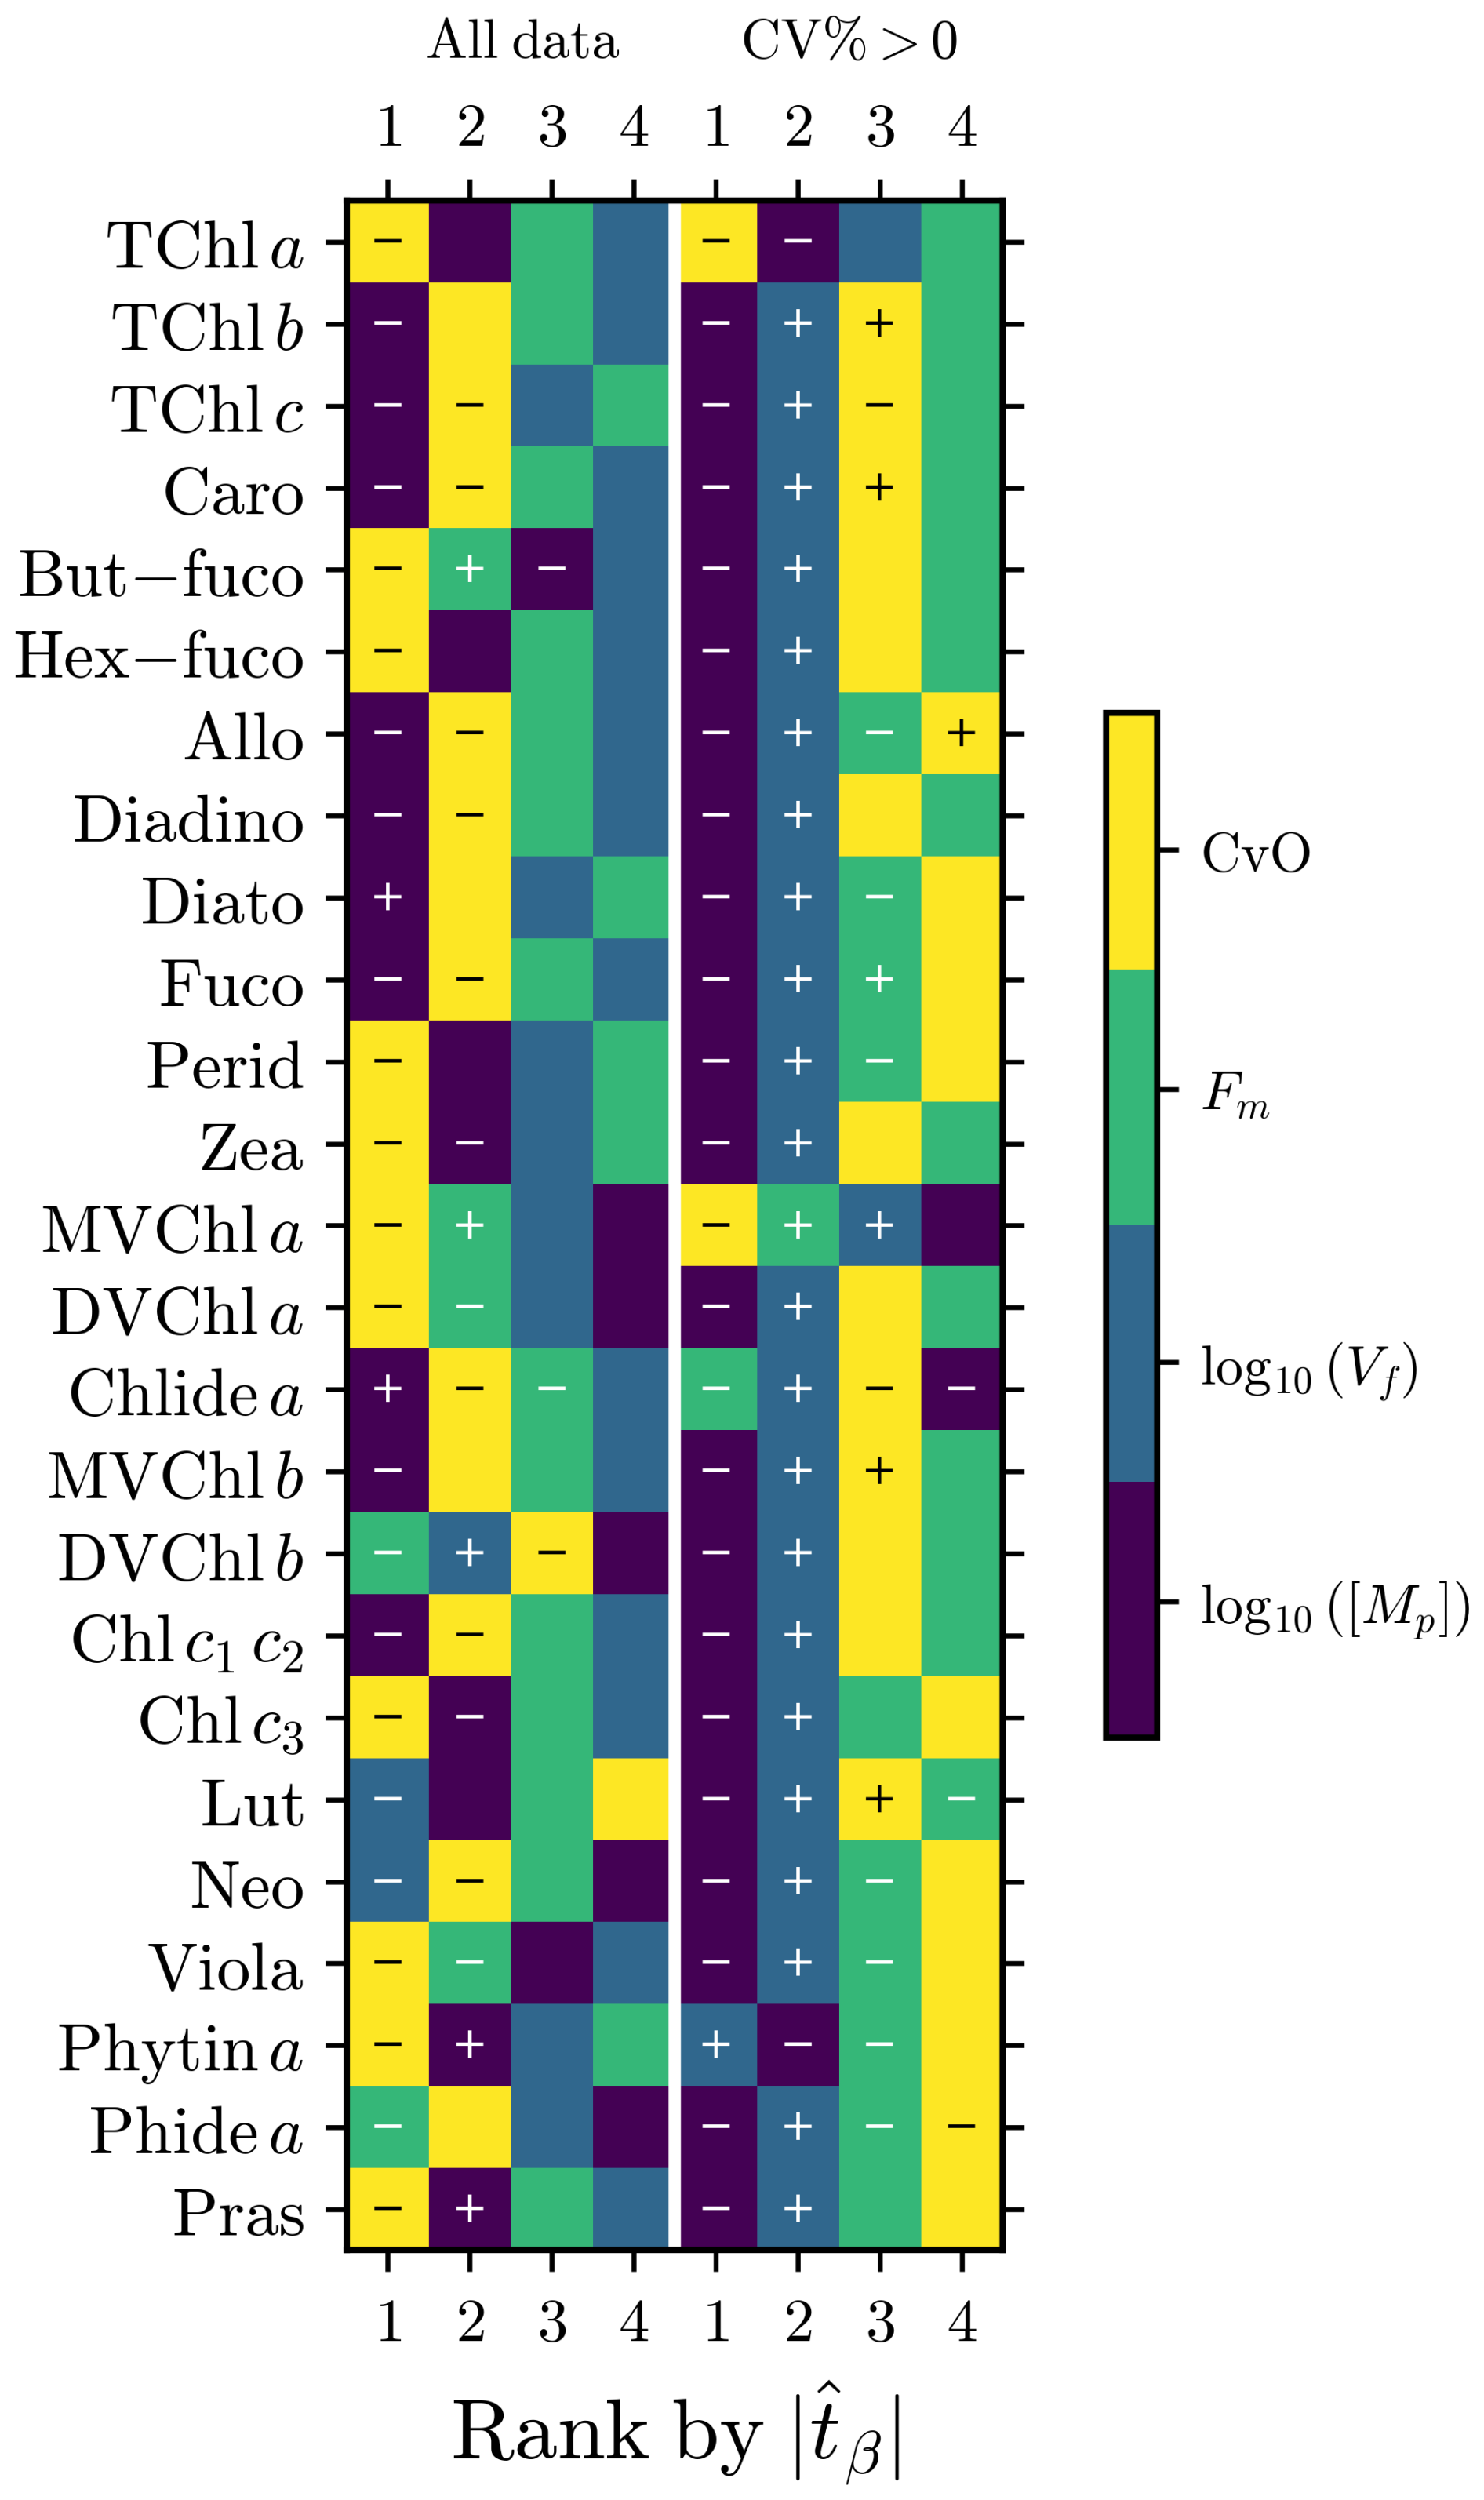
Figure B1Variable importance rankings from multivariate regressions predicting pigment precision for full dataset (left) and censored data excluding invariant replicates (right). Rankings (1–4) based on absolute t-statistics (). Symbols indicate effect direction: “+” increases CV %, “−” decreases CV %, blank = non-significant (α = 0.05). Variables: log10(MP) = pigment mass, log10(Vf) = filtered volume, Fm = microplankton fraction, CvO = coastal (0) vs. oceanic (1). Colors denote variables as per the colorbar.
Analysis code and data (Python scripts and Jupyter notebook) are available at: https://git.smce.nasa.gov/joaquin.chaves/, last access: 25 August 2026, hplc-precision-analysis under NASA Apache 2.0 License. Field sample data follow NASA's SeaBASS data policy (https://seabass.gsfc.nasa.gov/wiki/Access_Policy, last access: 16 March 2026) and are publicly accessible through the SeaBASS repository. Ocean color satellite data were obtained from NASA OB.DAAC (https://oceancolor.gsfc.nasa.gov/, last access: 16 March 2026).
JEC, CST, and AM designed the study. CST implemented all analytical procedures and conducted all sample analyses. JEC performed data curation, statistical analyses, and software development. JEC, CST, and AM prepared the manuscript with all co-authors contributing to revisions and approving the final version.
The contact author has declared that none of the authors has any competing interests.
Publisher's note: Copernicus Publications remains neutral with regard to jurisdictional claims made in the text, published maps, institutional affiliations, or any other geographical representation in this paper. The authors bear the ultimate responsibility for providing appropriate place names. Views expressed in the text are those of the authors and do not necessarily reflect the views of the publisher.
The smooth running of the daily activities of the NASA GSFC HPLC analytical facility is only possible with the assistance of C. Kenemer and the entire Ocean Ecology Laboratory Field Support Group. We thank the principal investigators who collected and submitted field samples for analysis. We thank the three anonymous reviewers for their constructive comments and suggestions, which helped improve the quality of this manuscript. We also thank Associate Editor Koji Suzuki for his thorough and expert handling of the manuscript throughout the review process, including his review of the final revision.
This research has been supported by the NASA Headquarters (grant nos. WBS: 509496.02.80.01.21 and WBS: 720817.04.14.01.07).
This paper was edited by Koji Suzuki and reviewed by Asta Heidemann and two anonymous referees.
Araujo, P.: Key aspects of analytical method validation and linearity evaluation, METHOD Valid. Comp. Transf., 877, 2224–2234, https://doi.org/10.1016/j.jchromb.2008.09.030, 2009.
Behrenfeld, M. J., Randerson, J. T., McClain, C. R., Feldman, G. C., Los, S. O., Tucker, C. J., Falkowski, P. G., Field, C. B., Frouin, R., Esaias, W. E., Kolber, D. D., and Pollack, N. H.: Biospheric Primary Production During an ENSO Transition, Science, 291, 2594, https://doi.org/10.1126/science.1055071, 2001.
Behrenfeld, M. J., Westberry, T. K., Boss, E. S., O'Malley, R. T., Siegel, D. A., Wiggert, J. D., Franz, B. A., McClain, C. R., Feldman, G. C., Doney, S. C., Moore, J. K., Dall'Olmo, G., Milligan, A. J., Lima, I., and Mahowald, N.: Satellite-detected fluorescence reveals global physiology of ocean phytoplankton, Biogeosciences, 6, 779–794, https://doi.org/10.5194/bg-6-779-2009, 2009.
Bidigare, R. R., Van Heukelem, L. V., Trees, C. C., and Perl, J.: HPLC Phytoplankton Pigments: Sampling, Laboratory Methods, and Quality Assurance Procedures, in: Ocean Optics Protocols For Satellite Ocean Color Sensor Validation, vol. Revision 5, Volume V, edited by: Mueller, J. L., Fargion, G. S., and McClain, C. R., National Aeronautics and Space Administration, Greenbelt, Maryland, 20771, https://seabass.gsfc.nasa.gov/wiki/System_Description/Protocols_Ver5_VolV.pdf (last access: 11 March 2026), 2003.
Canjura, F. L.: Separation of chlorophyll compounds and their polar derivatives by high-performance liquid chromatography, J. Agric. Food Chem., 39, 1102–1105, https://doi.org/10.1021/jf00006a020, 1991.
Canuti, E.: Phytoplankton pigment in situ measurements uncertainty evaluation: an HPLC interlaboratory comparison with a European-scale dataset, Front. Mar. Sci., 10, 2023, https://doi.org/10.3389/fmars.2023.1197311, 2023.
Canuti, E., Artuso, F., and Di Cicco, A.: Comparative analysis of HPLC methods for measuring phytoplankton pigments in the Western Mediterranean Sea: A contribution to the satellite Cal/Val activities, Mar. Chem., 270, 104516, https://doi.org/10.1016/j.marchem.2025.104516, 2025.
Claustre, H.: The trophic status of various oceanic provinces as revealed by phytoplankton pigment signatures, Limnol. Oceanogr., 39, 1206–1210, https://doi.org/10.4319/lo.1994.39.5.1206, 1994.
Cleveland, W. S., Grosse, E., and Shyu, W. M.: Local regression models, in: Statistical Models in S, edited by: Chambers, J. M. and Hastie, T. J., Wadsworth & Brooks/Cole, Pacific Grove, CA, 309–376, https://doi.org/10.1201/9780203738535, 1992.
Ellison, S. L. R. and Williams, A. (Eds.): Eurachem/CITAC guide: Quantifying Uncertainty in Analytical Measurement, 3rd edn., Eurachem, https://www.eurachem.org/images/stories/Guides/pdf/QUAM2012_P1.pdf (last access: 11 March 2026), 2012.
Ermer, J. and Miller, J. H. M. B.: Method Validation in Pharmaceutical Analysis: A Guide to Best Practice, Wiley, ISBN 978-3-527-60447-0, 2006.
Fernández-Marín, B., Roach, T., Verhoeven, A., and García-Plazaola, J. I.: Shedding light on the dark side of xanthophyll cycles, New Phytol., 230, 1336–1344, https://doi.org/10.1111/nph.17191, 2021.
Field, C. B., Behrenfeld, M. J., Randerson, J. T., and Falkowski, P.: Primary Production of the Biosphere: Integrating Terrestrial and Oceanic Components, Science, 281, 237–240, https://doi.org/10.1126/science.281.5374.237, 1998.
Gordon, H. R. and Morel, A.: Remote Assessment of Ocean Color for Interpretation of Satellite Visible Imagery: A Review, Springer-Verlag, New York, 114 pp., https://doi.org/10.1029/LN004, 1983.
Green, J. M.: A Practical Guide to Analytical Method Validation, Anal. Chem., 68, 305A–309A, https://doi.org/10.1021/ac961912f, 1996.
Hooker, S. B. and Maritorena, S.: An Evaluation of Oceanographic Radiometers and Deployment Methodologies, J. Atmospheric Ocean. Technol., 17, 811–830, https://doi.org/10.1175/1520-0426(2000)017<0811:AEOORA>2.0.CO;2, 2000.
Hooker, S. B. and Van Heukelem, L.: A symbology and vocabulary for an HPLC lexicon, in: Phytoplankton Pigments: Characterization. Chemotaxonomy and Applications in Oceanography, edited by: Roy, S., Llewellyn, C. A., Egeland, E. S., and Johnsen, G., Cambridge University Press, 243–256, ISBN 978-1139186841, 2011.
Hooker, S. B., Claustre, H., Ras, J., Van Heukelem, L., Berthon, J.-F., Targa, C., van der Linde, D., Barlow, R., and Sessions, H.: The First SeaWiFS HPLC Analysis Round-Robin Experiment (SeaHARRE-1), edited by: Hooker, S. B. and Firestone, E. R., Goddard Space Flight Center, Greenbelt, Maryland 20771, https://ntrs.nasa.gov/citations/20010072242 (last access: 11 March 2026), 2000.
Hooker, S. B., Heukelem, L. V., Thomas, C. S., Claustre, H., Ras, J., Schluter, L., Perl, J., Trees, C., Stuart, V., Head, E., Barlow, R., Sessions, H., Clementson, L., Fishwick, J., Llewellyn, C., and Aiken, J.: The Second SeaWiFS HPLC Analysis Round-Robin Experiment (SeaHARRE-2), National Aeronautics and Space Administration, https://ntrs.nasa.gov/citations/20060003771 (last access: 11 March 2026), 2005.
Hooker, S. B., McClain, C. R., and Mannino, A.: NASA Strategic Planning Document: A Comprehensive Plan for the Long-Term Calibration and Validation of Oceanic Biogeochemical Satellite Data, National Aeronautics and Space Administration, https://ntrs.nasa.gov/citations/20070027283 (last access: 11 March 2026), 2007.
Hooker, S. B., Van Heukelem, L., Thomas, C. S., Claustre, H., Ras, J., Schlüter, L., Clementson, L., van der Linde, D., Eker-Develi, E., Berthon, J.-F., Barlow, R., Sessions, H., Ismail, H., and Perl, J.: The Third SeaWiFS HPLC Analysis Round-Robin Experiment (SeaHARRE-3), National Aeronautics and Space Administration, https://ntrs.nasa.gov/citations/20100018466 (last access: 11 March 2026), 2009.
Hooker, S. B., Thomas, C. S., Van Heukelem, L., Schlüter, L., Russ, M. E., Ras, J., Claustre, H., Clementson, L., Canuti, E., Berthon, J.-F., Perl, J., Normandeau, C., Cullen, J., Kienast, M., and Pinckney, J. L.: The Fourth SeaWiFS HPLC Analysis Round-Robin Experiment (SeaHARRE-4), National Aeronautics and Space Administration, https://ntrs.nasa.gov/citations/20110008482 (last access: 11 March 2026), 2010.
Hooker, S. B., Clementson, L., Thomas, C. S., Schlüter, L., Allerup, M., Ras, J., Claustre, H., Normandeau, C., Cullen, J., Kienast, M., Kozlowski, W., Vernet, M., Chakraborty, S., Lohrenz, S., Tuel, M., Redalje, D., Cartaxana, P., Mendes, C. R., Brotas, V., Matondkar, S. G. P., Parab, S. G., Neeley, A., and Egeland, E. S.: The Fifth SeaWiFS HPLC Analysis Round-Robin Experiment (SeaHARRE-5), National Aeronautics and Space Administration, https://www.earthdata.nasa.gov/events/seaharre-5-workshop (last access: 11 March 2026), 2012.
IOCCG: Particulate Organic Matter Sampling and Measurement Protocols: Consensus Towards Future Ocean Color Missions, edited by: Chaves, J. E., Cetinić, I., Dall'Olmo, G., Estapa, M., Gardner, W., Goñi, M., Graff, J. R., Hernes, P., Lam, P. J., Liu, Z., Lomas, M. W., Mannino, M., Novak, M. G., Turnewitsch, R., Werdell, P. J., and Westberry, T. K., Ocean Opt. Biogeochem. Protoc. Satell. Ocean Colour Sens. Valid., 60, https://doi.org/10.25607/OBP-1646, 2021.
Jeffrey, S. W. and Mantoura, R. F. C.: Pigment abbreviations used by SCOR WG 78, in: Phytoplankton Pigments in Oceanography: Guidelines to Modern Methods, edited by: Jeffrey, S. W., Mantoura, R. F. C., and Wright, S. W., UNESCO Publishing, Paris, France, 571–572, ISBN 978-9231032752, 1997.
Kluyver, T., Ragan-Kelley, B., Pérez, F., Granger, B., Bussonnier, M., Frederic, J., Kelley, K., Hamrick, J., Grout, J., Corlay, S., Ivanov, P., Avila, D., Abdalla, S., Willing, C., and Jupyter Development Team: Jupyter Notebooks – a Publishing Format for Reproducible Computational Workflows, in: Positioning and Power in Academic Publishing: Players, Agents and Agendas, 87–90, https://doi.org/10.3233/978-1-61499-649-1-87, 2016.
Mantoura, R. F. C., Wright, S. W., Jeffrey, S. W., Barlow, R. G., and Cummings, D. E.: Filtration and storage of pigments from microalgae, in: Phytoplankton Pigments in Oceanography: Guidelines to Modern Methods, edited by: Jeffrey, S. W., Mantoura, R. F. C., and Wright, S. W., UNESCO Publishing, Paris, France, ISBN 978-9231032752, 283–306, 1997.
McClain, C. R., Esaias, W. E., Barnes, W., Guenther, B., Endres, D., Hooker, S., Mitchell, G., and Barnes, R.: Calibration and Validation Plan for SeaWiFS, NASA Goddard Space Flight Center, Greenbelt, Maryland, https://ntrs.nasa.gov/citations/19920024493 (last access: 11 March 2026), 1992.
Mélin, F. and Vantrepotte, V.: How optically diverse is the coastal ocean?, Remote Sens. Environ., 160, 235–251, https://doi.org/10.1016/j.rse.2015.01.023, 2015.
Morel, A. and Prieur, L.: Analysis of Variations in Ocean Color, Limnol. Oceanogr., 22, 709–722, https://doi.org/10.4319/lo.1977.22.4.0709, 1977.
National Research Council: Chemical Reference Materials: Setting the Standards for Ocean Science, National Academies Press, Washington, D.C., 144 pp., https://doi.org/10.17226/10476, 2002.
R Core Team: R: A Language and Environment for Statistical Computing, R Foundation for Statistical Computing, Vienna, Austria, https://www.R-project.org/ (last access: 11 March 2026), 2022.
Richardson, T. L. and Pinckney, J. L.: Monitoring of the toxic dinoflagellate Karenia brevis using gyroxanthin-based detection methods, J. Appl. Phycol., 16, 315–328, https://doi.org/10.1023/B:JAPH.0000047788.31312.4f, 2004.
Siegel, D. A., Maritorena, S., Nelson, N. B., Behrenfeld, M. J., and McClain, C. R.: Colored dissolved organic matter and its influence on the satellite-based characterization of the ocean biosphere, Geophys. Res. Lett., 32, L20605, https://doi.org/10.1029/2005gl024310, 2005.
Siegel, D. A., Behrenfeld, M. J., Maritorena, S., McClain, C. R., Antoine, D., Bailey, S. W., Bontempi, P. S., Boss, E. S., Dierssen, H. M., Doney, S. C., Eplee, R. E., Evans, R. H., Feldman, G. C., Fields, E., Franz, B. A., Kuring, N. A., Mengelt, C., Nelson, N. B., Patt, F. S., Robinson, W. D., Sarmiento, J. L., Swan, C. M., Werdell, P. J., Westberry, T. K., Wilding, J. G., and Yoder, J. A.: Regional to global assessments of phytoplankton dynamics from the SeaWiFS mission, Remote Sens. Environ., 135, 77–91, https://doi.org/10.1016/j.rse.2013.03.025, 2013.
Sosik, H. M.: Storage of marine particulate samples for light-absorption measurements, Limnol. Oceanogr., 44, 1139–1141, https://doi.org/10.4319/lo.1999.44.4.1139, 1999.
Trees, C. C., Clark, D. K., Bidigare, R. R., Ondrusek, M. E., and Mueller, J. L.: Accessory pigments versus chlorophyll a concentrations within the euphotic zone: A ubiquitous relationship, Limnol. Oceanogr., 45, 1130–1143, https://doi.org/10.4319/lo.2000.45.5.1130, 2000.
Uitz, J., Claustre, H., Morel, A., and Hooker, S. B.: Vertical distribution of phytoplankton communities in open ocean: An assessment based on surface chlorophyll, J. Geophys. Res., 111, https://doi.org/10.1029/2005jc003207, 2006.
Uitz, J., Claustre, H., Gentili, B., and Stramski, D.: Phytoplankton class-specific primary production in the world's oceans: Seasonal and interannual variability from satellite observations, Global Biogeochem. Cy., 24, GB3016, https://doi.org/10.1029/2009gb003680, 2010.
Van Heukelem, L. and Hooker, S.: The importance of a quality assurance plan for method validation and minimizing uncertainties in the HPLC analysis of phytoplankton pigments, in: Phytoplankton Pigments: Characterization, Chemotaxonomy and Applications in Oceanography, edited by: Llewellyn, C. A., Egeland, E. S., Johnsen, G., Roy, S., van Heukelem, L., and Hooker, S. B., Cambridge University Press, Cambridge, 195–256, https://doi.org/10.1017/CBO9780511732263.009, 2011.
Van Heukelem, L. and Thomas, C. S.: Computer-assisted high-performance liquid chromatography method development with applications to the isolation and analysis of phytoplankton pigments, J. Chromatogr. A, 910, 31–49, https://doi.org/10.1016/S0378-4347(00)00603-4, 2001.
Van Heukelem, L., Thomas, C. S., and Gilbert, P. M.: Sources of Variability in Chlorophyll Analysis by Fluorometry and High-Performance Liquid Chromatography in a SIMBIOS Inter-Calibration Exercise, NASA Goddard Space Flight Center, edited by: Fargion, G. S. and McClain, C. R., NASA Goddard Space Flight Center, Greenbelt, MD United States, https://ntrs.nasa.gov/citations/20020090932 (last access: 11 March 2026), 2002.
Vidussi, F., Claustre, H., Manca, B. B., Luchetta, A., and Marty, J.-C.: Phytoplankton pigment distribution in relation to upper thermocline circulation in the eastern Mediterranean Sea during winter, J. Geophys. Res.-Ocean., 106, 19939–19956, https://doi.org/10.1029/1999jc000308, 2001.
- Abstract
- Introduction
- Methods
- The Pigments
- Results
- Discussion
- Conclusions and Recommendations
- Appendix A: Precision Variability Across Phytoplankton Size Fractions (Full Dataset)
- Appendix B: Multivariate Regression Analysis Using Pigment Mass
- Code and data availability
- Author contributions
- Competing interests
- Disclaimer
- Acknowledgements
- Financial support
- Review statement
- References
- Abstract
- Introduction
- Methods
- The Pigments
- Results
- Discussion
- Conclusions and Recommendations
- Appendix A: Precision Variability Across Phytoplankton Size Fractions (Full Dataset)
- Appendix B: Multivariate Regression Analysis Using Pigment Mass
- Code and data availability
- Author contributions
- Competing interests
- Disclaimer
- Acknowledgements
- Financial support
- Review statement
- References