
the Creative Commons Attribution 4.0 License.
the Creative Commons Attribution 4.0 License.
 | 09 Oct 2026
Drought responses of a Norway spruce forest on drained peat soil: combining sap-flow sensors, eddy-covariance, meteorological, soil and UAV data
Pavel Konstantinovich Alekseychik

Mikko Peltoniemi
Raisa Mäkipää
Ville Tuominen
Tuomas Laurila
Hamlyn Jones
Mitro Müller
Evegeny Lopatin
Helena Rautakoski
Timo Vesala
Samuli Launiainen
The study explores the drought effects on boreal peatland forests, a problem that has not been sufficiently addressed to date. Deeper knowledge of how these stands respond to drought is essential for refining forest management practices and improving climate modeling. We conducted a holistic investigation of the ecophysiological and meteorological responses to drought in a southern Finnish Norway spruce-dominated, drained boreal peatland forest during the hot and dry spells of the summers of 2020 and 2021. The study utilized a comprehensive set of ecosystem monitoring products: eddy-covariance (EC) CO2 and H2O fluxes, surface energy balance, sap-flow sensors, UAV-based leaf temperature and NDVI orthomosaics, soil moisture and water table level, and weather data. Norway spruce reaction to drought was examined at sub-daily to seasonal time scales in a recently thinned Continuous Cover Forestry (CCF) block and a control block, revealing divergent reactions to drought. The stand-scale response was most directly reflected in the sap flow data, which indicated higher stress in the control block, likely caused by higher inter-tree competition for soil water. At the same time, both the control and CCF harvest blocks showed signs of physiological stress, manifested as reduced net ecosystem exchange (NEE) and increased Bowen ratio, particularly on high VPD days. The UAV surveys indicated that trees in the CCF block tend to have higher canopy temperatures and lower Normalized Difference Vegetation Index (NDVI) than in the control block, implying their possible susceptibility to more extreme drought. The study confirms the expectation of stronger drought response in the denser stand and confirms the benefits of UAV remote sensing and sap flow measurement for tree drought stress detection.
- Article
(15949 KB) - Full-text XML
- BibTeX
- EndNote


Nearly 80 % of the forests in the Fennoscandia region are intensively managed (Högberg et al., 2021), with Norway spruce and Scots pine being the primary species (Brunner et al., 2024). Norway spruce cultivation is particularly widespread, owing to its superior productivity in comparison with other industrial tree species (Pretzsch, 2005). Boreal managed forests might benefit from the enhancement of tree growth in the region due to higher air temperature and CO2 concentration which is forecast for the coming decades (Danneyrolles et al., 2023; Wang et al., 2023), however, only if water availability is not a limiting factor in new conditions (e.g. D'Orangeville et al., 2018). The projections of more frequent droughts (Hammond et al., 2022; Ruosteenoja and Jylhä, 2021) make drought resistance of Norway spruce (Picea abies) a major field of inquiry (Zhao et al., 2022), especially due to the cascading effects of drought stress and biotic disturbances such as insect attacks (Venäläinen et al., 2020; Jactel et al., 2011; Kolb et al., 2016).
Strong droughts cause sharp decline of CO2 sink in Norway Spruce-dominated stands, as observed by the studies in Boreal and Hemiboreal Europe during the 2018 extreme drought (e.g. Lindroth et al., 2020; Krasnova et al., 2022; Mamkin et al., 2022). Norway spruce is an isohydric species, i.e. one strongly responding to VPD increases with stomatal closure, attempting to preserve leaf water potential at the expense of lower carbon uptake, in part due to its shallow root system (Bréda et al., 2006; Hartmann et al., 2013). This leads to suppressed photosynthesis and transpiration during drought (Ditmarová et al., 2010). VPD increase over the recent decades has decreased the growth of several Boreal tree species, and will become a stronger limiting factor in the future (Mirabel et al., 2023). Drought stress has been an increasingly important limiting factor for tree growth over the last decades (Čermák et al., 2019). Drought resilience and recovery of N. spruce are further lowered when droughts become recurrent (Schmied et al., 2023), so that the predicted increase in drought frequency (e.g. Beniston and Stephenson, 2004) will reduce the growth of Norway spruce (Zang et al., 2012). Drought resilience of Norway spruce growing on mineral soil is known to be generally low (e.g. Lévesque et al., 2014; Vitali et al., 2017; Schmied et al., 2023; Zang et al., 2012) and is expected to become an important constraining factor throwing into question the feasibility of its cultivation (Aldea et al., 2023); less in known about Norway spruce grown on peat soil. However, the exact strength of drought required to cause a pronounced physiological response by is currently not well understood for stands on either mineral or organic soils; moderate droughts may not produce a notable effect on trees (Zang et al., 2020), or the tree reactions may be multi-directional and uncorrelated with the known drivers (Schmied et al., 2023). When coincident with soil drought, VPD stress is more likely to lead to physiological damage (xylem tensions and embolism) (Tardieu and Simonneau, 1998). However, air drought itself can cause high hydraulic stress also in the absence of soil drought (Schönbeck et al., 2022). The summers in the region are frequently characterized by air drought, i.e. VPD exceeding a certain threshold that is commonly found to be at around 1 kPa (Oogathoo et al., 2020). In order to formalize the approach do drought as a factor of plant functioning, a meteorological classification of droughts into extreme, severe and moderate is commonly used, often defined using the Standardized Precipitation Evapotranspiration Index (SPEI) (e.g. Paulo et al., 2012). This parameter has an advantage of utilizing a minimal set of universally accessible measurements of precipitation, temperature and potential evapotranspiration, enabling contextualization of drought intensity at the study site within a broader region.
The exact timing and magnitude of drought response on a stand scale is typically rather uncertain because the individual trees experience and react to drought at different times. In mature trees xylem and phloem water storage can compensate the deficit of soil water for about a week, with longer times for larger trees (Čermák et al., 2007). However, large trees have been found to be either more resilient (Zweifel et al., 2001) or less resilient to drought (Pretzsch et al., 2018; Schmied et al., 2022) than small trees. Young non-dominant trees and understory have smaller internal water reserves, but also experience a more moist and shaded microclimate (Zang et al., 2012; Kimmins, 1987; Bréda et al., 2006), which grants a buffer against the drought. As a result, one can expect a lag of a few days in the onset of drought reactions (stomatal closure, reduction of photosynthesis and transpiration, drop in leaf potential) between the least and most resilient N. spruce trees in a stand. Moreover, these differences can also be exacerbated by the soil quality, stand structure (Schmied et al., 2022), nutrient supply and hydrology (Ovenden et al., 2021), which complicates the analysis of timing of physiologically relevant drought periods at the stand scale.
The effects of stand thinning on drought resilience are of particular interest in the context of continuous cover forestry (CCF) that has seen a number of trials in the Boreal regions over the recent years (Lehtonen et al., 2023). There is evidence of increased resilience for Scots pine (Giuggiola et al., 2013) and Norway spruce stands to drought after thinning (Sohn et al., 2013). Soil drought (low volumetric water content in the rooting zone) is not a frequent condition in the Boreal region, particularly in drained peatlands. It is generally expected that thinned stands have less inter-tree competition for soil water, particularly during a drought in both Norway spruce and Scots pine, as the trees do not collectively drain the soil water reserves, and, on the other hand, the dominant trees do not leave the rest without access to water (Laurent et al., 2003; Gebhardt et al., 2014; Friedrichs et al., 2009; Martín-Benito et al., 2010; Del Río et al., 2017).
UAV Remote sensing has recently provided a wealth of new information on Boreal forest ecology via airborne measurements of canopy reflectance, leaf temperature, and photogrammetric or Lidar-based digital elevation models (Alderfasi and Nielsen, 2001; Erdem et al., 2010; Berni et al., 2009; Gonzalez-Dugo et al., 2012; Smigaj et al., 2024; Manase et al., 2025; Ecke et al., 2022; Hyyppä et al., 2020). However, while stand structure of typical forests of central and Boreal Europe has been explored by remote sensing (Saarinen et al., 2018; Kopačková-Strnadová et al., 2021; Kuželka et al., 2020; Bennett et al., 2020), applications of UAV-based thermal remote sensing to tree drought stress are still rare – especially in the Boreal region. Few studies have so far attempted UAV-borne thermography for detecting tree physiological stress (Smigaj et al., 2024). These include the thermal assessment of drought stress in beech (Krause and Sanders, 2023), detection of the effect of pathogens on canopy temperature in Eucalyptus trees (Maes et al., 2018), Scots pine and Lodgepole pine (Smigaj et al., 2019) and Norway spruce (Junttila et al., 2017), mixed forest drought stress detection (Scherrer et al., 2011), thermographic assessment of drought resilience in an orchard of small black poplar (Ludovisi et al., 2017) and water-stressed apple tree identification (Gómez-Candón et al., 2016).
The main objective of this study was to compare the drought responses of two adjacent Norway spruce stands – a recently selection-harvested and an untreated control stand, on drained peatland soil in southern Finland. Drained Boreal peatland forests with contrasting management have not been previously monitored in drought conditions. The study was conducted during the non-drought year 2020, and during a long and intense drought period in 2021, which is likely representative of the future Boreal climate (Balting et al., 2021), which was also the year when a half of the site was selection-harvested. We hypothesized that the trees in the selection-harvested stand would show a contrasting behaviour compared to that of the in the unharvested control under drought, with more impaired functioning of the control block trees due to higher competition for water. Specifically, the harvest stand trees are expected to outperform those in the control in both the stem growth and evapotranspiration.
The previous studies present a combined picture of divergent and often unpredictable drought responses of Boreal forests, which serves as another premise for the current work. Therefore, the second objective consists of cross-testing the drought indicators across the multitude of existing methodologies operating at different temporal and spatial scales, taking advantage of the diverse set of monitoring data available at the Ränskälänkorpi peatland forest site. This experiment utilized the standard ecosystem carbon, water and energy balance monitoring (eddy-covariance CO2 and H2O fluxes, surface energy balance, sap-flow sensors) supplemented by soil water monitoring and UAV-based orthomosaics of canopy temperature and NDVI, which have not been combined in a single study before. It should be noted that a joint thermal and multispectral assessment of Boreal stand ecophysiology has not been attempted before either. Based on the available data, we conducted an overview of how the drought progresses and trees respond in such an ecosystem, and compare the merits of different methods for observing drought stress of individual trees and tree stands, aiming to identify the most efficient approach.
2.1 Site description
The study site is a managed fertile peatland forest Ränskälänkorpi situated north of Lahti, southern Finland (61°11′ N, 25°16′ E) (Laurila et al., 2021). The site was nutrient rich forested mire before drainage conducted prior to 1960s. Additional ditches were made in the spring of 2019. Since at least 1960s and likely from an earlier date, the site developed a mixed stand consisting chiefly of Norway spruce (Picea abies), with smaller numbers of Scots pine (Pinus sylvestris) and pubescent birch (Betula pubescens). The oldest tree on the site whose age was measured is a 96 years old Norway spruce, implying the existence of a tree cover already in the 1920s. In a 2020, a manual inventory of 1712 trees was conducted, revealing that the dominant trees with the heights of over 15 m consisted of Norway spruce (73 %), downy birch (15 %), Scots pine (12 %) and a few other species. Martínez-García et al. (2026) provide the species-specific contribution to basal area. The species were distributed evenly across the site. As the stand is Norway spruce-dominated, we focus on spruce responses at tree scale.
At the commencement of eddy-covariance (EC) and environmental measurements (winter 2019/2020), the study site represented a rather homogeneous stand (Fig. 1a). Next winter (March 2021), the stand was divided into two blocks following the main forest tracks and ditches, and the western block was selectively harvested following the practice of Continuous Cover Forestry (CCF, Fig. 1b). The two blocks will be referred to as Control and Harvest in the following. The selection harvest led to removal of 55 % of the trees over 15 m in height and reduced the projected canopy cover from 60 % to 22 % in Harvest block (Appendix A for details on tree canopy detection in UAV maps before and after the harvest). One-sided leaf-area index (LAI) was estimated after Härkönen et al. (2015) and Tupek et al. (2015), and was found to be 2 m2 m−2 in Harvest (2021, post-CCF harvest) and 3 m2 m−2 in Control.
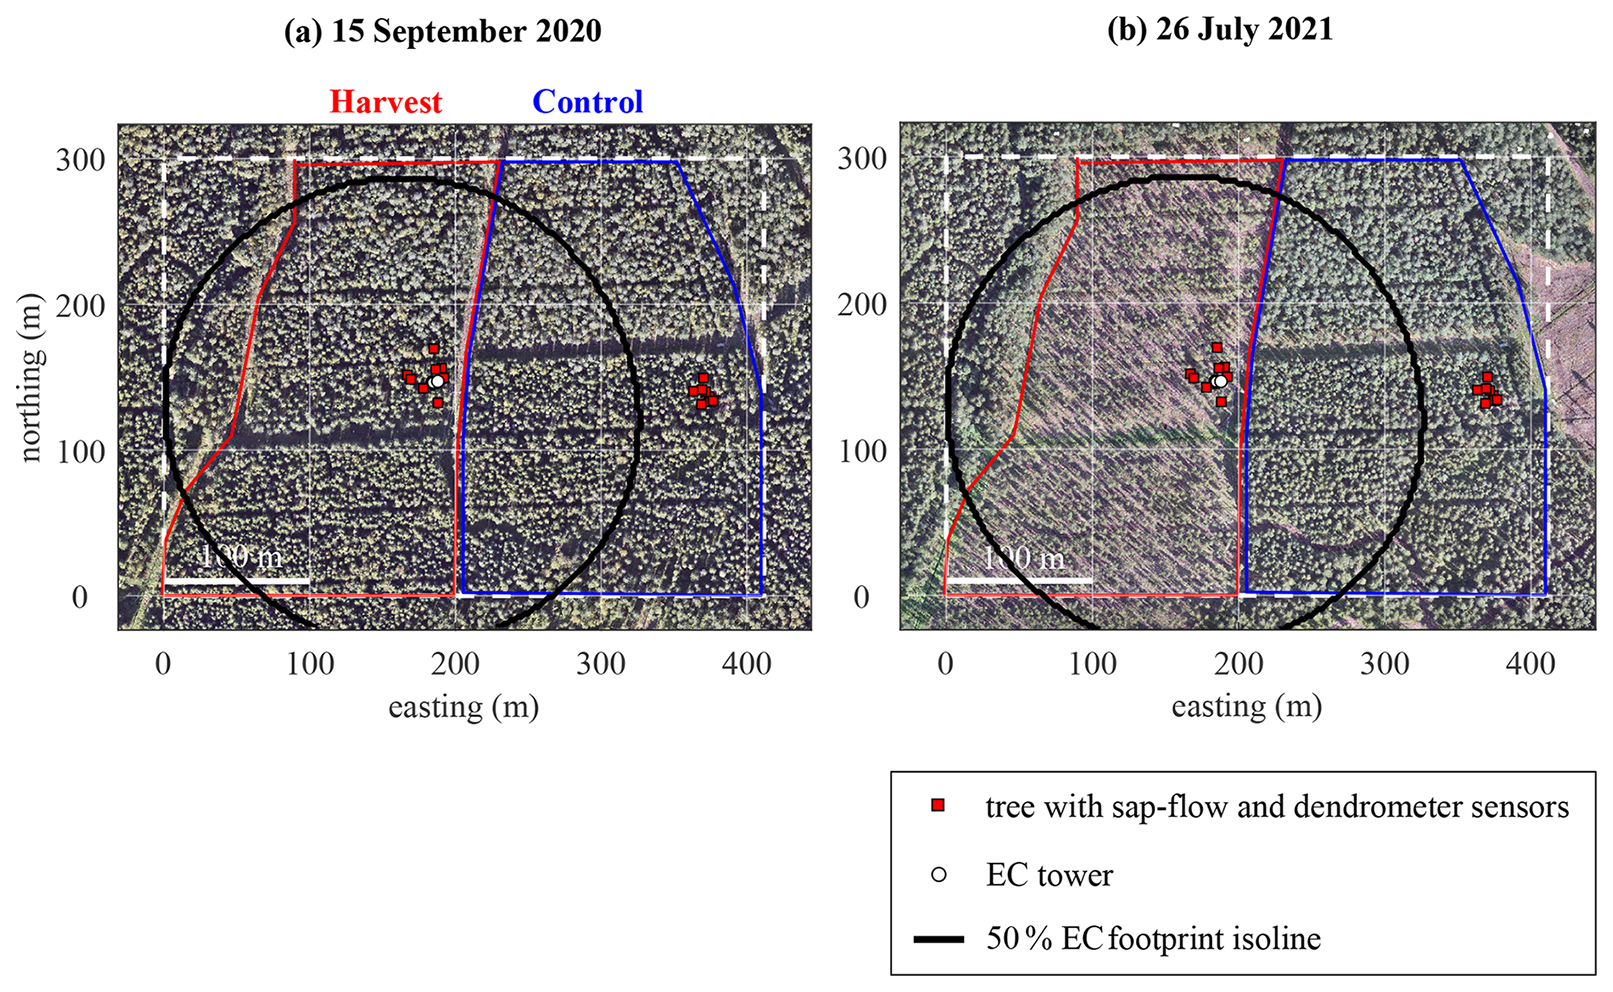
Figure 1UAV RGB orthophotos of the Ränskälänkorpi site before (a) and after the selection harvest (b). The primary study area of 300 × 400 m is shown with a white box. The ditches and the forest tracks can be clearly seen as N–S and W–E lines. The eddy-covariance tower is marked with a white square near the center of the mapped region. The trees equipped with sap flow sensors and dendrometers are shown with red squares. The boundaries of the Harvest and Control blocks are marked with red and blue lines, respectively. The 50 % eddy-covariance source area is shown with a black line.
2.2 Field measurement setup
2.2.1 Eddy-covariance flux measurements, gap-filling and CO2 flux partitioning
The EC setup is mounted at a height of 29 m on a telescopic mast on the border between the selection harvested and non-harvested blocks (61°10.973′ N 25°15.761′ E). The system consists of a sonic anemometer Metek uSonic-3 and a CO2, H2O gas analyzer LI-COR LI-7200RS. The raw data were post-processed using the in-house software developed by the Finnish Meteorological Institute (FMI), following the standard practices of raw data quality control and corrections (Aubinet et al., 2012) and the quality control of the 30 min average fluxes. The EC data in this study cover the years 2020 and 2021, without long gaps except for 26 July–30 August 2021, when the LI-7200RS filter was clogged. For the particulars on the EC measurements and processing, see Laurila et al. (2021).
Given the position of the EC tower between the two treatments, it was necessary to separate the 30-min flux values based on wind direction. The data were considered to represent the control plot at 20° < WD < 160°, and the harvest plot at 180° < WD < 360°.
Since the EC data were intended to be used solely as an indicator of drought/heat wave effect on ecosystem functions, a robust modeling and gap-filling method was formulated with the purpose of obtaining time series of light-saturated ecosystem photosynthesis rate (Pmax). The EC NEE is gap-filled by the sum of models of ecosystem respiration (Re) and photosynthesis (gross primary productivity, GPP). Nighttime Re was observed to increase exponentially at temperature range °C and become invariant of air temperature at higher Ta, and is therefore modeled using a conditional function,
where Reref=7.52 µmol CO2 m−2 s−1 and Q10=4.4. The apparent Q10 value is slightly lower than 4.9 estimated for Norway spruce stand ecosystem respiration by Wallin et al. (2001). GPP is calculated for daytime (photosynthetically active radiation PAR >50 µmol m−2 s−1) as the residual of measured EC CO2 flux and Re, and modeled as a function of PAR in two steps. In the first step, a Michaelis-Menthen function
was fit to all GPP vs. PAR data of the growing season (May–September) in order to calculate the fixed value of the parameter k=340 µmol m−2 s−1. Then, Eq. (2) was re-fitted to GPP vs. PAR data of each day separately so that to obtain the daily Pmax values while k is kept constant. The variability of daily NEE and maximum photosynthesis rate Pmax are used as proxies of an ecosystem reaction to drought.
The EC footprint was estimated using the model of Kljun et al. (2015) following Alekseychik et al. (2021). The footprint model of Kljun et al. (2015) was solved in Matlab for each 30 min time step on a 2 × 2 m grid. The individual tree contributions to exchange were calculated by interpolating the georeferenced 30 min average EC footprints for the locations of the trees derived from UAV data. However, such an interpolation procedure results in a reduced footprint integral due to the number of trees being smaller than the number of nodes in the original 2 × 2 m footprint grid. Therefore, to preserve the integral footprint value, each individual tree footprint contribution was scaled so that to make the sum of the individual tree contributions equal to the footprint integral value outputted by the Kljun et al. (2015) code. According to this footprint calculation, the Control and Harvest blocks contributed typically 50 %–60 % to the EC fluxes on individual days in the growing season. The rest of the EC flux was contributed by areas beyond study site, which are represented mainly by un-harvested spruce-dominated stands of varied age, except the clearcut in the eastern sector that is partly seen in the UAV maps (Fig. 1). See Appendix B for the extent of footprint and the estimation of individual tree contributions (footprint climatology).
2.2.2 Meteorological and soil environmental conditions
Meteorological parameters were measured at the top of the 29 m EC tower and at ground level within 10 m of the EC tower. At the top of the mast, a radiation sensor CNR4 (Kipp & Zonen B.V., Delft, the Netherlands) was used to record the radiation balance components, from which the net radiation (Rn) was calculated. Upward- and downward-facing PQS radiometers (Kipp & Zonen B.V., Delft, the Netherlands) produced the up-and downwelling photosynthetically active radiation (PAR); air temperature and humidity were measured by HMP155 sensor (Vaisala Oyj, Vantaa Finland). Air temperature and humidity were measured within 10 m from the EC tower by IKES Pt100 (Nokeval Oy, Nokia, Finland) and a HMP155 sensors (Vaisala), respectively, inside a radiation shield at 2 m a.g.l. Peat temperatures at the depths of 5 was measured by IKES Pt100 sensors (Nokeval) and volumetric soil moisture at the depth of 5 cm by ML3 ThetaProbe (Delta-T Devices Ltd., Cambridge, UK) These parameters were collected QML201C (Vaisala) data collection board. Water table depth (WTD) was measured by Odyssey sensors (Data Flow Systems Ltd, New Zealand) in two locations in the Control block and three locations in the Harvest block; block-average WTD was used in the analysis. Precipitation was measured with a weighing rain gauge (Pluvio2, OTT HydroMet GmbH, Kempten, Germany).
2.2.3 Sap flow and stem diameter change sensors
In total, 16 spruce trees (see Appendix E) were monitored with sap flow and stem diameter sensors since June 2020 in the harvest and control blocks (8 trees in each) (Peltoniemi, 2023, 2025; Liu et al., 2025).
The Edaphic HPV-06 sensors were installed at a height of 1.3 m on the southern side of the trees (Laurila et al., 2021), outputting the sap flow rate in the units of [L h−1]. The sap flow data cover the years 2020–2021 with few gaps; however, tree No. 5 (Control block) had to be discarded due to poor data quality. Two stem diameter sensors Solartron AX-5 were installed in June 2020 in each tree monitored for sap flow, one above the phloem and one above the xylem.
2.2.4 UAV flights and data processing
Spatially resolved data on individual tree parameters, including tree height, canopy area, tree canopy center coordinates, canopy temperature and colour (in RGB, NIR and Red Edge bands) were derived from imagery collected by UAV. The RGB and NIR imagery was used to calculate NDVI, whereas leaf stomatal resistance was estimated from tree canopy temperature. The UAV used to collect the remote sensing data was DJI Matrice 210 V2 with a payload of either DJI a Zenmuse XT2 thermal/RGB camera or a Micasense Altum multispectral camera.
The flights took place on four clear days (Table 1). Special ground control point (GCP) targets were designed to be easily discernible in the RGB, multispectral and thermal images alike. These were constructed as aluminum or polished steel crosses 1 m in width with a smaller cross of black duct tape marking the center. A total of 15 GCPs were used, spread evenly throughout the UAV survey zone of 20 ha.
Table 1The summary of UAV flights. GSD – ground sample distance of the orthomosaics.
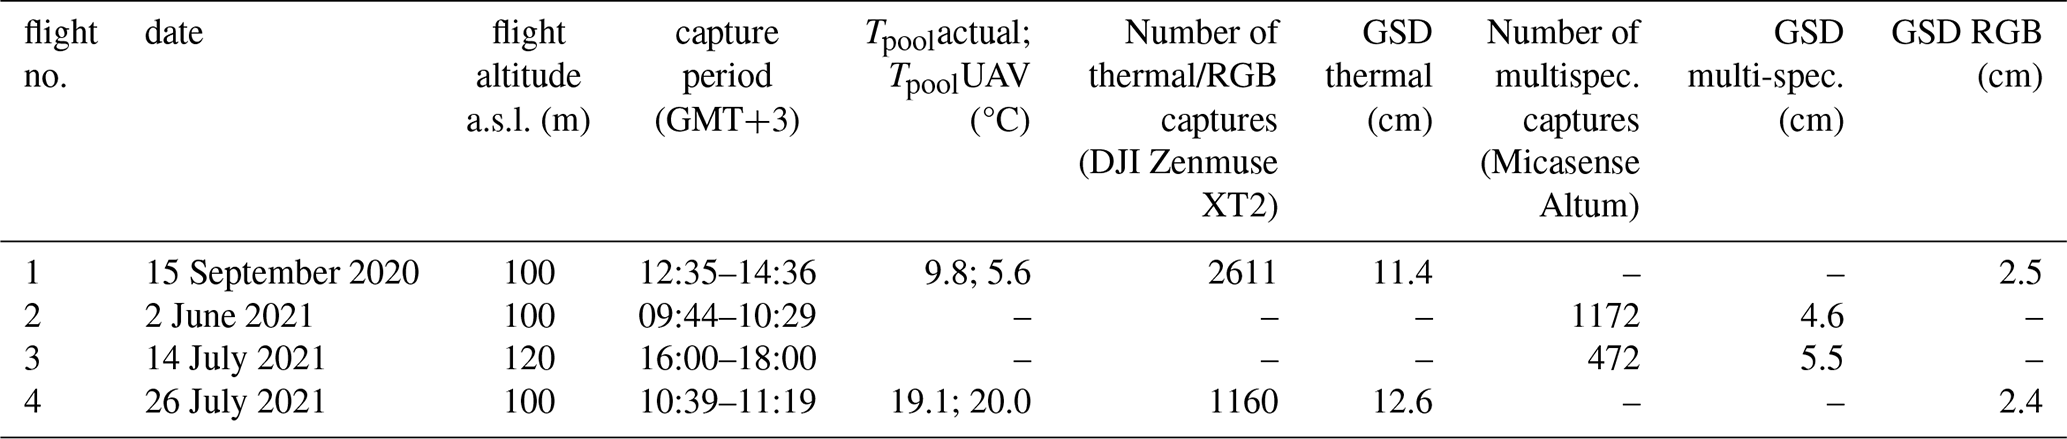
The mosaicking of RGB, thermal and multispectral images was performed in Agisoft Metashape®. The UAV multispectral and RGB data were retrieved and processed following the standard methods (Barbedo, 2019; Tmušić et al., 2020), yielding RGB and multispectral orthomosaics, 3D point clouds, and digital elevation models (DEM). The resolution (ground sample distance) of the final orthomosaics is given in Table 1. The processed UAV orthomosaics are shown in Appendix F.
Thermal images were retrieved by UAV in programmed flights on 15 September 2020 and 26 July 2021, ensuring side and frontal image overlap of over 80 %. A thermal emissivity value of 0.98 was used. The thermal images were processed in Agisoft Metashape®, in which the more detailed RGB point cloud was used in order to achieve better quality in the thermal orthomosaic. The ground sample distance (GSD) of the processed thermal orthomosaic was about 11.4–12.6 cm. The individual tree canopies were identified in the 2020 and 2021 RGB orthomosaics using a custom segmentation algorithm. The values of RGB, NIR and Red Edge bands and canopy temperature were averaged for the areas of the tree canopies for further processing. For details on UAV imagery processing, see Appendix C. The canopy temperature bias related to inter-tree differences in the incident solar radiation at the time of UAV survey was removed using a canopy brightness-based approach (Appendix G).
2.3 Drought and vegetation indices
2.3.1 Meteorological drought assessment
The Standardized Precipitation-Evapotranspiration index (SPEI) (Vicente-Serrano et al., 2010) was employed as a regional-scale indicator of climatological drought. A long-term time series of SPEI (1980–2021) was calculated for whole territory of Finland as follows. Daily weather data (Finnish Meteorological institute) was used as an input to SpaFHy model (Launiainen et al., 2019) to calculate the effective precipitation at the ground (liquid precipitation and snow melt) and evapotranspiration assuming LAI of 3 m2 m−2 and mesic soil properties (Table 2 in Launiainen et al., 2022). Finally, SPEI on a 1-month timescale was calculated with the climate_indices Python® package (Adams, 2017) using the effective precipitation and evapotranspiration. The spatial resolution of the resulting SPEI dataset is 10 × 10 km. Monthly SPEI values for May-September of 2020 and 2021, shown in Fig. 2, were retrieved for the Ränskälänkorpi site coordinates.
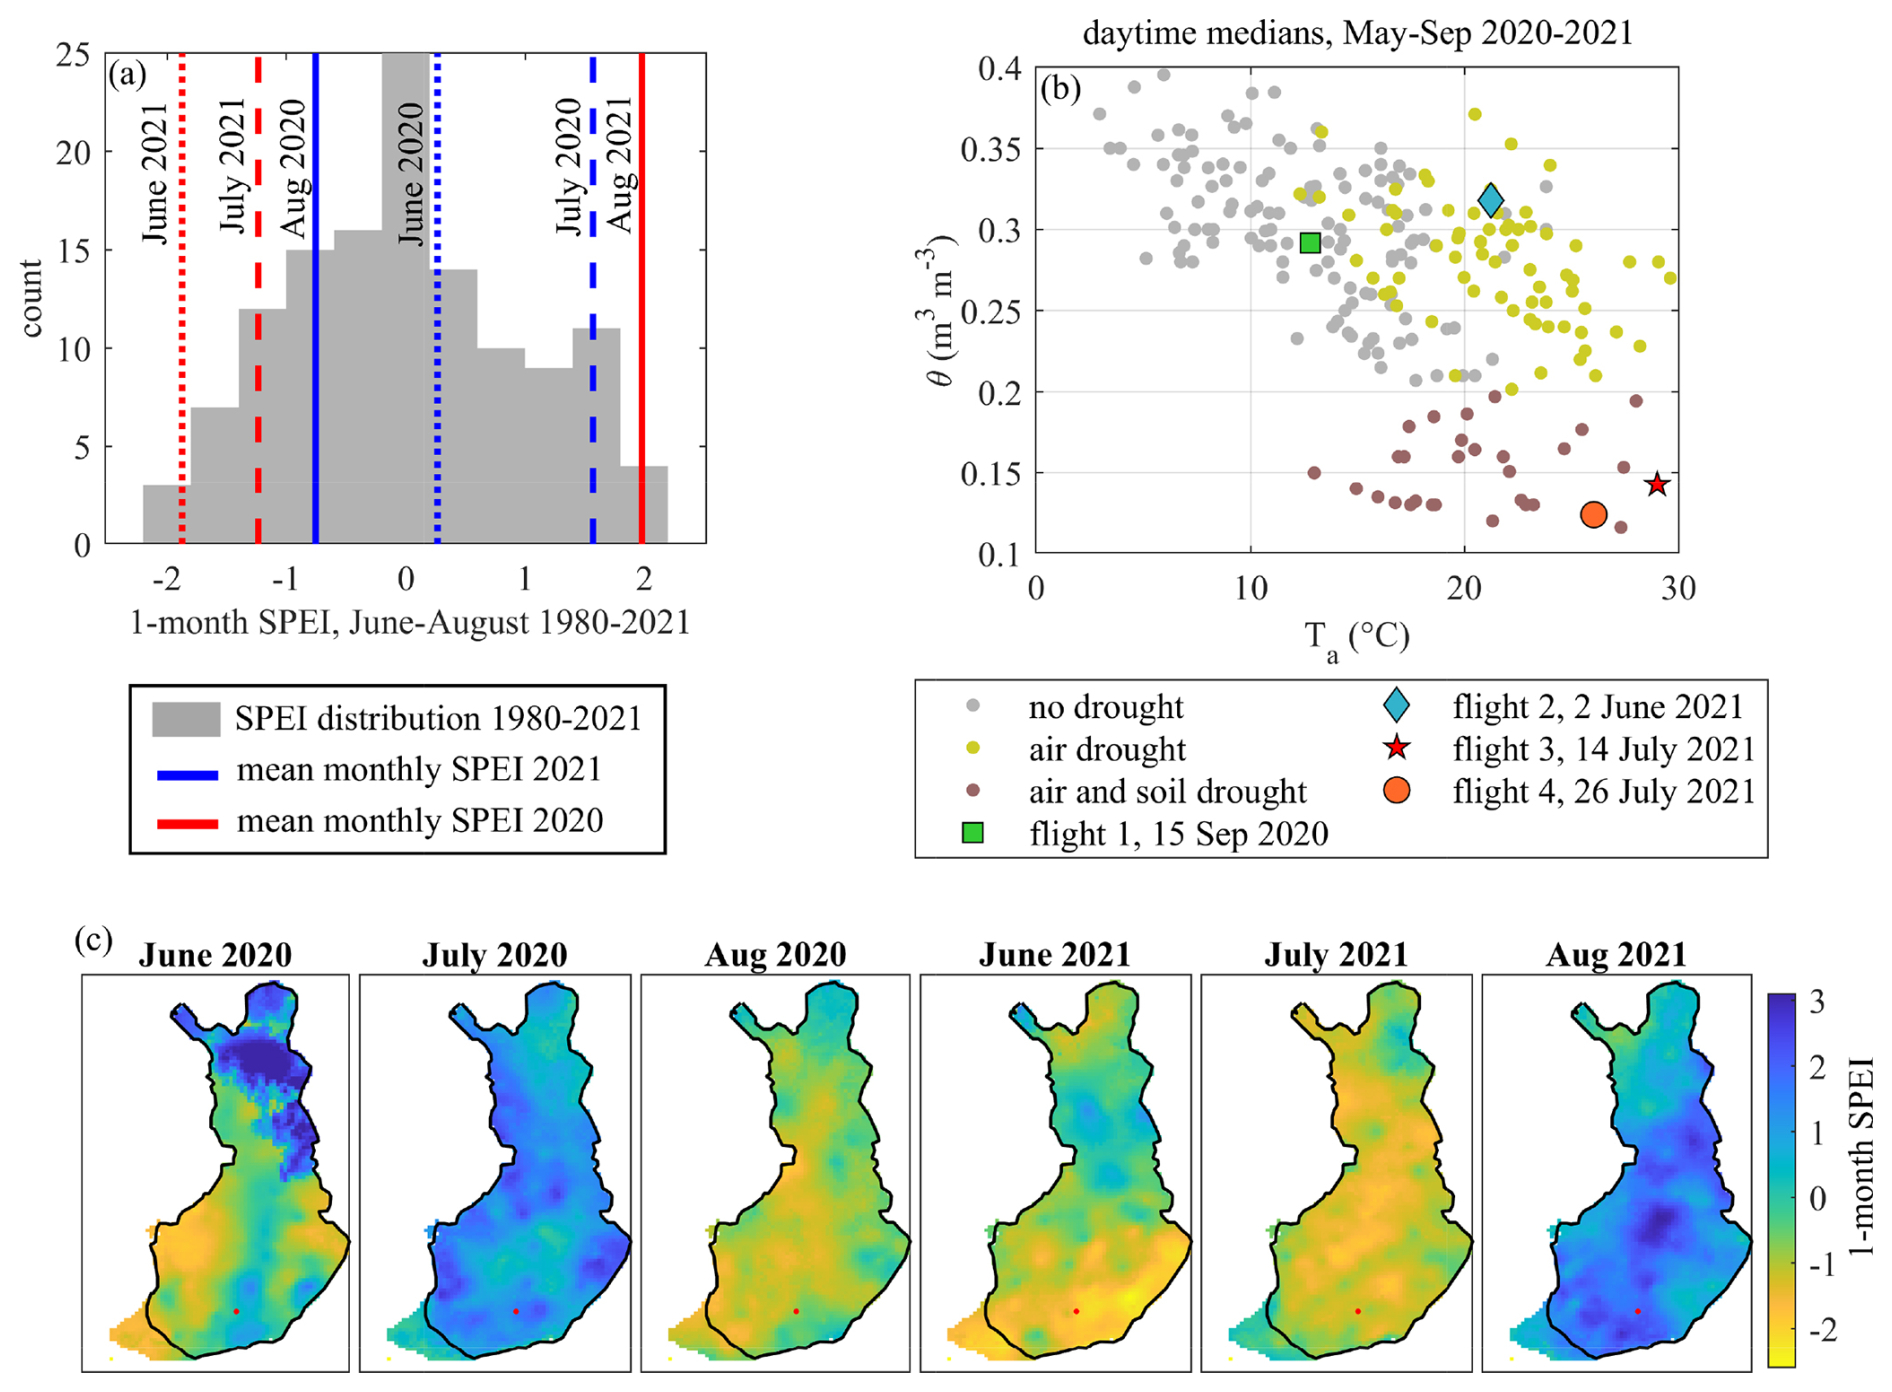
Figure 2Meteorological characteristics of the 2020–2021 growing seasons (May–September) at the Ränskälänkorpi site. (a) Monthly SPEI drought index for the summer months of 2020 and 2021 for the location of Ränskälänkorpi site, with the 40-year distribution of monthly SPEI values for June–August shown with grey shading; the mean SPEI for the individual summer months in 2020 and 2021 is shown with blue and red lines, respectively; (b) daytime median soil moisture at 5 cm depth in the Harvest block versus air temperature; the UAV flight days are marked with special symbols; (c) monthly SPEI spatial distribution over the territory of Finland; the location of the Ränskälänkorpi site is marked with a red dot. Negative SPEI values indicate dry conditions.
The drought conditions occurring locally at the research site were assessed separately as atmospheric and soil drought, as it was expected that these conditions might show independent effects on the plants. The soil moisture threshold marking the initiation of drought stress in central and northern European conifer forest varies widely in previous literature as much as the definition of the drought stress itself: 0.15 (Galiano et al., 2017), 0.2 (Arend et al., 2021), 0.45 (Kowalska et al., 2020), 0.10–0.13 (Střelcová et al., 2013), and 0.09 m3 m−3 (Clausnitzer et al., 2011). The variation in the reported critical SWC values is once again due to the contrasting definitions of drought stress and the particular site conditions and experimental setup; it is also important to note that the above values were reported for mineral soil stands. In the present study, soil drought was defined as surface soil water content (θ5 cm) below 0.2 m3 m−3, as the values marking the onset of the driest period in July 2021. This value is slightly above typical wilting point of surface peat in drained forest peatlands (Menberu et al., 2021). The air drought was defined on a daily basis as daily mean atmospheric vapor pressure deficit (VPD) exceeding 1 kPa, which similarly marks high VPD stress for Boreal ecosystems (McGloin et al., 2019; Jia et al., 2016; Lasslop et al., 2010). The following analyses consider the presence of air and soil drought defined above, separately or in combination.
2.3.2 Ecosystem-average ecophysiological drought proxies
Several quantities indicative of ecosystem reaction to drought were calculated from meteorological and EC data. By virtue of using the eddy-covariance fluxes and turbulence parameters, the below proxies are representative of stand-scale drought response (one should be mindful of the EC footprint shown in Appendix B). The Bowen ratio (BR, [–]) was calculated as the median ratio of sensible (H) to latent heat (LE) flux of the daytime hours (09:00–17:00 GMT+3).
High values of Bowen ratio indicate a relative deficit of evapotranspiration, thus pointing at drought stress in vegetation.
The aerodynamic resistance to water vapour transport ra [s m−1] was calculated after Verma (1989),
where U is the mean wind speed above the canopy, u∗ the friction velocity, κB−1 the logarithm of the ratio between momentum and heat roughness length (Owen and Thomson, 1963), assumed to equal 2, and κ the von Kármán's constant (=0.4).
Surface resistance to water vapour transport calculated from eddy-covariance and atmospheric data (rs, EC [s m−1]) was defined after Thom et al. (1975) as:
where ρ the air density [kg m−3], Rn the net radiation [W m−2], ζ the slope of the saturation vapour pressure curve [kPa K−1], and Cp the specific heat of air at constant pressure [J kg−1 K−1]. Surface conductance gs, EC [mm s−1] was calculated as a reciprocal of rs,EC. Canopy water stress index (CWSI, [–]) was computed after Jackson et al. (1981),
where γ is the psychrometric constant [kPa K−1].
Daily ecosystem water-use efficiency WUE [gC kg−1] was defined using the daily integrals of GPP [g C m−2 d−1] and ET [mm d−1]:
while the ecosystem light use efficiency (LUE, [–]) was obtained as the daily integrals of GPP and PAR:
Penman-Monteith potential evapotranspiration was calculated using the standard expression (Monteith, 1965):
Where Rn is the net radiation and Λ the latent heat of vaporization.
2.3.3 Upscaled sap flow and tree-level stomatal conductance
Tree-level stomatal conductance gs, sap [L h−1 m−2 kPa−1] was derived by normalizing the measured sap-flow of a tree (s) [L h−1] by sapwood area (Asap) [m2] and VPD for the current 15 min averaging period [kPa] (Oren et al., 1999; Köstner et al., 1992):
Along with the stem diameter change (Sect. 2.2.3), this quantity, for individual trees, or averaged for the control and harvest blocks, provides the most direct insight into tree functioning. However, it represents only a few trees that have the sensors, and is thus very local. In order to enable comparison with EC-based proxies, the recorded sap flow was upscaled to the plot and EC footprint scales based on the relationship between instantaneous sap flow rate and tree height (Appendix E). Tree height was chosen as the predictor of sap flow as this structural property is most readily derivable from a UAV digital elevation model (DEM).
2.3.4 UAV temperature-based stomatal conductance
Remote sensing at high resolutions achievable by UAV combines the benefits of single-tree representativeness and stand-scale coverage. A novel method for tree physiological stress estimation based on UAV thermal imaging was developed by adapting an approach designed originally for the use in greenhouses and laboratory experiments (Jones, 1992; Leinonen et al., 2006; Guilioni et al., 2008) to open forest canopy conditions. In the following, the subscript can denotes the vegetation index values averaged for the projected area of an individual tree crown. In the case of isolateral leaves and using both wet and dry leaf references, the surface temperature-based stomatal resistance can be defined as (Guilioni et al., 2008):
where Tcan is the tree crown temperature, Tw the wet reference temperature, Td the dry reference temperature and ra, w the boundary layer resistance to water vapour transfer [s m−1], estimated as (Verma 1989):
In Eq. (11), rH, R is the parallel resistance to heat (rH) and radiative transfer (rR):
The individual tree surface conductance is then calculated as an inverse of the resistance .
The dry and wet references were constructed as two piles of spruce branches with the areas of 1 m2 and up to ca. 30 cm high, lying on a frame raised 70 cm above ground on four wooden poles. Mounting the branch piles on a raised frame was intended to mimic the forest canopy by enabling better aeration of the branch piles from the bottom and thus creating a closer imitation of aerodynamic resistance to water vapor transport in a real canopy. The wet and dry references were captured by the UAV thermal camera from a ca. 40 m altitude a.g.l. just before the start of the planned flight. The references were in direct sunlight. Immediately before being captured, one of the branch piles was sprayed with 15 L of water from a watering can, which is therefore equivalent to 15 mm of rainfall. The dry and wet reference temperatures Td and Tw were obtained as the mean radiometric temperatures of the two piles. Appendix D details the arrangement of the dry and wet references and the water pool (providing the reference temperature) for the correction of the mean surface temperature in the UAV thermal orthomosaic.
3.1 Meteorological evidence of drought
The available dataset covered two years, 2020–2021, with widely different SPEI values in the summer months (Fig. 2a). The year 2020 was characterized by a warm summer without soil moisture deficit, while 2021 was marked with a hot summer that led to a substantial drop in WTD and soil moisture (Fig. 3g, h). Based on the classifications of McKee et al. (1993) and Paulo et al. (2012), one may interpret SPEI >0.5 as non-drought, SPEI as mild drought, SPEI as moderate drought, SPEI as severe drought, and extreme drought as SPEI . Accordingly, the summer of 2020 at Ränskälänkorpi site can be described as drought-free in terms of SPEI (Fig. 2a), the monthly SPEI values ranging from −0.75 to 1.5. The following year 2021 showed more extreme weather, with very dry June and July August (monthly SPEI and 1.24, respectively) that were followed by a wet August (SPEI =1.98). The occurrence of dry and wet conditions in specific months varies strongly across Finland due to rainfall patterns (Fig. 2c); note that the monthly SPEI value at the study site (red dot) is also generally representative of the situation in southern Finland.
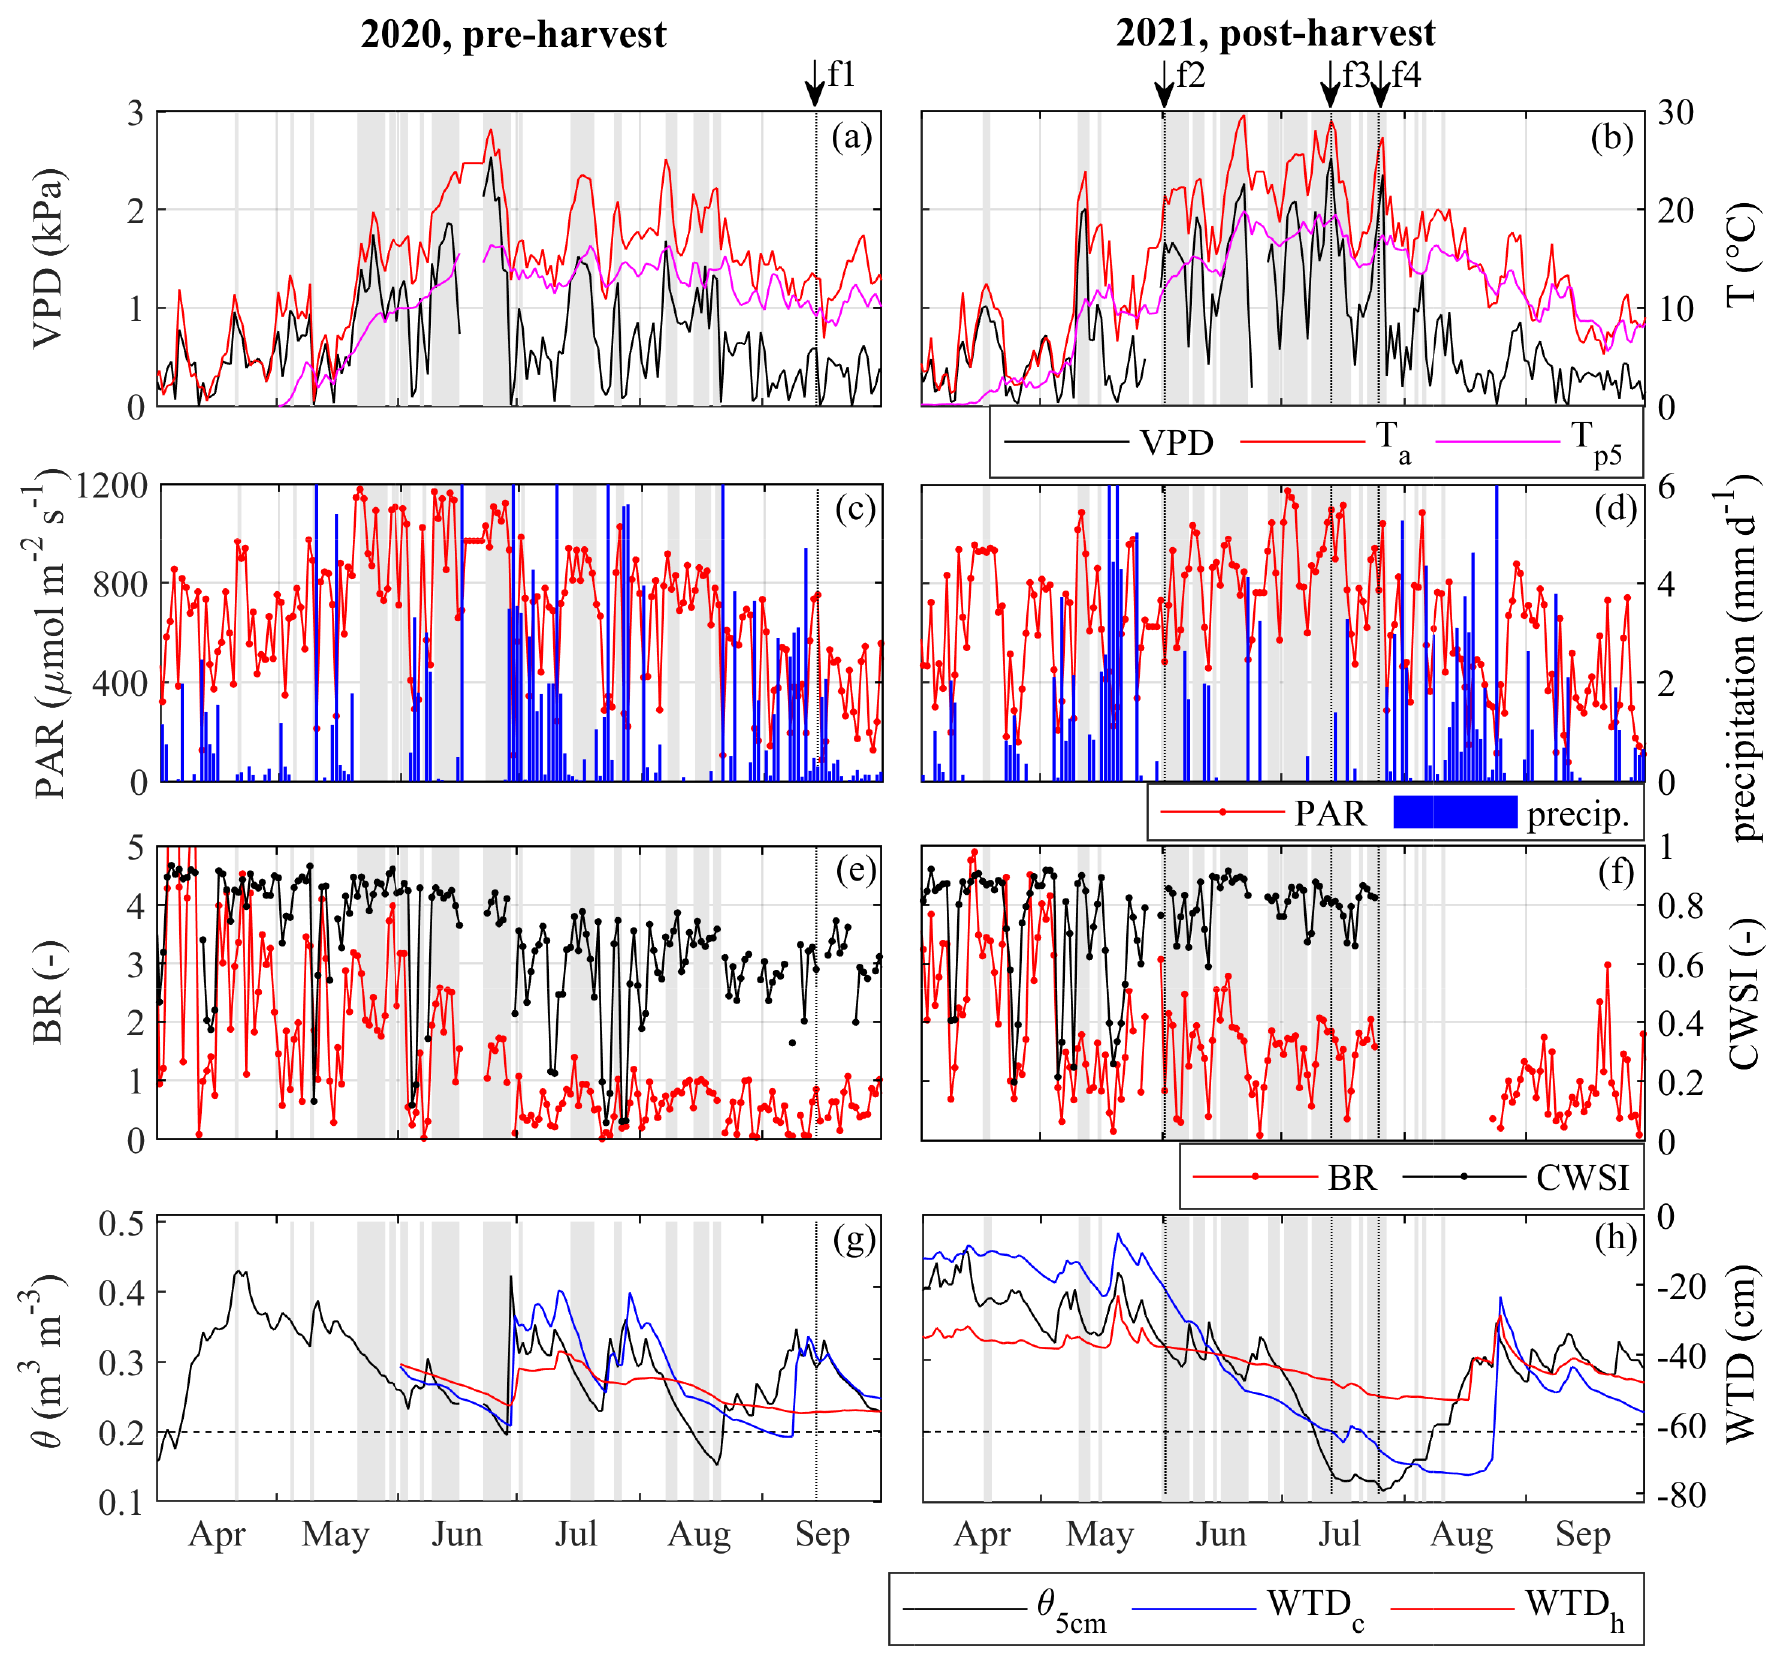
Figure 3Daily average meteorological and soil variables. (a, b) Daytime VPD, air temperature (Ta) and 5 cm soil temperature (Tp5); the grey shading here and in the following figures corresponds to days with mean VPD > 1 kPa; (c, d) photosynthetically active radiation (PAR) and precipitation; (e, f) Bowen Ratio (BR) and Canopy Water Stress Index (CWSI); (g, h) soil moisture θ5 cm at 5 cm depth and water table depth (WTD; the subscripts c and h stand for Control and Harvest sectors, respectively). The threshold value of θ5 cm=0.2 defining soil drought is marked with a dotted line in (g, h). The arrows indicate the dates of the four UAV flights. The CCF harvesting was done in the early 2021, before the period shown.
Seasonal and synoptic scale weather changes can be seen as broad ranges of daily median soil moisture and air temperature (Fig. 2b). Defined using the VPD and θ threshold (Sect. 2.3.1), the days are marked as “no drought”, “air drought” and “soil and air drought”. The three classes of days form distinct clusters, and the UAV flights occurred on the days representing this range of environmental conditions (see the markers in Fig. 2b). VPD over 1 kPa occurred at median daily temperature as low as 12.5 °C, which is not uncommon for spring weather in the region. However, the hottest days with median daytime Ta approaching 30 °C coincided with either low or high soil moisture content (observed range 0.12–0.37 m3m−3). Therefore, the studied forest was exposed to a range of atmospheric and soil drought conditions and their combinations during the two growing seasons.
A top soil water content sensor (in the Harvest block) indicated a steep drop in the −5 cm water content during the hottest part of the 2021 drought, in late June–early July (Fig. 3). The difference between the temporal courses in WTD and θ implies hydraulic decoupling between topsoil and the deeper horizons when WTD is below a certain level; this phenomenon further complicates the assessment of drought drivers and challenges the very definition of drought.
The summer of 2020 started with rather hot and dry spell in May and June (Fig. 3a), which was brought to an end by strong rainfalls, which continued in the first half of July (Fig. 3c). Relatively wet and cool weather persisted for the rest of the summer. In contrast, 2021 received ample rainfall (48 mm) in May (Fig. 3d), after which ensued a hot and rainless period that lasted until the very end of July. August was another rainy month, with 55 mm of precipitation. We thus consider June and July 2021 to be a period of extreme drought. Persistence of such conditions led to a large drop in WTD and θ5 cm, particularly in July (Fig. 3h), corresponding to low SPEI (−1.24) indicating drought in that month (Fig. 2f, g). Of note is the WTD relation between the two blocks: WTD was higher in Control during the wet periods of 2020, but lower during the drought of 2021 (Fig. 3g, h). The summer of 2021 was also generally sunnier than that of 2020 (Fig. 3c, d). The seasonal water level decline was much steeper in Control than Harvest, which is probably due to water use by a larger number of trees remaining in Control, compared with the low-tree density CCF state of the Harvest block. It should be noted that air drought (VPD >1 kPA) was frequent, in both 2020 and 2021, which is important in view of conservative stomatal closure dynamics of Norway spruce. During such periods, Bowen ratio and canopy water stress index remained high, with downward spikes on the rainy days (Fig. 3e, f). The Bowen ratio and CWSI were approximately twice higher in June–July 2021 than in the corresponding period of 2020, with less pronounced but similar differences in canopy water stress index, which could be a result of both the smaller number of trees in the post-harvest year 2021 and the lower WTD in the summer of 2021. The mean BR was about 3 in July 2020 and 4 in July 2021, corresponding to severe drought in line with the observations for boreal forest by Launiainen (2010) and McGloin et al. (2019). The meteorological data-based CWSI (Eq. 6) shows the difference between 2020–2021 equivalent to that observed in BR, with the mean CWSI values being 1–4 in July 2020 and about 0.8 in July 2021. Seidel et al. (2016) observed CWSI of about 0.6 at no-drought conditions and about 0.8 at drought conditions in Scots pine seedlings.
3.2 Eddy-covariance CO2 fluxes, WUE and LUE under drought
The growing season (April–September) NEE, GPP and Re (Fig. 4a, b) illustrate two major points. Firstly, there is an apparent drop in the absolute values of NEE and its component fluxes Re and GPP in 2021 compared to 2020, which reflects the effect of selection harvesting (see also Fig. 5). This reduction in CO2 exchange rates is also apparent in the reference respiration rate (Reref) and ecosystem photosynthetic capacity (Pmax, Fig. 4c–f), and in the light use efficiency (Fig. 4g–j). The same dynamic is seen in the ET (Fig. 4k–l).
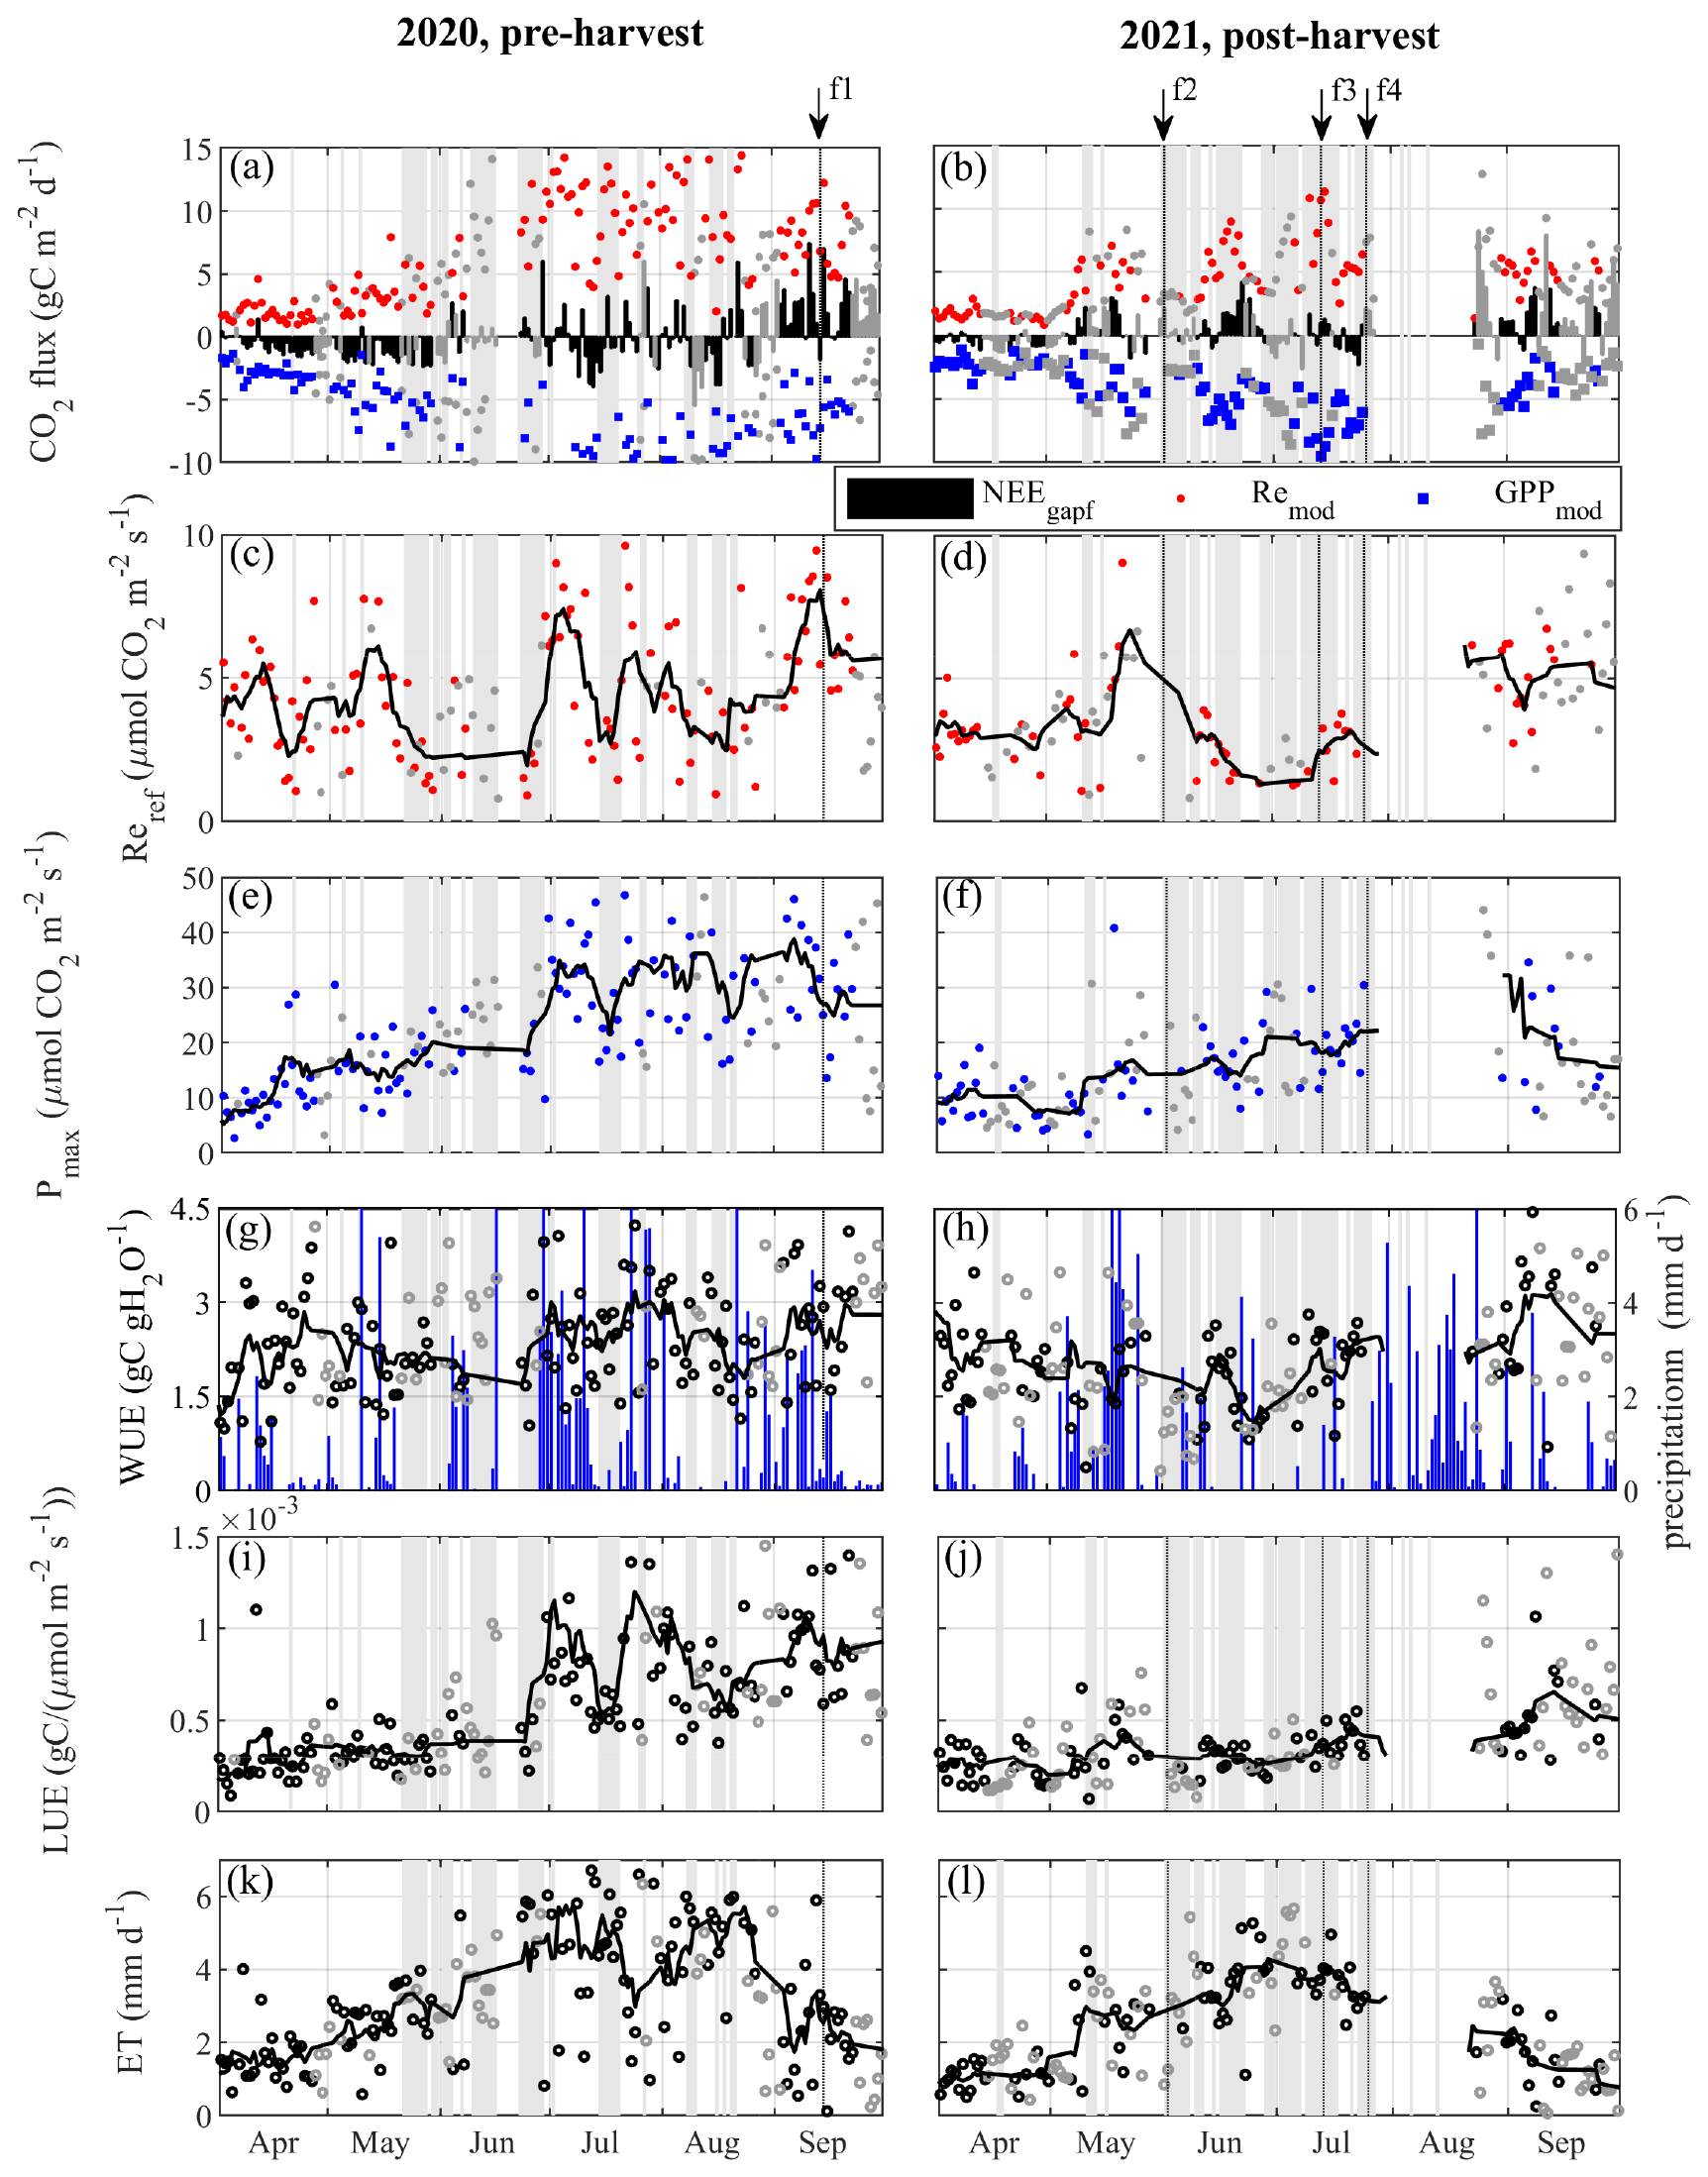
Figure 4Time series of eddy-covariance derived fluxes in April–September of 2020 and 2021. (a, b) daily NEE, Re and GPP; (c, d) reference respiration (Reref); (e, f) light-saturated photosynthesis Pmax; (g, h) water use efficiency (WUE); (i, j) light use efficiency (LUE); (k, l) daily median eddy-covariance evapotranspiration (ET). The UAV flights are marked with arrows f1–f4. The shading is for the periods of VPD > 1 kPa. The coloured markers (a–f) and black markers (g–j) show the days of easterly wind (from the Harvest block), while the grey markers correspond to easterly winds (from the Control block). The smoothing averages (black bold lines) are calculated only using the days with the winds from the direction of the Harvest block.
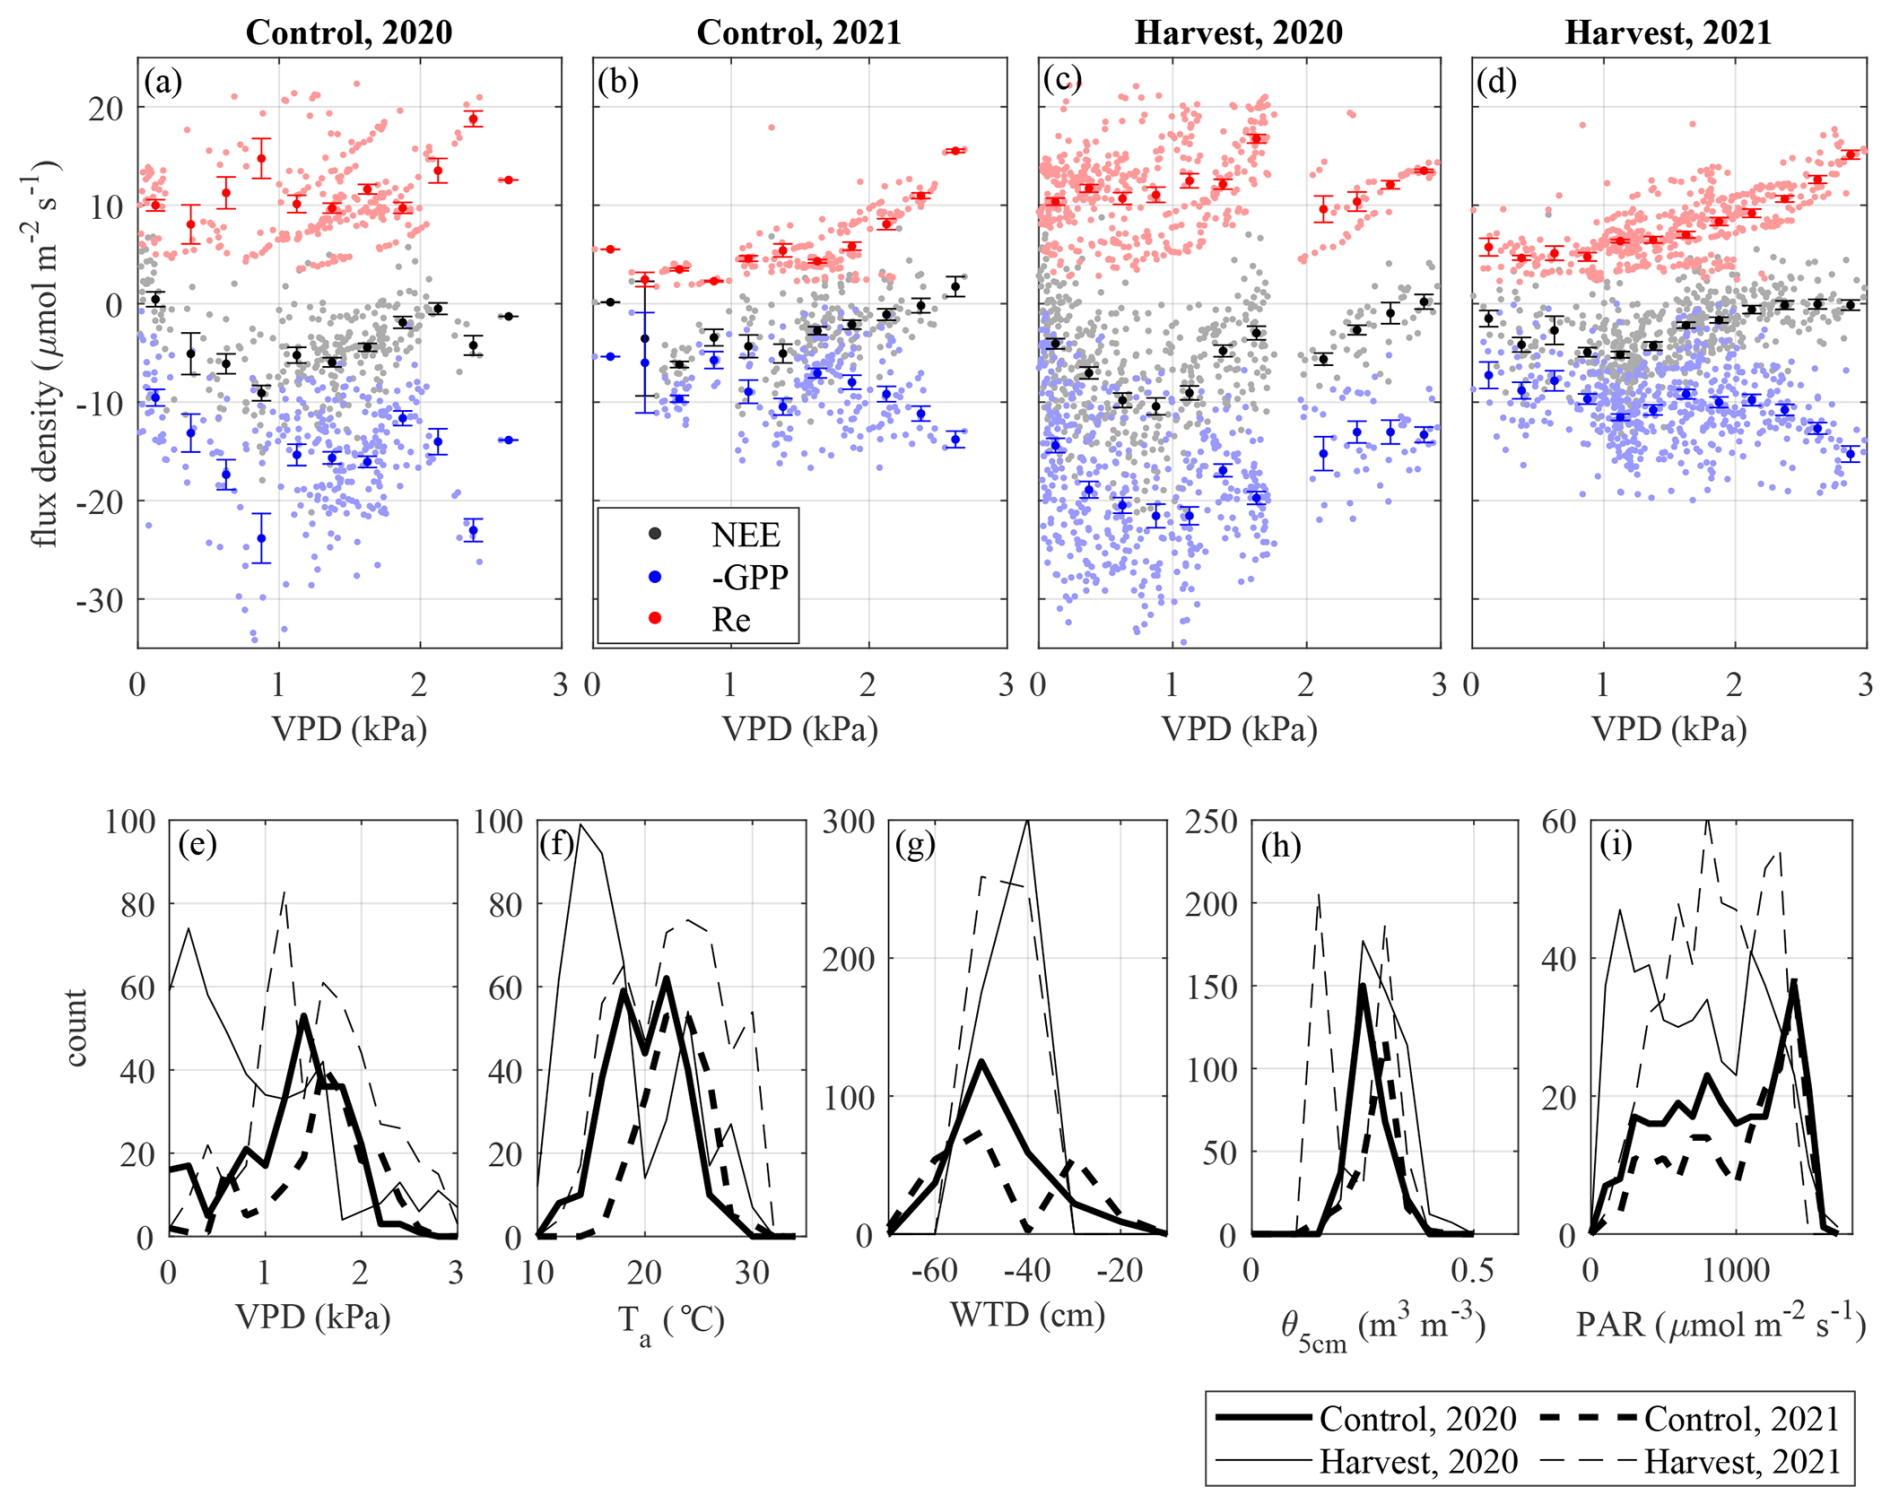
Figure 5The behaviour of ecosystem CO2 fluxes under varying VPD and the distributions of primary environmental drives. (a–d) Daytime 30 min averages of net ecosystem exchange (NEE), gross primary productivity (GPP) and ecosystem respiration (Re) model versus vapor pressure deficit (VPD). The data from June–July 2020 and 2021 are shown. (e–i) Distributions of the primary environmental drivers VPD, Ta, WTD, θ5 cm and PAR. The y-axis quantities are bin-averaged within 12 equal bins distributed along the VPD range [1, …, 3].
Secondly, the fluxes and bulk ecosystem parameters exhibit fluctuation at a weekly to seasonal timescale governed by phenology and weather changes. Rainy periods are followed by increased photosynthesis and respiration rates, as seen in Reref, Pmax and LUE, while the high-VPD periods cause respective reductions. The two main rainy periods on record showing this dynamic are late June–early July 2020 and mid-May 2021. The period of intense rainfall in early July 2020 led to markedly increased GPP, Re, ET, WUE and LUE; the recovery was comparatively weaker after the 2021 drought, to judge by the data after the August gap. This difference is likely in part due to the lower tree density after the selection harvest.
The temporal variability of CO2 exchange parameters is remarkable during the dry period of 2021. Reref and Pmaxand LUE were at low values in the early June when the drought began, and afterwards showed a steady increase until late July. This dynamic is likely mostly governed by the normal phenology of Boreal Norway spruce stands. At the same time, WUE oscillated widely during the period without apparent correlation with the other quantities. It is noteworthy that WUE clearly increased in late July 2021 during the peak drought.
Figure 5 shows the dependency of daytime NEE and its components on VPD over the two growing seasons. First, one must note the smaller GPP, Re and NEE in 2021 than in 2020. The reader is reminded that NEE is the quantity that is directly measured by the EC technique, whereas GPP and Re warrant extra care being modeled quantities. Regarding the relation with VPD, the primary feature in both blocks and in both study years is the peak NEE that is achieved at VPD of about 1 kPa. The NEE becomes smaller by modulus at drier conditions, eventually reaching zero at VPD of approximately 2 kPa, on both blocks and both years. However, the manner this trend is realized in GPP and Re seems to differ between 2020 and 2021. In the dry 2021, both GPP and Re increase with VPD, where the increase in Re at VPD > 2 kPa is steeper, leading to near-zero NEE. This is not observed in 2020 as the component fluxes are more stagnant, or even reduced by modulus at high VPD.
The distributions of the primary environmental drivers for June–July periods of 2020 and 2021 (Fig. 5e–i) suggest systematic and considerable differences in the weather and soil conditions, which is of importance for the understanding of the EC fluxes. It follows that when the EC measured the Harvest block, the weather was on average cloudier and cooler, leading to low VPD stress, compared to periods of Control wind directions. The distributions demonstrate that both blocks were hotter and drier in 2021 than in 2020. The 2021 bimodality of WTD and θ in Control and Harvest reflects the rapid decrease of soil water content during the dry spell (Fig. 3).
The photosynthetic light response curves of June–July (Fig. 6) reveal wide differences between the control and harvest blocks. First of all, the photosynthetic efficiency, which can be interpreted as GPP at very high PAR, was lower in 2021 than in 2020 in both blocks. In turn, the Harvest block photosynthetic efficiency was higher than that of the Control block in both years, both before and after the CCF thinning. The data for the Control block contains a limited number of days with soil drought, so that one can only infer that Pmaxat no drought is close to the curve representing the overall mean conditions (Fig. 6a,b). In Harvest, the effect of air drought seems to differ between 2020 and 2021 (Fig. 5c,d). In 2020, air drought caused a small decline in photosynthesis, while soil drought seems to have a large negative added effect (Fig. 6c). On the contrary, the 2021 light response curve at no drought on the c shows a lower Pmax that the curve at atmospheric and soil drought (Fig. 6d).
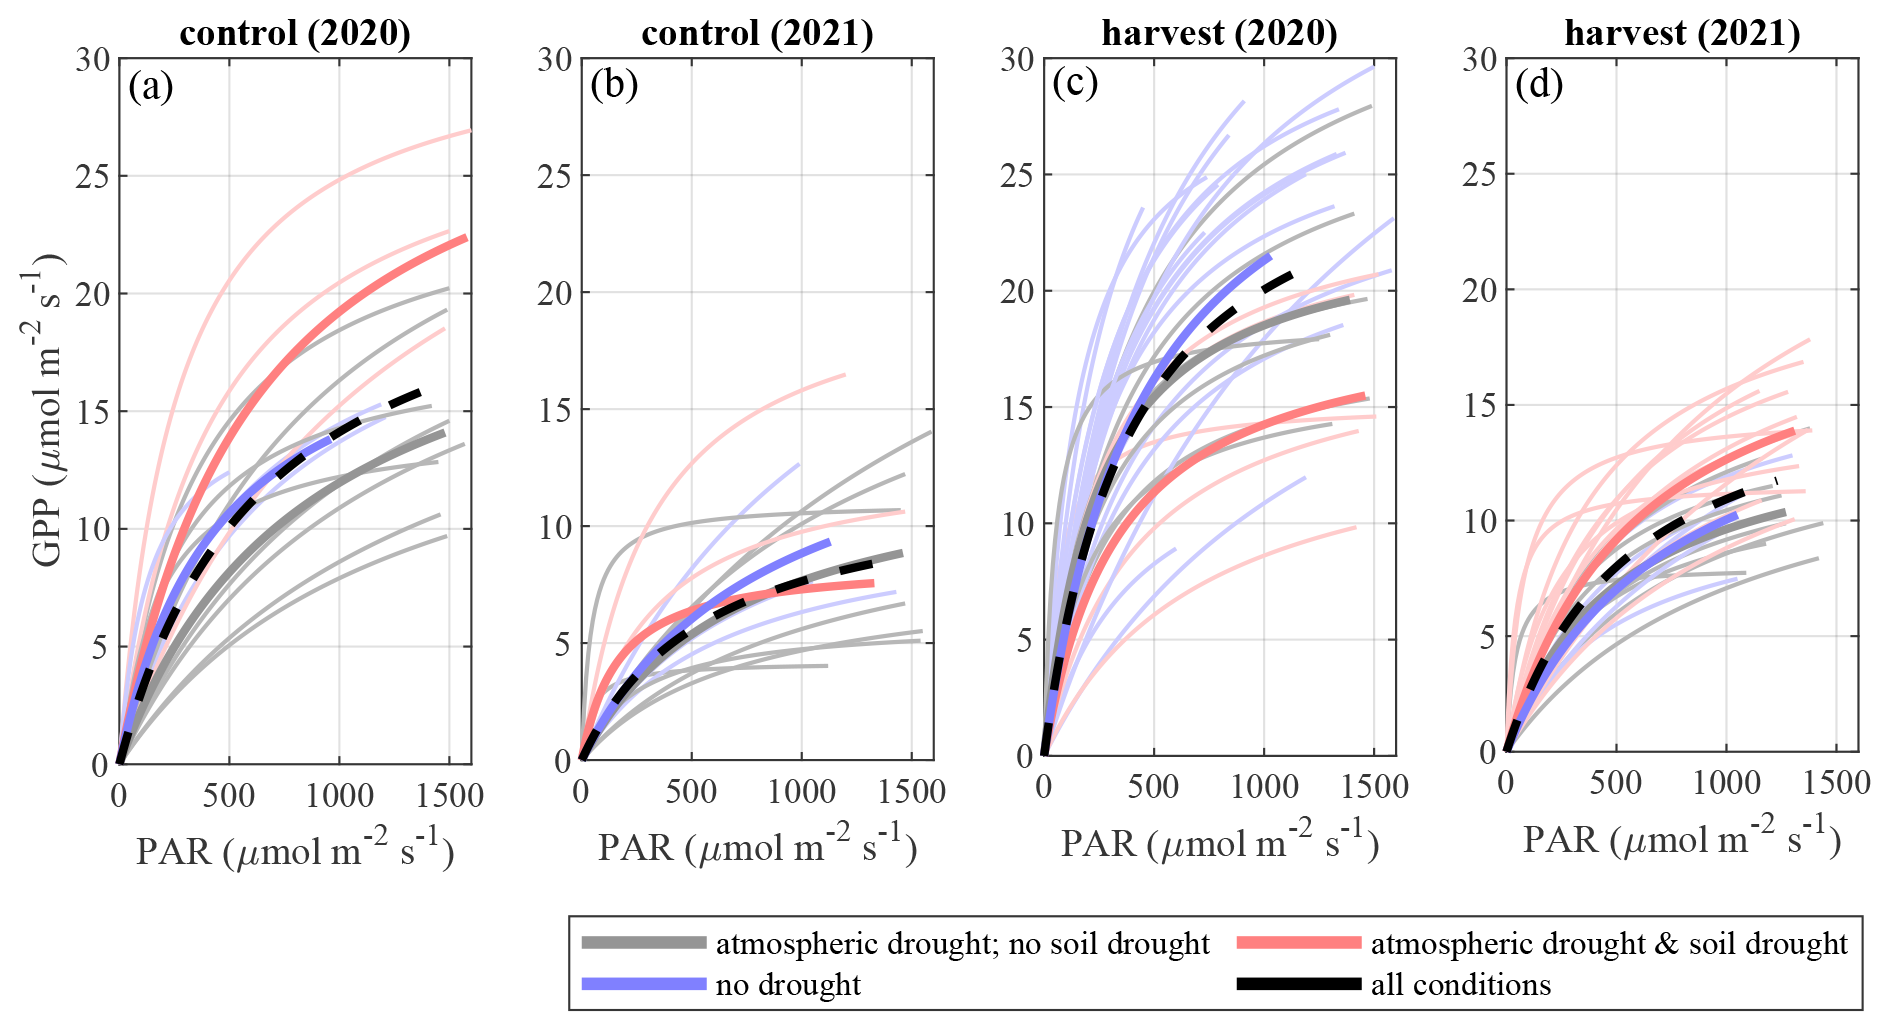
Figure 6Light response curves for individual days in June–July of 2020 and 2021. (a) Control, 2020; (b) control, 2021; (c) harvest, 2020; (d) harvest, 2021. The bold curves are the light response curves calculated from the mean of the Pmax and k parameters of the individual days in the respective drought classes. The black dashed lines show the mean light response curves calculated for all conditions.
It is of note that the drought periods are always associated with more sunlight than at mild (non-drought) weather, which is clear from the extent of the light response curves along the x-axis. Even when the drought effect on light response curve is apparent, e.g. in Harvest in 2021, the higher amount of sunlight at drought at least partly compensates for the lower Pmax, leading to a similar value of the integrated GPP as at no-drought conditions. For a graphical explanation of this effect, see Appendix I.
3.3 Sap-flow and evapotranspiration under drought
The sap flow data shows clear signs of VPD stress-induced limitation in tree water use, which magnitude differs between the trees and treatment blocks (Fig. 7). The dynamic observed in most trees here is the linear increase of sap flow with VPD up to 1 kPa, and a saturation at higher VPD, indicative of the decrease of tree-level stomatal conductance with increasing VPD. The saturating behavior of sapflow – VPD response is overall stronger during soil drought, however the slope at VPD > 1 varies between the trees (Fig. 7).
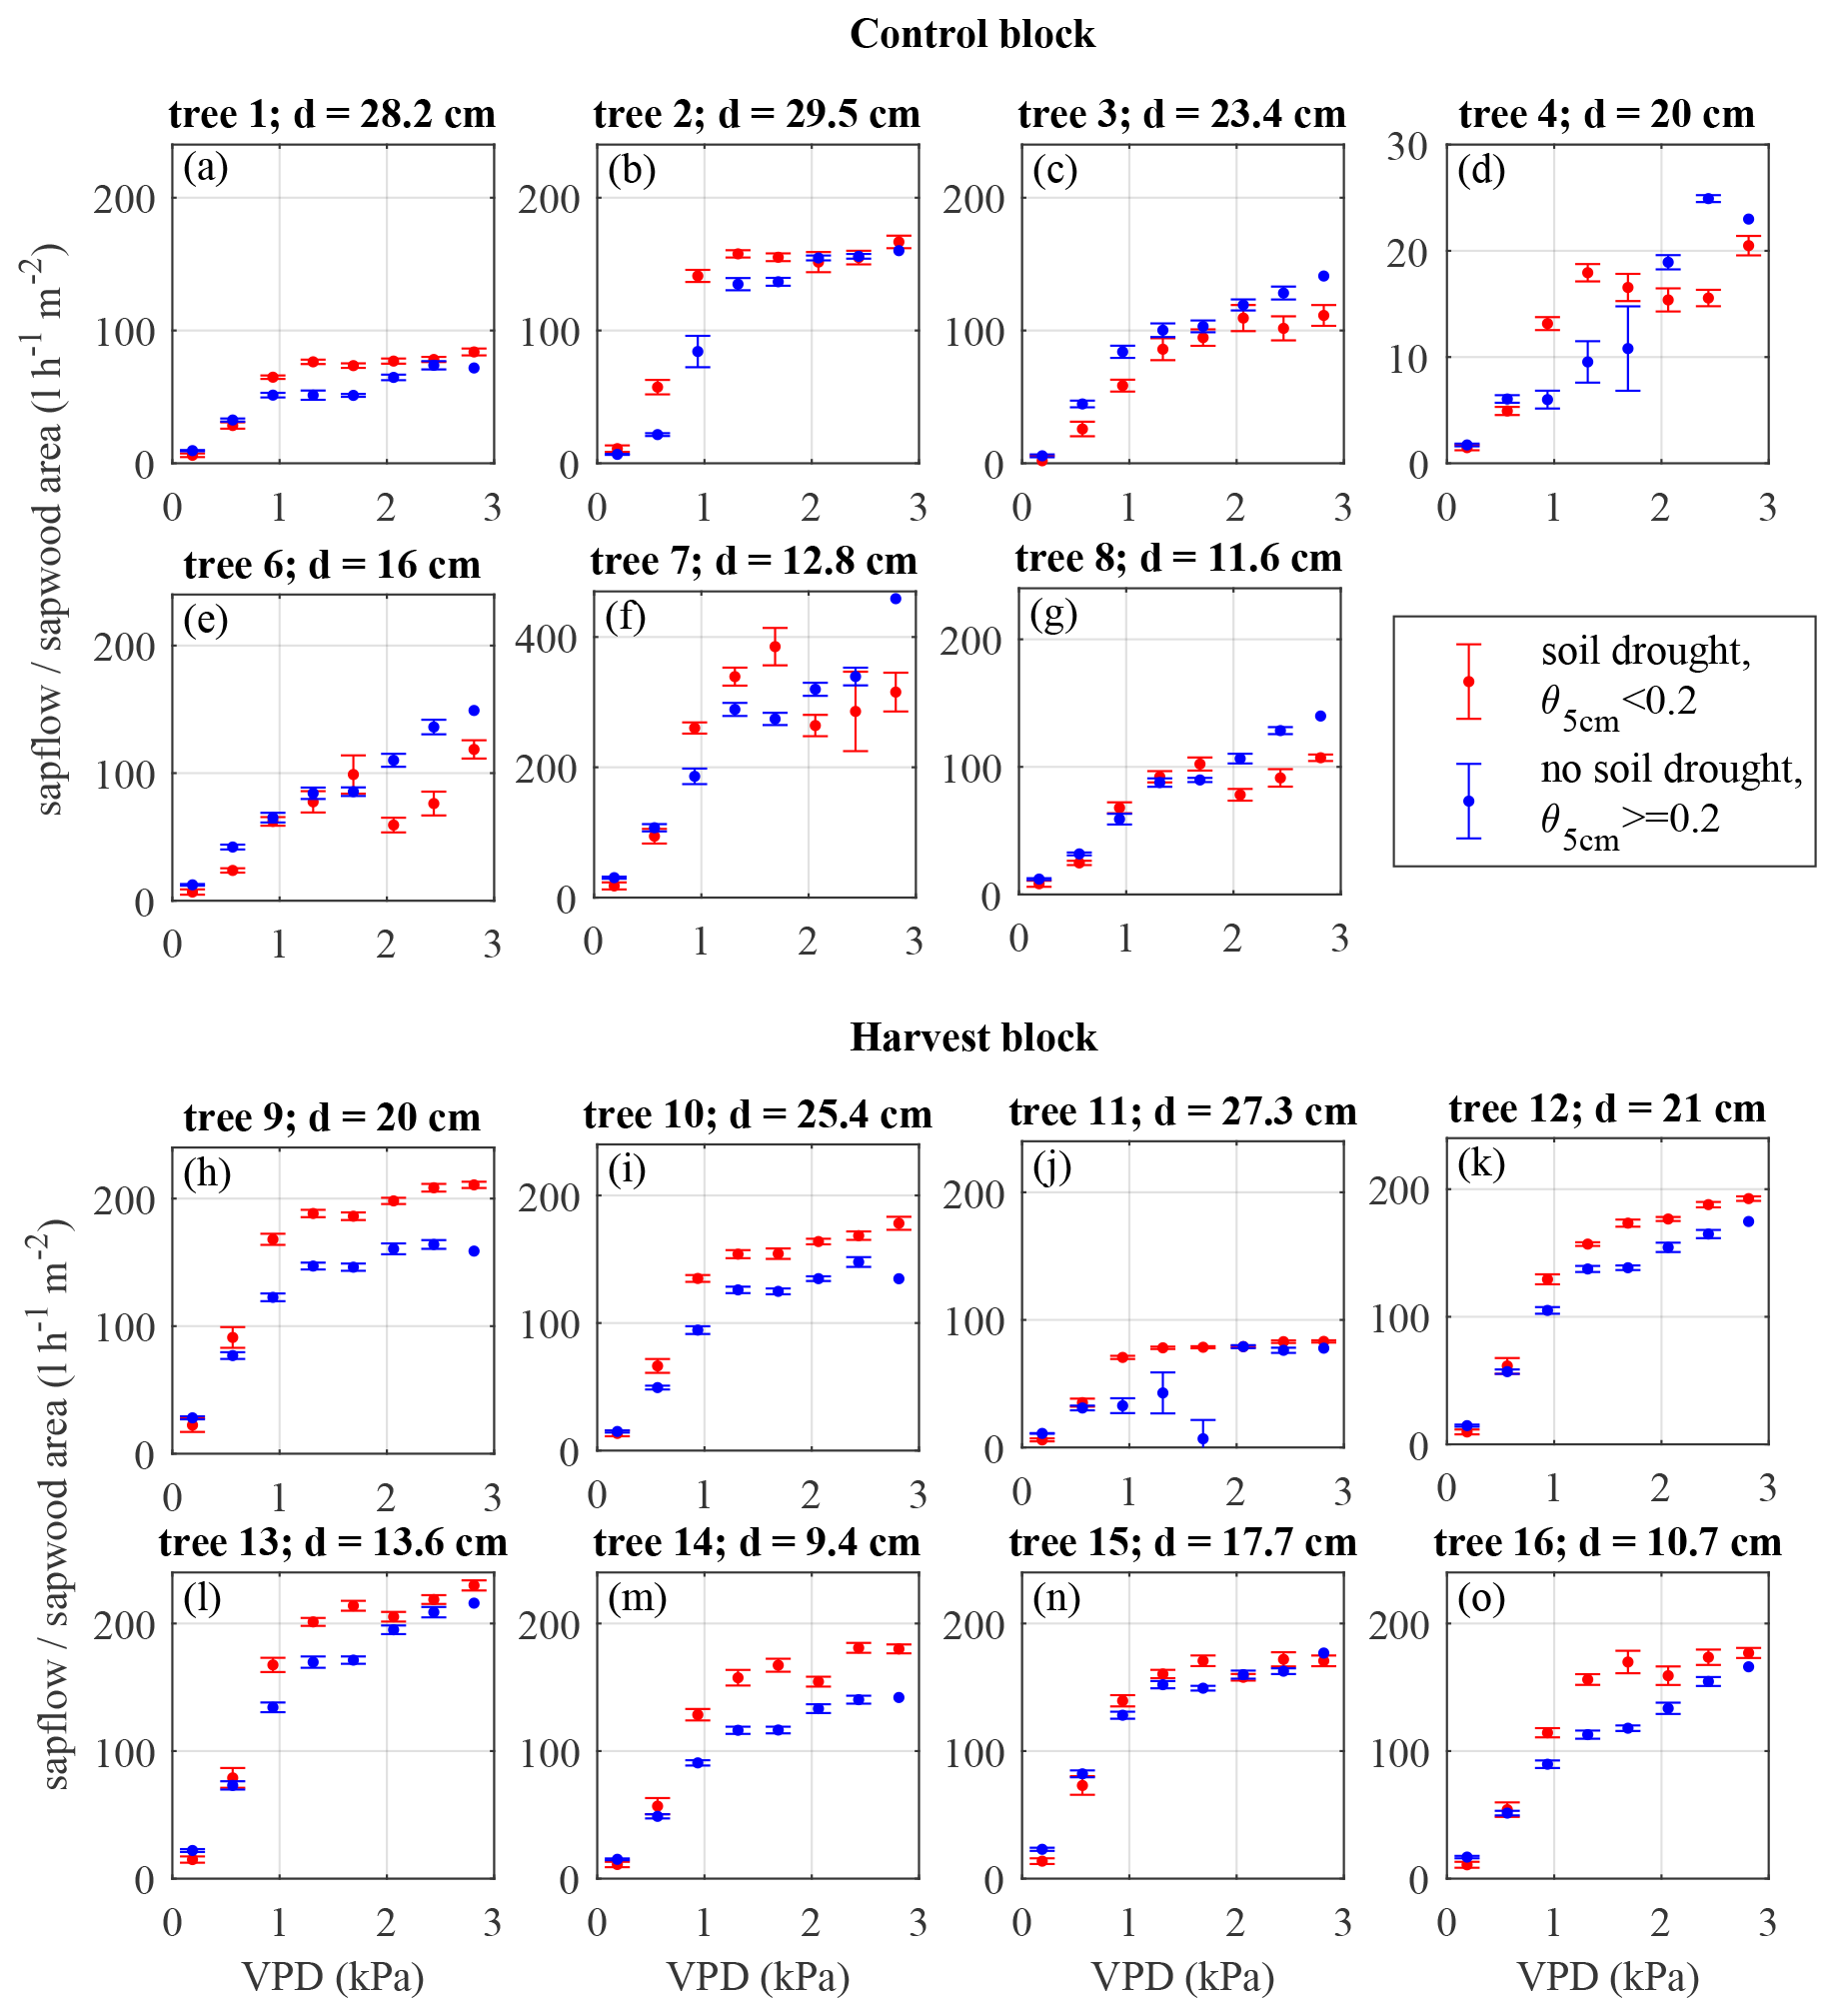
Figure 7Individual tree sap flow normalized by sapwood area versus VPD in the summer of 2021. Note that the x-axis limit is 250 for all trees except 4 and 7. The bin-averaging is done in 8 bins distributed evenly over the VPD range [0, …, 3].
The trees of the Harvest and Control blocks respond differently to drought. The Control trees generally show similar or lower sap flow at high VPD between soil drought/no-drought conditions. Most of the Harvest trees, however, show higher sap flow than the Control trees throughout the VPD range.
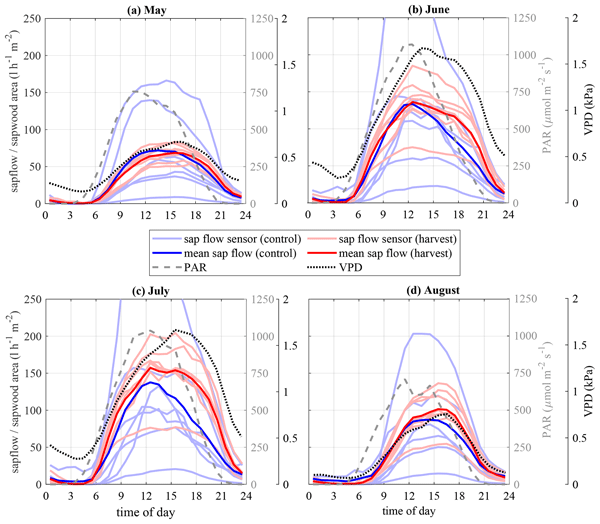
The diurnal cycle of sap flow closely matches the phase of VPD but lags PAR by about 3 h (Fig. 8). The range of midday sap flow is much broader among the trees in the control than in the harvest block, which might be related to more variable light availability and soil moisture due to the denser canopy.
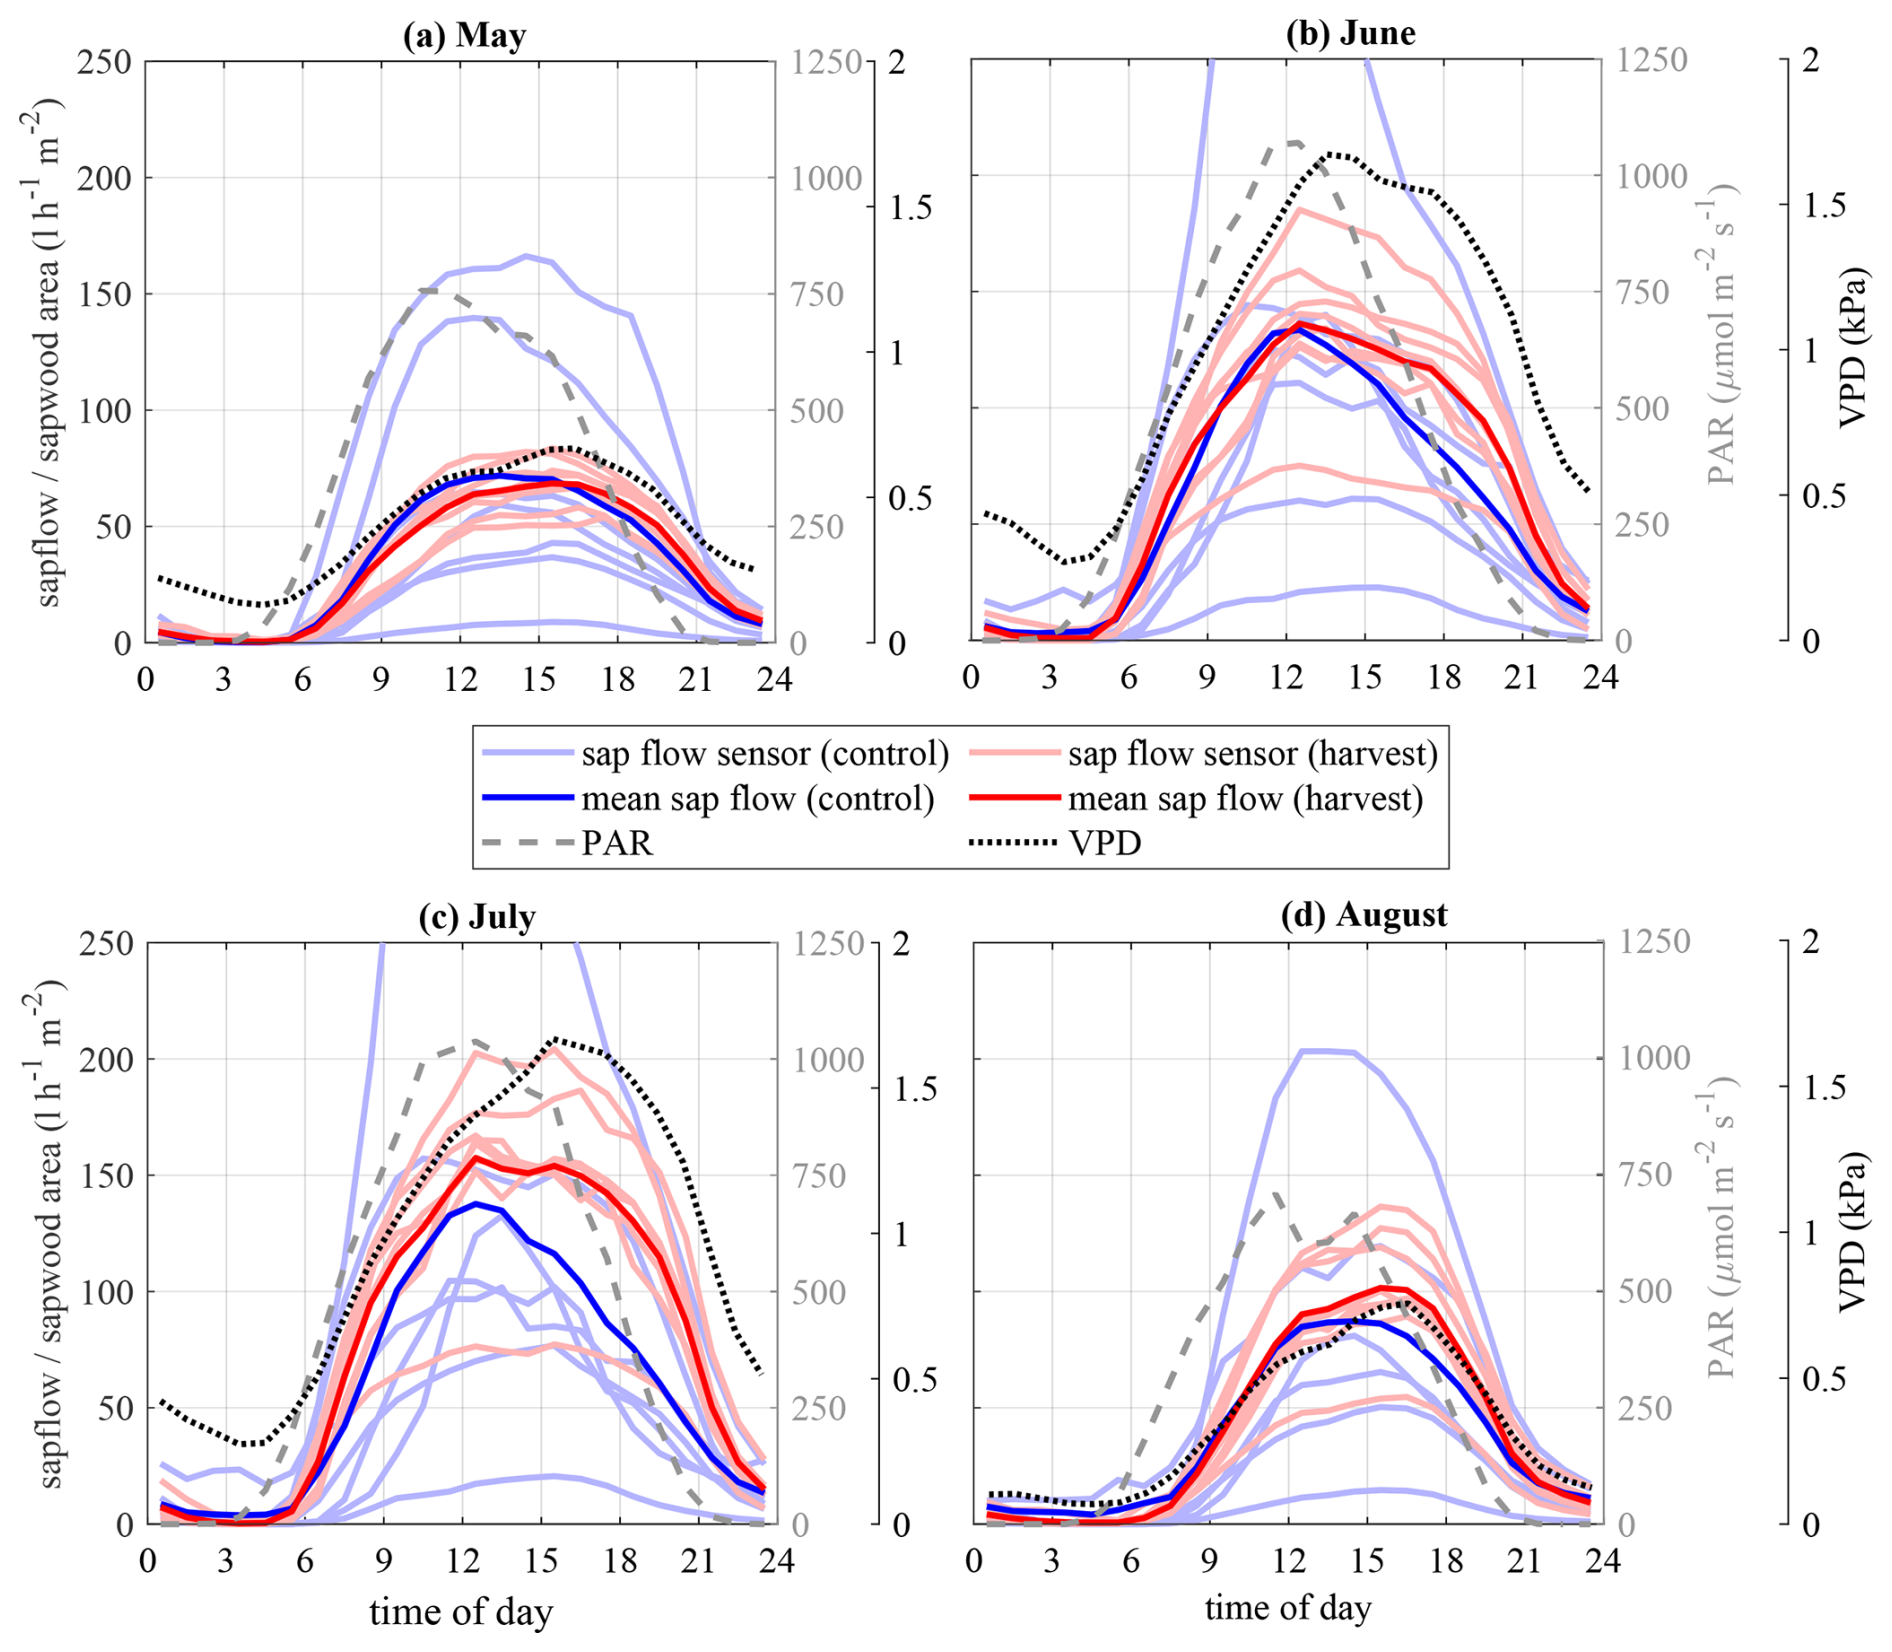
Figure 8Diurnal variation of sap flow normalized by sapwood area, averaged for the months May–August of 2021. The individual tree sap flow curves are shown with pale lines (red – harvest; blue – control), while the means of all trees in both blocks is shown with bold lines; PAR is shown as a dashed line and VPD with a dotted line. The normalized sapflow in one of the trees exceeds the y-limit of the panes (b, c).
In May 2021 (Fig. 8a), sap flow in control and harvest blocks is nearly identical, but June a clear afternoon dip occurs in the Control block (12:00–21:00 GMT+3); this dip gets progressively deeper in July, and then mostly disappears in August. The timing of this relative sap flow deficit coincides with the peak daily VPD levels.
The seasonality of upscaled sap flow, representing tree stand transpiration rate, closely mirrored that of the EC evapotranspiration (ET) in 2021 (Fig. 9a), with an increase towards late June and fall off starting from July. The synchronicity between EC ET and upscaled sap flow is best seen during the ET peaks in the first half of May and late August when the canopy is dry and transpiration a major contribution to ET. However, during and following heavy rainfall events the upscaled sapflow is less than half of the EC ET; in these conditions, non-stomatal water sources in the form of interception, evaporation and forest floor evaporation constitute a major part of the ET. The mean ratio between the upscaled sap flow and EC ET (Fig. 9b) is 0.7. The highs in the ratio during June–July appear to occur in the periods of air drought.
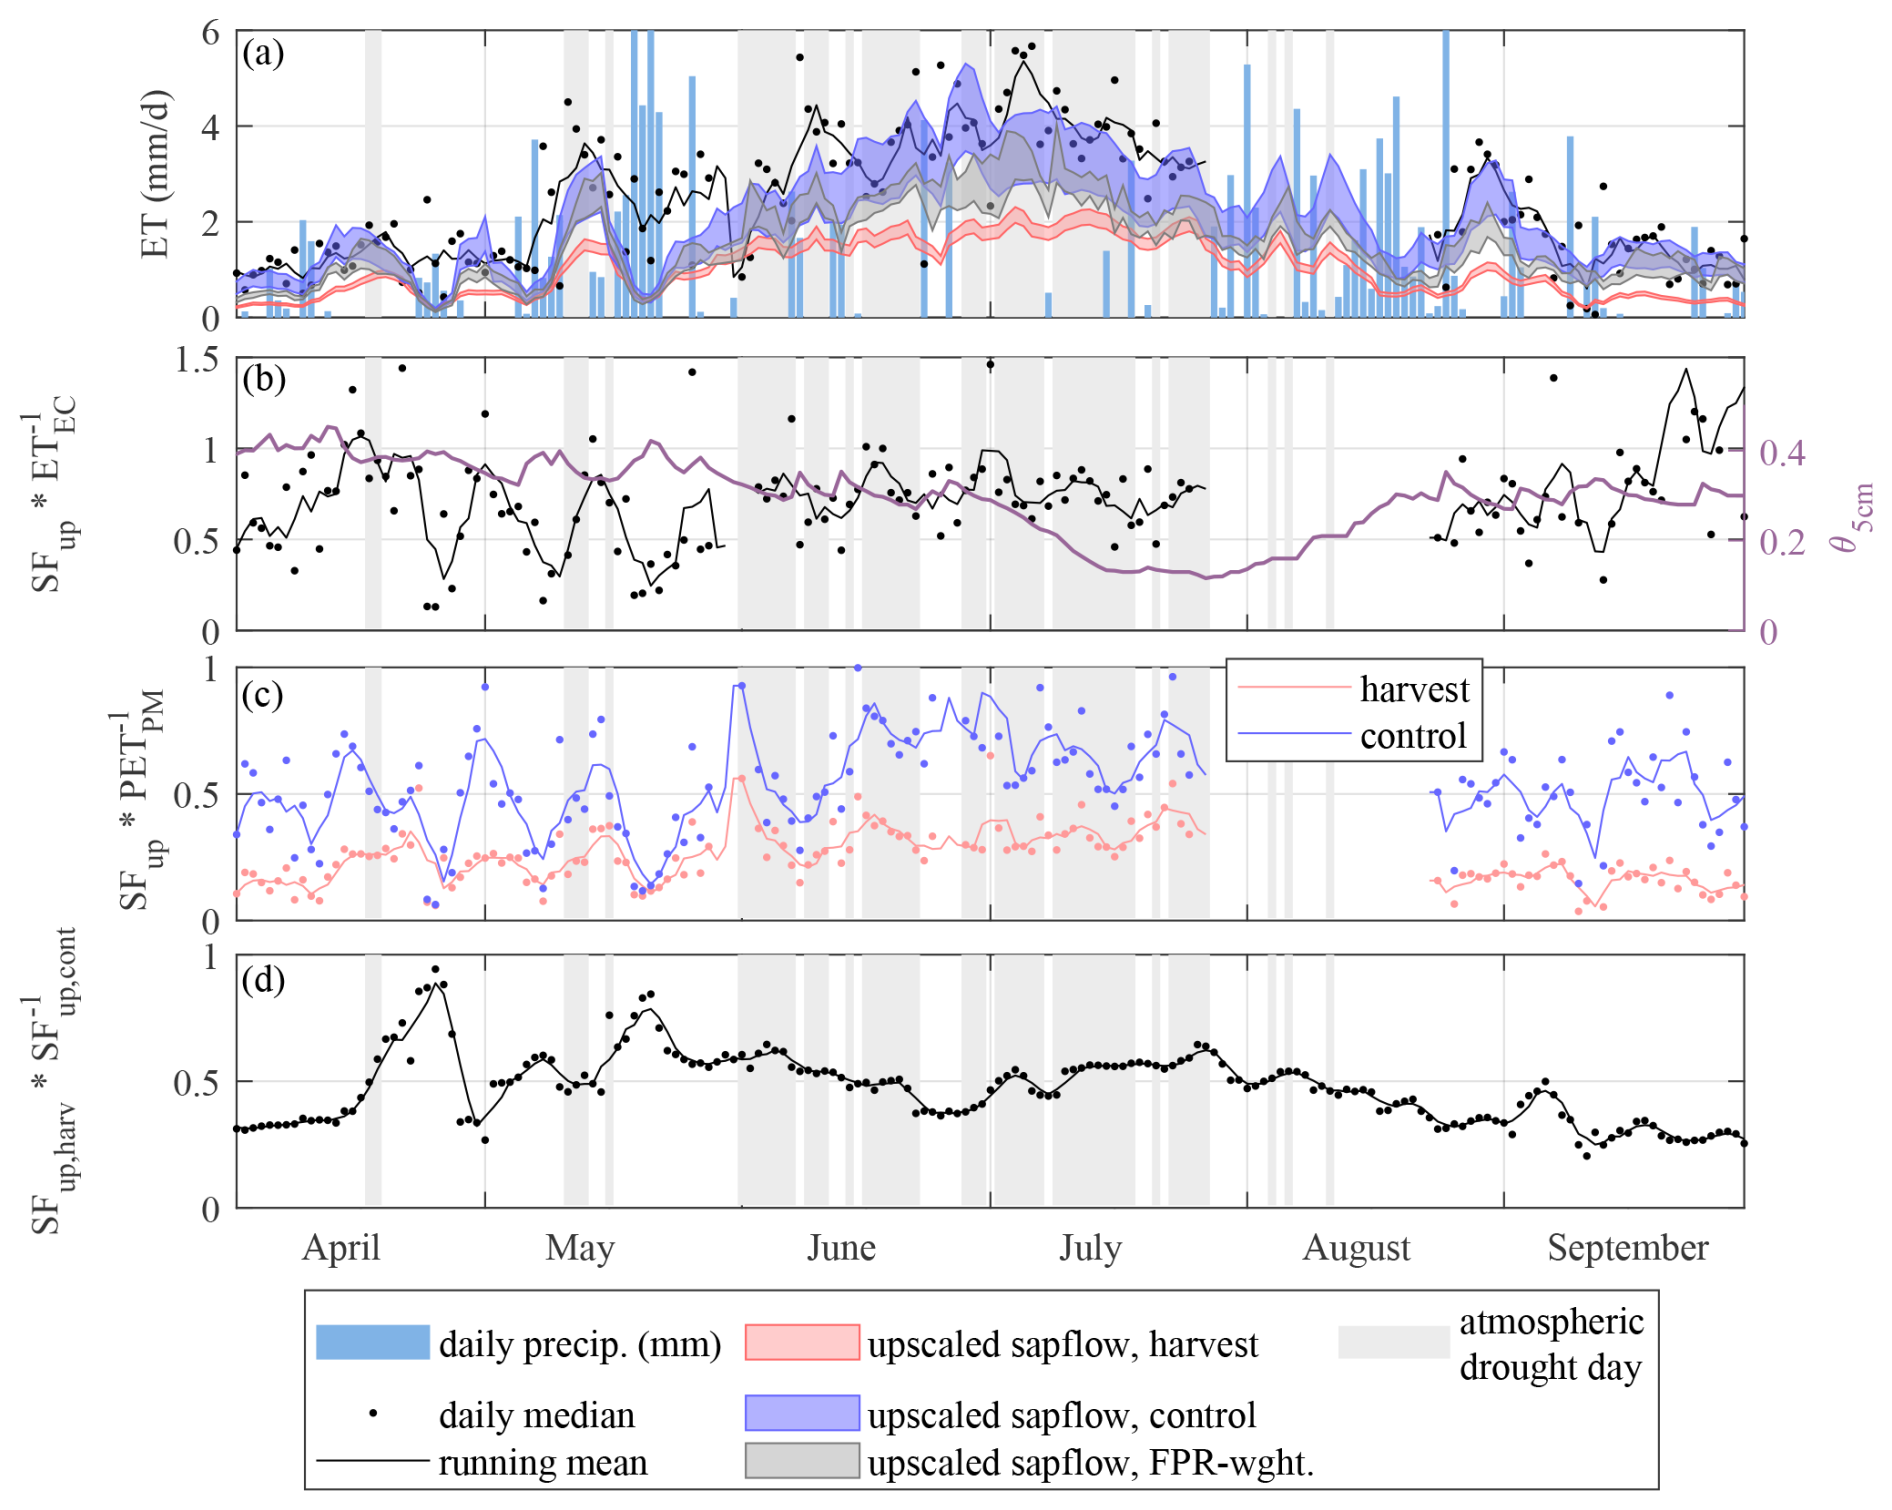
Figure 9The time series of ecosystem-scale evapotranspiration and sap flow in April–September of the drought year 2021. (a) Upscaled daily sap flow given as the average of Harvest, Control blocks and as a EC footprint-weighed value; daily EC evapotranspiration (ET) is given as black dots and its weekly running average as a black line; (b) ratio between the upscaled footprint-weighed sapflow (SF) and EC evapotranspiration; (c) ratio between the upscaled footprint-weighed sapflow and the Penman-Monteith potential evapotranspiration, separately for the Control and Harvest blocks; (d) ratio between the upscaled sap-flow of the harvest block and control block; The days of VPD > 1 kPa are marked with grey shading, as elsewhere. Daily precipitation is shown in (a) and the 5 cm soil water content in (b).
There is a wide separation between the curves for Control and Harvest upscaled sap flow, reflecting the difference in tree density and leaf-area index (LAI). The footprint-weighed upscaled SF shows intermediate values as it includes fractions of Harvest and Control blocks at all times (Appendices B, E).
The upscaled block-wise sap flow normalized by the Penman-Monteith potential evapotranspiration (Fig. 9c) was calculated separately for the two forest blocks by normalizing the time series of PETPM (Eq. 9) by the mean sap flow time series from Control and Harvest blocks. These ratios show stronger dynamics at the denser Control block than at the Harvest block, most likely due to different partitioning of ET between transpiration and evaporation. There was a moderate but noticeable drop in the mean level of that quantity between the second half of June and the whole July.
3.4 UAV surveys: individual tree NDVI and canopy temperature
The previous sections used continuous in-situ observations to reveal tree and ecosystem level responses to atmospheric and soil drought. The use of UAV-based thermal and RGB images then provide snapshots to high-resolution spatial variability within and across the Harvest and Control blocks (Fig. 10). The general feature in Fig. 10 is the contrast between the spatial distributions of canopy mean vegetation index values between the surveys in non-drought (15 September 2020, 2 June 2021) and drought conditions (14 and 26 July 2020; Fig. 3), with extra effects caused by the selection harvest. The post-harvest and drought survey of 2021 shows a considerable difference between the Harvest and Control blocks that wasn't seen in the reference survey in 2020 (Fig. 10a, b). This difference is seen yet clearer in temperature-based tree crown-level stomatal conductance () (Fig. 10c, d). Higher drought-period temperatures in the Harvest block (and some of the major forest tracks in the Control block) lead to markedly lower estimates, on average. A similar picture is revealed by the distribution of canopy brightness (Fig. 10e, f), indicating that the trees in the Harvest block were exposed to higher solar radiation amounts. The canopy NDVI was more equal between Harvest and Control in the pre-drought survey of 2 June 2021 than in the peak drought survey of 14 July 2021 (Fig. 10g, h). However, the mean Harvest tree NDVIcan was lower than that of the Control already on 2 June 2021, pointing at possible post-CCF harvest effects and different contribution of crowns vs. ground pixels in the drone images. This difference further increased by the time of the next survey on 14 July 2021, with the mean Harvest NDVIcan going down and the mean Control NDVIcan going up; the latter is likely due to typical phenology of Boreal coniferous forests (Karkauskaite et al., 2017; Jönsson et al., 2010). Furthermore, a particular spatial feature becomes apparent in the drought survey (Fig. 10h): rows of trees with low NDVIcan along the east-west forest tracks in the Harvest block, but also along some of the forest tracks in Control.
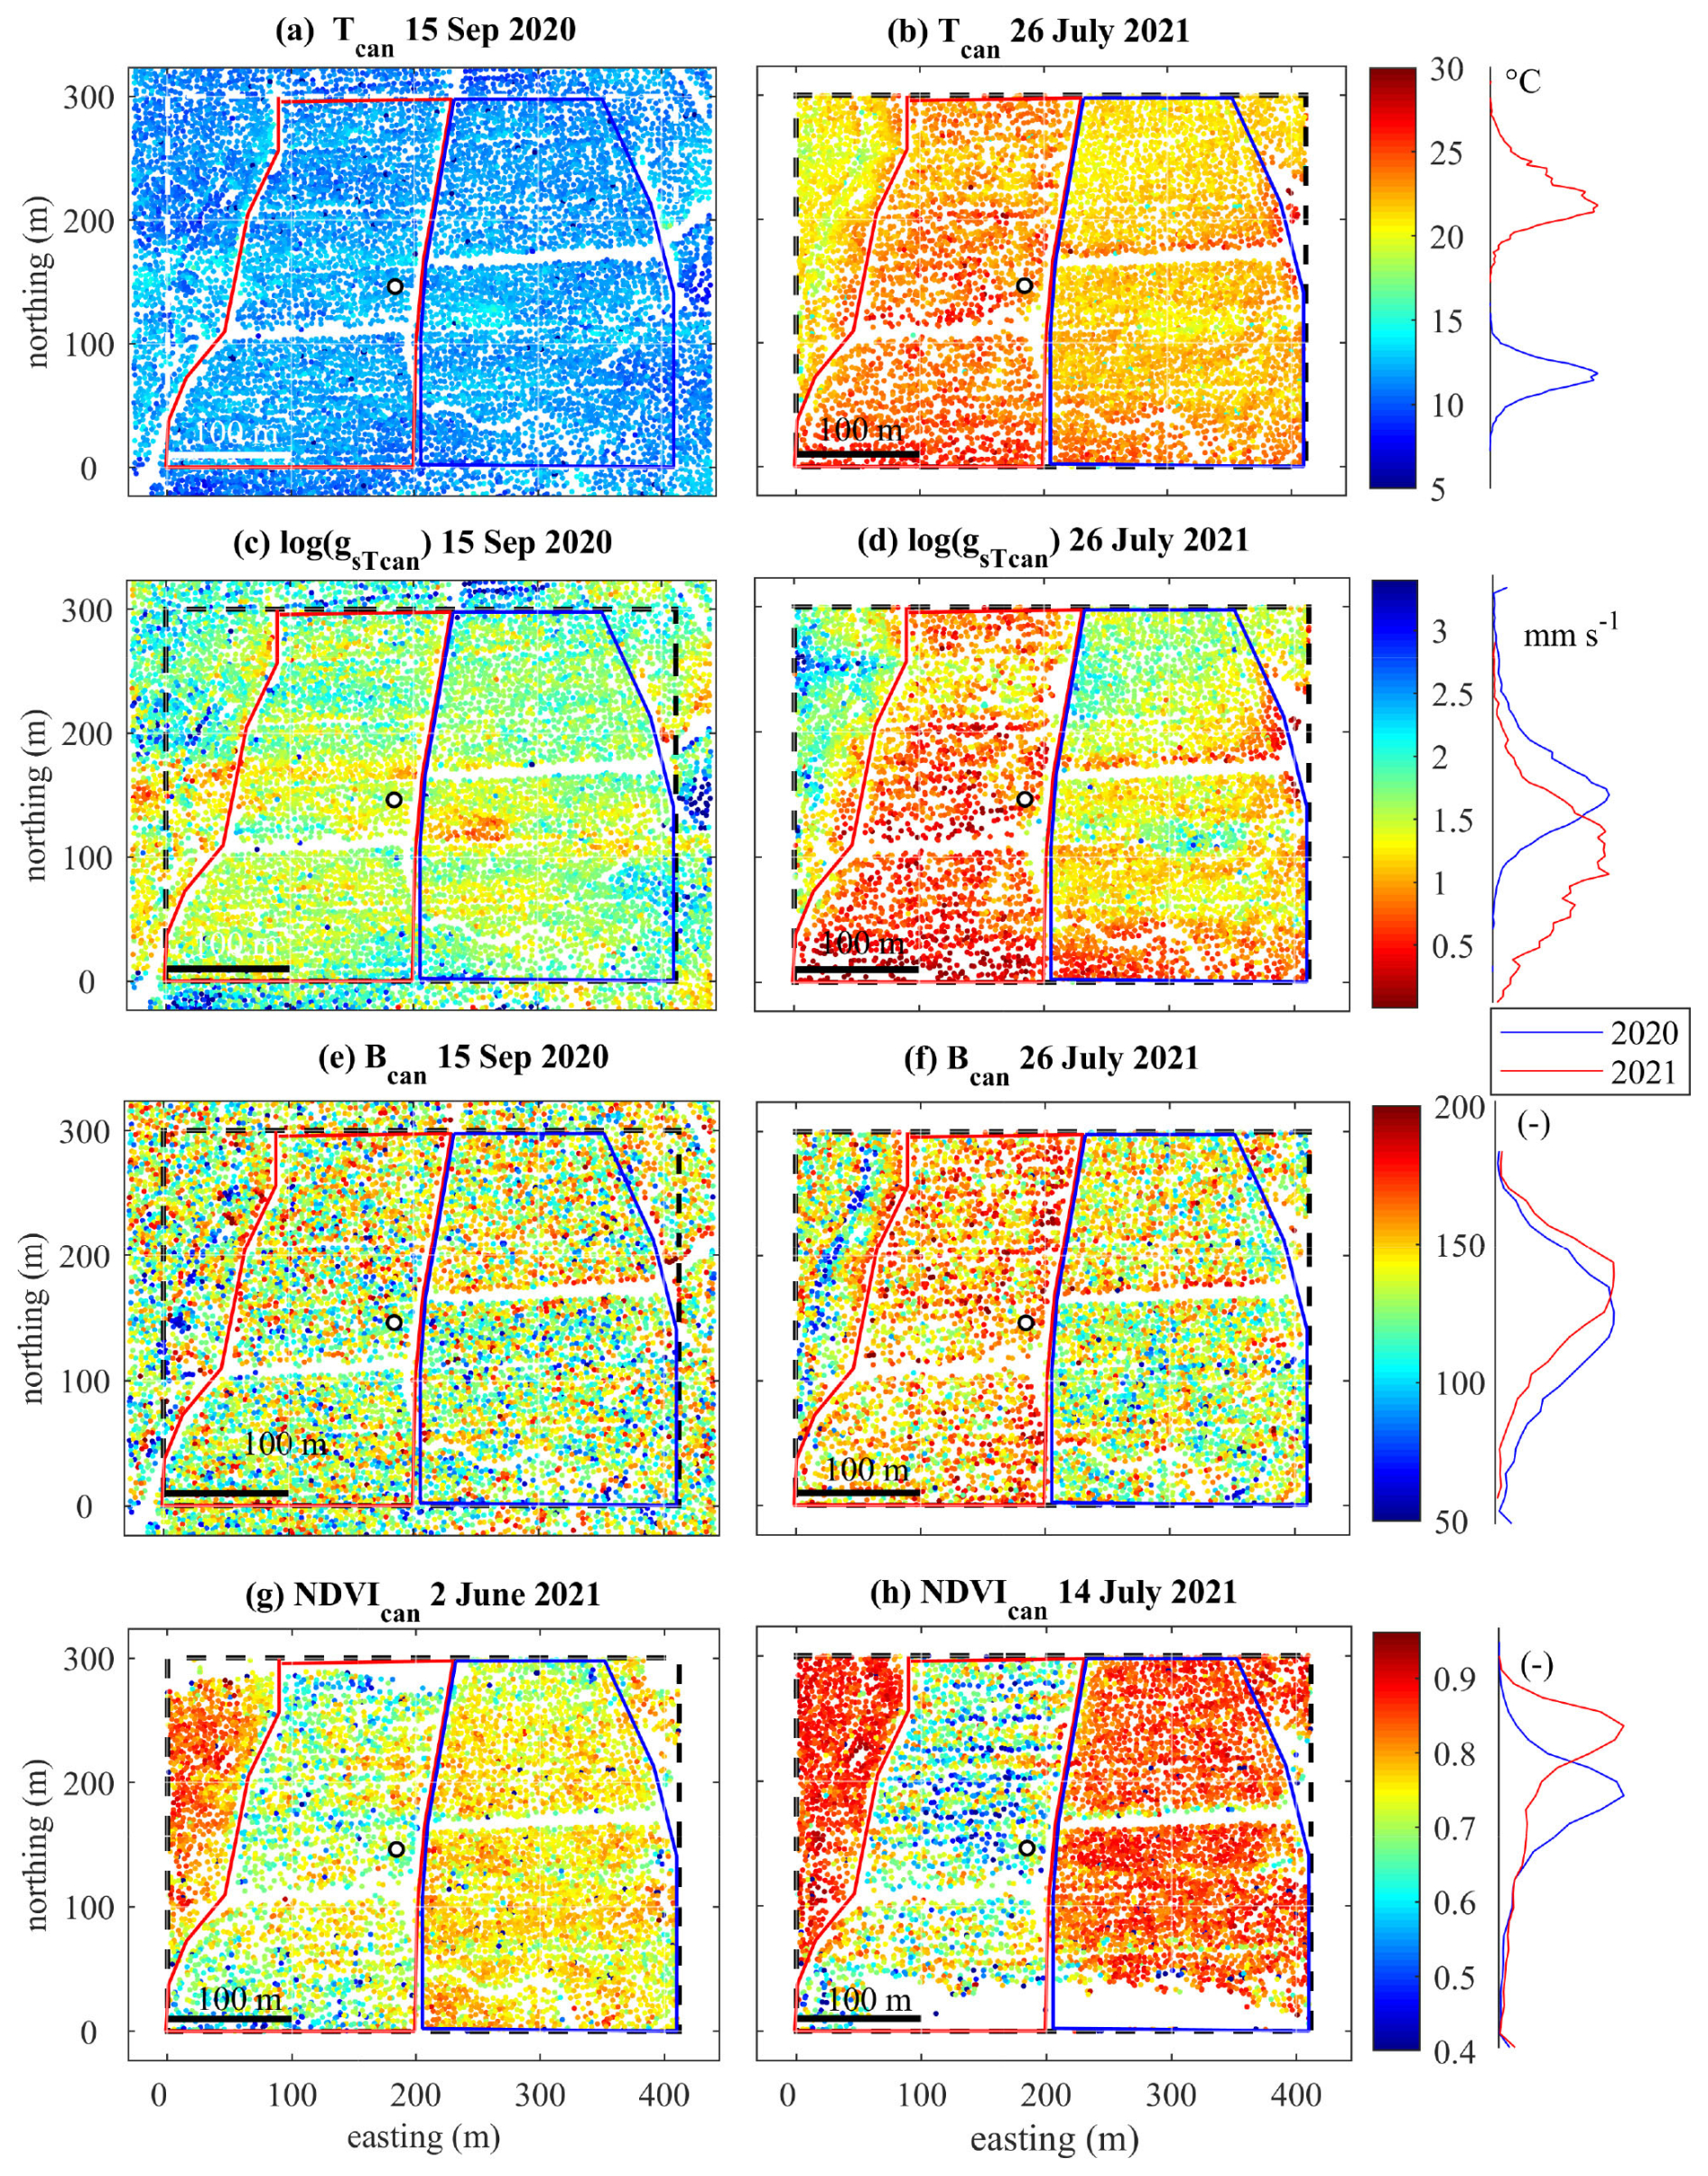
Figure 10Spatial distributions of the tree-mean vegetation indices based on canopy temperature and multispectral imagery. (a, b) tree canopy temperature in the surveys of 15 September 2020 and 26 July 2021; (c, d) logarithm of temperature-derived stomatal conductance (, dates as above); (e, f) canopy brightness (dates as above); (g, h) NDVIcan of the trees in pre-drought conditions (2 June 2021) and peak drought conditions (14 July 2021). The plots to the right of the main panels show the tree value distribution comparisons. The boundaries of the Harvest and Control blocks are shown as in Fig. 1. Note that the colour scale in (c, d) is inverted relative to other panels, in order to preserve the association between the colour scale and vegetation stress level (red – high stress, blue – low stress).
The distributions of individual tree canopy mean thermal stomatal resistance (), its reciprocal, conductance (), and the tree mean NDVIcan at the Harvest and Control blocks are shown in Fig. 11. In the non-stress conditions, harvest and control blocks show very close distributions (the blue lines in Fig. 11) both in 2020 (before harvest) and in 2021 (after harvest). In drought stress conditions, however, significant difference emerges. The change in stomatal resistance between non-drought and drought period is stronger in the Harvest block, where the stress-day distribution becomes much broader than in Control. The median of surface temperature-derived tree-scale resistance is approximately twice greater than the eddy-covariance estimates for both the non-stressed and stressed conditions (and vice versa for conductance).
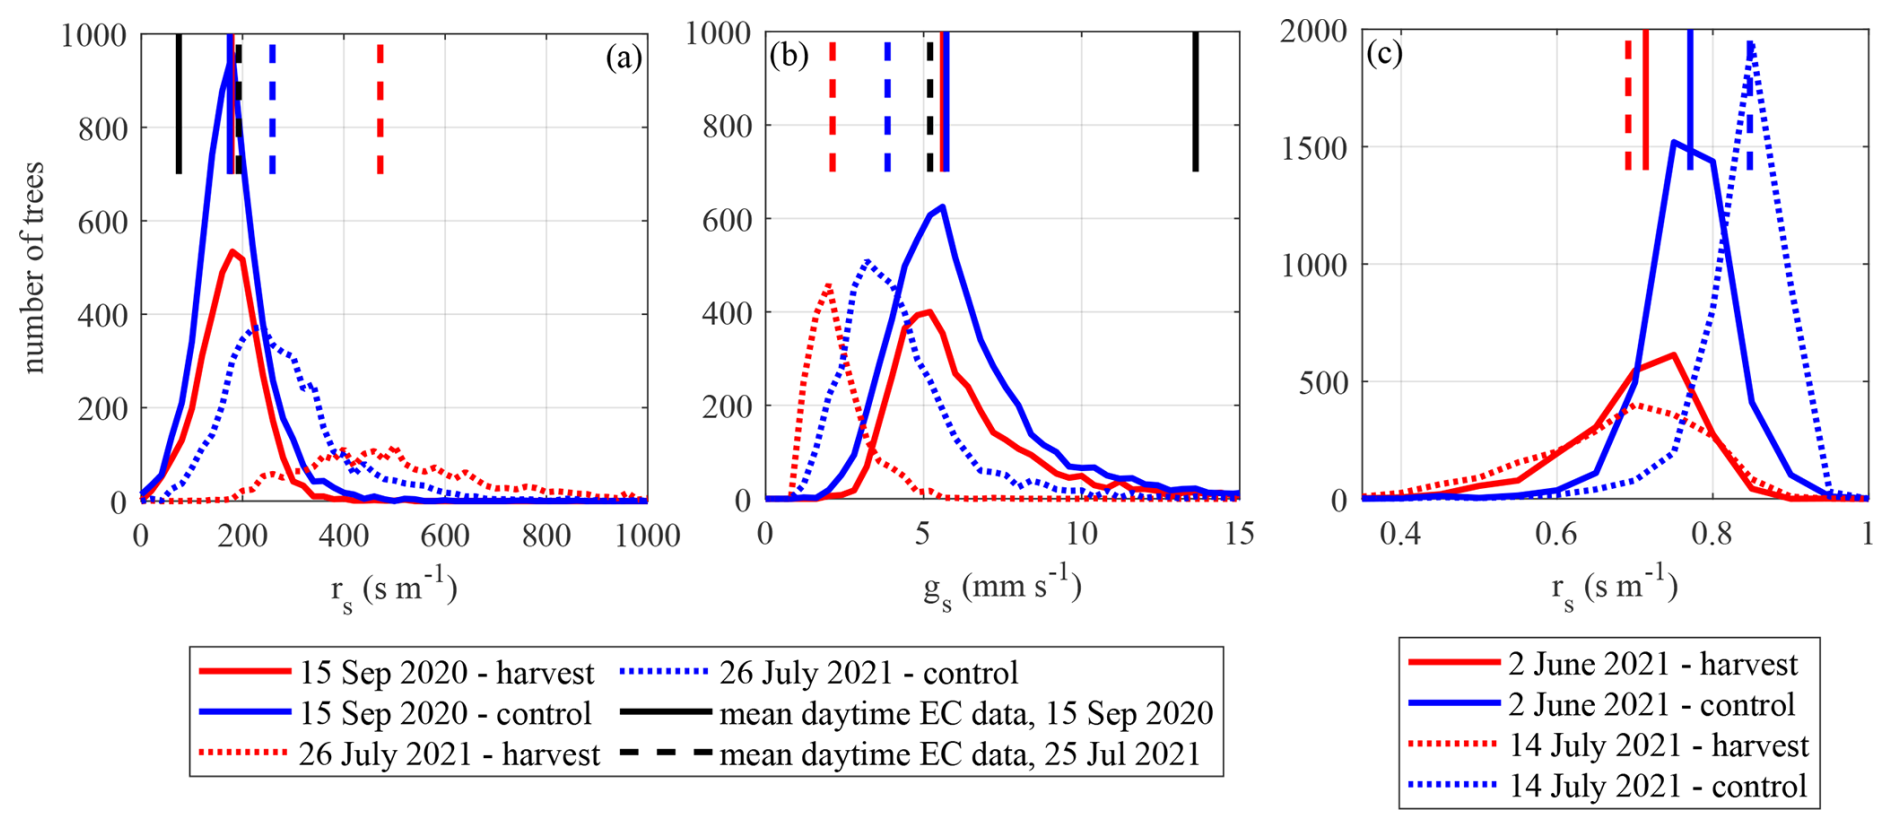
Figure 11Distributions of individual canopy temperature-derived stomatal resistance (a), conductance (b) and NDVIcan (c). The mean EC-derived and median remotely sensed individual tree resistance and conductance values for the time of the respective UAV flights are shown with vertical lines. The presented EC-based values are the means for the time of the UAV flights.
At the Control block, the NDVIcan (the mean values for individual tree canopies) in 2021 increases substantially from early June to mid-July (mean increase by about 0.1; Figs. 10g, h and 11c). At the Harvest block, the mean or median tree NDVIcan did not change, but there was a definite change in the distribution shape: The number of trees with NDVIcan from 0.65 to 0.80 decreased, while the number of trees in the region of 0.4–0.6 increased.
Tree canopy temperature increases with tree height (and exposure to light) in both Harvest and Control, but slightly steeper in the Control block (Fig. 12a). The dependency of on tree height is correspondingly opposite (Fig. 12b). NDVIcan likewise increases with tree height, but only in Harvest (Fig. 12c), while in Control NDVIcan is invariant of tree height. These relationships hold both for the pre-drought and drought surveys, and the only difference between the surveys is the overall NDVI range.
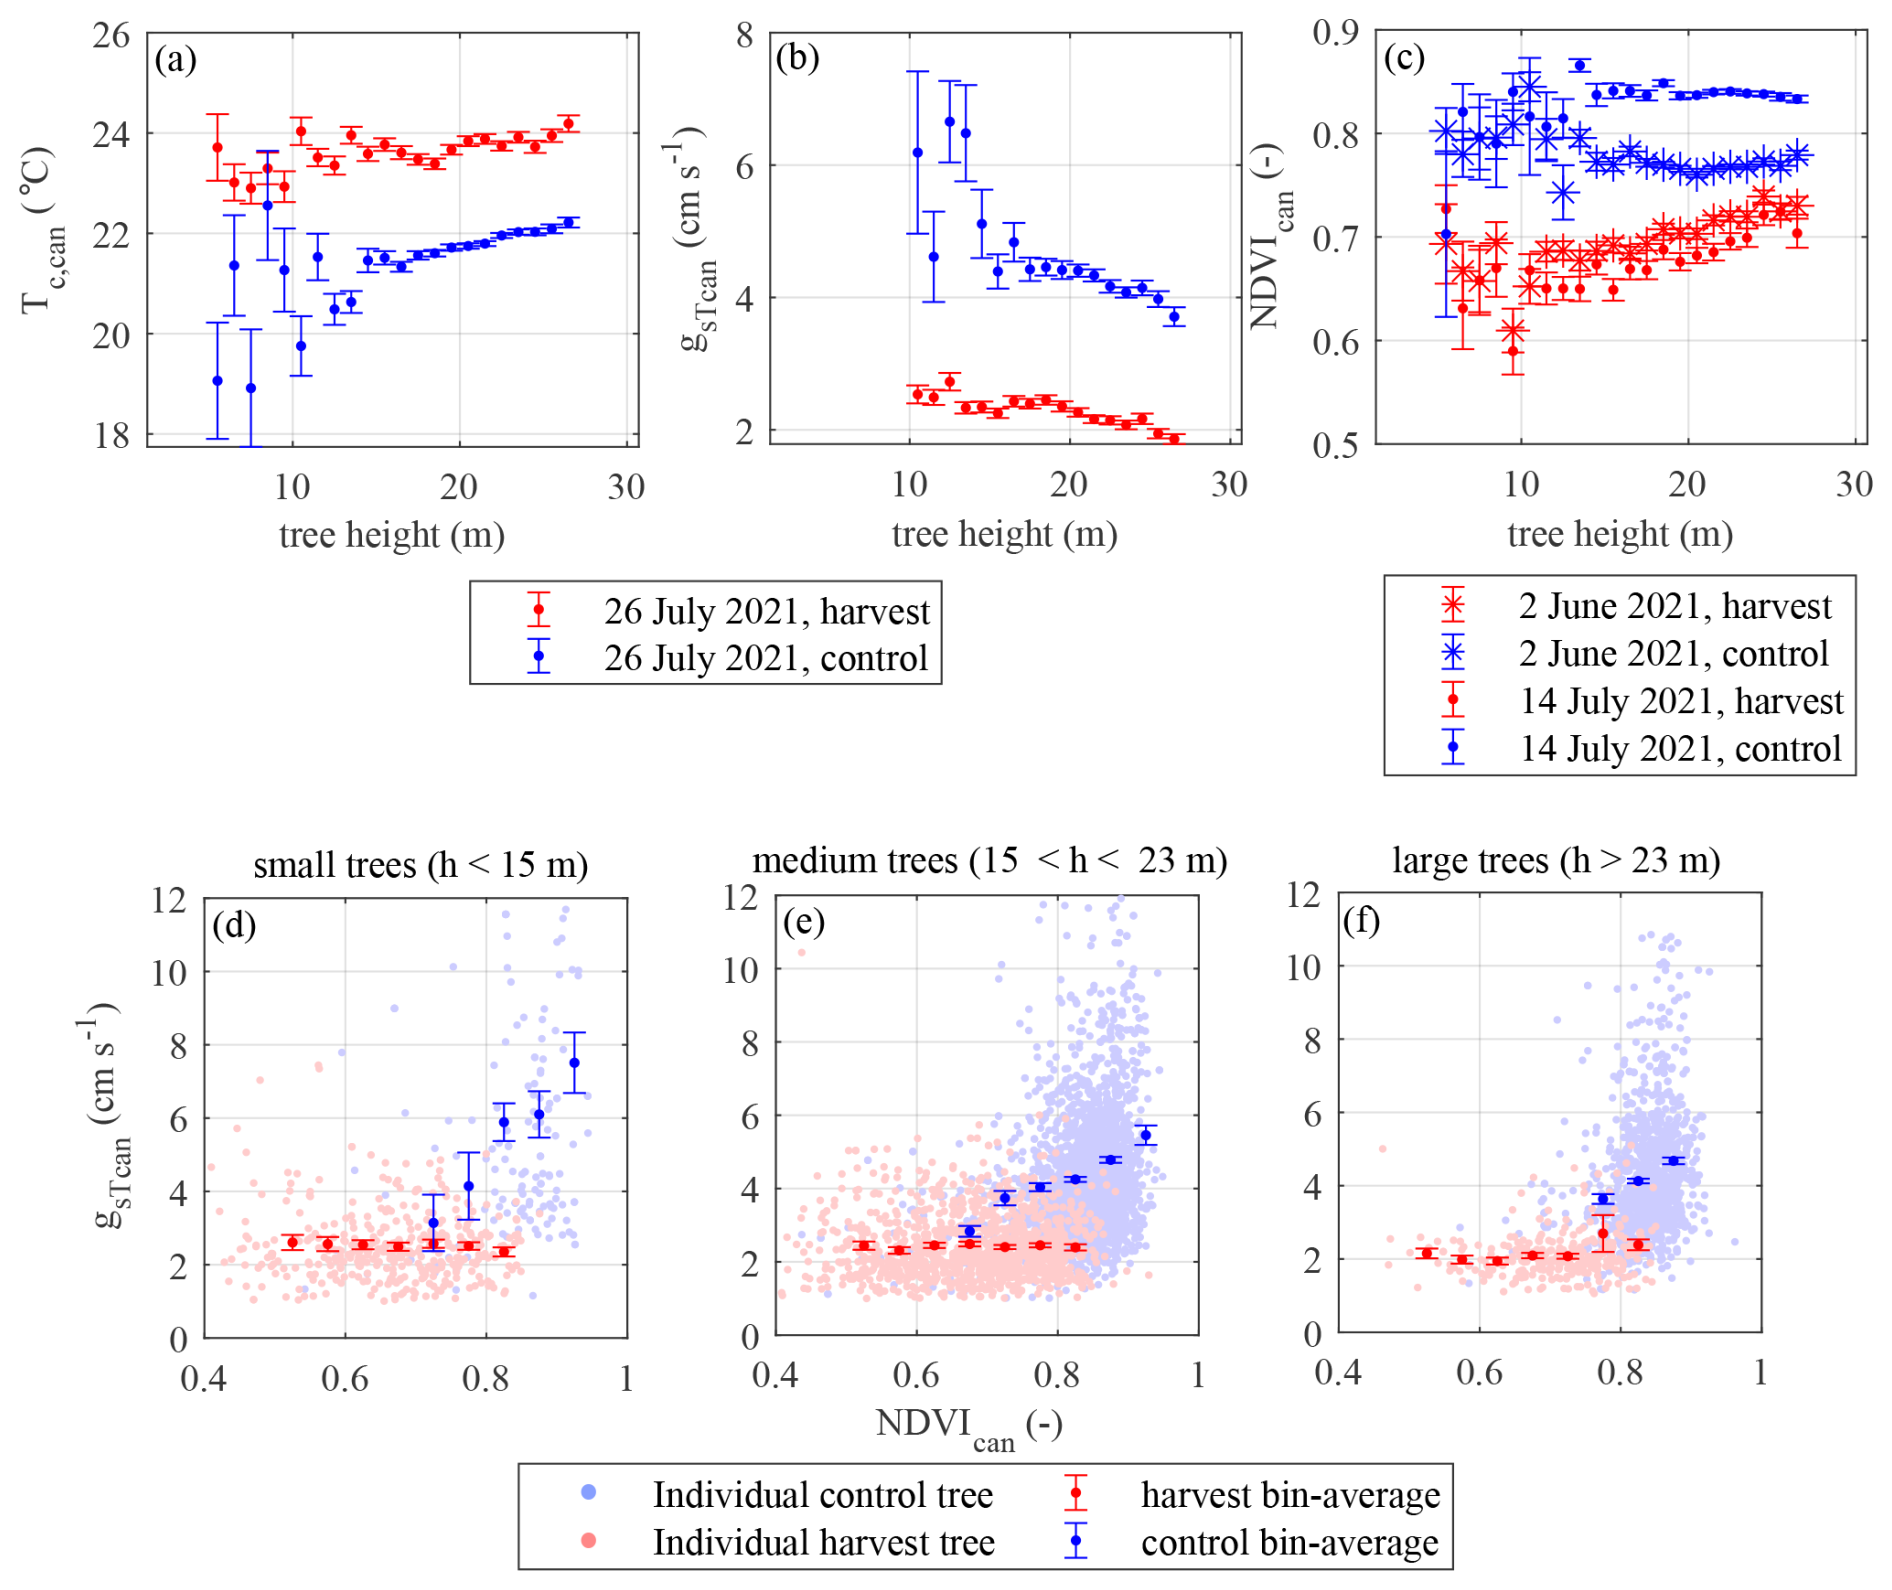
Figure 12Tree indices plotted against tree height: (a) mean canopy temperature Tc, can; (b) corrected temperature-based stomatal conductance (gsT). (d–f) Temperature-based stomatal conductance vs. NDVIcan shown separately for small (d), medium (e) and large (f) trees. In (a–c), the values are bin-averaged over 30 bins evenly distributed over the tree height range of [0, …, 30], while in (d–f) 12 bins over the NDVIcan range [0.4 …, 1] are used.
The trees were partitioned into tree size groups (under 15, 15–23 and over 23 m in height) in order to create distinct classes of small and large trees, in an attempt to improve on the practice of some previous studies that used only two classes (e.g. Zang et al., 2012). The tree mean parameters during drought (NDVIcan measured on 14 July and estimated from Tcan imagery on 21 July 2021) show very different relationships in Control and Harvest (Fig. 12d–f): a consistent positive correlation in Control, but essentially no correlation in Harvest. This holds for all three tree size classes.
Signs of drought stress due to low soil water content and high VPD during a hot, dry summer were detected in the carbon, water, and energy exchanges of a Boreal Norway spruce-dominated forest on drained peat soil, using multiple monitoring devices. The study site consists of the selection harvesting (of continuous cover forestry CCF) and un-harvested control blocks, which were monitored using eddy-covariance, sap flow sensors and UAV surveys. We chose the approach of defining a drought with meteorological means and finding the responses at tree to ecosystem level. In meteorological terms (SPEI), June–July 2021 can be considered a severe, although still not extreme, drought (Sect. 3.1, Fig. 2). The summer of 2021 represents the dry and hot conditions that have been observed in the Boreal region in a number of years over the last decades, and that will become more common in the foreseeable future (e.g. Felsche et al., 2024). The experimental setup thus has a potential to show whether a managed well-drained peatland ecosystem can show signs of physiological stress during a severe meteorological drought period.
4.1 Drought response of C and H2 O fluxes of a Norway spruce forest growing on drained peat soil
4.1.1 Photosynthetic and respiratory efficiencies in drought
The meteorological drought that occurred in southern Finland in June-July 2021 was characterized by low soil moisture levels and persistently high VPD, and affected ecosystem CO2 exchange and tree sap flow in the drained peatland forest. The EC CO2 fluxes, which are primarily representative of the Harvest block, indicate that the net CO2 sink is diminished under air drought (Sect. 3.2), which is manifested as the drop of photosynthetic efficiency and the actual level of photosynthesis. Pmax, WUE and LUE indicate constrained photosynthetic capacity during the air drought periods in both 2020 and 2021 (Fig. 4). The change in vegetation functioning between the two years is readily seen as a twice lower asymptotic limit of the mean light response curve of the non-harvested block in 2021 (Fig. 6). A similar twofold drop of photosynthesis rate that was observed in Harvest is largely due to drought, with a likely compensation from selection harvesting as it increases the radiation receipt by tree crowns. Drought-induced photosynthetic efficiency loss in Norway spruce is known to be sharp, and more pronounced than that of Scots pine (e.g. Zlobin et al., 2019). Matkala et al. (2021) reported a drop in maximum photosynthesis and reference respiration in hot and dry years based on EC measurements in a Norway spruce-dominated stand. Although stronger droughts may reduce photosynthesis and the availability of carbohydrates by causing a drop in stomatal conductance and metabolic activity (Dreyer et al., 1997; Escós et al., 2000), stomatal closure may also prevent any negative effects from mild and moderate droughts, ensuring fast recovery and continued growth (Gessler et al., 2020RefCheck: please correct “Gessler et al., 2020”. No exact match was found in the reference list.). This was accompanied by declining reference respiration (Fig. 4c, d), which likewise indicates a suppression of heterotrophic respiration under drought, as observed in previous studies (e.g. Matkala et al., 2021; Lindroth et al., 2020; Krasnova et al., 2022). The lowered Pmax and Reref led to a large decline in the mean levels of GPP and Re in June–July 2021 relative to the corresponding period of 2020 (Fig. 5).
These observations tie in with the previous studies showing the negative effects of air drought on Boreal forest GPP and Re. Mirabel et al. (2023) concluded that high VPD limits the growth of typical Boreal conifer species, particularly in combination with high temperature, while GPP was also found to be limited by VPD stress (Zhong et al., 2023). Granier et al. (2007) found both GPP and Re to be substantially reduced at very low soil water content in a range of forests of Boreal and temperate European forests during the 2003 drought; Lindroth et al. (2020) report the same regarding the 2018 drought, and note that the site-mean GPP deficit correlated with the deficit in gs in a range of Boreal sites. Such negative impacts may be caused by VPD in absence of soil drought (Schönbeck et al., 2022).
The NEE shows a peak at VPD of about 1 kPa, and a decline at stronger air drought (Fig. 5). A substantial fraction of this deficit may be contributed by ground vegetation that is less resilient to drought stress (Martínez-García et al., 2024). At the same time, the general tendency of both GPP and Re to increase with increasing VPD was preserved in the drought conditions (Fig. 5), likely for the reason of persistently high PAR, air and soil T at the times of air drought.
Soil and air droughts may either coincide, or occur separately (Fig. 2b). Most of the 2021 drought was manifested as VPD stress, with low soil water content occurring only in the second half of July (Fig. 3). Periods of air drought occurred in May and August 2020 and May 2021, when SPEI showed no meteorological drought, and soil water was kept up by regular precipitation. Whether soil drought imposed any additional stress on the Norway spruce trees in this study is unclear. The EC data showed enhanced photosynthesis on the combined soil and air drought days in the Harvest block in 2021, which had a sufficient number of drought days on the record.
While the air drought thus suppressed the photosynthetic efficiency in 2021, as was reliably shown by the CO2 exchange in Control, the mounting soil dryness and prolonged VPD stress do not seem to have had a similar effect in June–July 2021. Both Pmax and GPP increased throughout the drought of 2021, as well as during the hotter period of 2020 (Figs. 4–6).
It is unlikely that the weather of pre-harvest year 2020 augmented the drought response of 2021. Mid-late summer drought was shown to influence the growth in the following year (Laurent et al., 2003) via effects on bud formation (Salminen and Jalkanen, 2005), carbon allocation (Waring and Franklin, 1979), carbohydrate reserves for bud expansion and initial growth in the next growing season (Bouriaud and Popa, 2009). However, the weather in July–September 2020 was mild in terms of air temperature and soil water content.
4.1.2 Thinning effects
It is known that thinning intensity affects the drought sensitivity of a stand (Kohler et al., 2010; Misson et al., 2003). The previous studies generally agree on increased drought resistance and recovery as a result of partial harvest (Elkin et al., 2015; Manrique-Alba et al., 2020; Giuggiola et al., 2013; Sohn et al., 2016). The current study found the majority of Control block trees to increase their transpiration during air drought (increasing evaporative demand), whereas an opposite dynamic was in place at Harvest (Fig. 7). This relative sap flow deficit at Control may be seen as a dip between 12-16 PM, when the VPD is at the maximum (Fig. 8). The shape of mean SF vs. VPD curve in summer-2021 was similar between the trees in both blocks, in contrast to the report of highly heterogeneous sap flow patterns during the extreme 2003 drought (Gartner et al., 2009). Additionally, the possible positive effect of thinning follows from the analysis of light response curves, as the post-selection harvesting (CCF) light response curve is higher at air and soil drought than at no drought condition, while the opposite holds in regard to pre-harvest conditions (Fig. 6c, d).
Thinning increases individual tree transpiration but decreases transpiration at stand level (e.g. Laurent et al., 2003), and in this study, the selection-harvested block showed a twice lower transpiration than the Control block, based on upscaled tree sap flow data of the 2021 growing season (Fig. 9). Therefore, this study supports the previous observations that a thinned stand exhibits a drop in total transpiration, even if the individual trees are able to transpire more than they did before the thinning. Elsewhere, a removal of 61 % of basal area was found to lead to mean tree-level sap flow increase of 27 %, but a 34 % reduction in the stand-level transpiration (Zavadilová et al., 2023). At the same time, of economic relevance is the observation of a higher stem diameter growth in Harvest than Control, which was not apparently affected by the weather differences between 2020 and 2021 (Appendix H).
The ratio between the upscaled SF and EC ET stayed constant during the drought of 2021, and its mean value of 0.7 was substantially higher than approx. 0.5 predicted for a similar stand with LAI =2 m2 m−2 by a process-based model (Fig. 12 in Leppä et al., 2020) (Fig. 9). Such a dominance of tree transpiration over forest floor ET is common in mature forests, particularly in drought conditions (Launiainen et al., 2019; Martínez-García et al., 2024).
The decline in transpiration during drought is further reflected in Bowen ratio changes; the mean daytime June–July Harvest BR was 0.33 in 2020 and 1.49 in 2021, while the Control BR was respectively 0.25 in 2020 and 0.95 in 2021. Harvest thus shows consistently higher mean BR values, but that may be explained by the higher contribution of the ground to the block-average BR values in Harvest, than by higher stress level in that block. McGloin et al. (2019) identified similar drought-induced increases in the Bowen ratio of two Czech Norway spruce stands, from 1.52 to 2.50–2.70. Launiainen (2010) identified the typical no-drought BR value for a Scots pine stand as being somewhat below 1 in the summer months, with the values of 3–4 and above indicating extreme drought. In the current study, CWSI gave qualitatively similar information to BR and temperature-based stomatal conductance.
Therefore, based on the above, we may confirm the first hypothesis related to Control block trees being more impacted by the drought than the trees in the selection-thinned Harvest block, as the inter-block differences in tree transpiration, photosynthesis and stem growth are all indicative of a better physiological state of the trees in the Harvest block. This evidence may be seen as a warning of lowered Norway spruce health and growth in peat soils under the projected drier and hotter Boreal climate.
4.2 Towards early detection of drought stress: potential and limitations of different monitoring tools
4.2.1 Sap flow and UAV remote sensing data
Assessing the spatial diversity in tree transpiration is essential for early detection of drought stress. This can be done by UAV-based remote sensing and by sap flow measurements. Therefore, the search for the trees that are the first to exhibit drought reaction was one of the aims of the present study. Our findings suggest that there were indeed a minority of trees which are not resilient to drought. In Harvest, these trees revealed themselves by increased canopy temperature and lowered NDVI, while in Control the stress was detectable based on constrained sap flow.
The relative transpiration deficit in the individual trees in the Control block was well detected by sap flow sensors (Sect. 3.3, Figs. 7, 8). The afternoon sap flow deficit in the monitored Control block trees, in relation to those in the Harvest block, is a clear sign of water stress in the afternoon when the VPD is at its diurnal peak (Fig. 8). This is further illustrated on an individual tree basis by saturating sap flow behaviour at high VPD under soil drought conditions.
However, UAV remote sensing indicated a considerable increase in the spatial heterogeneity of individual tree canopy temperature and NDVI, which may also be interpreted as increase in stress relative to the reference (non-drought) period (Sect. 3.4, Fig. 10). However, the inter-tree differences in canopy temperature and NDVI at peak drought are higher in the Harvest than Control (Figs. 10, 11), which conflicts with the direct evidence of higher drought stress in the Control block obtained from sap flow data. In particular, the trees in the first row the ditches in the Harvest block have markedly lower NDVIcan and generally warmer canopies than those further away from the ditches, but are not measured by sap flow sensors; they therefore are possibly stressed, but we cannot verify this for lack of direct monitoring data of these specific trees. The variation in the degree of mutual shadowing by the trees is an unlikely reason for this spatial trend, as the Harvest has a uniformly low tree density and the drone flights were conducted at the time of the highest solar elevation. A similar spatial picture can be seen along some major ditches in the Control block (Fig. 10). Hence, it is possible that the trees monitored with sap flow sensors in the Harvest block do not cover the range of drought stress response that occurs within the Harvest block, and possibly likewise within the Control block. A further aspect that may have influenced the assessment of stressed trees in the pre-drought and drought NDVIcan maps is the fact the pre-drought NDVI data was obtained before noon, while the drought data were sampled in the afternoon, when maximum drought stress is shown by sap flow sensors.
Notwithstanding the uncertainties, more on which will be said below, UAV remote sensing has an undeniable strength in that it allows assessing the statistics of individual tree parameters within a stand. In the present study, the increase in the inter-tree disparity in NDVIcan (Fig. 10h), canopy temperature and the derived T-based stomatal resistance under drought, (Fig. 11b) may be considered to be an indication of stress in trees, as the least resilient trees show more extreme values of vegetation indices compared with the main tree population.
4.2.2 UAV data for drought detection: benefits and limitations
UAV mapping is a very useful tool enabling the study of spatial distributions of canopy and ground colour, reflectance, temperature and structure. However, the UAV data also have substantial limitations complicating the analysis of tree drought response that do not have immediate solutions. These concern both the multispectral data and thermal data. Canopy segmentation is a first important step that presented a greater challenge in the dense canopy of the Control block (Appendices A, C). The large number of trees that could not be segmented required a statistics-based correction (Appendix C). The dominant trees are more sensitive to climate and weather, being more exposed to wind, VPD stress and solar radiation (Schmied et al., 2022). The UAV data users should therefore be aware of the biases associated with the UAV tree health proxies in stands with non-uniform tree spacing and age.
The separation of canopy and ground pixels in the UAV multispectral and thermal orthomosaics is an issue common for all sensors. In the present experiment, the Normalized Green-Red Difference Index NGRDI was used (Appendix C), and performed well based on visual examination. However, we acknowledge that the greenness threshold segregating spruce needles from ground varies across the survey area due to the differences in tree vs. ground colour, both between the individual trees, and between the Control and Harvest blocks. The relatively open canopies of the Norway spruce pose an additional challenge to segregate the shoots from the woody parts and the ground.
A further two considerations apply to thermal imaging. One is the small-scale variability in aerodynamic conductance in the vicinity of each tree, or, in other words, wind-induced cooling and enhancement of transpiration. The trees that are sheltered from the wind experience a lower VPD and less wind-induced leaf cooling than other trees that are more exposed (e.g. Zweifel et al., 2005). This has direct consequences for the estimation of stomatal conductance based on leaf temperature (Sect. 3.4, Fig. 10, Appendix D). Such tree-scale variations in the field of turbulence are difficult or impossible to measure directly, so that Large Eddy Simulation of wind flow through forest canopy becomes the only feasible tool to tackle this problem. Accounting for inter-tree differences in aerodynamic conductance and amount of received solar radiation will enable more precise interpretation of canopy temperature.
The initial expectation was that the stressed trees would show both low Tree-mean NDVI and low temperature-derived stomatal conductance. A positive relationship is indeed observed in the Control, but the absence of correlation between the individual canopy NDVI and temperature-based stomatal conductance in the Harvest block that is observed in late July 2021 data is difficult to explain (Fig. 12). NDVI showed a positive correlation with tree height in Control, but the correlation was not detectable in Harvest, which could be partly due to the previously observed NDVIcan saturation over dense stands (Vicca et al., 2016). The highly disparate temporal dynamics of leaf temperature and optical indices such as NDVI should be considered as well: while the air drought stress is immediately reflected in leaf temperature via the rapid link between VPD – stomatal conductance – transpiration, NDVI instead reflects the changes in canopy spectral properties tied to the structural and biochemical state of the photosystems, which respond to stress over days to weeks. This time scale mismatch would be more relevant for the UAV surveys in the early drought, such as 2 June 2021 in this study, than for the surveys conducted several weeks into the drought period (14–26 July 2021, Fig. 10)
4.2.3 EC CO2 flux as ecosystem-average drought proxy
In contrast with the tree-specific information provided by sap flow sensor data, Eddy-Covariance drought stress proxies are known to be inherently area-averaging, and thus incapable of precisely detecting short-term changes in the physiology of a subset of trees within a stand. In the present study, the EC fluxes are mainly representative of the Harvest block (Appendix B), while the amount of data from Control is deemed too low to serve as reliable basis for drought stress estimation. This further diminishes the possibility of detecting the stress in the minority of non-resilient trees within Control which was identified by sap flow data. While the sequence of Norway spruce drought responses was found to be always the same (drop in stomatal conductance, photosynthesis, leaf potential, chlorophyll), the stress level controlled the timing and magnitude of responses (Ditmarová et al., 2010). The more resilient Norway spruce trees have water reserves to withstand several days of drought stress without showing pronounced reactions (Ditmarová et al., 2010; Čermák et al., 2007). Consequently, trees within a stand would respond to drought with a widely varying lag, complicating the interpretation of EC data.
The upscaling of sap-flow to the Harvest and Control blocks and EC footprint demonstrated a close match between the two independent transpiration measurement techniques (Sect. 3.3, Fig. 9). While tree transpiration comprised a larger fraction of the total ET during the hot June–July period of 2021, this ratio was not altered by the initiation of soil drought in the late June 2021. In general, it seems that the 2021 drought was also not strong enough to affect the seasonality in tree growth (Fig. H1 in the Appendix), carbon uptake (Fig. 4) and transpiration (Fig. 9), although it did induce relative deficits in all these parameters. From the tree viewpoint, the relative moderateness of the 2021 drought follows from the observation that sap flow and transpiration did not decouple from potential evapotranspiration (Fig. 9).
The difference in drought reaction timing between the individual trees in a stand is often ignored in studies based on eddy-covariance technique. While it is a useful tool providing continuous data on CO2 and H2O surface exchange, it yields fluxes averaged over a large area, typically a few ha to over 1 km2 in size (Rebmann et al., 2018). Because of this averaging nature of the EC method, its users can only detect drought responses as substantial changes in ecosystem-average carbon, water and energy fluxes - when (and if) such changes occur. Even over reasonably homogeneous stands, any change in EC footprint might lead to significant differences in estimated NEE and its components, further highlighting the challenge of EC flux attribution to smaller elements of the landscape (Krasnova et al., 2022). Furthermore, the contributions of the ground and trees to the total 30 min exchange rates in EC data are difficult to estimate (Subke and Tenhunen, 2004; Aslan et al., 2024).
Therefore, the second objective consisting of a broad comparison of ecosystem monitoring tools has been accomplished, however, revealing a complex picture of divergent performance, depending on the temporal and spatial scales in question. In summary, no current observational technique offers the combined benefits of directness, continuity, broad spatial coverage, and low uncertainty. However, the specific task of early warning for the initiation of stand drought response could be carried out by sap flow and stem diameter sensors installed in the less resilient trees. Further studies combining more frequent UAV surveys, eddy-covariance, wide soil sensor networks (WTD, moisture content) and larger numbers of sap-flow and dendrometer sensors resolving the tree drought resilience range would enhance the capacity to reconcile these monitoring techniques and gain deeper insights into the onset and progress of drought.
The results of this study complement the existing knowledge on the ecophysiology of Norway spruce-dominated Boreal forests exposed to episodic droughts. Boreal ecosystems typically show an increase in GPP during moderate droughts due to prevalence of sunny weather under drought, although the reduction in the CO2 uptake caused by the tightened stomatal control, decline in photosynthetic capacity and higher respiration tend to curtail any enhancement in net CO2 sink. These factors indeed reduced the NEE in the southern Finnish site of Ränskälänkorpi in June–July 2021.
The Norway spruce trees were found to exhibit stomatal regulation as an immediate defensive measure against water loss, although the drought did not significantly constrain stem radial growth (Appendix H). However, the different ecosystem monitoring tools (eddy-covariance, sap-flow sensors and UAS-based remote sensing) gave rather different indications regarding the drought stress caused by the early stages of a drought.
There was a range of indications of higher Norway spruce resilience to drought in the selection-harvested block than in the unharvested control block. These were manifested in higher photosynthetic CO2 uptake, evapotranspiration, sap flow, stem diameter growth in the Harvest block, which were likely enabled by the lower inter-tree competition for water than in the Control block.
It is proposed that early detection of drought stress in a stand is possible only via analysis of individual tree sap-flow data, while the applicability of eddy-covariance data is inferior due to being area-integrating, and the UAV remote sensing data have coarse temporal coverage. In order to improve the quality of now- and fore-casting of drought stress, it is further suggested that the sap-flow sensors be installed in trees representing the whole range of health and resilience within the stand, so that the most disadvantaged trees would act as indicators of drought onset.
Table A1Total areas of the Harvest and Control blocks, the total projected canopy area, and the projected canopy cover fraction.
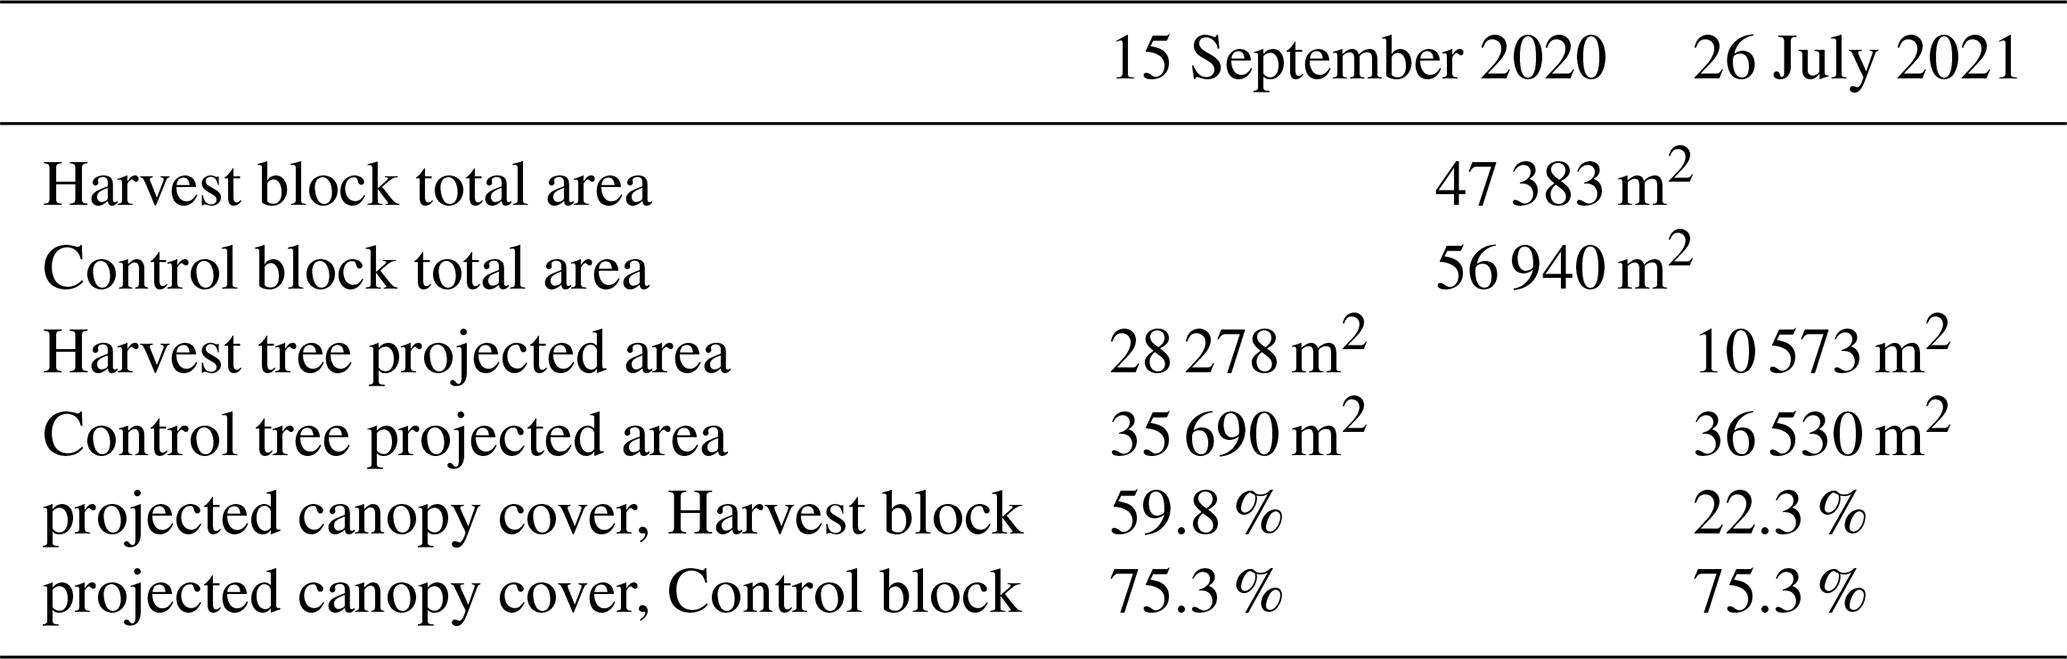
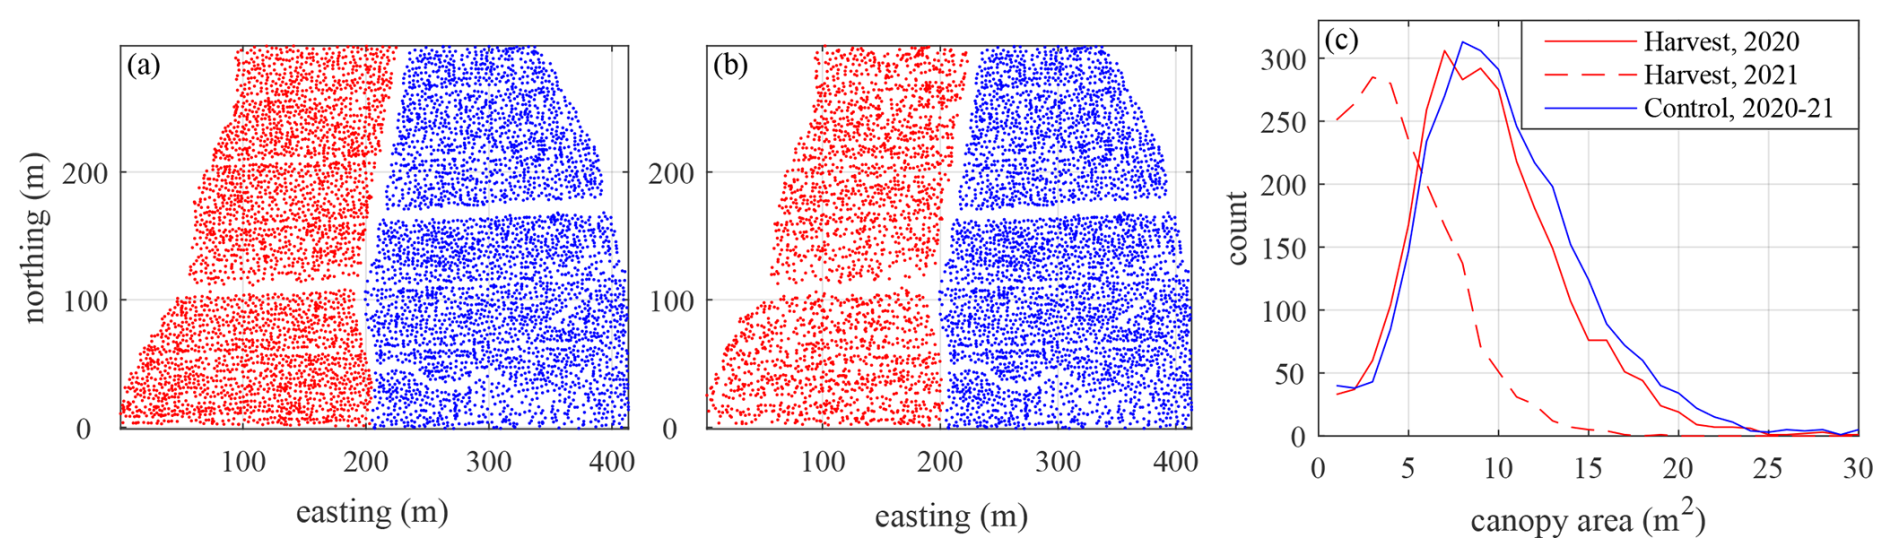
Figure A1(a) Tree locations in the Harvest (red) and Control (blue) blocks prior to selection harvest, based on the 15 September 2020 UAV survey; (b) same as (a), but for post-selection harvest, based on 26 July 2021 UAV survey; (c, d) tree canopy area distributions for Harvest and Control blocks before and after the selection harvest, respectively.
Projected canopy cover was calculated as the total area of the tree canopies identified in orthomosaics from 15 September 2020 and 26 July 2021 to the total area of the Harvest and Control blocks. Canopy projected area was somewhat lower in the Harvest block in 2020 prior to selection harvest, about 60 % compared with 75 % in the Control block (Table A1). Post-selection harvest in 2021, the Harvest block canopy cover was down to 22 %. The tree locations identified in the two UAV surveys are shown in Fig. A1a, b. The tree canopy area distributions prior to selection harvest were nearly identical in the two blocks (Fig. A1c). The distribution for Control shows slightly larger canopies, which might be in part related to the higher challenge of separating the overlapping canopies in the parts of Control block where the tree density was higher. After the selection harvest, the tree area in the Harvest block became strongly reduced (Fig. A1c), indicating that large trees were primarily harvested; the increase in the number of small trees is due to the fact that detection of small trees was facilitated by the removal of large trees.
The 30 min EC footprints were calculated following the Kljun et al. (2015) method, assuming the EC sensor height 29 m a.g.l. and a displacement height of 10 m. The difference in displacement height between the harvest and control blocks is difficult to estimate and thus was ignored. The differences in turbulent field between the two blocks were described by the roughness length, whose measured 30 min (i.e. wind direction-dependent) values were fed to the footprint algorithm.
As follows from Fig. B1a, the peak portion of the footprint falls at about 100 m distance from the EC tower. The cumulative footprint is approximately circular. The trees contributing the most to the estimated turbulent fluxes are therefore located at distances of ca. 25–100 m from the tower, in the SE–S–W sector. the Harvest block contributes at most 50 %–60 % to the total EC signal source, at S–SW winds (Fig. B1b); the rest of the source is contributed by the Control block or extends beyond the research area. The maximum contribution of the Control block approaches 100 % in the eastern sector.
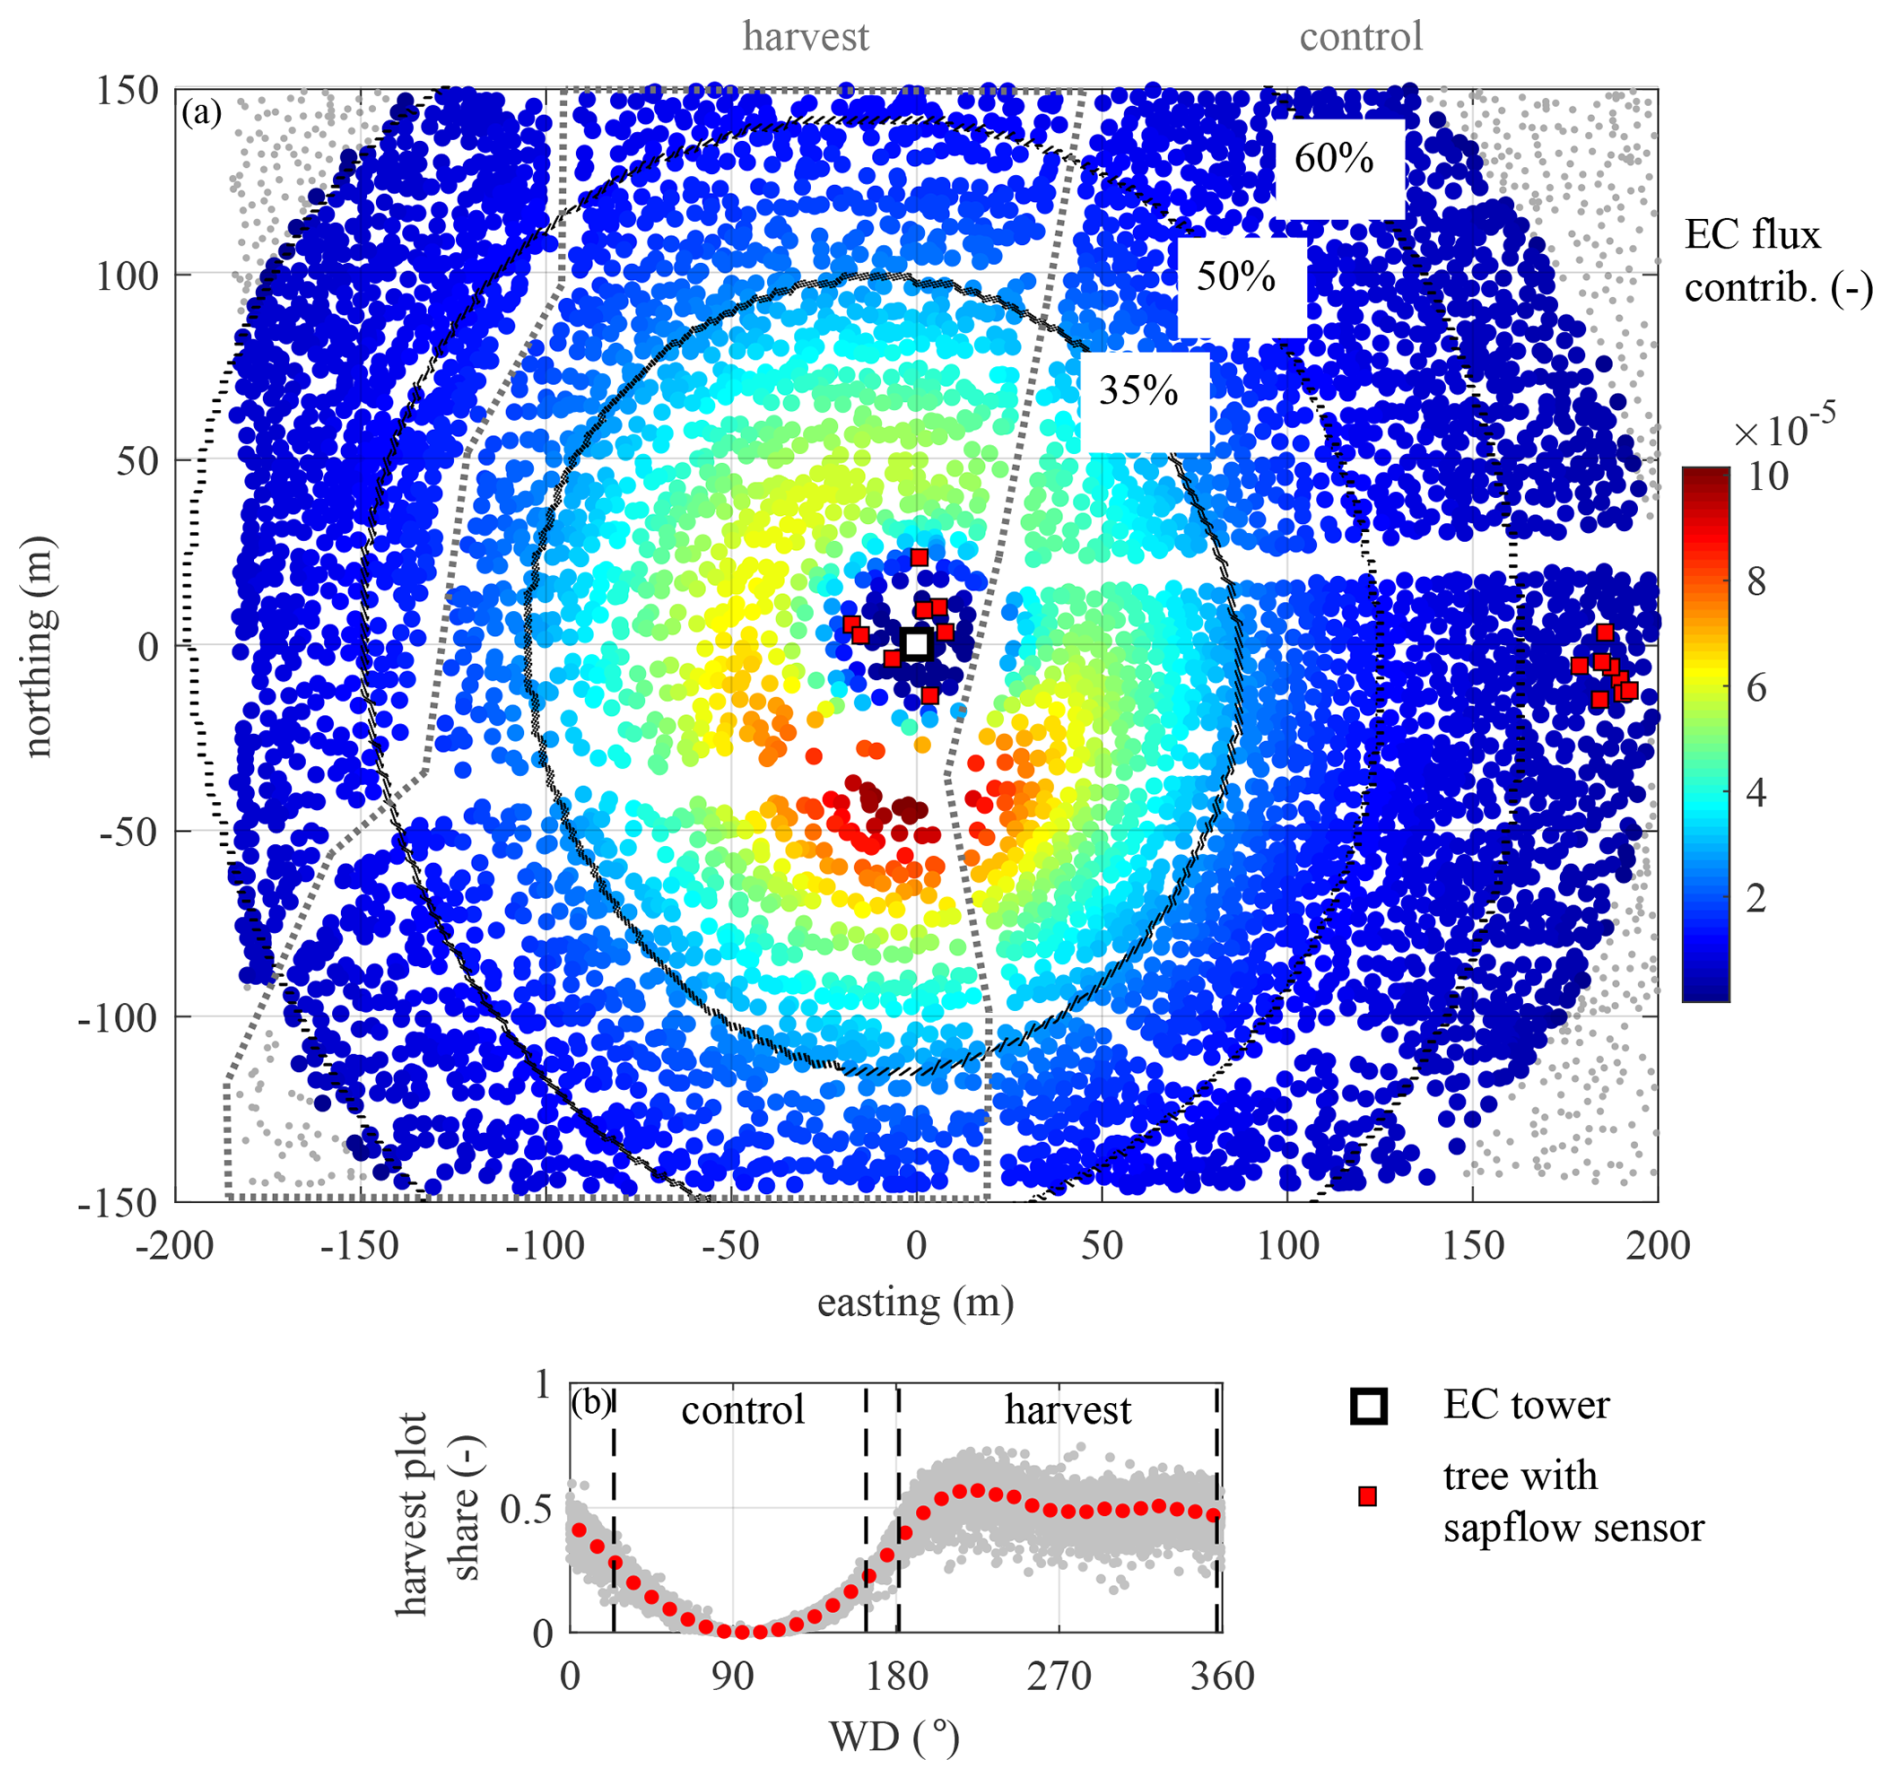
Figure B1(a) Eddy-covariance footprint isolines (bold black lines) and the individual tree contributions to cumulative source of the estimated turbulent fluxes (coloured dots). The colours of dots represent the cumulative summertime EC footprint. The EC tower is located in the center of the imaged area (the white square); northing and easting are calculated relative to the EC tower. The trees with sap flow sensors are shown with red squares. The Harvest block boundary is marked with a dotted line. (b) The dependence of Harvest block contribution to the overall EC flux on wind direction; the rest is the Control block contribution. The grey dots are 30 min averages; the red dots are 10° bin-averages.
A rubber pool filled with water was used as an absolute temperature reference. The pool water temperature was recorded every 10 s by a logger with two T sensors immersed in shadow locations on the opposite ends of the pool (see Appendix D for a photo of the setup). The water was continuously mixed by a portable pump to ensure that the sensor readings corresponded to surface water temperature. The pool temperature was calculated as the average of the readings of the two T sensors for the duration of the UAV flight. The absolute T of the thermal orthomosaics was thus corrected for the mean temperature offset by subtracting from all pixels the difference between the real T of the water pool and the T extracted from the thermal orthomosaic (Table 1). The original post-processed, corrected orthomosaics of surface temperature and NDVI before canopy segmentation are presented in Appendix E.
Tree canopy segmentation is based on an algorithm developed by Silva et al. (2016), which delineates the crowns using centroidal Voronoi tessellation based on tree tops detected using local maxima filtering (Popescu and Wynne, 2004) individual tree detection (ITD). As the trees in the site are generally have a small width compared with height, a narrow search window less than 2 m was required in order to find the local maxima (tree tops) from the Canopy Height Model (CHM). However, such a small window generates artificial tops in non-apex points of trees such as in upward-bending branches. Those tops were removed by examining the neighborhood of each top in the CHM by removing the false tops near ground pixels as the true tree top is expected to be located near the center of the crown ground projection.
Since the trees remaining in the harvest site are narrow and have tops detected near the edges of the crowns, the top neighborhood in CHM did not yield enough information to label the top as incorrect. As there were two flights made in the same area a year apart, the tops could be clustered by distance to correspond to a top detected in the previous survey which had fewer incorrect tops, and only a single top for each tree was assigned. With these two methods, almost all incorrect tops are removed in the Control block. In selection Harvest block, only about 5 % of the remaining tops are incorrect, which is we consider as good method performance for such a dense natural canopy. The methods also successfully remove the incorrect tops detected in CHM noise points, which are caused from lower image overlap in certain areas in 2021 RGB survey.
In 2020, individual tree detection was carried out in an area of 20 ha, yielding 10 188 trees in total; of these, 9202 trees had h>15 m. In 2021, the area was 12 ha, yielding 6612 trees with h>0, including 5820 trees with h>15 m.
For individual tree level analysis, the trees in 2020 and 2021 datasets are associated by finding the crowns with the highest overlap in area. In addition, the height difference is ensured to be less than 1 m so that correct trees are associated between the 2020 and 2021 data despite the larger number of smaller trees that are identified in the harvest plot thanks to the more open canopy after the selection harvest. In this way the slight georeferencing difference between the orthomosaics could be ignored and each associated 2020–2021 tree pair was given a unique ID.
Next, the individual tree canopy bands were calculated as the means of the orthomosaic pixels lying inside the tree canopy boundaries. The non-foliage ground pixels in the canopy segments were removed by choosing a NGRDI threshold value that was found to most efficiently separate the tree foliage from the woody tree parts and the ground. For each tree canopy, several indices were calculated from the pixels lying within the boundaries of a segmented canopy. The canopy mean RGB brightness was also calculated as the mean value of the RGB camera bands (Fig. 10e, f). The mean calibrated R and NIR band values from the multispectral camera orthomosaic were used to calculate the canopy-mean NDVI index values (Fig. 10g, h). The canopy-mean temperatures were obtained from the surface temperature map, and subsequently corrected for the brightness variations among the canopies, in order to eliminate the effect of unequal incident radiation (Appendix G). Finally, the temperature-based stomatal resistance was calculated (Eq. 11, Fig. 10a, b).
As the UAV images show only the top of the canopy layer, the ITD process for the 2021 imagery detects approximately 50 % of the trees in the control areas and 80 % in the selection harvest area when compared to Terrestrial Laser Scanning (TLS) campaigns undertaken in two 50 × 50 m survey areas in the control and harvest plots in spring 2021 after the selection harvest. To correct this bias, the true size distribution of all trees in the site was modeled using a Horvitz-Thompson-type approach developed by Kansanen et al. (2022), which estimates the detectability (α) of each tree. Here, the trees are ordered by height, and the tallest tree are assigned the detectability equal to 1. For the rest of the trees, the number of trees could be calculated using α. This method corrects the distribution for the set of trees with height detected using ITD, but does not sufficiently correct the bias for trees with height less than 10 m since these remain mostly unseen in the UAV photos. The trees with heights of less than 5 m are also mostly undetected in the TLS surveys. α may also be understood as an estimate of the overall success of the UAV imaging and the methodology used to identify and segment the canopies form the UAV data.
Estimation of individual tree stomatal conductance from UAV-measured crown temperature involved a set of references presented in Fig. D1. The two branch piles, wet and dry, represent the freely evaporating and non-evaporating canopies, respectively. Both branch piles are placed on a frame elevated ca. 70 cm from the ground in order to allow aeration from the bottom, in order to closer imitate the aerodynamic conductance profile of a real tree canopy. The wet branch pile is amply sprayed with water by means of a watering bucket, resulting in a temperature contrast as shown in the right-hand part of the figure. Nearby, a water pool for absolute temperature correction was set up, with a small pump continuously mixing the water, and two temperature sensors suspended near the surface in the opposite ends of the pool.
The multispectral reference was a 1 m2 steel sheet painted gray, placed near the thermal references.
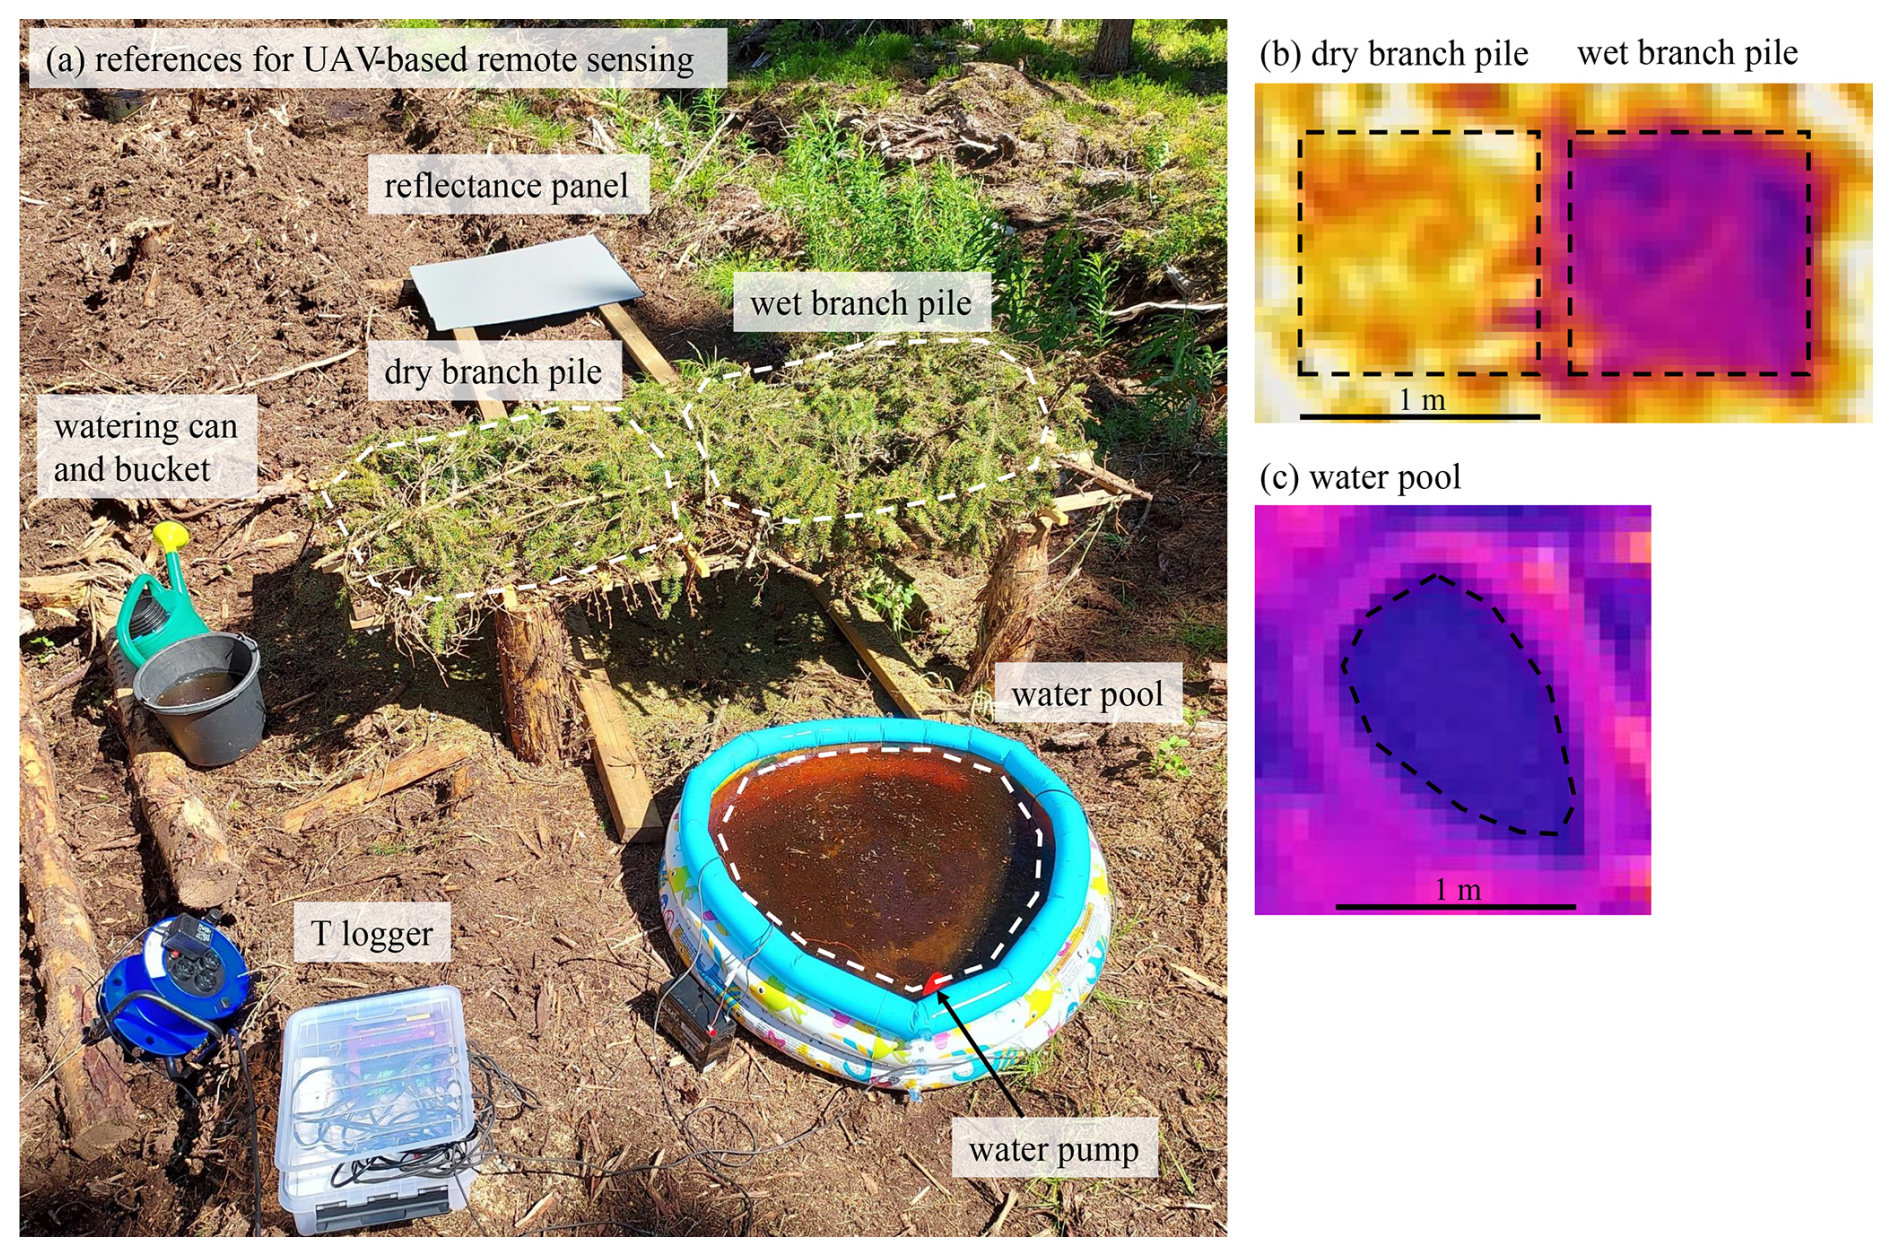
Figure D1Ground references for stomatal resistance estimation after adapted to the forest case. A ground photo and the views of the references as registered by the thermal camera from a 40 m altitude a.g.l.
Sap flow data were measured in 7 trees in the control and 8 trees in the harvest sites. The sap flow time series were quality controlled by visual inspection and apparently faulty periods removed based on high random error, scatter or unrealistic daily sap flow pattern. The periods that were offset to the positive nighttime values but retained a realistic diurnal pattern were corrected, separately for each day, by adjusting the sap flow values with a constant value added to each day so that the mean of the sap flow values between 00:00 and 04:00 GMT+3 becomes zero. The parameters of the sap flow trees are summarized in Table E1.
A method to upscale sap flow from single tree to EC footprint and block scale was performed based on previous approaches (Čermák et al., 2004; Zhang et al., 2018). In the current study, tree height was chosen as the explanatory variable for the following reasons. First, the number of sap flow sensors per treatment (7 and 8 in control and harvest, respectively) allows using only one explanatory variable. Second, it is known that tree-specific sap flow is strongly dependent on tree size, in the general sense. Third, out of all tree structural parameters, tree height is most readily obtained from the UAV photogrammetric digital elevation model. Fourth, the tree height shows a strong relationship with the sap flow in the 15 trees that have sap flow sensors installed (Fig. E1).
Table E1Parameters of the spruce trees monitored with sap flow and stem diameter sensors.
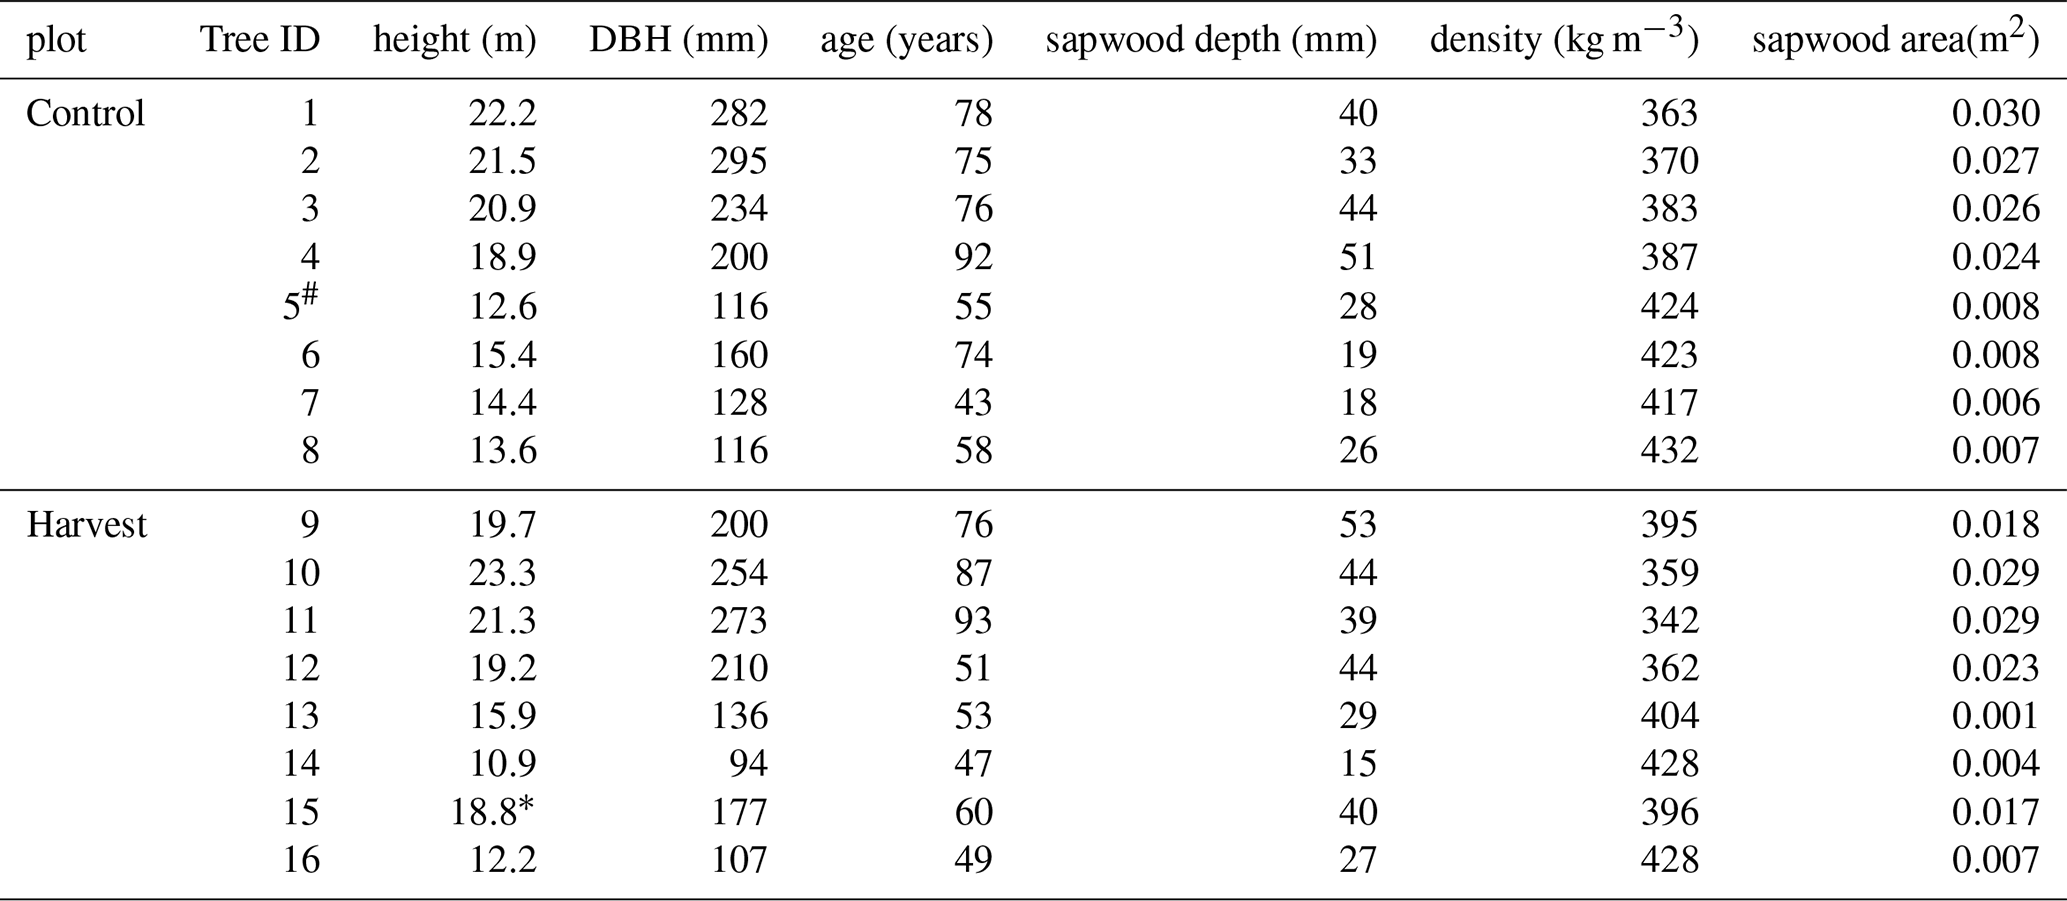
#Tree No. 5 was not used due to the technical issues with the sap flow sensor. ∗The height is estimated using the DBH-height relationship derived for this site (not shown). The tree No. 5 is excluded from sap flow analyses due to the issues with its sap flow sensor, but is retained in dendrometer analyses.
The fitting of a power function y=axb where y is the sap flow, x the tree height, and a, b the fit coefficients was done separately to the harvest and control trees. See Fig. E1 for an example of an upscaling curve. As sap flow was not measured in trees under 10 m in height, an assumption is made that the trees with infinitesimally small height have zero sap flow, in order to anchor the fit to the point of origin. This fitting procedure might lead to certain overestimation of sap flow in trees with heights of under 10 m, as the smaller trees are typically shaded more than the taller trees, which limits their sap flow. Nevertheless, this is of minor importance for the total upscaled sap flow of the forest, as the stand-scale sapflow is mainly contributed by large trees. Sap flow of each individual tree detected in drone orthomosaics is calculated from the regressions for the Control and Harvest blocks.
The radial growth of the trees detailed in Table E1 is presented in Appendix H.
For the harvest and control plots, the total sap flow is a simple sum of sap flows modeled for each tree. The total sap flow within the EC flux source area was achieved by weighing the individual tree sap flow values by the individual tree EC footprint values. In order to facilitate the comparison of the upscaled sap flow with ET derived from the EC latent heat flux, the upscaled sap flow values were expressed in the units of mm d−1.
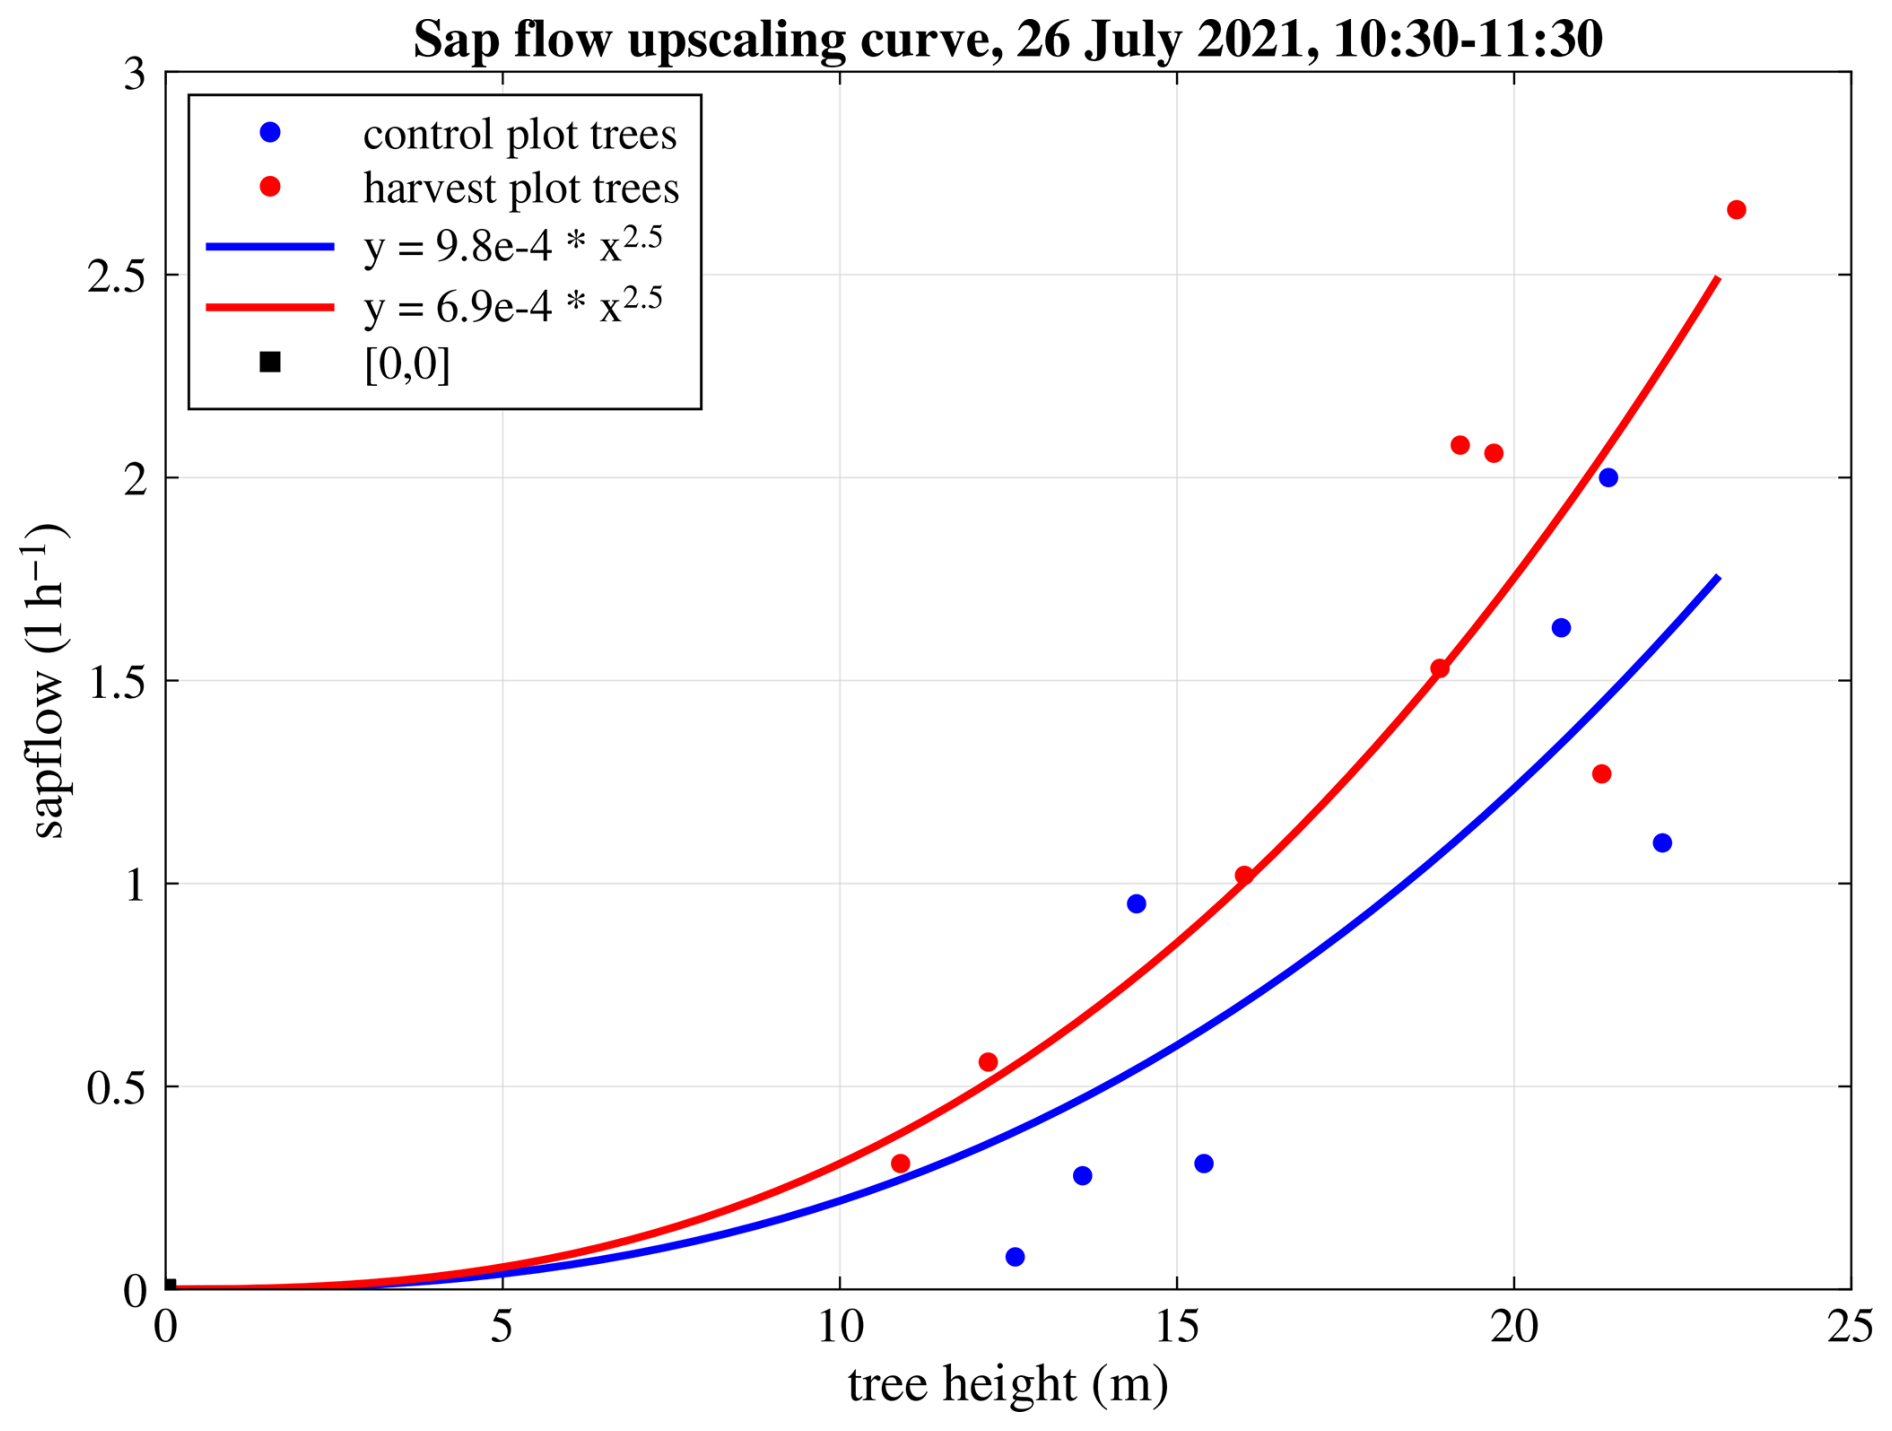
Figure E1An example of sap flow vs. tree height curves used for upscaling from tree to forest scales, averaged for the duration of the 4th UAV flight on 26 July 2021.
The original surface temperature and NDVI orthomosaics obtained in 2020 and 2021 are presented in Fig. F1.
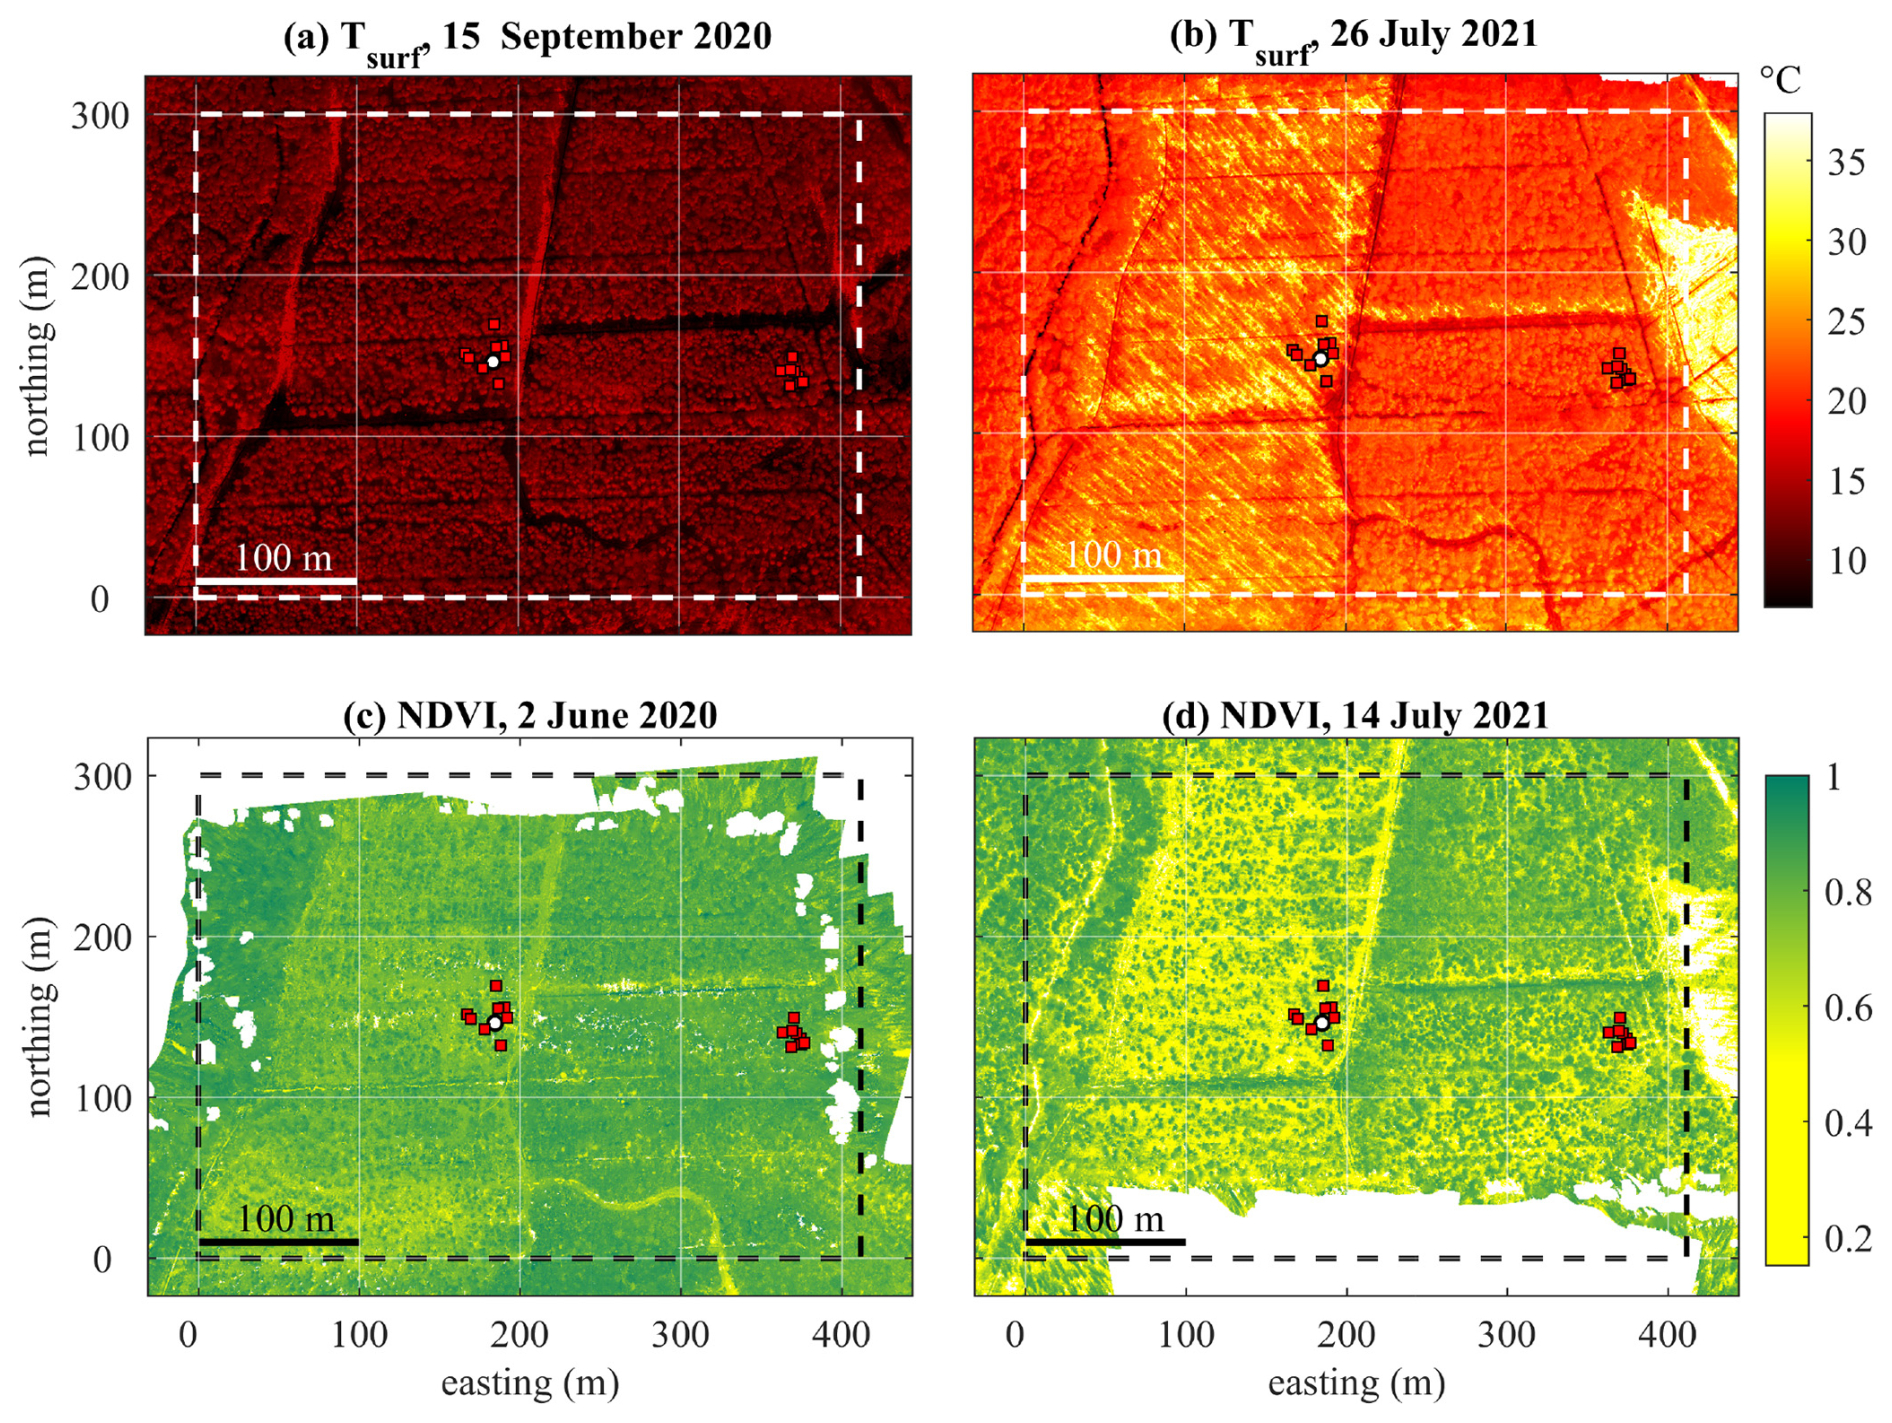
Figure F1(a, b) the original thermal orthomosaics based on the UAV flights on the 15 September 2020 and 26 July 2021, before canopy segmentation. (c, d) The original NDVI orthomosaics of 2 June 2021 and 14 July 2021. The mapped area and legend are as in Fig. 1.
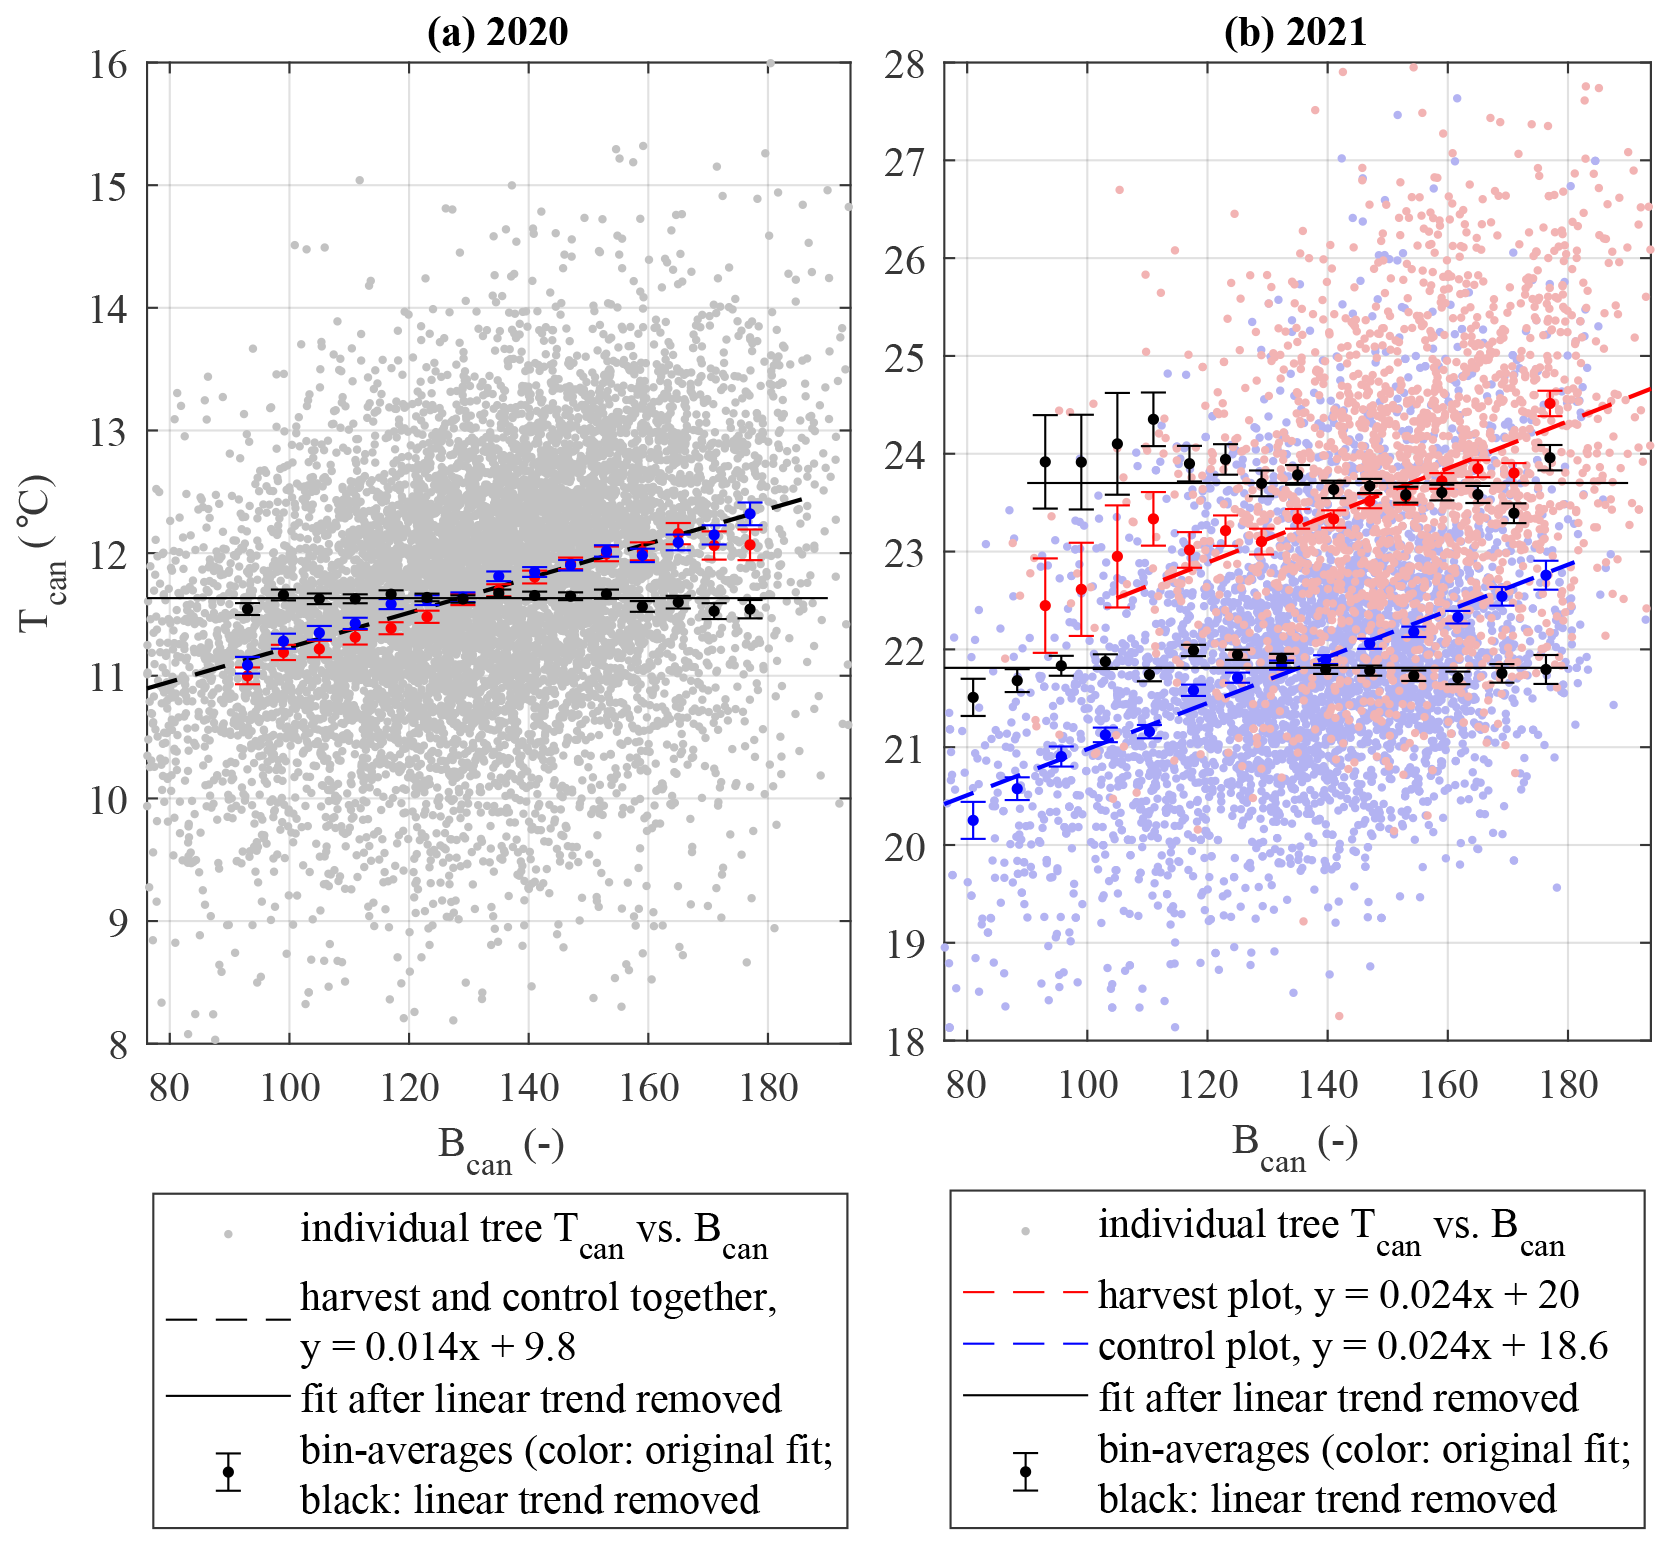
Figure G1Individual tree canopy temperature versus canopy brightness for the UAV flight data of 15 September 2020 (a) and 26 July 2021 (b).
Contrasting relationships between canopy brightness and temperature were observed in the data of 15 September 2020 (pre-harvest) and 26 July 2021 (after harvest, during drought) (Fig. G1). The regression lines of control and harvest practically coincide on 15 September 2020 and differ mainly by the intercept on 26 July 2021 (18.7 and 20.0 °C, respectively), the slope being almost equal (0.024). The main difference between the two flights is found in the slope of the Tcan vs. Bcan regression between the two dates, 0.014 and 0.024, respectively. Based on this evidence of a pronounced effect of canopy brightness on canopy temperature, the corrected canopy temperature (with the brightness effect eliminated) was calculated by subtracting from Tcan the linear relationship between Tcan and Bcan. Then, the corrected version of the temperature-based stomatal resistance rs T,corr was calculated (Eq. 11) using the brightness-corrected Tcan.
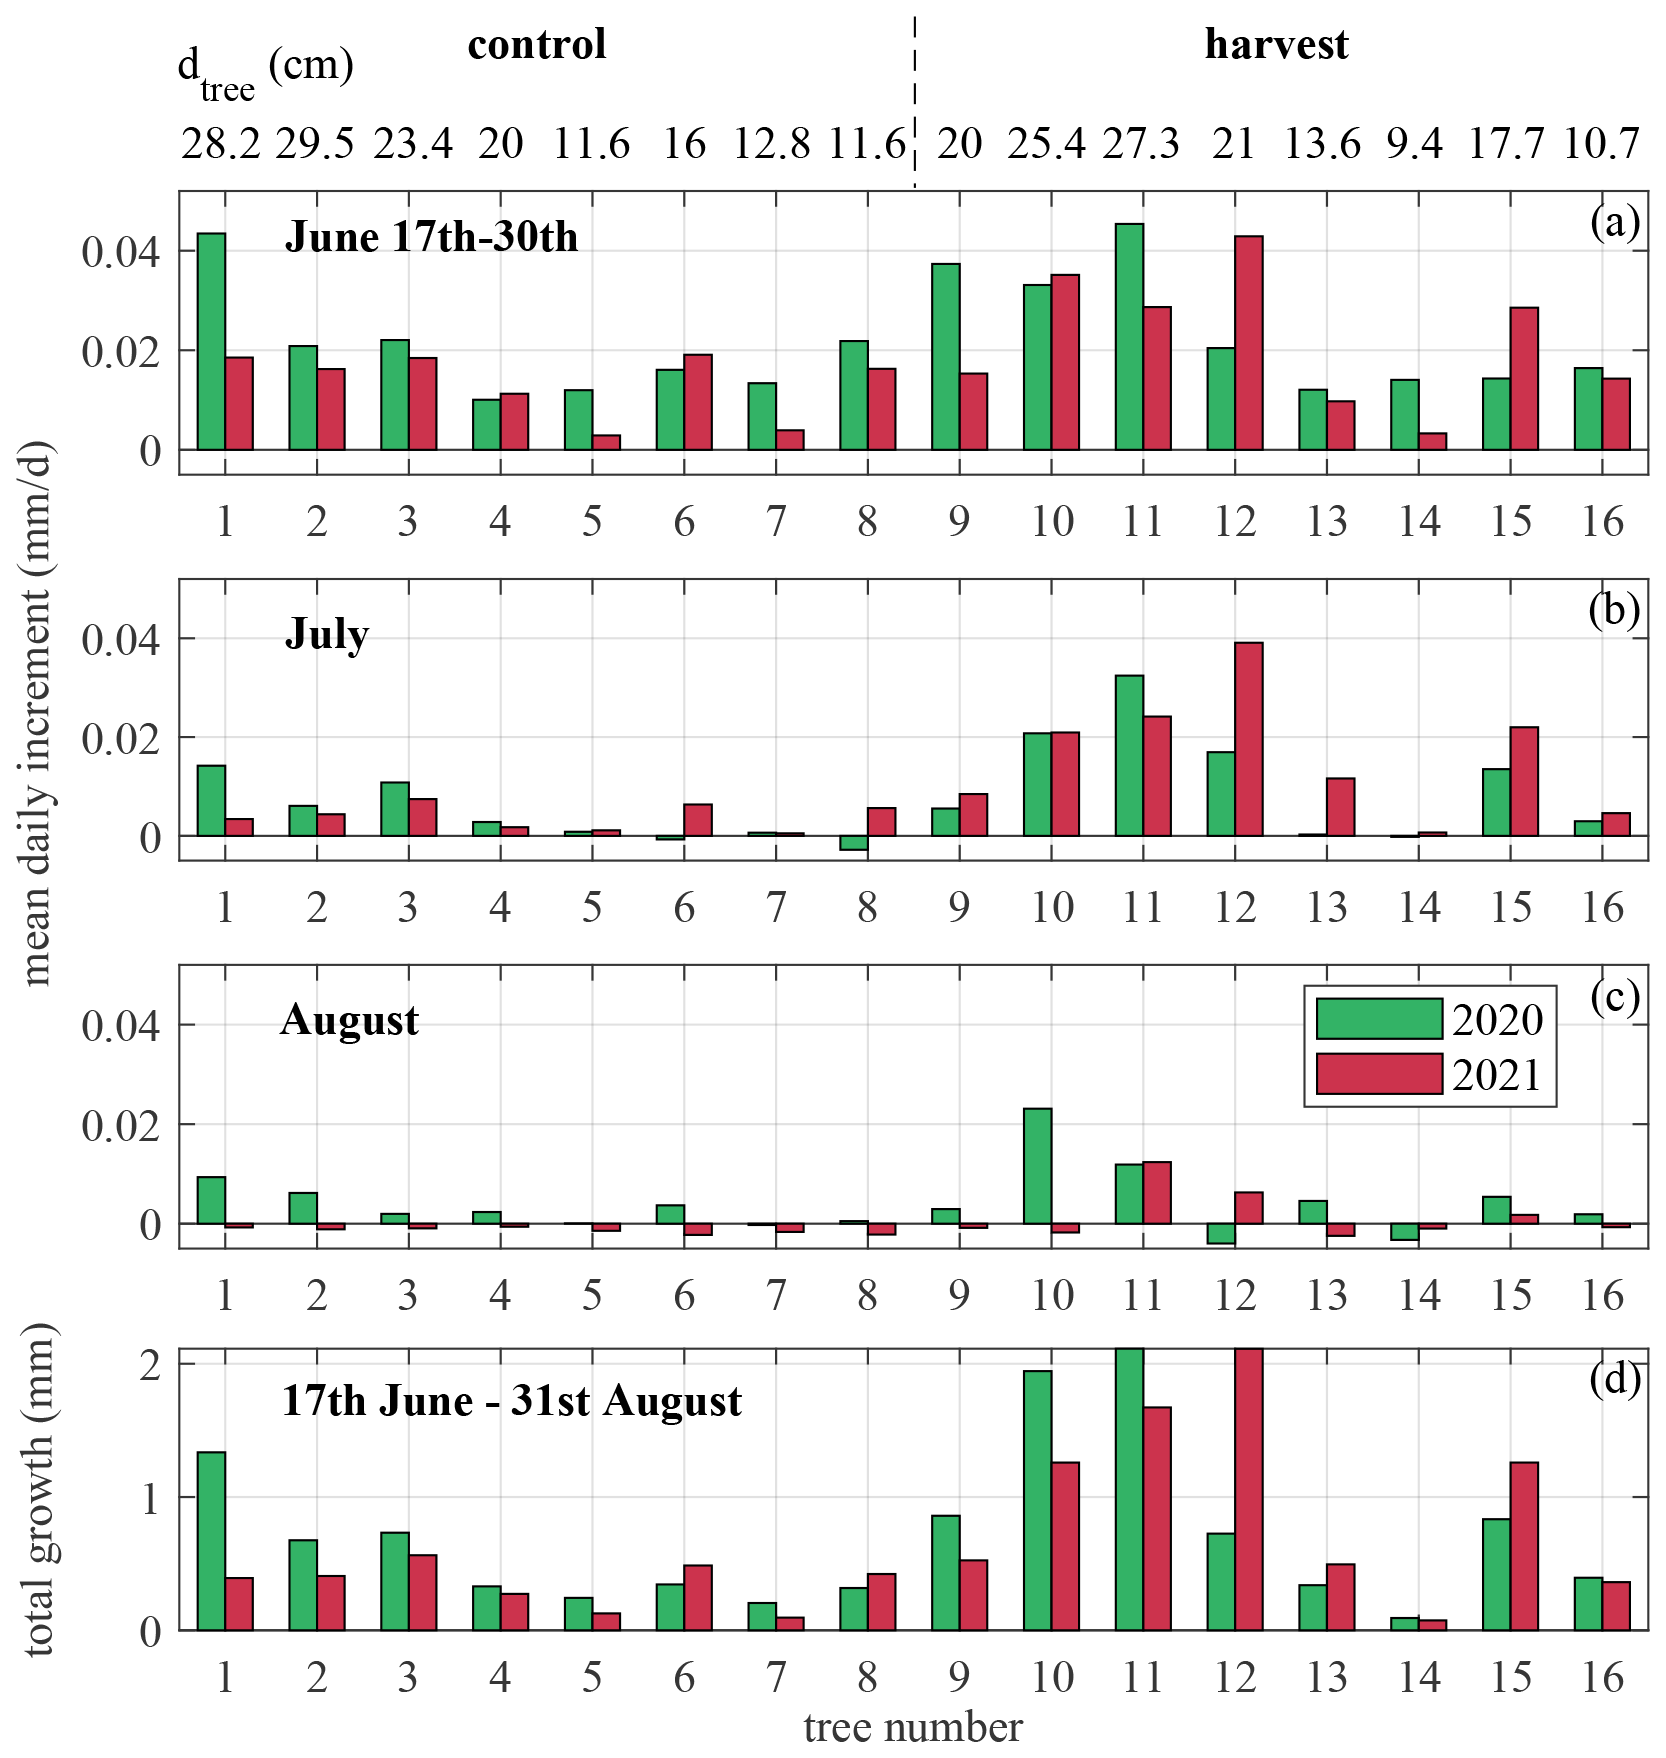
Figure H1Tree diameter increment for the monitored trees in Control and Harvest blocks in 2020 and 2021. Mean daily stem diameter increment in (a) 17–30 June, (b) July and (c) August; (d) total growth in 17 June–31 August. The trees 1–8 are in the Control block, 9–16 in the Harvest (CCF) block.
17–30 June is used as the period of good dendrometer data coverage in 2020, and used also for 2021 for the sake of consistency. 2020 and 2021 display the normal seasonality of Norway spruce stem diameter in southern Finland, with some differences between Control and Harvest (Fig. H1). The trees monitored with dendrometers show generally more growth in the Harvest block than in the Control block, in all months and in over the whole summer. The only exception in the Control is the dominant tree No. 1 that in 2020 showed growth comparable with the fastest growing trees in the Harvest block. The growth in June was the greatest of all summer months in both blocks and both years; it slowed down considerably in July and August, particularly in Control. In August 2021, most trees showed small stem shrinkage, except for trees No. 11, 12 and 15 (all in Harvest), which did grow slightly.
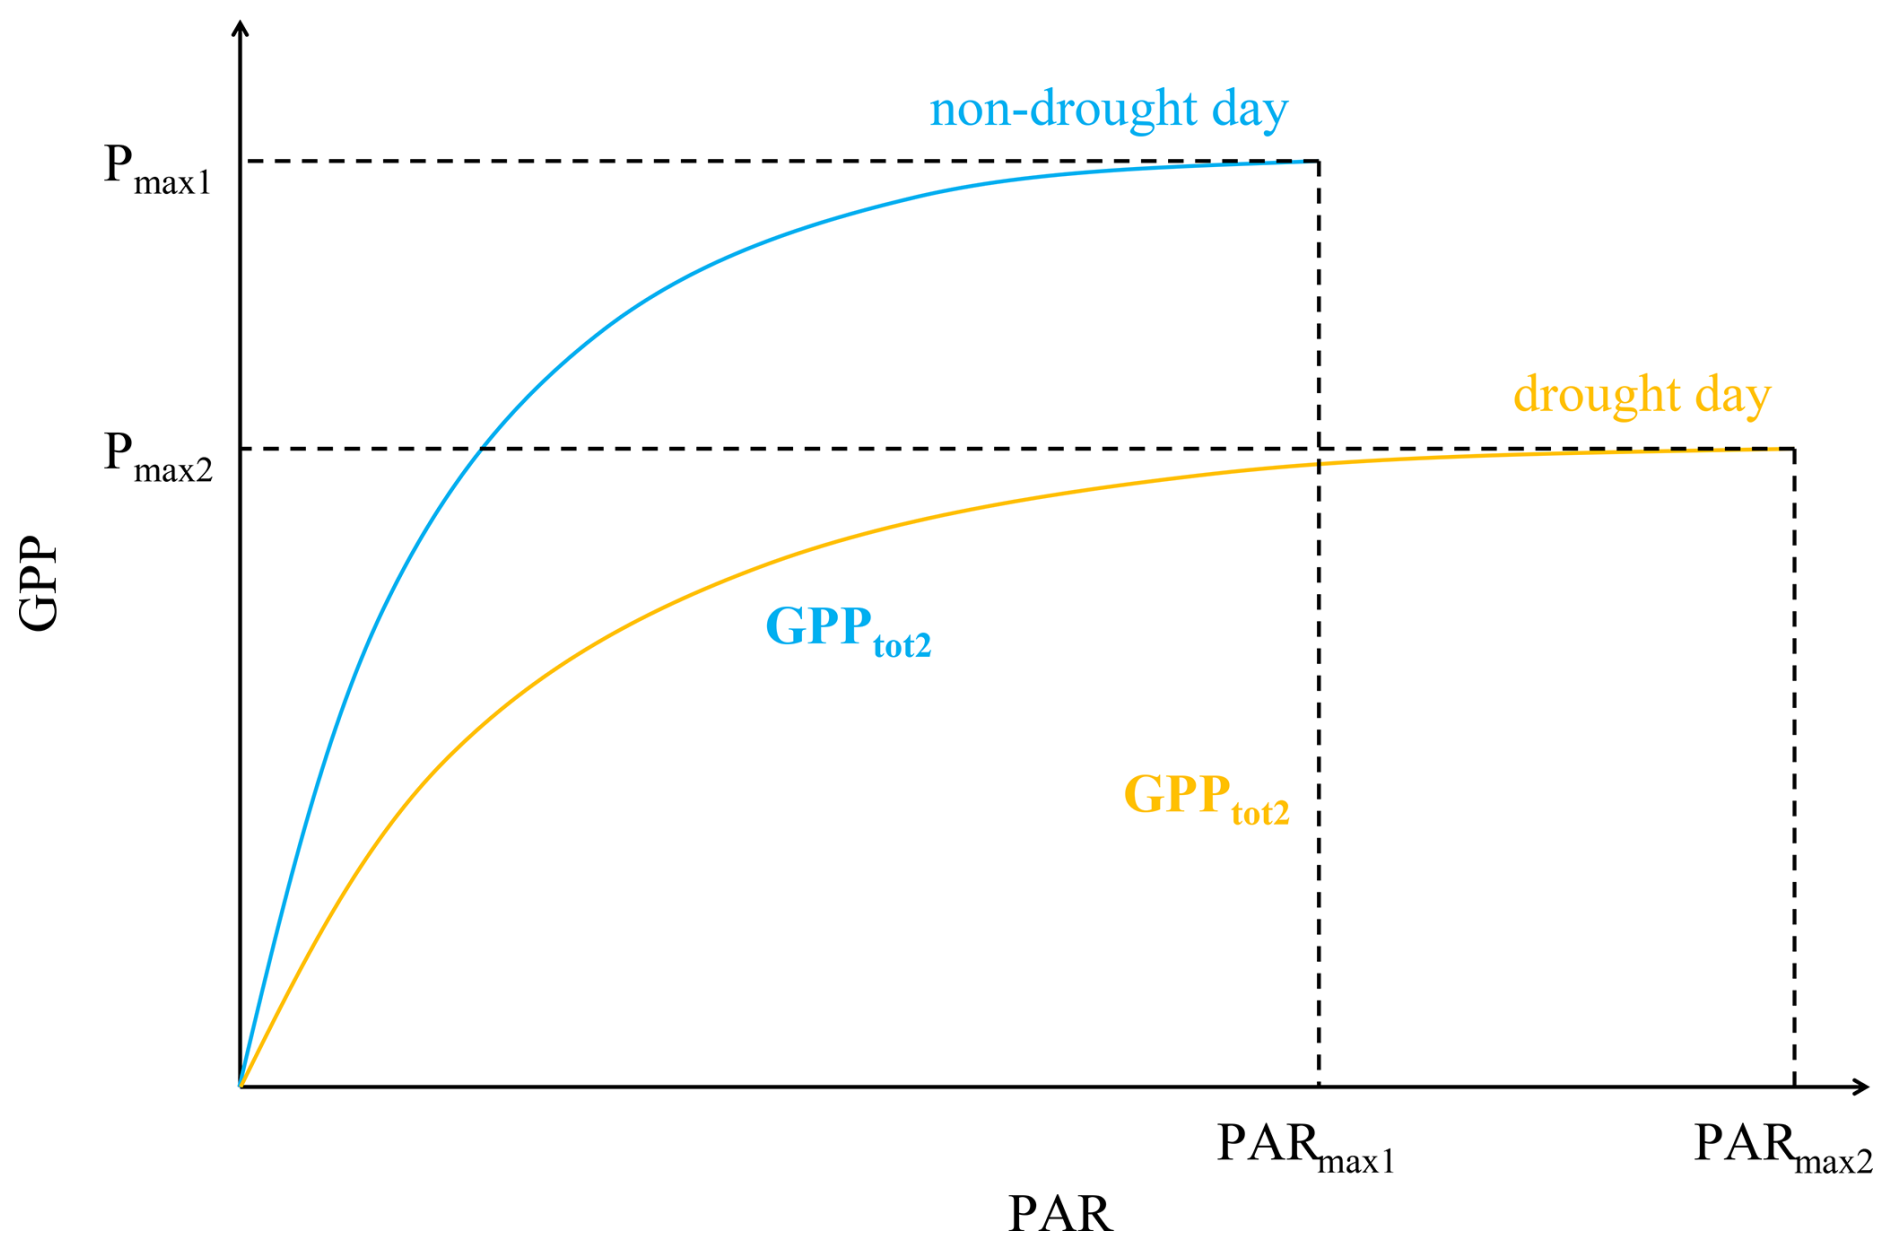
Figure I1Comparison of daily light response curves on a drought day (yellow) and non-drought day (cyan).
Drought days can lead to daily integral GPP that is comparable to that on non-drought days. This may be shown with two light response curves (Fig. I1). The drought conditions lead to a reduction in photosynthetic efficiency so that Pmax2 at drought is greater than Pmax1 at no drought, but the drought days are typically sunnier, meaning PARmax2 on a drought day is, on average, greater than PARmax1 on a non-drought day. In effect, the relatively higher solar radiation around noon on a typical drought day thus compensates for the relative daily GPP deficit caused by vegetation drought responses.
This study uses a large and diverse dataset and a complex code. To ensure appropriate use and interpretation, interested researchers are encouraged to consult the authors. The complete dataset and code used in this study are available from the corresponding author upon request.
PKA formulated the study framework, conducted UAV flights, analyzed the data and prepared the manuscript. MP helped formulate the conceptual framework, contributed to the manuscript, provided commentary on tree physiology, conducted in-situ tree measurements and provided the relevant field data. RM provided general supervision, made contributions on CCF- and stand structure-related topics, and wrote parts of the manuscript. VT processed and analyzed the UAV data, performed the statistical corrections of tree population data and contributed to the text. TL took care of eddy-covariance and meteorological data and contributed to the text. HJ provided expertise in thermal and multispectral remote sensing and helped interpret the relevant data. MM processed the UAV data, conducted the LAI and stand structure surveys, and wrote parts of the text. EL conducted UAV flights and processed the UAV data. HR contributed to the text and provided expertise on eddy-covariance data. TV provided the UAV equipment and contributed to the manuscript. SL provided overall supervision, helped conceptual framework, advised on the writing and data analysis, and wrote parts of the manuscript.
The contact author has declared that none of the authors has any competing interests.
Publisher's note: Copernicus Publications remains neutral with regard to jurisdictional claims made in the text, published maps, institutional affiliations, or any other geographical representation in this paper. The authors bear the ultimate responsibility for providing appropriate place names. Views expressed in the text are those of the authors and do not necessarily reflect the views of the publisher.
We are grateful to Prof. Lauri Mehtätalo (Natural resources Institute Finland) who provided advice on the statistical corrections to the tree population derived from the UAV maps and the sap flow upscaling approach. The team of engineers responsible for the measurements at the Ränskälänkorpi site are gratefully acknowledged.
We acknowledge the financial support of ICOS Finland by University of Helsinki. PKA received a Postdoctoral grant from the Research Council of Finland for the project DRONESTRESS (grant no. 351129). PKA and SL received support from the EU Horizon 2020 Framework Programme, EU H2020 Excellent Science (GreedFeedBack, grant no. 101056921) and the Research Council of Finland (grant no. 356138). MM received funding from the Postdoctoral Programme for Research Institutes in Finland. EL received funding the Interreg Northern Periphery and Arctic Programme, Co-funded by the European Union, project FORESTCARBOVISION (grant no. NPA0800248), funding from Research Council of Finland, the Academy of Finland Flagship Programme (Forest-Human-Machine Interplay (UNITE), grant no. 337653), and funding from Business Finland, project Digital Forest Carbon Twins. This study received financial support frm the Research Council of Finland Flagship Programme (UNITE Flagship, grant no. 359174). This project received further funding from the Research Council of Finland through grant nos. 374131, 372822. This study also received support from the ACCC Flagship funded by the Research Council of Finland (grant no. 337552).
This paper was edited by Ivonne Trebs and reviewed by Prajwal Khanal and two anonymous referees.
Adams, J.: climate_indices, an open-source Python library providing reference implementations of commonly used climate indices, https://github.com/monocongo/climate_indices (last access: 24 August 2026), 2017.
Aldea, J., Bianchi, S., Nilsson, U., Hynynen, J., Lee, D., Holmström, E., and Huuskonen, S.: Evaluation of growth models for mixed forests used in Swedish and Finnish decision support systems, For. Ecol. Manag., 529, 120721, https://doi.org/10.1016/j.foreco.2022.120721, 2023.
Alderfasi, A. A. and Nielsen, D. C.: Use of crop water stress index for monitoring water status and scheduling irrigation in wheat, Agric. Water Manag., 47, 69–75, 2001.
Alekseychik, P., Korrensalo, A., Mammarella, I., Launiainen, S., Tuittila, E.-S., Korpela, I., and Vesala, T.: Carbon balance of a Finnish bog: temporal variability and limiting factors based on 6 years of eddy-covariance data, Biogeosciences, 18, 4681–4704, https://doi.org/10.5194/bg-18-4681-2021, 2021.
Arend, M., Link, R. M., Patthey, R., Hoch, G., Schuldt, B., and Kahmen, A.: Rapid hydraulic collapse as cause of drought-induced mortality in conifers, Proc. Natl. Acad. Sci. USA, 118, e2025251118, https://doi.org/10.1073/pnas.2025251118, 2021.
Aslan, T., Launiainen, S., Kolari, P., Peltola, O., Aalto, J., Bäck, J., Vesala, T., and Mammarella, I.: Thinning turned boreal forest to a temporary carbon source – short-term effects of partial harvest on carbon dioxide and water vapor fluxes, Agric. For. Meteorol., 353, 110061, https://doi.org/10.1016/j.agrformet.2024.110061, 2024.
Aubinet, M., Vesala, T., and Papale, D. (Eds): Eddy covariance: a practical guide to measurement and data analysis, Springer, https://doi.org/10.1007/978-94-007-2351-1, 2012.
Balting, D. F., AghaKouchak, A., Lohmann, G., and Ionita, M.: Northern Hemisphere drought risk in a warming climate, npj Clim. Atmos. Sci., 4, 61, https://doi.org/10.1038/s41612-021-00218-2, 2021.
Barbedo, J. G. A.: A review on the use of unmanned aerial vehicles and imaging sensors for monitoring and assessing plant stresses, Drones, 3, 40, https://doi.org/10.3390/drones3020040, 2019.
Beniston, M. and Stephenson, D. B.: Extreme climatic events and their evolution under changing climatic conditions, Global Planet. Change, 44, 1–9, https://doi.org/10.1016/j.gloplacha.2004.06.001, 2004.
Bennett, A. C., Penman, T. D., Arndt, S. K., Roxburgh, S. H., and Bennett, L. T.: Climate more important than soils for predicting forest biomass at the continental scale, Ecography, 43, 1692–1705, 2020.
Berni, J. A. J., Zarco-Tejada, P. J., Suárez, L., González-Dugo, V., and Fereres, E.: Remote sensing of vegetation from UAV platforms using lightweight multispectral and thermal imaging sensors, Int. Arch. Photogramm. Remote Sens. Spatial Inf. Sci., 38, 6 pp., 2009.
Bouriaud, O. and Popa, I.: Comparative dendroclimatic study of Scots pine, Norway spruce, and silver fir in the Vrancea Range, Eastern Carpathian Mountains, Trees, 23, 95–106, 2009.
Bréda, N., Huc, R., Granier, A., and Dreyer, E.: Temperate forest trees and stands under severe drought: a review of ecophysiological responses, adaptation processes and long-term consequences, Ann. For. Sci., 63, 625–644, 2006.
Brunner, A., Valkonen, S., Goude, M., Hanssen, K. H., and Erefur, C.: Chapter 2: Definitions and terminology: What is continuous cover forestry in Fennoscandia?, in: Continuous Cover Forestry in Boreal Nordic Countries, edited by: Rautio, P., Routa, J., Huuskonen, S., Holmström, E., Cedergren, J., and Kuehne, C., Springer, Cham, 11–43, https://doi.org/10.1007/978-3-031-70484-0_2, 2024.
Čermák, J., Kučera, J., and Nadezhdina, N.: Sap flow measurements with some thermodynamic methods, flow integration within trees and scaling up from sample trees to entire forest stands, Trees, 18, 529–546, 2004.
Čermák, J., Kučera, J., Bauerle, W. L., Phillips, N., and Hinckley, T. M.: Tree water storage and its diurnal dynamics related to sap flow and changes in stem volume in old-growth Douglas-fir trees, Tree Physiol., 27, 181–198, https://doi.org/10.1093/treephys/27.2.181, 2007.
Čermák, P., Kolář, T., Žid, T., Trnka, M., and Rybníček, M.: Norway spruce responses to drought forcing in areas affected by forest decline, For. Syst., 28, e016, https://doi.org/10.5424/fs/2019283-14868, 2019.
Clausnitzer, F., Köstner, B., Schwärzel, K., and Bernhofer, C.: Relationships between canopy transpiration, atmospheric conditions and soil water availability – Analyses of long-term sap-flow measurements in an old Norway spruce forest at the Ore Mountains/Germany, Agric. For. Meteorol., 151, 1023–1034, 2011.
Danneyrolles, V., Boucher, Y., Fournier, R., and Valeria, O.: Positive effects of projected climate change on post-disturbance forest regrowth rates in northeastern North American boreal forests, Environ. Res. Lett., 18, 024041, https://doi.org/10.1088/1748-9326/acb72a, 2023.
Del Río, M., Pretzsch, H., Ruíz-Peinado, R., Ampoorter, E., Annighöfer, P., Barbeito, I., Bielak, K., Brazaitis, G., Coll, L., Drössler, L., and Fabrika, M.: Species interactions increase the temporal stability of community productivity in Pinus sylvestris–Fagus sylvatica mixtures across Europe, J. Ecol., 105, 1032–1043, 2017.
Ditmarová, Ľ., Kurjak, D., Palmroth, S., Kmeť, J., and Střelcová, K.: Physiological responses of Norway spruce (Picea abies) seedlings to drought stress, Tree Physiol., 30, 205–213, 2010.
D'Orangeville, L., Maxwell, J., Kneeshaw, D., Pederson, N., Duchesne, L., Logan, T., Houle, D., Arseneault, D., Beier, C. M., Bishop, D. A., Druckenbrod, D., Fraver, S., Girard, F., Halman, J., Hansen, C., Hart, J. L., Hartmann, H., Kaye, M., Leblanc, D., Manzoni, S., Ouimet, R., Rayback, S., Rollinson, C. R., and Phillips, R. P.: Drought timing and local climate determine the sensitivity of eastern temperate forests to drought, Glob. Change Biol., 24, 2339–2351, https://doi.org/10.1111/gcb.14096, 2018.
Dreyer, I., Antunes, S., Hoshi, T., Müller-Röber, B., Palme, K., Pongs, O., Reintanz, B., and Hedrich, R.: Plant K+ channel alpha-subunits assemble indiscriminately, Biophys. J., 72, 2143–2150, 1997.
Ecke, S., Dempewolf, J., Frey, J., Schwaller, A., Endres, E., Klemmt, H. J., Tiede, D., and Seifert, T.: UAV-based forest health monitoring: A systematic review, Remote Sens., 14, 3205, https://doi.org/10.3390/rs14133205, 2022.
Elkin, C., Giuggiola, A., Rigling, A., and Bugmann, H.: Short- and long-term efficacy of forest thinning to mitigate drought impacts in mountain forests in the European Alps, Ecol. Appl., 25, 1083–1098, 2015.
Erdem, Y., Arin, L., Erdem, T., Polat, S., Deveci, M., Okursoy, H., and Gültaş, H. T.: Crop water stress index for assessing irrigation scheduling of drip irrigated broccoli (Brassica oleracea L. var. italica), Agric. Water Manag., 98, 148–156, 2010.
Escós, J., Alados, C. L., Pugnaire, F. I., Puigdefábregas, J., and Emlen, J.: Stress resistance strategy in an arid land shrub: interactions between developmental instability and fractal dimension, J. Arid Environ., 45, 325–336, 2000.
Felsche, E., Böhnisch, A., Poschlod, B., and Ludwig, R.: European hot and dry summers are projected to become more frequent and expand northwards, Commun. Earth Environ., 5, 410, https://doi.org/10.1038/s43247-024-01575-5, 2024.
Friedrichs, D. A., Trouet, V., Büntgen, U., Frank, D. C., Esper, J., Neuwirth, B., and Löffler, J.: Species-specific climate sensitivity of tree growth in Central-West Germany, Trees, 23, 729–739, 2009.
Galiano, L., Timofeeva, G., Saurer, M., Siegwolf, R., Martínez-Vilalta, J., Hommel, R., and Gessler, A.: The fate of recently fixed carbon after drought release: towards unravelling C storage regulation in Tilia platyphyllos and Pinus sylvestris, Plant Cell Environ., 40, 1711–1724, 2017.
Gartner, K., Nadezhdina, N., Englisch, M., Čermak, J., and Leitgeb, E.: Sap flow of birch and Norway spruce during the European heat and drought in summer 2003, For. Ecol. Manag., 258, 590–599, 2009.
Gebhardt, T., Häberle, K.-H., Matyssek, R., Schulz, C., and Ammer, C.: The more, the better? Water relations of Norway spruce stands after progressive thinning, Agric. For. Meteorol., 197, 235–243, 2014.
Gessler, A., Bottero, A., Marshall, J., and Arend, M.: The way back: recovery of trees from drought and its implication for acclimation, New Phytol., 228, 1704–1709,https://doi.org/10.1111/nph.16703, 2020.
Giuggiola, A., Bugmann, H., Zingg, A., Dobbertin, M., and Rigling, A.: Reduction of stand density increases drought resistance in xeric Scots pine forests, For. Ecol. Manag., 310, 827–835, 2013.
Gómez-Candón, D., Virlet, N., Labbé, S., Jolivot, A., and Regnard, J.-L.: Field phenotyping of water stress at tree scale by UAV-sensed imagery: new insights for thermal acquisition and calibration, Precis. Agric., 17, 786–800, 2016.
Gonzalez-Dugo, V., Zarco-Tejada, P., Berni, J. A., Suarez, L., Goldhamer, D., and Fereres, E.: Almond tree canopy temperature reveals intra-crown variability that is water stress-dependent, Agric. For. Meteorol., 154, 156–165, 2012.
Granier, A., Reichstein, M., Bréda, N., Janssens, I. A., Falge, E., Ciais, P., Grünwald, T., Aubinet, M., Berbigier, P., Bernhofer, C., and Buchmann, N.: Evidence for soil water control on carbon and water dynamics in European forests during the extremely dry year: 2003, Agr. Forest Meteorol., 143, 123–145, https://doi.org/10.1016/j.agrformet.2006.12.004, 2007.
Guilioni, L., Jones, H. G., Leinonen, I., and Lhomme, J.-P.: On the relationships between stomatal resistance and leaf temperatures in thermography, Agric. For. Meteorol., 148, 1908–1912, 2008.
Hammond, W.M., Williams, A. P., Abatzoglou, J. T., Adams, H. D., Klein, T., López, R., Sáenz-Romero, C., Hartmann, H., Breshears, D. D., and Allen, C. D.: Global field observations of tree die-off reveal hotter-drought fingerprint for Earth's forests, Nat. Commun., 13, 1761, https://doi.org/10.1038/s41467-022-29289-2, 2022.
Härkönen, S., Lehtonen, A., Manninen, T., Tuominen, S., and Peltoniemi, M.: Estimating forest leaf area index using satellite images: comparison of k-NN based Landsat-NFI LAI with MODIS-RSR based LAI product for Finland, Boreal Environ. Res., 20, 181–195, 2015.
Hartmann, H., Ziegler, W., Kolle, O., and Trumbore, S.: Thirst beats hunger – declining hydration during drought prevents carbon starvation in Norway spruce saplings, New Phytol., 200, 340–349, 2013.
Högberg, P., Ceder, L.A., Astrup, R., Binkley, D., Dalsgaard, L., Egnell, G., Filipchuk, A., Genet, H., Ilintsev, A., Kurz, W.A., Laganière, J., Lemprière, T., Lundblad, M., Lundmark, T., Mäkipää, R., Malysheva, N., Mohr, C.W., Nordin, A., Petersson, H., Repo, A., Schepaschenko, D., Shvidenko, A., Soegaard, G., and Kraxner, F.: Sustainable boreal forest management challenges and opportunities for climate change mitigation, Report 2021/11, https://pure.iiasa.ac.at/17778 (last access: 14 September 2026), 2021.
Hyyppä, E., Yu, X., Kaartinen, H., Hakala, T., Kukko, A., Vastaranta, M., and Hyyppä, J.: Comparison of backpack, handheld, under-canopy UAV, and above-canopy UAV laser scanning for field reference data collection in boreal forests, Remote Sens., 12, 3327, https://doi.org/10.3390/rs12203327, 2020.
Jackson, R. D., Idso, S. B., Reginato, R. J., and Pinter Jr., P. J.: Canopy temperature as a crop water stress indicator, Water Resour. Res., 17, 1133–1138, 1981.
Jactel, H., Petit, J., Desprez-Loustau, M.-L., Delzon, S., Piou, D., Battisti, A., and Koricheva, J.: Drought effects on damage by forest insects and pathogens: a meta-analysis, Glob. Change Biol., 18, 267–276, 2011.
Jia, X., Zha, T. S., Gong, J. N., Wu, B., Zhang, Y. Q., Qin, S. G., Chen, G. P., Feng, W., Kellomäki, S., and Peltola, H.: Energy partitioning over a semi-arid shrubland in northern China, Hydrol. Process., 30, 972–985, 2016.
Jones, H. G.: Plants and Microclimate, 2nd edn., Cambridge University Press, Cambridge, ISBN: 978-0-521-42524-7, 1992.
Jönsson, A. M., Eklundh, L., Hellström, M., Bärring, L., and Jönsson, P.: Annual changes in MODIS vegetation indices of Swedish coniferous forests in relation to snow dynamics and tree phenology, Remote Sens. Environ., 114, 2719–2730, 2010.
Junttila, S., Vastaranta, M., Hämäläinen, J., Latva-Käyrä, P., Holopainen, M., Hernández Clemente, R., Hyyppä, H., and Navarro-Cerrillo, R. M.: Effect of forest structure and health on the relative surface temperature captured by airborne thermal imagery – case study in Norway spruce-dominated stands in southern Finland, Scand. J. For. Res., 32, 154–165, 2017.
Kansanen, K., Packalen, P., Lähivaara, T., Seppänen, A., Vauhkonen, J., Maltamo, M., and Mehtätalo, L.: Refining and evaluating a Horvitz–Thompson-like stand density estimator in individual tree detection based on airborne laser scanning, Can. J. For. Res., 52, 527–538, 2022.
Karkauskaite, P., Tagesson, T., and Fensholt, R.: Evaluation of the plant phenology index (PPI), NDVI and EVI for start-of-season trend analysis of the Northern Hemisphere boreal zone, Remote Sens., 9, 485, 2017.
Kimmins, J. P.: Forest Ecology, Macmillan Publishing Company, New York, ISBN 10 0023640502, 1987.
Kljun, N., Calanca, P., Rotach, M. W., and Schmid, H. P.: A simple two-dimensional parameterisation for Flux Footprint Prediction (FFP), Geosci. Model Dev., 8, 3695–3713, https://doi.org/10.5194/gmd-8-3695-2015, 2015.
Kohler, M., Sohn, J., Nägele, G., and Bauhus, J.: Can drought tolerance of Norway spruce (Picea abies (L.) Karst.) be increased through thinning?, Eur. J. For. Res., 129, 1109–1118, 2010.
Kolb, T. E., Fettig, C. J., Ayres, M. P., Bentz, B. J., Hicke, J. A., Mathiasen, R., Stewart, J. E., and Weed, A. S.: Observed and anticipated impacts of drought on forest insects and diseases in the United States, For. Ecol. Manag., 380, 321–334, 2016.
Köstner, B. M. M., Schulze, E. D., Kelliher, F. M., Hollinger, D. Y., Byers, J. N., Hunt, J. E., McSeveny, T. M., Meserth, R., and Weir, P.L.: Transpiration and canopy conductance in a pristine broad-leaved forest of Nothofagus: an analysis of xylem sap flow and eddy correlation measurements, Oecologia, 91, 350–359. 1992.
Kopačková-Strnadová, V., Koucká, L., Jelének, J., Lhotáková, Z., and Oulehle, F.: Canopy top, height and photosynthetic pigment estimation using parrot sequoia multispectral imagery and the unmanned aerial vehicle (UAV), Remote Sens., 13, 705, https://doi.org/10.3390/rs13040705, 2021.
Kowalska, N., Šigut, L., Stojanović, M., Fischer, M., Kyselova, I., and Pavelka, M.: Analysis of floodplain forest sensitivity to drought, Philos. Trans. R. Soc. B, 375, 20190518, https://doi.org/10.1098/rstb.2019.0518, 2020.
Krasnova, A., Krasnov, D., Cordey, H. P. E., and Noe, S. M.: Eddy-covariance carbon fluxes of a heterogeneous forest: one tower – two heights, EGUsphere [preprint], https://doi.org/10.5194/egusphere-2022-384, 2022.
Krause, S. and Sanders, T.G.M. Mapping tree water deficit with UAV thermal imaging and meteorological data. Remote Sens Earth Syst Sci 6(3-4):275-296, https://doi.org/10.1007/s41976-023-00094-9, 2023.
Kuželka, K., Slavík, M., and Surový, P.: Very high density point clouds from UAV laser scanning for automatic tree stem detection and direct diameter measurement, Remote Sens., 12, 1236, https://doi.org/10.3390/rs12081236, 2020.
Lasslop, G., Reichstein, M., Papale, D., Richardson, A. D., Arneth, A., Barr, A., Stoy, P., and Wohlfahrt, G.: Separation of net ecosystem exchange into assimilation and respiration using a light response curve approach: critical issues and global evaluation, Glob. Change Biol., 16, 187–208, 2010.
Launiainen, S.: Seasonal and inter-annual variability of energy exchange above a boreal Scots pine forest, Biogeosciences, 7, 3921–3940, https://doi.org/10.5194/bg-7-3921-2010, 2010.
Launiainen, S., Guan, M., Salmivaara, A., and Kieloaho, A.-J.: Modeling boreal forest evapotranspiration and water balance at stand and catchment scales: a spatial approach, Hydrol. Earth Syst. Sci., 23, 3457–3480, https://doi.org/10.5194/hess-23-3457-2019, 2019.
Launiainen, S., Katul, G. G., Leppä, K., Kolari, P., Aslan, T., Grönholm, T., Korhonen, L., Mammarella, I., and Vesala, T.: Does growing atmospheric CO2 explain increasing carbon sink in a boreal coniferous forest?, Glob. Change Biol., 28, 2910–2929, 2022.
Laurent, M., Antoine, N., and Joël, G.: Effects of different thinning intensities on drought response in Norway spruce (Picea abies (L.) Karst.), For. Ecol. Manag., 183, 47–60, 2003.
Laurila, T., Aurela, M., Hatakka, J., Hotanen, J.-P., Jauhiainen, J., Korkiakoski, M., Korpela, L., Koskinen, M., Laiho, R., Lehtonen, A., Leppä, K., Linkosalmi, M., Lohila, A., Minkkinen, K., Mäkelä, T., Mäkiranta, P., Nieminen, M., Ojanen, P., Peltoniemi, M., Penttilä, T., Rainne, J., Rautakoski, H., Saarinen, M., Salovaara, P., Sarkkola, S., and Mäkipää, R.: Set-up and instrumentation of the greenhouse gas measurements on experimental sites of continuous cover forestry, Natural Resources and Bioeconomy Studies, 26/2021, Natural Resources Institute Finland, Helsinki, 51 pp., ISBN: 978-952-380-191-2, 2021.
Lehtonen, A., Eyvindson, K., Härkönen, K., Leppä, K., Salmivaara, A., Peltoniemi, M., Salminen, O., Sarkkola, S., Launiainen, S., Ojanen, P., Räty, M., and Mäkipää, R.: Potential of continuous cover forestry on drained peatlands to increase the carbon sink in Finland, Sci. Rep., 13, 15510, https://doi.org/10.1038/s41598-023-42315-7, 2023.
Leinonen, I., Grant, O. M., Tagliavia, C. P. P., Chaves, M. M., and Jones, H. G.: Estimating stomatal conductance with thermal imagery, Plant Cell Environ., 29, 1508–1518, 2006.
Leppä, K., Korkiakoski, M., Nieminen, M., Laiho, R., Hotanen, J.-P., Kieloaho, A. J., Korpela, L., Laurila, T., Lohila, A., Minkkinen, K., and Mäkipää, R.: Vegetation controls of water and energy balance of a drained peatland forest: responses to alternative harvesting practices, Agric. For. Meteorol., 295, 108198, https://doi.org/10.1016/j.agrformet.2020.108198, 2020.
Lévesque, M., Rigling, A., Bugmann, H., Weber, P., and Brang, P.: Growth response of five co-occurring conifers to drought across a wide climatic gradient in Central Europe, Agric. For. Meteorol., 197, 1–12, 2014.
Lindroth, A., Holst, J., Linderson, M. L., Aurela, M., Biermann, T., Heliasz, M., Chi, J., Ibrom, A., Kolari, P., Klemedtsson, L., and Krasnova, A.: Effects of drought and meteorological forcing on carbon and water fluxes in Nordic forests during the dry summer of 2018, Philos. Trans. R. Soc. B, 375, 20190516, https://doi.org/10.1098/rstb.2019.0516, 2020.
Liu, C., Peltoniemi, M., Alekseychik, P., Mäkelä, A., and Hölttä, T.: A coupled model of hydraulic ecophysiology and cambial growth – accounting for biophysical limitations and phenology improves stem diameter prediction at high temporal resolution, Plant Cell Environ., 48, 1344–1365, 2025.
Ludovisi, R., Tauro, F., Salvati, R., Khoury, S., Mugnozza Scarascia, G., and Harfouche, A.: UAV-based thermal imaging for high-throughput field phenotyping of black poplar response to drought, Front. Plant Sci., 8, 1681, https://doi.org/10.3389/fpls.2017.01681, 2017.
Maes, W. H., Huete, A. R., Avino, M., Boer, M. M., Dehaan, R., Pendall, E., Griebel, A., and Steppe, K.: Can UAV-based infrared thermography be used to study plant-parasite interactions between mistletoe and eucalypt trees?, Remote Sens., 10, 2062, https://doi.org/10.3390/rs10122062, 2018.
Mamkin, V., Varlagin, A., Yaseneva, I., and Kurbatova, J.: Response of spruce forest ecosystem CO2 fluxes to inter-annual climate anomalies in the Southern Taiga, Forests, 13, 1019, https://doi.org/10.3390/f13071019, 2022.
Manase, A., Manyevere, A., Abd Elbasit, M. A., and Mashamaite, C.: The use of UAV-based systems in monitoring forest health: potentials and challenges, Sci. Afr., 28, e02724, https://doi.org/10.1016/j.sciaf.2025.e02724, 2025.
Manrique-Alba, À., Beguería, S., Molina, A. J., González-Sanchis, M., Tomàs-Burguera, M., Del Campo, A. D., Colangelo, M., and Camarero, J. J.: Long-term thinning effects on tree growth, drought response and water use efficiency at two Aleppo pine plantations in Spain, Sci. Total Environ., 728, 138536, 2020.
Martín-Benito, D., Del Río, M., Heinrich, I., Helle, G., and Cañellas, I.: Response of climate-growth relationships and water use efficiency to thinning in a Pinus nigra afforestation, For. Ecol. Manag., 259, 967–975, 2010.
Martínez-García, E., Nilsson, M. B., Laudon, H., Lundmark, T., Fransson, J. E., Wallerman, J., and Peichl, M.: Drought response of the boreal forest carbon sink is driven by understorey–tree composition, Nat. Geosci., 17, 197–204, 2024.
Martínez-García, E., Rautakoski, H., Rissanen, A. J., Adamczyk, B., Anttila, J., Lehtonen, A., Li, Q., Lohila, A., Peltoniemi, M., Sarkkola, S., and Ťupek, B.: Short-term effects of harvesting alternatives on soil nitrous oxide fluxes in a boreal drained peatland forest, Geoderma, 465, 117648, https://doi.org/10.1016/j.geoderma.2025.117648, 2026.
Matkala, L., Kulmala, L., Kolari, P., Aurela, M., and Bäck, J.: Resilience of subarctic Scots pine and Norway spruce forests to extreme weather events, Agric. For. Meteorol., 296, 108239, 2021.
McGloin, R., Šigut, L., Fischer, M., Foltýnová, L., Chawla, S., Trnka, M., Pavelka, M., and Marek, M. V.: Available energy partitioning during drought at two Norway spruce forests and a European beech forest in Central Europe, J. Geophys. Res.-Atmos., 124, 3726–3742, 2019.
McKee, T. B., Doesken, N. J., and Kleist, J.: The relationship of drought frequency and duration to time scales, in: Proceedings of the 8th Conference on Applied Climatology, 17, 179–183, 1993.
Menberu, M. W., Marttila, H., Ronkanen, A.-K., Haghighi, A. T., and Kløve, B.: Hydraulic and physical properties of managed and intact peatlands: application of the van Genuchten–Mualem models to peat soils, Water Resour. Res., 57, e2020WR028624, https://doi.org/10.1029/2020WR028624, 2021.
Mirabel, A., Girardin, M. P., Metsaranta, J., Way, D., and Reich, P. B.: Increasing atmospheric dryness reduces boreal forest tree growth, Nat. Commun., 14, 6901, https://doi.org/10.1038/s41467-023-42466-1, 2023.
Misson, L., Nicault, A., and Guiot, J.: Effects of different thinning intensities on drought response in Norway spruce (Picea abies (L.) Karst.), For. Ecol. Manag., 183, 47–60, 2003.
Monteith, J.: Evaporation and environment, Symp. Soc. Exp. Biol., 19, 205–234, PMID: 5321565, 1965.
Oogathoo, S., Houle, D., Duchesne, L., and Kneeshaw, D.: Vapour pressure deficit and solar radiation are the major drivers of transpiration of balsam fir and black spruce tree species in humid boreal regions, even during a short-term drought, Agric. For. Meteorol., 291, 108063, https://doi.org/10.1016/j.agrformet.2020.108063, 2020.
Oren, R. J. S. S., Sperry, J. S., Katul, G. G., Pataki, D. E., Ewers, B. E., Phillips, N., and Schäfer, K. V. R.: Survey and synthesis of intra‐and interspecific variation in stomatal sensitivity to vapour pressure deficit, Planet Cell Environ., 22, 1515–1526, 1999.
Ovenden, T. S., Perks, M. P., Clarke, T. K., Mencuccini, M., and Jump, A. S.: Life after recovery: increased resolution of forest resilience assessment sheds new light on post-drought compensatory growth and recovery dynamics, J. Ecol., 109, 3157–3170, 2021.
Owen, P. R. and Thomson, W. R.: Heat transfer across rough surfaces, J. Fluid Mech., 15, 321–334, 1963.
Paulo, A. A., Rosa, R. D., and Pereira, L. S.: Climate trends and behaviour of drought indices based on precipitation and evapotranspiration in Portugal, Nat. Hazards Earth Syst. Sci., 12, 1481–1491, 2012.
Peltoniemi, M.: Dendrometer and sapflow measurements of Norway spruce trees in a peatland harvesting experiment in Ränskälänkorpi, Zenodo [data set], https://doi.org/10.5281/zenodo.10043607, 2023.
Peltoniemi, M.: Temperature invariant tree dendrometer frame – construction and installation, Zenodo [data set], https://doi.org/10.5281/zenodo.18019069, 2025.
Popescu, S. C. and Wynne, R. H.: Seeing the trees in the forest, Photogramm. Eng. Remote Sens., 70, 589–604, 2004.
Pretzsch, H.: Stand density and growth of Norway spruce (Picea abies (L.) Karst.) and European beech (Fagus sylvatica L.): evidence from long-term experimental plots, Eur. J. For. Res., 124, 193–205, 2005.
Pretzsch, H., Schütze, G., and Biber, P.: Drought can favour the growth of small in relation to tall trees in mature stands of Norway spruce and European beech, For. Ecosyst., 5, 1–19, 2018.
Rebmann, C., Aubinet, M., Schmid, H., Arriga, N., Aurela, M., Burba, G., Clement, R., De Ligne, A., Fratini, G., Gielen, B., and Grace, J.: ICOS eddy covariance flux-station site setup: a review, Int. Agrophys., 32, 471–494, 2018.
Ruosteenoja, K. and Jylhä, K.: Projected climate change in Finland during the 21st century calculated from CMIP6 model simulations, Geophysica, 56, 39–69, 2021.
Saarinen, N., Vastaranta, M., Näsi, R., Rosnell, T., Hakala, T., Honkavaara, E., Wulder, M. A., Luoma, V., Tommaselli, A. M., Imai, N. N., and Ribeiro, E. A.: Assessing biodiversity in boreal forests with UAV-based photogrammetric point clouds and hyperspectral imaging, Remote Sens., 10, 338, 2018.
Salminen, H. and Jalkanen, R.: Modelling the effect of temperature on height increment of Scots pine at high latitudes, Silva Fennica, 39, 497–508, https://doi.org/10.14214/sf.362, 2005.
Scherrer, D., Bader, M. K. F., and Körner, C.: Drought-sensitivity ranking of deciduous tree species based on thermal imaging of forest canopies, Agric. For. Meteorol., 151, 1632–1640, 2011.
Schmied, G., Hilmers, T., Mellert, K. H., Uhl, E., Buness, V., Ambs, D., Steckel, M., Biber, P., Šeho, M., Hoffmann, Y. D., and Pretzsch, H.: Nutrient regime modulates drought response patterns of three temperate tree species, Sci. Total Environ., 868, 161601, https://doi.org/10.1016/j.scitotenv.2023.161601, 2023.
Schmied, G., Hilmers, T., Uhl, E., and Pretzsch, H.: The past matters: previous management strategies modulate current growth and drought responses of Norway spruce (Picea abies H. Karst.), Forests, 13, 243, https://doi.org/10.3390/f13020243, 2022.
Schönbeck, L. C., Schuler, P., Lehmann, M. M., Mas, E., Mekarni, L., Pivovaroff, A. L., Turberg, P., and Grossiord, C.: Increasing temperature and vapour pressure deficit lead to hydraulic damages in the absence of soil drought, Plant Cell Environ., 45, 3275–3289, 2022.
Seidel, H., Schunk, C., Matiu, M., and Menzel, A.: Diverging drought resistance of scots pine provenances revealed by infrared thermography, Frontiers in plant science, 7, 1247, https://doi.org/10.3389/fpls.2016.01247, 2016.
Silva, C. A., Hudak, A. T., Vierling, L. A., Loudermilk, E. L., O'Brien, J. J., Hiers, J. K., Jack, S. B., Gonzalez-Benecke, C., Lee, H., Falkowski, M. J., and Khosravipour, A.: Imputation of individual longleaf pine (Pinus palustris Mill.) tree attributes from field and LiDAR data, Can. J. Remote Sens., 42, 554–573, 2016.
Smigaj, M., Gaulton, R., Suarez, J. C., and Barr, S. L.: Canopy temperature from an Unmanned Aerial Vehicle as an indicator of tree stress associated with red band needle blight severity, Forest Ecol. Manag., 433, 699–708, https://doi.org/10.1016/j.foreco.2018.11.032, 2019.
Smigaj, M., Agarwal, A., Bartholomeus, H., Decuyper, M., Elsherif, A., de Jonge, A., and Kooistra, L.: Thermal infrared remote sensing of stress responses in forest environments: a review of developments, challenges, and opportunities, Curr. For. Rep., 10, 56–76, 2024.
Sohn, J. A., Saha, S., and Bauhus, J.: Potential of forest thinning to mitigate drought stress: a meta-analysis, For. Ecol. Manag., 380, 261–273, 2016.
Sohn, J. A., Gebhardt, T., Ammer, C., Bauhus, J., Häberle, K.-H., Matyssek, R., and Grams, T. E. E.: Mitigation of drought by thinning: short-term and long-term effects on growth and physiological performance of Norway spruce (Picea abies), For. Ecol. Manag., 308, 188–197, 2013.
Střelcová, K., Kurjak, D., Leštianska, A., Kovalčíková, D., Ditmarová, Ľ., Škvarenina, J., and Ahmed, Y. A. R.:. Differences in transpiration of Norway spruce drought stressed trees and trees well supplied with water, Biologia, 68, 1118–1122, 2013.
Subke, J. A. and Tenhunen, J. D.: Direct measurements of CO2 flux below a spruce forest canopy, Agric. For. Meteorol., 126, 157–168, 2004.
Tardieu, F. and Simonneau, T.: Variability among species of stomatal control under fluctuating soil water status and evaporative demand: modelling isohydric and anisohydric behaviours, J. Exp. Bot., 49, 419–432, 1998.
Thom, A. S., Stewart, J. B., Oliver, H. R., and Gash, J. H. C.: Comparison of aerodynamic and energy budget estimates of fluxes over a pine forest, Q. J. R. Meteorol. Soc., 101, 93–105, 1975.
Tmušić, G., Manfreda, S., Aasen, H., James, M. R., Gonçalves, G., Ben-Dor, E., Brook, A., Polinova, M., Arranz, J. J., Mészáros, J., and Zhuang, R.: Current practices in UAS-based environmental monitoring, Remote Sens., 12, 1001, https://doi.org/10.3390/rs12061001, 2020.
Tupek, B., Mäkipää, R., Heikkinen, J., Peltoniemi, M., Ukonmaanaho, L., Hokkanen, T., Nöjd, P., Nevalainen, S., Lindgren, M., and Lehtonen, A.: Foliar turnover rates in Finland – comparing estimates from needle-cohort and litterfall-biomass methods, https://doi.org/10.60910/avn0-9u03, 2015.
Venäläinen, A., Lehtonen, I., Laapas, M., Ruosteenoja, K., Tikkanen, O. P., Viiri, H., Ikonen, V. P., and Peltola, H.: Climate change induces multiple risks to boreal forests and forestry in Finland: a literature review, Glob. Change Biol., 26, 4178–4196, 2020.
Verma, S. B.: Aerodynamic resistances to transfers of heat, mass and momentum, Papers in Natural Resources, 1211, https://digitalcommons.unl.edu/natrespapers/1211/ (last access: 14 September 2026), 1989.
Vicca, S., Balzarolo, M., Filella, I., Granier, A., Herbst, M., Knohl, A., Longdoz, B., Mund, M., Nagy, Z., Pintér, K., and Rambal, S.: Remotely-sensed detection of effects of extreme droughts on gross primary production, Sci. Rep., 6, 28269, https://doi.org/10.1038/srep28269, 2016.
Vicente-Serrano, S. M., Beguería, S., and López-Moreno, J. I.: A multiscalar drought index sensitive to global warming: the standardized precipitation evapotranspiration index, J. Clim., 23, 1696–1718, 2010.
Vitali, V., Büntgen, U., and Bauhus, J.: Silver fir and Douglas fir are more tolerant to extreme droughts than Norway spruce in south-western Germany, Glob. Change Biol., 23, 5108–5119, 2017.
Wallin, G., Linder, S., Lindroth, A., Räntfors, M., Flemberg, S., and Grelle, A.: Carbon dioxide exchange in Norway spruce at the shoot, tree and ecosystem scale, Tree Physiol., 21, 969–976, 2001.
Wang, J., Taylor, A. R., and D'Orangeville, L.: Warming-induced tree growth may help offset increasing disturbance across the Canadian boreal forest, Proc. Natl. Acad. Sci. USA, 120, e2212780120, https://doi.org/10.1073/pnas.221278012, 2023.
Waring, R. H. and Franklin, J. F.: Evergreen coniferous forests of the Pacific Northwest: massive long-lived conifers dominating these forests are adapted to a winter-wet, summer-dry environment, Science, 204, 1380–1386, 1979.
Zang, C., Pretzsch, H., and Rothe, A.: Size-dependent responses to summer drought in Scots pine, Norway spruce and common oak, Trees, 26, 557–569, 2012.
Zang, C. S., Buras, A., Esquivel-Muelbert, A., Jump, A. S., Rigling, A., and Rammig, A.: Standardized drought indices in ecological research: why one size does not fit all, Glob. Change Biol., 26, 322–324, 2020.
Zavadilová, I., Szatniewska, J., Stojanović, M., Fleischer, P., Vágner, L., Pavelka, M., and Petrík, P.: The effect of thinning intensity on sap flow and growth of Norway spruce, J. For. Sci., 69, 205–216, 2023.
Zhang, Z., Zhao, P., Zhao, X., Zhou, J., Zhao, P., Zeng, X., Hu, Y., and Ouyang, L.:. The tree height‐related spatial variances of tree sap flux density and its scale‐up to stand transpiration in a subtropical evergreen broadleaf forest, Ecohydrology, 11, e1979, https://doi.org/10.1002/eco.1979, 2018.
Zhao, J., Lange, H., and Meissner, H.: Estimating carbon sink strength of Norway spruce forests using machine learning, Forests, 13, 1721, https://doi.org/10.3390/f13101721, 2022.
Zhong, Z., He, B., Wang, Y. P., Chen, H. W., Chen, D., Fu, Y. H., Chen, Y., Guo, L., Deng, Y., Huang, L., and Yuan, W.: Disentangling the effects of vapor pressure deficit on northern terrestrial vegetation productivity, Sci. Adv., 9, eadf3166, https://doi.org/10.1126/sciadv.adf3166, 2023.
Zlobin, I. E., Kartashov, A. V., Pashkovskiy, P. P., Ivanov, Y. V., Kreslavski, V. D., and Kuznetsov, V. V.: Comparative photosynthetic responses of Norway spruce and Scots pine seedlings to prolonged water deficiency, J. Photochem. Photobiol. B, 201, 111659, https://doi.org/10.1016/j.jphotobiol.2019.111659, 2019.
Zweifel, R., Item, H., and Häsler, R.: Link between diurnal stem radius changes and tree water relations, Tree Physiol., 21, 869–876, 2001.
Zweifel, R., Zimmermann, L., and Newbery, D. M.: Modeling tree water deficit from microclimate: an approach to quantifying drought stress, Tree Physiol., 25, 147–156, 2005.
- Abstract
- Introduction
- Materials and methods
- Results
- Discussion
- Conclusions
- Appendix A: Projected canopy cover
- Appendix B: Eddy-covariance footprint
- Appendix C: Processing of UAV imagery and tree canopy segmentation
- Appendix D: References for thermal and multispectral measurement
- Appendix E: Monitored tree parameters and sap-flow upscaling
- Appendix F: Original UAV maps of surface T and NDVI
- Appendix G: Brightness correction of canopy temperature
- Appendix H: Stem radial growth
- Appendix I: GPP on drought versus non-drought days.
- Code and data availability
- Author contributions
- Competing interests
- Disclaimer
- Acknowledgements
- Financial support
- Review statement
- References
- Abstract
- Introduction
- Materials and methods
- Results
- Discussion
- Conclusions
- Appendix A: Projected canopy cover
- Appendix B: Eddy-covariance footprint
- Appendix C: Processing of UAV imagery and tree canopy segmentation
- Appendix D: References for thermal and multispectral measurement
- Appendix E: Monitored tree parameters and sap-flow upscaling
- Appendix F: Original UAV maps of surface T and NDVI
- Appendix G: Brightness correction of canopy temperature
- Appendix H: Stem radial growth
- Appendix I: GPP on drought versus non-drought days.
- Code and data availability
- Author contributions
- Competing interests
- Disclaimer
- Acknowledgements
- Financial support
- Review statement
- References