
the Creative Commons Attribution 4.0 License.
the Creative Commons Attribution 4.0 License.
 | 19 Oct 2026
Detecting long-term canopy change and vegetation shifts in northern peatlands using LAI and climate data
Iuliia Burdun
Jiabin Pu
Ranga B. Myneni
Miina Rautiainen

Northern peatlands store vast amounts of carbon, part of which might be released to the atmosphere as climate warming alters peatland canopies. To track these changes, we analysed recent greening and browning across northern peatlands, defined here as increases and decreases in leaf area index (LAI), from 2001 to 2023. We assessed vegetation change using gap-filled, sensor-independent LAI climate data record at 500 m resolution across the peatland-dominated pixels north of 45° N, defined as pixels with at least 90 % mapped peatland cover and no detected wildfire during 2001–2023. To our knowledge, our results provide the first multi-decadal assessment of peatland canopy change based strictly on mapped peatlands rather than on the broader Arctic and boreal domain in which peatlands are usually embedded. Although greening was widespread at the pixel level (77 % of studied peatlands; greening-to-browning ratio 3.5:1), the area-weighted LAI trend at the map scale was not significant. LAI anomalies were weakly positively correlated with air temperature and weakly negatively correlated with precipitation; multi-year mean annual precipitation, rather than air temperature, was retained in the model of long-term LAI trends. Higher tree cover was associated with less greening, but this association was weaker in peatlands with deciduous needleleaf cover and where precipitation was higher. Most peatland pixels showed a linear LAI trend with no breakpoints; where non-linear trends occurred, their breakpoints were often temporally aligned with phase shifts in the Pacific Decadal Oscillation. These non-linear trends differed by region: trends in which LAI first decreased and then increased were concentrated in West Siberia, whereas trends in which LAI first increased and then decreased were widespread across Europe, northeastern Asia, and Canada. Protected peatlands did not show different LAI trends once differences in climate and canopy were accounted for. Overall, recent peatland canopy change was not a uniform increase in greenness but rather reflected moisture-sensitive, tree-composition-dependent responses modulated by decadal climate variability.
- Article
(4983 KB) - Full-text XML
- BibTeX
- EndNote


Peatlands have helped cool our climate by an estimated 0.6 °C over the Holocene through the sequestration of atmospheric carbon and its long-term storage as peat (United Nations Environment Programme, 2022). These ecosystems are built and sustained by plants that engineer waterlogged, nutrient-poor and oxygen-limited conditions; among them, Sphagnum mosses are especially important because they help maintain the acidic conditions under which peat accumulates (Turetsky et al., 2025). By slowing the decomposition of plant remains, these conditions allow carbon-rich peat to accumulate over long timescales rather than be rapidly returned to the atmosphere.
However, under a warming, drying climate, together with anthropogenic drainage, the conditions that sustain peatland may shift, causing plant communities to reorganise (Liu et al., 2023) and altering the processes that regulate peatland carbon dynamics (Bansal et al., 2023; Virkkala et al., 2025; Yuan et al., 2024). Sphagnum is highly sensitive to temperature (Campbell et al., 2021; Oke and Hager, 2017), partly because warming alters its metabolic composition (Sytiuk et al., 2023). As suitable habitats decline, Sphagnum is projected to migrate northwards (Ma et al., 2022), increasing the risk of invasion by vascular plants (Ma et al., 2022; Oke and Hager, 2020). Such vegetation shifts can reduce peatland productivity and carbon sequestration (Bragazza et al., 2013; Keane et al., 2025), partly by accelerating the decomposition of carbon-rich organic matter through changes in soil enzyme activity (Bragazza et al., 2013). Peatlands may consequently shift from carbon sinks to sources (Bansal et al., 2023), especially in northern regions (north of 45° N), where rapid warming (Qiu et al., 2022) has contributed to the widespread drying of peatlands (Swindles et al., 2019).
Across the northern regions, warming has already led to increases in vegetation height, biomass, cover, and abundance (Myers-Smith et al., 2020), and expanded colonisable areas following the drainage of permafrost lake basins (Chen et al., 2023). Consistent with these projections, case studies have shown local-scale shifts in peatland vegetation driven by warming (Elmendorf et al., 2012; Kolari et al., 2021; Sturm et al., 2001), related wildfires (Väliranta et al., 2017) and changes in snow cover (Backéus et al., 2023), with species changes detected even within strictly protected areas (Ren et al., 2021).
Given that these changes occur over decades and across continental scales, only satellite remote sensing enables consistent monitoring of vegetation properties, including canopy greenness, structure, and productivity (Myers-Smith et al., 2020). Building on these observations, long-term satellite archives have revealed areas of increasing (“greening”) and decreasing (“browning”) vegetation activity (Myneni et al., 1997). Since the early 1990s, browning has expanded markedly – by more than 60 % – across northern latitudes, leading to widespread greening-to-browning reversals and a slowdown in global greening, despite overall greening dominance since the early 1980s (Pan et al., 2018; Winkler et al., 2021). Although greening and browning dynamics have been widely investigated, large-scale studies have generally not addressed peatlands as a distinct ecosystem (Higgins et al., 2023) or have excluded them from the analysis (Winkler et al., 2019; Xu et al., 2013). Consequently, global and semi-global mapping of greening and browning trends has mostly been focused on broad terrestrial vegetation types, e.g., forests, tundra, shrublands, grasslands, where greening has often been linked to warming, carbon dioxide fertilisation, or land-use change, while browning has been associated with drought, heat stress, disturbance, and vegetation mortality (Barichivich et al., 2013; Cai et al., 2025; Forzieri et al., 2017; Lian et al., 2020; Piao et al., 2019; Zhu et al., 2016).
Yet in peatlands, greening trends may not have the same ecological meaning as in forests or tundra. In forests or tundra, more leaf area often indicates higher productivity; in peatlands, it may instead reflect the expansion of vascular plants at the expense of Sphagnum mosses, with potential consequences for peat-forming function and carbon sequestration.
Here, we address this gap by analysing long-term vegetation changes across peatland-dominated 500 m pixels north of 45° N, defined as pixels with at least 90 % mapped peatland cover and no detected wildfire during 2001–2023, using a gap-filled, sensor-independent climate data record of leaf area index (LAI), i.e. a consistently processed multi-decadal LAI time series merged from three satellite sensors. LAI is an Essential Climate Variable that describes canopy foliage amount and is defined as one half of the total green leaf area per unit horizontal ground surface area (Chen and Black, 1992; The Global Climate Observing System, 2026). In simple terms, higher LAI means more green leaf area above the ground, whereas lower LAI means less green leaf area. We therefore interpret increases in LAI over time as greening and decreases as browning. In this study, we hypothesise that northern peatlands exhibit spatially coherent greening or browning trends in LAI and that these trends can be explained by (i) climate-related changes, including warming, precipitation and recent lake drainage in the northern permafrost zone; (ii) differences in protection status; and (iii) variation in tree cover type and density.
Specifically, our objectives were to:
-
quantify the direction, magnitude, spatial distribution, and temporal dynamics of LAI-based greening and browning across peatland-dominated, unburned 500 m pixels north of 45° N over 2001–2023; and
-
test whether the identified LAI-based greening and browning patterns were associated with climatic, ecological, and protection-related factors, including temperature, precipitation, decadal climate variability, recent lake drainage, tree-cover type and density, and protection status.
This provides, to our knowledge, the first multi-decadal, peatland-specific assessment of canopy trends.
2.1 Polygons of northern peatlands
The potential distribution of peatlands has been the focus of several recent global mapping efforts (Fluet-Chouinard et al., 2023; Hu et al., 2017; Hugelius et al., 2020; Xu et al., 2018). One of the most widely used datasets, PEATMAP (Xu et al., 2018), has been shown to underestimate the northern peatland extent by roughly 1 million km2 (Hugelius et al., 2020). The recently released Global Peatland Map 2.0 (Global Peatlands Initiative and United Nations Environment Programme, 2022) offers improved coverage and consistency at a spatial resolution of 1 km; however, this coarse grid limits its direct integration with satellite datasets of finer spatial resolution.
To overcome these limitations, we integrated the following four complementary global datasets to map peatlands north of 45° N:
-
PEATMAP, an amalgamated global peatland distribution dataset compiled from national, regional, and global sources (Xu et al., 2018), for which we retained all cells with peatland cover above 0 %, resulting in a potential peatland envelope of ∼5 700 559 km2 within the study domain;
-
Open Street Map (OSM) for which we derived polygons tagged as “Wetland” (OpenStreetMap contributors, 2024) downloaded on 2 May 2024 that cover ∼606 699 km2 in the study domain;
-
ESA WorldCover 2021 – global land cover product at 10 m resolution, based on Sentinel-1 and 2 data (Zanaga et al., 2021), for which we derived pixels classified as “Herbaceous wetland” (class 90) with ∼1 582 232 km2 coverage in the study domain; and
-
Global Peatland Map 2.0 – 1 km resolution that indicates locations of peatlands that cover ∼7 456 109 km2 in the study domain, combining areas with a peat in soil mosaic and peat-dominated areas (Global Peatlands Initiative and United Nations Environment Programme, 2022) .
Because the OSM and ESA WorldCover datasets map wetlands rather than specifically peatlands specifically, our first step was to retain only those wetland locations that intersect with the Global Peatland Map 2.0. We applied the same intersection to PEATMAP, although it directly represents peatlands, to ensure a consistent and systematic workflow across all datasets. From these intersected layers, we retained only areas represented in at least two of the three datasets (OSM, PEATMAP, and ESA WorldCover). Thus, the final peatland mask included areas supported by at least two global datasets and also located within the Global Peatland Map 2.0. Because peatland locations remain uncertain, we used agreement among global datasets as a conservative criterion: areas were retained only when they were supported by multiple sources. Our resulting peatland mask covered ∼535 017 km2 of conservatively mapped peatland area. This approach prioritises higher-confidence peatland areas, while acknowledging that OSM coverage is uneven and often sparse in areas with few active contributors.
2.2 Sensor-independent leaf area index climate data record for northern peatlands
We used sensor-independent LAI climate data record at 500 m spatial and 8 d temporal resolution for 2001–2023 (Pu et al., 2024). A climate data record is a consistently processed, uncertainty-quantified time series that is long and stable enough for analyses at climate timescales (Merchant et al., 2017). The record is sensor-independent because, for each 8 d period, it combines high-quality retrievals from MODIS Terra, MODIS Aqua and VIIRS, which reduces biases tied to one sensor's calibration and overpass time. Remaining temporal gaps, e.g. due to clouds, aerosols or snow, are filled with a spatio-temporal tensor completion model (Pu et al., 2024). It also includes data on the fraction of photosynthetically active radiation absorbed by vegetation (FPAR); however, because spatial patterns of greening and browning in FPAR closely matched those observed for LAI (Fig. A1), we focus our results on LAI only. The LAI data were obtained in the MODIS sinusoidal projection, and all other datasets in this study were reprojected accordingly to ensure spatial consistency.
For each LAI pixel, we calculated the proportion of area covered by mapped peatlands, as derived in Sect. 2.1, and retained only those with peatland coverage of 90 % or greater. To minimise confounding effects from rapid vegetation changes following wildfires, we excluded all pixels classified as burned between 2001 and 2023 in the combined Terra and Aqua MCD64A1 dataset version 061. MCD64A1 data were accessed and processed in the Google Earth Engine cloud-based platform. The final number of pixels for our analysis was 1 244 063, which captures more than half of our conservative peat mask area (Fig. 1). Therefore, our analysis should not be interpreted as an exhaustive assessment of all northern peatlands, but as an assessment of peatland-dominated, unburned pixels where the LAI signal is least likely to be confounded by mixed land cover or recent fire disturbance.
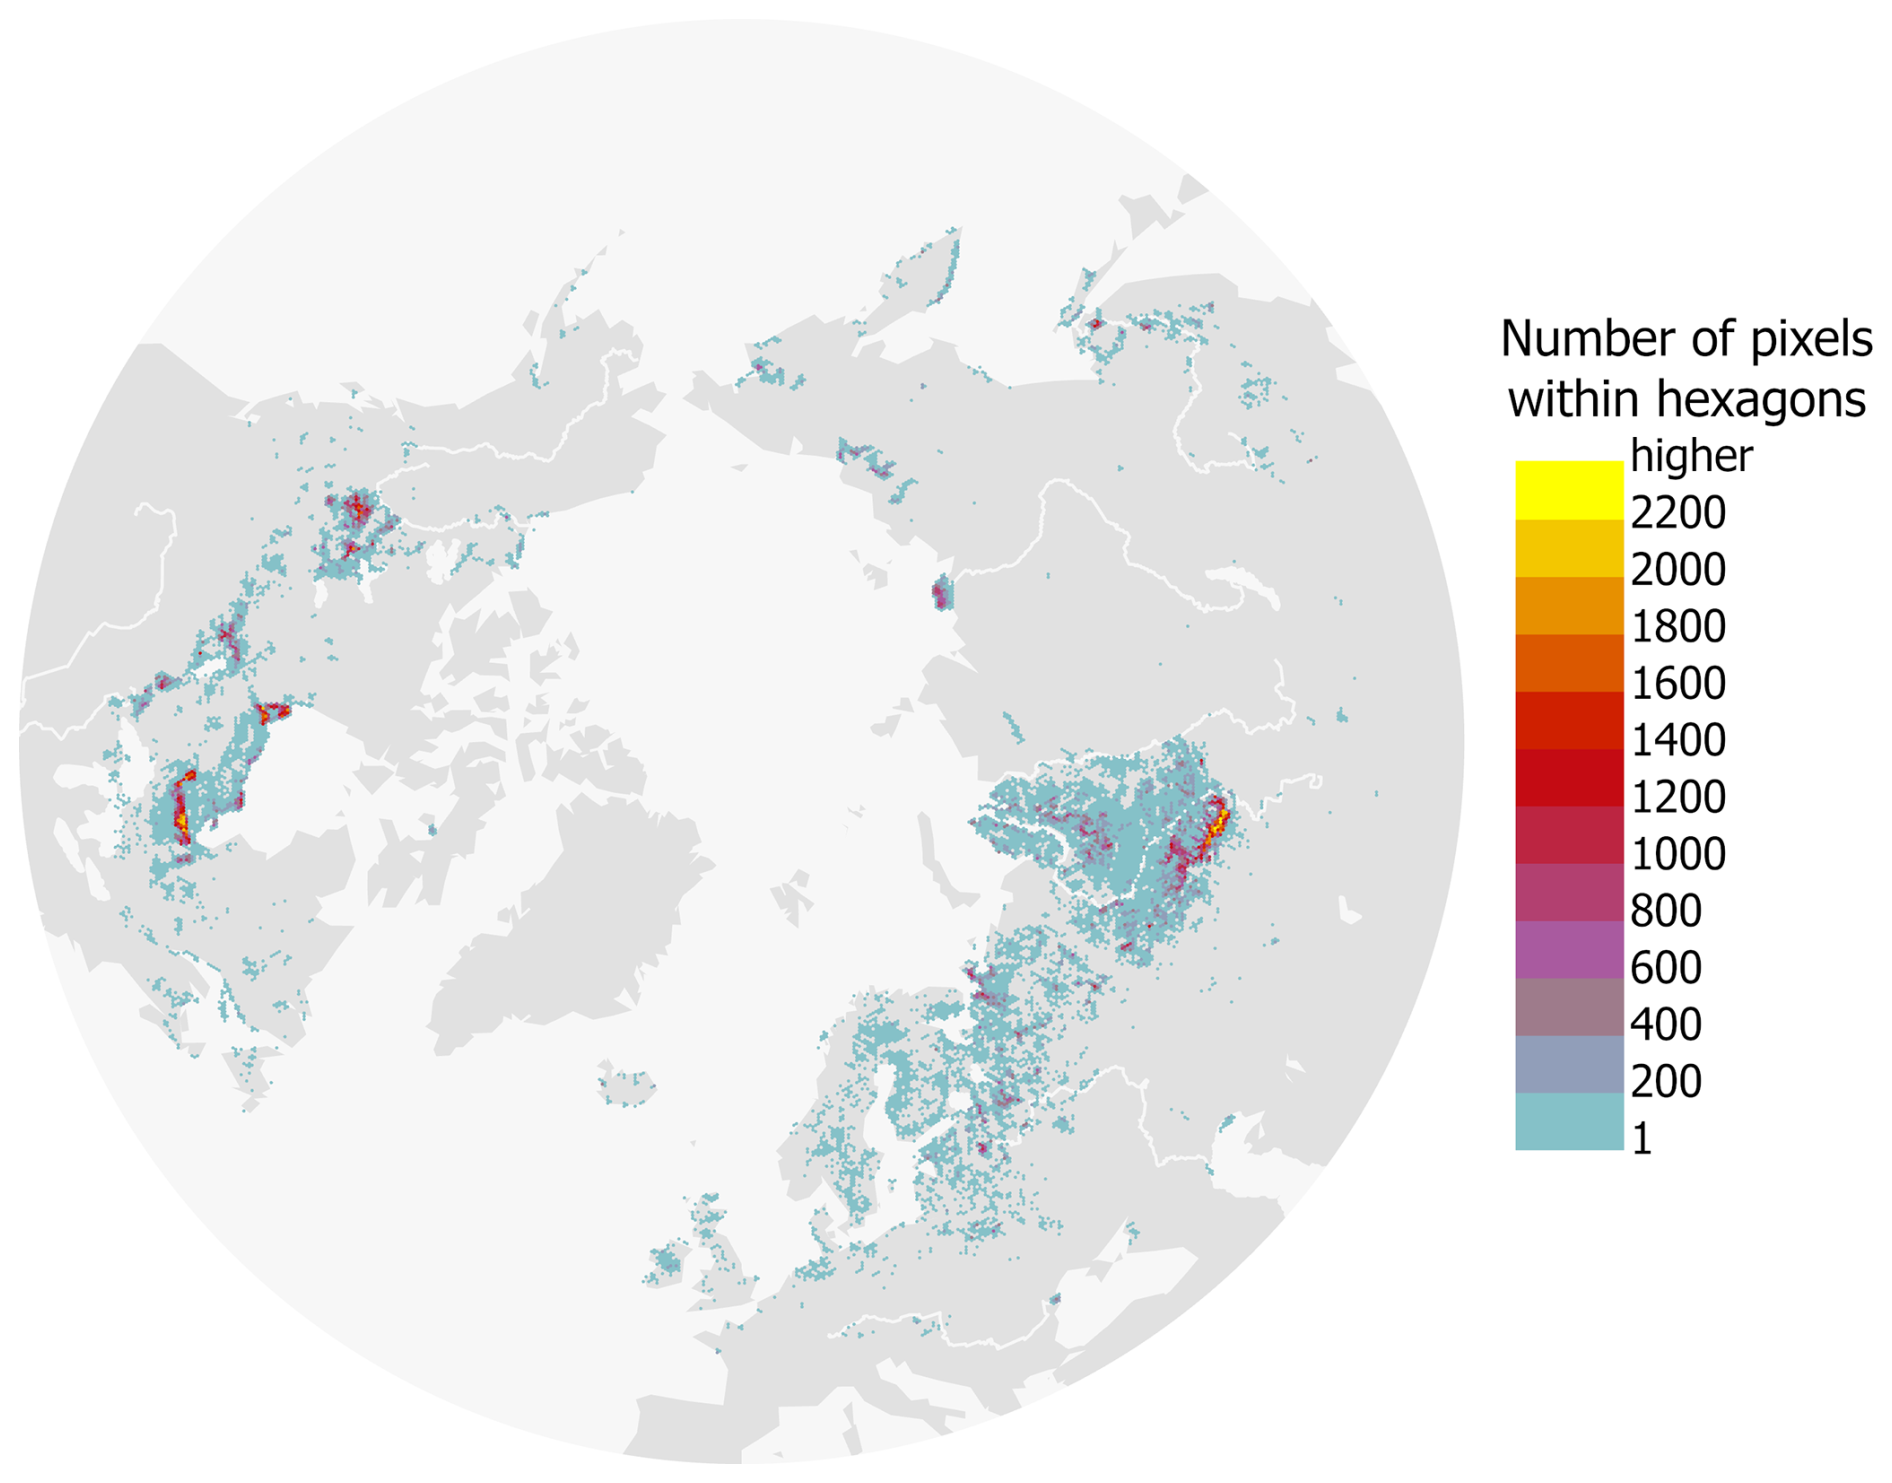
Figure 1Study area and number of 500 m resolution pixels from the sensor-independent leaf area index raster within each 500 km2 hexagon used for visualisation. The colour scheme indicates the number of LAI pixels with peatland coverage of 90 % or greater and without wildfire detected between 2001 and 2023.
2.3 Climatic, ecological, and protection-related data
2.3.1 Climatic information
To characterise a broad-scale climatic regime affecting peatland vegetation patterns, we used the present-day Köppen-Geiger climate dataset (Beck et al., 2018). In our study area, the climate classes varied between 5 (BWk: Arid, desert, cold) and 29 (ET: Polar, Tundra) with most of the pixels having climate 27 (Dfc: Cold, no dry season, cold summer – 985 441 pixels) and 26 (Dfb: Cold, no dry season, warm summer – 151 789 pixels). For analysis, the original classes were aggregated into four main groups: Dry (classes 5–7), Temperate (classes 8–16), Continental (classes 17–28), and Polar (class 29).
To represent multi-year to decadal climate variability potentially influencing vegetation, we used monthly Pacific Decadal Oscillation (PDO) index data for 2001–2023 (National Centers for Environmental Information (NCEI), 2025). PDO has a relatively strong impact on changes in temperature and precipitation in the region north of 40° N and can weaken or enhance greening trends (Guo et al., 2023). During the preliminary analysis, we examined monthly data for the Arctic Oscillation (AO), North Atlantic Oscillation (NAO), and Oceanic Niño Index (ANOM34), in addition to the PDO index. We estimated pixel-based Pearson correlations between detrended anomalies of LAI and those indices with a time lag from 0 to 6 months, assuming the lag effect within the same phenological year (Zhang et al., 2019). This screening was used to identify the index and lag with the strongest spatially coherent association with LAI anomalies, rather than to conduct pixel-level hypothesis testing. Since the PDO without time lag had the highest absolute values of the Pearson correlation coefficient (ranging from −0.33 to 0.37), we used it in further analysis. Finally, to capture spatial variability and long-term trends in key meteorological parameters, we used the daily mean air temperature at 2 m above the land surface and total precipitation from the ERA5 reanalysis for 2001–2023 (Hersbach et al., 2020).
2.3.2 Tree canopy cover and type
We used the global tree cover dataset for the year 2000, defined as canopy closure for all vegetation taller than 5 m and expressed as a percentage per grid cell (Hansen et al., 2013), to calculate the mean tree cover for each of the studied pixels.
To identify the potential tree-cover type present in the studied pixels, we used the MCD12Q1.061 annual land cover product at 500 m spatial resolution for 2001 as a baseline at the start of the analysis period. Land Cover Type 1, based on the International Geosphere–Biosphere Programme classification, was filtered to retain only the tree-cover classes. After that, we calculated planar Euclidean distances to identify the nearest pixel belonging to one of the retained classes and assigned its tree-cover type, ensuring that every studied pixel had an attributed potential nearest tree-cover class:
-
evergreen needleleaf forests included 488 104 pixels;
-
evergreen broadleaf forests included 1703 pixels;
-
deciduous needleleaf forests included 173 534 pixels;
-
deciduous broadleaf forests included 90 972 pixels; and
-
mixed forests included 489 750 pixels.
Classes 2 and 4 were merged because evergreen broadleaf forests (class 2) contained very few studied pixels. Assigning potential tree-cover type using the nearest-class distance matrix introduces some uncertainty, but it provides spatially complete coverage while retaining the broader landscape context of surrounding vegetation, offering a consistent solution for large-scale analyses. Nevertheless, the distances between pixel centroids and the nearest tree cover varied widely, which introduces uncertainty in these assignments: class 1 – mean 19 km (max 346 km), class 2 – 2 km (16 km), class 3 – 27 km (252 km), class 4 – 15 km (337 km), and class 5 – 4 km (254 km). Therefore, these forest-type effects should be further interpreted with appropriate caution. While many northern peatlands are naturally treeless, we assigned a potential tree-cover type to all pixels to enable its use in the analysis as an interaction term with tree-cover percentage, without implying the actual presence of trees in treeless areas (Fig. A2).
2.3.3 Elevation and continent information
We derived the elevation for each centroid of the studied pixels from the WorldClim 2.1 elevation layer (Fick and Hijmans, 2017), which is based on Shuttle Radar Topography Mission data and, north of 60° N, on the GTOPO30 global elevation model. The elevation of the studied pixels varied from −32 to 1619 m. Additionally, we included continent information to account for continental differences in vegetation sensitivity to climatic parameters (Muccio et al., 2025). In this sense, the continent was used to capture a large-scale regional context that was not fully represented by climate data, elevation, or tree cover. To assign each peatland pixel to a continent, we obtained country boundaries from the rnaturalearth package v. 1.0.1 in R (Massicotte and South, 2024), and split the Russian Federation along the 60° E meridian, treating the territory east of this line as Asia and the territory to the west as Europe.
2.3.4 Areas of Arctic lake drainage
We used the Arctic drained lake dataset (Chen et al., 2023) to identify the studied pixels with documented lake drainage events after 2001, allowing us to test whether such hydrological disturbances within peatland-dominated pixels were associated with distinct LAI trajectories.
2.3.5 Protection status of peatlands
Using the World Database on Protected Areas (downloaded April 2024), we classified each studied pixel into one of three protection categories:
-
Protected – pixels entirely within protected areas established before 2000 (136 999 pixels);
-
Non-protected – pixels outside any protection area for the full period covered by the dataset (1 038 094 pixels);
-
Mixed – pixels either (i) within protected areas designated after 2000, or (ii) partially overlapping both protected and unprotected areas between 2000 and 2023 (68 970 pixels).
We included all types of protection recognised in the dataset, regardless of designation level (national, regional, international, or not available) and legal status (“Designated”, “Proposed”, “Established”). This approach ensured that all areas recorded in the World Database on Protected Areas as having some form of protected-area designation at the start of, or during our 2001–2023 satellite record were represented. Only the polygon dataset was used; the point dataset was excluded, as just nine studied pixels included protected point sites of unknown area.
Our study comprised three main methodological steps (Fig. 2). First, we removed seasonal cycles and long-term trends from LAI, air temperature, and precipitation time series to examine whether short-term canopy anomalies were associated with climate anomalies (Sect. 3.1). Second, we identified whether LAI trends changed direction over time, allowing us to detect non-linear canopy trajectories in peatlands (Sect. 3.2). Finally, we estimated overall long-term increases and decreases in LAI trends and tested whether these trends were related to climate, tree cover, and the protection status of peatlands (Sect. 3.3). This research design allowed us to describe non-linear LAI behaviour while using formal inference to test map-scale long-term LAI trends and their associations with covariates.
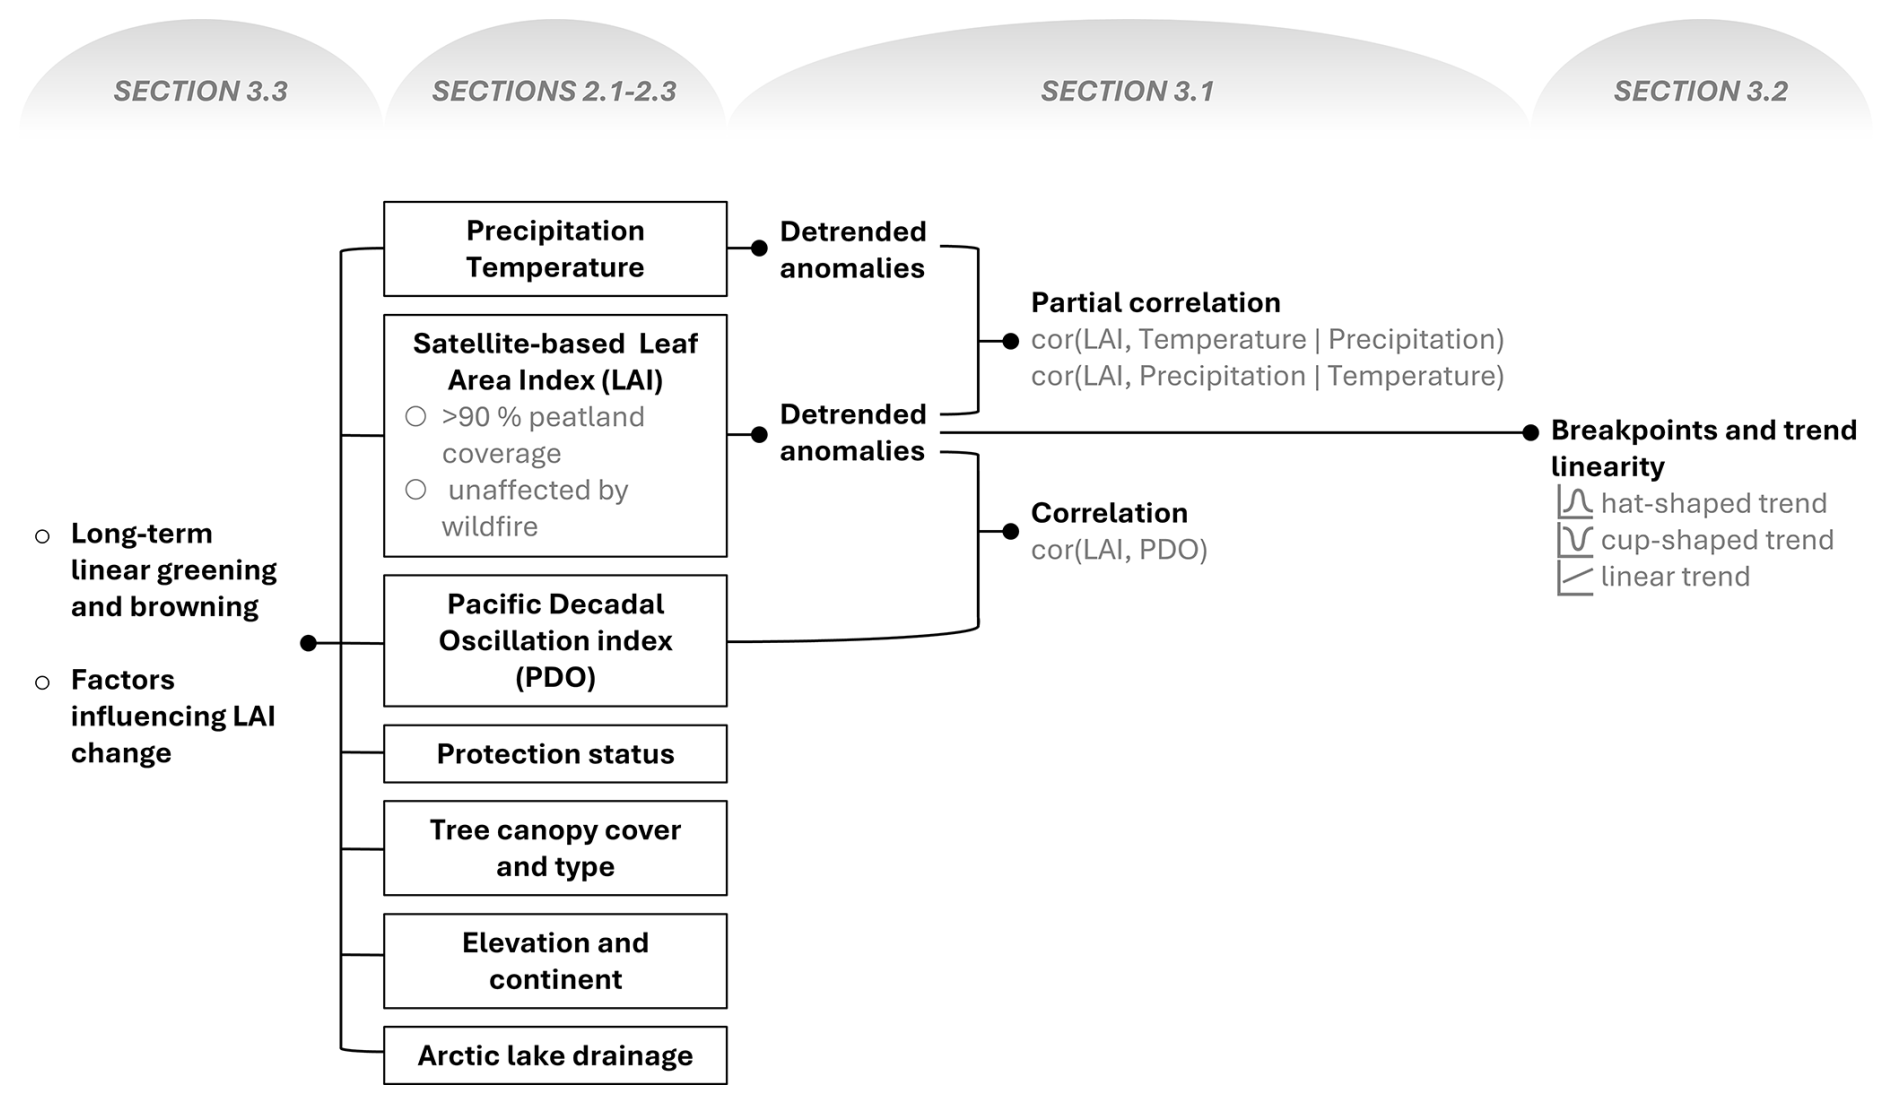
Figure 2General workflow of the study showing the main methodological steps used to analyse satellite-based leaf area index (LAI), detect breakpoints and trend shape, estimate long-term greening and browning trends, and test factors associated with LAI change in peatlands. Section numbers indicate where each step is described in more detail. Input datasets are shown as black-outlined boxes, and connector lines indicate the flow from datasets to derived variables and analysis.
3.1 Extraction of anomalies in LAI and climate data and analysis of their associations
First, we separated short-term variability from the regular seasonal cycle and long-term change in LAI, air temperature, and precipitation. For each pixel, we decomposed the LAI, temperature, and precipitation time series into three components: a seasonal component, a trend component and a remainder (rt) component, using the seasonal–trend decomposition by Loess implemented in R's base stl function (Cleveland et al., 1990; R Core Team, 2022). We applied a periodic seasonal window and set the trend window to one year. In the following analyses, we treated the remainder (rt) component as the anomaly, because it represents deviations from the expected seasonal cycle and long-term trend.
We did not exclude snow-covered periods from the analyses. In the LAI records, snow-affected retrievals are removed during quality screening and replaced with gap-filled estimates (Pu et al., 2024). The seasonal–trend decomposition by Loess assigns these recurring winter estimates to the seasonal component, so winter anomalies are close to zero. In this way, we retained the full time series to keep a regular and consistent time base across pixels, which is important for decomposition and trend estimation methods.
We then tested whether LAI anomalies were associated with temperature and precipitation anomalies at the pixel level. Because temperature and precipitation can covary, we used partial correlation to estimate the association between LAI and one climate variable while controlling for the other. Specifically, using the ppcor package v. 1.1 in R (Kim, 2015), we calculated: (i) the partial correlation between LAI and air temperature anomalies, controlling for precipitation anomalies, (Eq. 1), and (ii) the partial correlation between LAI and precipitation anomalies, controlling for air temperature anomalies, (Eq. 2).
where , , and are the remainder components for LAI, air temperature, and precipitation, respectively, in a pixel i at time t.
Finally, we assessed whether LAI anomalies were associated with PDO. Because the PDO index was available at a monthly temporal resolution, we first averaged the LAI anomalies from 8 d values to monthly means for each pixel. We then computed the Pearson correlation coefficient between monthly mean LAI anomalies and the monthly PDO index:
where is a monthly mean LAI anomaly for pixel i in month m, PDOm is the PDO index value in the same month, and is the resulting Pearson correlation coefficient.
3.2 Detecting breakpoints in LAI anomalies
A single long-term trend can mask breakpoints, where the direction of LAI change reverses during the study period. We therefore examined whether each pixel-level LAI anomaly time series followed one of three trend shapes following Higgins et al. (2023): (i) hat-shaped, where LAI trend increased initially then decreased, (ii) cup-shaped, where LAI decreased initially and then increased, and (iii) linear, where no change in trend sign was detected. We restricted our analysis to a single breakpoint to capture the main turning point over 2001–2023. While multiple breakpoints can occur globally, higher northern latitudes showed a higher share of zero and one trend change than lower latitudes (de Jong et al., 2012). Thus, the single-breakpoint model summarises the main change in direction, rather than implying that additional breakpoints cannot occur.
For each LAI anomaly time series rt, we first detected linear and non-linear (cup-shaped and hat-shaped) trends fitting Bayesian polynomial regression with LaplacesDemon package v. 16.1.6 in R (Statisticat LLC, 2021):
where xt is a time index in fractional years, standardised to zero mean and unit variance, b0 is the intercept, b1 is the linear trend coefficient, b2 is the curvature coefficient, and ϵt is Gaussian noise with variance σ2. This model was used to distinguish approximately linear anomaly time series from those exhibiting curvature. We considered curvature to be supported when 95 % of the credible intervals of b2 did not include zero.
We specified weakly informative priors and placed a N(0,10) prior on log σ, and recover the noise scale via σ=exp (log σ), ensuring σ>0. The Adaptive Metropolis–within–Gibbs sampler was run for 600 000 iterations with thinning set to 150. We recorded posterior means, standard deviations, 95 % credible intervals, overall acceptance rate, and deviance information criterion.
For LAI anomaly time series with supported curvatures, we then fitted the bent-cable model (Chiu et al., 2006) to identify the timing and direction of the main change in LAI anomalies, i.e. breakpoints:
where rt is the LAI anomaly at time t, xt is the standardised time index, b0 is the intercept, b1 is the slope before the breakpoint, b2 is the change in slope after the breakpoint, q is the bent-cable basis function, τ is the central location of the breakpoint in scaled time, γ is the half-width of the transition zone around the breakpoint, and ϵt is Gaussian noise with variance σ2. We constrained τ to the central 70 % of the time series, , to avoid estimating breakpoints at the very beginning or end of the time series. The half-width parameter γ was assigned a uniform prior between 0 and 2 scaled time units. We ran 30 000 Adaptive Metropolis–within–Gibbs iterations with thinning set to 150. Finally, we converted τ back to the calendar date and used the fitted trend direction to classify non-linear time series as either cup-shaped or hat-shaped.
3.3 Estimating long-term linear greening and browning trends and testing of factors influencing LAI change
To estimate long-term greening and browning trends of LAI, we modelled LAI change through time while accounting for both temporal autocorrelation within each pixel and spatial autocorrelation across 1 244 063 pixels. This was done using the remotePARTS package v. 1.0.4 in R (Ives et al., 2021; Morrow and Ives, 2025) that reduces sensitivity to autocorrelation in satellite time series (Ploton et al., 2020).
The analysis proceeded in three steps. First, for each pixel, we fitted a linear trend to the LAI, air temperature, and precipitation time series with first-order autoregressive errors, AR(1), using the function fitAR_map(). This provided pixel-level trend estimates while accounting for temporal autocorrelation within each time series. Second, we used the AR(1) residuals to estimate the range parameter of an exponential spatial covariance model, describing how residual similarity declines with distance among pixels. Third, for computational efficiency, we divided the full dataset of 1 244 063 pixels into 1500-pixel partitions and analysed these partitions in parallel using function the fitGLS_partition(). Within each partition, we fitted generalised least squares models with exponential spatial covariance and a nugget term. The partition-level test statistics were then combined into an overall map-scale inference, while accounting for spatial non-independence. We used this framework to test four hypotheses: (i) whether LAI trends differed from zero across all pixels (net greening or browning), (ii) whether the association between tree cover and LAI varied within tree cover type and density, (iii) whether protected peatlands differ from unprotected peatlands in their LAI trends; (iv) and whether LAI trends varied with climate zones and continents, latitude, longitude, and local air temperature and precipitation.
We selected the final partitioned spatial generalised least squares model by testing each candidate against its main-effects baseline using the remotePARTS pooled likelihood-ratio F-test, retaining the most parsimonious specification that significantly improved the fit. We prioritised interpretable, biophysically consistent interactions and excluded additions that offered negligible gains in residual sum of squares error. The final model is summarised in Table A1, and the intercept-only map-level trend model used to test the overall LAI trend is summarised in Table A2. Further details about the hypothesis testing with the remotePARTS package can be found in the original paper by Morrow and Ives (2025).
3.4 Visualisation
To minimise overplotting, we overlaid a grid of 500 km2 hexagons on the raster data and, within each hexagon, calculated the mean of numerical values and the majority class for categorical data. These aggregated data were used only for plotting; analysis was conducted using non-aggregated data. These aggregated summaries are what we display on the manuscript's maps, with the total number of analysed raster pixels within each hexagon shown in Fig. 1.
4.1 Associations of LAI with air temperature, precipitation, and the PDO index
To study the association between LAI anomalies and potential climate drivers, we estimated spatial partial correlations between LAI anomalies and air temperature and precipitation anomalies, and a Pearson correlation between LAI anomalies and the PDO index. Anomalies in LAI showed a weak but predominantly positive partial correlation with air temperature anomalies (Fig. 3a) and a weak, predominantly negative partial correlation with precipitation anomalies (Fig. 3b). The regions with the strongest associations were broadly the same for both climate variables, most prominently in West Siberia and the Hudson Bay Lowlands. The correlation with the PDO index was spatially patchy and changed sign by region, with a broad positive correlation in southern West Siberia and the European part of Russia, and negative correlations in northern Europe and scattered areas in the Canadian Interior Plains (Fig. 3c).
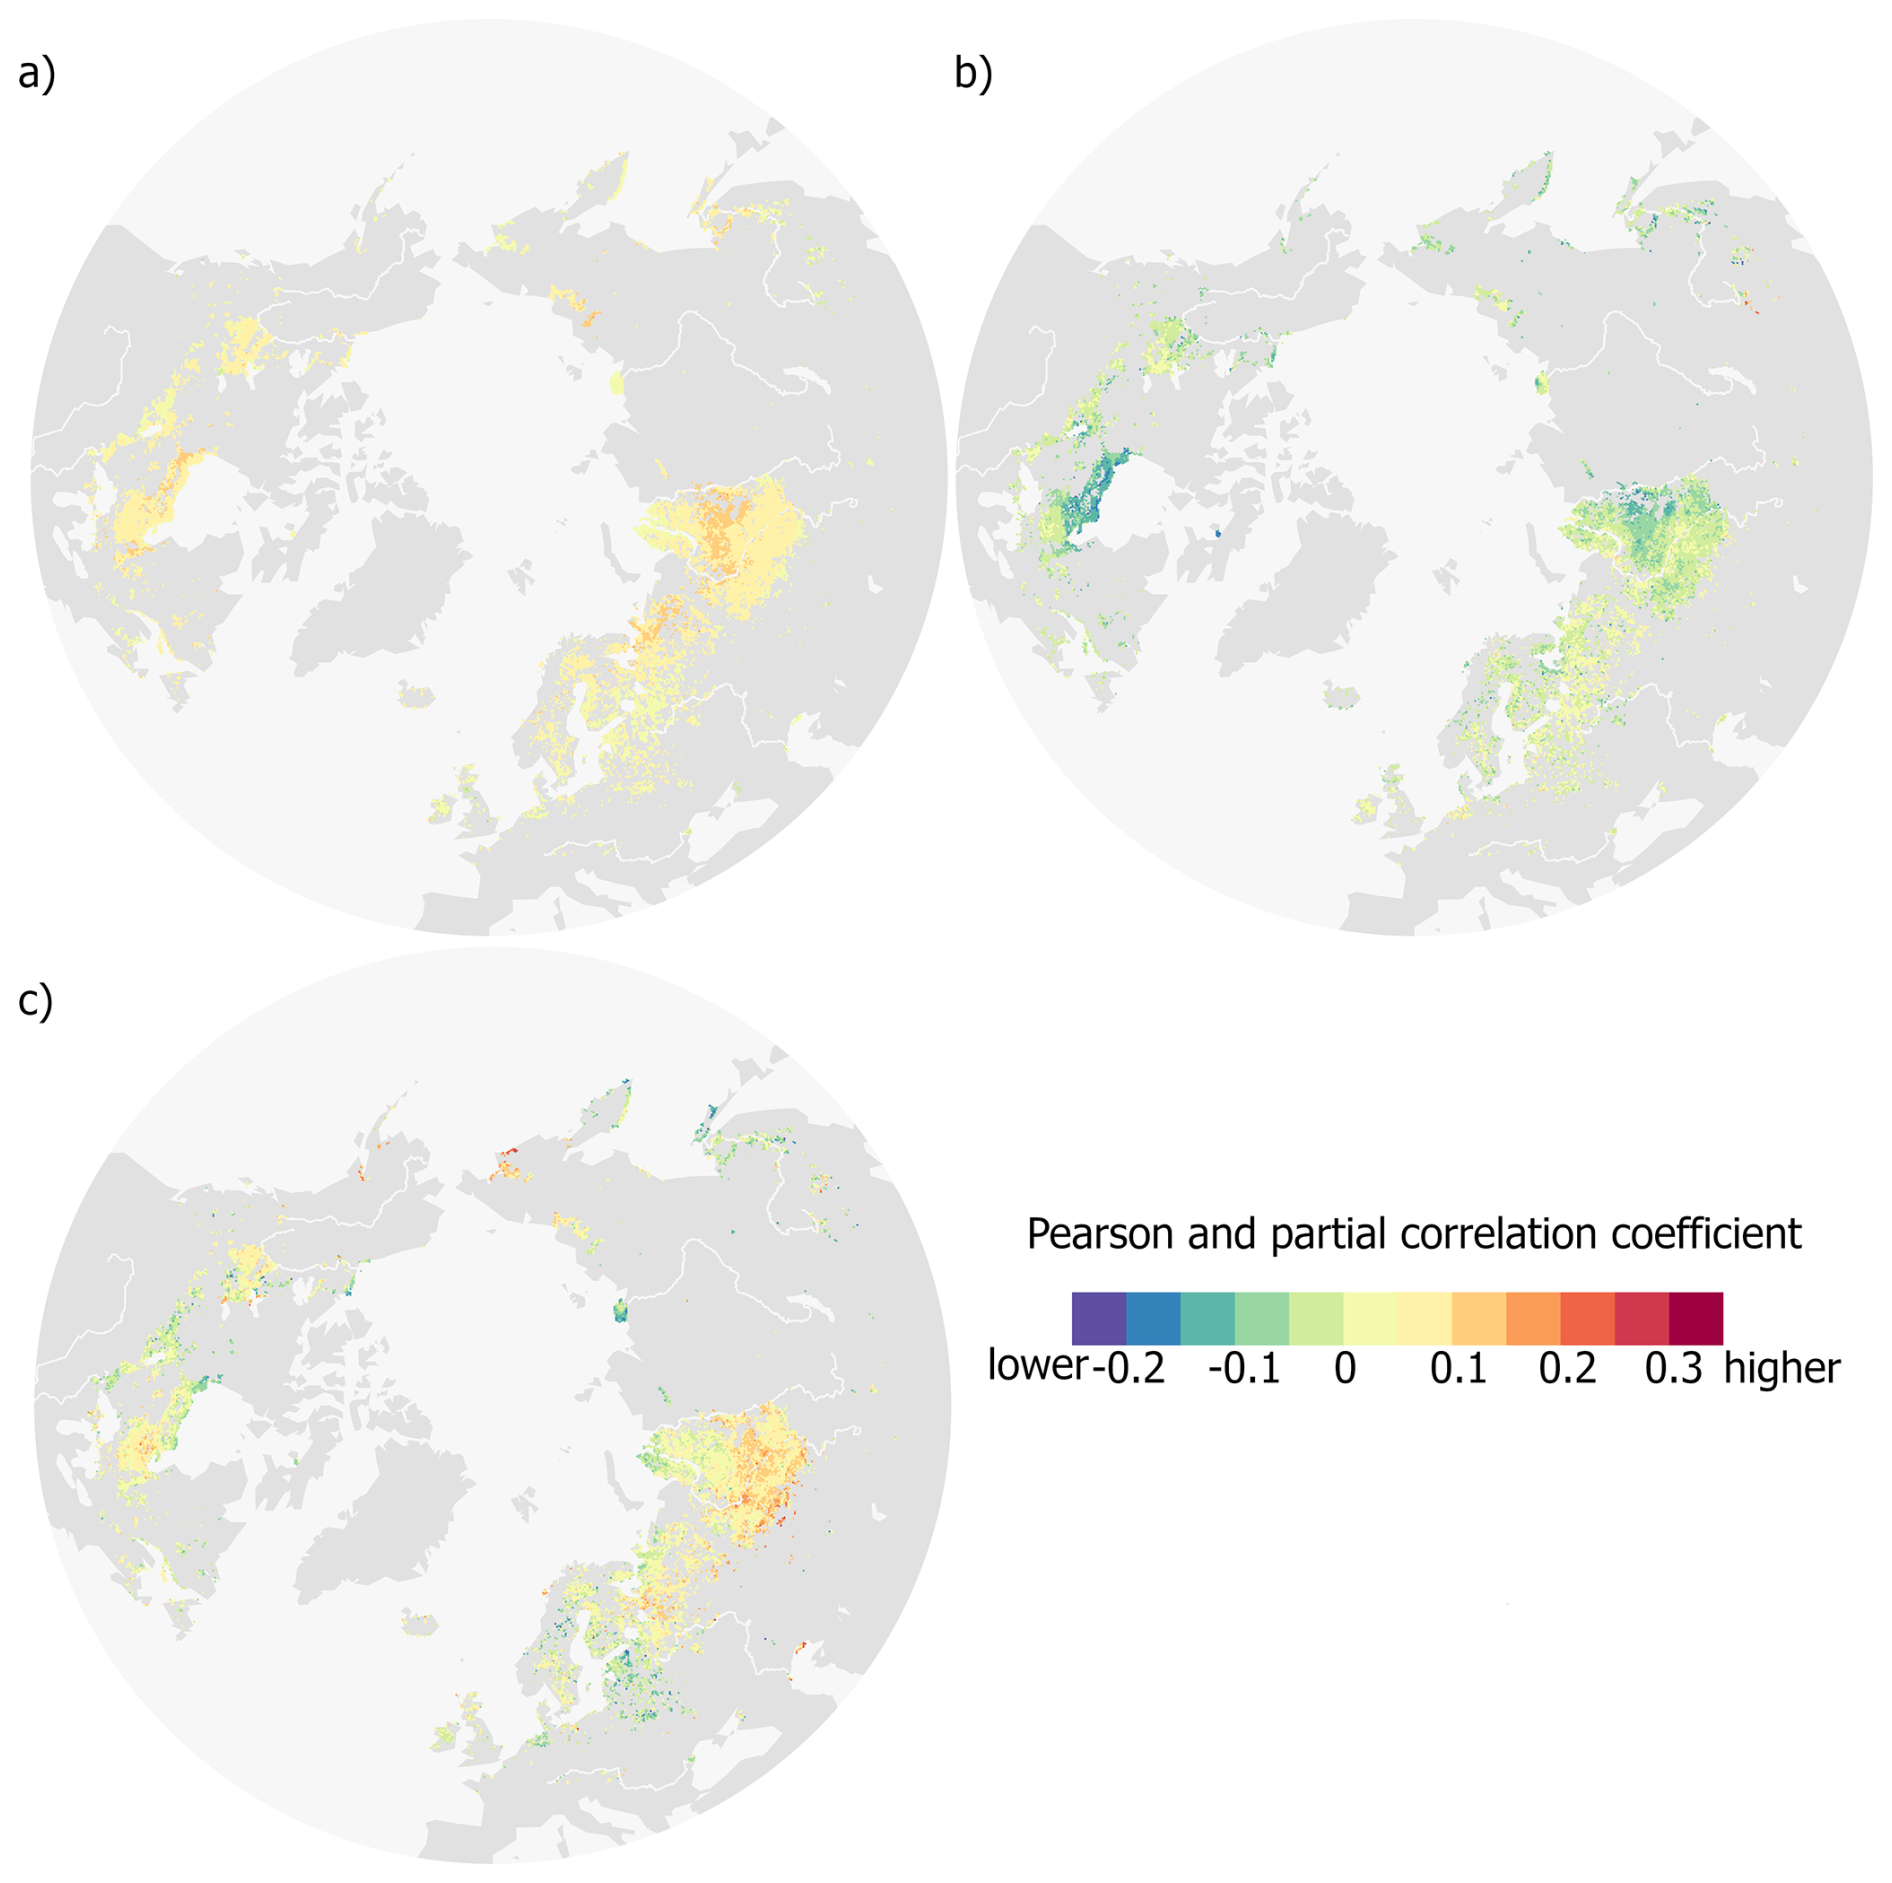
Figure 3Spatial patterns of correlation between monthly anomalies of leaf area index (LAI) and potential climate drivers across northern peatlands during 2001–2023. (a) Partial correlation between LAI anomalies and air temperature anomalies, controlling for precipitation anomalies. (b) Partial correlation between LAI anomalies and precipitation anomalies, controlling for air temperature anomalies. (c) Pearson correlation between monthly LAI anomalies and the Pacific Decadal Oscillation (PDO) index. Colours indicate correlation coefficients, with the same scale applied to both Pearson and partial correlations.
4.2 Shapes in LAI anomaly trends
At each pixel, the LAI anomaly trend over 2001–2023 took one of the three shapes: linear, cup-shaped, and hat-shaped, and these shapes revealed clear regional patterns (Fig. 4a). Here, linear refers to pixels with no detected change in trend direction, cup-shaped refers to pixels where LAI anomalies first declined and then increased, and hat-shaped refers to pixels where LAI anomalies first increased and then declined. Linear trends dominated large areas, cup-shaped trends were concentrated in West Siberia, and hat-shaped trends were widespread across Europe, northeastern Asia, and Canada. In West Siberia, a north–south gradient was evident, from cup-shaped in the north, through mainly linear in the centre, to predominantly hat-shaped in the south.
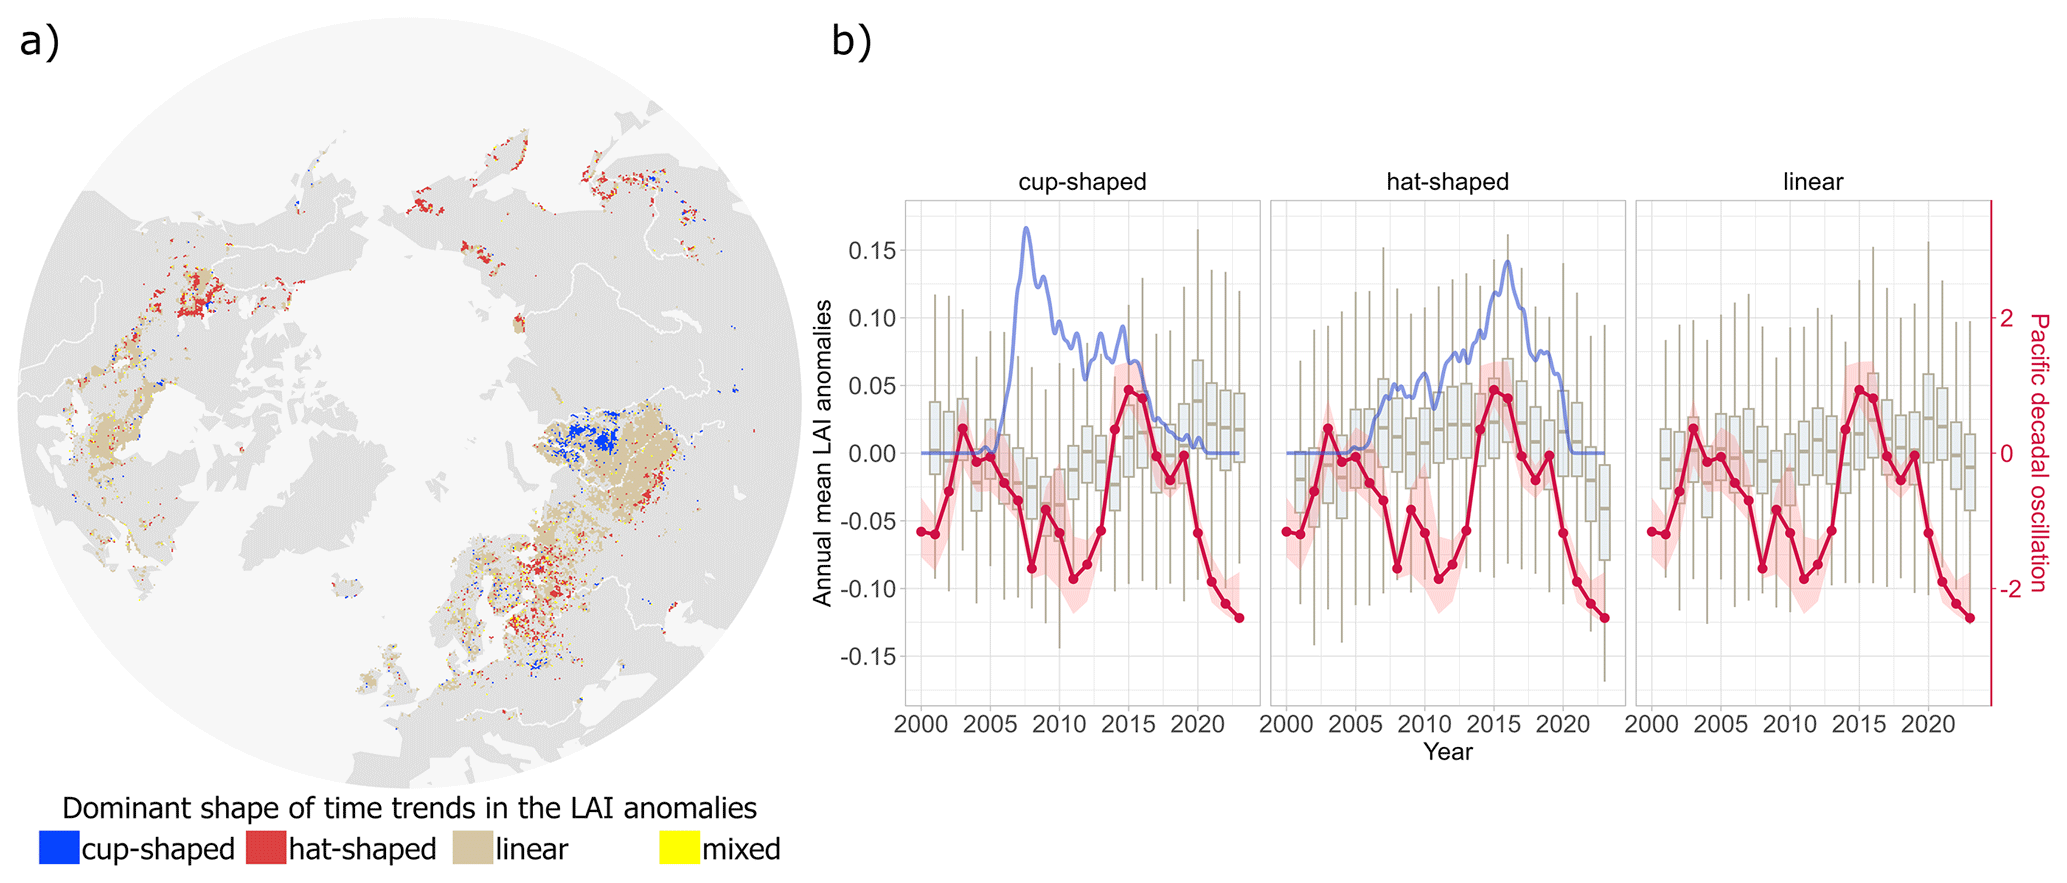
Figure 4Spatial and temporal patterns of dominant LAI anomaly trends in northern peatlands. (a) Spatial distribution of the dominant trend shape in LAI anomalies, classified as cup-shaped, hat-shaped, linear, or mixed (where two or more shapes occurred with equal frequency within a hexagon). (b) Annual mean LAI anomalies (box plots) for pixels belonging to each trend type, overlaid with the density of posterior mean breakpoint years (blue line; higher values indicate more pixels with a breakpoint in that year) and the Pacific Decadal Oscillation (PDO) index (red line; shaded area shows 25 %–75 % quantiles).
Annual dynamics in mean LAI anomalies also differed by trend shape (Fig. 4b). For the cup-shaped trends, anomalies declined during 2005–2010, and the density of posterior mean breakpoints peaked earlier (2005–2010) than in the hat-shaped class. For the hat-shaped trends, anomalies rose to a maximum around 2010–2015 and then decreased, with a later peak in breakpoint density (2012–2016). In both non-linear classes, peaks in breakpoint density occurred soon after a phase change in the PDO.
4.3 Decadal LAI trends
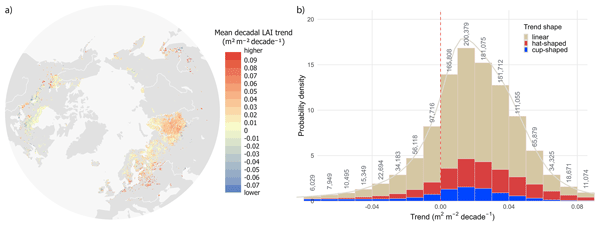
Out of the studied northern peatlands (approximately 261 819 km2), more than 77 % (203 269 km2) showed positive LAI trends, and the remainder (approximately 58 550 km2) showed negative trends (Fig. 5a). The strongest positive decadal LAI trends clustered in southern West Siberia, Central Europe, and southern Fennoscandia. The largest pattern of negative LAI trends was located near Hudson Bay Lowlands in North America. Overall, the LAI trends in peatlands ranged from −1.07 to 0.78 m2 m−2 per decade, with 95 % of values ranging from −0.07 to 0.09 m2 m−2 per decade. Across the distribution of mean decadal LAI trends, the three trend shapes contributed in broadly similar proportions (Fig. 5b).
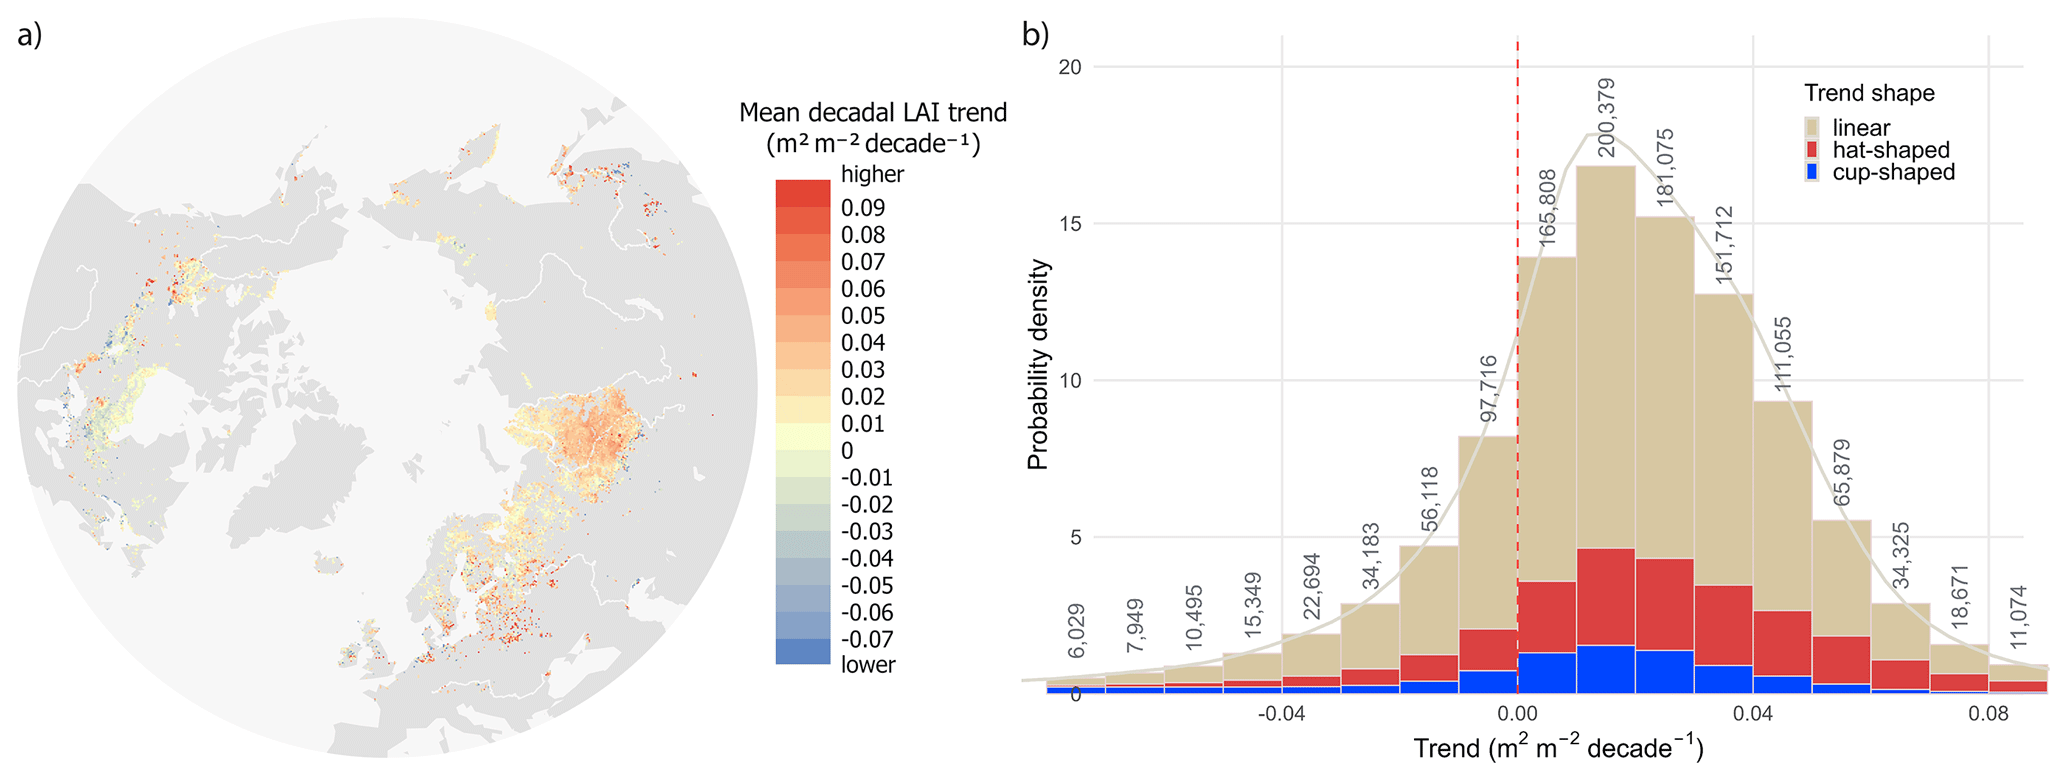
Figure 5Spatial distribution and frequency of mean decadal LAI trends in northern peatlands (2001–2023). (a) Map of the mean decadal LAI trend, where warmer colours indicate stronger greening and cooler colours indicate browning. (b) Distribution of decadal trends shown as a density-scaled histogram, with bar fill indicating the dominant trend shape (linear, hat-shaped, cup-shaped). Numbers above bars are pixel counts per bin; the grey curve is the kernel density estimate, and the dashed vertical line marks zero trend.
Despite a high proportion of greening trends, we did not find a significant overall increase in LAI at the map scale between 2001 and 2023 (Table A2). The partitioned spatial generalised least squares model further indicated that greater tree cover was associated with less greening (i.e., less positive or more negative) LAI trend, conditional on continent, mapped tree-cover context, and the multi-year mean annual precipitation estimated for 2001–2023. In Asian peatlands where the nearest surrounding trees in 2001 were mapped as evergreen needleleaf, each additional +1 % tree cover was associated with a mean decline of m2 m−2 per decade (Table A1). Relative to Asia, the slope was markedly steeper in North America and marginally weaker in Europe. Relative to the evergreen needleleaf baseline, deciduous needleleaf cover attenuated the negative tree-cover effect, whereas broadleaf and mixed forests tended towards more negative slopes. Higher multi-year mean annual precipitation was associated with a less negative tree-cover slope.
After accounting for the continent, tree canopy type and cover, and precipitation in a generalised least squares model, the remaining factors, such as protection status, climate zones, and geographical coordinates, were found to be insignificant. We did not include Arctic lake drainage in the generalised least squares model because it was present in only 2328 pixels (0.187 % of the dataset). Nevertheless, pixels overlapping drained lakes showed a higher proportion of increasing LAI trends: 94.5 % of overlapping pixels had increasing trends, comprising 1185 pixels with linear increasing trends, 758 with cup-shaped increasing trends, and 256 with hat-shaped increasing trends (Fig. 6). Although linear increasing trends accounted for the largest number of overlapping pixels, the relative share of drained-lake overlap was highest for cup-shaped increasing trends, and the overlapping pixels were predominantly located in Asian peatlands. Given the limited and spatially clustered sample, this pattern should be interpreted as exploratory and not generalised.
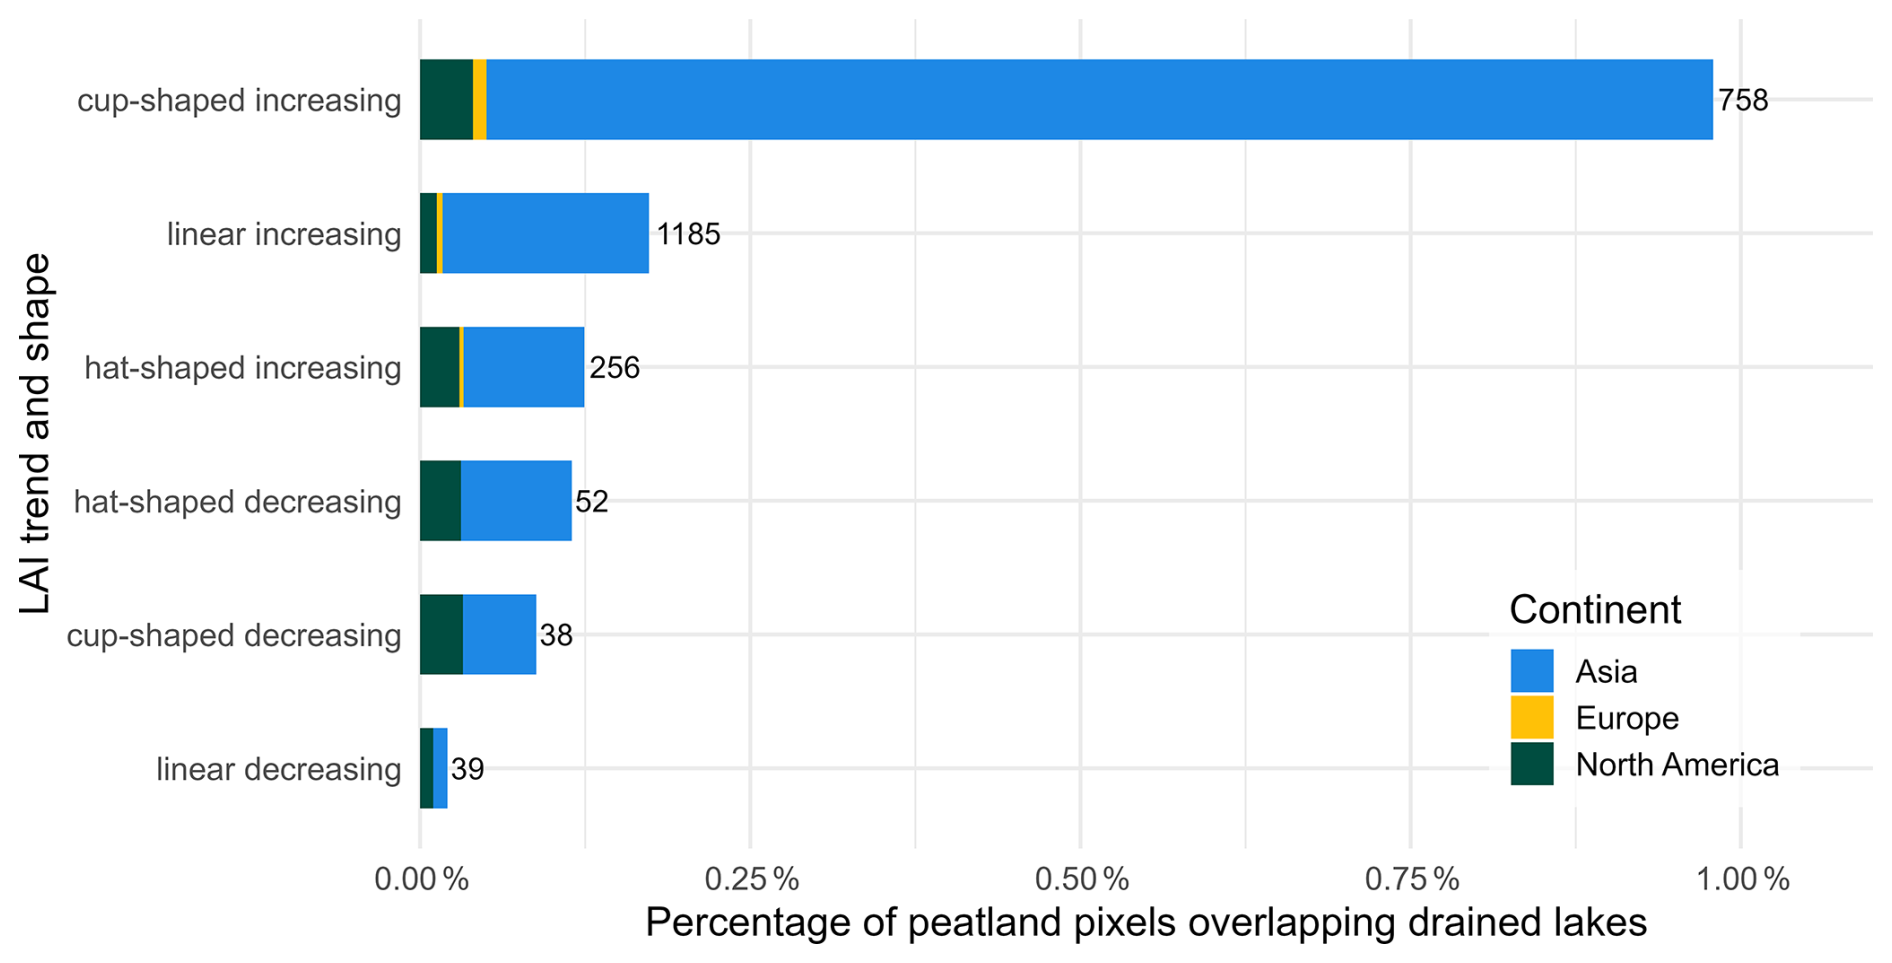
Figure 6Proportion of peatland pixels that overlap drained-lake polygons by long-term LAI trend (increasing and decreasing) and trend-shape class. Horizontal bars indicate the share of pixels with a drained lake overlap greater than 0 %; coloured segments denote the continental composition (Asia, Europe, North America) of the overlapping pixels. Numbers at bar ends give the count of overlapping pixels. Classes are ordered by decreasing prevalence.
5.1 Long-term trends in LAI
We found that vegetation greening was observed across 77 % of the studied peatlands for 2001–2023, with a greening-to-browning ratio of 3.5:1. This is broadly consistent with multi-decadal satellite records that reported widespread greening since at least the 1980s across different regions (Myneni et al., 1997; Piao et al., 2019), although the extent of greening varied with study scale and timeframe. At the global scale, greening was estimated at 27 % for 2000–2017 using MODIS annual maximum FPAR (Cai et al., 2025), 40 % for 1981–2017 with GIMMS and MODIS LAI (Winkler et al., 2021), 46 % for 1985–2011 using GIMMS3g LAI (Forzieri et al., 2017), and up to 50 % for 1982–2014 with GIMMS LAI3g, GLOBMAP LAI, and GLASS LAI (Zhu et al., 2016). Regional studies reported comparable areas of greening, including 39 % in the Arctic and 41 % in the boreal vegetation for 1981–2011 with Normalized Difference Vegetation Index (NDVI) data from GIMMS NDVI3g product (Xu et al., 2013), 24 % in an undisturbed Canadian forest for 1981–2011 with Landsat NDVI (Sulla-Menashe et al., 2018), and only 8.4 % in West Siberia for 2000–2014 using MODIS NDVI data (Miles and Esau, 2016).
Our higher greening percentage most likely reflects methodological differences. We used the PARTS approach and, unlike many previous studies, did not threshold trends by per-pixel p-values; requiring per-pixel significance typically reduces the mapped extent of greening. Additionally, part of this difference in estimated greening may also stem from the vegetation metric itself: many previous studies were based on NDVI, which responds to canopy chlorophyll and saturates relatively early (Camps-Valls et al., 2021). By contrast, the LAI data used in our study is a biophysical measure of leaf area retrieved primarily through a physically based radiative transfer algorithm rather than from spectral greenness alone (Pu et al., 2024). Greening and browning expressed through these metrics are therefore not directly comparable, and this may help explain some of the divergence between our LAI-based results and earlier NDVI-based estimates. Yet our greening-to-browning ratio is consistent with a 3.6:1 greening-to-browning ratio in the Low Arctic observed before (Berner et al., 2020).
An additional note of caution is warranted because our analysis represented peatland-dominated, unburned 500 m pixels rather than the full northern peatland domain. Our mapped and analysed peatland area was smaller than the potential peatland domain indicated by PEATMAP and Global Peatland Map 2.0. This difference reflects our conservative sampling strategy rather than a revised estimate of the extent of northern peatlands. Broad products such as PEATMAP cells with peat cover >0 % and Global Peatland Map 2.0 include mosaic and low-fraction peatland areas, whereas our analysis retained only peatland-dominated 500 m pixels and excluded areas affected by wildfire during 2001–2023. This conservative pixel selection was intended to reduce mixed-pixel effects from adjacent non-peatland land covers, such as open water, non-peatland forests, and agricultural land, and to avoid confounding by abrupt fire disturbance and post-fire recovery. However, it also means that fragmented, small, recently burned, edge-dominated, and mosaic peatlands are likely underrepresented, potentially biasing greening–browning estimates.
Observed greening and browning trends in this study should not be interpreted as direct indicators of change in peatland productivity. In boreal and Arctic ecosystems, disturbances can affect vegetation trends, producing browning after tree loss and greening during post-disturbance recovery (Wang and Friedl, 2019). Although we minimised wildfire effects by excluding burned pixels, we did not account for insect defoliation and associated tree mortality (MacLean, 2016), or for disturbances related to peatland drainage and restoration. Moreover, greening trends can even coincide with declines in terrestrial carbon storage, for example, where forest cover decreases, and understory vegetation becomes more visible to satellite sensors (Loranty et al., 2018; Rautiainen et al., 2007; Rautiainen and Lukeš, 2015). In permafrost peatlands, thaw adds a further pathway of vegetation reorganisation, including shifts in dominant tree species and transitions between forested and wetland states (Carpino et al., 2021; Dearborn et al., 2021). Therefore, the widespread positive LAI trends observed here likely integrate multiple forms of vegetation change, rather than representing a single uniform greening mechanism. Some of these possible mechanisms are discussed in more detail in the following sections.
5.2 Influence of precipitation and air temperature on LAI
At broader scales and across many ecosystems, greening was often associated with higher precipitation (Cai et al., 2025; Forzieri et al., 2017; Piao et al., 2019). In contrast, we found a predominantly negative association between LAI and precipitation in northern peatlands (Fig. 3b). This pattern is consistent with Yuan et al. (2019), who reported a positive relationship between LAI and vapour pressure deficit over peatland-dominated areas of West Siberia and the Hudson Bay Lowlands, whereas greenness generally decreased with rising vapour pressure deficit across much of the globe (Yuan et al., 2019). Multiple mechanisms can mediate LAI-precipitation relationships at high latitudes; for example, browning in parts of the Arctic was linked to increased cloud cover (Lara et al., 2018), whereas greening arose from graminoid and shrub expansion (Berner et al., 2020; Kettridge et al., 2015; Myers-Smith et al., 2011).
In northern peatlands, this negative LAI-precipitation association aligns with hydrological controls: reduced precipitation lowers the water table, leading to peatlands drying under a warmer climate (Swindles et al., 2019). Such hydrological shifts favour the expansion of dry-habitat species (Gałka et al., 2023), for example, vascular plant expansion at the expense of Sphagnum where the water table falls below ∼20 cm under persistently warm conditions (Keane et al., 2025). This vegetation change increases vascular leaf area and, consequently, the overall LAI of peatlands. Thus, greening in northern peatlands may reflect the expansion of vascular plants rather than enhanced Sphagnum growth.
It is noteworthy that multi-year mean annual precipitation, rather than air temperature, was retained in the best-fitting model. This aligns with the evidence that multi-decadal greening in high latitudes was primarily associated with rising air temperatures, resulting in growing-season lengthening and the relaxation of cold constraints (Park et al., 2020; Piao et al., 2019). However, recent evidence suggests that, over the past two decades, vegetation responses have become increasingly constrained by moisture balance, making water availability an important control on canopy dynamics (Chen et al., 2025), and may have facilitated the expansion of vascular plants in peatlands (Bu et al., 2011). Probably due to these moisture-driven conditions in our study region, a higher multi-year mean annual precipitation moderated the negative tree-cover slope, making it less negative (and, in sufficiently wet sites, even positive).
Given the centrality of moisture in northern peatlands, interpreting LAI dynamics requires tracking moisture conditions alongside temperature. Recent analyses indicated increased aridity across northern Eurasia (Sardans et al., 2024) and expanding heatwave coverage in the Arctic (Rantanen et al., 2024), both of which could intensify evaporative loss and further increase the expansion of vascular plants. Therefore, future work could link observed LAI trends with modelled peatland moisture, for example, using peatland-specific land-surface models (Bechtold et al., 2019), to improve detection of recent moisture-driven regime shifts in northern peatlands at the circumpolar scale.
5.3 Influence of PDO and non-linearity in LAI trends
For the first time, to our knowledge, we observed that a shift in the PDO phase might contribute to changes in peatland vegetation trends (Fig. 4b), with a high number of breakpoints in the LAI trend occurring soon after a PDO phase change. This aligns with prior works showing that PDO modulates vegetation in other regions via meteorological anomalies (Guo et al., 2023; Pan et al., 2018): growing-season greenness tends to be higher during negative than positive PDO phases (Gonsamo et al., 2016). Moreover, the extremely positive PDO in 2015 resulted in higher greening, where it brought cooler, wetter conditions (central Eurasia) and browning, where it brought warmer, drier conditions (central Europe and western North America) (Bastos et al., 2017).
The PDO-LAI relationships showed clear, region-specific signs (Fig. 3c). Under the negative PDO phase, local meteorological conditions differ by region: it is warmer and wetter in West Siberia but cooler and drier in the Baltic region and along the North American Pacific coast (Guo et al., 2023). Accordingly, in West Siberia, we observed predominantly negative LAI anomalies during the negative PDO phase (2005–2012; Fig. 4a) and a positive correlation between PDO and LAI (higher LAI with positive PDO and lower with negative PDO). In the Baltic region, we observed mostly positive LAI anomalies during negative PDO phases, accompanied by a negative correlation between PDO and LAI (higher LAI during negative PDO phases and lower during positive PDO phases). Along the North American Pacific coast, the cooler, drier negative phase likewise coincided with positive LAI anomalies. Taken together, these spatial patterns likely reflect a PDO-associated moisture anomaly, with regional modulation by other large-scale atmospheric circulation (MacIas-Fauria et al., 2012; Scholten et al., 2022). In this way, precipitation anomalies, through their effects on the water table in peatlands, may determine the favourable conditions for the expansion and growth of vascular plants: wetter phases tend to suppress vascular canopy development, whereas drier phases favour vascular growth (Keane et al., 2025; Kettridge et al., 2015).
Beyond large-scale atmospheric circulation, permafrost thaw can also introduce decadal non-linearity in LAI trends. Frozen ground acts as a hydrological dam; thawing and thermokarst-lake drainage breaches this dam, reconfiguring drainage pathways and partially draining areas, which leads to land cover transition (Carpino et al., 2021). Consistent with this pathway, pixels overlapping mapped drained lakes showed a higher prevalence of increasing and cup-shaped LAI trajectories (Fig. 6), compatible with a vegetation shift in which initial permafrost disturbance is followed by graminoid and shrub colonisation and, locally, tree establishment after ∼2–3 decades (Carpino et al., 2021). Because moderate-resolution LAI data integrates heterogeneous peatland–lake mosaics, part of the apparent LAI increase may reflect a decline in the open-water fraction rather than canopy change alone. Nevertheless, the vegetation shift associated with permafrost thaw and thermokarst-lake drainage remains poorly quantified at circumpolar scales; future work should utilise higher-resolution greenness analyses (e.g., Landsat/Sentinel-2) to study the thaw–drain–revegetate mechanism across regions.
5.4 Tree cover and LAI trends
LAI trends became more negative with increasing tree cover; however, the effect was numerically small ( m2 m−2 per decade per 1 % increase in cover in the Asia evergreen baseline; Table A1). This finding is consistent with that of Winkler et al. (2021), who reported browning in areas with high LAI (forests) and greening in low-LAI areas, attributing forest browning to climate-change-driven water stress and disturbances, and greening in northern low-LAI ecosystems to lengthening of the growing season. Because that study did not include areas with high peatland density, it is essential to note that peatlands may involve additional mechanisms. For example, the loss of evergreen needleleaf trees (black spruce) can lead to counterintuitive greening trends in peatlands through reduced shading and species shifts (Dearborn and Baltzer, 2021).
In our study, the tree-cover slope was significantly attenuated in deciduous needleleaf contexts. This aligns with Dearborn and Baltzer (2021), who showed that larch mitigates the negative association between tree mortality and greening, and Miles and Esau (2016), who found that larch-dominated needle-leaf forests were greening, unlike evergreen coniferous forests and evergreen-majority mixed forests in Western Siberia. Taken together, these observations may suggest that LAI increases in peatlands near deciduous needleleaf forests could partially reflect colonisation by adjacent deciduous conifers of drier sites (Kirpotin et al., 2009) in the Western Siberian taiga, where an ongoing peatland decline is occurring (Kirpotin et al., 2009).
Within our dataset, North American peatlands exhibited higher baseline tree cover than Eurasian peatlands (Fig. A2), which may partly explain the stronger estimated tree-cover penalty in North America. Relative to Asia, the tree-cover coefficient yielded a total slope of m2 m−2 per decade per 1 % cover in the North American evergreen needleleaf baseline (Table A1). Counterintuitively, the largest positive LAI trends in North America occurred at high tree-cover levels. This can arise when partial conifer mortality and understory release increase vascular leaf area despite high initial canopy cover, as documented in boreal peatlands (Dearborn and Baltzer, 2021). In the Hudson Plains, we observed small trends in LAI, whereas Montesano et al. (2024) reported an increase in tree cover over recent decades, suggesting broader vegetation changes in the surrounding landscape. We also found a higher proportion of browning trends in North American peatlands than in Eurasian ones, in line with earlier reports of widespread browning in North American boreal forests, which may be influenced by drought, wildfire, and insect outbreaks (Winkler et al., 2021; Xu et al., 2013). Taken together, these patterns fit a broader picture of divergent boreal trajectories in Eurasia and North America, with continued warming in North America curbing long-term productivity gains (Muccio et al., 2025).
5.5 Protected status and LAI trends
In our analysis, ∼11 % of the studied pixels fell within protected areas. This accords with the global estimates, where only ∼17 % of peatlands are protected (11 % in the boreal region), substantially less than many other ecosystems (Austin et al., 2025). The protection status of peatlands did not significantly explain LAI trends. Importantly, a null association with LAI should not be construed as evidence that protection is ineffective; benefits may occur in attributes not captured by LAI (e.g., biodiversity), or at magnitudes below detectability, given the limited protected-area coverage. Moreover, legal designation alone may not buffer LAI-related dynamics because many protected areas are small and fragmented, exposed to edge effects and biological invasions, conservation actions can be uneven or ineffective, and climate change has often been overlooked in siting and management (Gatiso et al., 2022; Li et al., 2024; Ren et al., 2021). Taken together, our results may suggest that LAI trends in peatlands were more closely associated with climate exposure than with nominal protection status, underscoring the value of climate-aware management and planning (Cimatti et al., 2025).
Using a gap-filled, sensor-independent LAI climate data record, we quantified LAI-based greening and browning across peatland-dominated, unburned 500 m pixels north of 45° N between 2001 and 2023 and tested their associations with climatic, ecological, and protection-related factors. Greening was more frequent than browning at the pixel level: 77 % of the studied pixels had positive LAI trends, corresponding to a greening-to-browning ratio of 3.5:1. However, the map-scale LAI trend was not statistically different from zero after accounting for spatial autocorrelation. Thus, widespread local greening did not translate into a significant overall increase in LAI across the studied peatland-dominated, unburned pixels.
LAI change was associated with moisture conditions and canopy context rather than with temperature alone. LAI anomalies were weakly positively associated with air temperature and weakly negatively associated with precipitation, while multi-year mean annual precipitation, rather than air temperature, was retained in the model of long-term LAI trends. Greater tree cover was associated with less greening, but this association varied by continent, tree-cover type, and precipitation regime. Protection status did not explain LAI trends after accounting for climatic and canopy-related factors.
Most studied pixels followed a linear LAI trend over 2001–2023, with no detected breakpoint. Where non-linear trends occurred, their breakpoints often appeared soon after phase shifts in the Pacific Decadal Oscillation. Cup-shaped trends, where LAI first declined and then increased, were concentrated in West Siberia, whereas hat-shaped trends, where LAI first increased and then declined, were widespread across Europe, northeastern Asia, and Canada. Overall, northern peatland LAI change was spatially and temporally heterogeneous rather than a uniform greening response between 2001 and 2023.
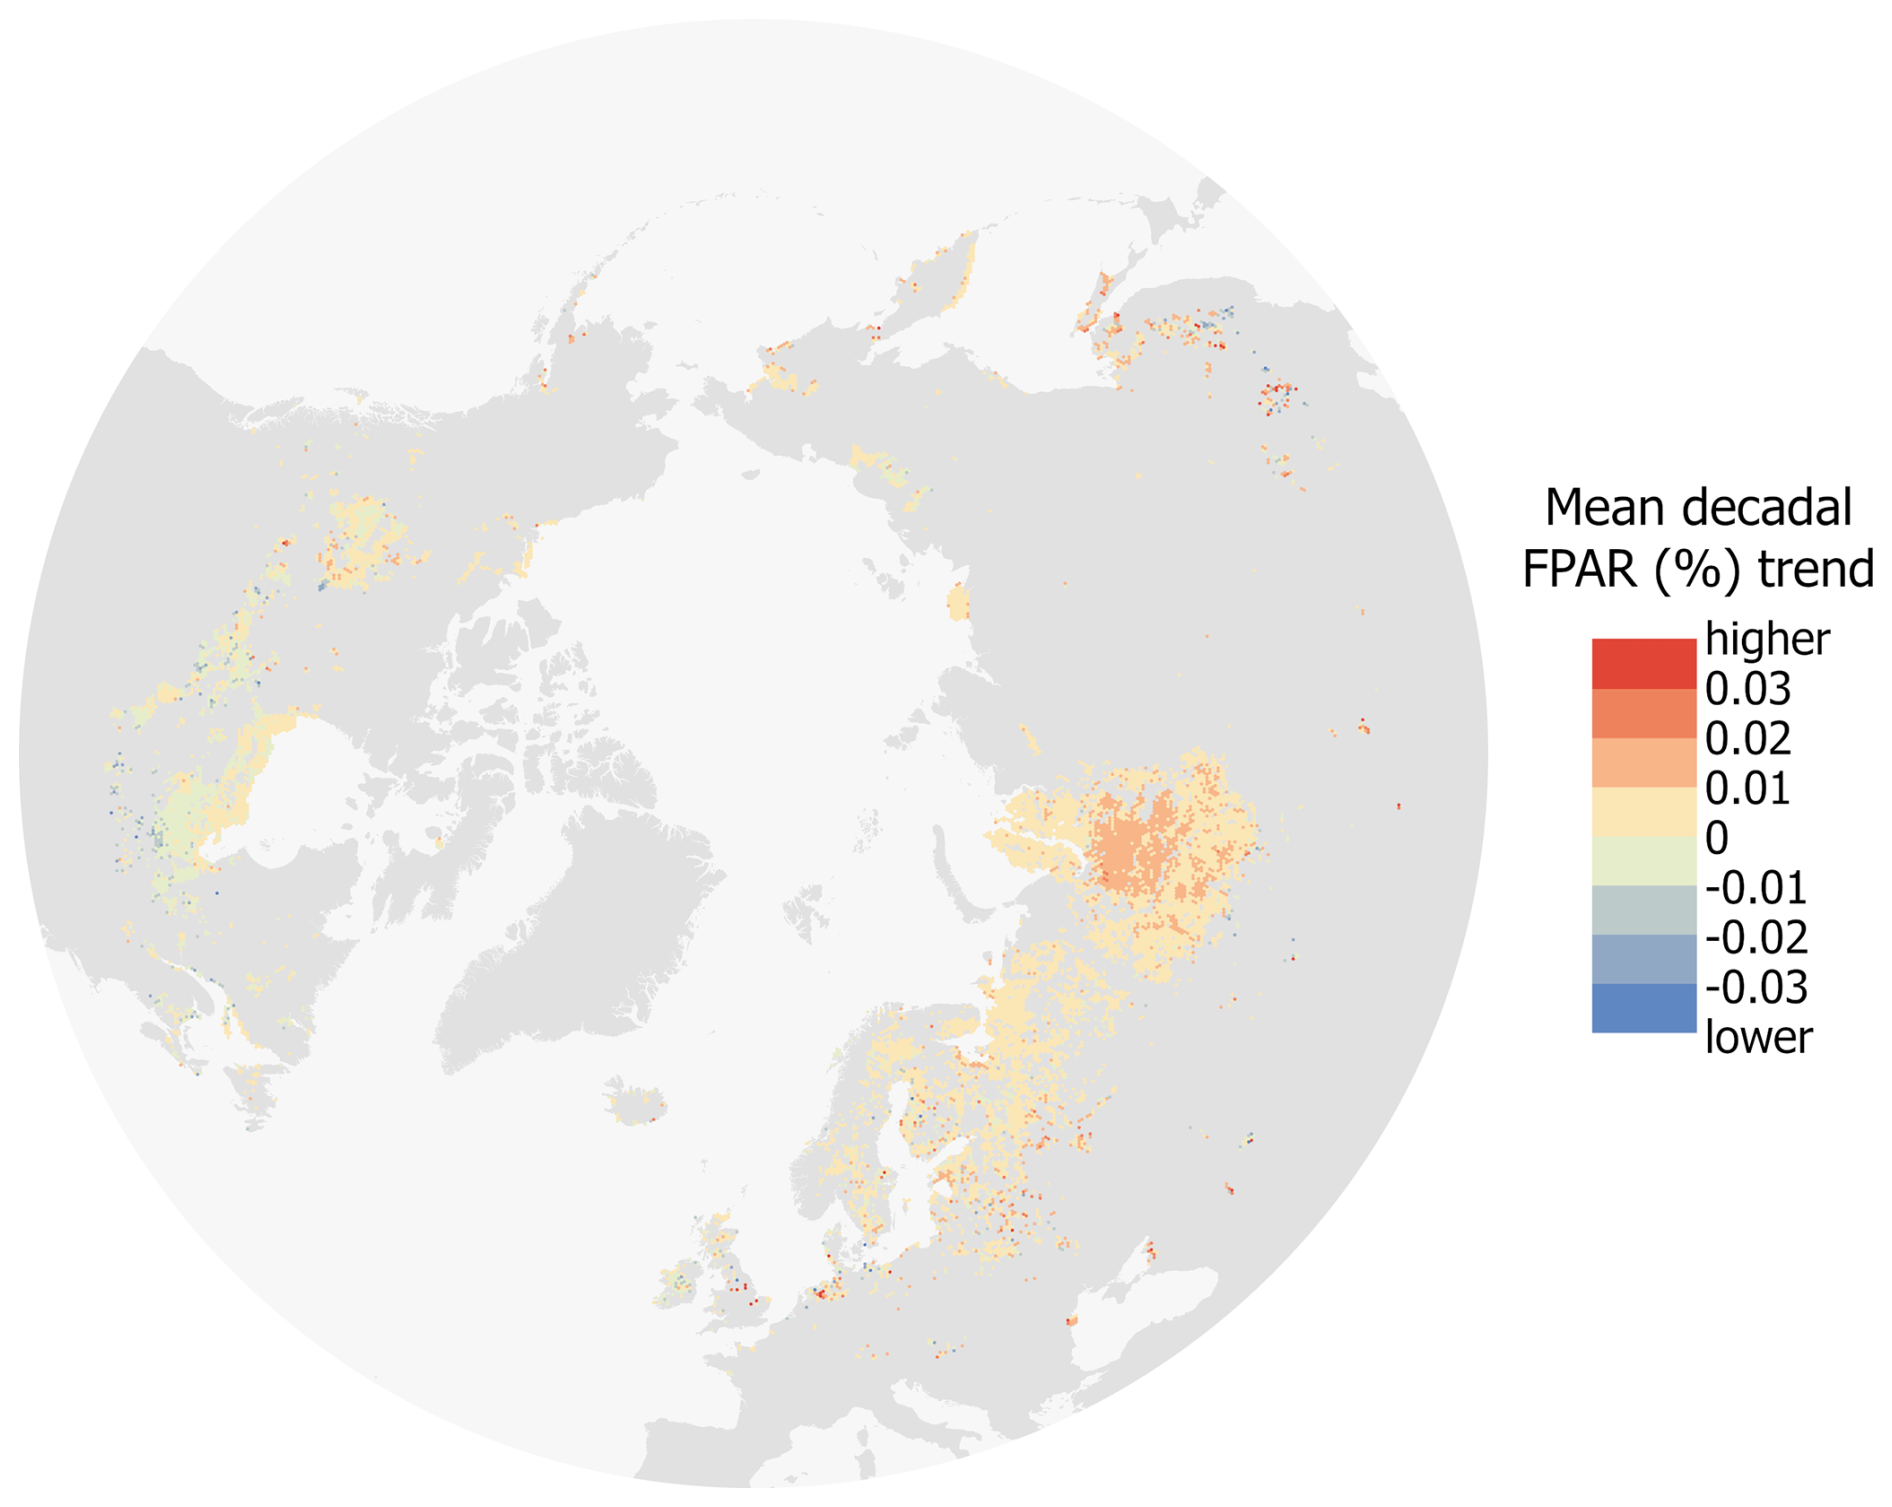
Figure A1Spatial patterns of the mean decadal FPAR trend, where warmer colours indicate stronger greening and cooler colours indicate browning.
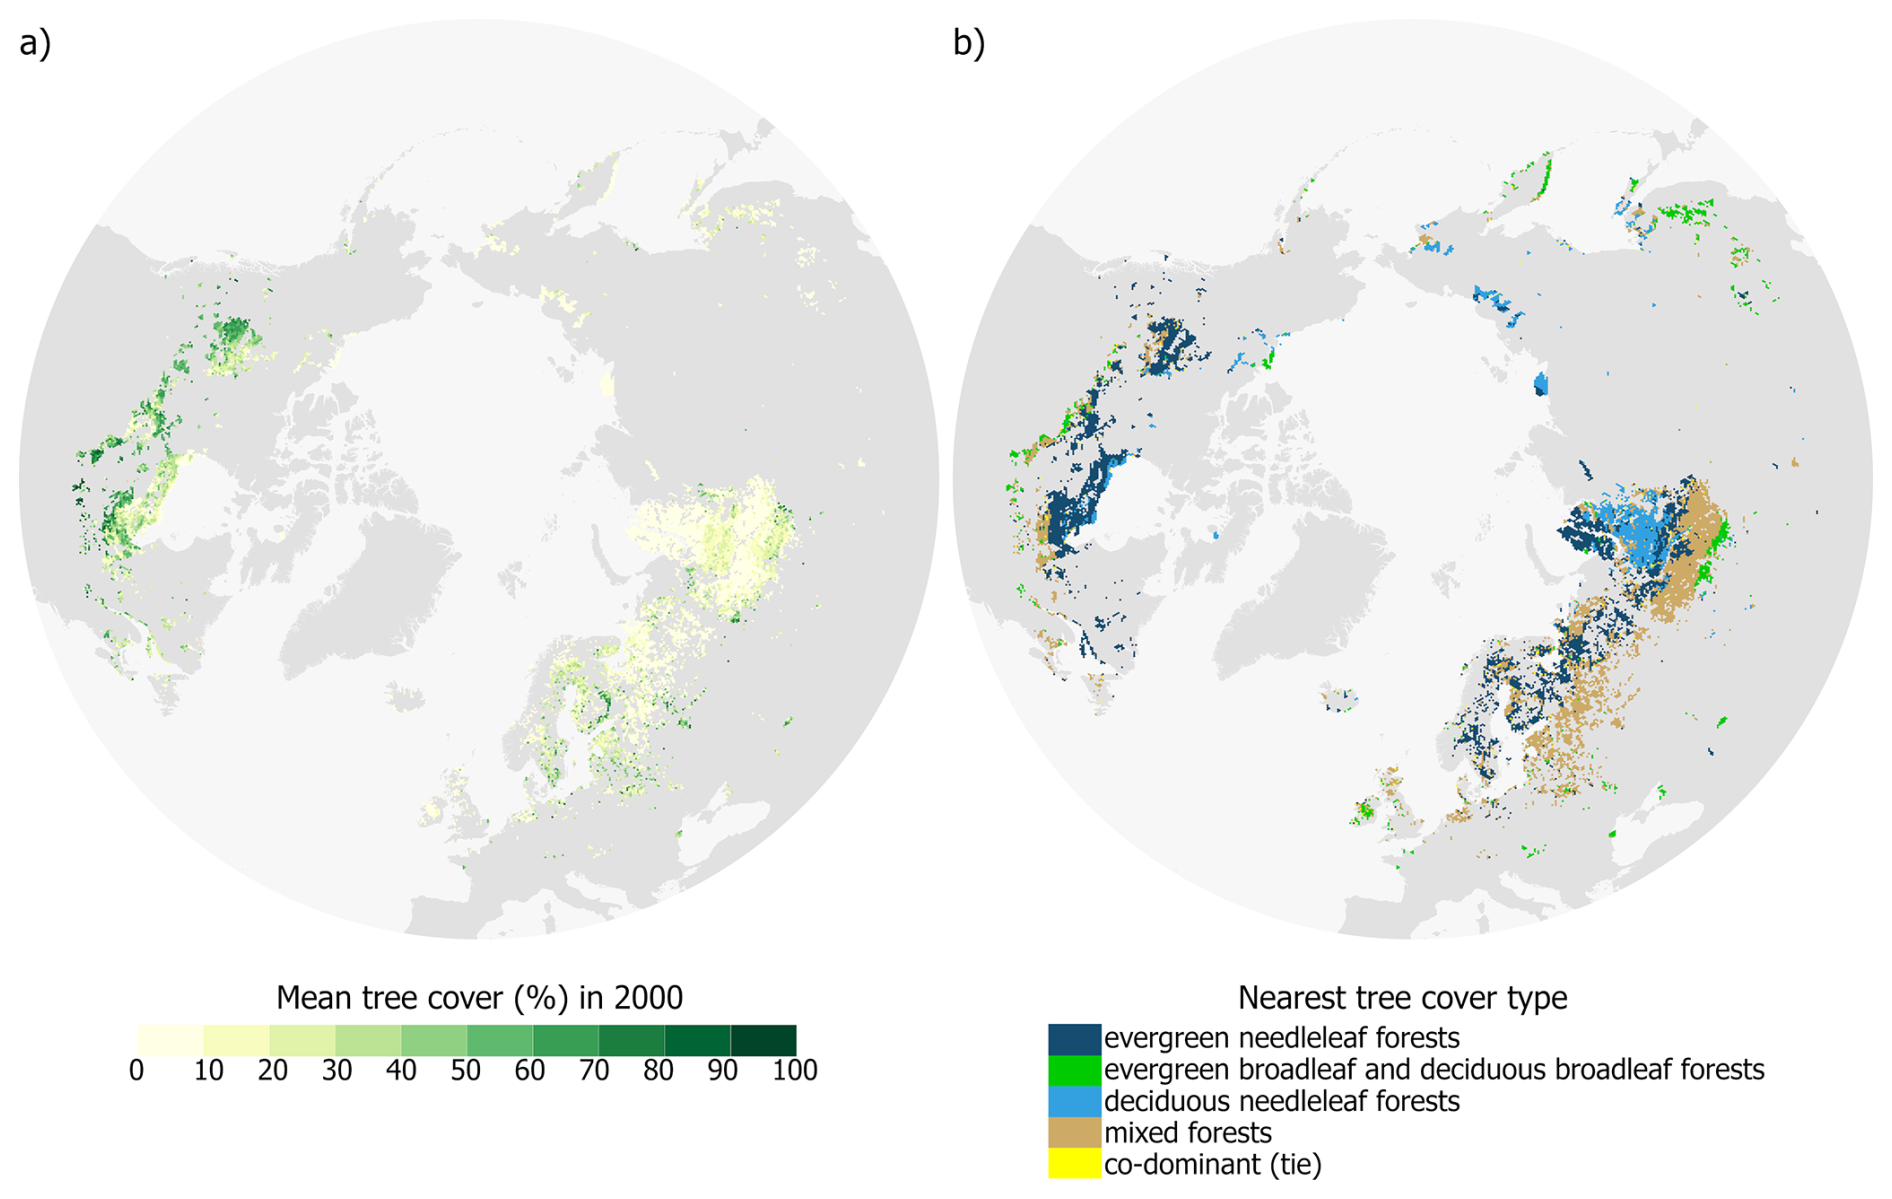
Figure A2Mean tree cover in 2000 (a) and the nearest type of tree cover (b) in the studied northern peatlands.
Table A1Summary of the pooled cross-partition generalised least squares coefficients for the best-fitted model. reported on original MODIS 8 d units (m2 m−2 per 8 d composite). Model fit pooled over 829 disjoint 1500-pixel partitions (exponential covariance; pooled nugget) was , pooled , rSSE = 0.020, rSSR = 0.003. Baselines were evergreen needleleaf (Tree type) and Asia (Continent). The primary slope with respect to tree cover (per +1 % cover) was negative (; SE 4.231 × 10⁻⁸; ). Two interactions dominated modulation of this slope: (i) North America × Tree cover was strongly negative (; SE 1.715 × 10⁻⁸; ), indicating steeper declines than in Asia; (ii) Tree cover × Multi-year mean annual precipitation was positive ( in the tree-cover slope per 1 mm yr−1 increase in mean annual precipitation; SE 1.676 × 10⁻⁹; ), meaning wetter conditions mitigate the negative tree-cover effect ( in the tree-cover slope for each +100 mm−1 yr−1 increase in mean annual precipitation. Canopy composition also matters: Tree cover × Tree type 3 (deciduous needleleaf forests) attenuated the decline (; SE 2.010 × 10⁻⁸; ), while Tree cover × Tree type classes 2 and 4 (evergreen broadleaf and deciduous broadleaf forests) and Tree cover × Tree type 5 (mixed forests) were modest and borderline (, p=0.0526; , p=0.050).
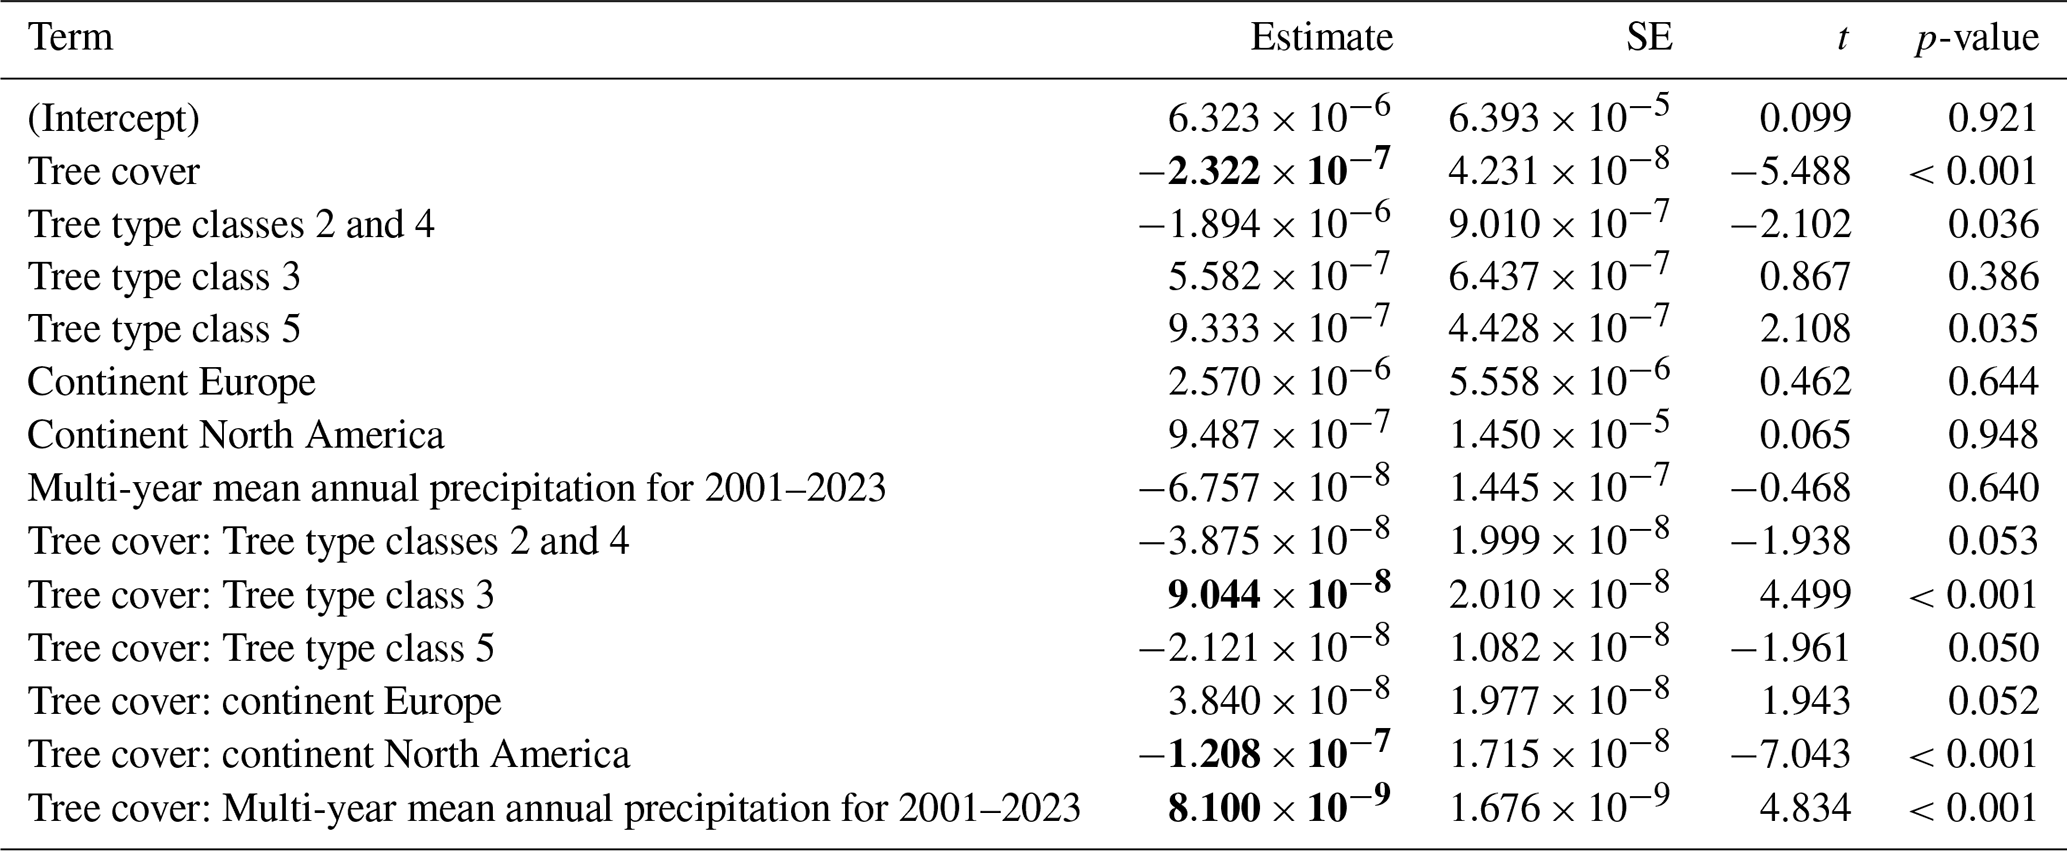
Table A2Summary of the pooled cross-partition generalised least squares coefficients for the intercept-only map-level trend model. LAItrend8d∼1 reported on original MODIS 8 d units (m2 m−2 per 8 d composite). The pooled intercept represents the grand mean trend across all pixels. The estimate is indistinguishable from zero, indicating no detectable map-level LAI trend once spatial autocorrelation is accounted for.

The LAI/FPAR climate data record is openly available at https://doi.org/10.5281/zenodo.8076540 (Pu et al., 2023).
Iuliia Burdun: Conceptualization, Methodology, Software, Validation, Formal analysis, Data curation, Writing – original draft, Visualization. Jiabin Pu: Writing – review and editing, Data curation. Ranga B. Myneni: Writing – review and editing, Data curation. Miina Rautiainen: Conceptualization, Methodology, Resources, Data curation, Writing – review and editing, Supervision, Project administration, Funding acquisition.
The contact author has declared that none of the authors has any competing interests.
Publisher's note: Copernicus Publications remains neutral with regard to jurisdictional claims made in the text, published maps, institutional affiliations, or any other geographical representation in this paper. The authors bear the ultimate responsibility for providing appropriate place names. Views expressed in the text are those of the authors and do not necessarily reflect the views of the publisher.
We gratefully acknowledge the CSC—IT Center for Science, Finland, for providing computational resources through the Puhti supercomputer. Iuliia Burdun acknowledges the use of ChatGPT (OpenAI) for improving the flow of the manuscript text.
The study was mainly funded by the Research Council of Finland (grant nos. PEATSPEC 3341963/Miina Rautiainen and Iuliia Burdun and PeatResC 374133/Miina Rautiainen). Iuliia Burdun acknowledged FWO, which has co-financed the underlying research, Junior Postdoctoral Fellowship (grant no. 12A5O24N).
This paper was edited by Anne Klosterhalfen and reviewed by two anonymous referees.
Austin, K. G., Elsen, P. R., Coronado, E. N. H., DeGemmis, A., Gallego-Sala, A. V., Harris, L., Kretser, H. E., Melton, J. R., Murdiyarso, D., Sasmito, S. D., Swails, E., Wijaya, A., Winton, R. S., and Zarin, D.: Mismatch Between Global Importance of Peatlands and the Extent of Their Protection, Conserv. Lett., 18, e13080, https://doi.org/10.1111/CONL.13080, 2025.
Backéus, I., Gunnarsson, U., and Strömquist, L.: Bog vegetation re-mapped after 63 and 103 years: expansion of Rhynchospora alba (Studies on Skagershultsmossen 2), Mires Peat, 29, https://doi.org/10.19189/MaP.2022.OMB.Sc.2004364, 2023.
Bansal, S., van der Burg, M. P., Fern, R. R., Jones, J. W., Lo, R., McKenna, O. P., Tangen, B. A., Zhang, Z., and Gleason, R. A.: Large increases in methane emissions expected from North America's largest wetland complex, Sci. Adv., 9, https://doi.org/10.1126/sciadv.ade1112, 2023.
Barichivich, J., Briffa, K. R., Myneni, R. B., Osborn, T. J., Melvin, T. M., Ciais, P., Piao, S., and Tucker, C.: Large-scale variations in the vegetation growing season and annual cycle of atmospheric CO2 at high northern latitudes from 1950 to 2011, Glob. Change Biol., 19, 3167–3183, https://doi.org/10.1111/GCB.12283, 2013.
Bastos, A., Ciais, P., Park, T., Zscheischler, J., Yue, C., Barichivich, J., Myneni, R. B., Peng, S., Piao, S., and Zhu, Z.: Was the extreme Northern Hemisphere greening in 2015 predictable?, Environ. Res. Lett., 12, 044016, https://doi.org/10.1088/1748-9326/AA67B5, 2017.
Bechtold, M., De Lannoy, G., Koster, R. D., Reichle, R. H., Mahanama, S., Bleuten, W., Bourgault, M. A., Brümmer, C., Burdun, I., Desai, A. R., Devito, K., Grünwald, T., Grygoruk, M., Humphreys, E. R., Klatt, J., Kurbatova, J., Lohila, A., Munir, T. M., Nilsson, M. B., Price, J. S., Röhl, M., Schneider, A., and Tiemeyer, B.: PEAT-CLSM: A Specific Treatment of Peatland Hydrology in the NASA Catchment Land Surface Model, J. Adv. Model. Earth Syst., 11, 1–33, https://doi.org/10.1029/2018MS001574, 2019.
Beck, H. E., Zimmermann, N. E., McVicar, T. R., Vergopolan, N., Berg, A., and Wood, E. F.: Present and future Köppen-Geiger climate classification maps at 1-km resolution, Sci. Data, 5, 1–12, https://doi.org/10.1038/sdata.2018.214, 2018.
Berner, L. T., Massey, R., Jantz, P., Forbes, B. C., Macias-Fauria, M., Myers-Smith, I., Kumpula, T., Gauthier, G., Andreu-Hayles, L., Gaglioti, B. V., Burns, P., Zetterberg, P., D'Arrigo, R., and Goetz, S. J.: Summer warming explains widespread but not uniform greening in the Arctic tundra biome, Nat. Commun., 11, 1–12, https://doi.org/10.1038/s41467-020-18479-5, 2020.
Bragazza, L., Parisod, J., Buttler, A., and Bardgett, R. D.: Biogeochemical plant–soil microbe feedback in response to climate warming in peatlands, Nat. Clim. Change, 3, 273–277, https://doi.org/10.1038/nclimate1781, 2013.
Bu, Z., Hans, J., Li, H., Zhao, G., Zheng, X., Ma, J., and Zeng, J.: The response of peatlands to climate warming: A review, Acta Ecologica Sinica, 31, 157–162, https://doi.org/10.1016/J.CHNAES.2011.03.006, 2011.
Cai, W., Zhu, Z., Harrison, S. P., Ryu, Y., Wang, H., Zhou, B., and Prentice, I. C.: A unifying principle for global greenness patterns and trends, Communications Earth & Environment, 6, 1–11, https://doi.org/10.1038/s43247-025-01992-0, 2025.
Campbell, C., Granath, G., and Rydin, H.: Climatic drivers of Sphagnum species distributions, Front. Biogeogr., 13, https://doi.org/10.21425/F5FBG51146, 2021.
Camps-Valls, G., Campos-Taberner, M., Moreno-Martínez, Á., Walther, S., Duveiller, G., Cescatti, A., Mahecha, M. D., Muñoz-Marí, J., García-Haro, F. J., Guanter, L., Jung, M., Gamon, J. A., Reichstein, M., and Running, S. W.: A unified vegetation index for quantifying the terrestrial biosphere, Sci. Adv., 7, https://doi.org/10.1126/sciadv.abc7447, 2021.
Carpino, O., Haynes, K., Connon, R., Craig, J., Devoie, É., and Quinton, W.: Long-term climate-influenced land cover change in discontinuous permafrost peatland complexes, Hydrol. Earth Syst. Sci., 25, 3301–3317, https://doi.org/10.5194/hess-25-3301-2021, 2021.
Chen, J. M. and Black, T. A.: Defining leaf area index for non-flat leaves, Plant Cell Environ., 15, 421–429, https://doi.org/10.1111/J.1365-3040.1992.TB00992.X, 1992.
Chen, L., Brun, P., Buri, P., Fatichi, S., Gessler, A., McCarthy, M. J., Pellicciotti, F., Stocker, B., and Karger, D. N.: Global increase in the occurrence and impact of multiyear droughts, Science (1979), 387, 278–284, https://doi.org/10.1126/science.ado4245, 2025.
Chen, Y., Cheng, X., Liu, A., Chen, Q., and Wang, C.: Tracking lake drainage events and drained lake basin vegetation dynamics across the Arctic, Nat. Commun, 14, 1–18, https://doi.org/10.1038/s41467-023-43207-0, 2023.
Chiu, G., Lockhart, R., and Routledge, R.: Bent-Cable Regression Theory and Applications, J. Am. Stat. Assoc., 101, 542–553, https://doi.org/10.1198/016214505000001177, 2006.
Cimatti, M., Mezzanotte, V., Heikkinen, R. K., Hällfors, M. H., Karger, D. N., and Di Marco, M.: The Accelerating Exposure of European Protected Areas to Climate Change, Glob. Change Biol., 31, e70261, https://doi.org/10.1111/GCB.70261, 2025.
Cleveland, R. B., Cleveland, W. S., McRae, J. E., and Terpenning, I.: STL: A Seasonal-Trend Decomposition Procedure Based on Loess, https://www.scb.se/contentassets/ca21efb41fee47d293bbee5bf7be7fb3/stl-a-seasonal-trend-decomposition-procedure-based-on-loess.pdf (last access: 24 September 2026), 1990.
de Jong, R., Verbesselt, J., Schaepman, M. E., and de Bruin, S.: Trend changes in global greening and browning: Contribution of short-term trends to longer-term change, Glob. Change Biol., 18, 642–655, https://doi.org/10.1111/j.1365-2486.2011.02578.x, 2012.
Dearborn, K. D. and Baltzer, J. L.: Unexpected greening in a boreal permafrost peatland undergoing forest loss is partially attributable to tree species turnover, Glob. Change Biol., 27, 2867–2882, https://doi.org/10.1111/GCB.15608, 2021.
Dearborn, K. D., Wallace, C. A., Patankar, R., and Baltzer, J. L.: Permafrost thaw in boreal peatlands is rapidly altering forest community composition, J. Ecol., 109, 1452–1467, https://doi.org/10.1111/1365-2745.13569, 2021.
Elmendorf, S. C., Henry, G. H. R., Hollister, R. D., Björk, R. G., Boulanger-Lapointe, N., Cooper, E. J., Cornelissen, J. H. C., Day, T. A., Dorrepaal, E., Elumeeva, T. G., Gill, M., Gould, W. A., Harte, J., Hik, D. S., Hofgaard, A., Johnson, D. R., Johnstone, J. F., Jónsdóttir, I. S., Jorgenson, J. C., Klanderud, K., Klein, J. A., Koh, S., Kudo, G., Lara, M., Lévesque, E., Magnússon, B., May, J. L., Mercado-Díaz, J. A., Michelsen, A., Molau, U., Myers-Smith, I. H., Oberbauer, S. F., Onipchenko, V. G., Rixen, C., Martin Schmidt, N., Shaver, G. R., Spasojevic, M. J., Pórhallsdóttir, P. E., Tolvanen, A., Troxler, T., Tweedie, C. E., Villareal, S., Wahren, C. H., Walker, X., Webber, P. J., Welker, J. M., and Wipf, S.: Plot-scale evidence of tundra vegetation change and links to recent summer warming, Nat. Clim. Change, 2, 453–457, https://doi.org/10.1038/nclimate1465, 2012.
Fick, S. E. and Hijmans, R. J.: WorldClim 2: new 1-km spatial resolution climate surfaces for global land areas, Int. J. Climatol., 37, 4302–4315, https://doi.org/10.1002/JOC.5086, 2017.
Fluet-Chouinard, E., Stocker, B. D., Zhang, Z., Malhotra, A., Melton, J. R., Poulter, B., Kaplan, J. O., Goldewijk, K. K., Siebert, S., Minayeva, T., Hugelius, G., Joosten, H., Barthelmes, A., Prigent, C., Aires, F., Hoyt, A. M., Davidson, N., Finlayson, C. M., Lehner, B., Jackson, R. B., and McIntyre, P. B.: Extensive global wetland loss over the past three centuries, Nature, 614, 281–286, https://doi.org/10.1038/s41586-022-05572-6, 2023.
Forzieri, G., Alkama, R., Miralles, D. G., and Cescatti, A.: Satellites reveal contrasting responses of regional climate to the widespread greening of Earth, Science (1979), 356, 1180–1184, https://doi.org/10.1126/science.aal1727, 2017.
Gałka, M., Diaconu, A. C., Cwanek, A., Hedenäs, L., Knorr, K. H., Kołaczek, P., Łokas, E., Obremska, M., Swindles, G. T., and Feurdean, A.: Climate-induced hydrological fluctuations shape Arctic Alaskan peatland plant communities, Sci. Total Environ., 905, 167381, https://doi.org/10.1016/J.SCITOTENV.2023.167381, 2023.
Gatiso, T. T., Kulik, L., Bachmann, M., Bonn, A., Bösch, L., Eirdosh, D., Freytag, A., Hanisch, S., Heurich, M., Sop, T., Wesche, K., Winter, M., and Kühl, H. S.: Effectiveness of protected areas influenced by socio-economic context, Nat. Sustain., 5, 861–868, https://doi.org/10.1038/s41893-022-00932-6, 2022.
Global Peatlands Initiative and United Nations Environment Programme: Greifswald Mire Centre: Global Peatland Map 2.0, underlying dataset of the UNEP Global Peatlands Assessment, https://greifswaldmoor.de/global-peatland-database-en.html (last access: 28 April 2026), 2022.
Gonsamo, A., Chen, J. M., and Lombardozzi, D.: Global vegetation productivity response to climatic oscillations during the satellite era, Glob. Change Biol., 22, 3414–3426, https://doi.org/10.1111/GCB.13258, 2016.
Guo, Z., Sun, C., Fu, Y., Liu, Y., Wei, T., and Lou, W.: Different trends of vegetation activity over northern extratropics during two multidecadal warming periods in the 20th century, Glob. Planet. Change, 227, 104181, https://doi.org/10.1016/J.GLOPLACHA.2023.104181, 2023.
Hansen, M. C., Potapov, P. V., Moore, R., Hancher, M., Turubanova, S. A., Tyukavina, A., Thau, D., Stehman, S. V., Goetz, S. J., Loveland, T. R., Kommareddy, A., Egorov, A., Chini, L., Justice, C. O., and Townshend, J. R. G.: High-resolution global maps of 21st-century forest cover change, Science (1979), 342, 850–853, https://doi.org/10.1126/science.1244693, 2013.
Hersbach, H., Bell, B., Berrisford, P., Hirahara, S., Horányi, A., Muñoz-Sabater, J., Nicolas, J., Peubey, C., Radu, R., Schepers, D., Simmons, A., Soci, C., Abdalla, S., Abellan, X., Balsamo, G., Bechtold, P., Biavati, G., Bidlot, J., Bonavita, M., De Chiara, G., Dahlgren, P., Dee, D., Diamantakis, M., Dragani, R., Flemming, J., Forbes, R., Fuentes, M., Geer, A., Haimberger, L., Healy, S., Hogan, R. J., Hólm, E., Janisková, M., Keeley, S., Laloyaux, P., Lopez, P., Lupu, C., Radnoti, G., de Rosnay, P., Rozum, I., Vamborg, F., Villaume, S., and Thépaut, J. N.: The ERA5 global reanalysis, Q. J. Roy. Meteor. Soc., 146, https://doi.org/10.1002/qj.3803, 2020.
Higgins, S. I., Conradi, T., and Muhoko, E.: Shifts in vegetation activity of terrestrial ecosystems attributable to climate trends, Nat. Geosci., 16, 147–153, https://doi.org/10.1038/s41561-022-01114-x, 2023.
Hu, S., Niu, Z., Chen, Y., Li, L., and Zhang, H.: Global wetlands: Potential distribution, wetland loss, and status, Sci. Total Environ., 586, 319–327, https://doi.org/10.1016/J.SCITOTENV.2017.02.001, 2017.
Hugelius, G., Loisel, J., Chadburn, S., Jackson, R. B., Jones, M., MacDonald, G., Marushchak, M., Olefeldt, D., Packalen, M., Siewert, M. B., Treat, C., Turetsky, M., Voigt, C., and Yu, Z.: Large stocks of peatland carbon and nitrogen are vulnerable to permafrost thaw, P. Natl. Acad. Sci. USA, 117, 20438–20446, https://doi.org/10.1073/pnas.1916387117, 2020.
Ives, A. R., Zhu, L., Wang, F., Zhu, J., Morrow, C. J., and Radeloff, V. C.: Statistical inference for trends in spatiotemporal data, Remote Sens. Environ., 266, 112678, https://doi.org/10.1016/J.RSE.2021.112678, 2021.
Keane, B., Alderson, D. M., Clay, G. D., Evans, M. G., Field, C. D., Johnston, A., Limpens, J., McCarter, C. P. R., Overtoom, N., Ritson, J. P., Robroek, B. J. M., Rochefort, L., Shuttleworth, E. L., Telgenkamp, Y., Turetsky, M. R., and Waddington, J. M.: The effects of drought on Sphagnum moss species and the implications for hydrology in peatlands, New Phytol., 247, 2003–2021, https://doi.org/10.1111/NPH.70361, 2025.
Kettridge, N., Turetsky, M. R., Sherwood, J. H., Thompson, D. K., Miller, C. A., Benscoter, B. W., Flannigan, M. D., Wotton, B. M., and Waddington, J. M.: Moderate drop in water table increases peatland vulnerability to post-fire regime shift, Sci. Rep., 5, 8063, https://doi.org/10.1038/srep08063, 2015.
Kim, S.: ppcor: An R Package for a Fast Calculation to Semi-partial Correlation Coefficients, Commun. Stat. Appl. Methods, 22, 665–674, https://doi.org/10.5351/CSAM.2015.22.6.665, 2015.
Kirpotin, S. N., Berezin, A., Bazanov, V., Polishchuk, Y., Vorobiov, S., Mironycheva-Tokoreva, N., Kosykh, N., Volkova, I., Dupre, B., Pokrovsky, O., Kouraev, A., Zakharova, E., Shirokova, L., Mognard, N., Biancamaria, S., Viers, J., and Kolmakova, M.: Western Siberia wetlands as indicator and regulator of climate change on the global scale, Int. J. Environ. Stud., 66, 409–421, https://doi.org/10.1080/00207230902753056, 2009.
Kolari, T. H. M., Korpelainen, P., Kumpula, T., and Tahvanainen, T.: Accelerated vegetation succession but no hydrological change in a boreal fen during 20 years of recent climate change, Ecol. Evol., 11, 7602–7621, https://doi.org/10.1002/ECE3.7592, 2021.
Lara, M. J., Nitze, I., Grosse, G., Martin, P., and McGuire, A. D.: Reduced arctic tundra productivity linked with landform and climate change interactions, Sci. Rep., 8, 1–10, https://doi.org/10.1038/s41598-018-20692-8, 2018.
Li, G., Fang, C., Watson, J. E. M., Sun, S., Qi, W., Wang, Z., and Liu, J.: Mixed effectiveness of global protected areas in resisting habitat loss, Nat. Commun., 15, 1–17, https://doi.org/10.1038/s41467-024-52693-9, 2024.
Lian, X., Piao, S., Li, L. Z. X., Li, Y., Huntingford, C., Ciais, P., Cescatti, A., Janssens, I. A., Peñuelas, J., Buermann, W., Chen, A., Li, X., Myneni, R. B., Wang, X., Wang, Y., Yang, Y., Zeng, Z., Zhang, Y., and McVicar, T. R.: Summer soil drying exacerbated by earlier spring greening of northern vegetation, Sci. Adv., 6, https://doi.org/10.1126/sciadv.aax0255, 2020.
Liu, X., Chen, Y., Li, Z., and Li, Y.: Greening in the middle and high latitudes in the Northern Hemisphere is determined by changes in the growth rate of natural vegetation during the growing season, Ecol. Indic., 155, 111025, https://doi.org/10.1016/J.ECOLIND.2023.111025, 2023.
Loranty, M. M., Davydov, S. P., Kropp, H., Alexander, H. D., Mack, M. C., Natali, S. M., and Zimov, N. S.: Vegetation Indices Do Not Capture Forest Cover Variation in Upland Siberian Larch Forests, Remote Sens., 10, https://doi.org/10.3390/RS10111686, 2018.
Ma, X. Y., Xu, H., Cao, Z. Y., Shu, L., and Zhu, R. L.: Will climate change cause the global peatland to expand or contract? Evidence from the habitat shift pattern of Sphagnum mosses, Glob. Change Biol., 28, 6419–6432, https://doi.org/10.1111/GCB.16354, 2022.
MacIas-Fauria, M., Forbes, B. C., Zetterberg, P., and Kumpula, T.: Eurasian Arctic greening reveals teleconnections and the potential for structurally novel ecosystems, Nat. Clim. Chang., 2, 613–618, https://doi.org/10.1038/nclimate1558, 2012.
MacLean, D. A.: Impacts of insect outbreaks on tree mortality, productivity, and stand development, Can. Entomol., 148, S138–S159, https://doi.org/10.4039/TCE.2015.24, 2016.
Massicotte, P. and South, A.: rnaturalearth: World Map Data from Natural Earth, https://cran.r-project.org/web/packages/rnaturalearth/index.html (last access: 1 August 2025), 2024.
Merchant, C. J., Paul, F., Popp, T., Ablain, M., Bontemps, S., Defourny, P., Hollmann, R., Lavergne, T., Laeng, A., de Leeuw, G., Mittaz, J., Poulsen, C., Povey, A. C., Reuter, M., Sathyendranath, S., Sandven, S., Sofieva, V. F., and Wagner, W.: Uncertainty information in climate data records from Earth observation, Earth Syst. Sci. Data, 9, 511–527, https://doi.org/10.5194/essd-9-511-2017, 2017.
Miles, V. V and Esau, I.: Spatial heterogeneity of greening and browning between and within bioclimatic zones in northern West Siberia, Environ. Res. Lett., 11, 115002, https://doi.org/10.1088/1748-9326/11/11/115002, 2016.
Montesano, P. M., Frost, M., Li, J., Carroll, M., Neigh, C. S. R., Macander, M. J., Sexton, J. O., and Frost, G. V.: A shift in transitional forests of the North American boreal will persist through 2100, Commun. Earth Environ., 5, 1–10, https://doi.org/10.1038/s43247-024-01454-z, 2024.
Morrow, C. J. and Ives, A. R.: remotePARTS: Spatiotemporal autoregression analyses for large data sets, J. Open Source Softw., 10, 7937, https://doi.org/10.21105/JOSS.07937, 2025.
Muccio, D., Keppel-Aleks, G., and Parazoo, N.: Contrasting Temperature Sensitivity of Boreal Forest Productivity in North America and Eurasia, J. Geophys. Res.-Biogeo., 130, e2024JG008634, https://doi.org/10.1029/2024JG008634, 2025.
Myers-Smith, I. H., Forbes, B. C., Wilmking, M., Hallinger, M., Lantz, T., Blok, D., Tape, K. D., MacIas-Fauria, M., Sass-Klaassen, U., Lévesque, E., Boudreau, S., Ropars, P., Hermanutz, L., Trant, A., Collier, L. S., Weijers, S., Rozema, J., Rayback, S. A., Schmidt, N. M., Schaepman-Strub, G., Wipf, S., Rixen, C., Ménard, C. B., Venn, S., Goetz, S., Andreu-Hayles, L., Elmendorf, S., Ravolainen, V., Welker, J., Grogan, P., Epstein, H. E., and Hik, D. S.: Shrub expansion in tundra ecosystems: dynamics, impacts and research priorities, Environ. Res. Lett., 6, 045509, https://doi.org/10.1088/1748-9326/6/4/045509, 2011.
Myers-Smith, I. H., Kerby, J. T., Phoenix, G. K., Bjerke, J. W., Epstein, H. E., Assmann, J. J., John, C., Andreu-Hayles, L., Angers-Blondin, S., Beck, P. S. A., Berner, L. T., Bhatt, U. S., Bjorkman, A. D., Blok, D., Bryn, A., Christiansen, C. T., Cornelissen, J. H. C., Cunliffe, A. M., Elmendorf, S. C., Forbes, B. C., Goetz, S. J., Hollister, R. D., de Jong, R., Loranty, M. M., Macias-Fauria, M., Maseyk, K., Normand, S., Olofsson, J., Parker, T. C., Parmentier, F. J. W., Post, E., Schaepman-Strub, G., Stordal, F., Sullivan, P. F., Thomas, H. J. D., Tømmervik, H., Treharne, R., Tweedie, C. E., Walker, D. A., Wilmking, M., and Wipf, S.: Complexity revealed in the greening of the Arctic, Nat. Clim. Change, 10, 106–117, https://doi.org/10.1038/s41558-019-0688-1, 2020.
Myneni, R. B., Keeling, C. D., Tucker, C. J., Asrar, G., and Nemani, R. R.: Increased plant growth in the northern high latitudes from 1981 to 1991, Nature, 386, 698–702, https://doi.org/10.1038/386698a0, 1997.
National Centers for Environmental Information (NCEI): Pacific Decadal Oscillation (PDO), https://www.ncei.noaa.gov/access/monitoring/pdo/ (last access: 11 August 2025), 2025.
Oke, T. A. and Hager, H. A.: Assessing environmental attributes and effects of climate change on Sphagnum peatland distributions in North America using single- and multi-species models, PLoS One, 12, e0175978, https://doi.org/10.1371/JOURNAL.PONE.0175978, 2017.
Oke, T. A. and Hager, H. A.: Plant community dynamics and carbon sequestration in Sphagnum-dominated peatlands in the era of global change, Global Ecol. Biogeogr., 29, 1610–1620, https://doi.org/10.1111/GEB.13152, 2020.
OpenStreetMap contributors: OpenStreetMap, https://www.openstreetmap.org/copyright (last access: 11 August 2025), 2024.
Pan, N., Feng, X., Fu, B., Wang, S., Ji, F., and Pan, S.: Increasing global vegetation browning hidden in overall vegetation greening: Insights from time-varying trends, Remote Sens. Environ., 214, 59–72, https://doi.org/10.1016/J.RSE.2018.05.018, 2018.
Park, H., Jeong, S., and Peñuelas, J.: Accelerated rate of vegetation green-up related to warming at northern high latitudes, Glob. Change Biol., 26, 6190–6202, https://doi.org/10.1111/GCB.15322, 2020.
Piao, S., Wang, X., Park, T., Chen, C., Lian, X., He, Y., Bjerke, J. W., Chen, A., Ciais, P., Tømmervik, H., Nemani, R. R., and Myneni, R. B.: Characteristics, drivers and feedbacks of global greening, Nature Reviews Earth & Environment, 1, 14–27, https://doi.org/10.1038/s43017-019-0001-x, 2019.
Ploton, P., Mortier, F., Réjou-Méchain, M., Barbier, N., Picard, N., Rossi, V., Dormann, C., Cornu, G., Viennois, G., Bayol, N., Lyapustin, A., Gourlet-Fleury, S., and Pélissier, R.: Spatial validation reveals poor predictive performance of large-scale ecological mapping models, Nat. Commun., 11, https://doi.org/10.1038/s41467-020-18321-y, 2020.
Pu, J., Roy, S., Knyazikhin, Y., and Myneni, R.: Sensor-Independent LAI/FPAR CDR, Zenodo [data set], https://doi.org/10.5281/zenodo.8076540, 2023.
Pu, J., Yan, K., Roy, S., Zhu, Z., Rautiainen, M., Knyazikhin, Y., and Myneni, R. B.: Sensor-independent LAI/FPAR CDR: reconstructing a global sensor-independent climate data record of MODIS and VIIRS LAI/FPAR from 2000 to 2022, Earth Syst. Sci. Data, 16, 15–34, https://doi.org/10.5194/essd-16-15-2024, 2024.
Qiu, C., Ciais, P., Zhu, D., Guenet, B., Chang, J., Chaudhary, N., Kleinen, T., Li, X. Y., Müller, J., Xi, Y., Zhang, W., Ballantyne, A., Brewer, S. C., Brovkin, V., Charman, D. J., Gustafson, A., Gallego-Sala, A. V., Gasser, T., Holden, J., Joos, F., Kwon, M. J., Lauerwald, R., Miller, P. A., Peng, S., Page, S., Smith, B., Stocker, B. D., Sannel, A. B. K., Salmon, E., Schurgers, G., Shurpali, N. J., Wårlind, D., and Westermann, S.: A strong mitigation scenario maintains climate neutrality of northern peatlands, One Earth, 5, 86–97, https://doi.org/10.1016/j.oneear.2021.12.008, 2022.
R Core Team: R: A Language and Environment for Statistical Computing, https://www.R-project.org/ (last access: 1 August 2025), 2022.
Rantanen, M., Kämäräinen, M., Luoto, M., and Aalto, J.: Manifold increase in the spatial extent of heatwaves in the terrestrial Arctic, Commun. Earth Environ., 5, 1–8, https://doi.org/10.1038/s43247-024-01750-8, 2024.
Rautiainen, M. and Lukeš, P.: Spectral contribution of understory to forest reflectance in a boreal site: an analysis of EO-1 Hyperion data, Remote Sens. Environ., 171, 98–104, https://doi.org/10.1016/J.RSE.2015.10.009, 2015.
Rautiainen, M., Suomalainen, J., Mõttus, M., Stenberg, P., Voipio, P., Peltoniemi, J., and Manninen, T.: Coupling forest canopy and understory reflectance in the Arctic latitudes of Finland, Remote Sens. Environ., 110, 332–343, https://doi.org/10.1016/J.RSE.2007.03.002, 2007.
Ren, J., Chen, J., Xu, C., van de Koppel, J., Thomsen, M. S., Qiu, S., Cheng, F., Song, W., Liu, Q. X., Xu, C., Bai, J., Zhang, Y., Cui, B., Bertness, M. D., Silliman, B. R., Li, B., and He, Q.: An invasive species erodes the performance of coastal wetland protected areas, Sci. Adv., 7, 8943–8956, https://doi.org/10.1126/sciadv.abi8943, 2021.
Sardans, J., Miralles, A., Tariq, A., Zeng, F., Wang, R., and Peñuelas, J.: Growing aridity poses threats to global land surface, Commun. Earth Environ., 5, 1–8, https://doi.org/10.1038/s43247-024-01935-1, 2024.
Scholten, R. C., Coumou, D., Luo, F., and Veraverbeke, S.: Early snowmelt and polar jet dynamics co-influence recent extreme Siberian fire seasons, Science (1979), 378, 1005–1009, https://doi.org/10.1126/SCIENCE.ABN4419, 2022.
Statisticat LLC: LaplacesDemon: Complete Environment for Bayesian Inference, CRAN (Comprehensive R Archive Network), https://doi.org/10.32614/CRAN.package.LaplacesDemon, 2021.
Sturm, M., Racine, C., and Tape, K.: Increasing shrub abundance in the Arctic, Nature, 411, 546–547, https://doi.org/10.1038/35079180, 2001.
Sulla-Menashe, D., Woodcock, C. E., and Friedl, M. A.: Canadian boreal forest greening and browning trends: an analysis of biogeographic patterns and the relative roles of disturbance versus climate drivers, Environ. Res. Lett., 13, 014007, https://doi.org/10.1088/1748-9326/AA9B88, 2018.
Swindles, G. T., Morris, P. J., Mullan, D. J., Payne, R. J., Roland, T. P., Amesbury, M. J., Lamentowicz, M., Turner, T. E., Gallego-Sala, A., Sim, T., Barr, I. D., Blaauw, M., Blundell, A., Chambers, F. M., Charman, D. J., Feurdean, A., Galloway, J. M., Gałka, M., Green, S. M., Kajukało, K., Karofeld, E., Korhola, A., Lamentowicz, Ł., Langdon, P., Marcisz, K., Mauquoy, D., Mazei, Y. A., McKeown, M. M., Mitchell, E. A. D., Novenko, E., Plunkett, G., Roe, H. M., Schoning, K., Sillasoo, Ü., Tsyganov, A. N., van der Linden, M., Väliranta, M., and Warner, B.: Widespread drying of European peatlands in recent centuries, Nat. Geosci., 12, 922–928, https://doi.org/10.1038/s41561-019-0462-z, 2019.
Sytiuk, A., Hamard, S., Céréghino, R., Dorrepaal, E., Geissel, H., Küttim, M., Lamentowicz, M., Tuittila, E. S., and Jassey, V. E. J.: Linkages between Sphagnum metabolites and peatland CO2 uptake are sensitive to seasonality in warming trends, New Phytol., 237, 1164–1178, https://doi.org/10.1111/NPH.18601, 2023.
The Global Climate Observing System: Leaf Area Index, https://gcos.wmo.int/site/global-climate-observing-system-gcos/essential-climate-variables/leaf-area-index (last access: 19 May 2026), 2026.
Turetsky, M. R., Weston, D. J., Cox, W. D., Petro, C., and Shaw, A. J.: The challenging but unique eco-evolutionary aspects of Sphagnum moss, New Phytol., 247, 1608–1621, https://doi.org/10.1111/NPH.70233, 2025.
United Nations Environment Programme: United Nations Environment Programme: Global Peatlands Assessment: The State of the World's Peatlands – Evidence for Action toward the Conservation, Restoration, and Sustainable Management of Peatlands, Nairobi, https://wedocs.unep.org/handle/20.500.11822/41222 (last access: 22 November 2022), 2022.
Väliranta, M., Salojärvi, N., Vuorsalo, A., Juutinen, S., Korhola, A., Luoto, M., and Tuittila, E. S.: Holocene fen–bog transitions, current status in Finland and future perspectives, Holocene, 27, 752–764, https://doi.org/10.1177/0959683616670471, 2017.
Virkkala, A. M., Rogers, B. M., Watts, J. D., Arndt, K. A., Potter, S., Wargowsky, I., Schuur, E. A. G., See, C. R., Mauritz, M., Boike, J., Bret-Harte, M. S., Burke, E. J., Burrell, A., Chae, N., Chatterjee, A., Chevallier, F., Christensen, T. R., Commane, R., Dolman, H., Edgar, C. W., Elberling, B., Emmerton, C. A., Euskirchen, E. S., Feng, L., Göckede, M., Grelle, A., Helbig, M., Holl, D., Järveoja, J., Karsanaev, S. V., Kobayashi, H., Kutzbach, L., Liu, J., Luijkx, I. T., López-Blanco, E., Lunneberg, K., Mammarella, I., Marushchak, M. E., Mastepanov, M., Matsuura, Y., Maximov, T. C., Merbold, L., Meyer, G., Nilsson, M. B., Niwa, Y., Oechel, W., Palmer, P. I., Park, S. J., Parmentier, F. J. W., Peichl, M., Peters, W., Petrov, R., Quinton, W., Rödenbeck, C., Sachs, T., Schulze, C., Sonnentag, O., St. Louis, V. L., Tuittila, E. S., Ueyama, M., Varlagin, A., Zona, D., and Natali, S. M.: Wildfires offset the increasing but spatially heterogeneous Arctic–boreal CO2 uptake, Nat. Clim. Change, 15, 188–195, https://doi.org/10.1038/s41558-024-02234-5, 2025.
Wang, J. A. and Friedl, M. A.: The role of land cover change in Arctic-Boreal greening and browning trends, Environ. Res. Lett., 14, 125007, https://doi.org/10.1088/1748-9326/AB5429, 2019.
Winkler, A. J., Myneni, R. B., Alexandrov, G. A., and Brovkin, V.: Earth system models underestimate carbon fixation by plants in the high latitudes, Nat. Commun., 10, 1–8, https://doi.org/10.1038/s41467-019-08633-z, 2019.
Winkler, A. J., Myneni, R. B., Hannart, A., Sitch, S., Haverd, V., Lombardozzi, D., Arora, V. K., Pongratz, J., Nabel, J. E. M. S., Goll, D. S., Kato, E., Tian, H., Arneth, A., Friedlingstein, P., Jain, A. K., Zaehle, S., and Brovkin, V.: Slowdown of the greening trend in natural vegetation with further rise in atmospheric CO2, Biogeosciences, 18, 4985–5010, https://doi.org/10.5194/bg-18-4985-2021, 2021.
Xu, J., Morris, P., Liu, J., and Holden, J.: PEATMAP: Refining estimates of global peatland distribution based on a meta-analysis, Catena (Amst), 160, 134–140, https://doi.org/10.1016/j.catena.2017.09.010, 2018.
Xu, L., Myneni, R. B., Chapin, F. S., Callaghan, T. V., Pinzon, J. E., Tucker, C. J., Zhu, Z., Bi, J., Ciais, P., Tømmervik, H., Euskirchen, E. S., Forbes, B. C., Piao, S. L., Anderson, B. T., Ganguly, S., Nemani, R. R., Goetz, S. J., Beck, P. S. A., Bunn, A. G., Cao, C., and Stroeve, J. C.: Temperature and vegetation seasonality diminishment over northern lands, Nat. Clim. Change, 3, 581–586, https://doi.org/10.1038/nclimate1836, 2013.
Yuan, K., Li, F., McNicol, G., Chen, M., Hoyt, A., Knox, S., Riley, W. J., Jackson, R., and Zhu, Q.: Boreal–Arctic wetland methane emissions modulated by warming and vegetation activity, Nat. Clim. Change, 14, 282–288, https://doi.org/10.1038/s41558-024-01933-3, 2024.
Yuan, W., Zheng, Y., Piao, S., Ciais, P., Lombardozzi, D., Wang, Y., Ryu, Y., Chen, G., Dong, W., Hu, Z., Jain, A. K., Jiang, C., Kato, E., Li, S., Lienert, S., Liu, S., Nabel, J. E. M. S., Qin, Z., Quine, T., Sitch, S., Smith, W. K., Wang, F., Wu, C., Xiao, Z., and Yang, S.: Increased atmospheric vapor pressure deficit reduces global vegetation growth, Sci. Adv., 5, https://doi.org/10.1126/SCIADV.AAX1396, 2019.
Zanaga, D., Van De Kerchove, R., Daems, D., De Keersmaecker, W., Brockmann, C., Kirches, G., Wevers, J., Cartus, O., Santoro, M., Fritz, S., Lesiv, M., Herold, M., Tsendbazar, N.-E., Xu, P., Ramoino, F., and Arino, O.: ESA WorldCover 10 m 2021 v200, Zenodo, https://doi.org/10.5281/ZENODO.7254221, 2021.
Zhang, Y., Dannenberg, M. P., Hwang, T., and Song, C.: El Niño-Southern Oscillation-Induced Variability of Terrestrial Gross Primary Production During the Satellite Era, J. Geophys. Res.-Biogeo., 124, 2419–2431, https://doi.org/10.1029/2019JG005117, 2019.
Zhu, Z., Piao, S., Myneni, R. B., Huang, M., Zeng, Z., Canadell, J. G., Ciais, P., Sitch, S., Friedlingstein, P., Arneth, A., Cao, C., Cheng, L., Kato, E., Koven, C., Li, Y., Lian, X., Liu, Y., Liu, R., Mao, J., Pan, Y., Peng, S., Peuelas, J., Poulter, B., Pugh, T. A. M., Stocker, B. D., Viovy, N., Wang, X., Wang, Y., Xiao, Z., Yang, H., Zaehle, S., and Zeng, N.: Greening of the Earth and its drivers, Nat. Clim. Change, 6, 791–795, https://doi.org/10.1038/nclimate3004, 2016.