
the Creative Commons Attribution 4.0 License.
the Creative Commons Attribution 4.0 License.
 | 26 Oct 2026
Biogeochemical controls on the concentrations and stable isotope compositions of sea-ice particulate organic matters in the Southern Ocean
Keigo D. Takahashi

Ryosuke Makabe
Masayoshi Sano
Kazuki Nakata
Noriaki Kimura
Daiki Nomura
Michiyo Yamamoto-Kawai
Ryo Matsuda
Natsumi Nojiro
Masato Ito
Shintaro Takao
Naho Horimoto-Miyazaki
Aiko Tachibana
Norio Kurosawa
Takeshi Tamura
Mizuki Komatsu
Kay I. Ohshima
Kohei Mizobata
Shigeru Aoki
Masato Moteki
The primary production and zooplankton life cycles in the Southern Ocean synchronize with seasonal sea ice melting, during which particulate organic carbon (POC) and nitrogen (PN), including ice algae, are supplied from sea ice into the water column. To understand carbon flow through food webs in productive marginal ice zones, it is necessary to determine the quantity and quality of organic carbon and nitrogen in sea ice. However, knowledge regarding brash sea ice is scarce, even though it is the predominant form at the Antarctic ice edge. In this study, 102 sea-ice samples were collected from the Indian sector (20–160° E) during summer to clarify variations in isotopic baselines and the potential contribution of sea ice-derived carbon and nitrogen to the water column. The δ13C and δ15N values of all sea-ice particulate matter samples were ‰ and ‰ (mean ± standard deviation), respectively, showing greater variability compared to those in seawater ( ‰ for δ13C and ‰ for δ15N). We identified correlations of δ13C and δ15N with organic matter and nutrient concentrations and their ratios (e.g., silicate : nitrate), suggesting that nutrient consumption and organic matter decomposition influenced those isotopic characteristics in sea ice. Using freshwater flux from sea ice melt and the measured sea-ice POC concentrations, the POC supply was estimated to be 4.1±0.3 Tg C yr−1, equivalent to 14.7±2.8 % of primary production in the marginal ice zone of the studied region. This result suggests that sea ice melt provides significant portion of organic matters potentially supporting Antarctic ecosystems in the seasonal sea ice zone, which could be traced by difference of sea-ice and seawater stable isotope compositions.
- Article
(3064 KB) - Full-text XML
-
Supplement
(3860 KB) - BibTeX
- EndNote


The Southern Ocean is known as a carbon sink, absorbing 43 % of the anthropogenic carbon dioxide from the atmosphere (Frölicher et al., 2015). This carbon uptake is chiefly driven by the atmospheric-oceanic imbalance resulting from phytoplankton photosynthesis and the drawdown of dissolved inorganic carbon. In the Southern Ocean, approximately 90 % of the organic matter produced by phytoplankton is consumed by herbivorous zooplankton, whereas only 10 % settles as phytodetritus (Moreau et al., 2020). Because organic matter leads to long-term carbon sequestration by sinking below the winter thermocline as aggregates or zooplankton fecal pellets, understanding ecosystem structures, such as predator-prey relationships and trophic levels, is essential for understanding carbon flow.
In the Southern Ocean, the vast seasonal sea ice zone (SIZ) plays a crucial role in controlling the primary production and carbon export to the depth (Ardyna et al., 2017; Zúñiga et al., 2021). Ice-edge phytoplankton blooms can occur during sea ice melting (Wilson et al., 1986), which accounts for more than 10 % of primary production south of 50° S (Arrigo et al., 2008). Primary consumers (such as copepods and salps), the drivers of the biological pumps and sequestering organic carbon into the deep ocean, have life cycles that rely on carbon dynamics following ice melting (Makabe et al., 2017; Tachibana et al., 2023; Sugioka et al., 2021). However, ice-edge blooms occur in only approximately 20 % of the area (Fitch and Moore, 2007) because of large variations in iron supply (Sedwick and DiTullio, 1997), water-column stratification (Wilson et al., 1986), and the released ice algae, which serve as a seeding population (Garrison et al., 1987; van Leeuwe et al., 2022). Despite the significant heterogeneity in phytoplankton biomass (chlorophyll a [Chl a] concentration), zooplankton distribute more ubiquitously (Takahashi et al., 2011). Reviews by Dalman et al. (2025) summarized high particulate organic carbon (POC) concentrations (>1000 µg L−1) and POC : Chl a ratios (>1000) in the upper summer sea-ice cores. Hence, particulate organic matter (POM) from sea ice is hypothesized to sustain these primary consumers and the knowledge on its quantity and quality could contributes to our understanding of the carbon cycle in the Southern Ocean.
In addition to POC and particulate nitrogen (PN) concentrations, insights into the quality of POM in sea ice, specifically its stable isotope ratios, are crucial for understanding ecosystem structure. The δ13C values of POM are used to estimate prey resources, while δ15N is used to estimate trophic levels. The position of each zooplankton within the food web and its prey resources were estimated (Schmidt et al., 2003; Liu and Zhou, 2025). Sea-ice δ15N varies significantly, with values ranging from −4.9 ‰ to +6.0 ‰ used as the baseline for ice algae (Mincks et al., 2008; Jia et al., 2016). However, the maximum values reported is +41 ‰ (Rau et al., 1991). As Wada et al. (1987) determined the zooplankton trophic level as δ15NZooplankton=3.3 (Trophic level −1) + δ15NBaseline, variability in δ15NBaseline (algae) values could significantly affect estimates of food web structures. Similarly, δ13C ranges from −28 ‰ to −10 ‰ in sea ice (Munro et al., 2010; Wing et al., 2018), which has greater variability than the δ13C of POM in seawater within the SIZ (approximately −30 ‰ to −28 ‰, Rau et al., 1991). These studies suggest that characterization the isotope compositions of sea-ice POM will contribute to the understanding of carbon pathways in planktonic food webs of the SIZ.
The ranges of previously reported δ13C and δ15N values of sea-ice POM are extremely wide, yet the factors driving these variations are not fully understood. In aquatic systems, δ13C and δ15N change depending on isotopic fractionation by photosynthetic organisms, the types of assimilated nutrients (e.g., nitrate and ammonium), the isotope composition of dissolved inorganic carbon in the environment, and differences in fractionation factors among taxonomic groups (Casciotti et al., 2003; Casciotti, 2009; Henley et al., 2012). Because the isotope ratios of POM in the ocean often accord with the environmental conditions (e.g., dissolved CO2 concentration), it is possible to reconstruct the past surface pCO2 (Bentaleb et al., 1998; Lourey et al., 2004) and nitrate concentrations (Francois et al., 1992) by using the isotope ratios in sediments. In sea ice, however, although the carbon isotope fractionation coefficient of ice algae is lower than that of open-ocean phytoplankton (Munro et al., 2010), the δ13C of POC is generally higher and wider due to a decrease in CO2 concentration in the brine by active photosynthesis of ice algae (Kennedy et al., 2002). Similarly, the δ15N of PN in sea ice is higher than that in seawater (Rau et al., 1991), which is thought to be due to POM decomposition, the recycling of nitrogen nutrients, and the consumption of NH. Recently by using isotope ratio of nitrogen, 70 % of the consumed nitrogen was estimated to be from the regenerated nitrate in Antarctic sea ice (Fripiat et al., 2014). These studies indicate that the δ13C and δ15N of POM are closely related to ice-algal production, nutrient consumption, and recycling, suggesting that they can help us understand material cycling processes within sea ice which are difficult to observe directly.
To date, much of the POM data have been obtained from sea-ice core samples collected during spring, when fast ice and pack ice floes are thick enough to conduct ice coring and observations safely on ice. Consequently, knowledge of POM concentrations and their isotope ratios in more melted sea ice (such as brash ice) or at lower latitudes (offshore) remains limited to certain areas, such as off Cape Darnley (Takahashi et al., 2023). Brash sea ice is fragmented and melted into smaller pieces (generally <2 m), possessing distinct biogeochemical compositions and physical properties compared to ice floes (Takahashi et al., 2022; Nomura et al., 2023). Furthermore, because of their high surface-area-to-volume ratio, they are thought to melt rapidly from spring to summer, influencing dissolved and particulate biogeochemical components in the ocean surface layer (Takahashi et al., 2022; Nomura et al., 2023; Akino et al., 2024). For example, organisms within broken ice receive higher irradiance than intact floes. Moreover, a high brine volume fraction (Nomura et al., 2023) and surface area-to-volume ratio are thought to enable gas exchange (e.g., carbon dioxide) between brash ice and the atmosphere. Considering that light intensity and dissolved inorganic carbon concentration influence the POC isotope composition of diatoms (Thompson and Calvert, 1994; Kennedy et al., 2002), such environments may yield δ13C values distinct from those reported from ice floes in previous studies.
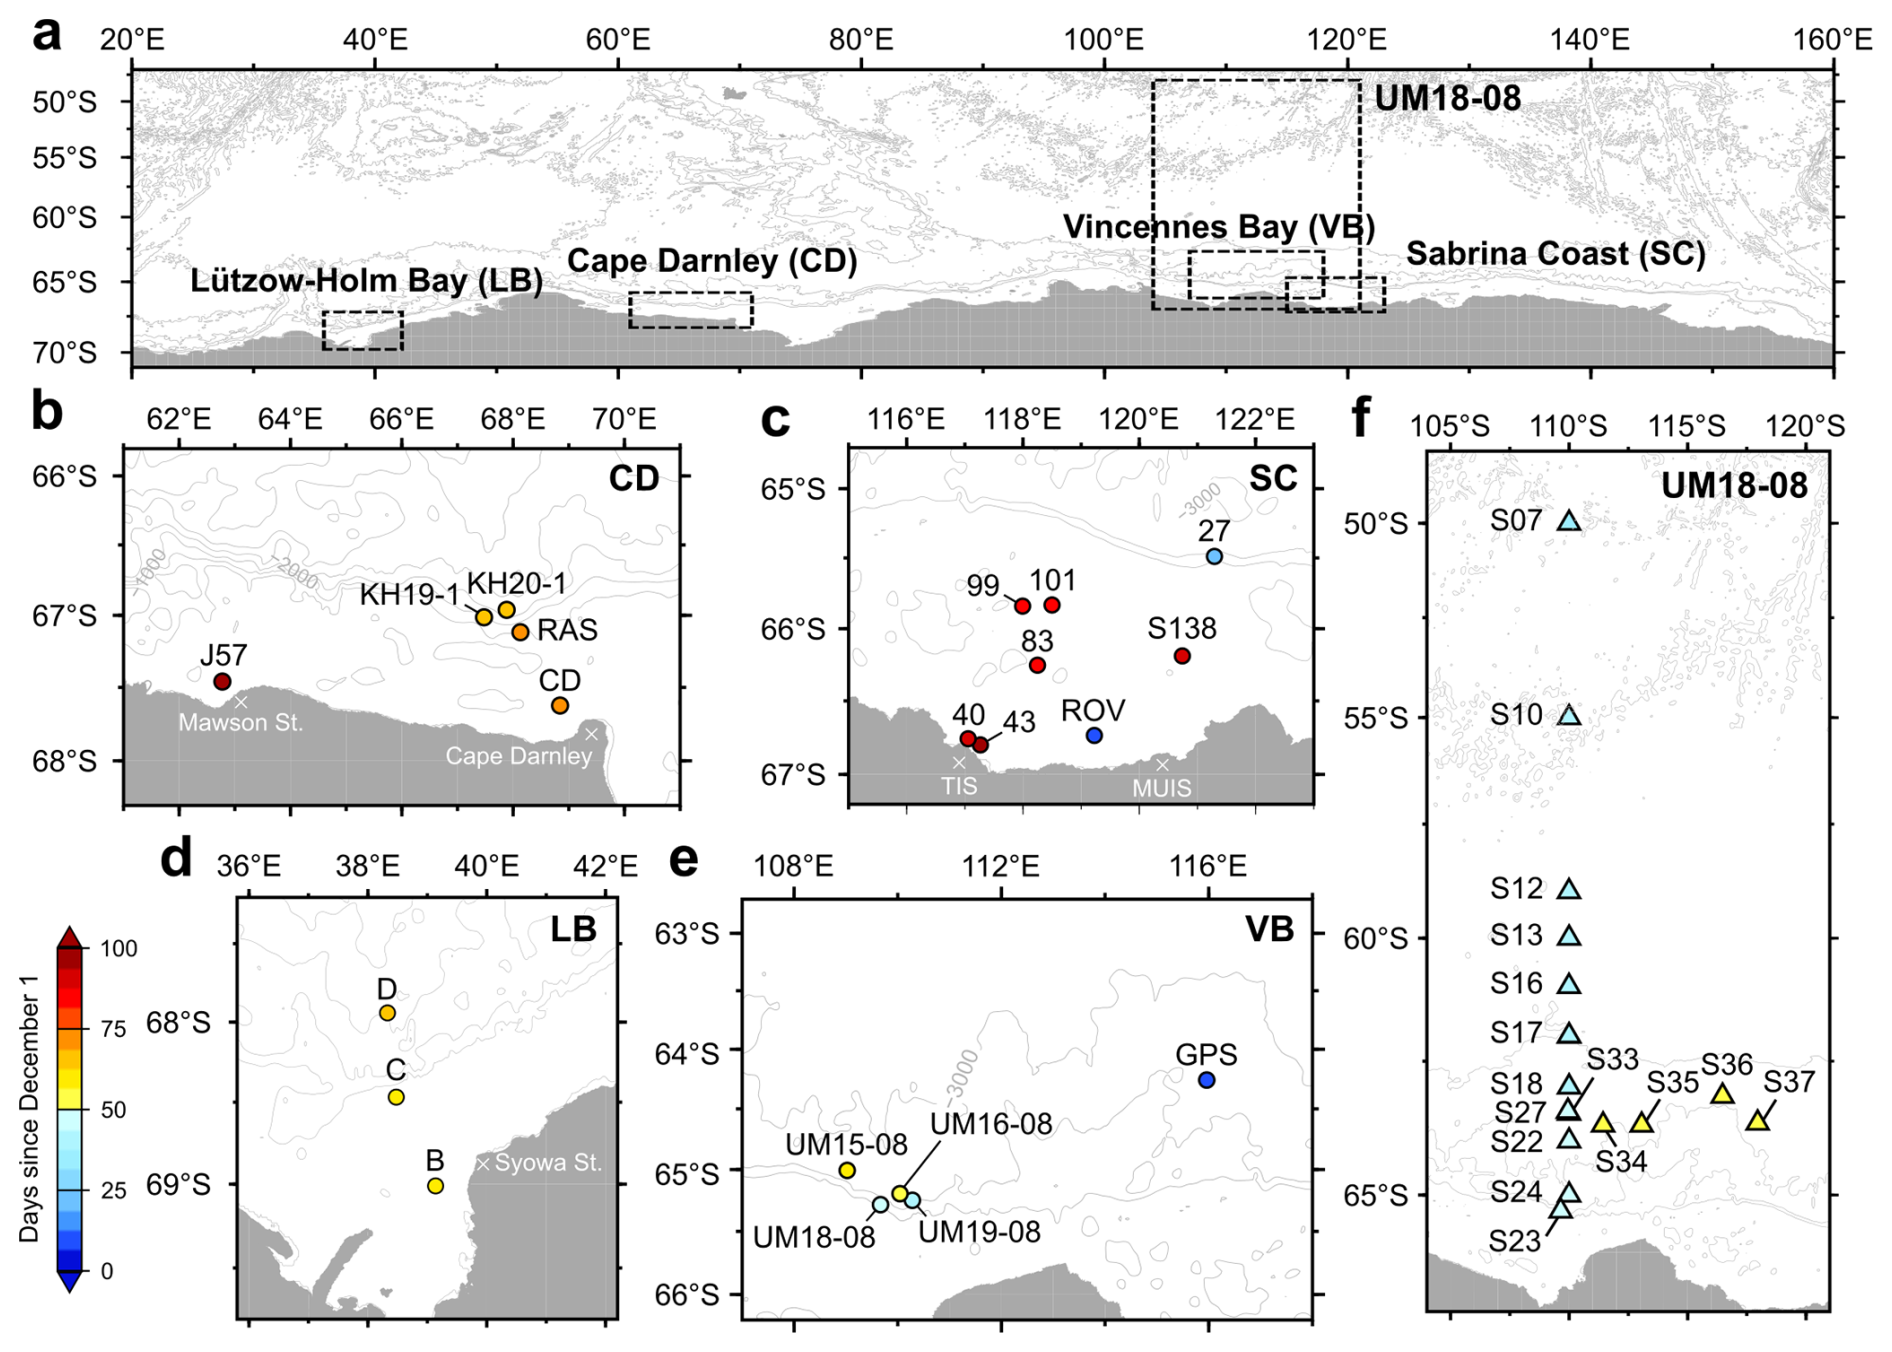
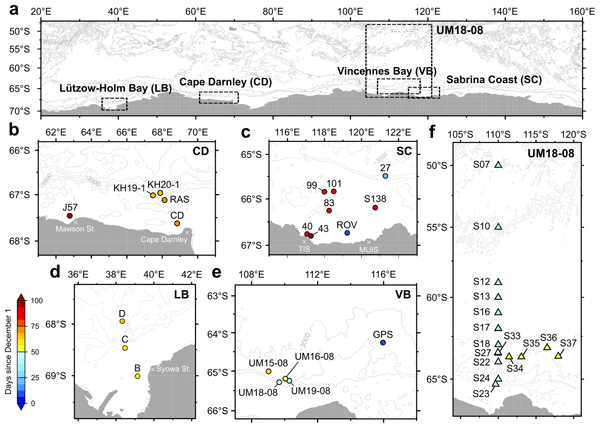
Figure 1Study area of the Indian sector of the Southern Ocean (a) and the sampling stations of sea ice in each region (b–e). CD: off the Cape Darnley (b), SC: Sabrina Coast (c), LB: Lützow-Holm Bay, VB (d): offshore region around the Vincennes Bay (e): seawater sampling sites around 110° E conducted during the cruise UM18-08 (f). Circles and triangles indicate sampling sites of sea ice and surface seawater, respectively.
We collected sea ice from various locations in the Indian sector of the Southern Ocean (20–160° E) from January 2016 to early March 2020. The objectives of this study were to determine the quantity and quality of POM within drift ice in the region and to clarify the factors influencing the CN isotopic characteristics by analyzing other parameters, such as Chl a and nutrient concentrations. Furthermore, we discuss the potential of sea ice melt as a carbon source during the summer. The contribution of algae-derived carbon was estimated using the algal carbon and Chl a ratios reported in prior microscopic observations of sea ice.
2.1 Sea ice and seawater sampling
Sea ice samples were collected from 24 stations during nine voyages conducted between January 2016 and March 2020 (Fig. 1; Table 1). The collected sea ice was brash ice (drift ice <2 m in diameter) originating from first-year ice/older ice (FYI/OI) and newly formed ice (pancake ice and nilas). On the training vessel Umitaka-maru (Tokyo University of Marine Science and Technology, UM15-08, UM16-08, UM18-08, UM19-08), drift ice was scooped up by the crane using a plankton net frame covered with cloth (Takahashi et al., 2022). On the icebreaker Shirase (JARE57, JARE61) and the research vessel Hakuho-maru (KH19-01, KH20-1), samples were collected manually and randomly using steel baskets and fishing nets (Takahashi et al., 2023, 2025), respectively. For UM18-08, UM19-09, JARE61, and KH19-01 sea-ice salinity, nutrients and Chl a concentration of some samples are published in the previous studies (Takahashi et al., 2022, 2023, 2025; Nomura et al., 2023). Along with these datasets, we compiled unpublished data (e.g., POC, PN, and stable isotope ratios etc.) and archived in the Arctic and Antarctic Data Archive System (ADS). The collected sea ice was immediately packed into polyethylene bags and stored in the dark at −20 °C (Miller et al., 2015) until analysis for not longer than 12 months. Seawater was sampled almost twice daily in January 2019 (UM18-08 cruise) using a continuous underway pump (5 m depth) aboard Umitaka-maru. For POC/PN concentrations and δ13C and δ15N, a total of 1.0 to 2.3 L of seawater was filtered through the pre-combusted Whatman GF/F filters (450 °C, 4 h). The filters were packed into cryovials and transported to the laboratory in liquid nitrogen.
Table 1Sampling date and physical and biological properties of sea ice at each station. The en dash (–) indicates no data. Means and standard deviations are shown, except for stations where only two sea-ice samples were collected. The DSF indicate the number of days elapsed since sea ice formation, which was estimated using remote sensing. Newly formed ice stations and stations with no valid ice data (e.g., low sea ice concentration) were excluded from the DSF analysis. LB: Lützow-Holm Bay; CD: Cape Darnley; VB: Vincennes Bay; SC: Sabrina Coast.
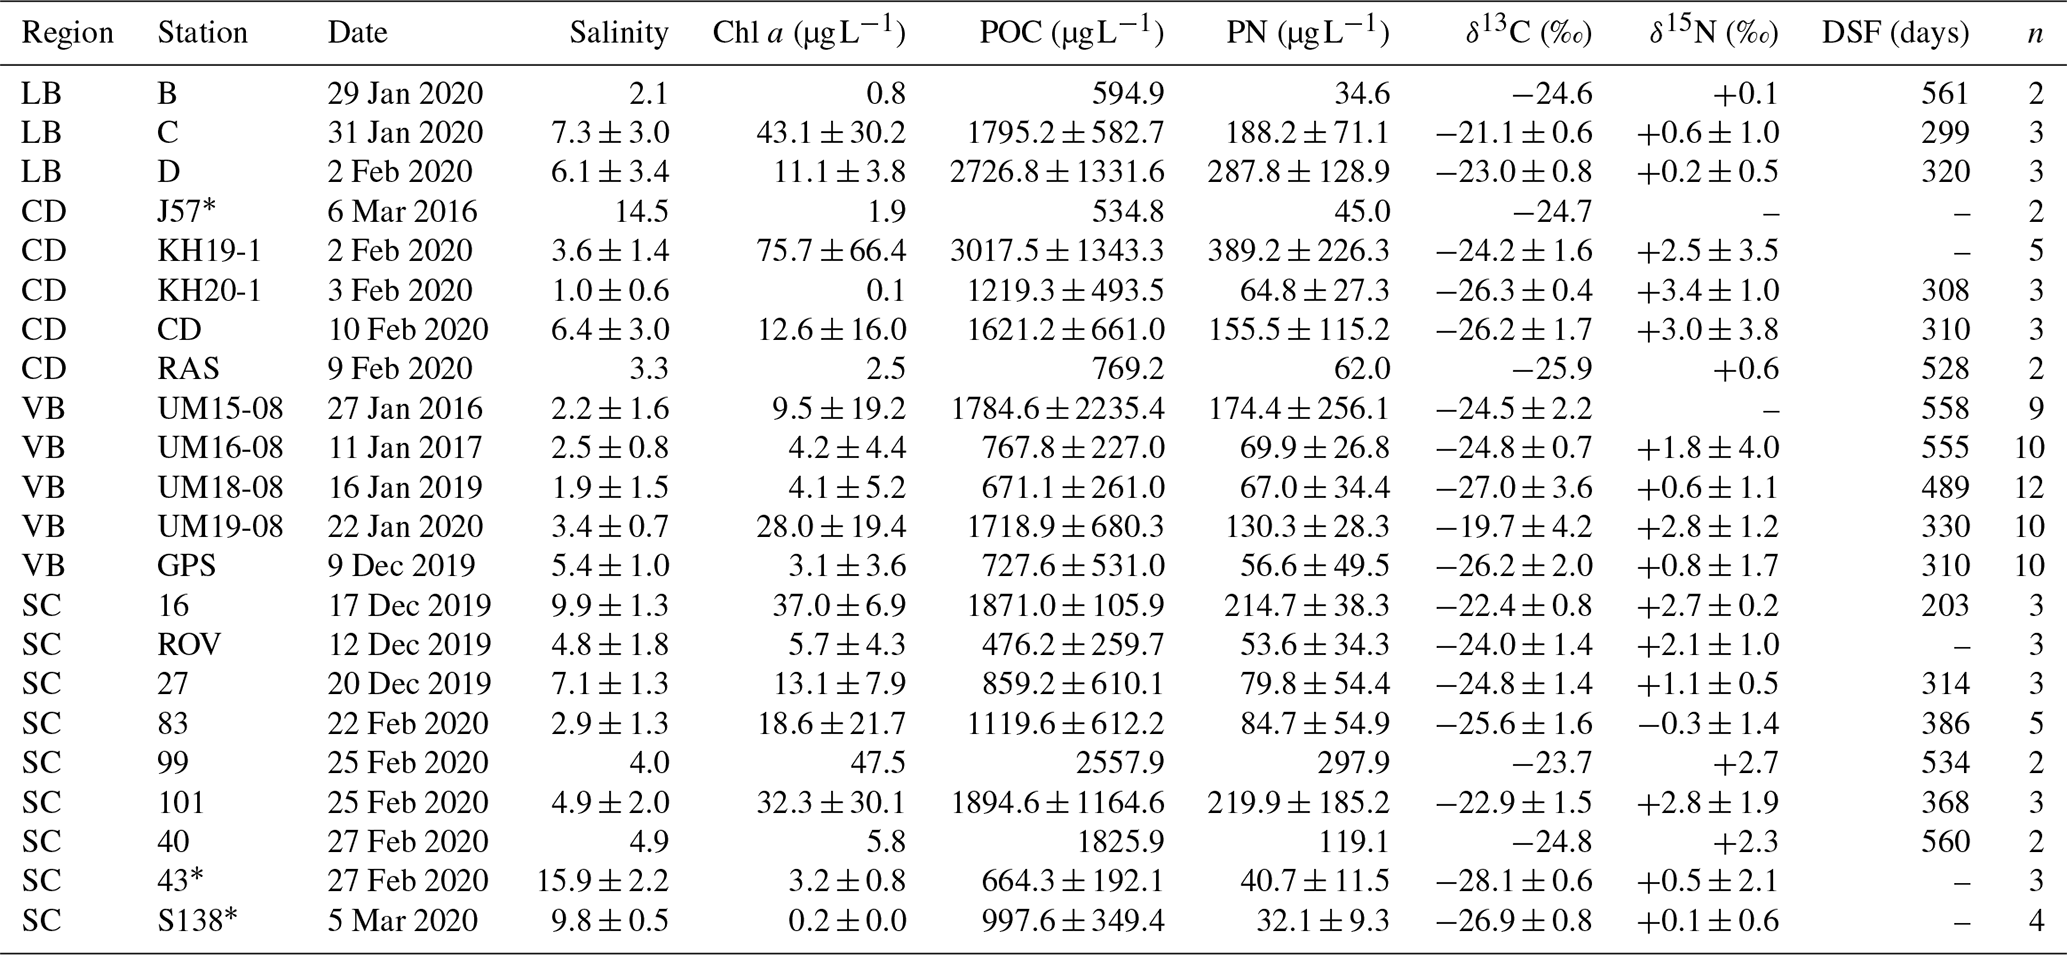
∗ Stations of newly formed ice.
2.2 Sea ice melting and subsampling procedures
After measuring the total weight of sea ice, the ice blocks were roughly crushed with an ice pick to homogenize them, then randomly divided into 200–800 g portions (excluding UM15-08 and UM16-08). This ice was melted in 9 times the volume of 0.2 µm-filtered seawater at 4 °C in the dark, and the meltwater was filtered through Whatman GF/F filters to measure Chl a concentration. The filters were soaked in N,N-Dimethylformamide (Suzuki and Ishimaru, 1990) and stored at −20 °C in the dark. The remaining sea ice was then melted in polyethylene bags at room temperature in the dark (Roukaerts et al., 2019). Meltwater was filtered through pre-combusted Whatman GF/F filters and stored in a deep freezer. The subsequent drying and fumigation followed the procedure for seawater POM filters. Salinity was measured from a portion of the meltwater collected for nutrient analysis, which was then stored in a deep freezer (−80 °C). Sea ice volume was calculated from salinity, meltwater temperature (+4 °C), and weight of sea ice.
2.3 Chl a concentration
The pigments on filters were extracted with N,N-Dimethylformamide for at least 24 h and Chl a concentrations were measured using a pre-calibrated fluorometer (Welschmeyer, 1994). For sea-ice samples from Sts. UM15-08 and UM16-08, all Chl a samples were collected from meltwater without adding filtered seawater. However, the effect of osmotic changes on bulk Chl a concentration is considered insignificant (Dieckmann et al., 1998; Meiners et al., 2012).
2.4 POC and PN concentrations and stable isotope composition
The POM filters were dried at 60 °C for 24 h, fumed with 1 mol L−1 hydrochloric acid (HCl) to remove particulate inorganic carbon, and stored in a desiccator. The filter samples were packed into tin capsules and analyzed for POC and PN concentrations and stable isotope ratios (δ13C, δ15N) using the isotope ratio mass spectrometry (Flash 2000-ConfoIV-DeltaV advantage, Thermo Scientific, USA; Europa PPZ GEO 20-20). δ13C and δ15N were calculated using the following equations based on the differential ratios relative to standard materials.
where x is either 13C or 15N and Rsample and Rstandard are the isotope ratios ( and ) of the samples and standard materials, respectively.
2.5 Nutrient concentrations
Nutrient concentrations (NO, PO Si(OH)4) in sea ice collected by Umitaka-maru from 2016 to 2019 (UM15-08, UM16-08, UM18-08) and sea ice collected by Shirase in 2016–2017 and 2018–2019 (JARE57, JARE59) were measured using the methods described in Shimada et al. (2020). Sea ice from the Hakuho-maru voyages (KH19-01 and KH20-01) and the 2019–2020 Shirase voyage (JARE61) were measured in accordance with JGOFS (1994). To visually analyze the consumption and remineralization of each nutrient (NO, PO, Si(OH)4) since sea ice formation, comparisons with the Theoretical Dilution Line (TDL) were conducted. The mean nutrient concentrations and salinity (34.3) from the summer minimum temperature layer, measured in the eastern Antarctic SIZ, were cited from Nomura et al. (2023) as initial (autumn to winter) seawater values. Bulk sea ice nutrient concentrations depend on brine discharge, sea ice freezing and melting, and snow accumulation, which could dilute bulk concentration. To isolate the effects of biological accumulation and consumption processes on the other components (e.g., POC concentration), the salinity-normalized nutrient concentrations (*NO, *PO, *Si(OH)4) were calculated (Fripiat et al., 2017), which were expressed as:
Here, C represents the bulk nutrient concentration, and S represents the salinity of sea ice. It should be noted that this method focuses on the seasonal change in nutrient concentration (i.e., changes since sea-ice formation) and does not completely rule out the effect of brine convection or exchange with seawater which could dilute/supply nutrient in sea ice.
2.6 Contribution of algal carbon to POC
The conversion of algae in sea ice to carbon was estimated from the POC : Chl a ratio reported in previous studies (Becquevort et al., 2009; Meiners et al., 2011; Takahashi et al., 2023). The POC : Chl a ratio for isolated cultured strains has been reported to be 25–96 for the Antarctic diatom Fragilariopsis cylindrus and 41–284 for the haptophyte Phaeocystis antarctica (Arrigo et al., 2010). However, these values are highly dependent on culture light conditions and are unlikely to reflect sea ice in natural environments inhabited by diverse communities. Therefore, this study used the ratio of ice-algal carbon (IAC) to chlorophyll a concentration, estimated from field observations. Previously, the IAC : Chl a ratios for Antarctic ice algae (based on linear regression) were reported to range from 32.5 to 91.7 (Becquevort et al., 2009; Meiners et al., 2011; Takahashi et al., 2023). We calculated ice-algal carbon content (POCalgae, µg C L−1) by multiplying sea-ice Chl a concentration by the mean IAC : Chl a ratio (54.4±26.5).
Here, F is the mean IAC : Chl a ratio. Additionally, by dividing POCalgae by the POC concentration, we estimated the proportion of algae-derived carbon (%). This ratio still has uncertainty which affects our estimation of POCalgae because of the variabilities among studies (Fig. S1 in the Supplement). Natural ice-algal assemblages change their cellular carbon or Chl a content under the alleviated light condition (Gosselin et al., 1990).
2.7 Sea-ice back trajectory and ice production based on remote sensing
To reconstruct the trajectories of sea ice after its formation, we estimated sea ice motion based on satellite observations (Kimura, 2004). Specifically, backward trajectories of virtual particles were calculated using daily gridded sea ice drift velocity data with a spatial resolution of 60 km. Each particle was advected backward in time following the ice motion field. When a particle reached a grid cell where no sea ice was present, that location was regarded as the point of initial sea ice formation for the particle (Corkill et al., 2023, etc.). However, it remains unclear whether sea ice was formed at this specific point. In this study, we estimated daily sea-ice production along the sea-ice trajectory to better identify its origin. First, the thermal ice thickness was estimated following Nakata et al. (2019) using microwave data from AMSR2 on board GCOM-W. The daily sea-ice production (m d−1, 6.25 km grid resolution) was calculated by the heat budget analyses (Nakata et al., 2021) using ECMWF ERA5 reanalysis products (Hersbach et al., 2018, 2020) and the estimated thermal ice thickness. We extracted sea ice production only along the trajectory. The first date of sea-ice production is defined as the first time sea ice was produced (>0.00 m d−1) across all available trajectory data, and the elapsed days from sea-ice formation to ice sampling (DSF) are calculated. Because sea-ice motion was estimated using cross-correlations of pixels in a 60 km × 60 km window, the trajectories and DSF data are missing in Sts. KH19-1 and ROV which lacked valid sea-ice data around the sampling site.
2.8 Sea ice melt thickness and POC flux from sea ice
To estimate POC and algae-derived POC (Sect. 2.6) supply from sea ice, we determined the average POC and Chl a concentrations within sea ice during the melt season. Because this study randomly sampled broken ice, it included sea ice of various sizes. To estimate the POC concentration in meltwater when these sea-ice samples melt, it is necessary to account for differences in ice piece size (melt volume). Using the POC concentration of all sea ice (excluding newly formed ice) and the volume calculated from sea ice weight, we calculated the volume-weighted mean (VWM) POC and Chl a concentrations, following Takahashi et al. (2022).
Here, n is the total number of ice samples, and i indexes each ice sample. ai and ci represent the concentrations of POC or Chl a (µg L−1), respectively, in the sea-ice sample number i, and bi is the volume (L) of the sample. ChlVWM was converted to algal-derived POC by multiplying it by an IAC : Chl a ratio of 54.4±26.5 (Sect. 2.6).
We adopted the VWM method to determine POC content in meltwater in order to avoid biases when a mathematical mean was used. In extreme case, release of POC into seawater from quite small sea ice (sample volume: 0.4 L) with high POC concentration (5,000 µg L−1) is equivalent to that from larger ice (10 L) with low POC concentration (200 µg L−1) if both of them were melted (POCVWM: 2000 µg L−1). In this situation, using a simple mean value (2600 µg L−1) would make the contribution of POC concentration in larger-sized sea ice minor and the other way around. Although the VWM method cannot calculate the variance SD, it can correct for such bias when dealing with the samples with different size or concentrations.
Next, we estimated the freshwater flux from sea ice melt (unit: sea ice melt thickness [m]). The freshwater flux was calculated using climate values from Komatsu et al. (2025) and averaged over the study area (20–160° E). The sea ice meltwater flux was multiplied by the POCVWM concentration in sea ice to estimate the POC flux from sea ice to the water column per unit area (mg C m−2 yr−1).
Here, Hi is ice melt thickness and ρi is the density of sea ice (0.90) used in Komatsu et al. (2025). To estimate the contribution of the POC flux from sea ice to primary production in the water column, we cited the means (± standard deviation: SD) of SIZ area (difference of ice extent in September and February) during 1979–2019 (Parkinson, 2019) and the primary production for the summer MIZ and MIZ shelves during 1997–2006 (Arrigo et al., 2008) in the Indian sector of the Southern Ocean. The SD for the contribution of sea-ice POC to the production in seawater was calculated by propagation of error using SD of POC input and primary production in the MIZ.
2.9 Statistical analyses
To identify factors influencing variations in sea-ice POC, PN concentrations, and POM stable isotope ratios (δ13C, δ15N), we investigated correlations between these data and salinity, Chl a, salinity-normalized nutrient concentrations, the Si(OH)4 : NO ratio, the ratio, and DSF. For each dataset, Q-Q plots were first used to assess whether parametric tests were appropriate. Since linear regression could not be applied to some parameter sets, a nonparametric Spearman's rank correlation test was used for all correlations, except the POC : PN ratio, to assess the presence of significant relationships and to calculate correlation coefficients. For POC, PN concentrations, δ13C, and δ15N in the four areas (LB, CD, VB, SC; Fig. 1), the datasets were non-normal according to the Kolmogorov–Smirnov test. Therefore, the Kruskal-Wallis test and Steel-Dwass tests were used to confirm differences in medians across areas. All statistical analyses were performed using the R software (https://www.r-project.org/, last access: 4 January 2026).
3.1 Characteristics of salinity, macronutrient, and POM concentrations in sea ice and seawater
The POC concentrations in sea ice ranged 246.1–6365.3 µg L−1 and showed a linear relationship with PN (14.4–725.4 µg L−1) (Fig. 2a). The POC : PN ratio (g : g) ranged from 4.5 to 41.9, with an average of 13.4, and the ratio obtained from linear regression was 7.6. Sea-ice POM δ13C and δ15N ranged from −35.1 ‰ to −11.7 ‰ and −3.8 ‰ to +11.1 ‰, respectively, showing a significant positive correlation with each other (Spearman's rank test, r=0.34, p < 0.05), although the correlation coefficient was low (Fig. 2b).
The POC and PN concentrations in surface seawater showed lower values and smaller variations compared to sea ice ranging 79.7–302.5 and 13.9–64.3 µg L−1, respectively. Chl a concentration was also consistently low (0.2–1.8 µg L−1) except the maximum found at St. S35 (1.8 µg L−1). Seawater POM δ13C and δ15N were ‰ (−30.9 ‰ to −27.0 ‰) and ‰ (−3.1 ‰ to +1.5 ‰), respectively and no relationships were observed between them.
Sea-ice salinity ranged from 0.3 to 10.6 in FYI/OI-derived sea ice and from 9.4 to 18.4 in newly formed ice. NO, PO, and Si(OH)4 concentrations in sea ice were 0.5–15.9, 0.0–8.0, and 0.0–21.3 µmol L−1, respectively (Fig. 2d–f). All nutrients showed a positive correlation with sea ice salinity, with the highest concentrations observed in the new ice from the SC. Compared to seawater (winter TDL), plots for NO, PO, and Si(OH)4 fell below the TDL in 43 %, 7 %, and 93 % of samples, respectively. The proportion of sea ice samples falling below the TDL showed no significant regional variation for NO.
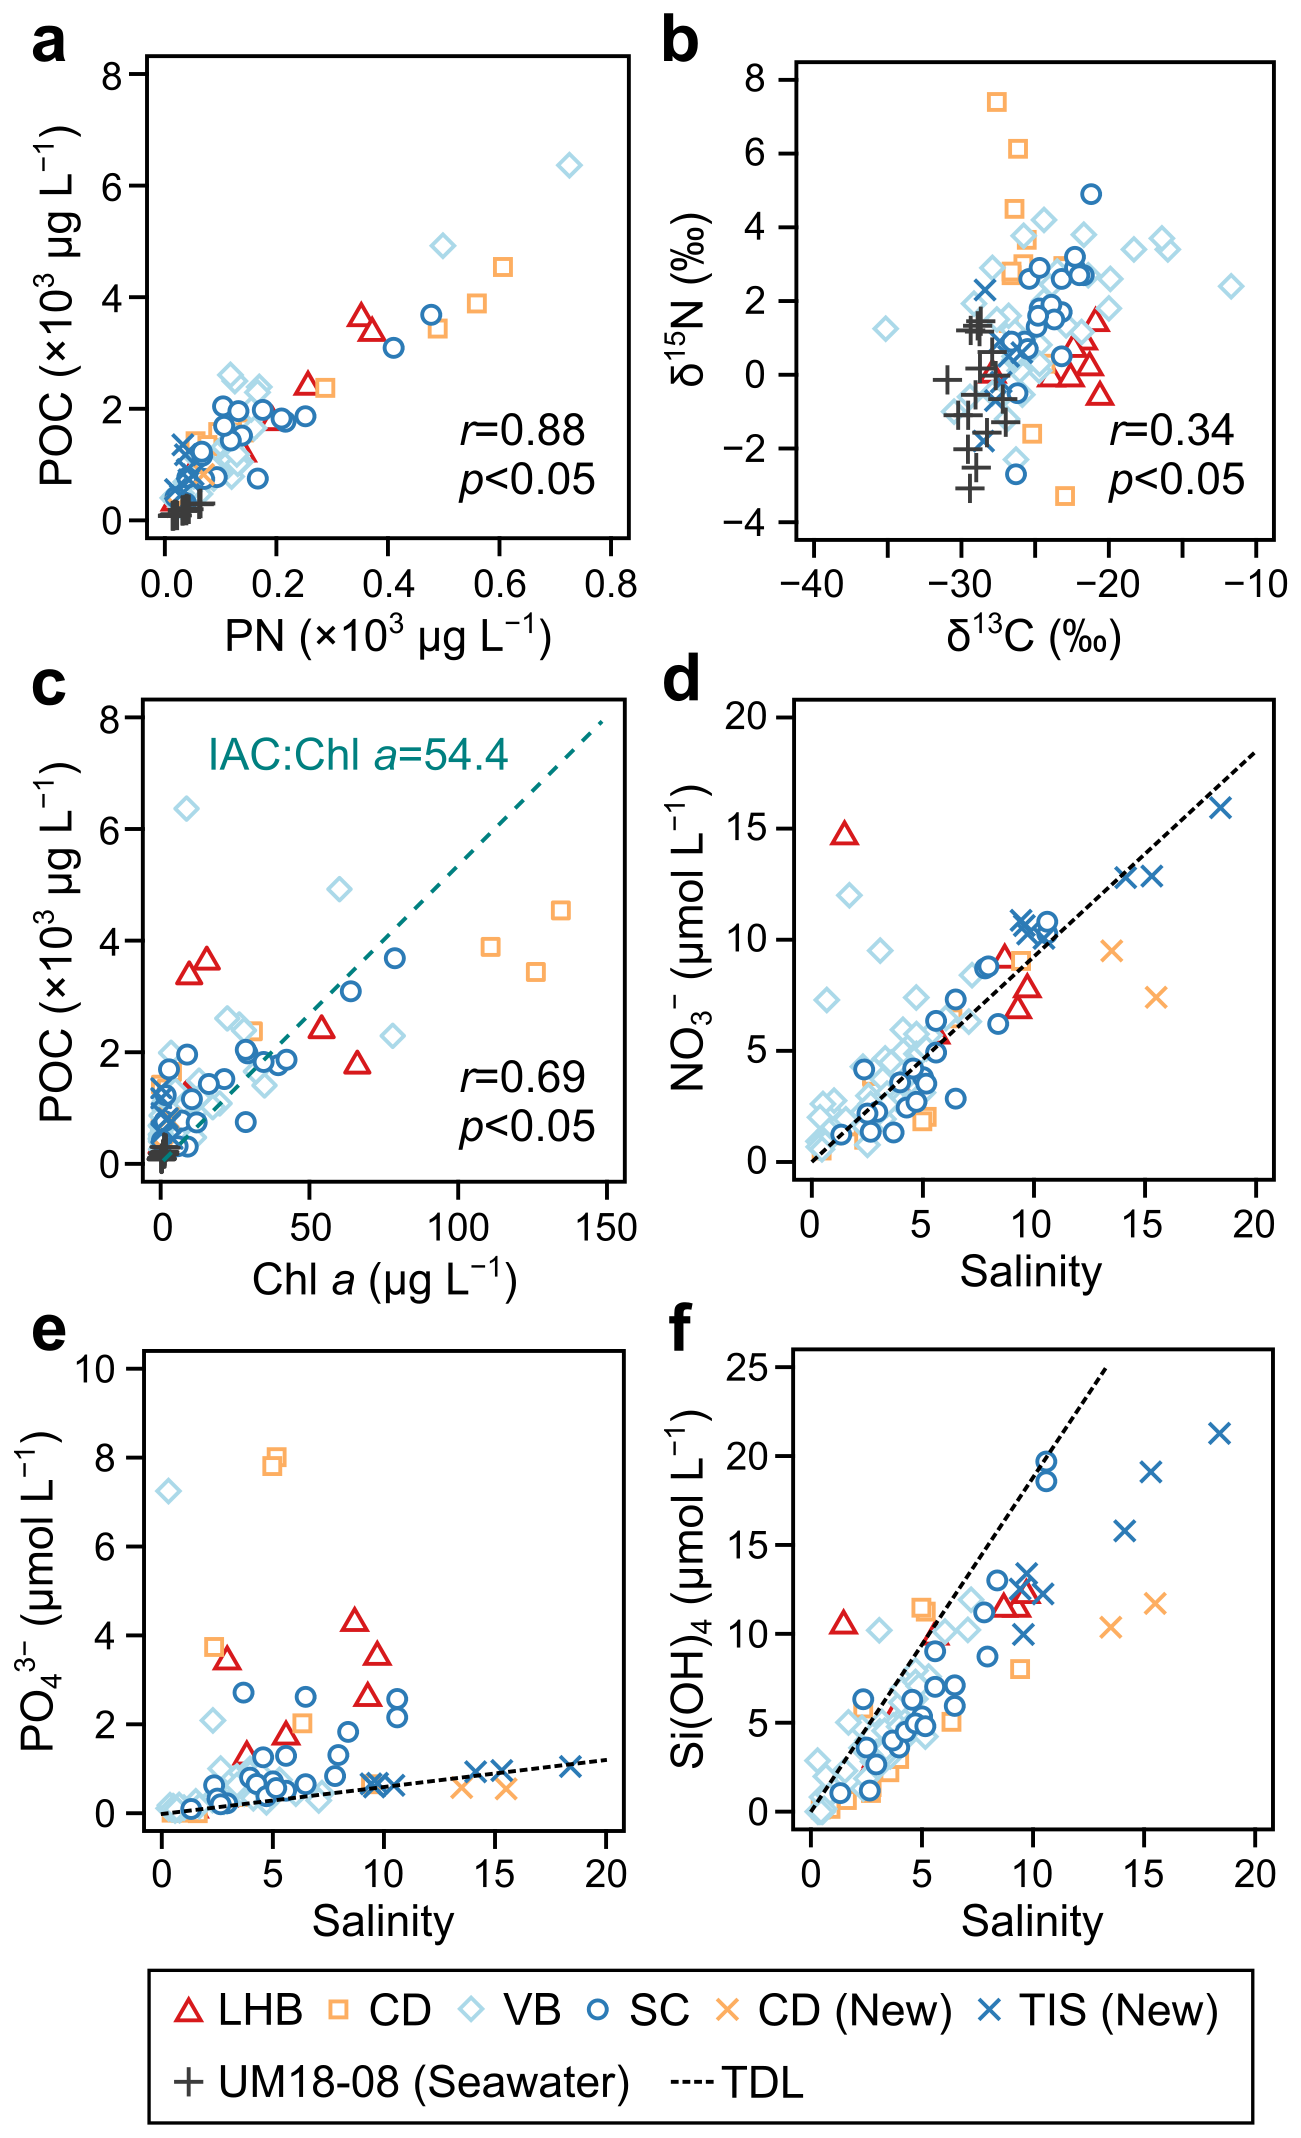
Figure 2Relationships between concentrations or isotope ratios of particulate organic carbon and nitrogen and Chl a and in sea ice and seawater (a–c). Sea-ice salinity and macronutrient concentrations (d–f). TDL denotes theoretical dilution line. LB: Lützow-Holm Bay; CD: Cape Darnley; VB: Vincennes Bay; SC: Sabrina Coast. The Spearman's rank correlation coefficient and p values are shown in the bottom right for (a)–(c).
The tracked trajectory of the sea ice revealed that much of it drifted from the east (Figs. S1–S3). The number of days since the sea ice formation (DSF) ranged from 203 to 581 d (Table 1). Even within the same sea area (LB, CD, VB, and SC), the DSF varied significantly, ranging from sea ice less than 1-year old to ice likely to be second-year ice (DSF > 500 d).
3.2 Regional variations of Chl a and POM concentrations and isotope signatures
To examine the regional variations and differences between sea ice types (FYI/OI and newly formed ice) for each parameter, the values were plotted for the four regions (Fig. 3). The sea ice salinity of the FYI/OI from all stations was significantly lower than that of the newly formed ice. Significant salinity differences were observed between the VB (mean 3.0) and SC (mean 5.4) (Steel-Dwass test, p<0.05). Chl a concentrations in FYI/OI ranged 0.01–134 µg L−1, showing higher average concentrations compared to newly formed ice (0.2–4.0 µg L−1). Except for CD, FYI/OI had significantly higher Chl a concentrations than the newly formed ice (Steel-Dwass test, p<0.05).
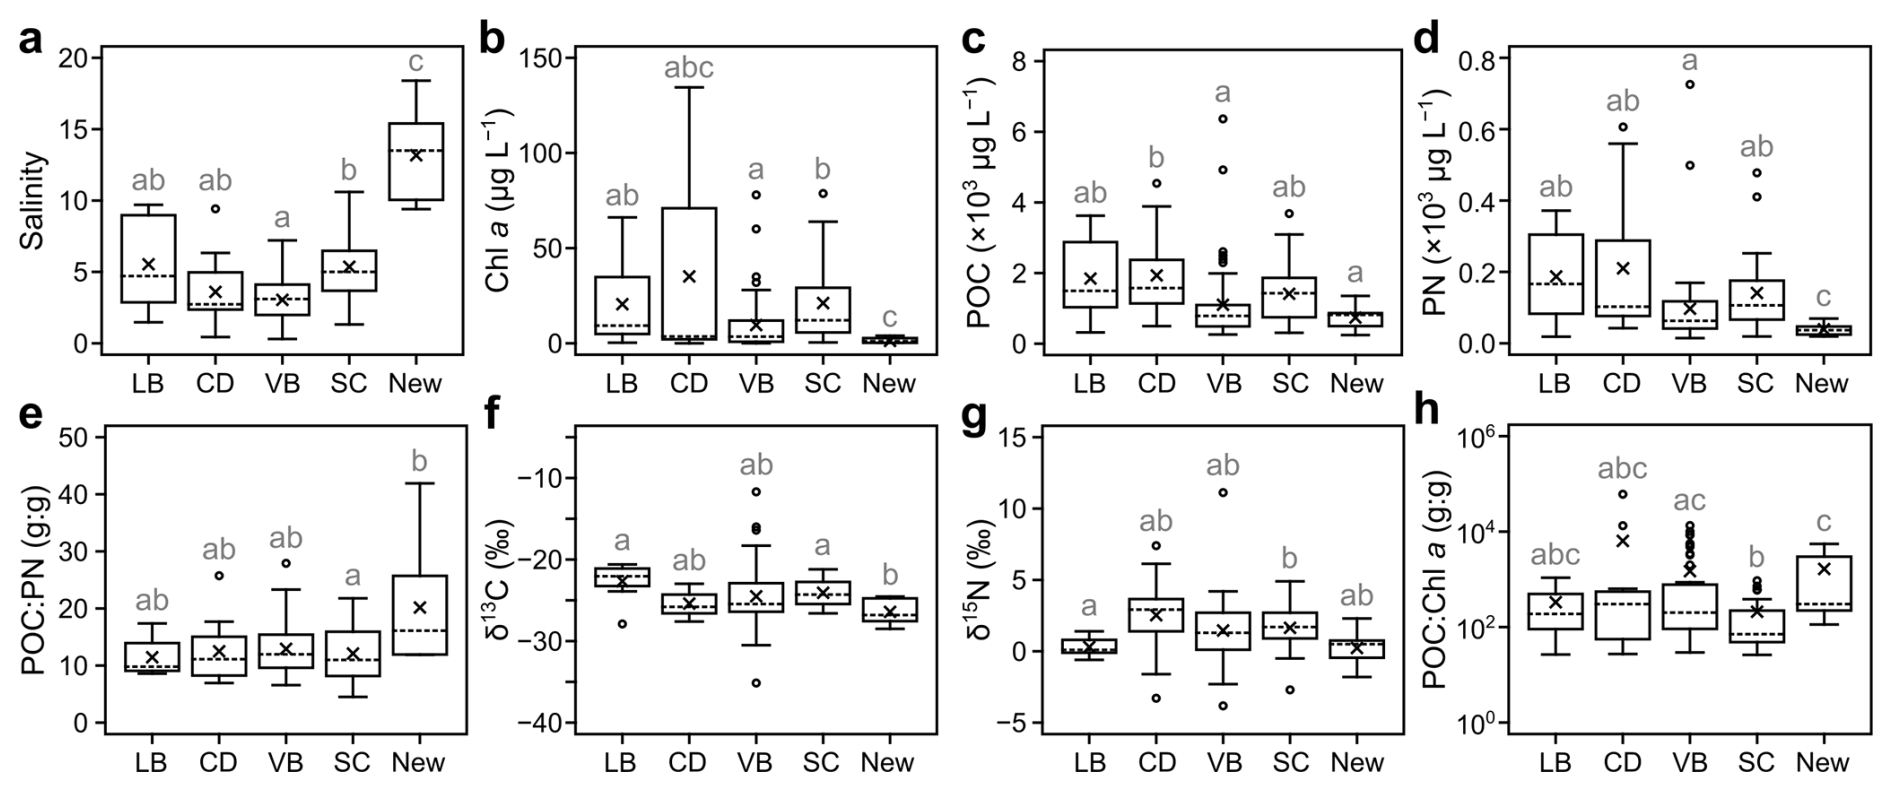
Figure 3Regional or ice-type (FYI/OI brash ice vs. newly formed ice) differences in salinity (a), Chl a (b), POC (c), PN (d) concentrations and POC : PN ratios (e), stable isotopes of POC (f) and PN (g), and POC : Chl a ratios (h) in sea ice. X and horizontal dotted lines indicate the mean and median, respectively. LB: Lützow-Holm Bay; CD: Cape Darnley; VB: Vincennes Bay; SC: Sabrina Coast.
Similar to Chl a, POC concentrations of FYI/OI were higher than the average value for newly formed ice (738.3 µg L−1), but significant differences in POC concentration were only observed between those of CD and VB, and between CD and newly formed ice. Unlike POC, PN concentrations showed no significant differences between FYI/OI, whereas newly formed ice was significantly lower than VB, CD, and SC. The POC : PN ratio for FYI/OI ranged from 4.5 to 12.6, showing lower values and less variation compared to new ice (11.9–41.9). However, significant differences were observed only between the SC and newly formed ice (Steel-Dwass test, p<0.05).
The mean (± SD) δ13C and δ15N values for sea ice excluding newly formed ice were ‰ and ‰, respectively ( ‰ and ‰ for all sea ice). The δ13C of newly formed ice was significantly lower than those of LB and SC, but no significant difference was observed among FYI/OI samples. For δ15N, no significant differences were found between regions or newly formed ice, except that SC was significantly higher than LB. The POC : Chl a ratio showed significant differences among the VB, SC, and newly formed ice, with the highest average value observed in the newly formed ice.
3.3 Monthly variations in physical properties and biogeochemical components of sea ice
To clarify whether the physical parameters and particulate matter within sea ice varied across sampling periods, the above components were plotted separately for December, January, and February (Fig. 4), excluding newly formed ice. The sea ice salinity showed significant differences between December and February. The average salinity peaked in December (6.3), declined to 2.8 in January, and increased slightly to 4.0 in February. The Chl a concentration in the sea ice increased from December to February. Although the average value in February was more than 2.1 times higher than that in the preceding months, no significant monthly differences were observed (Kruskal-Wallis test, p=0.26). The mean monthly POC concentrations increased from December to February, with significantly higher concentration found in February than in other months. The PN concentration also tended to increase in February and significant differences were observed between February and the preceding months. However, the rate of increase from January to February was 1.6 times for POC and 1.8 times for PN, which was more moderate than the increase in Chl a concentration. POC : PN and POC : Chl a ratios, δ13C, and δ15N showed some monthly variations, but no significant differences were discerned (Kruskal-Wallis test, p>0.29).
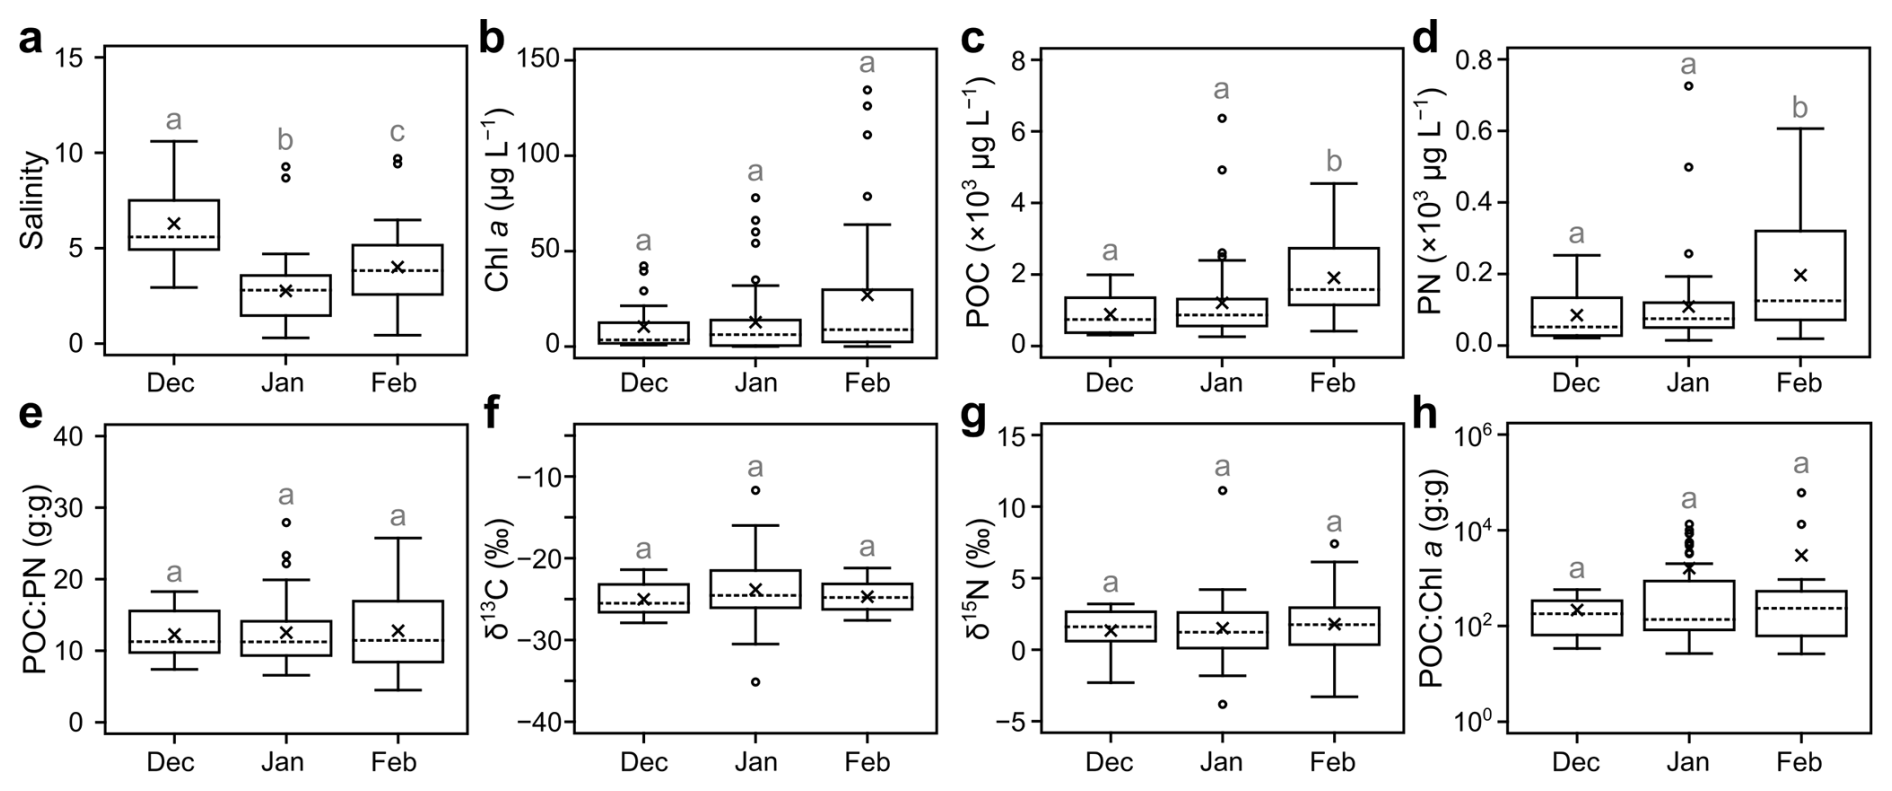
Figure 4Monthly variations of sea-ice salinity (a), Chl a (b), POC (c), PN (d) concentrations and POC : PN ratios (e), stable isotope ratios of POC (f) and PN (g), and POC : Chl a ratios (h). × and horizontal dotted lines indicate the mean and median, respectively.
3.4 Inter-relationships between biogeochemical components in sea ice and seawater
To identify the factors affecting the sea ice POC and PN concentrations and their respective isotope ratios, we investigated their correlations with other physical and biogeochemical parameters (Fig. 5). Sea-ice POC and PN concentrations showed positive correlations with Chl a and *PO concentrations and Si(OH)4 : NO (Spearman's rank test, r>0.30, p<0.05), while they correlated negatively with *NO and DSF (, p<0.05, Fig. 5a). Chl a concentration showed similar results to POC and PN regarding Chl a and *PO, but it also exhibited a weak positive correlation with salinity (Spearman's rank test, r=0.35, p<0.05). DSF showed negative correlations with Chl a concentration and salinity, similar to POC and PN, but a positive correlation was also observed between POC : Chl a ratio (Spearman's rank test, r=0.32, p<0.05).
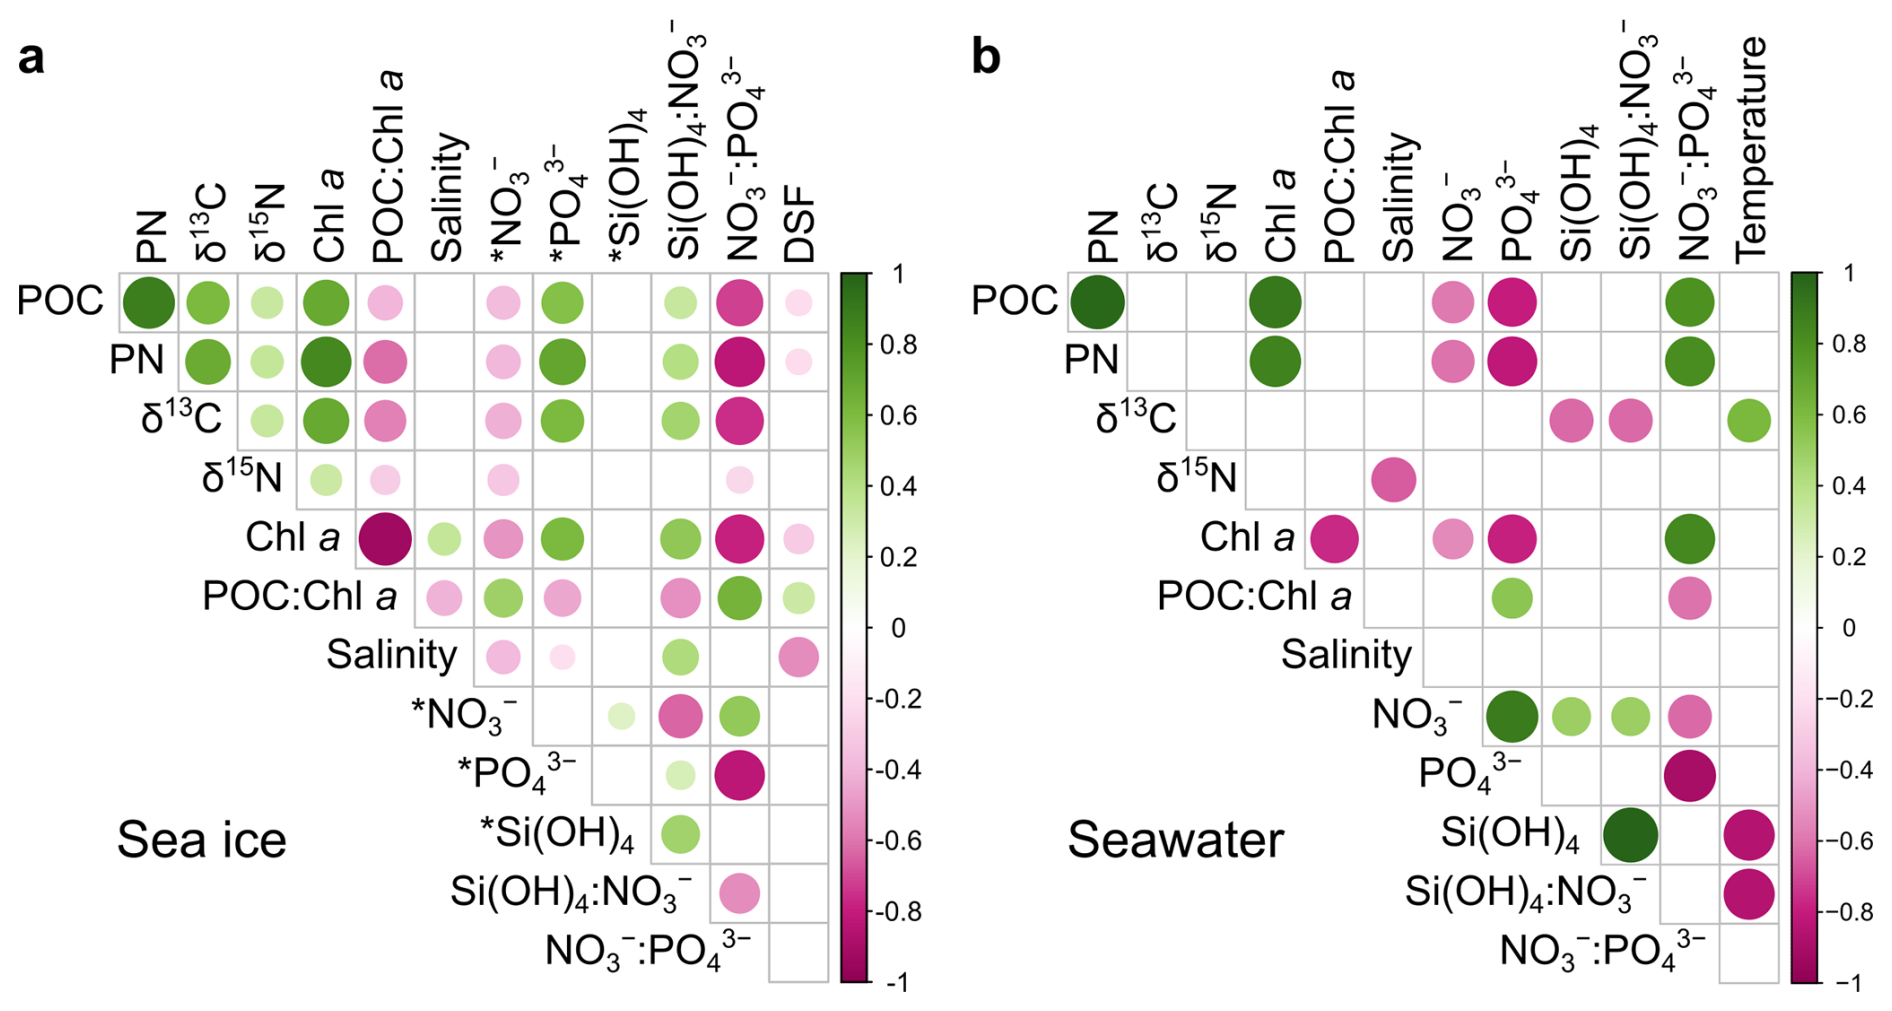
Figure 5Inter-relationships of biogeochemical properties and POC, PN concentration and their isotope ratios for sea ice (a) and surface seawater (b). DSF: days since sea-ice formation.
The sea-ice POM δ13C and δ15N showed positive correlations with POC, PN, and Chl a concentration (Spearman's rank test, r>0.30, p<0.05), while they correlated negatively with POC : Chl a ( and for δ13C and δ15N, respectively, p<0.05). Among each nutrient, both δ13C and δ15N showed a negative correlation with *NO and (Spearman's rank test, , p<0.05), while only δ13C showed a positive correlation with *PO and Si(OH)4 : NO (r>0.45, p<0.05).
The POC and PN concentrations in surface seawater also showed a strong positive correlation with the Chl a concentration (Spearman's rank test, r=0.90 and r=0.87 for POC and PN, respectively, p<0.05, Fig. 5b). However, unlike sea ice, they showed negative correlations with PO (Spearman's rank test, , p<0.05). δ13C showed a negative correlation with Si(OH)4 concentration and the Si(OH)4 : NO ratio (Spearman's rank test, , p < 0.05), while δ13C showed a positive one with sea surface temperature (r=0.62, p<0.05). δ15N showed a significant negative correlation only with salinity (Spearman's rank test, , p<0.05).
3.5 Contribution of POC released from sea ice to the water column
The POCVWM concentration for sea ice (excluding newly formed ice) was 1137.2 µg L−1, with an average value of 1353.0 µg L−1 and a median of 1022.1 µg L−1. The POC supply from sea ice in the Indian sector, calculated from meltwater flux and the area of the SIZ, was 4.1±0.3 Tg yr−1 (Table 2). Assuming the primary production at the MIZ in this sector to be 27.9±5.0 Tg yr−1 (Arrigo et al., 2008), sea ice-derived carbon was found to account for 14.7±2.8 % of this production. The ChlVWM concentration was 12.4 µg L−1. The POCalgae concentration estimated by ChlVWM and the mean IAC : Chl a ratio (54.4±26.5, Sect. 2.6) yielded 674.6±328.6 µg L−1, which corresponds to 59.3±28.9 % of POCVWM.
Table 2The estimated input of POC from sea ice and its contribution to primary production in the marginal ice zones of the Indian sector (20–160° E) of the Southern Ocean. The standard deviation (SD) for the contribution of sea-ice POC to the production in seawater was calculated by propagation of error using SD of POC input and primary production in the MIZ.
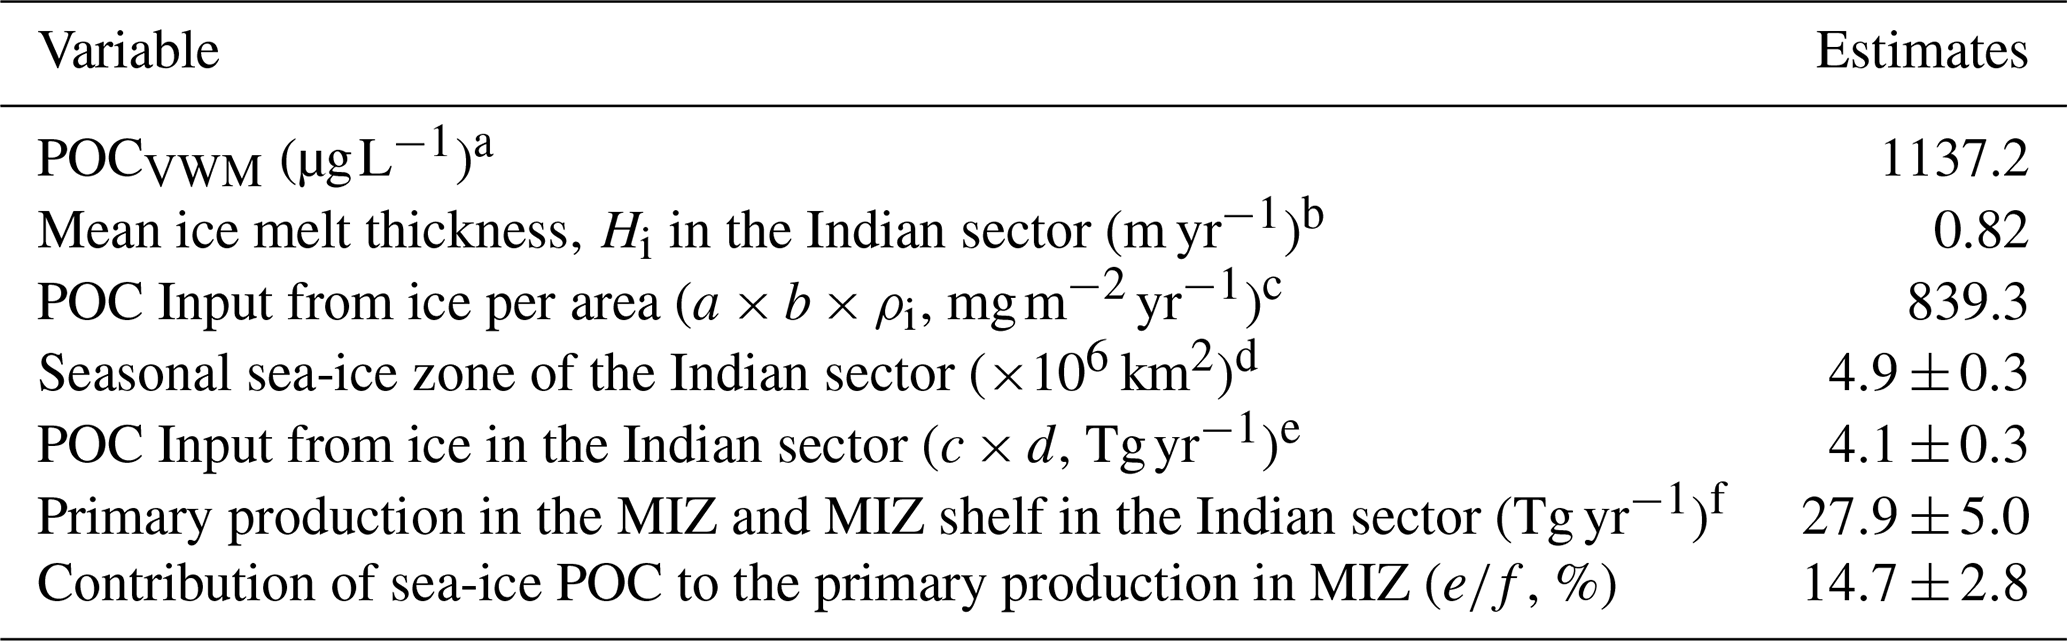
a Volume-Weighted Mean (VWM) of all sea-ice POC except newly formed ice, b Estimates from Komatsu et al. (2025), c ρi is the sea-ice density (0.90), d Parkinson (2019), e Estimated POC input in the study region, f Arrigo et al. (2008).
4.1 Spatial and temporal variabilities of sea-ice particulate organic matter
Sea ice salinity, excluding newly formed ice, was negatively correlated with the days since sea-ice formation: DSF; this is likely due to desalination associated with surface melting and brine discharge during summer, as well as snow accumulation (Eicken, 1992). Conversely, POC, PN, and Chl a concentrations gradually decreased as DSF increased (Fig. 6), although there is diversity among sea-ice samples. Our sea ice was collected during the summer season (December to February) when primary productivity is generally in a declining phase (net heterotrophy), as indicated by a decrease in total organic carbon (Dalman et al., 2025). In multi-year ice, nitrate concentration is much lower than first-year ice (Henley et al., 2023). In such environment, algal accumulation is slow, for the dissolution of diatom frustules (Si(OH)4 accumulation) surpassed the consumption by diatoms (Sahashi et al., 2022). There was a weak but significant positive correlation between POC : Chl a and DSF, suggesting that in older (high DSF) samples, sea ice algae were at the senescent stage.
In accord with the previous studies, POC : PN ratio was generally higher than that in seawater and the median for Antarctic sea ice is around 10 (Dalman et al., 2025). This is partly owing to ice algae which have high C:N ratio even in nutrient-replete condition (Gleitz and Thomas, 1993). Under nutrient (NO) limitation, POC : PN could increase to >20 (McMinn et al., 1999) and it is more pronounced in productive spring season (Roukaerts et al., 2016; Dalman et al., 2025). EPS are rich in carbon and may accumulate in older sea ice as suggested by comparison of FYI and MYI (Meiners et al., 2003). Although there was no significant relationship between DSF and POC : PN (Spearman's rank correlation test, p=0.49), inferring the combination of nutrient status and EPS affected our results.
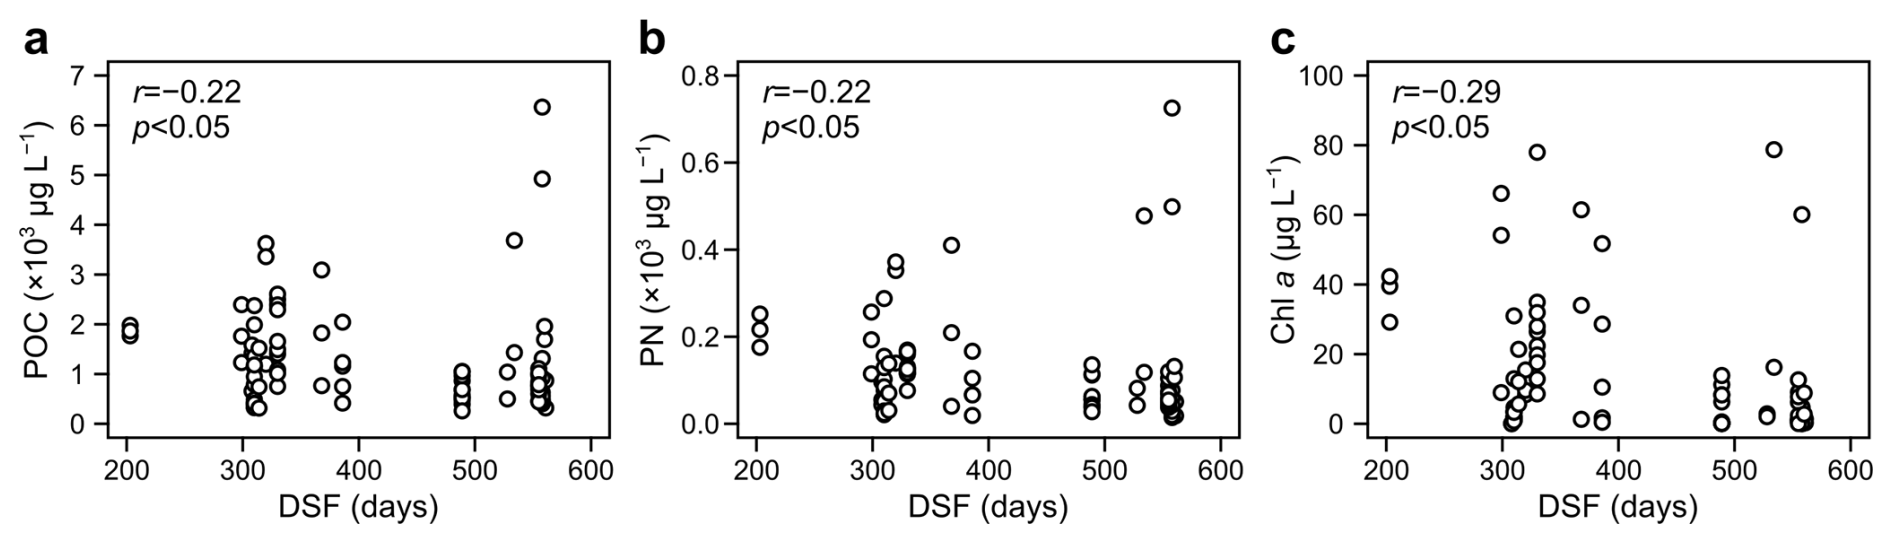
Figure 6Relationships between the days since sea-ice formation (DSF) at each station and the concentrations of POC (a), PN (b), Chl a (c) of sea ice. The Spearman's rank correlation coefficient and p values are shown in the top left.
The maximum Chl a concentration in newly formed ice in the Southern Ocean is 260.0 µg L−1 (Ito et al., 2025), while the Chl a and POC concentrations in this study were 0.2–4.0 and 246.1–1354.0 µg L−1, respectively (Fig. 3b, c). Therefore, the samples in this study were considered to have formed without active frazil ice production or phytoplankton blooms (Ito et al., 2025; Takahashi et al., 2025). Despite the low Chl a concentration, the newly formed ice exhibited high average POC : PN and POC : Chl a ratios, which were significantly higher than those of some FYI/OI samples, such as those in SC (Fig. 3e, h). This difference is likely due to differences in ice-algal composition and the selective accumulation of organic matter during sea-ice formation and growth. The newly formed ice sample from St. S138, which had the highest POC : Chl a ratio, was dominated by nanoflagellates (Takahashi et al., 2025). The POC : Chl a ratio for Phaeocystis antarctica, the predominant nanoflagellate in the Southern Ocean, ranges from 41 to 284 (Arrigo et al., 2010), and this is significantly higher than that for diatoms (approximately 37, Whitaker, 1977). In East Antarctic sea ice, diatoms dominate over nanoflagellates as the sea ice grows (Takahashi et al., 2025), suggesting that differences in algal composition contribute to the relatively high POC : Chl a ratio in newly formed ice than older ice. Another process that influences the POC : Chl a ratio is the selective incorporation of particulates during sea ice formation (Gradinger and Ikävalko, 1998; Janssens et al., 2016; Takahashi et al., 2025). Since POC incorporation into sea ice is higher than PN and small (<10 µm) algal cells (Janssens et al., 2016), the dominance of small nanoflagellates in seawater (St. S138, Takahashi et al., 2025) could enhance POC : PN and POC : Chl a ratios in newly formed ice.
4.2 Driving factors of carbon and nitrogen isotope ratios in sea ice
The δ13C of POC was ‰ for all sea ice samples, which was higher than the previously reported δ13C of surface seawater in the SIZ (−31 ‰ to −24 ‰, Espinasse et al., 2019). The δ15N of sea-ice PN (1.5±2.2 ‰) was also generally higher than summer seawater (−5 ‰ to +7 ‰, Espinasse et al., 2019). Although spatiotemporally limited, our δ13C and δ15N of surface seawater obtained in January was lower than those of sea ice ( ‰ for δ13C and ‰ for δ15N). The small variability in isotope ratios in seawater is likely owing to the narrower ranges of sampling region (50–64° S) and periods (January) compared to the previous data sets conducted in 37–70° S during June and May over several years (Espinasse et al., 2019). The isotope ratios of sea ice remained within the range previously reported for Antarctic sea ice (Rau et al., 1991; Kennedy et al., 2002; Munro et al., 2010). The stable isotope ratios of POC, in particular, varied across the observed regions, likely due to differences in sea ice organic matter and nutrient concentrations among regions (Fig. 3). This section discusses drivers of stable isotope ratios in the context of sea-ice biogeochemical parameters.
Microalgae incorporate 13C when CO2 becomes limiting; hence, δ13C of POM in sea-ice could increase under closed conditions and high algal CO2 demand (i.e., when high ice-algal biomass is reached) (Kennedy et al., 2002). According to Nomura et al. (2023), the brine volume fraction in brash ice is 16.2 %. Since this exceeds the threshold for gas permeability to the atmosphere (5 %; Golden et al., 1998), δ13C values could be distinct from those of more intact ice floes. However, our samples showed a significant positive correlation between sea-ice POC and δ13C, and high δ13C values ( ‰) were limited to high POC concentration (>2000 µg L−1), generally consistent with the previous sea-ice core observations (Kennedy et al., 2002; Munro et al., 2010) (Fig. 7). Three possible reasons for the similar isotope ratios between brash ice and ice floes are as follows: (1) brash ice reflects the history of the ice floes before they are broken, (2) there is limited exchange between sea ice and the atmosphere at the microscale, and (3) dilution of brine DIC by surface melting of brash ice. For reason 1, although there are no direct measurements of productivity in brash ice, reports indicate net heterotrophic activity in late-summer (February) sea ice (Dalman et al., 2025). Thus, the isotope ratios during earlier periods (i.e., when sea ice was not broken into brash ice) may have been recorded in our brash sea ice samples. According to the field observation in spring Antarctic sea ice, δ13C increases with algal accumulation in the very surface layer of sea ice (5 cm inside sea ice from ice–water interface, McMinn et al., 1999), which could be the reason 2). For the reason 3, pCO2 in sea ice declines with increasing brine volume fraction (Nomura et al., 2010; Geilfus et al., 2014; van der Linden et al., 2020). As pack ice breaks up into smaller pieces, it warms by approaching the temperature of seawater. As brine salinity decreases and DIC dilution in the brine progresses, CO2 can become rate-limiting in brash ice (Nomura et al., 2010). However, the brine salinity of brash ice derived from ice temperature is 27.6±4.8 (Nomura et al., 2023; Vancoppenolle et al., 2019), indicating the dilution effect is not significant to determine brash ice δ13C.
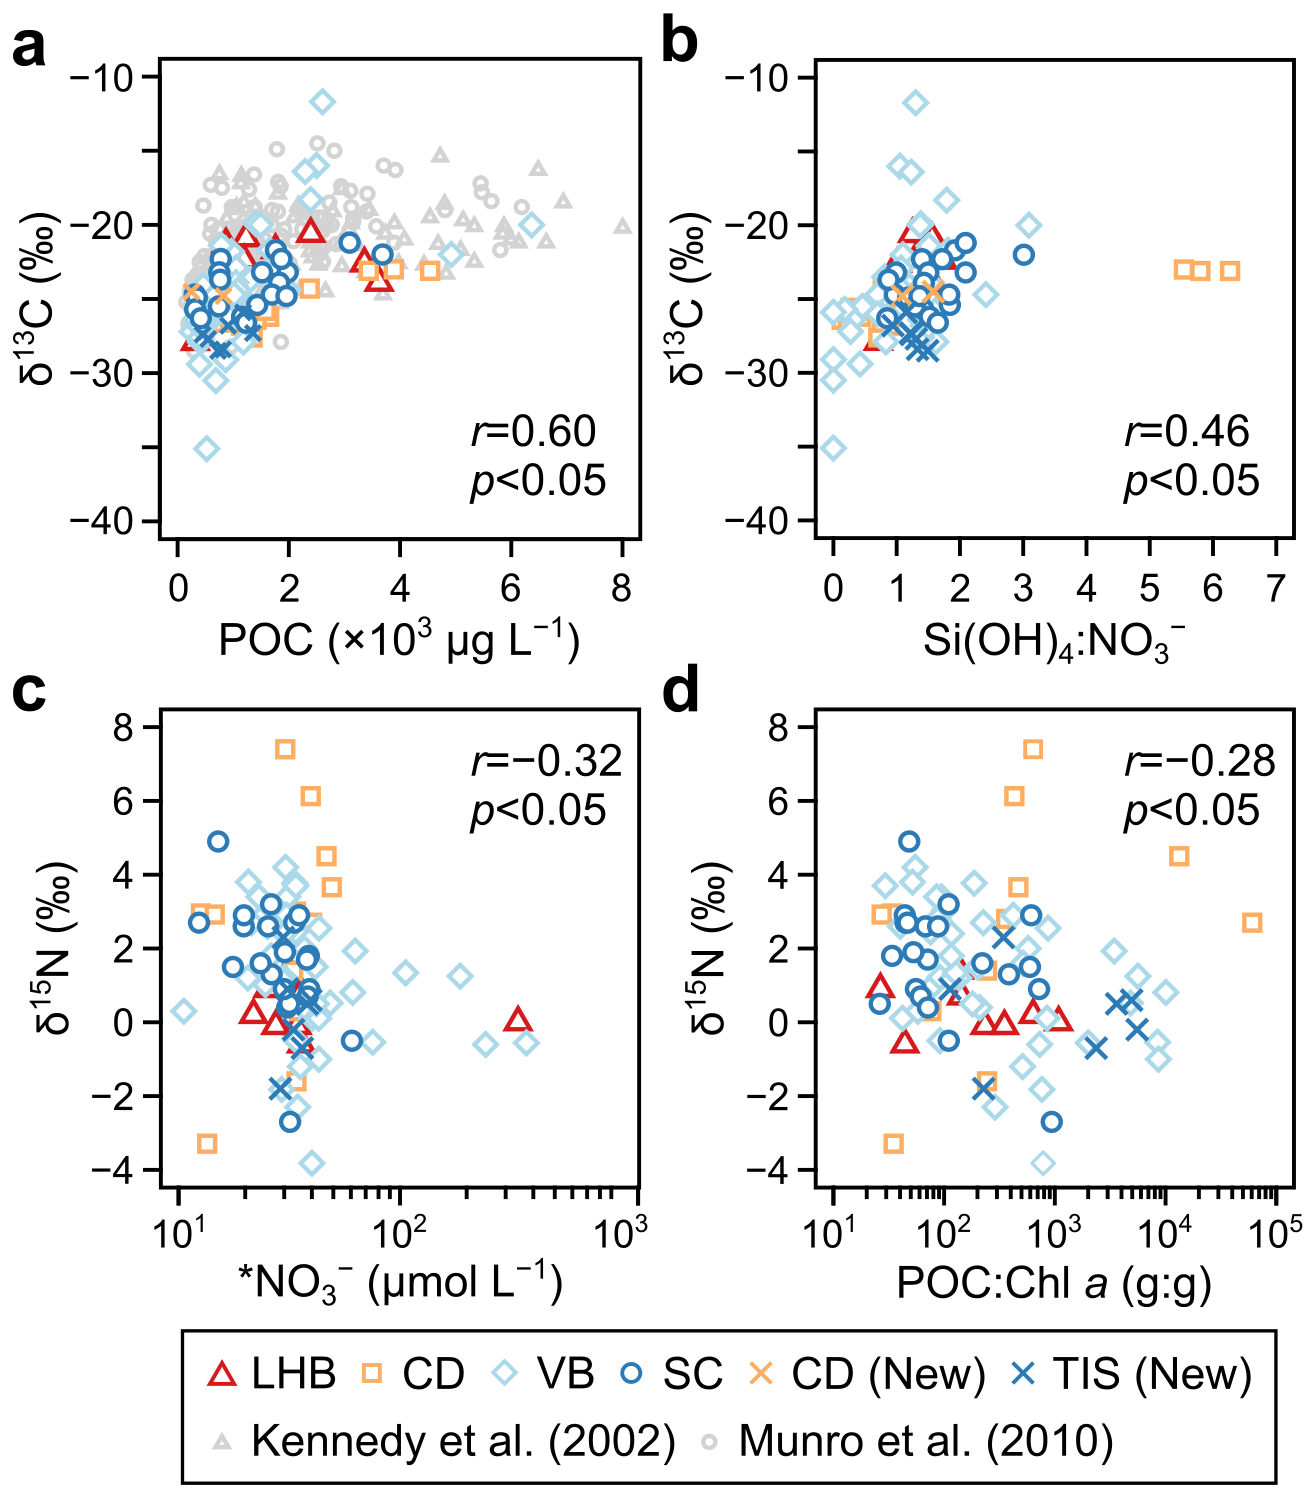
Figure 7Relationships of δ13C and POC concentration (a), δ13C and Si(OH)4 : NO (b), δ15N and *NO concentration (c), and δ15N and POC : Chl a (d). The grey triangles and circles are derived from sea-ice data of Kennedy et al. (2002) and Munro et al. (2010), respectively. The data points of Munro et al. (2010) were constructed with a permission by AGU Publications. The Spearman's rank correlation coefficient and p-values are shown in the bottom or top right. Only the data from the present study are used to calculate the correlation coefficients.
Within sea ice, PO is regenerated alongside diatom proliferation, resulting in extremely low summer ratios (Fripiat et al., 2017; Takahashi et al., 2022; Nomura et al., 2023). Due to PO regeneration, a negative correlation exists between ice-algal biomass, in particular diatoms, and ratios in brash ice (Takahashi et al., 2022). In this study, a negative correlation between δ13C and was observed, suggesting that diatoms contributed to the δ13C increase. Furthermore, previous microscopic observations of East Antarctic sea ice have confirmed that diatoms dominate during late spring and summer (Meiners et al., 2011; Takahashi et al., 2022, 2023, 2025). On the other hand, the negative correlation between δ13C and Si(OH)4 : NO suggests that different diatom species in sea ice may exhibit distinct 13C isotope fractionation (Burkhardt et al., 1999). Fischer (1991) investigated the surface POC δ13C distribution in the Scotia Sea and reported a positive correlation between the particulate Si:N ratio and δ13C. Diatoms have different silica requirements depending on the species. For example, the Si(OH)4 half-saturation constant of Corethron pennatum is more than ten times that of small diatoms (Sommer and Stabel, 1986). Large diatoms with high particulate Si:N ratios (i.e., those that induce low Si(OH)4 : NO) incorporate relatively little 13C (Burkhardt et al., 1999; Fischer, 1991), suggesting that differences in diatom taxa within sea ice may be reflected in the variation of δ13C values. However, the correlation coefficient between δ13C and Si(OH)4 : NO (r=0.46) is lower than those with POC, PN, or Chl a concentrations (r=0.60–0.69), suggesting a smaller effect on the increase in δ13C than algal accumulation.
According to studies on the stable isotope ratios of POM in seawater, nitrogen nutrient utilization reflects variations in PN δ15N (Saino and Hattori, 1980). Nomura et al. (2023) reported that despite brash ice having high permeability and exchange with seawater (>5 % brine volume fraction), the biological activity in sea ice influences the nutrient concentration. In this study, PO was highly enriched in sea ice, while Si(OH)4, known for its slow decomposition rate, was lower than in seawater (Fig. 2e, f). Due to these characteristics, even brash ice subject to melting has a distinct nutrient status within the ice compared to seawater, which likely contributed to the observed δ15N values. In this study, δ15N showed a negative correlation with *NO, suggesting that nitrogen consumption contributed to the high isotope ratio. Diatoms selectively incorporate 14N (Wada and Hattori, 1978), hence, in a closed system where NO is actively consumed, the δ15N of remaining (unconsumed) NO increases (Wu et al., 1997). The uptake of NO is supported by the negative correlations between POC, PN, and Chl a concentrations and *NO (Fig. 5).
Conversely, it is known that δ15N values of PN or dissolved inorganic nitrogen also change during organic matter decomposition and nitrification (oxidation from NH to oxidized nitrogen species) (Saino and Hattori, 1980). The POC : Chl a ratio in this study showed a negative correlation with δ15N. An increase in the POC : Chl a ratio is linked to NH accumulation from predation and excretion by heterotrophic organisms (Schnack-Schiel et al., 2004) and remineralization of particulate organic matter (Roukaerts et al., 2021). Although δ15N decreases during the oxidation of NH to NO through the fractionation by nitrifying bacteria, 15N accumulates in NO during the subsequent oxidation of NO to NO (Casciotti et al., 2003, Casciotti, 2009). Therefore, NO produced by nitrification is considered to have δ15N values similar to or lower than those of NH produced by decomposition (i.e., NH before its nitrification) (Henley et al., 2018). On the other hand, when algae directly assimilate NH, the δ15N of PN decreases due to the lower fractionation factor, −25 ‰ and −15 ‰ (negative values indicate greater incorporation of 14N into the algae) than nitrification (Waser et al., 1998). The nitrification rate in sea ice is known to correlate positively with Chl a concentration (Priscu et al., 1990). In this study, POC : Chl a was negatively correlated with Chl a concentration (Fig. 5a). That is, higher POC : Chl a ratios in sea ice may have been associated with reduced nitrification activity. The negative correlation between POC : Chl a ratio and δ15N (Fig. 7d) suggests that even if NH may be re-mineralized due to the shift from autotrophy to heterotrophy, direct NH utilization by ice algae likely outweighed assimilation after nitrification of NH (conversion of NH to NO) and resulted in low PN δ15N. This hypothesis is supported by observations showing relatively high NH uptake rates in the upper layer of Antarctic drift ice, where the POC : Chl a ratio is higher than that in the interior or bottom sections of sea ice (Roukaerts et al., 2016).
4.3 Contribution of ice algae on particulate organic carbon in sea ice
The POC : Chl a ratio varied significantly across regions, seasons, and sea-ice types (FY/OI and newly formed ice). This result indicates that carbon sources other than ice algae are also important for the POC consumed by pelagic heterotrophs in the water column during sea ice melt. The relationship between POC and Chl a concentrations (Fig. 2c) showed that sea ice with high Calgae contributions (sample plots above the IAC : Chl a = 54.4 line) was most common in sea ice with low to moderate Chl a concentrations (<30 µg L−1); this aligns with previous reports that ice algae contribute most of the carbon in sea ice with extremely high Chl a concentrations (Takahashi et al., 2023). The POC : Chl a ratio showed a tendency to increase from December to February, and the POC : Chl a ratio was found to have a significant positive correlation with days since formation (DSF). These findings indicate that from early to late summer, older sea ice contributes to a greater proportion of non-algal-derived POC.
Although the types of non-algal-derived POC were not identified, one possibility is the presence of extracellular polymeric substances (EPS) or detritus within ice (Dumont et al., 2009). Studies examining temporal changes in sea-ice EPS and Chl a concentrations have reported that EPS tends to remain within the ice longer than Chl a during the melting season (Riedel et al., 2008). In general, EPS forms biofilms that cause ice algae and bacteria to attach within brine pockets, preventing particulate matter from following brine dynamics (i.e., salinity decreases during melting). In this study, although a weak positive correlation existed between Chl a concentration and salinity, POC and PN showed no relationship with salinity. Therefore, in older sea ice, some portions of ice algae (Chl a) may have been released through brine expulsion, whereas POC likely remained on the ice. The negative correlation between the POC : Chl a ratio and Chl a concentration supports the notion that Chl a is more readily decomposed or removed from sea ice than POC or PN.
4.4 Potential impact of ice particulate organic matter during the melting season
Based on the measured sea ice POC concentrations and sea ice melt fluxes, the impact of sea ice-derived carbon on marine zooplankton as a food resource during the melt season was estimated (Table 2). When combined with primary production after ice retreat, POC from sea ice accounted for 14.7±2.8 % of primary production in the MIZ of the studied sector. It should be noted that since POC concentrations in sea ice during October–November – before the observation period of this study – were not included, calculations solely using summer sea-ice data may have resulted in an overestimation of the POC supply. This is primarily due to seasonal accumulation of organic carbon from September to February in Antarctic sea ice (Dalman et al., 2025). Nevertheless, according to satellite-based estimates by Bocquet et al. (2024), approximately 85 % of sea-ice melt (sea-ice volume reduction) occurs between December and February. Therefore, even if we excluded the POC supply from October to November, the summer POC from melted sea ice is equivalent to 12.5 % of production in the MIZ. It should be acknowledged that these estimates are averaged ones and the spatial or temporal differences are expected owing to variations in ice melt thickness (0.2–1.6 m, Komatsu et al., 2025), sea-ice POC concentration (Fig. 3c), and primary production in the MIZ (21.4–37.2 Tg yr−1, Arrigo et al., 2008).
The previous estimate of POC supply from sea ice was 0.253 Tg C yr−1 in the Weddell Sea (60° W–30° E), calculated from sea ice extent and POC concentrations converted from sea-ice Chl a (Ackley et al., 1979). When estimated per unit area, this corresponds to 35.6 , which is significantly lower than our estimate of 839.3 (Table 2). This difference may be attributed to the conservative assumptions used by Ackley et al. (1979), who averaged the low sea-ice Chl a concentration (1.2 mg m−2) over February and March. However, recent reports found an average sea-ice Chl a concentration of 6.4 mg m−2 across the Antarctic SIZ, which increases to 12.8 mg m−2 during February to March (Meiners et al., 2012). It should also be noted that the POC : Chl a ratio was 37 in the previous estimate, which is close to the lower limit observed during ice algal blooms (Whitaker, 1977). The POC : Chl a ratio can exceed 100 in spring sea ice (Roukaerts et al., 2016), and the median FYI/OI in this study was 170. If we use our ChlVWM value and POC : Chl a ratio (37) used in Ackley et al. (1979), the POCInput was estimated to be 338.6 . The input of ice-algal carbon (IACInput) using ChlVWM and IAC : Chl a was 674.6±242.5 (297.4–839.2) and our most conservative estimate was greater than that by Ackley et al. (1979), suggesting a significant underestimation caused by the measured sea-ice Chl a concentrations and the conversion factor from Chl a to POC. Given the differences between these assumptions, the POC supply from sea ice is one to two orders of magnitude higher than that estimated by Ackley et al. (1979), which is closer to our estimate.
Finally, we discuss the impact of POC supply from sea ice on the carbon content in the water column from the perspective of primary consumers. Antarctic filter-feeding euphausiids have been reported to consume ice algae which constitute 5 %–36 % (11 % on average) of the carbon in their diet in the summer MIZ (Kohlbach et al., 2019). Although it remains unknown if all sea-ice derived POM are consumed or settle to the depth or remineralized in the water column, our estimate (>14 % of MIZ production), which was temporally integrated, fell within this range, yet. In this study, the POC : PN ratio was >10 on average, indicating lower food quality than phytoplankton (surface seawater POM, 5.2±0.5 POC : PN ratio in this study). It should be noted, however, that surface seawater POC : PN ratios in this study are conservative values for they were determined in the most productive season (Janurary), when POC : PN usually reaches minimum during spring and autumn (Smith et al., 2000). Daase et al. (2011) found the growth time and body size during the nauplius stage were equivalent to those when fed high-quality (low POC : PN ratio) food (Daase et al., 2011). Therefore, POM from sea ice during the summer have a potential to support the growth of zooplankton larvae (such as copepod nauplii) and needs to be tested by grazer's isotopic signatures.
This study is the first to reveal the isotopic signatures of POM in brash sea ice and its distribution across an extensive SIZ in the Southern Ocean. When averaged for all POM data, no significant differences in sea-ice δ13C and δ15N were observed during summer. This finding suggests that the isotope ratios obtained in this study can aid estimating the food webs in the summer MIZ from previously accumulated zooplankton isotope ratio datasets (e.g., Liu and Zhou, 2025). While particulate accumulation (POM and Chl a concentrations) primarily contributed to variations in isotope ratios, nutrient uptake by ice algae also influenced them. This implies that changes in ice-algal species composition associated with variations in East Antarctic sea ice (e.g., ice thickness and snow accumulation) may alter sea-ice isotope ratios. The POC : Chl a ratio and POC concentration in sea ice showed correlations with the DSF, indicating that the quantity or quality of POM and the subsequent supply from ice also may change with sea ice age and drift. Furthermore, we estimated the carbon supply from sea ice to be 4.1±0.3 Tg C yr−1, equivalent to 14.7±2.8 % of primary production in the MIZ. Because this carbon includes contributions from sources other than ice algae themselves (40.7 % on average), it is necessary to investigate the composition of these carbon sources (lipids, EPS, etc.) and their contributions within the food web in detail.
The physico-chemical and biological data of sea ice (https://doi.org/10.17592/001.2026050701; Takahashi et al., 2026) and sea-ice motion data (https://doi.org/10.17592/001.2025112601; Kimura and Sugimura, 2013) are archived in the Arctic and Antarctic Data Archive System (ADS) managed by National Institute of Polar Research, Japan.
The supplement related to this article is available online at https://doi.org/10.5194/bg-23-7505-2026-supplement.
Conceptualization: RM, KDT; Investigation: KDT, RM, MS, KN, NK, DN, MYK, RM, NN, MI, ST, NMH, AT, NK, TT, KIO, KM, SA, MM; Formal analysis: KDT, RM, MS, KN, NK, DN, MYK, RM, NN, MI, ST, NMH, AT, NK, MK; Funding acquisition: KDT, RM, MI, NK, TT, MK, KIO, SA, MM; Writing – original draft: KDT, RM; Writing – review & editing: All authors.
The contact author has declared that none of the authors has any competing interests.
Publisher's note: Copernicus Publications remains neutral with regard to jurisdictional claims made in the text, published maps, institutional affiliations, or any other geographical representation in this paper. The authors bear the ultimate responsibility for providing appropriate place names. Views expressed in the text are those of the authors and do not necessarily reflect the views of the publisher.
We thank the captain, crew and members onboard the T/V Umitaka-maru, R/V Hakuho-maru, and ice breaker Shirase for their support during the cruises. Our appreciation goes to Tsuneo Odate for his supports on the Antarctic research expeditions. The data points from Fig. 7c were obtained and modified from Munro et al. (2010) with a permission by AGU Publications, John Wiley and Sons. An open AI tool was used to assist the translation and preparation for the first manuscript. We wish to thank anonymous reviewers and the associate editor, Yuan Shen, who provided comments to improve our manuscript.
This research has been supported by the Japan Society for the Promotion of Science (grant nos. 16101001, 17H06317, 17H06319, 20H04313, 24H00759, 20H05707, 21J14914, 22H05003, 24KJ0006, and 24K17997), the Japan Science and Technology Agency, Core Research for Evolutional Science and Technology (grant no. JPMJCR23J5), National Institute of Polar Research (grant nos. KP-308, AP-0923, AP-0939, AJ-0902, and AJ-1003), the University of Tokyo (grant nos. JURCAOSKAV19-57, JURCAOSKAV20-56, JURCAOSKAV22-50, and JURCAOSKAV23-48), and the grant for Joint Research Program of the Institute of Low Temperature Science, Hokkaido University (grant nos. 22S012, 23S017, 24S015, and 25S010), and ANID ANILLO ATE250008 and FONDECYT (POSTDOCTORADO 3260313).
This paper was edited by Yuan Shen and reviewed by Ashok Jagtap and one anonymous referee.
Ackley, S. F., Buck, K. R., and Taguchi, S.: Standing crop of algae in the sea ice of the Weddell Sea region, Deep-Sea Res. Pt. A., 26, 269–281, https://doi.org/10.1016/0198-0149(79)90024-4, 1979.
Akino, R., Nomura, D., Sahashi, R., Tozawa, M., Hatta, M., Matsuno, K., Endo, W., Shiozaki, T., Kawakami, T., Ito, M., Murata, A., and Fujiwara, A.: Characteristics of late summer Arctic brash sea ice and its melting effect on the surface-water biogeochemistry of the Chukchi Shelf and Canada Basin, Elem. Sci. Anth., 12, 00094, https://doi.org/10.1525/elementa.2023.00094, 2024.
Ardyna, M., Claustre, H., Sallée, J. B., D'Ovidio, F., Gentili, B., van Dijken, G., D'Ortenzio, F., and Arrigo, K. R.: Delineating environmental control of phytoplankton biomass and phenology in the Southern Ocean, Geophys. Res. Lett., 44, 5016–5024, https://doi.org/10.1002/2016GL072428, 2017.
Arrigo, K. R., van Dijken, G. L., and Bushinsky, S.: Primary production in the Southern Ocean, 1997–2006, J. Geophys. Res., 113, C08004, https://doi.org/10.1029/2007jc004551, 2008.
Arrigo, K. R., Mills, M. M., Kropuenske, L. R., Van Dijken, G. L., Alderkamp, A.-C., and Robinson, D. H.: Photophysiology in two major Southern Ocean phytoplankton taxa: Photosynthesis and growth of Phaeocystis antarctica and Fragilariopsis cylindrus under different irradiance levels, Integr. Comp. Biol., 50, 950–966, https://doi.org/10.1093/icb/icq021, 2010.
Becquevort, S., Dumont, I., Tison, J. L., Lannuzel, D., Sauvée, M. L., Chou, L., and Schoemann, V.: Biogeochemistry and microbial community composition in sea ice and underlying seawater off East Antarctica during early spring, Polar Biol., 32, 879–895, https://doi.org/10.1007/s00300-009-0589-2, 2009.
Bentaleb, I., Fontugne, M., Descolas-Gros, C., Girardin, C., Mariotti, A., Pierre, C., Brunet, C., and Poisson, A.: Carbon isotopic fractionation by plankton in the Southern Indian Ocean: relationship between δ13C of particulate organic carbon and dissolved carbon dioxide, J. Marine Syst., 17, 39–58, https://doi.org/10.1016/s0924-7963(98)00028-1, 1998.
Bocquet, M., Fleury, S., Rémy, F., and Piras, F.: Arctic and Antarctic sea ice thickness and volume changes from observations between 1994 and 2023, J. Geophys. Res.-Oceans, 129, e2023JC020848, https://doi.org/10.1029/2023JC020848, 2024.
Burkhardt, S., Riebesell, U., and Zondervan, I.: Stable carbon isotope fractionation by marine phytoplankton in response to daylength, growth rate, and CO2 availability, Mar. Ecol. Prog. Ser., 184, 31–41, https://doi.org/10.3354/meps184031, 1999.
Casciotti, K. L.: Inverse kinetic isotope fractionation during bacterial nitrite oxidation, Geochim. Cosmochim. Ac., 73, 2061–2076, https://doi.org/10.1016/j.gca.2008.12.022, 2009.
Casciotti, K. L., Sigman, D. M., and Ward, B. B.: Linking diversity and stable isotope fractionation in ammonia-oxidizing bacteria, Geomicrobiol. J., 20, 335–353, https://doi.org/10.1080/01490450303895, 2003.
Corkill, M., Moreau, S., Janssens, J., Fraser, A. D., Heil, P., Tison, J. L., Cougnon, E. A., Genovese, C., Kimura, N., Meiners, K. M., Wongpan, P., and Lannuzel, D.: Physical and biogeochemical properties of rotten East Antarctic summer sea ice, J. Geophys. Res.-Oceans, 128, e2022JC018875, https://doi.org/10.1029/2022JC018875, 2023.
Daase, M., Søreide, J. E., and Martynova, D.: Effects of food quality on naupliar development in Calanus glacialis at subzero temperatures, Mar. Ecol. Prog. Ser., 429, 111–124, https://doi.org/10.3354/meps09075, 2011.
Dalman, L. A., Meiners, K. M., Thomas, D. N., Deman, F., Bestley, S., Moreau, S., Arrigo, K. R., Campbell, K., Corkill, M., Cozzi, S., Delille, B., Munro, D. R., Nomura, D., Norman, L., Papadimitriou, S., Schallenberg, C., Tison, J.-L., Vancoppenolle, M., van der Merwe, P., and Fripiat, F.: Observation-based estimate of net community production in Antarctic sea ice, Geophys. Res. Lett., 52, e2024GL113717, https://doi.org/10.1029/2024GL113717, 2025.
Dieckmann, G. S., Eicken, H., Haas, C., Garrison, D. L., Gleitz, M., Lange, M., Spindler, M., Sullivan, C. W., Thomas, D. N., Weissenberger, J. N.: A compilation of data on sea ice algal standing crop from the Bellinghausen, Amundsen and Weddell Seas from 1983 to 1994, in: Antarctic sea ice: Biological Processes, Interactions and Variability, edited by: Lizotte, M. P. and Arrigo, K. R., American Geophysical Union, Washington, US, 85–92, https://doi.org/10.1029/AR073p0085, 1998.
Dumont, I., Schoemann, V., Lannuzel, D., Chou, L., Tison, J.-L., and Becquevort, S.: Distribution and characterization of dissolved and particulate organic matter in Antarctic pack ice, Polar Biol., 32, 733–750, https://doi.org/10.1007/s00300-008-0577-y, 2009.
Eicken, H.: Salinity profiles of Antarctic sea ice: Field data and model results, J. Geophys. Res., 97, 15545–15557, https://doi.org/10.1029/92JC01588, 1992.
Espinasse, B., Pakhomov, E. A., Hunt, B. P. V., and Bury, S. J.: Latitudinal gradient consistency in carbon and nitrogen stable isotopes of particulate organic matter in the Southern Ocean, Mar. Ecol. Prog. Ser., 631, 19–30. https://doi.org/10.3354/meps13137, 2019.
Fischer, G.: Stable carbon isotope ratios of plankton carbon and sinking organic matter from the Atlantic sector of the Southern Ocean, Mar. Chem., 35, 581–596, https://doi.org/10.1016/S0304-4203(09)90044-5, 1991.
Fitch, D. T. and Moore J. K.: Wind speed influence on phytoplankton bloom dynamics in the Southern Ocean marginal ice zone, J. Geophys. Res.-Oceans, 1112, C08006, https://doi.org/10.1029/2006JC004061, 2007.
Francois, R., Altabet, M. A., and Burckle, L. H.: Glacial to interglacial changes in surface nitrate utilization in the Indian sector of the Southern Ocean as recorded by sediment δ15N, Paleoceanography, 7, 589–606, https://doi.org/10.1029/92PA01573, 1992.
Fripiat, F., Sigman, D. M., Fawcett, S. E., Rafter, P. A., Weigand, M. A., and Tison, J.-L.: New insights into sea ice nitrogen biogeochemical dynamics from the nitrogen isotopes, Global Biogeochem. Cy., 28, 115–130, https://doi.org/10.1002/2013GB004729, 2014.
Fripiat, F., Meiners, K. M., Vancoppenolle, M., Papadimitriou, S., Thomas, D. N., Ackley, S. F., Arrigo, K. R., Carnat, G., Cozzi, S., Delille, B., Dieckmann, G. S., Dunbar, R. B., Fransson, A., Kattner, G., Kennedy, H., Lannuzel, D., Munro, D. R., Nomura, D., Rintala, J.-M., Schoemann, V., Stefels, J., Steiner, N., and Tison, J.-L.: Macro-nutrient concentrations in Antarctic pack ice: Overall patterns and overlooked processes, Elem. Sci. Anthropocene, 5, 13, https://doi.org/10.1525/elementa.217, 2017.
Frölicher, T. L., Sarmiento, J. L., Paynter, D. J., Dunne, J. P., Krasting, J. P., and Winton, M.: Dominance of the Southern Ocean in anthropogenic carbon and heat uptake in CMIP5 models, J. Climate, 28, 862–886, https://doi.org/10.1175/JCLI-D-14-00117.1, 2015.
Garrison, D. L., Buck, K. R., and Fryxell, G. A.: Algal assemblages in Antarctic pack ice and in ice-edge plankton, J. Phycol., 23, 564–572, https://doi.org/10.1111/j.1529-8817.1987.tb04206.x, 1987.
Geilfus, N.-X., Tison, J.-L., Ackley, S. F., Galley, R. J., Rysgaard, S., Miller, L. A., and Delille, B.: Sea ice pCO2 dynamics and air–ice CO2 fluxes during the Sea Ice Mass Balance in the Antarctic (SIMBA) experiment – Bellingshausen Sea, Antarctica, The Cryosphere, 8, 2395–2407, https://doi.org/10.5194/tc-8-2395-2014, 2014.
Gleitz, M. and Thomas, D. N.: Variation in phytoplankton standing stock, chemical composition and physiology during sea-ice formation in the southeastern Weddell Sea, Antarctica, J. Exp. Mar. Biol. Ecol., 173, 211–230, https://doi.org/10.1016/0022-0981(93)90054-R, 1993.
Golden, K. M., Ackley, S. F., and Lytle, V. I.: The Percolation Phase Transition in Sea Ice, Science, 282, 2238–2241, https://doi.org/10.1126/science.282.5397.2238, 1998.
Gosselin, M., Legendre, L., Therriault, J.-C., and Demers, S.: Light and nutrient limitation of sea-ice microalgae (Hudson Bay, Canadian Arctic), J. Phycol., 26, 220–232, https://doi.org/10.1111/j.0022-3646.1990.00220.x, 1990.
Gradinger, R. and Ikävalko, J.: Organism incorporation into newly forming Arctic sea ice in the Greenland Sea, J. Plankton Res., 20, 871–886, https://doi.org/10.1093/plankt/20.5.871, 1998.
Henley, S. F., Annett, A. L., Ganeshram, R. S., Carson, D. S., Weston, K., Crosta, X., Tait, A., Dougans, J., Fallick, A. E., and Clarke, A.: Factors influencing the stable carbon isotopic composition of suspended and sinking organic matter in the coastal Antarctic sea ice environment, Biogeosciences, 9, 1137–1157, https://doi.org/10.5194/bg-9-1137-2012, 2012.
Henley, S. F., Jones, E. M., Venables, H. J., Meredith, M. P., Firing, Y. L., Dittrich, R., Heiser, S., Stefels, J., and Dougans, J.: Macronutrient and carbon supply, uptake and cycling across the Antarctic Peninsula shelf during summer, Philos. Trans. A, 376, 20170168. https://doi.org/10.1098/rsta.2017.0168, 2018.
Henley, S. F., Cozzi, S., Fripiat, F., Lannuzel, D., Nomura, D., Thomas, D. N., Meiners, K. M., Vancoppenolle, M., Arrigo, K., Stefels, J., van Leeuwe, M., Moreau, S., Jones, E. M., Fransson, A., Chierici, M., and Delille, B.: Macronutrient biogeochemistry in Antarctic land-fast sea ice: Insights from a circumpolar data compilation, Mar. Chem., 257, 104324, https://doi.org/10.1016/j.marchem.2023.104324, 2023.
Hersbach, H., Bell, B., Berrisford, P., Biavati, G., Horányi, A., Muñoz Sabater, J., Nicolas, J., Peubey, C., Radu, R., Rozum, I., Schepers, D., Simmons, A., Soci, C., Dee, D., and Thépaut, J.-N.: ERA5 hourly data on single levels from 1940 to present, Copernicus Climate Change Service (C3S) Climate Data Store (CDS) [data set], https://doi.org/10.24381/cds.adbb2d47, 2018.
Hersbach, H., Bell, B., Berrisford, P., Hirahara, S., Horányi, A., Muñoz-Sabater, J., Nicolas, J., Peubey, C., Radu, R., Schepers, D., Simmons, A., Soci, C., Abdalla, S., Abellan, X., Balsamo, G., Bechtold, P., Biavati, G., Bidlot, J., Bonavita, M., De Chiara, G., Dahlgren, P., Dee, D., Diamantakis, M., Dragani, R., Flemming, J., Forbes, R., Fuentes, M., Geer, A., Haimberger, L., Healy, S., Hogan, R. J., Hólm, E., Janisková, M., Keeley, S., Laloyaux, P., Lopez, P., Lupu, C., Radnoti, G., de Rosnay, P., Rozum, I., Vamborg, F., Villaume, S., and Thépaut, J.-N.: The ERA5 global reanalysis, Q. J. Roy. Meteor. Soc., 146, 1999–2049, https://doi.org/10.1002/qj.3803, 2020.
Ito, M., Takahashi, K. D., Makabe, R., Hirano, D., Ohshima, K. I., Tamura, T., and Aoki, S.: Intense frazil ice production promotes high algal biomass in newly-formed sea ice. J. Geophys. Res.-Oceans, 130, e2024JC021689, https://doi.org/10.1029/2024JC021689, 2025.
Janssens, J., Meiners, K. M., Tison, J.-L., Dieckmann, G., Delille, B., Lannuzel, D., and Miller, L. A.: Incorporation of iron and organic matter into young Antarctic sea ice during its initial growth stages, Elem. Sci. Anthropocene, 4, 000123, https://doi.org/10.12952/journal.elementa.000123, 2016.
JGOFS: Protocols for the Joint Global Ocean Flux Study Core Measurements, International JGOFS Report Series, 19, https://doi.org/10.25607/OBP-1409, 1994
Jia, Z., Swadling, K., Meiners, K., Kawaguchi, S., and Virtue, P.: The zooplankton food web under East Antarctic pack ice – A stable isotope study, Deep-Sea Res. Pt. II, 13, 189–202, https://doi.org/10.1016/j.dsr2.2015.10.010, 2016.
Kennedy, H., Thomas, D. N., Kattner, G., Haas, C., and Dieckmann G. S.: Particulate organic matter in Antarctic summer sea ice: Concentration and stable isotopic composition, Mar. Ecol. Prog. Ser., 238, 1–13, https://doi.org/10.3354/meps238001, 2002.
Kimura, N.: Sea ice motion in response to surface wind and ocean current in the Southern Ocean, J. Meteor. Soc. Jpn. Ser. II, 82, 1223–1231, https://doi.org/10.2151/jmsj.2004.1223, 2004.
Kimura, N. and Sugimura, T.: Daily Polar Gridded Sea Ice Velocity, 1.00, Arctic and Antarctic Data archive System (ADS), Japan [data set], https://doi.org/10.17592/001.2025112601, 2013.
Kohlbach, D., Lange, B. A., Graeve, M., Vortkamp, M., and Flores. H.: Varying dependency of Antarctic euphausiids on ice algae- and phytoplankton-derived carbon during summer, Mar. Biol., 166, https://doi.org/10.1007/s00227-019-3527-z, 2019.
Komatsu, M., Ohshima, K. I., Mensah, V., and Nakata, K.: Mapping of sea-ice melting and net freshwater flux by sea-ice in the Southern Ocean, Commun. Earth Environ., 6, 579, https://doi.org/10.1038/s43247-025-02560-2, 2025.
Liu, Z. and Zhou, M.: Spatial variability of ice krill, Euphausia crystallorophias, diet from the Amundsen Sea to Ross Sea (Antarctica) revealed by stomach content and stable isotope analyses, Polar Biol., 48, 116, https://doi.org/10.1007/s00300-025-03438-x, 2025.
Lourey, M. J., Trull, T. W., and Tilbrook, B.: Sensitivity of delta C-13 of Southern Ocean suspended and sinking organic matter to temperature, nutrient utilization, and atmospheric CO2, Deep-Sea Res. Pt. I, 51, 281–305, https://doi.org/10.1016/j.dsr.2003.10.002, 2004.
Makabe, R., Tanimura, A., Tamura, T., Hirano, D., Shimada, K., Hashihama, F., and Fukuchi, M.: Meso-zooplankton abundance and spatial distribution off Lützow-Holm Bay during austral summer 2007–2008, Polar Sci., 12, 25–33, https://doi.org/10.1016/j.polar.2016.09.002, 2017.
McMinn, A., Skerratt, J., Trull, T., Ashworth, C., and Lizotte, M.: Nutrient stress gradient in the bottom 5 cm of fast ice, McMurdo Sound, Antarctica, Polar Biol., 21, 220–227, https://doi.org/10.1007/s003000050356, 1999.
Meiners, K., Gradinger, R., Fehling, J., Civitarese, G., and Spindler, M.: Vertical distribution of exopolymer particles in sea ice of the Fram Strait (Arctic) during autumn. Mar. Ecol. Prog. Ser., 248, 1–13, https://doi.org/10.3354/meps248001, 2003.
Meiners, K. M., Norman, L., Granskog, M. A., Krell, A., Heil, P., and Thomas, D. N.: Physico-ecobiogeochemistry of East Antarctic pack ice during the winter-spring transition, Deep-Sea Res. Pt. II, 58, 1172–1181, https://doi.org/10.1016/j.dsr2.2010.10.033, 2011.
Meiners, K. M., Vancoppenolle, M., Shanassekos, S., Dieckmann, D. S., Thomas, D. N., Tison, J.-L., Arrigo, K. R., Garrison, D., McMinn, A., Lannuzel, D., van der Merwe, P., Swadling, K. M., Smith Jr., W. O., Melnikov, I., and Raymond, B.: Chlorophyll a in Antarctic sea ice from historical ice core data, Geophys. Res. Lett., 39, 21602–21602, https://doi.org/10.1029/2012GL053478, 2012.
Miller, L. A., Fripiat, F., Else, B. G. T., Bowman, J. S., Brown, K. A., Collins, R. E., Ewert, M, Fransson, A., Gosselin, M., Lannuzel, D., Meiners, K. M., Michel, C., Nishioka, J., Nomura, D., Papadimitriou, S., Russell, L. M., Sørensen, L. L., Thomas, D. N., Tison, J.-L., van Leeuwe, M. A., Vancoppenolle, M., Wolff, E. W., and Zhou J.: Methods for biogeochemical studies of sea ice: The state of the art, caveats, and recommendations, Elem. Sci. Anth., 3, 53, https://doi.org/10.12952/journal.elementa.000038, 2015.
Mincks, S. L., Smith, C. R., Jeffreys, R. M., and Sumida, P. Y. G.: Trophic structure on the West Antarctic Peninsula shelf: Detritivory and benthic inertia revealed by δ13C and δ15N analysis, Deep-Sea Res. Pt. II, 55, 2502–2514, https://doi.org/10.1016/j.dsr2.2008.06.009, 2008.
Moreau, S., Boyd, P. W., and Struttom, P. G.: Remote assessment of the fate of phytoplankton in the Southern Ocean sea-ice zone, Nat. Commun., 11, 3108, https://doi.org/10.1038/s41467-020-16931-0, 2020.
Munro, D. R., Dunbar, R. B., Mucciarone, D. A., Arrigo, K. R., and Long, M. C.: Stable isotope composition of dissolved inorganic carbon and particulate organic carbon in sea ice from the Ross Sea, Antarctica, J. Geophys. Res.-Oceans, 115, C09005, https://doi.org/10.1029/2009JC005661, 2010.
Nakata, K., Ohshima, K. I., and Nihashi, S.: Estimation of thin ice thickness and discrimination of ice type from AMSR-E passive microwave data, IEEE T. Geosci. Remote, 57, 263–276, https://doi.org/10.1109/TGRS.2018.2853590, 2019.
Nakata, K., Ohshima, K. I., and Nihashi, S.: Mapping of active frazil for Antarctic coastal polynyas, with an estimation of sea-ice production, Geophys. Res. Lett., 48, e2020GL091353, https://doi.org/10.1029/2020GL091353, 2021.
Nomura, D., Yoshikawa-Inoue, H., Toyota, T., and Shirasawa, K.: Effects of snow, snowmelting and refreezing processes on air–sea-ice CO2 flux, J. Glaciol., 56, 262–270, https://doi.org/10.3189/002214310791968548, 2010.
Nomura, D., Sahashi, R., Takahashi, K.D., Makabe, R., Ito, M., Tozawa, M., Wongpan, P., Matsuda, R., Sano, M., Yamamoto-Kawai, M., Nojiro, N., Tachibana, A., Kurosawa, N., Moteki, M., Tamura, T., Aoki, S., and Murase, H.: Biogeochemical characteristics of brash sea ice and icebergs during summer and autumn in the Indian sector of the Southern Ocean, Prog. Oceanogr., 214, 103023, https://doi.org/10.1016/j.pocean.2023.103023, 2023.
Parkinson, C. L.: A 40-y record reveals gradual Antarctic sea ice increases followed by decreases at rates far exceeding the rates seen in the Arctic, P. Natl. Acad. Sci. USA, 116, 14414–14423, https://doi.org/10.1073/pnas.1906556116, 2019.
Priscu, J. C., Downes, M. T., Priscu, L. R., Palmisano, A. C., and Sullivan, C. W.: Dynamics of ammonium oxidizer activity and nitrous oxide (N2O) within and beneath Antarctic sea ice, Mar. Ecol. Prog. Ser., 62, 37–46, https://doi.org/10.3354/meps062037, 1990.
Rau, G. H., Takahashi, T., Des Marais, D. J., and Sullivan, C. W.: Particulate organic matter δ13C variations across the Drake Passage, J. Geophys. Res.-Oceans, 96, 15131–15135, https://doi.org/10.1029/91JC01253, 1991.
Riedel, A., Michel, C., Gosselin, M., and LeBlanc, B.: Winter–spring dynamics in sea-ice carbon cycling in the coastal Arctic Ocean, J. Mar. Sys., 74, 918–932, https://doi.org/10.1016/j.jmarsys.2008.01.003, 2008.
Roukaerts, A., Cavagna, A. J., Fripiat, F., Lannuzel, D., Meiners, K. M., and Dehairs, F.: Sea-ice algal primary production and nitrogen uptake rates off East Antarctica, Deep-Sea Res. Pt. II, 131, 140–149. https://doi.org/10.1016/J.DSR2.2015.08.007, 2016.
Roukaerts, A., Nomura, D., Deman, F., Hattori, H., Dehairs, F., and Fripiat, F.: The effect of melting treatments on the assessment of biomass and nutrients in sea ice (Saroma-ko lagoon, Hokkaido, Japan), Polar Biol., 42, 347–356, https://doi.org/10.1007/s00300-018-2426-y, 2019.
Roukaerts, A., Deman, F., der Linden, F. V., Carnat, G., Bratkic, A., Moreau, S., Lannuze, D., Dehairs, F., Delille, B., Tison, J.-L., and Fripiat, F.: The biogeochemical role of a microbial biofilm in sea ice: Antarctic landfast sea ice as a case study, Elem. Sci. Anthropocene, 9, 00134, https://doi.org/10.1525/elementa.2020.00134, 2021.
Sahashi, R., Nomura, D., Toyota, T., Tozawa, M., Ito, M., Wongpan, P., Ono, K., Simizu, D., Naoki, K., Nosaka, Y., Tamura, T., Aoki, S., and Ushio, S.: Effects of snow and remineralization processes on nutrient distributions in multi-year Antarctic landfast sea ice. J. Geophys. Res.-Oceans, 127, e2021JC018371, https://doi.org/10.1029/2021jc018371, 2022.
Saino, T. and Hattori, A.: 15N natural abundance in oceanic suspended particulate matter, Nature, 283, 752–754, https://doi.org/10.1038/283752a0, 1980.
Schmidt, K., Atkinson, A., Stübing, D., McClelland, J. W., Montoya, J. P., and Voss, M.: Trophic relationships among Southern Ocean copepods and krill: Some uses and limitations of a stable isotope approach, Limnol. Oceanogr., 48, 277–289, https://doi.org/10.4319/lo.2003.48.1.0277, 2003.
Schnack-Schiel, S. B., Dieckmann, G. S., Kattner, G., and Thomas, D. N.: Copepods in summer platelet ice in the eastern Weddell Sea, Antarctica, Polar Biol., 27, 502–506, https://doi.org/10.1007/s00300-004-0613-5, 2004.
Sedwick, P. N. and DiTullio, G. R.: Regulation of algal blooms in Antarctic shelf waters by the release of iron from melting sea ice, Geophys. Res. Lett., 24, 2515–2518, https://doi.org/10.1029/97GL02596, 1997.
Shimada, K., Makabe, R., Takao, S., and Odate, T.: Physical and chemical oceanographic data during Umitaka-maru cruise of the 58th Japanese Antarctic Research Expedition in January 2017, Polar Data J., 4, 1–29, https://doi.org/10.20575/00000010, 2020.
Smith, W. O., Marra, J., Hiscock, M. R., and Barber, R. T.: The seasonal cycle of phytoplankton biomass and primary productivity in the Ross Sea, Antarctica, Deep-Sea Res. Pt. II, 47, 3119–3140, https://doi.org/10.1016/S0967-0645(00)00061-8, 2000.
Sommer, U. and Stabel, H. H.: Near surface nutrient and phytoplankton distribution in the Drake Passage during early December, Polar Biol., 6, 107–110, https://doi.org/10.1007/BF00258261, 1986.
Sugioka, R., Matsuno, K., Takahashi, K. D., Makabe, R., Takahashi, K., Moteki, M., Odate, T., and Yamaguchi, A.: North-south changes of zooplankton community and copepods population along the 110° E line in the Indian sector of the Southern Ocean during the austral summer, Bull. Fish. Sci. Hokkaido Univ., 71, 39–50, https://doi.org/10.14943/bull.fish.71.1.39, 2021.
Suzuki, R. and Ishimaru, T.: An improved method for the determination of phytoplankton chlorophyll using N,N-dimethylformamide, J. Oceanogr. Soc. Jpn., 46, 190–194, https://doi.org/10.1007/BF02125580, 1990.
Tachibana, A., Ohkubo, Y., Matsuno, K., Takahashi, K. D., Makabe, R., and Moteki, M.: Interannual and spatial variation in small zooplankton off Vincennes Bay, East Antarctica, Polar Biol., 46, 915–932, https://doi.org/10.1007/s00300-023-03174-0, 2023.
Takahashi, K. T., Hosie, G. W., McLeod, D. J., and Kitchener, J. A.: Surface zooplankton distribution patterns during austral summer in the Indian sector of the Southern Ocean, south of Australia, Polar Sci., 5, 134–145, https://doi.org/10.1016/j.polar.2011.04.003, 2011.
Takahashi, K. D., Makabe, R., Takao, S., Kashiwase, H., and Moteki, M.: Phytoplankton and ice-algal communities in the seasonal ice zone during January (Southern Ocean, Indian sector), J. Oceanogr., 78, 409–424, https://doi.org/10.1007/s10872-022-00649-2, 2022.
Takahashi, K. D., Ito, M., Sano, M., Makabe, R., Yamamoto-Kawai, M., and Ohshima, K. I.: Summer ice-algal blooms by the diatom Fragilariopsis curta (Van Heurck) Hustedt off Cape Darnley, Southern Ocean, Diatom, 39, 12–20, https://doi.org/10.11464/diatom.39.12, 2023.
Takahashi, K. D., Ito, M., Nojiro, N., Nomura, D., Sano, M., Aoki, S., Wongpan, P., Williams, G. D., Yamamoto-Kawai, M., Tamura, T., Moteki, M., Hirawake, T., and Makabe, R.: Algal enrichment process for newly formed sea ice in the Dalton polynya off East Antarctica during the late summer–early autumn, Elem. Sci. Anthropocene, 13, 00038, https://doi.org/10.1525/elementa.2024.00038, 2025.
Takahashi, K. D., Makabe, R., Sano, M., Nakata, K., Kimura, N., Nomura, D., Yamamoto-Kawai, M., Matsuda, R., Nojiro, N., Ito, M., Takao, S., Horimoto-Miyazaki, N., Tachibana, A., Kurosawa, N., Tamura, T., Komatsu, M., Ohshima, K. I., Mizobata, K., Aoki, S., and Moteki, M.: Particulate organic carbon and nitrogen concentrations and other biogeochemical data of brash sea ice and seawater collected in the Indian Sector of the Southern Ocean in the expeditions during 2016 and 2020 summer, 1.00, Arctic Data archive System (ADS), Japan [data set], https://doi.org/10.17592/001.2026050701, 2026.
Thompson, P. A. and Calvert, S. E.: Carbon-isotope fractionation by a marine diatom: The influence of irradiance, daylength, pH, and nitrogen source, Limnol. Oceanogr., 39, 1835–1844, https://doi.org/10.4319/lo.1994.39.8.1835, 1994.
Vancoppenolle, M., Madec, G., Thomas, M., and McDougall, T. J.: Thermodynamics of sea ice phase composition revisited, J. Geophys. Res.-Oceans, 124, 615–634, https://doi.org/10.1029/2018jc014611, 2019.
van der Linden, F. C., Tison, J. L., Champenois, W., Moreau, S., Carnat, G., Kotovitch, M., Fripiat, F., Deman, F., Roukaerts, A., Dehairs, F., Wauthy, S., Lourenço, A., Vivier, F., and Haskell, T., and Delille, B.: Sea ice CO2 dynamics across seasons: Impact of processes at the interfaces, J. Geophys. Res.-Oceans, 125, https://doi.org/10.1029/2019JC015807, 2020.
van Leeuwe, M. A., Fenton, M., Davey, E., Rintala, J.-M., Jones, E. M., Meredith, M. P., and Stefels, J.: On the phenology and seeding potential of sea-ice microalgal species, Elem. Sci. Anthr., 10, 00029, https://doi.org/10.1525/elementa.2021.00029, 2022.
Wada, E. and Hattori, A.: Nitrogen isotope effects in the assimilation of inorganic nitrogenous compounds by marine diatoms, Geomicrobiol. J., 1, 85–101, https://doi.org/10.1080/01490457809377725, 1978.
Wada, E., Terazaki, M., Kabaya, Y., and Nemoto, T.: 15N and 13C abundances in the Antarctic Ocean with emphasis on the biogeochemical structure of the food web, Deep-Sea Res. Pt. A, 34, 829–841, https://doi.org/10.1016/0198-0149(87)90039-2, 1987.
Waser, N., Harrison, P., Nielsen, B., Calvert, S., and Turpin, D.: Nitrogen isotope fractionation during the uptake and assimilation of nitrate, nitrite, ammonium, and urea by a marine diatom, Limnol. Oceanogr., 43, 215–224, https://doi.org/10.4319/lo.1998.43.2.0215, 1998.
Welschmeyer, N. A.: Fluorometric analysis of chlorophyll a in the presence of chlorophyll b and pheopigments, Limnol. Oceanogr., 39, 1985–1992, https://doi.org/10.4319/lo.1994.39.8.1985, 1994.
Whitaker, T. M.: Sea ice habitats of Signy Island (South Orkneys) and their primary productivity, in: Adaptations within Antarctic Ecosystems, edited by: Llano, G. A., Gulf Publ., Houston, US, 75–82, ISBN 0872010007, 1977.
Wilson, D. L., Smith Jr., W. O., and Nelson, D. M.: Phytoplankton bloom dynamics of the western Ross Sea ice edge – I. Primary productivity and species-specific production, Deep-Sea Res. Pt. I, 33, 1375–1387, https://doi.org/10.1016/0198-0149(86)90041-5, 1986.
Wing, S. R., Leichter, J. J., Wing, L. C., Stokes, D., Genovese, S. J., McMullin, R. M., and Shatova, O. A.: Contribution of sea ice microbial production to Antarctic benthic communities is driven by sea ice dynamics and composition of functional guilds, Glob. Change Biol., 24, 3642–3653, https://doi.org/10.1111/gcb.14291, 2018.
Wu, J., Calvert, S. E., and Wong, C. S.: Nitrogen isotope variations in the subarctic northeast Pacific: relationships to nitrate utilization and trophic structure, Deep-Sea Res.-Pt. I, 44, 287–314, https://doi.org/10.1016/S0967-0637(96)00099-4, 1997.
Zúñiga, D., Sanchez-Vidal, A., Flexas, M. D. M., Carroll, D., Rufino, M. M., Spreen, G., Calafat, A., and Abrantes, F.: Sinking diatom assemblages as a key driver for deep carbon and silicon export in the Scotia Sea (Southern Ocean), Front. Earth Sci., 9, 579198, https://doi.org/10.3389/feart.2021.579198, 2021.