
the Creative Commons Attribution 4.0 License.
the Creative Commons Attribution 4.0 License.
 | 11 Nov 2026
Multi-centennial ocean biogeochemical responses to extended Shared Socioeconomic Pathways
Hidetaka Kobayashi

Tokuta Yokohata
Akitomo Yamamoto
Tomohiro Hajima
Hiroaki Tatebe
Akira Oka
Keith B. Rodgers
Despite their profound consequences for the global carbon cycle, multi-centennial ocean biogeochemical responses to anthropogenic greenhouse gas forcing remain poorly constrained. Here we investigate long-term oceanic responses to atmospheric CO2 forcing using the Model for Interdisciplinary Research on Climate, Earth System version 2 for Long-term simulations (MIROC-ES2L) Earth system model driven by extended Shared Socio-economic Pathway (SSP) scenarios through to the year 2500. Ocean–atmosphere pCO2 disequilibrium exhibits strong scenario dependence. Under the low-emission scenario SSP1–2.6, oceanic CO2 undersaturation gradually weakens and approaches near equilibrium by 2100. By contrast, under the high-emission scenario SSP5–8.5, rapid increase in atmospheric pCO2 results in increasing undersaturation of CO2 in the ocean over the 21st century. Thereafter, surface-ocean CO2 supersaturation progressively expand into the equatorial and subtropical oceans between the mid–23rd and late 25th century. The Southern Ocean remains persistently undersaturated throughout the simulations, consistent with sustained influence from deep waters that are weakly affected by anthropogenic perturbations. Under SSP5–8.5, oceanic CO2 uptake continues to increase until the late 21st century. Thereafter, it gradually weakens as surface-ocean pCO2 approaches atmospheric levels, whereas the Southern Ocean remains a persistent carbon sink throughout the simulation. Across all scenarios, early oceanic pCO2 changes are primarily driven by increases in dissolved inorganic carbon, whereas alkalinity becomes an increasingly important control from the mid–22nd century onward under SSP5–8.5. A progressive decline in the oceanic CO2 buffering capacity, driven by cumulative CO2 uptake, increases the sensitivity of surface-ocean pCO2 to additional carbon uptake. The buffering capacity approaches its effective minimum levels by the late 22nd century. In parallel, enhanced upper-ocean stratification and a slowdown of the deep overturning circulation reduce the upward transport of high alkalinity waters to the surface. This results in a decline in surface-ocean alkalinity that further enhances the influence of alkalinity on surface-ocean pCO2 during this period. Marine biological productivity and export vary significantly as a function of atmospheric CO2 trajectory. It increases under low-emission scenarios but declines under sustained high-emission scenarios. The transition between the two behaviors occurs when reaches approximately 3 times the preindustrial level and is closely associated with the weakening of the Atlantic Meridional Overturning Circulation and the resulting nutrient redistribution. Thermal stress and nutrient limitation persist in regions such as the Arctic Ocean until the late 25th century even under SSP1–2.6, indicating a centennial-scale lagged response of marine ecosystems to atmospheric CO2 forcing. In the surface ocean, marine ecosystem stress (integrating thermal and biogeochemical stressors) continues to intensify through the late 22nd century under SSP5–8.5, despite the stabilization of atmospheric pCO2, highlighting the long memory and limited reversibility of oceanic ecosystem stress.
- Article
(25073 KB) - Full-text XML
- BibTeX
- EndNote


The ocean is a major sink for anthropogenic carbon dioxide (CO2), currently absorbing about 25 % of annual global emissions; thus it plays a critical role in mitigating ongoing global warming (Friedlingstein et al., 2025). Because carbon–climate feedbacks strongly influence the climate system (Friedlingstein et al., 2006), reliable climate projections require an accurate understanding of how ocean carbon uptake responds to global warming.
Substantial progress has been made in understanding physical and biogeochemical responses of the ocean to climate change up to 2100, particularly through the Coupled Model Intercomparison Project (CMIP). According to CMIP5 multi-model means, marine ecosystems would face concurrent stressors – higher sea surface temperature (SST; +2.7 °C), lower surface pH (−0.33), reduced dissolved oxygen (−3.45 %), and declining net primary production (NPP; −8.6 %) – by the 2090s under Representative Concentration Pathway (RCP) 8.5 (Bopp et al., 2013).
Relative to CMIP5, CMIP6 models generally exhibit higher climate sensitivity (Forster et al., 2019). As a result, the magnitudes of warming, acidification, and nutrient and oxygen declines are higher in CMIP6 than in CMIP5 (Kwiatkowski et al., 2020). In CMIP6, however, despite stronger physical–chemical forcing, projected changes in NPP are smaller in magnitude than those in CMIP5, and are highly uncertain in sign. The variations among models are partly due to differences in the parameterizations of key processes such as nitrogen fixation and associated nutrient limitations; these factors alter the response of NPP even under the same scenario (Bopp et al., 2022). The increase in NPP is also driven by variability in the C:N uptake ratio of phytoplankton (Kwon et al., 2022).
Low-latitude productivity is crucial for the global carbon cycle. However, robust projection of this key variable remains a major challenge because of substantial inter-model spread (Rodgers et al., 2024). A major source of uncertainty lies in the ongoing debate over whether remote nutrient supply or local recycling processes are the dominant mechanism that sustains low-latitude productivity. Moore et al. (2018) argued that a reduction of nutrient supply from the Southern Ocean can strongly suppress low-latitude productivity. By contrast, Rodgers et al. (2024) highlighted that temperature-dependent remineralization enhances local mesopelagic nutrient recycling, together with water mass ventilation, thereby sustaining productivity under high-emission scenarios on centennial timescales. On longer timescales, however, Lee et al. (2025) showed that nutrient depletion within local mesopelagic layers can ultimately drive substantial declines in low-latitude production by 2500. Taken together, current evidence indicates that the drivers and timescales of biogeochemical responses remain uncertain and strongly model-dependent.
Recognizing this uncertainty, studies have emphasized the importance of regional processes. For example, Nakamura and Oka (2019) demonstrated that dominant controls of phytoplankton growth vary by region, underscoring the need for spatially explicit analyses. This spatial heterogeneity also characterizes air–sea CO2 fluxes and ocean acidification: low- and high-latitude regions respond to distinct drivers. In the Southern Ocean, intensifying westerlies and freshening alter circulation in ways that both enhance surface CO2 uptake and promote deep-ocean carbon storage (Ito et al., 2015). In addition, future ocean carbon uptake is projected to rely on a hybrid of solubility-driven winter uptake and biologically mediated summer uptake (Mongwe et al., 2024). By contrast, the Arctic Ocean is experiencing rapid acidification. Sea-ice retreat enhances CO2 uptake (Bates et al., 2006), with models projecting a reversal of seasonal cycles of oceanic partial pressure of CO2 () and intensified summer acidification (Orr et al., 2022). Overall, polar oceans are shaped by freshwater input and sea-ice dynamics, whereas low-latitude responses are governed primarily by stratification and nutrient supply.
Analyses using CMIP models have also advanced our understanding of present-day oceanic uptake of anthropogenic CO2 and its controls. Tjiputra et al. (2014) identified rising dissolved inorganic carbon (DIC) as the dominant contributor to higher surface over the 21st century. This is primarily due to anthropogenic CO2 uptake, whereas SST increase plays a secondary role. However, projections beyond 2100 remain scarce. For example, RCP8.5 simulations of the Community Earth System Model version 1 (CESM1) indicate that global oceanic CO2 uptake peaks around the 2080s but remains substantial through 2300 (Chikamoto and DiNezio, 2021). More recent work shows that enhanced upper-ocean stratification reduces the upward transport of high alkalinity waters. This leads to declining surface-ocean alkalinity and subsequent reduction in carbonate-system buffering capacity, thereby slowing CO2 uptake in later centuries (Chikamoto et al., 2023). Furthermore, while shoaling of CaCO3 dissolution depths weakens the carbonate pump (Planchat et al., 2024).
Given that the deep ocean carbon reservoir is much larger than the atmospheric reservoir of carbon, the long-term adjustment of the ocean carbon reservoir is central to climate trajectories. Most studies, however, do not go beyond 2100 because multi-centennial simulations with comprehensive Earth system models (ESMs) are computationally expensive. Therefore, the mechanisms shaping centennial-to-millennial responses (2100–2500) remain poorly constrained. Although Earth system models of intermediate complexity (EMICs) have enabled simulations over these long timescales (Claussen et al., 2002; Weber, 2010), the multi-centennial mechanisms of ocean carbon uptake have been much less explored using comprehensive ESMs because of their substantially greater computational cost. Recent work has demonstrated that the mechanisms governing the climate–carbon cycle feedback differ between low- and high-emission scenarios on multi-centennial timescales, highlighting the need for long-term mechanistic analyses of marine carbon uptake (Khatiwala et al., 2026). Nevertheless, few studies have focused on such analyses using comprehensive ESMs.
Improving the representation of ocean biogeochemical processes in ESMs is important not only for constraining future carbon-cycle feedbacks but also for increasing confidence in projections of marine ecosystem responses. This is because ESMs provide the physical and biogeochemical forcing for a wide range of marine ecosystem studies (e.g., Masson-Delmotte et al., 2021). For example, the Fisheries and Marine Ecosystem Model Intercomparison Project (FishMIP) is based on CMIP6 ESM outputs. Its results indicate that substantial declines in global marine animal biomass and major regional shifts in marine ecosystems are likely to occur in response to climate change (Tittensor et al., 2021). These applications of ESM output demonstrate that uncertainties in simulated ocean biogeochemistry propagate into downstream impact assessments, influencing estimates of ecosystem change and fisheries impacts.
This study aims to contribute towards improving the representation of ocean biogeochemical processes in ESMs. We analyze extended simulations from the Model for Interdisciplinary Research on Climate, Earth System version 2 for Long-term simulations (MIROC-ES2L) to investigate the centennial-to-millennial evolution of ocean biogeochemistry and the oceanic CO2 uptake under contrasting atmospheric CO2 trajectories by extending three baseline Shared Socio-economic Pathways (SSP1–2.6, SSP2–4.5, and SSP5–8.5) through the year 2500.
We address three main questions: (1) How does ocean carbon uptake evolve after atmospheric pCO2 () stabilizes? (2) What processes govern the long-term evolution of ocean carbonate chemistry and buffering capacity? (3) How do biological productivity and ecosystem stress evolve on multi-centennial timescales? To answer these questions, we contrast SSP1–2.6, in which peaks and declines early, with SSP5–8.5, in which continues to rise until 2250.
We further examine the redistribution of biogeochemical tracers across depth horizons (epipelagic, mesopelagic, and deep ocean) and climate zones (tropical, subtropical, subpolar, and polar) to distinguish rapid responses that emerge during the 21st century from slower adjustment processes that continue for centuries thereafter. Using a single comprehensive ESM and multiple emission pathways allows us to investigate the relationships between the trajectory of anthropogenic forcing and long-term adjustments of ocean carbon storage, carbonate chemistry, and marine biogeochemistry.
2.1 Model description of the MIROC-ES2L and its ocean biogeochemical component
In this study, we use the MIROC-ES2L, which is an Earth system model that participated in CMIP6 (Hajima et al., 2020a). The physical core of MIROC-ES2L is MIROC 5.2, which interactively couples the Center for Climate System Research–National Institute for Environmental Studies atmospheric general circulation model (CCSR-NIES AGCM) (Numaguti et al., 1997), an online aerosol model (Spectral Radiation-Transport Model for Aerosol Species – SPRINTARS) (Takemura et al., 2000; Takemura, 2005), a coupled sea-ice–ocean general circulation model (CCSR Ocean Component – COCO) (Hasumi, 2006), and a land surface physical model (Minimal Advanced Treatments of Surface Interaction and Runoff – MATSIRO) (Takata et al., 2003). The biogeochemical components of land and ocean are represented by the Vegetation Integrative SImulator for Trace gases (VISIT-e) (Ito and Inatomi, 2012; Hajima et al., 2020a) and the Ocean ecosystem component embedded within the ocean circulation model (OECO2) (Yoshikawa et al., 2008; Watanabe et al., 2011; Hajima et al., 2020a), respectively. The atmospheric model has 40 vertical levels up to 3 hPa and a cutoff wavenumber of T42. The ocean model is in a horizontal tripolar coordinate system. A spherical coordinate system is used south of 63 N, with a longitude grid spacing of 1°, but meridian spacing varies from about 0.5° near the equator to 1° at mid-latitudes. The hybrid σ-z coordinate system has 62 vertical layers.
The OECO2 includes two types of phytoplankton (normal non-diazotrophic phytoplankton and diazotrophic phytoplankton), zooplankton, particulate detritus, nitrate, phosphate, dissolved iron, and dissolved oxygen. Atmospheric nitrogen and iron deposition, inorganic nitrogen and phosphorus input from rivers, dissolved iron from continental shelves and hydrothermal vents, and biological nitrogen fixation are considered as external nutrient inputs in OECO2. A land surface biogeochemical model is coupled with a river routine that can compute inorganic nitrogen transport from soil to ocean. In addition to river discharge, fertilizer, atmospheric nitrogen deposition, and land use changes, which are prescribed in the forcing data, affect riverine nitrogen fluxes. Riverine phosphorus flux from land to ocean is diagnosed from nitrogen fluxes using the Redfield ratio (). Nitrogen deposition to land and ocean is prescribed in forcing data. Atmospheric iron deposition is predicted on the basis of dust simulated by SPRINTARS and data from biomass, fossil fuel, and biofuel combustion emissions datasets.
The equilibrium climate sensitivity (ECS) of this version of the model has been diagnosed using Gregory's method (Gregory et al., 2004) and is reported to be 2.66 K (Tsutsui, 2020; Ohgaito et al., 2021). The transient climate response to cumulative carbon emissions (TCRE) of MIROC-ES2L is 1.3 °C per 1000 Pg C (MacDougall et al., 2020; Hajima et al., 2020a), which lies within the likely range estimated by the Intergovernmental Panel on Climate Change (IPCC). Within the range of ECS values of the CMIP6 models, the ECS of MIROC-ES2L is relatively modest.
2.2 Extended Shared Socioeconomic Pathways scenarios and model experimental design
Anthropogenic greenhouse gas emissions, quantified under the Shared Socioeconomic Pathways (SSP) scenarios, are the primary drivers of current and future climate change in climate model simulations, with CO2 being the dominant contributor to radiative forcing. The SSPs harmonize projections of , ranging from approximately 393 ppm in 2015 to over 2000 ppm by 2250. They reflect a range of possible futures based on varying societal and policy choices (Figs. 1a and A1) (Meinshausen et al., 2020).
In this study, we use the extended SSPs, which contain projections of greenhouse gas concentrations up to 2500, to investigate the long-term response of the climate and carbon cycle. Eight extended scenarios are employed for concentration-driven simulations of MIROC-ES2L: SSP1–1.9, SSP1–2.6, SSP2–4.5, SSP3–7.0, SSP4–3.4, SSP4–6.0, SSP5–3.4–OS, and SSP5–8.5 (Fig. A1). This paper primarily focuses on three scenarios – SSP1–2.6, SSP2–4.5, and SSP5–8.5 – representing low, intermediate, and high emission pathways, respectively.
By 2500, net-zero emissions will be achieved across all the extended scenarios; begins to decrease after 2250 even in the high-emission scenario. In the MIROC-ES2L experiment driven by these extended scenarios, global mean surface temperatures (GMST) show a tendency to stabilize from around 2250. Whereas the decline in initiates global cooling, the continued warming of the deep ocean induces a gradual rise in surface air temperature, suggesting complex transient behavior beyond simple radiative response. The long-term evolution of the physical ocean state is summarized in Appendix B.
Additionally, changes in GMST levels are associated with non-linear and potentially irreversible responses in the climate system, such as tipping points in sea-ice extent, abrupt changes in El Niño–Southern Oscillation (ENSO) behavior, cloud regimes, and polar climate dynamics, as well as irreversibility in the Atlantic Meridional Overturning Circulation (AMOC) (Lenton et al., 2008; Weijer et al., 2019; Armstrong McKay et al., 2022). Notably, using the same MIROC-ES2L extended SSP simulations, Hayashi et al. (2026) demonstrated non-monotonic changes in ENSO characteristics with increasing global warming levels.
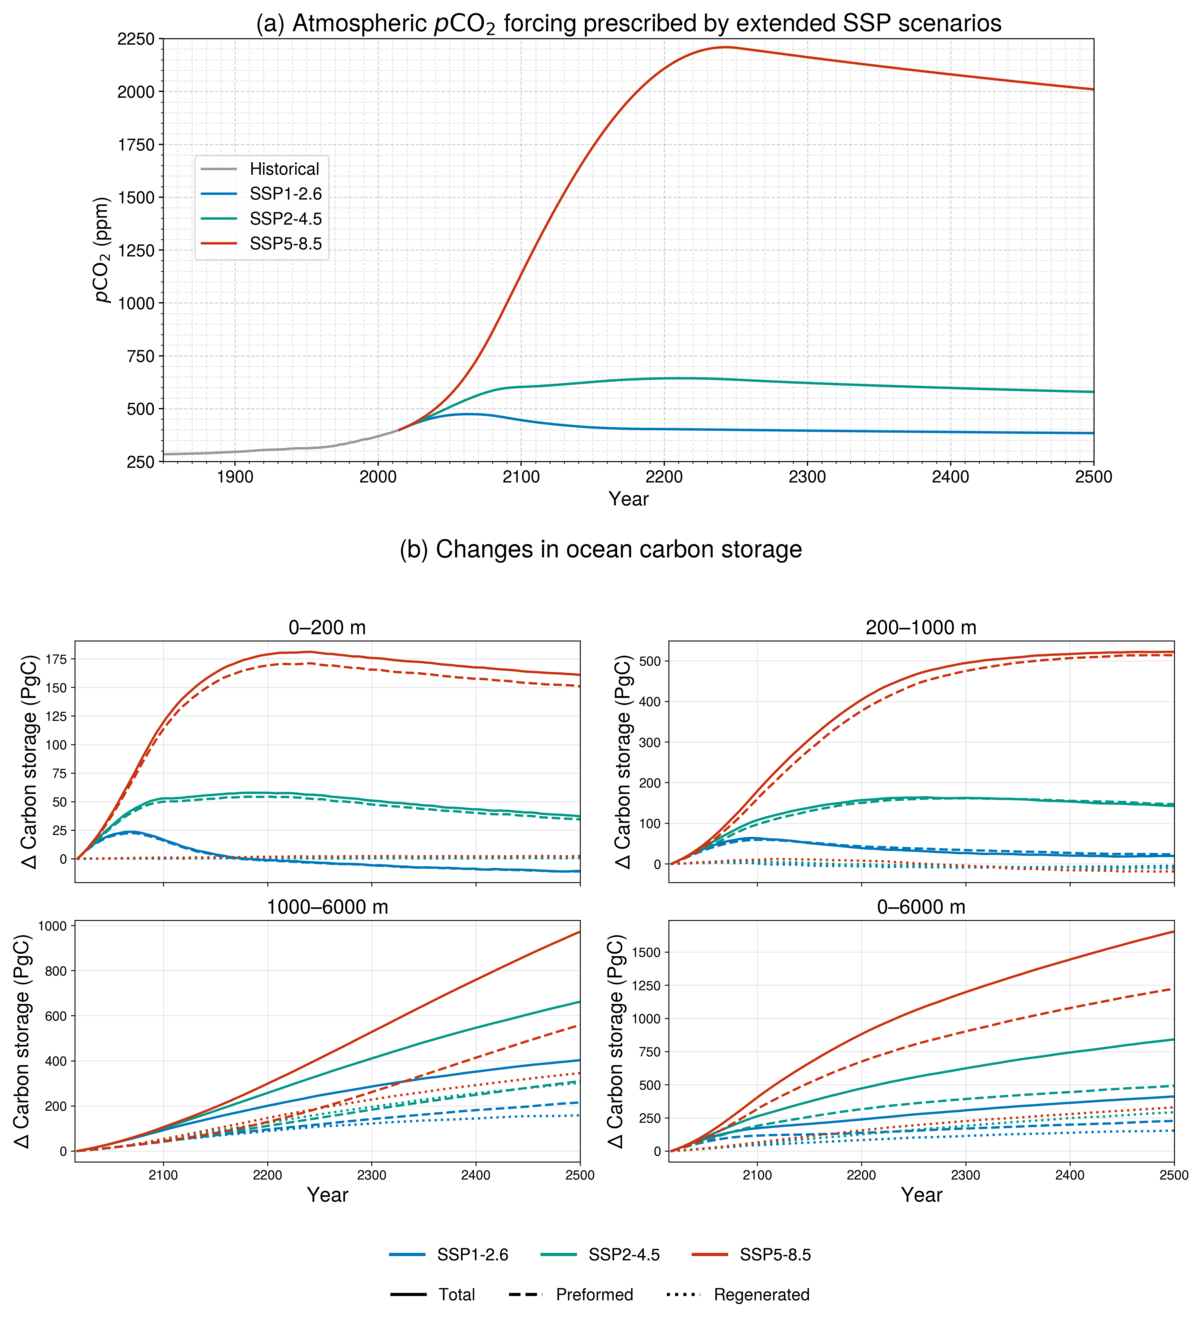
Figure 1Surface carbon rapidly adjusts to atmospheric forcing, whereas the deep ocean remains committed to centuries of carbon accumulation. (a) Atmospheric pCO2 forcings prescribed by the extended SSP scenarios that were used in our analyses. (b) Depth-integrated anthropogenic carbon inventory (unit: PgC) in three ocean layers (0–200, 200–1000, and 1000–6000 m) and the global ocean, simulated under the extended SSP scenarios (SSP1–2.6, SSP2–4.5, and SSP5–8.5). The anthropogenic carbon inventory is further partitioned into preformed (dashed lines) and regenerated (dotted lines) components.
2.3 Isolation of factors that change oceanic partial pressure of CO2
The oceanic partial pressure of CO2 is determined by temperature, salinity, DIC, and total alkalinity (Sarmiento and Gruber, 2006). Accordingly, the tendency of is governed by the tendencies of these four variables. The tendency of can be decomposed as follows:
The terms on the right-hand side of Eq. (1) represent the contributions from temperature, salinity, DIC, and alkalinity, respectively. Contributions for each year are computed using annual mean values of . In this study, we apply this decomposition to analyze the drivers of the temporal changes in .
Further decomposition of the temperature and salinity terms is given by:
The sensitivities are °C−1 and (Sarmiento and Gruber, 2006).
3.1 Centennial-scale changes in ocean biogeochemistry
3.1.1 Anthropogenic carbon accumulation and dissolved inorganic carbon redistribution
The temporal evolutions of depth-weighted time series of anthropogenic carbon storage and DIC are depth-dependent. They are characterized by a rapid, scenario-sensitive surface adjustment, a delayed yet sustained mesopelagic response, and a monotonic deep-ocean increase across all scenarios (Figs. 1b and A2). In the low-emission (e.g., SSP1–1.9, SSP1–2.6) and overshoot (SSP5–3.4-OS) scenarios, surface DIC stabilizes at approximately historical levels once begins to decline, whereas deep-ocean DIC continues to increase throughout the simulation, reflecting the long adjustment timescales of ocean carbon uptake (Fig. A2).
In the upper ocean (0–200 m), anthropogenic carbon storage and DIC closely follow . Both increase rapidly during the historical period and projections vary according to scenario after approximately 2100. Under SSP1–2.6, surface DIC reaches a maximum during the 21st century before gradually decreasing toward historical levels. Under SSP2–4.5, DIC remains elevated despite a slow decline. By contrast, under SSP5–8.5, anthropogenic carbon storage and DIC increase rapidly throughout the 21st century and remain substantially above historical levels thereafter (Figs. 1b and A2).
Between 200 and 1000 m, DIC concentrations eventually stabilize or gradually decline under the low-emission and overshoot scenarios, whereas they continue to increase or remain elevated under the high-emission scenario. Partitioning anthropogenic carbon storage into preformed and regenerated components using apparent oxygen utilization shows that the long-term increase is dominated by the preformed component. Nevertheless, the regenerated component also increases under all scenarios (Fig. 1b). This delayed response is consistent with slow ventilation and the long residence times of intermediate waters (see Appendix B and Fig. A3).
Below 1000 m, both anthropogenic carbon storage and DIC continue to increase monotonically through 2500, with no indication of reversal in any scenario. This persistent deep-ocean accumulation despite stabilization or decline of reflects substantial oceanic inertia and the slow downward propagation of anthropogenic carbon.
Taken together, these results demonstrate a pronounced vertical contrast in ocean carbon redistribution. Although emission mitigation can halt or reverse changes in the surface ocean, anthropogenic carbon continues to accumulate in the deep ocean over multi-centennial timescales, committing the ocean carbon reservoir to prolonged adjustment long after atmospheric forcing begins to stabilize.
3.1.2 Biological productivity and nutrient redistribution
The export of carbon from the euphotic zone is a key component of the ocean carbon cycle, influencing the transfer and storage of carbon in the deep ocean. Long-term responses of primary production and the vertical export of detritus at 100 m vary according to scenario, with sustained increase in some scenarios and pronounced declines in others (Fig. 2a and b).
Under low-emission scenarios (SSP1–2.6 and SSP2–4.5), biological productivity increases approximately linearly between the beginning of the 21st century and 2500. By contrast, under the high-emission scenario SSP5–8.5, biological productivity is projected to decline by approximately 5 % by the early 22nd century, with only limited recovery thereafter.
The temporal evolution of detritus export is influenced by a complex interplay of environmental factors, including temperature, light availability, and nutrient concentrations, whereas the basin-scale distributions of these variables are reshaped by changes in ocean circulation. In particular, weakening of the AMOC (Fig. A3) reduces the upward transport of nutrients to the North Atlantic surface ocean, leading to lower surface macronutrient concentrations (Fig. A4) and a suppression of detritus export (Fig. 2d). Meanwhile, nutrients become increasingly trapped within the lower overturning cell associated with Antarctic Bottom Water (AABW). This leads to a pronounced decline in surface and subsurface nutrient concentrations in the Pacific Ocean after 2250 under SSP5–8.5.
The relationships between , detritus export, and AMOC strength are consistent with the mechanisms described above (Fig. 3). Increasing is associated with progressive weakening of the AMOC and reduction in detritus export. In particular, detritus export decreases below its preindustrial level when reaches approximately 3 times the preindustrial concentration (Fig. 3a).
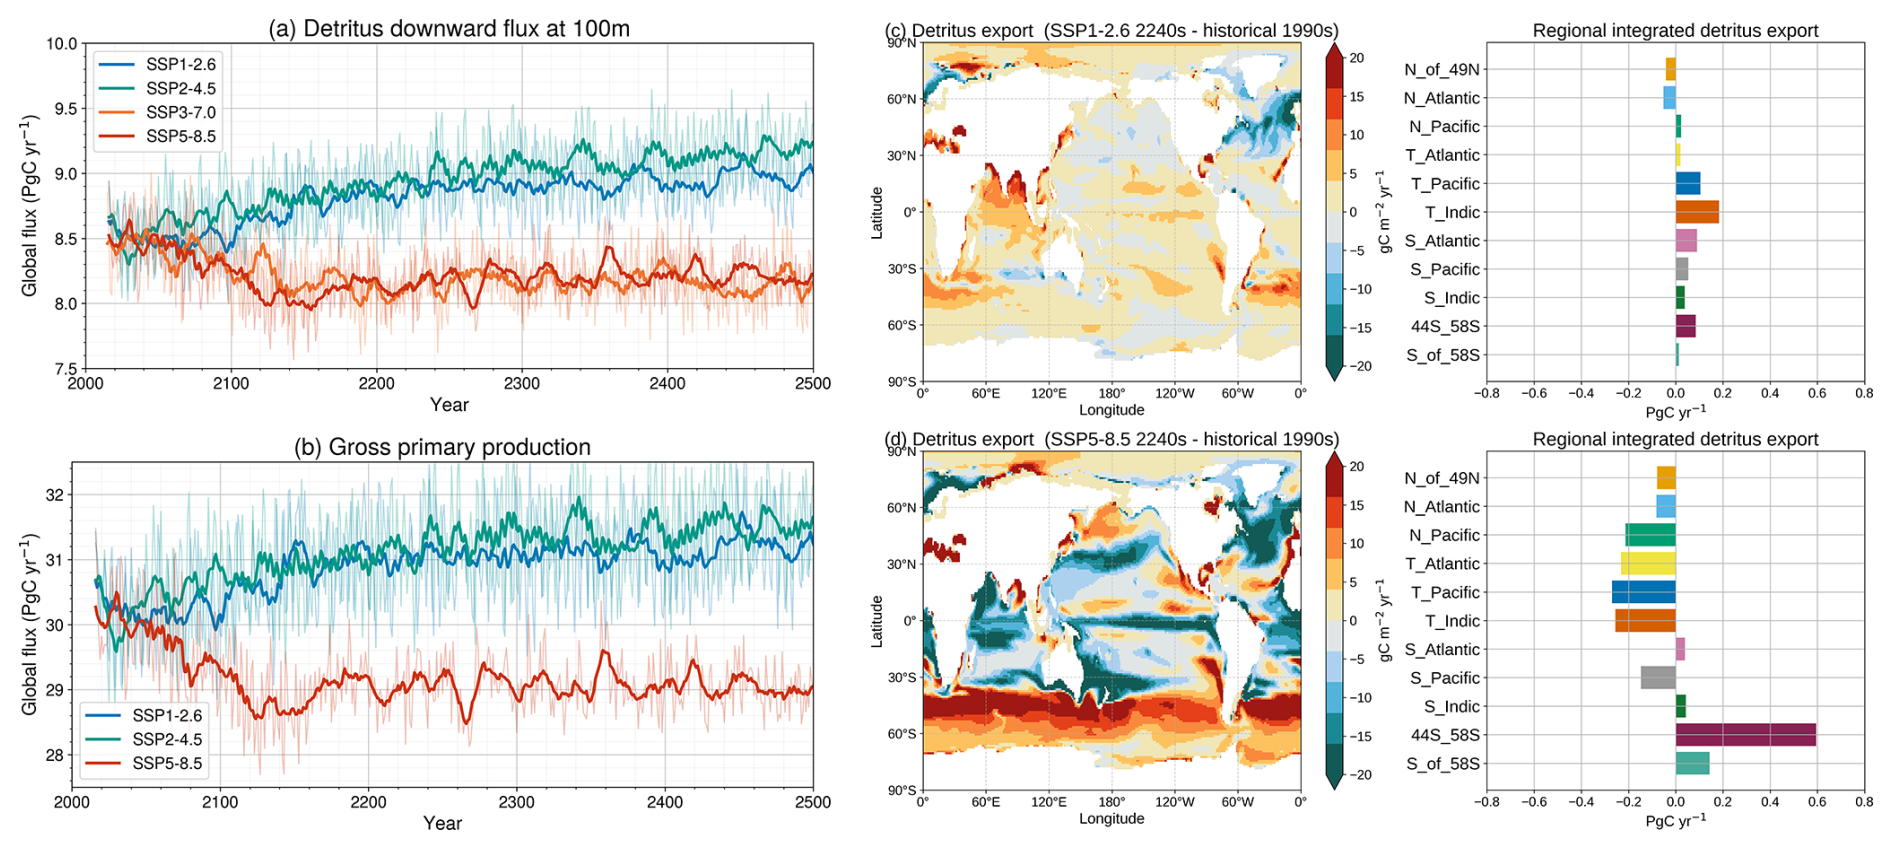
Figure 2Future biological productivity diverges sharply across emission pathways. (a) Detritus downward flux at the depth of 100 m (unit: Pg C yr−1) simulated under SSP1–2.6, SSP2–4.5, and SSP5–8.5. Thick lines represent 10-year running means, whereas thin lines indicate annual-mean values. (b) Gross primary production (unit: Pg C yr−1) simulated under SSP1–2.6, SSP2–4.5, and SSP5–8.5. Thick lines represent 10-year running means, whereas thin lines indicate annual values. Spatial changes in detritus downward flux at the depth of 100 m (unit: ), calculated as the difference between the values from the 2240s and the historical values from the 1990s under (c) SSP1–2.6 and (d) SSP5–8.5. The bar plots exhibit integrated air-sea CO2 fluxes over the regions (unit: Pg C yr−1) used in Mikaloff Fletcher et al. (2007).
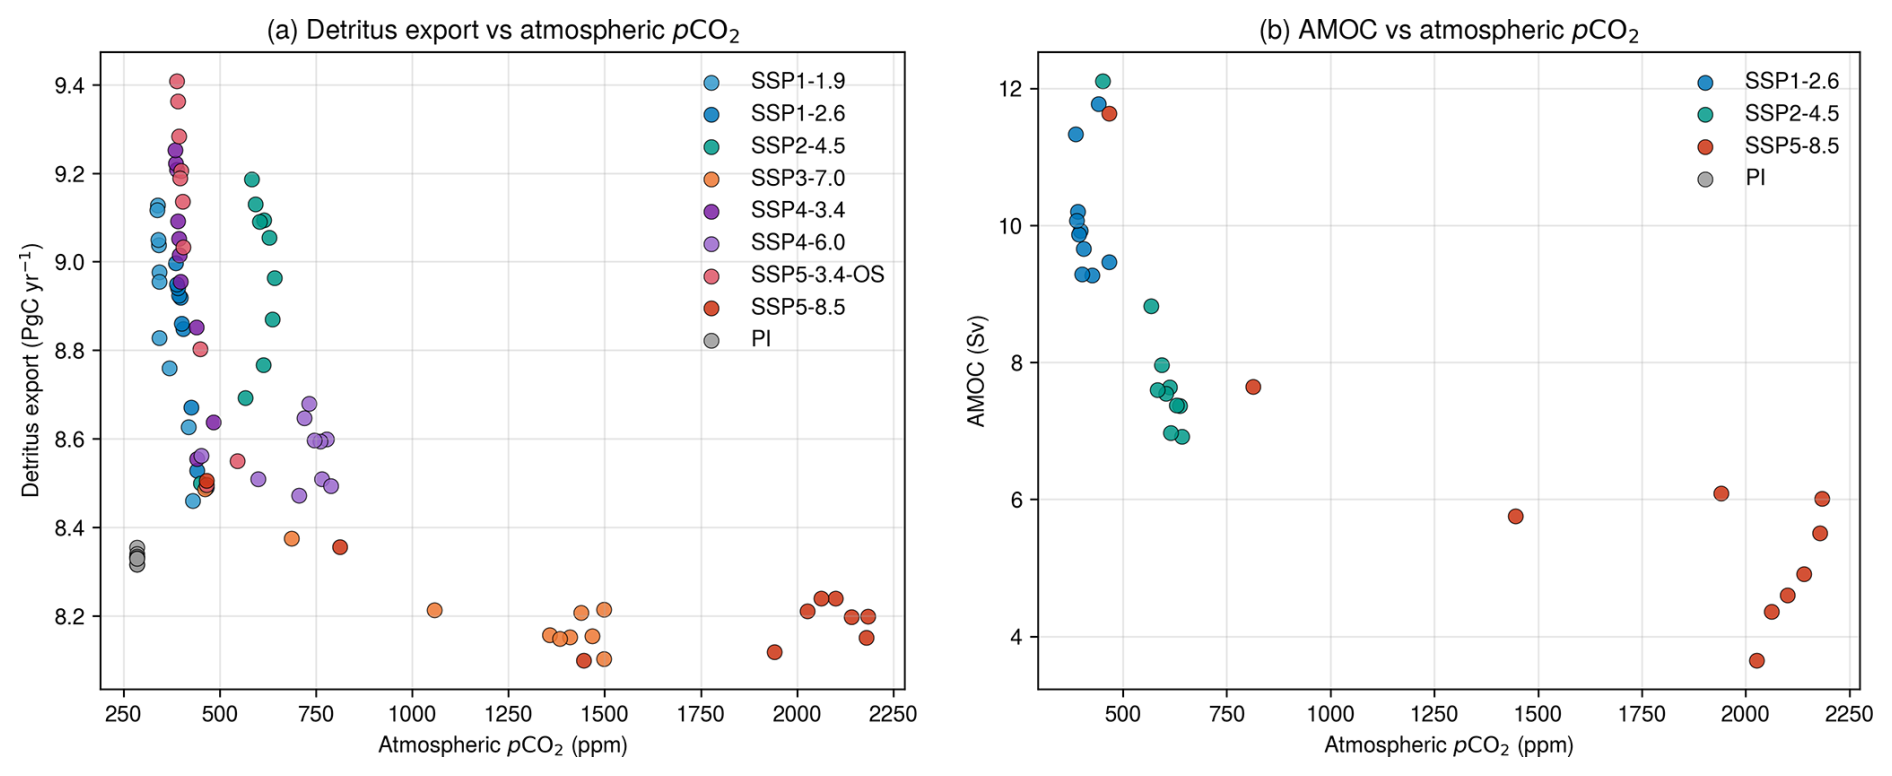
Figure 3Atmospheric pCO2 exhibits a strong negative relationship with organic carbon export, which is in turn closely linked to the strength of the AMOC. (a) Scatter plot showing the relationship between (ppm) and organic carbon export (PgC yr−1). Each point represents a 50-year mean (2015–2050, 2051–2100, …, 2451–2500) simulated under the extended SSP scenarios. (b) Scatter plot showing the relationship between (ppm) and the maximum AMOC strength (Sv). Each point represents a 50-year mean (2015–2050, 2051–2100, …, 2451–2500) simulated under the extended SSP scenarios.
3.2 Processes controlling the ocean carbon sink
3.2.1 Evolution of surface-ocean partial pressure of CO2
Across the different scenarios, begins to decline under the prescribed forcing by 2250 (Fig. 1a). Subsequently, global mean temperature stabilizes (Fig. A5). Long-term projections indicate leveling off of both and temperature but continued dynamic responses of the ocean carbon cycle to the prescribed forcing. The oceanic pCO2 in the surface ocean continues to vary over the long term in response to the physical and biogeochemical changes in the ocean. Under the extended SSP scenarios, surface generally follows the trajectory of , with relatively small differences across latitudes (Figs. 1 and A6)
3.2.2 Air–sea difference in partial pressure of CO2
Changes in surface strongly affect the air–sea difference in pCO2, defined as . Negative values indicate that the surface ocean is undersaturated with respect to the atmosphere and therefore favors oceanic CO2 uptake, whereas positive values imply supersaturation and potential outgassing.
At the global scale (Fig. 4a and b), the temporal evolution of ΔpCO2 differs markedly between scenarios. From the beginning of the 21st century to around 2100, ΔpCO2 increases from approximately −10 to nearly 0 ppm under SSP1–2.6, reflecting the relatively slow increase in . By contrast, under SSP5–8.5, ΔpCO2 decreases from approximately −10 to about −15 ppm by around 2080, indicating that the rapid rise in outpaces the increase in surface-ocean pCO2. After approximately 2080, ΔpCO2 begins to increase as surface gradually catches up with atmospheric forcing.
The two scenarios also differ in terms of the evolution of the spatial distribution of ΔpCO2 (Fig. 4c and d). Under SSP1–2.6, positive ΔpCO2 remains largely confined to the equatorial Pacific throughout the simulation. By contrast, under SSP5–8.5, positive ΔpCO2 progressively expands across the equatorial and subtropical oceans during the 21st century. By the end of the 22nd century, supersaturated waters extend over much of the subtropical gyres and subsequently spread into the Northern Hemisphere subpolar oceans during the late 23rd century. This poleward expansion indicates that surface in increasingly large areas of the surface ocean approaches equilibrium with, or exceeds, under sustained high emissions.
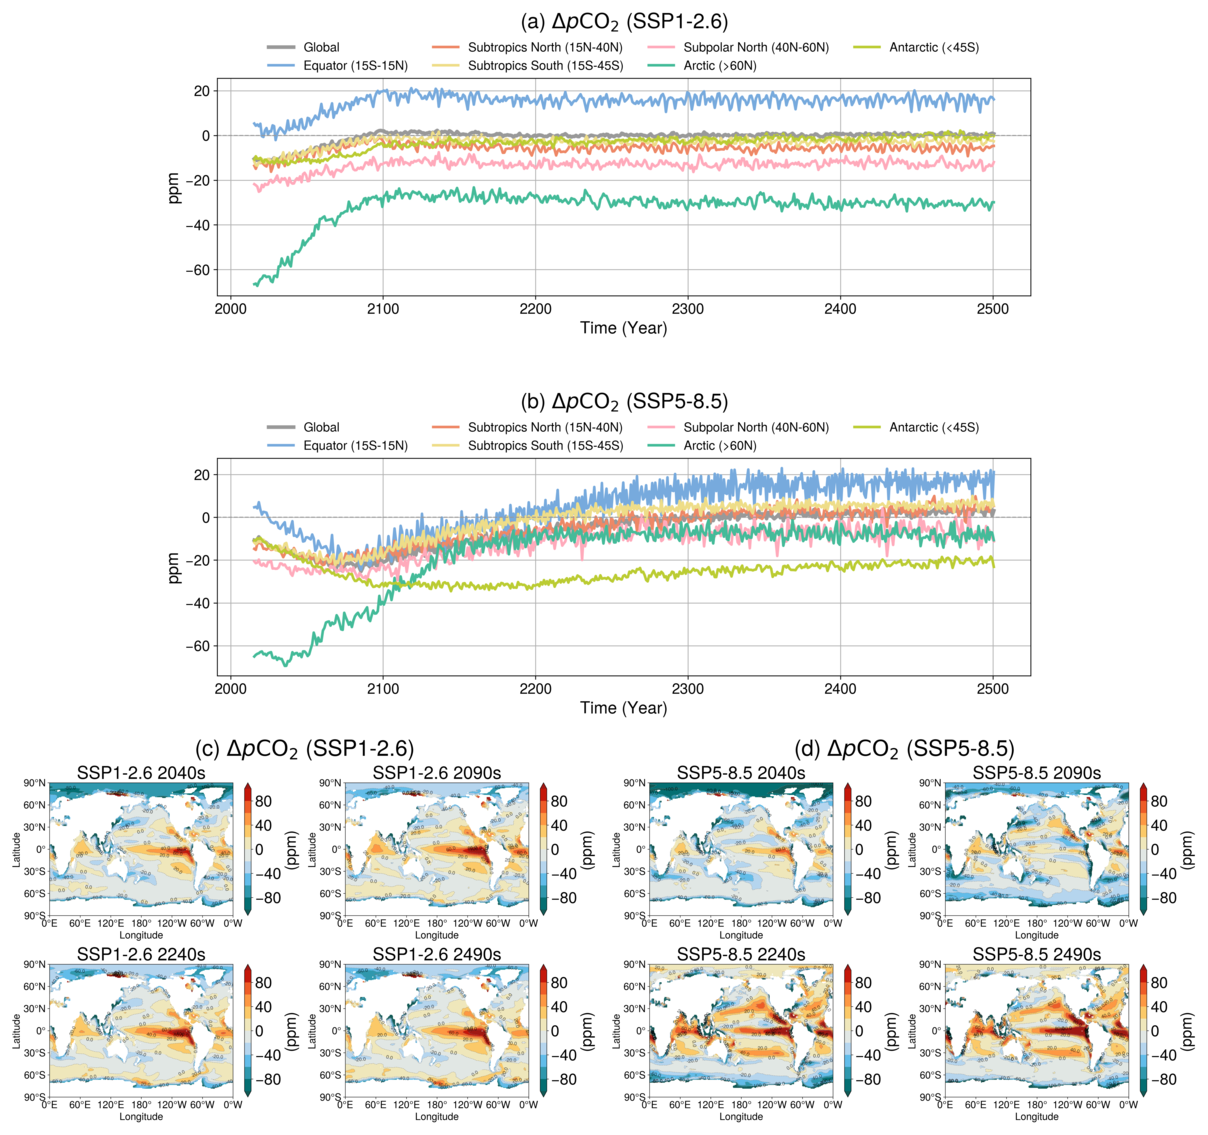
Figure 4Under SSP5–8.5, oceanic pCO2 exceeds atmospheric pCO2 at low latitudes, whereas the opposite applies in the Southern Ocean. Annual-mean changes in the ocean-atmosphere pCO2 difference (ΔpCO2, unit: ppm) by latitude band, simulated under (a) SSP1–2.6 and (b) SSP5–8.5. Positive values indicate that oceanic pCO2 exceeds atmospheric pCO2, whereas negative values indicate the opposite. Colored lines represent different latitude bands as follows: gray (global mean), dark blue (equatorial: 15° S–15° N), orange (northern subtropics: 15–40° N), yellow (southern subtropics: 15–45° S), pink (northern subpolar: 40–60° N), green (Arctic: >60° N), and light green (Antarctic: <45° S). Annual-mean ΔpCO2 for (c) SSP1–2.6 and (d) SSP5–8.5. Panels show the decadal means for the 2040s, 2090s, 2240s, and 2490s.
3.2.3 Air–sea CO2 flux
The temporal evolution of the simulated air–sea CO2 flux broadly follows that of ΔpCO2 (Fig. 5). Under SSP5–8.5, oceanic CO2 uptake increases throughout the 21st century, reaches a maximum near the end of the century, and gradually decreases thereafter. This evolution is consistent with the temporal changes in ΔpCO2, indicating that changes in the air–sea pCO2 gradient dominate the long-term evolution of the global ocean carbon sink. By contrast, changes in the air–sea CO2 flux remain comparatively small under SSP1–2.6.
The spatial distribution of the air–sea CO2 flux differs in several important aspects from that of ΔpCO2 (Figs. 5c–d and 4c–d). Under SSP1–2.6, oceanic CO2 uptake is maintained over much of the extratropical ocean, whereas outgassing remains largely confined to low latitudes. Under SSP5–8.5, positive ΔpCO2 expands across much of the tropical and subtropical oceans, but this expansion is not accompanied by a corresponding increase in air–sea CO2 outgassing. Instead, the strongest outgassing is confined in the region near the equatorial oceans.
The Southern Ocean remains a particularly strong carbon sink throughout the SSP5–8.5 simulation. Although the spatial distribution of the air–sea CO2 flux broadly follows that of ΔpCO2, the Southern Ocean exhibits substantially stronger uptake than would be inferred from ΔpCO2 alone. This regional enhancement is consistent with the persistently strong westerly winds over the Southern Ocean (Fig. A7), which may enhance air–sea gas exchange.
The persistence of oceanic carbon uptake under SSP5–8.5 is consistent with the multi-model results of Koven et al. (2022), which showed that the global ocean remains a carbon sink under sustained high ; it transitions to a carbon source primarily under concentration-driven overshoot scenarios with declining . The sustained Southern Ocean carbon sink that is present in our simulations is therefore consistent with this broader long-term behavior of the global ocean carbon cycle.
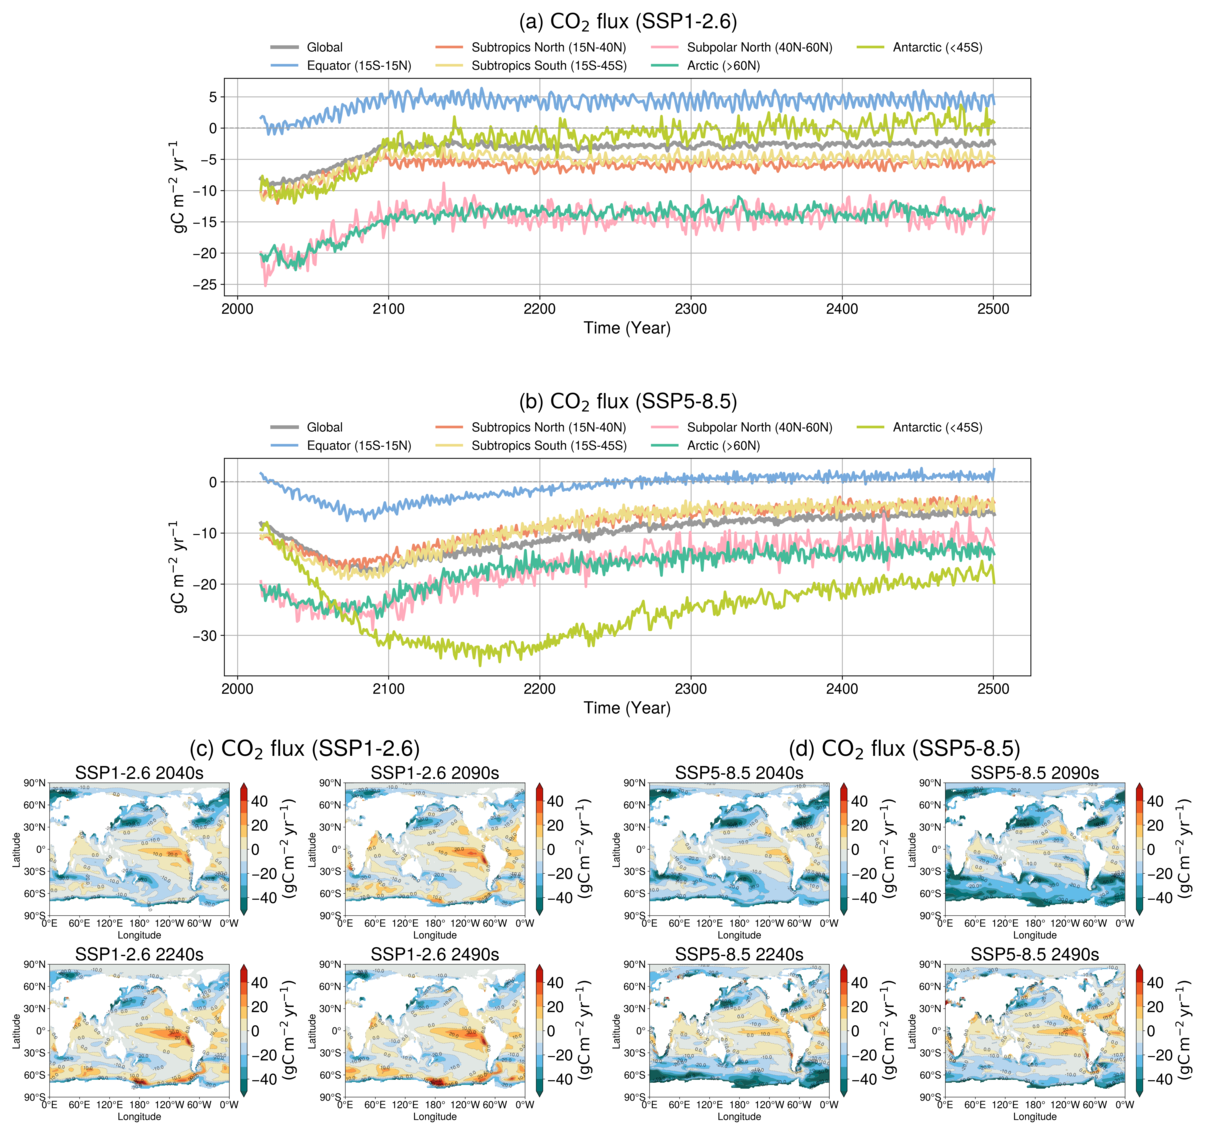
Figure 5Under SSP5–8.5, the oceanic CO2 flux indicates gradual shifts toward outgassing at the low latitudes, whereas the Southern Ocean remains a persistent sink. Annual-mean changes in the CO2 flux (unit: g C yr−1) by latitude band, simulated under (a) SSP1–2.6 and (b) SSP5–8.5. Positive values indicate oceanic CO2 outgassing, whereas negative values indicate oceanic CO2 uptake. Colored lines represent different latitude bands as follows: gray (global mean), dark blue (equatorial: 15° S–15° N), orange (northern subtropics: 15–40° N), yellow (southern subtropics: 15–45° S), pink (northern subpolar: 40–60° N), green (Arctic: >60° N), and light green (Antarctic: <45° S). Annual-mean CO2 flux (unit: ) for (c) SSP1–2.6 and (d) SSP5–8.5. Panels show the decadal means for the 2040s, 2090s, 2240s, and 2490s.
3.2.4 Carbonate buffering capacity of the surface ocean
The ocean plays a buffering role in the global carbon cycle by absorbing CO2 and, through seawater carbonate chemistry, buffers the increase in acidity associated with elevated DIC, thereby mitigating the accumulation of CO2 in the atmosphere. However, ongoing ocean acidification progressively weakens this carbonate buffering capacity, resulting in increased temporal and spatial variability in the carbonate system's response to changes in CO2 (Orr et al., 2005; Egleston et al., 2010).
To characterize these long-term changes, we first examine the evolution of the Revelle factor, which is the ratio of the relative change in pCO2 to the relative change in DIC and is the conventional measure of the sensitivity of seawater pCO2 to changes in DIC. Because the Revelle factor becomes less sensitive under high-CO2 conditions, we calculate the buffering capacity, , which has been adopted as a practical indicator of seawater buffering capacity (Riebesell et al., 2009). The buffering capacity is not equivalent to the reciprocal of the Revelle factor, but we use it as a proxy that provides a direct measure of the increase in DIC associated with a given increase in seawater pCO2.
Figure 6a and c shows that the buffering capacity in the surface ocean is projected to decline markedly during the 21st and 22nd centuries even under the low-emission scenario SSP1–2.6. However, gradual recovery is expected to emerge by the end of the 22nd century and the buffering capacity is projected to increase again over multi-centennial timescales. This delayed recovery reflects the stabilization and subsequent decline of atmospheric and surface ocean pCO2 under SSP1–2.6; reaches levels that are close to those of the present day only after around 2200. The carbonate system re-equilibrates slowly and buffering capacity is partially restored.
By contrast, under the high-emission scenario SSP5–8.5, the buffering capacity continues to decline throughout the simulation period and reaches its effective minimum values of approximately 0.05 across almost the entire global ocean by around 2200 (Fig. 6b and d). This indicates a state in which carbonate-system buffering is strongly diminished as continued accumulation of anthropogenic carbon drives buffering capacity toward its effective minimum across most of the global surface ocean. As buffering capacity approaches this effective minimum, regional contrasts progressively diminish, resulting in a nearly homogeneous spatial distribution of buffering capacity by around 2200.
When buffering capacity is high, increases in DIC lead to relatively moderate rises in pCO2. However, as buffering capacity declines, the sensitivity of pCO2 to a given increase in DIC increases, amplifying the effects of other drivers such as temperature rise and reductions in alkalinity (see Sect. 3.2.5). Changes in buffering capacity thus render the surface ocean more responsive to atmospheric forcing, particularly to the continued uptake of anthropogenic CO2. A reduced buffering capacity also implies a diminished efficiency in oceanic carbon uptake, increasing the fraction of anthropogenic CO2 that remains in the atmosphere. This point is discussed in more detail in the Discussion (Sect. 4.3).
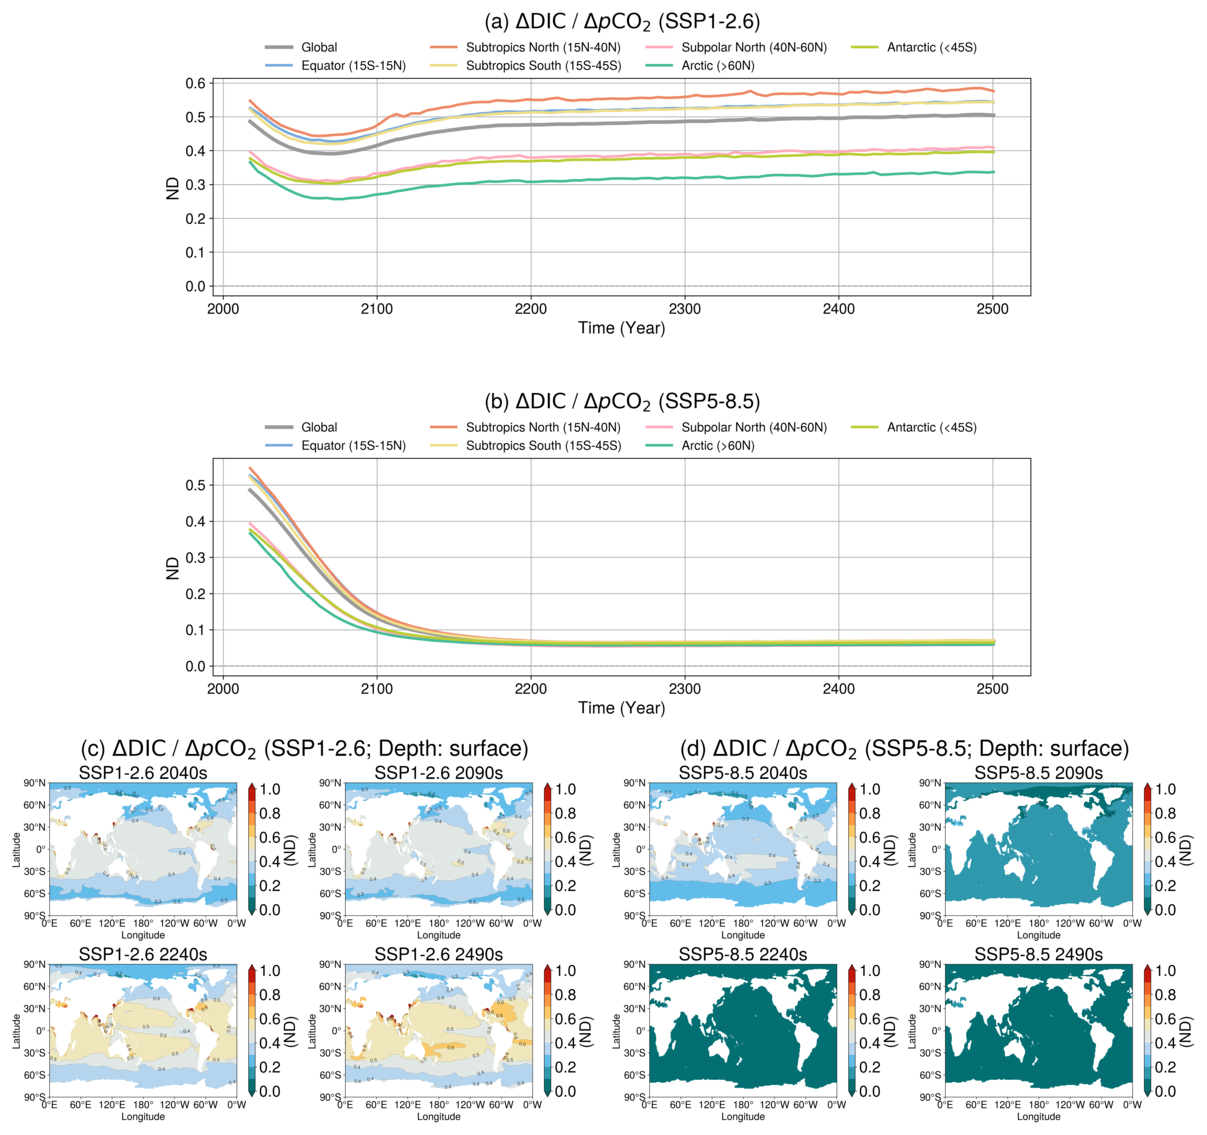
Figure 6Under SSP5–8.5, the ocean's CO2 buffering capacity reaches a near minimum by the mid–22nd century, whereas even under SSP1–2.6 it takes about a century to return to present-day levels. Annual-mean changes in – representing the sensitivity of dissolved inorganic carbon (DIC) to changes in surface-ocean pCO2 – in the surface ocean (unit: ND) by latitude band, simulated under (a) SSP1–2.6 and (b) SSP5–8.5. Colored lines represent different latitude bands as follows: gray (global mean), dark blue (equatorial: 15° S–15° N), orange (northern subtropics: 15–40° N), yellow (southern subtropics: 15–45° S), pink (northern subpolar: 40–60° N), green (Arctic: >60° N), and light green (Antarctic: <45° S). Annual-mean for (c) SSP1–2.6 and (d) SSP5–8.5. A higher value indicates stronger buffering capacity, meaning that the ocean can absorb and retain more CO2 for a given increase in pCO2. Panels show the decadal means for the 2040s, 2090s, 2240s, and 2490s.
3.2.5 Drivers of temporal changes in surface-ocean partial pressure of CO2
Changes in are driven by variations in ocean temperature, salinity, DIC, and total alkalinity. We performed a decomposition analysis of the temporal changes in surface to identify the contributions of these factors (see Sect. 2.3 for details) (Figs. 7 and A8).
Under the low-emission scenario SSP1–2.6, temporal variations in surface are largely explained by changes in DIC (Fig. 7a). Under this scenario, surface increases until around 2080 and subsequently decreases. The positive trend becomes negative as stabilizes. By around 2200, the change in surface approaches zero, indicating near equilibrium between the ocean and atmosphere.
Similarly, from the beginning of the 21st century to around 2200, the rise in surface under the high-emission scenario SSP5–8.5 is primarily driven by increasing DIC concentrations, reflecting the rapid uptake of anthropogenic carbon under strong air–sea disequilibrium (Fig. 7b). Before 2200, the contributions from temperature and alkalinity changes remain secondary. After 2200, however, the influence of reductions in surface alkalinity, together with thermal effects, becomes increasingly important in driving further increases in surface . This influence is associated with enhanced upper-ocean stratification and the subsequent weakening of the meridional overturning circulation (Fig. A9). During this period, although calcium carbonate export decreases, the associated conservation of alkalinity is insufficient to offset the effects of physical changes, resulting in an overall decline in surface-ocean alkalinity. This coincides with the approach of the buffering capacity of the marine carbonate system toward its minimum, consistent with the interpretation of Chikamoto et al. (2023).
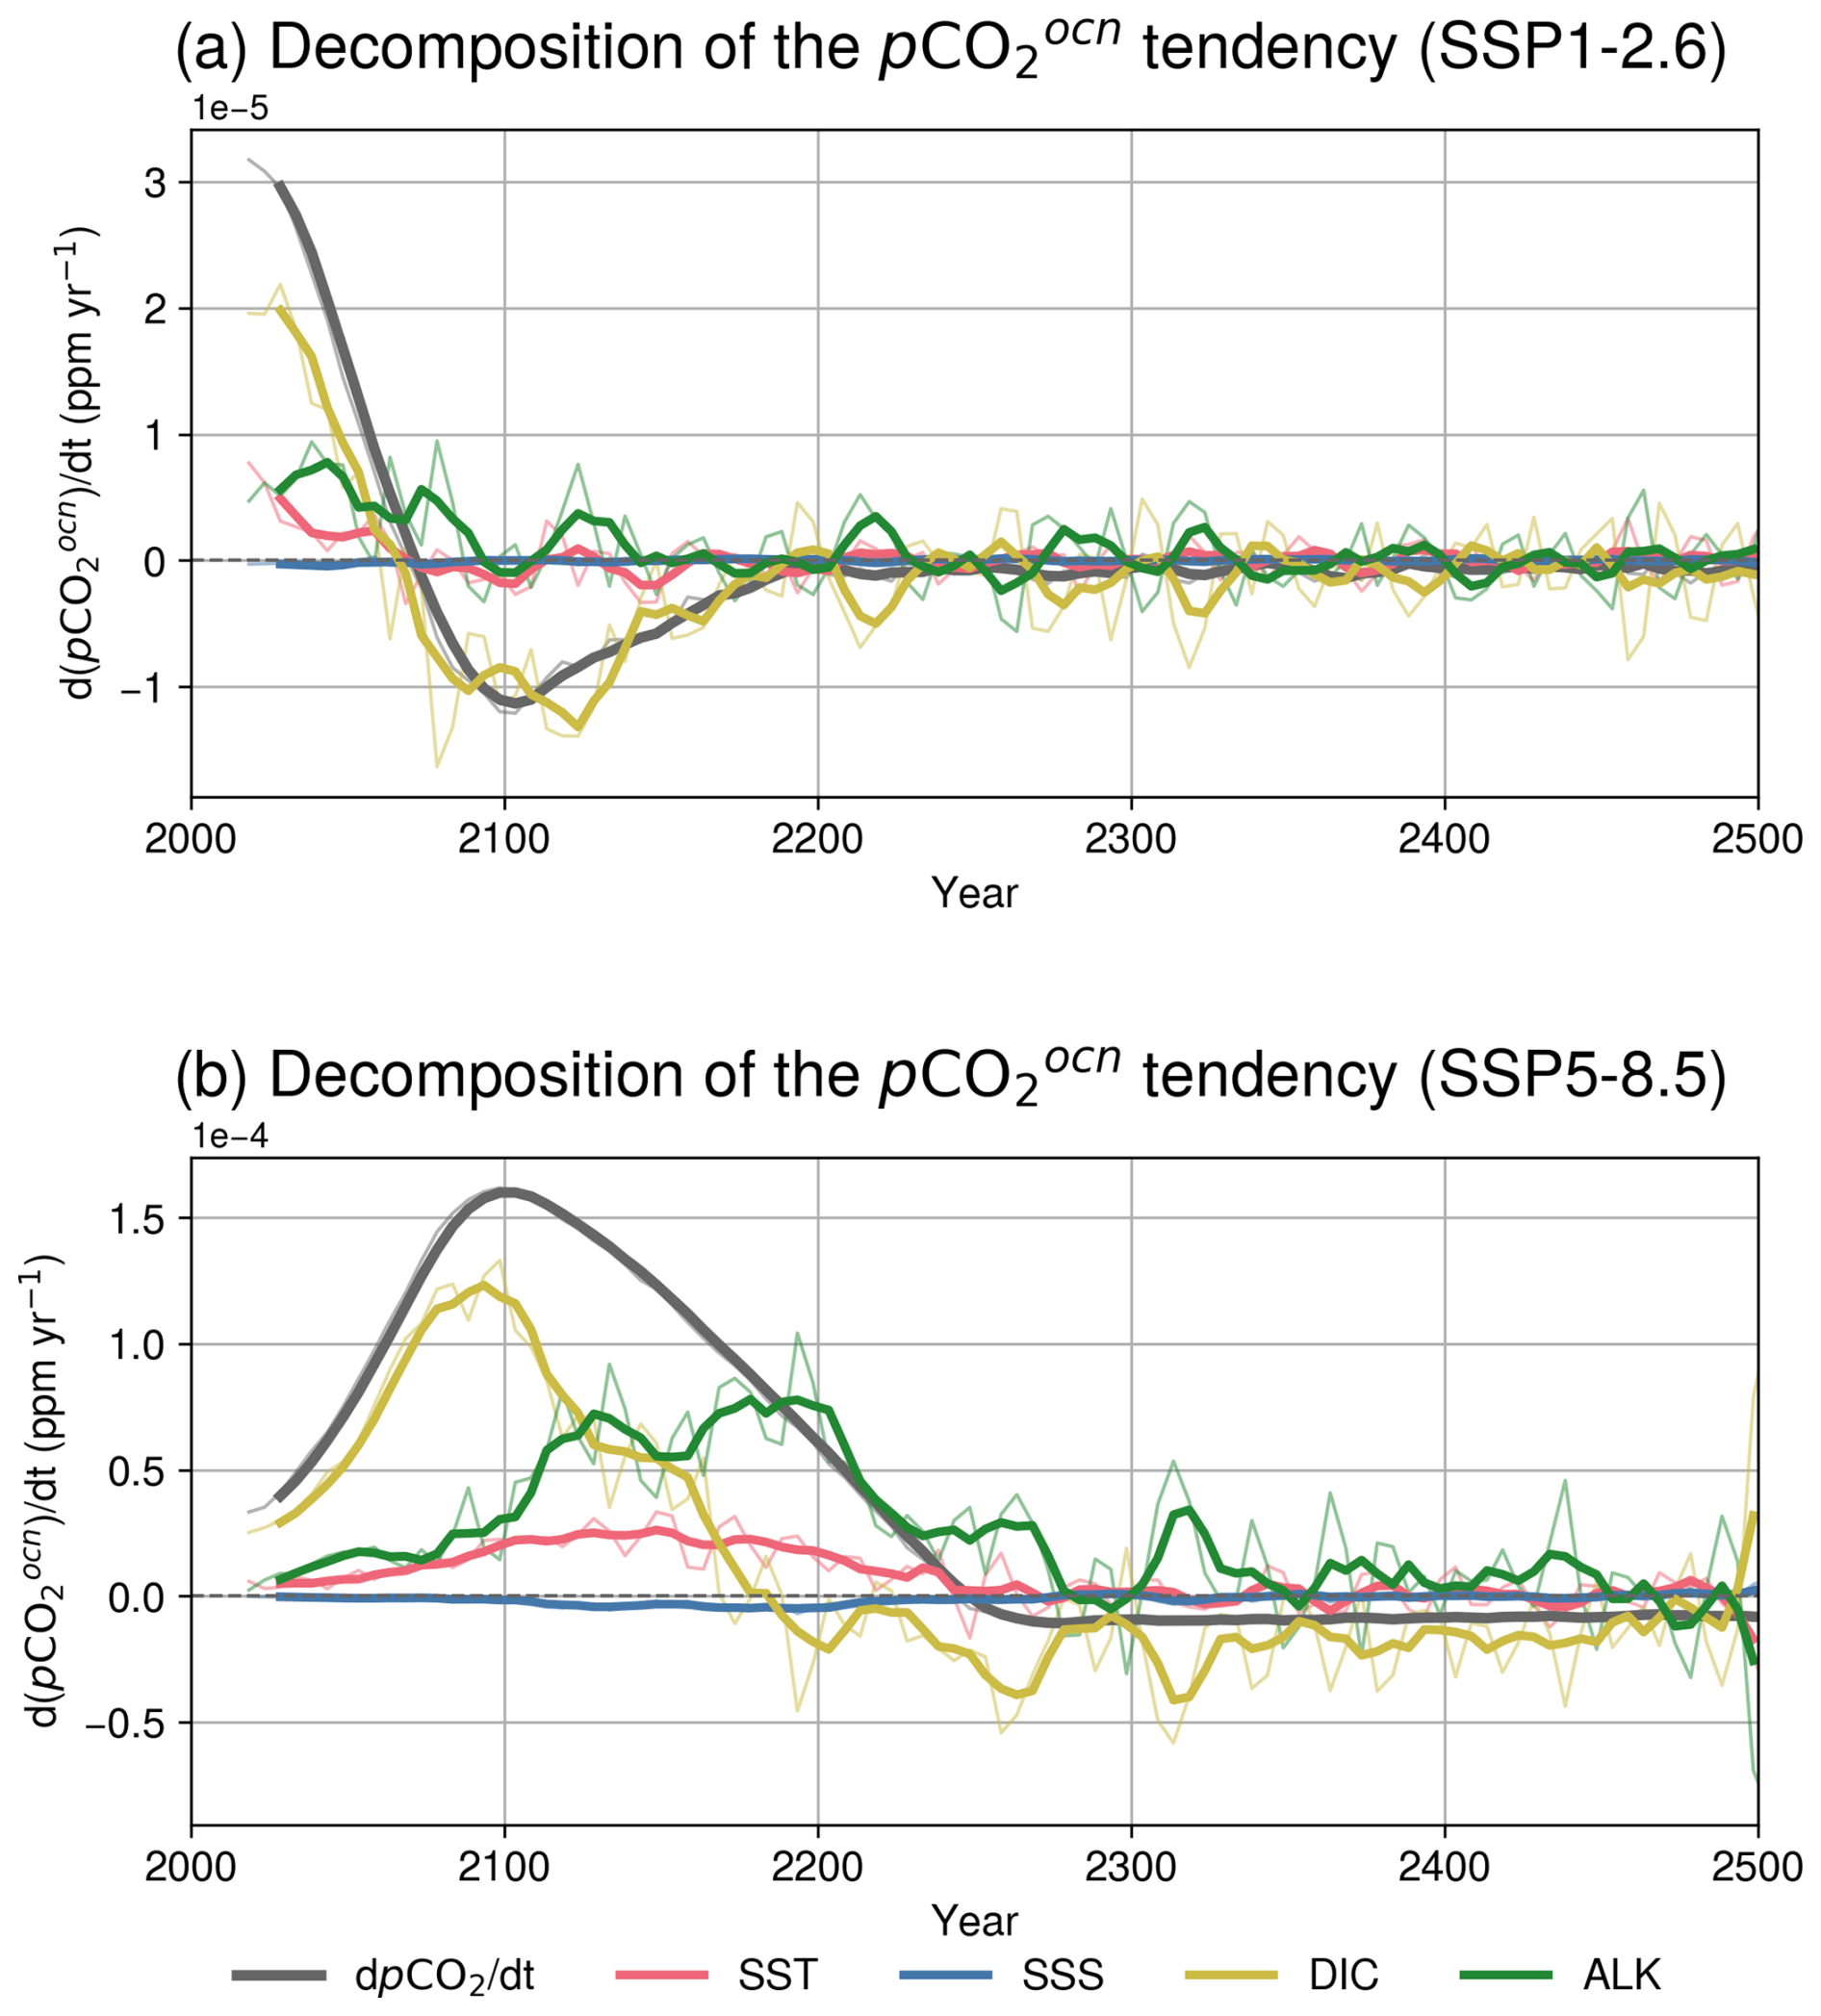
Figure 7Changes in surface-ocean pCO2 are initially driven by surface DIC, with alkalinity becoming important from the mid–22nd century onward under SSP5–8.5. Contributions of temperature (red), salinity (blue), DIC (yellow), and alkalinity (green) to the temporal change of global-mean surface (black) under (a) SSP1–2.6 and (b) SSP5–8.5. Thick lines represent 20-year running means, whereas thin lines indicate 5-year mean values. The horizontal axis represents time (years), and the vertical axis shows the time derivative of pCO2 (, unit: ppm yr−1).
3.2.6 Deep-ocean carbon storage and remaining carbon uptake capacity
Under both low- and high-emission scenarios, DIC concentrations in the deep ocean continue to increase even after stabilizes or begins to decline (Figs. 1a, A1 and A2). This sustained increase is consistent with the long residence time and slow renewal of deep waters, which allow anthropogenic carbon to accumulate and persist in the ocean interior for centuries once it is transported below the surface. Enhanced stratification and slow, multi-centennial adjustments of ocean biogeochemical cycles further support this continued accumulation.
In particular, pronounced increases in DIC are evident along major deep-water formation and export pathways under SSP5–8.5 (Fig. A10). Along AABW pathways, DIC increases extend into the abyssal and bottom ocean, whereas the North Atlantic Deep Water (NADW) exhibits enhanced DIC accumulation primarily within the deep Atlantic basin. These spatial patterns indicate the efficient transfer of anthropogenic carbon from the surface into the ocean interior along established deep-water circulation pathways.
Changes in the formation and properties of deep waters, together with modifications of the circulation in the ocean interior, regulate the depth at which carbon is stored and the residence time of deep waters. Consequently, they are associated with variations in the vertical distribution and accumulation of DIC. In addition, changes in biological export and remineralization contribute to enhanced DIC accumulation in the ocean interior. Under SSP5–8.5, regenerated carbon increases despite the general decrease in detritus export (Fig. 2d). This is because longer water-mass residence times enhance the accumulation of remineralized carbon in the ocean interior, which is consistent with previous CMIP6 analyses of the future biological carbon pump (Wilson et al., 2022). Interior DIC increase is dominated by preformed carbon, with regenerated carbon providing a secondary but positive contribution (Fig. 1b).
To further examine the remaining capacity of the ocean interior to absorb anthropogenic CO2, we calculate potential (), defined as the surface-equivalent pCO2 of an interior seawater parcel (Broecker and Peng, 1982; Chen et al., 2022). The deviation of interior from (ΔPCO2) is used as a diagnostic for the remaining chemical capacity of the ocean interior to absorb anthropogenic CO2.
Under SSP1–2.6, elevated ΔPCO2 develops at intermediate depths and progressively extends into the deep ocean (Figs. 8a–d). By the mid–23rd century, positive ΔPCO2 is evident even within the abyssal ocean, indicating that anthropogenic carbon has penetrated efficiently into the ocean interior and progressively reduced the remaining capacity for additional carbon uptake.
By contrast, under SSP5–8.5, ΔPCO2 exhibits a pronounced vertical gradient, with elevated values in the thermocline but persistently low values throughout much of the deep ocean (Fig. 8e–h). This pattern indicates that the rapid increase in outpaces the ventilation of the deep ocean, leaving much of the ocean interior substantially undersaturated with respect to anthropogenic CO2 despite continued increases in interior DIC. In the Southern Ocean, relatively low ΔPCO2 extends to shallow waters further highlighting the important role of Southern Ocean ventilation in sustaining the long-term carbon storage capacity of the deep ocean. By the 2240s, large positive ΔPCO2 values develop within the mesopelagic ocean. This is consistent with the nonlinear response of the marine carbonate system to anthropogenic carbon invasion and the continued accumulation of remineralized DIC (Fassbender et al., 2023).
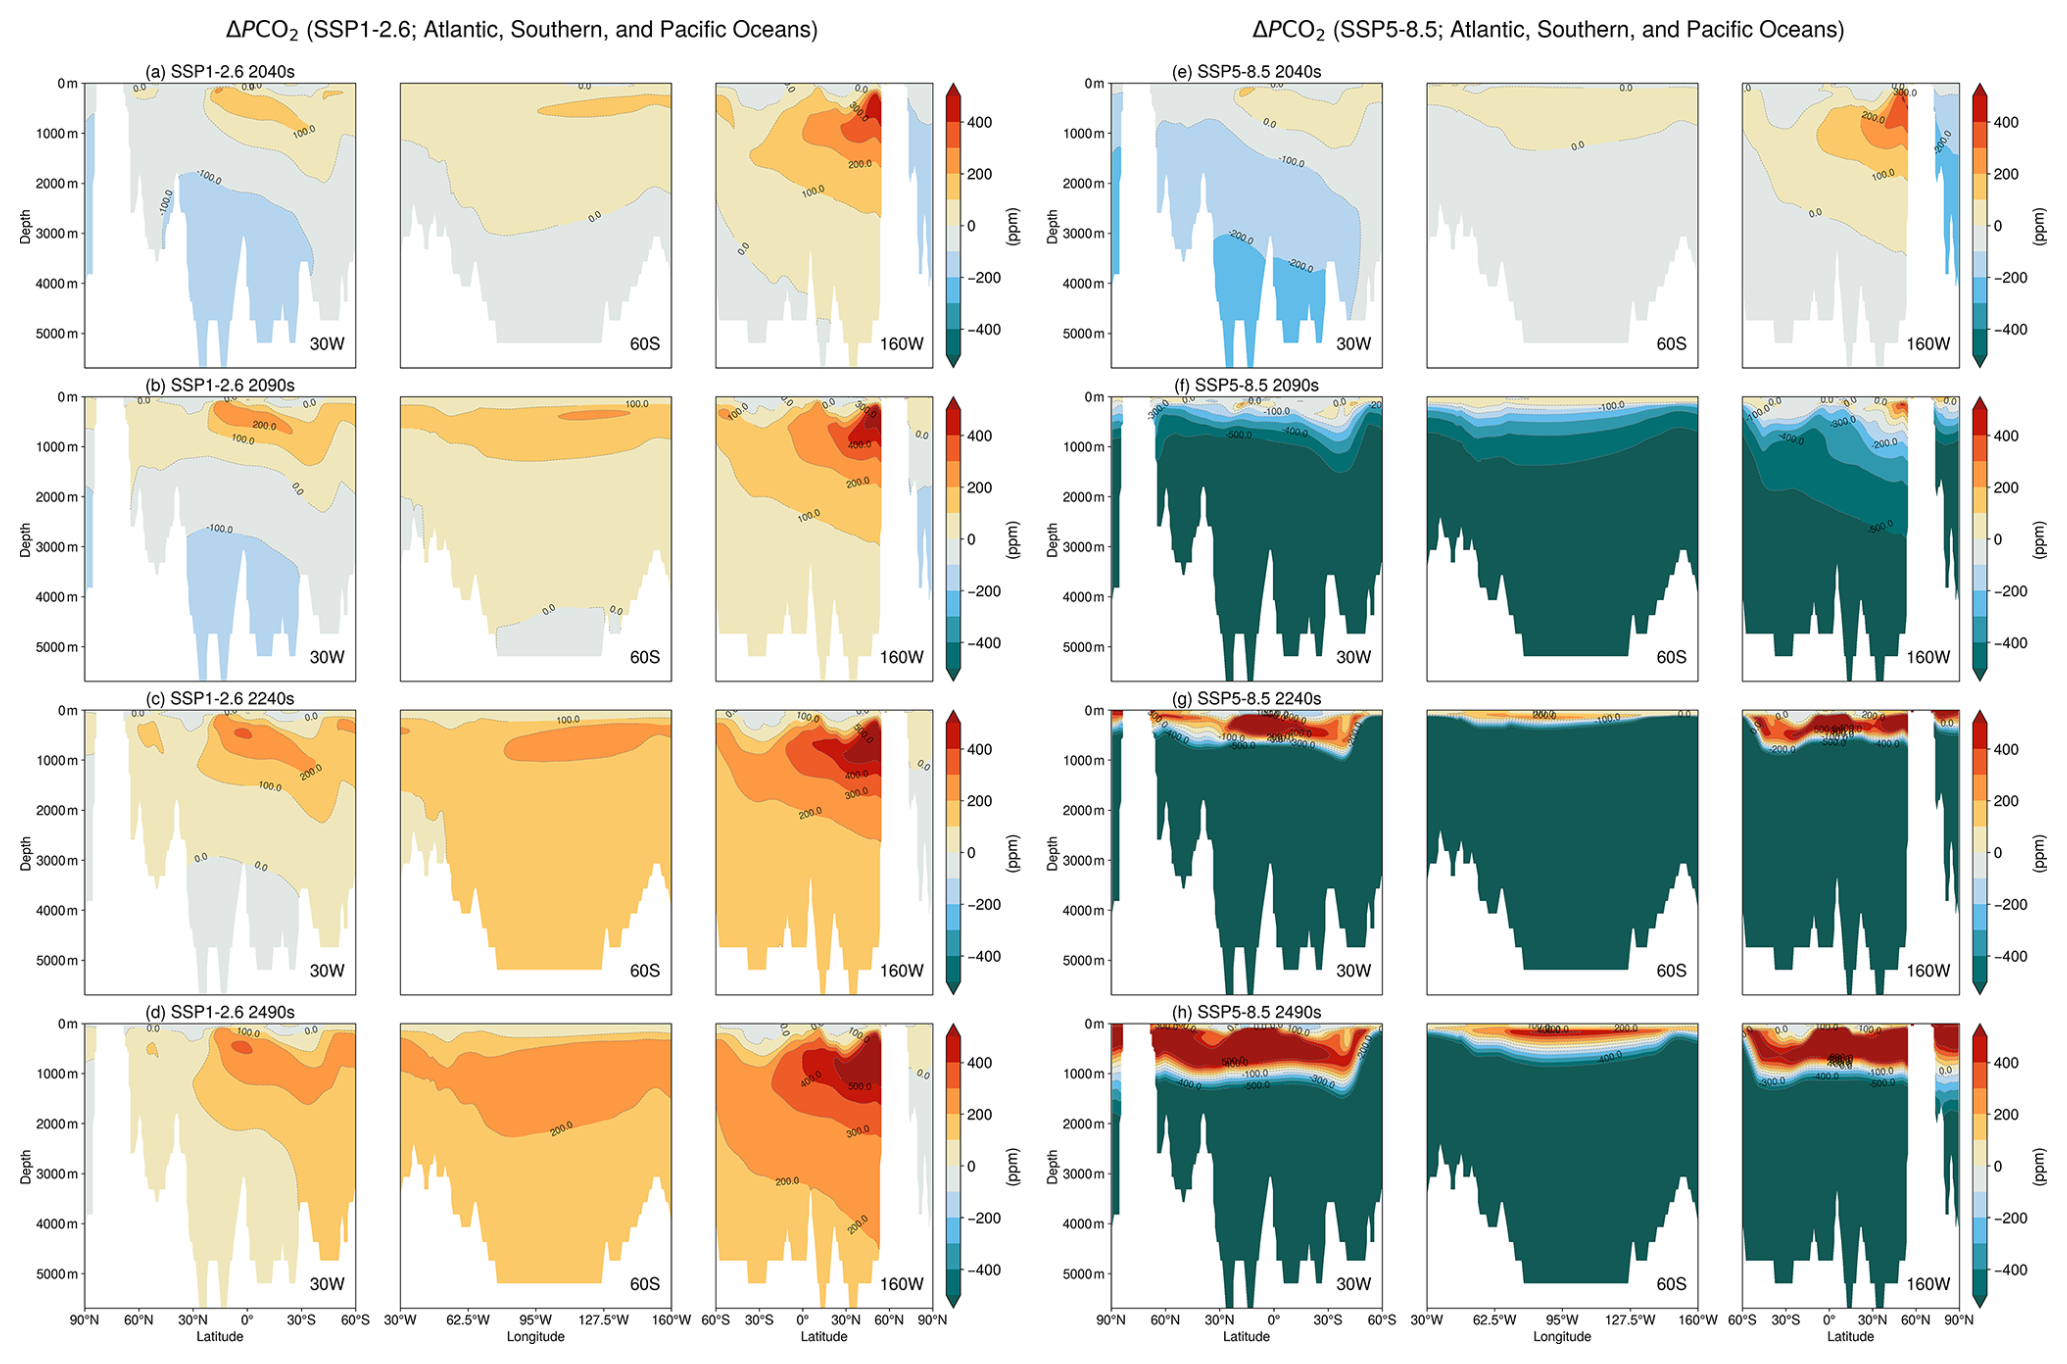
Figure 8 Under SSP5–8.5, surface and subsurface waters become potentially supersaturated in pCO2 relative to the atmosphere over time, whereas deeper waters remain potentially undersaturated. Zonal mean vertical sections of (unit: ppm) for (a–d) SSP1–2.6 and (e–h) SSP5–8.5, where denotes ocean potential pCO2 and denotes atmospheric pCO2. From left to right, the panels show longitudinally averaged sections for the Atlantic, Southern, and Pacific Oceans. From top to bottom, rows represent the decadal means for the (a, e) 2040s, (b, f) 2090s, (c, g) 2240s, and (d, h) 2490s.
3.3 Ecological consequences of long-term biogeochemical change
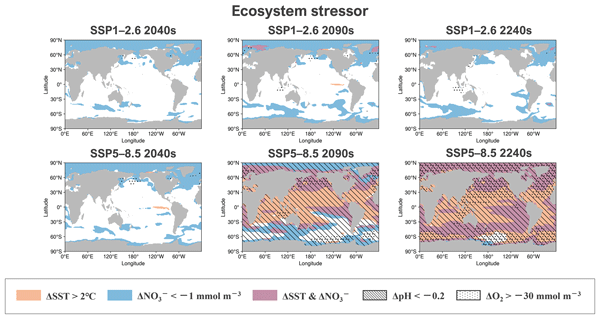
As a result of ongoing global warming, marine ecosystems are under increasingly complex and regionally differentiated pressures from concurrent stressors – e.g., warming, acidification, and deoxygenation – that vary in magnitude across time and space. We evaluate ecosystem stress using multiple indicators, including SST, nutrient concentrations, dissolved oxygen, pH, and aragonite and calcite saturation states (Ωarag and Ωcalc), following Kwiatkowski et al. (2020), over centennial timescales (Figs. 9, 10 and A11).
Ecosystem stress under the low-emission scenario SSP1–2.6 remains relatively limited compared with that under the higher-emission scenarios. Anomalies in temperature, ocean acidification, and deoxygenation persist over several centuries, primarily in the polar and subpolar regions (Fig. 9a–c). Nevertheless, the return of multiple stress indicators toward modern-day levels is slow across a wide range of marine ecosystems, including coastal seas, coral reefs, and kelp forests. Present-day conditions are only reached in the late 22nd century (Fig. 10).
Importantly, several key environmental variables do not fully return to present-day levels even after declines under SSP1–2.6. Sea surface temperatures remain approximately 0.5 °C above present-day values after the 21st century. Surface nutrient concentrations, dissolved oxygen, and alkalinity continue to decrease over multiple centuries (Figs. A12, A13, and A14). These residual anomalies are particularly pronounced in the Arctic, where changes in temperature and nutrient availability persist through to the end of the 25th century (Fig. 10). Together, these results indicate that even under a low-emission pathway, key physical and biogeochemical stress indicators can take several centuries to return to present-day levels.
By contrast, under SSP2–4.5, combined ecosystem stress arising from surface warming and declining nutrient availability expands beyond the polar regions into the subpolar and equatorial regions over multi-centennial timescales (Fig. 9d–f). Notably, this expansion continues well beyond 2100, despite only modest increases in after the end of the 21st century. On multi-centennial timescales, some stressors show partial relaxation; however, conditions do not return to present-day levels and, at best, approach late–21st-century states (Fig. 10). This behavior indicates that ecosystem stress under SSP2–4.5 is driven not only by contemporaneous atmospheric forcing, but also by delayed oceanic responses, including the persistence of elevated surface temperatures and sustained reductions in upper-ocean nutrient supply. As a result, the spatial extent of stressed marine ecosystems continues to grow over subsequent centuries, highlighting a cumulative and lagged response of the ocean–ecosystem system to the forcing under intermediate-emission scenarios.
This trend is further amplified under the high-emission scenario SSP5–8.5 (Fig. 9g–i). Up to around 2090, the evolution of ecosystem stress is broadly consistent with previous assessments focusing on the 21st century (Kwiatkowski et al., 2020), with stress primarily emerging in the tropical and high-latitude regions. After 2100, however, ecosystem stress intensifies markedly, as the combined effects of surface warming and declining nutrient availability expand across nearly all ocean basins. This intensification is accompanied by pronounced surface-ocean acidification on a global scale.
Under SSP5–8.5, declining surface nutrient availability in coastal and kelp systems and strong reductions in surface aragonite saturation in coral reef regions become increasingly pronounced on multi-centennial timescales (Fig. 10). Together, these results highlight a substantial increase in ecosystem stress beyond the end of the 21st century because of interactions between multiple stressors under sustained forcing in high-emission scenarios.
Spatial heterogeneity is also evident in the progression of ocean deoxygenation under SSP5–8.5 (Figs. A13 and A15). The oxygen minimum zones (OMZs) in the equatorial region exhibit relatively little change. However, there are pronounced declines in dissolved oxygen concentrations in the deep North Pacific and Southern Ocean, associated with the weakening of deep ocean ventilation and warming.
Regarding the aragonite saturation state, projections under the low-emission scenario SSP1–2.6 show that aragonite undersaturation (Ωarag<1) emerges transiently in the polar regions around the end of the 21st century (Fig. A16a and b). Subsequently, much of the area experiencing undersaturated conditions recovers to Ωarag>1 as declines, consistent with the partial recovery shown in Fig. 10. However, aragonite saturation in parts of the Arctic Ocean remains close to unity on multi-centennial timescales, indicating a slow and incomplete return to present-day conditions.
By contrast, under the high-emission scenario SSP5–8.5, undersaturated conditions (Ωarag<1) emerge by 2100 across most of the Southern Ocean south of 45° S, as well as over large areas of the Arctic Ocean and the subpolar North Pacific (Fig. A16e and f). These spatial patterns are broadly consistent with previous projections focusing on the 21st century; however, the extended simulations reveal a continued and substantial expansion of undersaturated regions beyond 2100. After 2100, Ωarag<1 conditions expand further under SSP5–8.5, progressively encompassing more than half of the global ocean by the mid–23rd century and continuing to grow through the late 25th century (Fig. A16g and h). By this time, the global mean aragonite saturation state approaches, and in some periods falls below, unity, indicating a widespread transition toward corrosive conditions for aragonite across much of the ocean.
Regarding the calcite saturation state, Ωcalc remains substantially higher than Ωarag under most conditions, such that calcite undersaturation provides a more stringent indicator of corrosive conditions for calcifying organisms. Under the low-emission scenario SSP1–2.6, Ωcalc stays well above unity across most of the global ocean, generally exceeding values of about 1.5, with near-unity conditions appearing only locally in limited coastal parts of the Arctic Ocean (Figs. A16i–l). This indicates that, although aragonite may transiently become undersaturated in the polar regions, the carbonate system does not broadly transition into conditions that are corrosive with respect to calcite under strong emission mitigation.
By contrast, under the high-emission scenario SSP5–8.5, calcite undersaturation (Ωcalc<1) emerges by the end of the 21st century over large portions of the Arctic Ocean and in coastal sectors of the Southern Ocean (Fig. A16n). The extended simulations further reveal that these Ωcalc<1 regions continue to expand beyond 2100, spreading into subpolar waters by the mid–23rd century (Fig. A16o and p). This progression indicates that sustained high emissions drive the ocean not only toward widespread aragonite corrosivity, but also toward a more extreme regime in which even calcite becomes thermodynamically unstable over broad high-latitude and subpolar regions.
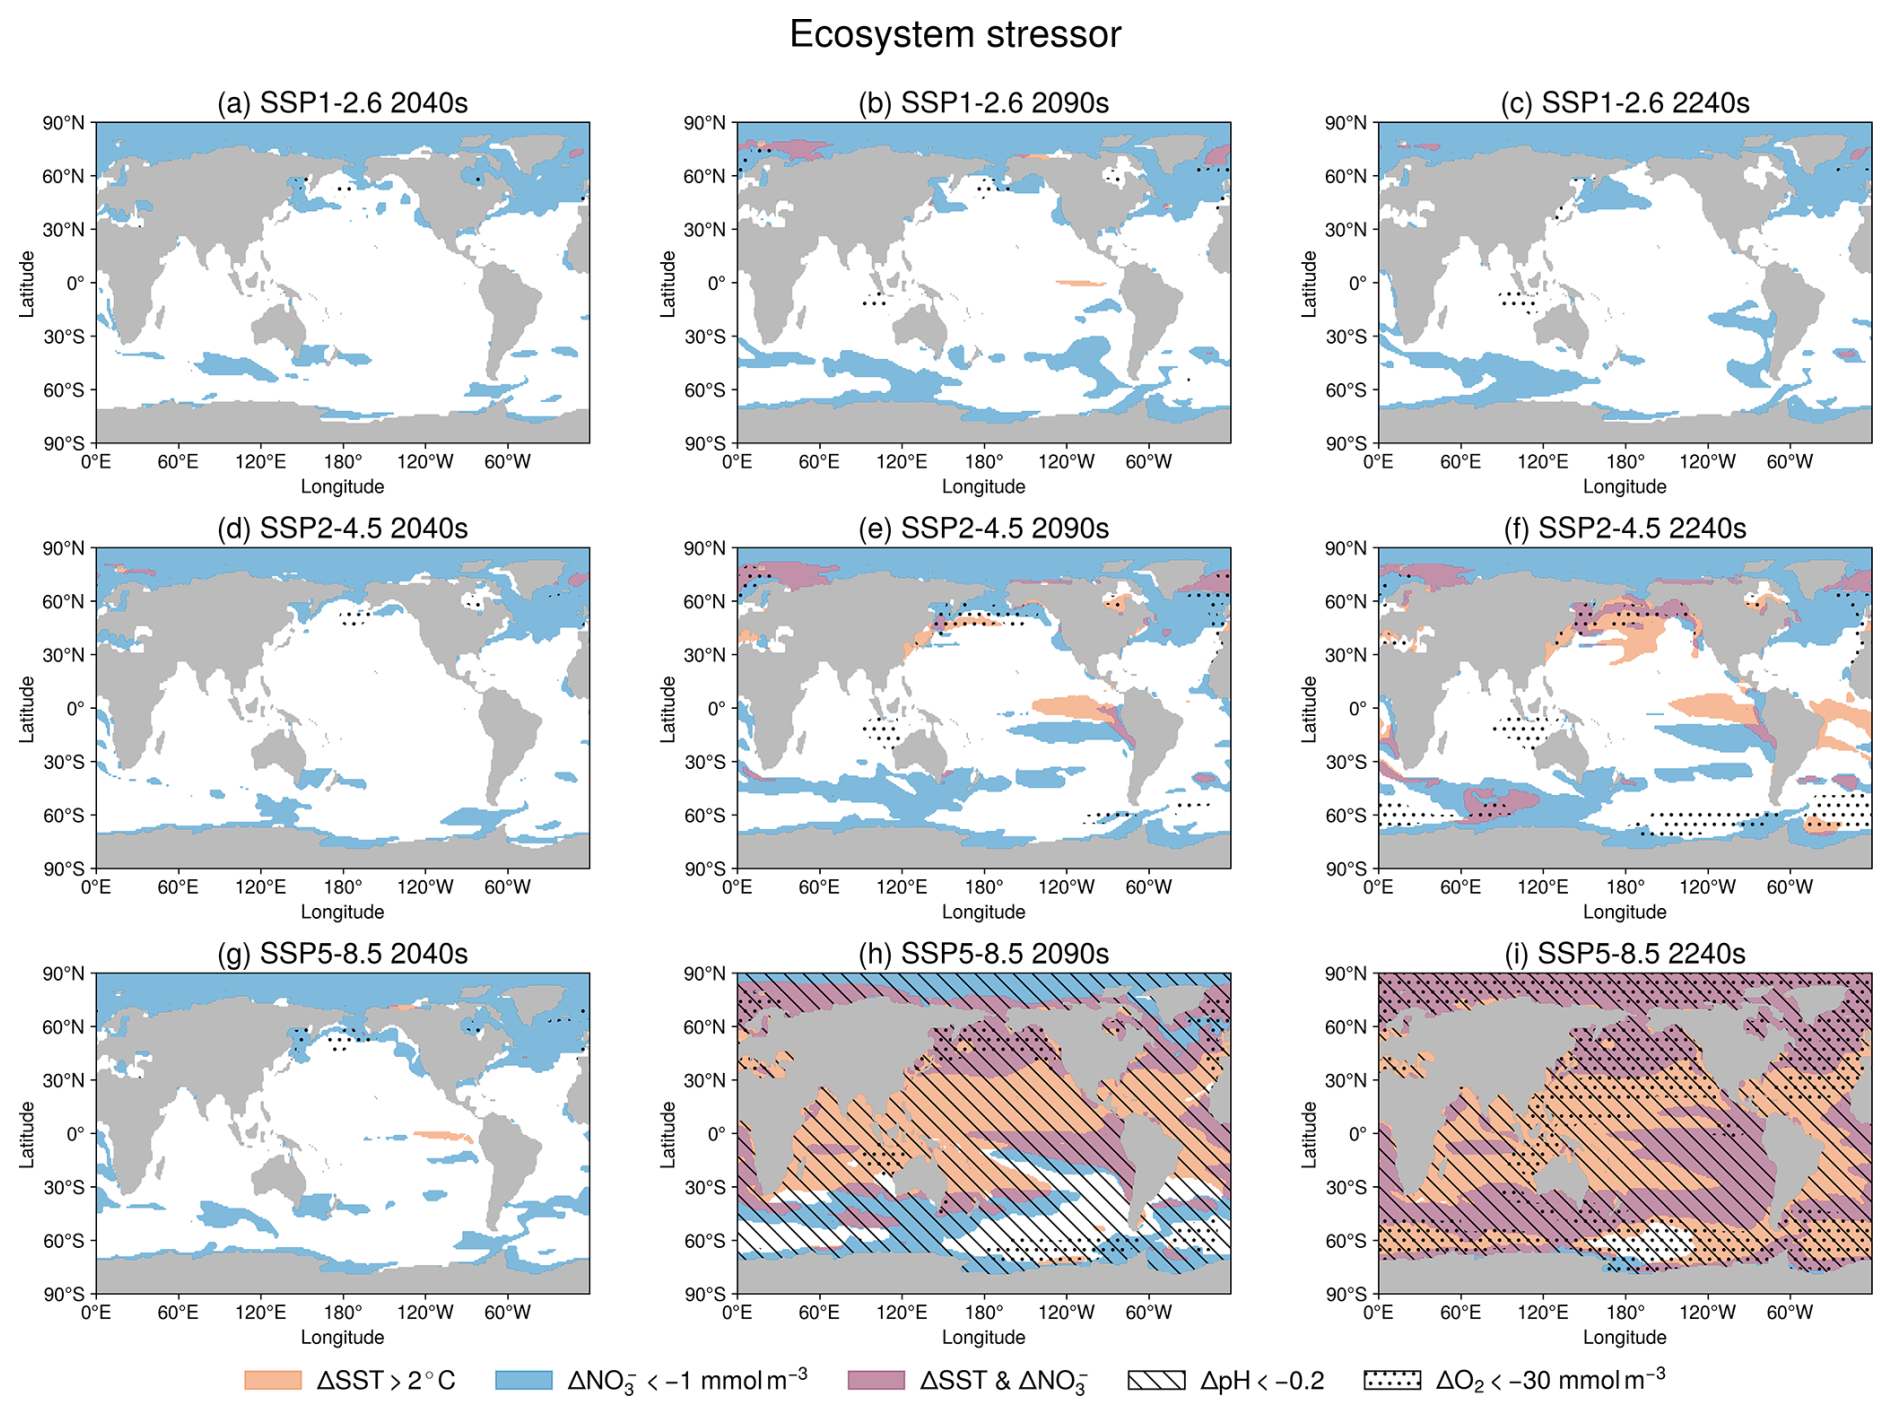
Figure 9Even under the intermediate scenario SSP2–4.5, ecosystem stress continues to intensify beyond the 21st century. Ecosystem stressors under (a–c) SSP1–2.6, (d–f) SSP2–4.5, and (g–i) SSP5–8.5. Panels show changes in the (a, d, g) 2040s, (b, e, h) 2090s, and (c, f, i) 2240s relative to the 2010s average under SSP1–2.6. Following Kwiatkowski et al. (2020), stressors are defined using sea surface temperature, surface ocean pH, euphotic-zone nitrate concentration (averaged over 0–100 m), and subsurface dissolved oxygen concentration (averaged over 100–600 m). Stressors include warming (+2 °C), nutrient decline (, blue), and their overlap (red). Additional stressors are ocean acidification (surface pH decrease of −0.2, hatched) and deoxygenation (subsurface dissolved oxygen decrease of , dotted).
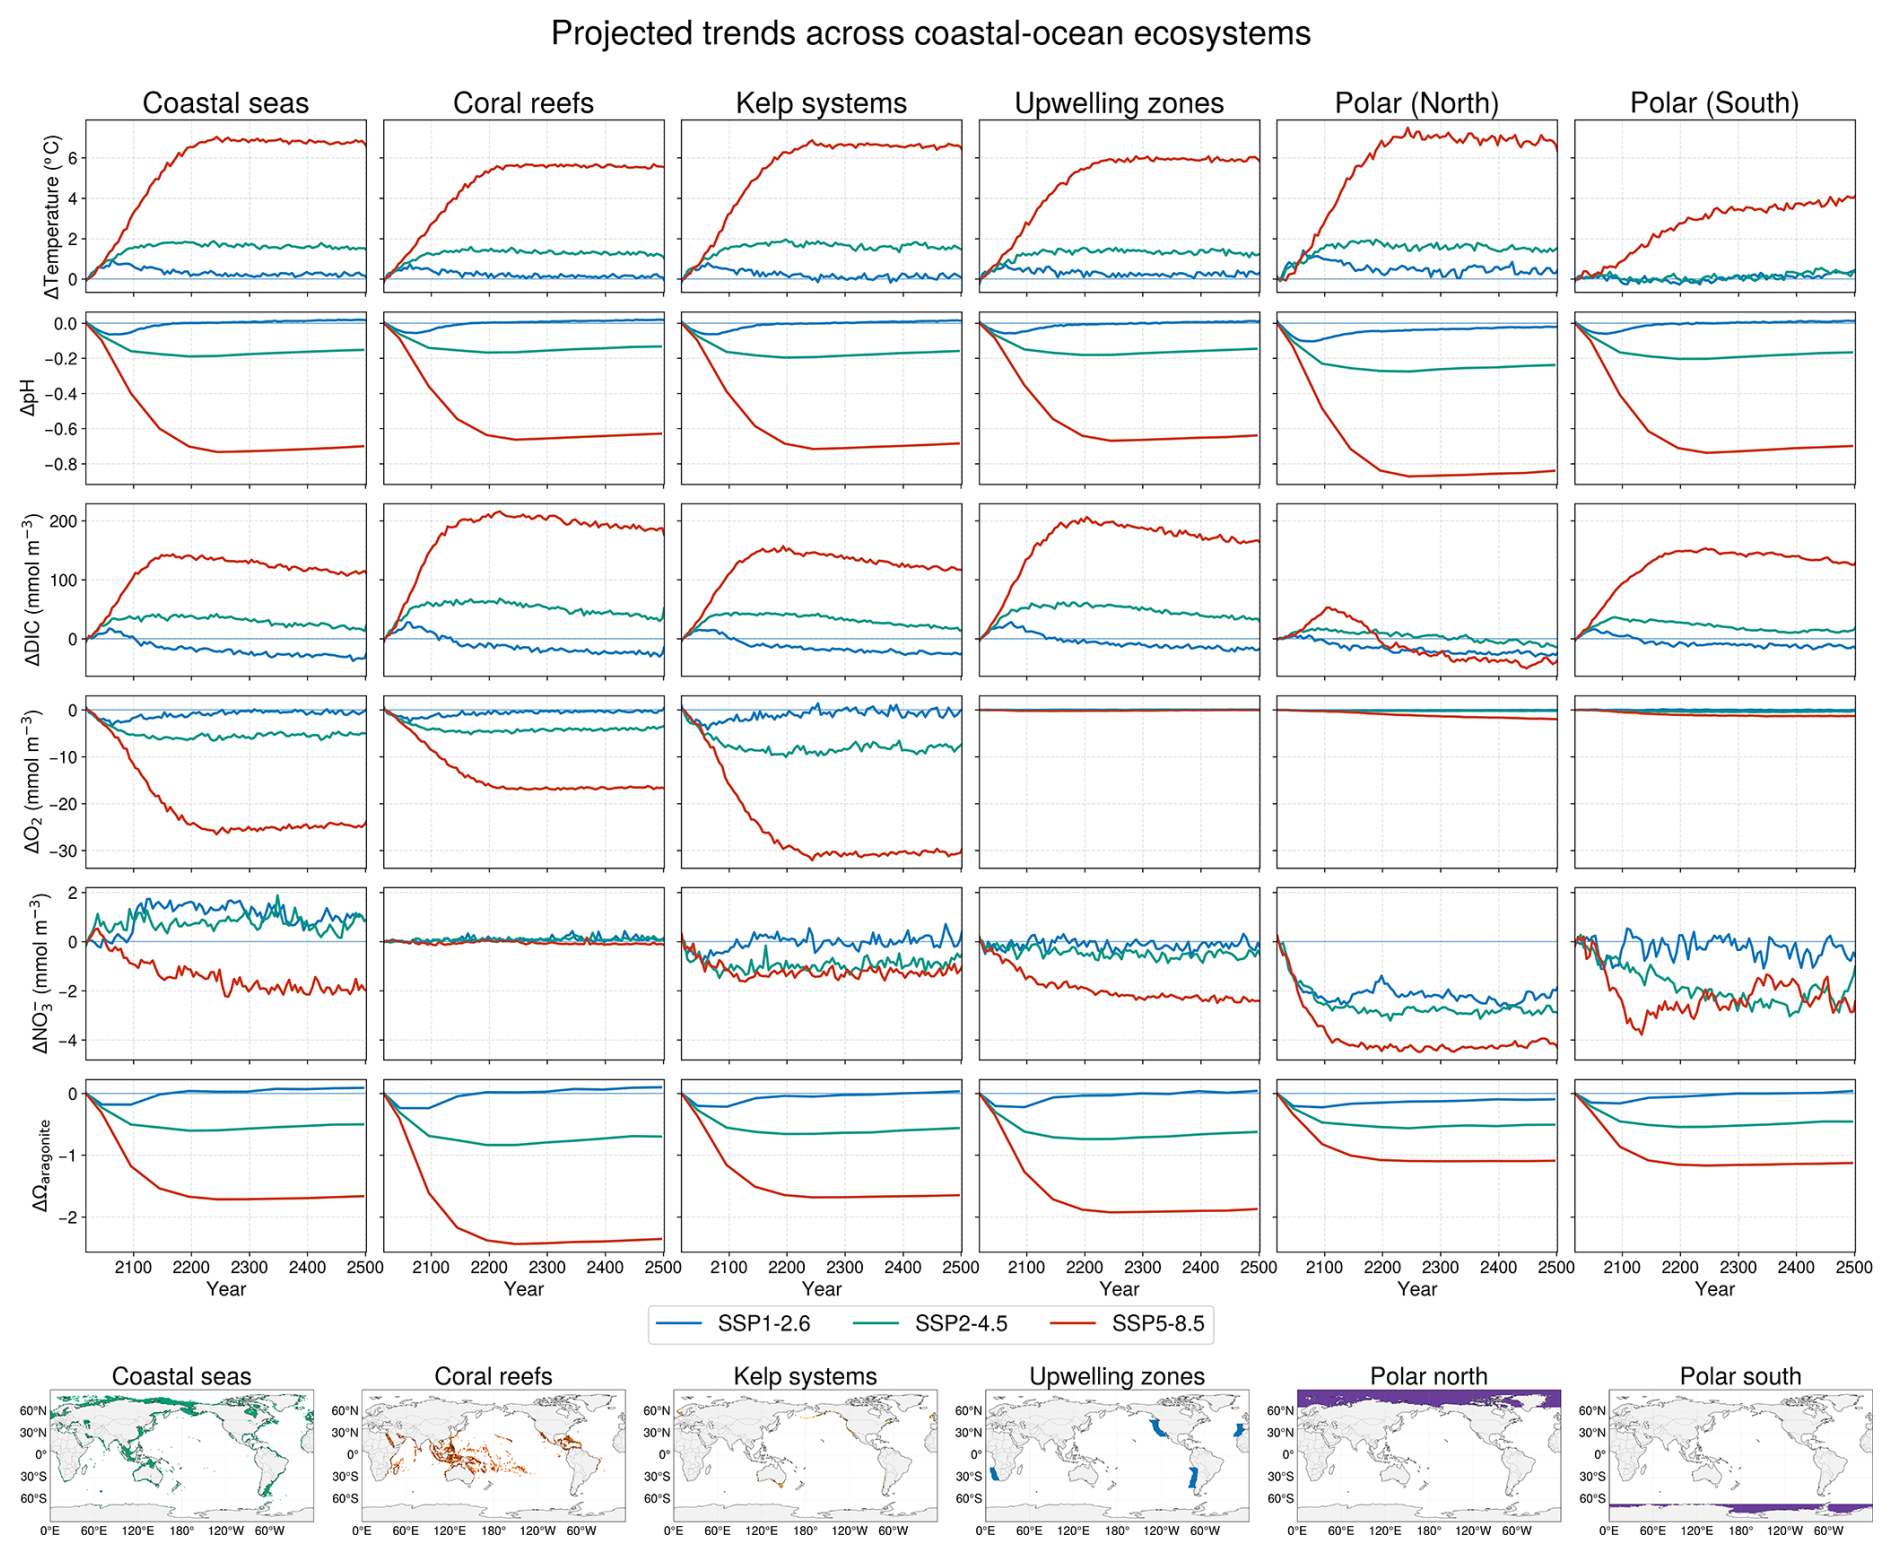
Figure 10Under SSP5–8.5, nutrient declines in coastal and kelp systems and reductions in aragonite saturation in coral reef regions become pronounced. Projected time series of coastal-ocean temperature, pH, DIC, O2, , and Ωaragonite across coastal seas, coral reefs, kelp systems, upwelling zones, and polar regions (north and south) under SSP1–2.6, SSP2–4.5, SSP3–7.0, and SSP5–8.5. Spatial masks follow IPCC AR6 WGII Fig. 3.7 (Cooley et al., 2022).
4.1 Mechanisms governing long-term ocean biogeochemical responses
This study examines ocean biogeochemical responses under low (SSP1–2.6), intermediate (SSP2–4.5), and high (SSP5–8.5) emission pathways extended to the year 2500, with the aim of constraining the magnitude, persistence, and reversibility of long-term ocean responses to different atmospheric CO2 trajectories. In this section, we focus on discussing the contrasting responses between the end-member scenarios SSP1–2.6 and SSP5–8.5 and use SSP2–4.5 to illustrate intermediate and delayed adjustments.
Previous studies have primarily focused on ocean changes during the 21st century, highlighting reductions in carbonate buffering capacity, ocean acidification, and increasing ecosystem stress under continued anthropogenic emissions (Kwiatkowski et al., 2020; Masson-Delmotte et al., 2021). Our simulations of ocean changes between the 21st century and 2500 demonstrate that many of these responses are likely to continue to evolve long after atmospheric forcing has stabilized or begun to decline. Rather than approaching a steady state, the ocean is projected to progressively shift toward distinct long-term biogeochemical regimes. Regime characteristics depend strongly on the emission pathway. In particular, the high-emission scenario is characterized by a progressive approach toward the minimum buffering capacity of the marine carbonate system, continued sequestration of anthropogenic carbon in the deep ocean, and persistent changes in nutrient distributions and marine ecosystem stress. Even under strong emission mitigation, substantial perturbations to ocean chemistry and the ocean interior are projected to remain for centuries.
In the following subsections, we discuss the mechanisms underlying these long-term responses. First, we consider the transient evolution of surface . This is followed by a discussion of the long-term evolution of carbonate buffering capacity and carbonate mineral saturation. We then consider the mechanisms controlling deep-ocean carbon sequestration and storage capacity, circulation-driven changes in nutrient supply and biological productivity, and finally focus on the implications of multiple stressors and their interactions for marine ecosystems.
4.1.1 Mechanisms controlling the temporal evolution of ocean carbon uptake
The temporal evolution of the ocean carbon sink is governed by the combined effects of atmospheric forcing, carbonate chemistry, and ocean circulation. These processes regulate the air–sea pCO2 difference (Fig. 4) and consequently the magnitude of air–sea CO2 exchange (Fig. 5).
Under SSP1–2.6, net oceanic CO2 uptake is maintained throughout the 21st century because exceeds surface over most of the global ocean. As subsequently stabilizes and declines, the air–sea pCO2 difference progressively weakens, leading to a gradual reduction in ocean carbon uptake. By contrast, under SSP5–8.5, sustained atmospheric forcing maintains a large negative air–sea pCO2 difference well beyond 2100. Consequently, oceanic CO2 uptake continues to increase until the late 21st century before gradually decreasing as surface-ocean pCO2 catches up with atmospheric forcing.
Although the temporal evolution of the air–sea CO2 flux closely follows that of the air–sea pCO2 difference, regional discrepancies remain. In particular, the Southern Ocean maintains a stronger carbon sink than would be expected from the air–sea pCO2 difference alone. This behavior is consistent with the enhancement of air–sea gas exchange by persistently strong Southern Hemisphere westerlies (Fig. A7). It is also in alignment with the multi-model analysis of Koven et al. (2022), which indicated that the Southern Ocean remains an important carbon sink under sustained high-emission scenarios.
The long-term decline in carbonate buffering capacity provides an additional control on the temporal evolution of ocean carbon uptake. As anthropogenic carbon accumulates, the Revelle factor increases and the buffering capacity decreases, indicating progressively larger increases in surface for a given increase in DIC. By the 22nd century under SSP5–8.5, the buffering capacity of much of the surface ocean approaches its minimum. As a result, the efficiency of further oceanic CO2 uptake is substantially reduced (Fig. 6b).
This simulated slowdown in ocean carbon uptake under SSP5–8.5 is consistent with the late–21st-century saturation of oceanic carbon uptake reported by Chikamoto and DiNezio (2021) who attributed the slowdown primarily to reduced CO2 solubility and carbonate-system buffering associated with ocean warming and anthropogenic carbon accumulation. Furthermore, Chikamoto et al. (2023) identified declining surface-ocean alkalinity as an additional feedback that operates on multi-centennial timescales. This is consistent with the results of our decomposition analysis, which show reductions in surface alkalinity becoming an increasingly important driver of surface after the mid–22nd century under SSP5–8.5 (Fig. 7b).
There are, nevertheless, regional differences in terms of the timing and mechanisms of this feedback. Whereas Chikamoto et al. (2023) emphasized alkalinity reductions associated with Southern Ocean processes, our simulations indicate that alkalinity-driven increases in surface-ocean pCO2 are likely to appear earlier in the Arctic and the Northern Hemisphere subpolar oceans (Fig. A8b). These regional differences are consistent with changes in AMOC strength and associated tracer transport, suggesting that circulation pathways exert an important control on the spatial expression of long-term alkalinity feedbacks. Our simulations indicate that the dominant mechanism underlying these differences is the reduced upward transport of high alkalinity waters to the surface caused by enhanced upper-ocean stratification and changes in overturning circulation, with possible contributions from reduced calcium carbonate export (Fig. A9).
4.1.2 Long-term evolution of ocean buffering capacity and carbonate mineral saturation
Anthropogenic uptake of atmospheric CO2 fundamentally alters the ocean carbonate system by reducing carbonate ion concentrations and the buffering capacity of seawater, which we use as a proxy of defined here as the reciprocal of the Revelle factor. Consistent with earlier coupled climate–carbon cycle simulations (e.g. Orr et al., 2005), our results demonstrate a pronounced decline in buffering capacity throughout the 21st and 22nd centuries, with strong spatial heterogeneity and a clear dependence on emission pathway.
Across all scenarios, the loss of buffering capacity emerges earliest in the Arctic Ocean and the subpolar regions in the Northern Hemisphere (Fig. 6). Low temperatures, relatively low alkalinity, and efficient air–sea gas exchange result in high intrinsic sensitivity to carbon perturbations in these regions, which can, therefore, be considered as early-warning hotspots of carbonate-system vulnerability. Under SSP1–2.6, buffering capacity declines substantially during the 21st and early 22nd centuries, but returns gradually toward present-day values at the global scale as atmospheric and surface-ocean pCO2 values stabilize and decline (Fig. 6a). Nevertheless, reduced buffering capacity persists at high latitudes. Recovery of buffering capacity is incomplete even under strong emission mitigation.
Under SSP5–8.5, buffering capacity continues to decline throughout the simulation period and converges toward its effective minimum values across almost the entire global ocean by the end of the 22nd century (Fig. 6b). This convergence marks a transition toward a weakly buffered carbonate-system regime, in which further increases in DIC generate disproportionately large increases in surface . As buffering weakens, the sensitivity of surface to additional carbon uptake increases, amplifying the effects of ocean warming and alkalinity changes.
Changes in buffering capacity are closely mirrored by the evolution of the aragonite saturation state, Ωarag, highlighting the causal link between carbonate-system sensitivity and the emergence of corrosive conditions for calcium carbonate minerals. Under SSP1–2.6, transient aragonite undersaturation develops in the polar regions toward the end of the 21st century, but much of this area subsequently returns to supersaturated conditions (Fig. A16a and b). By contrast, under SSP5–8.5, aragonite undersaturation expands beyond the high latitudes after 2100, eventually extending over more than half of the global ocean on multi-centennial timescales (Fig. A16e–h).
Our simulations take into account prognostic alkalinity and dynamic air–sea CO2 exchange, but not pH-dependent changes in CaCO3 production and dissolution. In addition, they do not include sediment carbonate dissolution or associated benthic alkalinity feedbacks, which could partially offset surface-ocean alkalinity declines and modify the long-term evolution of ocean buffering capacity and carbon uptake on multi-centennial timescales. Recent work suggests that such carbonate pump feedbacks may partially counteract acidification by increasing alkalinity (Planchat et al., 2024). Consequently, our simulation results may represent overestimates of the long-term reduction in surface-ocean buffering capacity, particularly under sustained high-CO2 conditions. Under these conditions, sedimentary alkalinity feedbacks are expected to become increasingly important.
4.1.3 Controls on deep-ocean carbon sequestration and long-term storage
Across all scenarios, DIC concentrations in the deep ocean continue to increase even after stabilizes or declines, reflecting the long residence times and slow renewal of deep waters. Once anthropogenic carbon is transported below the surface, it is sequestered in the ocean interior for centuries to millennia and becomes a long-lived memory of past emissions in the climate system.
The implications of this storage are clarified using . Potential oceanic pCO2 isolates the biogeochemical imprint on subsurface carbon and can be used as a diagnostic of the ocean interior's potential to absorb or release CO2 upon ventilation.
Under SSP1–2.6, develops pronounced maxima at intermediate depths and exceeds even in the deep ocean by the mid–23rd century (Fig. 8a–d). This indicates that, although strong emission mitigation limits perturbations in the surface ocean, much of the carbon stored in the ocean interior would have the potential to outgas if deep waters were re-exposed to the surface, highlighting the delayed reversibility of oceanic carbon uptake.
Under SSP5–8.5, exhibits strong vertical gradients (Fig. 8e–h). Elevated values are confined to the thermocline and values in the deep ocean remain persistently low, indicating that the rapid rise in outpaces deep ocean ventilation. As a result, the deep ocean remains far from chemical equilibrium with the atmosphere despite continued DIC accumulation. Consequently, the deep ocean retains substantial capacity for further CO2 uptake, highlighting that carbon storage and chemical equilibration proceed on different timescales under sustained high emissions.
Examination of the preformed and regenerated components of deep-ocean carbon storage further highlights the complementary roles of the physical and biological pumps in long-term carbon sequestration (Fig. 1b). Although detritus export declines under the high-emission scenarios, regenerated carbon storage continues to increase. This contrasting behavior suggests that long-term regenerated carbon storage is influenced not only by biological export but also by changes in ocean circulation and water-mass residence time. Nevertheless, preformed carbon remains the dominant contributor to the long-term increase in deep-ocean carbon storage. These results suggest that changes in ocean circulation remain a primary control on long-term carbon sequestration, whereas biological processes continue to influence the redistribution and storage of carbon within the ocean interior.
The accumulation of DIC along AABW pathways further underscores the importance of deep-ocean circulation in regulating long-term carbon storage. Freshwater input from ice-sheet melt, which is not included in the present simulations, is expected to amplify the long-term impact of anthropogenic carbon storage on seawater chemistry by reducing AABW formation and deep ocean ventilation. The resulting increase in deep-water residence time would prolong the isolation of carbon-rich waters from the atmosphere, reinforcing deep-ocean acidification (Lago and England, 2019; Chen et al., 2023).
4.1.4 Ocean circulation controls on biological productivity
Simulation results for detritus export at the depth of 100 m vary substantially across emission scenarios. Detritus export is projected to increase over the long term under SSP1–2.6 and SSP2–4.5, but to decrease under SSP3–7.0 and SSP5–8.5 (Fig. 2a). Most of this divergence develops during the 21st century and closely follows the rapid adjustment of the large-scale ocean circulation. Detritus export declines as the weakening of the AMOC becomes more pronounced under stronger forcing; this transition occurs when exceeds approximately 3 times the pre-industrial level (Fig. 3). Consequently, the long-term behavior of detritus export is largely established by the end of the 21st century and remains comparatively stable thereafter. This behavior is difficult to identify from end-of-century analyses alone. Detritus export decreases across the high-latitude North Atlantic under all scenarios. The largest decline occurrs under SSP5–8.5, in which the magnitude of AMOC weakening is also the largest (Fig. 2d).
Under SSP5–8.5, enhanced nutrient trapping within the AABW cell after 2250 leads to a sustained reduction in surface nutrient availability, particularly at low and mid-latitudes (Fig. A4). This nutrient sequestration in the deep ocean coincides with declining biological productivity in regions such as the equatorial Pacific, contributing to long-term reductions in biological export (Fig. 2d). On the basis of the available model diagnostics, it is unclear whether this low-latitude decrease is a consequence of the changes in the Southern Ocean (Moore et al., 2018) or is associated with local changes resulting from the interplay between water mass renewal and remineralization under large perturbations (Rodgers et al., 2024). Attribution of the cause of these low-latitude changes will require model sensitivity studies in the future and is beyond the scope of this study.
4.1.5 Ecological implications of multiple stressors
We found pronounced contrasts across ecosystem stress indicators and emission scenarios, reflecting interactions between physical, chemical, and biogeochemical changes and cumulative effects. Considering that Ωarag and Ωcalc integrate the effects of anthropogenic CO2 uptake, we have included them as indicators of ecosystem stress in this study. Their values can indicate increased energetic costs and reduced fitness in calcifying organisms and have often been used as ecologically relevant thresholds.
Under SSP1–2.6, ecosystem stress remains comparatively limited and several indicators gradually recover toward present-day conditions (Fig. A11a–c). However, recovery is slow and spatially heterogeneous, with polar and subpolar ecosystems remaining close to critical thresholds for centuries (Fig. 10). Persistent anomalies in temperature, nutrient availability, oxygen, and alkalinity indicate that ecological recovery may substantially lag behind the stabilization of atmospheric forcing.
As illustrated by the results from the intermediate-emission scenario SSP2–4.5, ecosystem responses are not determined solely by the magnitude of atmospheric forcing. Under SSP2–4.5, warming, ocean acidification, and altered nutrient distributions continue to cause ecosystem stress to intensify although the increase in slows after 2100 (Fig. 10). These results demonstrate that marine ecosystem stress depends on the persistence of ocean biogeochemical change as well as on the trajectory of .
Under SSP5–8.5, ecosystem stress becomes widespread throughout nearly all ocean basins (Fig. A11g–i). Consistent with previous 21st-century projections (e.g., Kwiatkowski et al., 2020), stress first emerges in tropical and high-latitude regions, but our extended simulations reveal continued expansion and intensification well beyond 2100. The coexistence of persistent warming, declining nutrient availability, widespread ocean acidification, and prolonged carbonate mineral undersaturation indicates a transition toward ecosystem states with multiple chronic stressors and limited potential for recovery.
The extended simulations also reveal distinct long-term behaviors of Ωarag and Ωcalc (Fig. A16). Because calcite generally remains supersaturated at lower saturation states than aragonite, the emergence of calcite undersaturation represents a more severe perturbation of seawater carbonate chemistry. Under SSP1–2.6, aragonite undersaturation develops transiently in polar regions (Fig. A16a–d), whereas calcite remains largely supersaturated (Fig. A16i–l). By contrast, under SSP5–8.5, calcite undersaturation expands into subpolar regions (Fig. A16m–p), indicating that high-emission pathways may push marine ecosystems beyond chemical thresholds associated with substantially lower resilience.
Together, these results demonstrate that emission pathways determine not only the magnitude but also the persistence and reversibility of marine ecosystem stress. Strong emission mitigation substantially limits cumulative impacts but does not eliminate the long-term ecological legacy of anthropogenic forcing.
These findings also have implications for marine ecosystem impact assessments. Outputs from ESMs are widely used as environmental forcing for higher-trophic-level ecosystem models. For example, the CMIP6-driven FishMIP simulations project substantial declines in global marine animal biomass together with pronounced regional redistributions of marine ecosystems under future climate change (Tittensor et al., 2021). Our results suggest that ecosystem responses may continue to evolve for centuries after atmospheric forcing has stabilized because key stressors, including ocean acidification, carbonate mineral saturation, nutrient availability, and warming, continue to change beyond the 21st century. Extending ESM simulations beyond the conventional 2100 time horizon may therefore improve assessments of long-term marine ecosystem responses and their implications for fisheries and ecosystem services.
4.2 Implications for future ocean carbon uptake
Here, we synthesize the implications of the multi-centennial ocean responses that we have identified in this study for the long-term behavior of the climate–carbon cycle system. Our results demonstrate that even after the stabilization of and surface temperatures around the mid–22nd century, the ocean continues to absorb, redistribute, and store carbon over subsequent centuries. The deep ocean therefore does not reach a passive equilibrium once surface conditions stabilize, but remains an active component of the carbon cycle because of ongoing circulation and biogeochemical processes.
In particular, DIC accumulating along AABW pathways is physically isolated from the surface and retained in the ocean interior over long timescales, contributing to progressive deep-ocean acidification. This transport and storage of carbon persists on millennial timescales (Yamamoto et al., 2018; Hajima et al., 2020b), providing a clear illustration of emission legacy – the long-term impacts of past and present greenhouse gas emissions that endure even after atmospheric forcing stabilizes. Such behavior reflects the inertia of the ocean and the broader Earth system, underscoring the potential for long-lasting changes in deep-ocean chemistry and climate.
With respect to ocean carbon chemistry, our analysis of buffering capacity indicates that the ocean approaches a limit in its ability to absorb additional CO2. Although these simulations are concentration-driven and is prescribed, the emergence of a near-minimum buffering regime implies that, under emission-driven scenarios, declining oceanic uptake efficiency could substantially amplify climate–carbon cycle feedbacks.
By extending simulations beyond the conventional cutoff of 2100 and evaluating ocean responses under scenarios extended to 2500, this study expands the temporal scope of future projections. A robust understanding of ocean response timescales is essential for assessing long-term Earth system stability, particularly in the context of climate mitigation strategies, emission legacy, and the potential deployment of negative emissions technologies.
4.3 Future challenges and uncertainties
In this study, we have presented simulation results that provide new insight into multi-centennial ocean biogeochemical responses. Because of limitations associated with model structure, experimental design, and the representation of key Earth-system processes, several uncertainties remain. Addressing these uncertainties will be essential for improving the robustness of long-term climate projections and the application of long-term projections to marine ecosystem and climate-impact assessments.
4.3.1 Model structural uncertainty
A major source of uncertainty arises from structural differences among ESMs, especially in terms of model representations of the carbon cycle and marine biogeochemistry. Previous multi-model analyses have demonstrated substantial spread in projections of NPP, biological export, and ocean acidification, reflecting differences in nutrient limitation, ecosystem parameterizations, biological pump formulations, and carbonate chemistry (Bopp et al., 2013; Kwiatkowski et al., 2020; Bopp et al., 2022).
The simulations presented in this study show contrasting responses of detritus export across emission scenarios, which can largely be explained by the combined influence of atmospheric CO2 forcing and changes in large-scale ocean circulation (Fig. 3). Under high-emission scenarios, weakening of the AMOC reduces nutrient resupply to the North Atlantic and suppresses detritus export, whereas detritus export is maintained or enhanced under lower-emission scenarios because the overturning circulation remains comparatively stable.
However, CMIP-class ESMs vary in terms of their simulations of the mean state, and deep convection of the overturning circulation (Weijer et al., 2020; Masson-Delmotte et al., 2021). These uncertainties and those associated with the magnitude and timing of AMOC weakening propagate through to projections of nutrient supply, marine productivity, and carbon export. Accordingly, uncertainties in biological export projections are associated with those in the simulated physical climate response as well as model parameterizations of the ecosystem.
The concentration-driven experimental design also represents an important source of uncertainty. Because is prescribed, feedbacks between anthropogenic emissions, the coupled climate system, and the carbon cycle are not represented explicitly. Previous comparisons between concentration- and emission-driven experiments have shown differences in ocean carbon uptake trajectories and stronger climate–carbon feedbacks in emission-driven simulations (Friedlingstein et al., 2014, 2025). In this study, we have identified future declines in buffering capacity and ocean carbon uptake, which may have larger magnitudes under fully coupled emission-driven scenarios.
4.3.2 Missing Earth-system processes
Several processes that become increasingly important on centennial-to-millennial timescales, such as interactive ice-sheet dynamics, carbonate dissolution in marine sediments and coral reefs, and associated alkalinity feedbacks, are not represented in the MIROC-ES2L model framework used in the present study.
Freshwater input from ice sheet melt has long been recognized as a key driver of large-scale ocean circulation changes, particularly through its influence on buoyancy-driven overturning (Rahmstorf, 2002). Recent studies have shown that Antarctic ice sheet melt can weaken AABW formation, alter Southern Ocean circulation, and substantially modify ocean carbon uptake and storage (Bronselaer et al., 2018, 2020), whereas freshwater perturbations from the Greenland Ice Sheet have been shown to reduce ocean carbon uptake through their influence on the AMOC (Swingedouw et al., 2007). The omission of dynamic freshwater forcing in the present study therefore represents an important source of uncertainty in projections of long-term ocean carbon storage and acidification.
Additionally, the magnitudes of the reductions in surface-ocean alkalinity and buffering capacity may have been overestimated in our simulations, which did not take into account sediment carbonate dissolution declining coral reef calcification, and benthic alkalinity feedbacks (Kwiatkowski et al., 2025). Sediment dissolution supplies alkalinity to the ocean, partially compensates for ocean acidification, and weakens the long-term decline in carbonate buffering capacity. On longer timescales, carbonate compensation provides one of the principal negative feedbacks regulating atmospheric CO2 and restoring ocean carbonate chemistry (Archer et al., 1998; Archer and Brovkin, 2008).
Furthermore, continental shelf and coastal oceans and are strongly influenced by terrestrial carbon and nutrient inputs but are poorly resolved in coarse-resolution global models (Yamamoto et al., 2022). River-derived carbon may drive oceanic CO2 outgassing that is equivalent to approximately 20 % of present anthropogenic ocean carbon uptake (Lacroix et al., 2020; Regnier et al., 2022). Therefore, the biogeochemical responses in the continental shelf and coastal oceans represent another important source of uncertainty in the long-term projections reported in this study.
4.3.3 Future directions
Future modeling efforts should prioritize improving the coupling between ice sheets and the ocean, as well as targeted sensitivity experiments that explore the impact of freshwater perturbations on long-term carbon cycle dynamics. Improved land–ocean coupling and higher-resolution global simulations are also needed. Beyond these physical and Earth system interactions, further progress will require improved representation of biogeochemical and ecological processes.
At present, ecosystem responses in ESMs are commonly assessed using aggregated physical and biogeochemical stress indicators, rather than explicit representations of species- or community-level dynamics. Such simplified representations limit the ability of current models to capture ecosystem complexity, biodiversity responses, and trophic interactions, particularly at higher trophic levels (Stock et al., 2017; Lotze et al., 2019). Recent studies incorporating multiple plankton functional types demonstrate that accounting for greater ecosystem complexity can substantially alter projected community composition and functional structure under climate change (Henson et al., 2022). Addressing these limitations will require the integration of ecosystem models that explicitly represent multiple plankton functional types and higher trophic levels, together with sustained observational constraints.
In addition to ecosystem complexity, seasonal variability represents another important dimension of future ecological change. Although this study focuses on annual mean states and long-term trends, changes in the timing and amplitude of seasonal cycles can substantially alter the seasonal exposure of marine organisms to acidification stress (Kwiatkowski and Orr, 2018; Orr et al., 2022).
Another important source of uncertainty concerns the strength and nonlinearity of climate–carbon feedbacks associated with ocean carbonate chemistry. Although projections of ocean acidification are relatively robust, substantial uncertainty still remains with respect to the timing and magnitude of changes in buffering capacity and the resulting limits on long-term ocean carbon uptake (Orr et al., 2005; Egleston et al., 2010). Biases in the simulated Revelle factor have also been linked to biases in projected ocean carbon uptake across CMIP6 models (Terhaar et al., 2022).
Future progress will require coordinated multi-model experiments that extend beyond the conventional 2100 horizon while incorporating improved representations of ocean circulation, carbonate chemistry, sediment processes, ice-sheet interactions, and marine ecosystem dynamics.
In this study, we presented comprehensive analyses of ESM simulations from MIROC-ES2L and examined the sensitivity of ocean biogeochemistry and ocean biogeochemical fluxes under a range of anthropogenic emission scenarios extended to the year 2500. This timescale is much longer than the timescale that is typically used in climate projection studies. Our results confirm that changes can persist over multiple centuries, with broad implications for human resource management and ecosystem health. Importantly, our results underscore the value of choosing a low-emission strong-mitigation pathway (rather than a high-emission weak-mitigation pathway) in promoting both ocean health and limiting marine ecosystem stress over these extended timescales. Emission mitigation substantially reduces many of the deleterious impacts of the forcing produced by high emissions, including warming, deoxygenation, and reduced availability of nutrients in the euphotic zone.
In terms of the carbon cycle, the ocean is projected to continue to absorb CO2 from the atmosphere beyond the 21st century, leading to sustained accumulation of DIC in the deep ocean. This is especially evident along pathways of AABW, where acidification in the deep ocean also intensifies. Analysis of the buffering capacity reveals a substantial weakening of the ocean's carbonate buffering system under SSP5–8.5, indicating a decline in the efficiency of oceanic CO2 uptake in the future. This weakening is delayed in the Southern Ocean because of the increase in biological export and influence of deep water masses.
Biological export exhibits a pronounced dependence on the trajectory of . Detritus export increases under low-emission scenarios but declines under sustained high-emission scenarios, with the transition occurring when reaches approximately 3 times the preindustrial level. Although this threshold behavior reflects the combined influence of multiple physical and biogeochemical processes, it is closely associated with changes in large-scale ocean circulation, particularly the weakening of the AMOC and the resulting redistribution of nutrients.
Ecosystem stressors – warming, acidification, and deoxygenation – are projected to expand in both space and time. Even under the low-emission scenario SSP1–2.6, return to modern-day levels is delayed by roughly 100 years, whereas under SSP2–4.5, more areas are stressed and ecosystem stress is projected to intensify through the 25th century. In the Southern Ocean, the aragonite saturation state is projected to fall below 1.0 by 2100 under SSP5–8.5, posing serious risks to calcifying organisms. Furthermore, reduced deep-ocean ventilation in the North Atlantic, North Pacific, and Southern Ocean is expected to drive oxygen loss outside current OMZs.
These findings underscore the importance of accounting for sustained and delayed ocean responses in climate projections beyond the 21st century. Long-term simulations extending to the year 2500 show that persistent anthropogenic forcing leads to profound and long-lasting alterations in ocean biogeochemistry, particularly through changes in the polar regions and the deep ocean. Weakening and reorganization of the overturning circulation result in the redistribution of biogeochemical tracers over multi-centennial timescales, reducing the ocean's capacity to buffer and limiting future carbon uptake. As a consequence, deep-ocean acidification intensifies, especially along AABW pathways, raising concerns about persistent impacts on benthic ecosystems and highlighting the need to place high priority on these processes in future model development and climate policy planning.
These findings highlight long-term (multi-centennial) memory of the ocean interior of climate perturbations and have a number of broad implications. One of them is the reversibility of such changes under climate stabilization. Because perturbations persist in the deep ocean under high-emission scenarios, identification of the timescales of the persistence of marine biogeochemical perturbations should be a priority in future studies. Fully understanding reversibility will likely require developing attribution methods that can deconvolve the direct effects of warming on biogeochemical cycling and the indirect effects as manifested through changes in circulation. This will provide insight into the indirect contributions of weakening overturning circulation structures to global biogeochemical change and facilitate assessments of the relative contribution of the direct effect of warming on biogeochemical processes beyond 2100 or 2150 and its temporal variability.
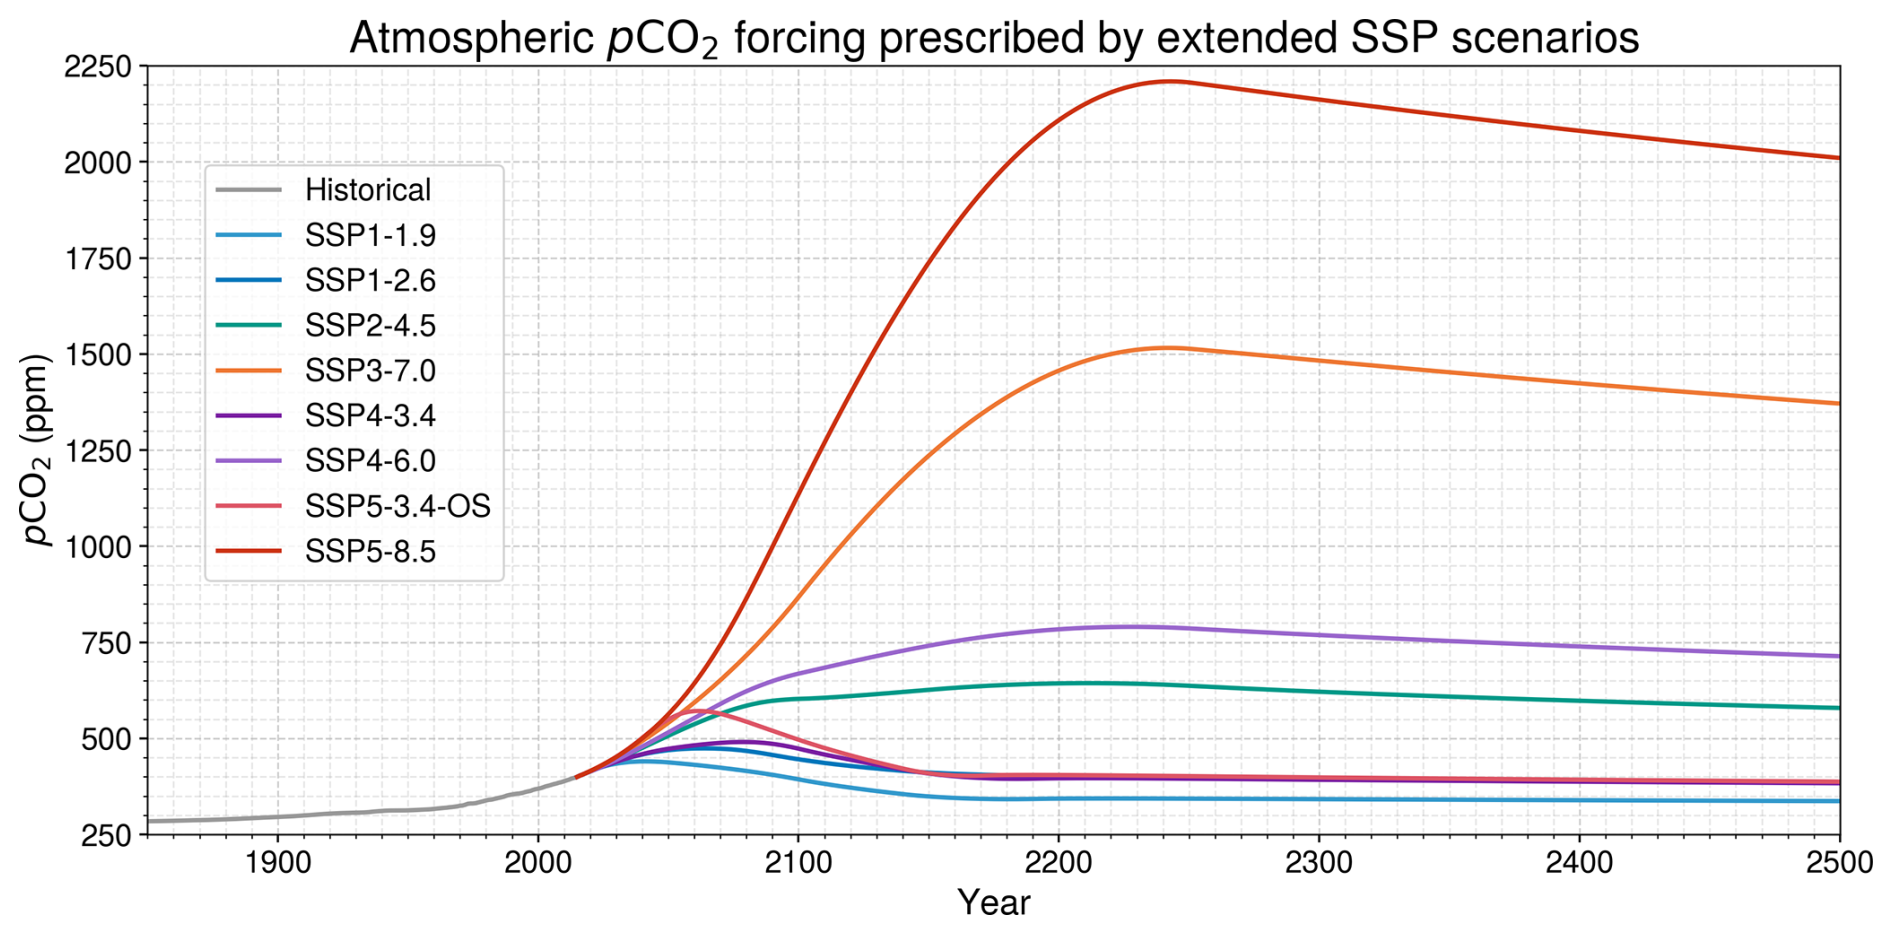
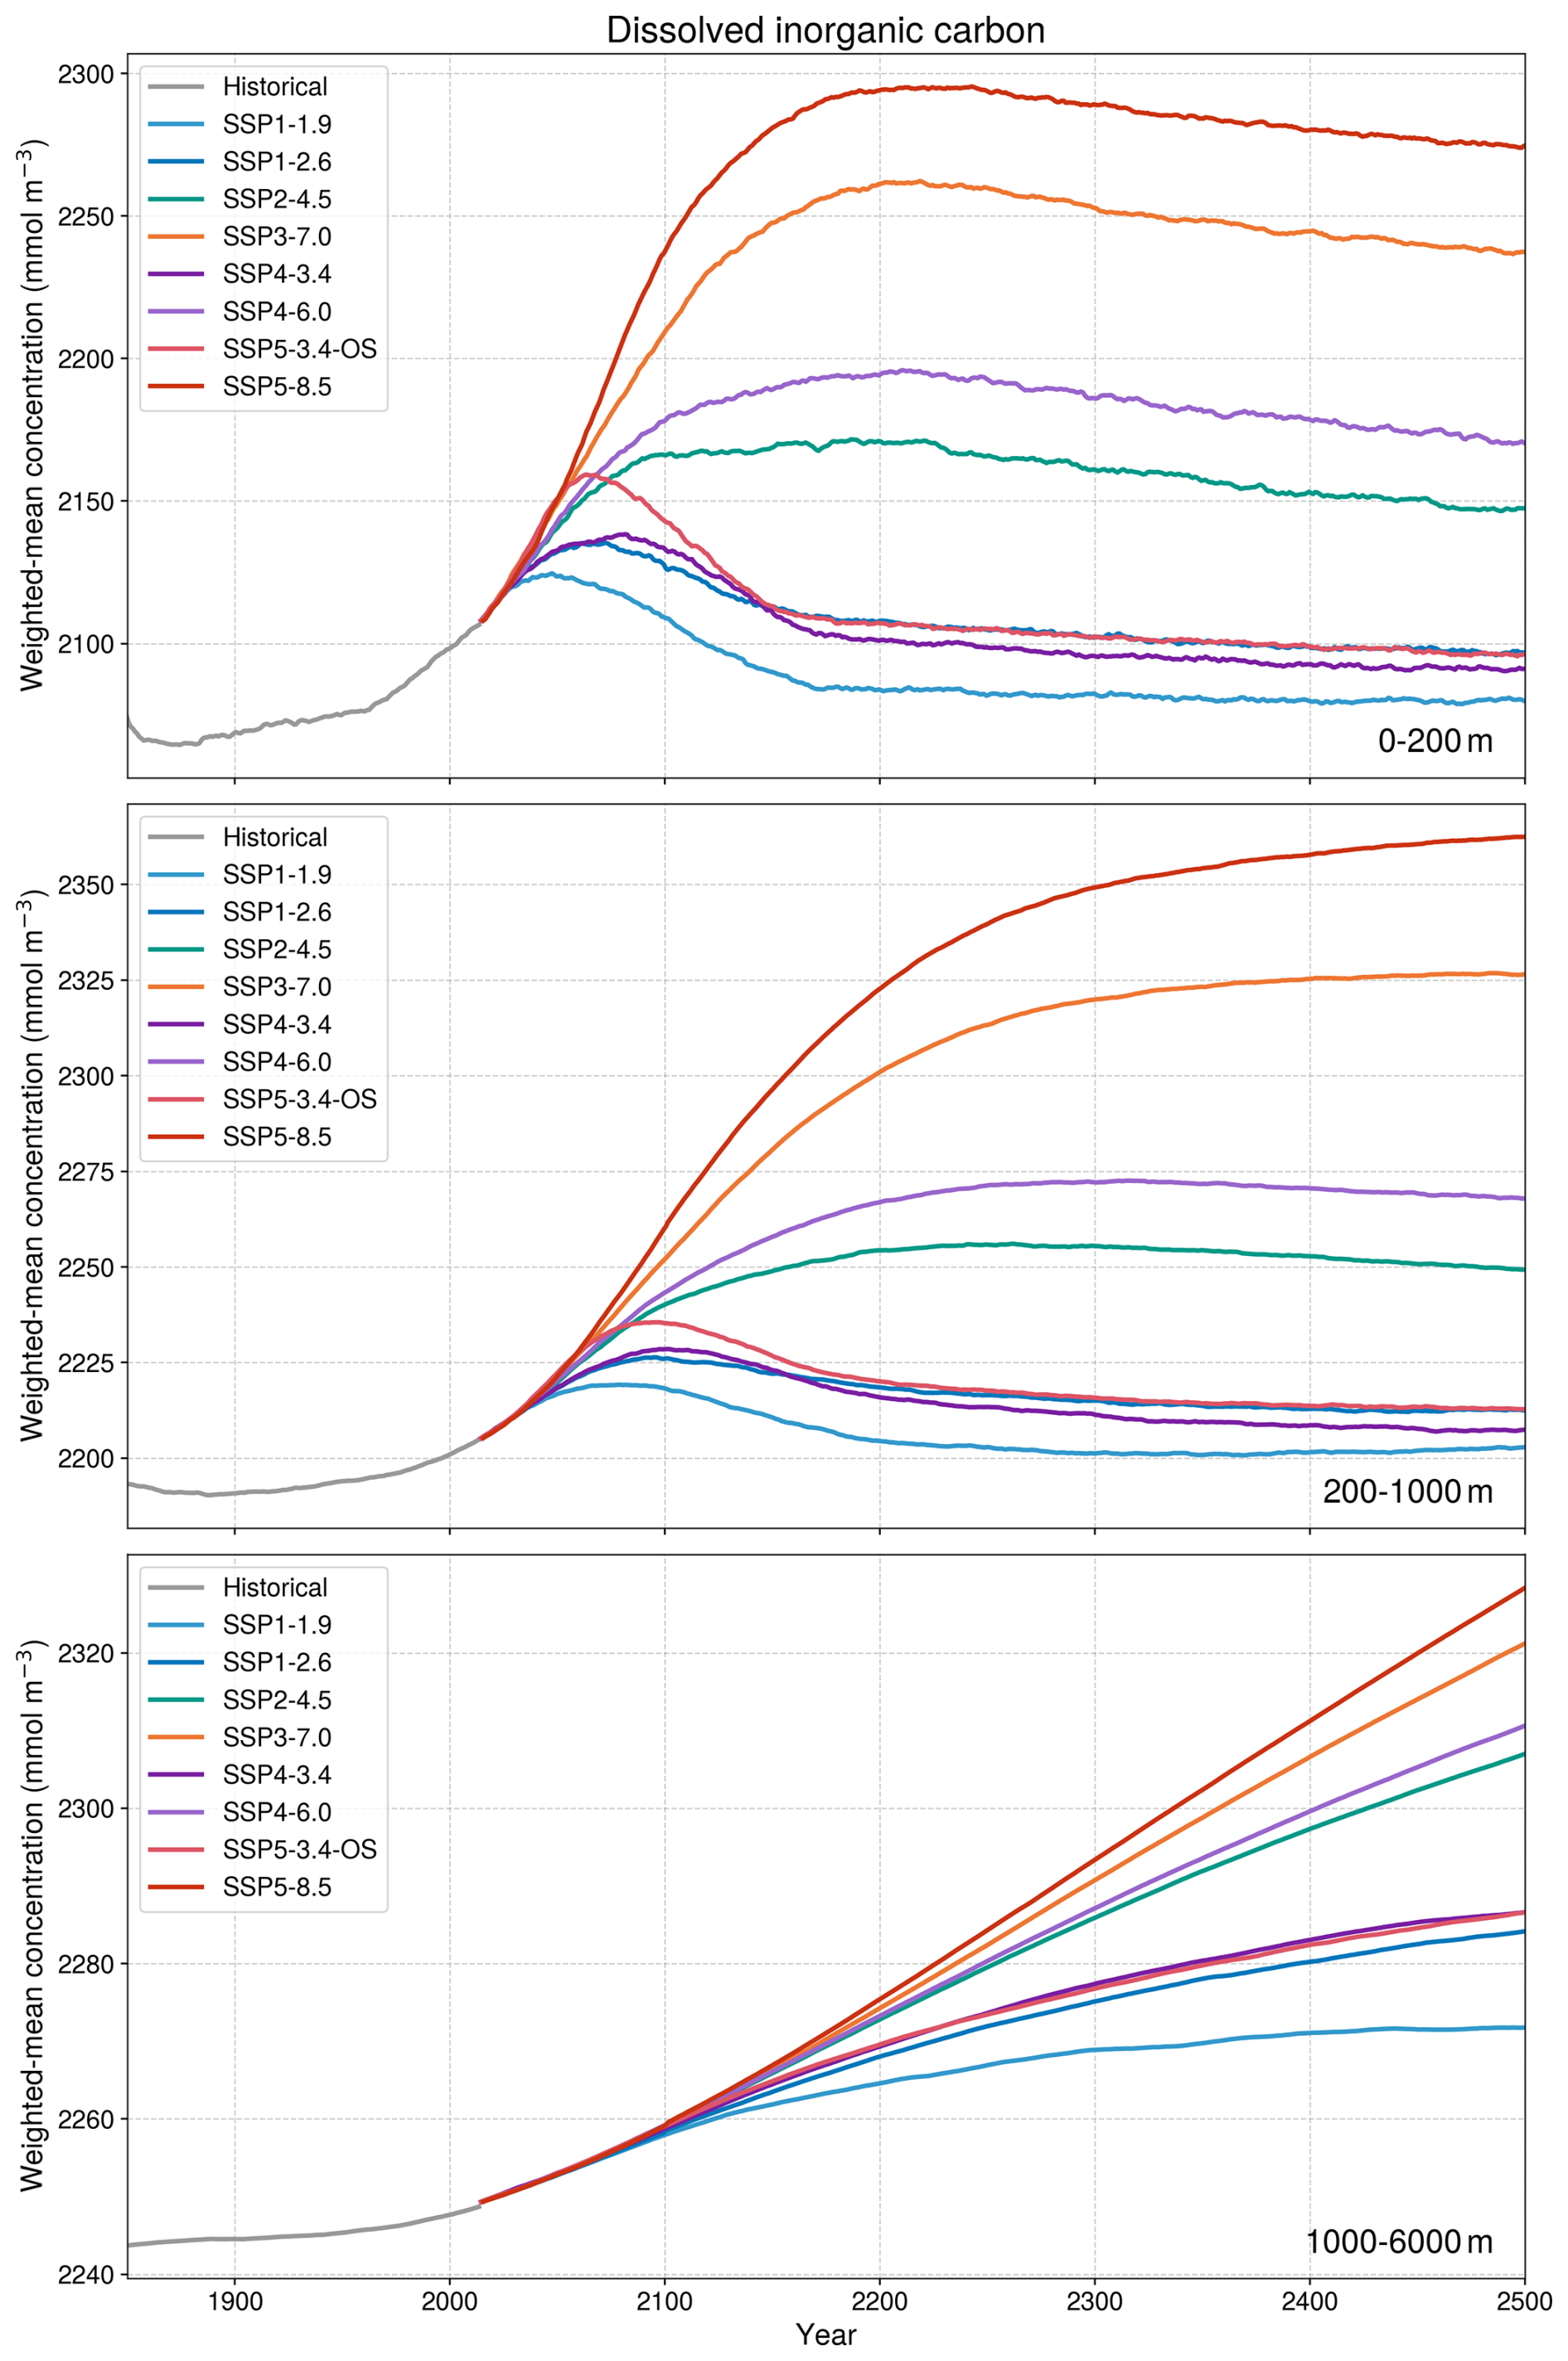
Figure A2Surface DIC follows atmospheric pCO2, whereas deep-ocean DIC continues to increase gradually over centuries. Depth-integrated DIC concentrations (unit: mmol m−3) in three ocean layers (0–200, 200–1000, and 1000–6000 m), simulated under the extended SSP scenarios.
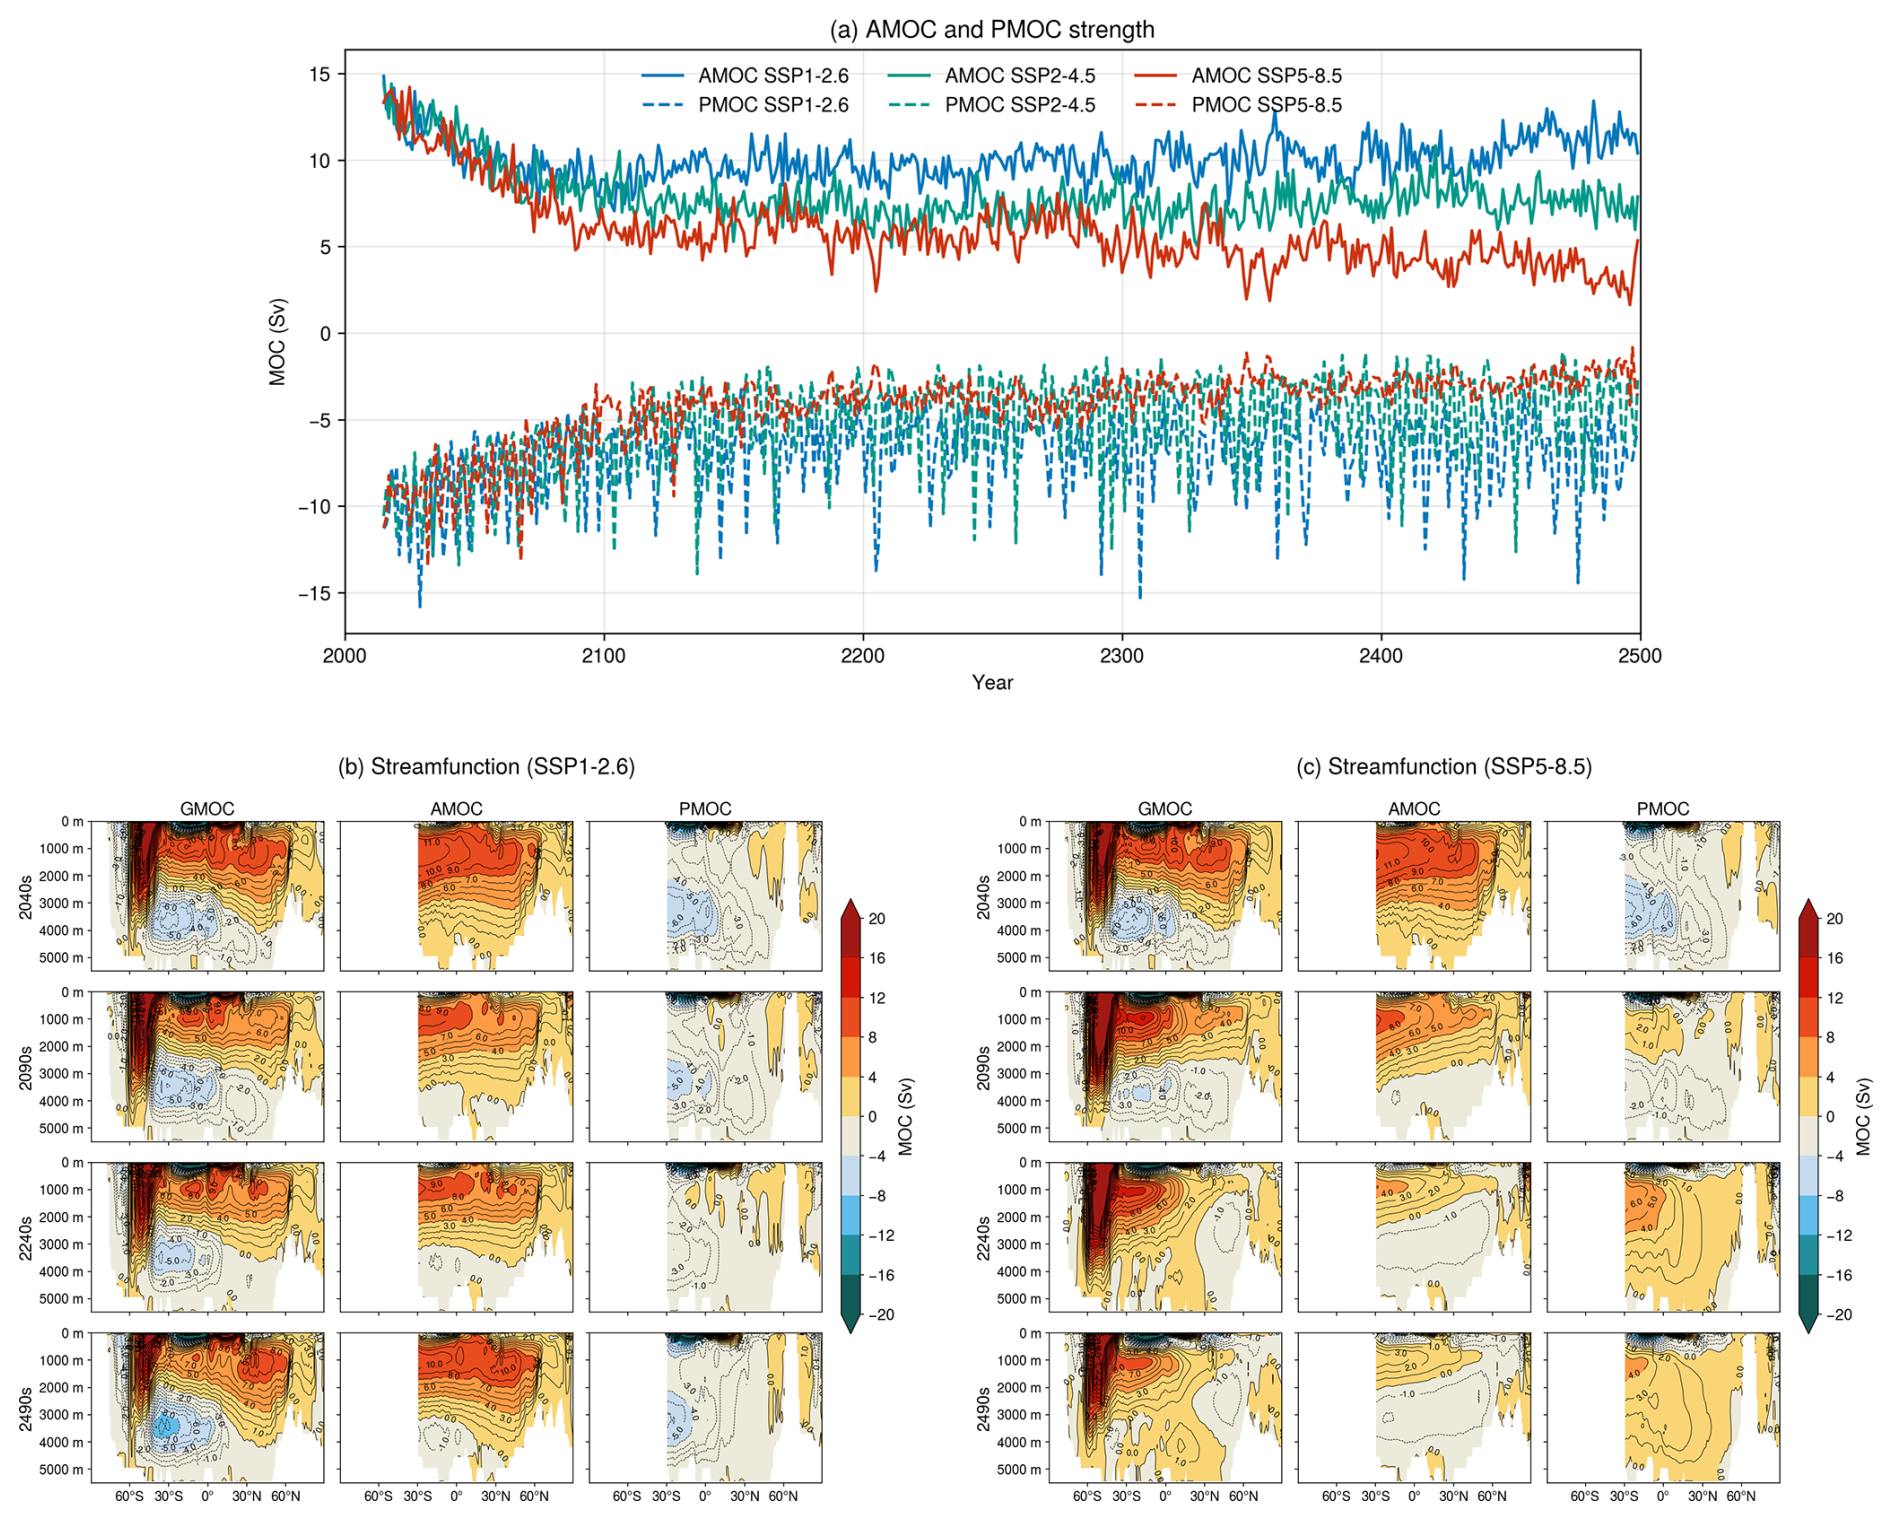
Figure A3Under SSP5–8.5, the AMOC becomes much weaker and shallower by the end of the 21st century. (a) Time series of AMOC and Pacific Meridional Overturning Circulation (PMOC) strength under SSP1–2.6, SSP2–4.5, and SSP5–8.5. AMOC and PMOC strengths are defined as the maximum meridional overturning streamfunction over 31–90° N and 500–5400 m depth in the Atlantic and 30° S–90° N and 1000–5400 m depth in the Pacific, respectively. Meridional overturning streamfunctions in the global, Atlantic, and Pacific Oceans for (b) SSP1–2.6 and (c) SSP5–8.5.
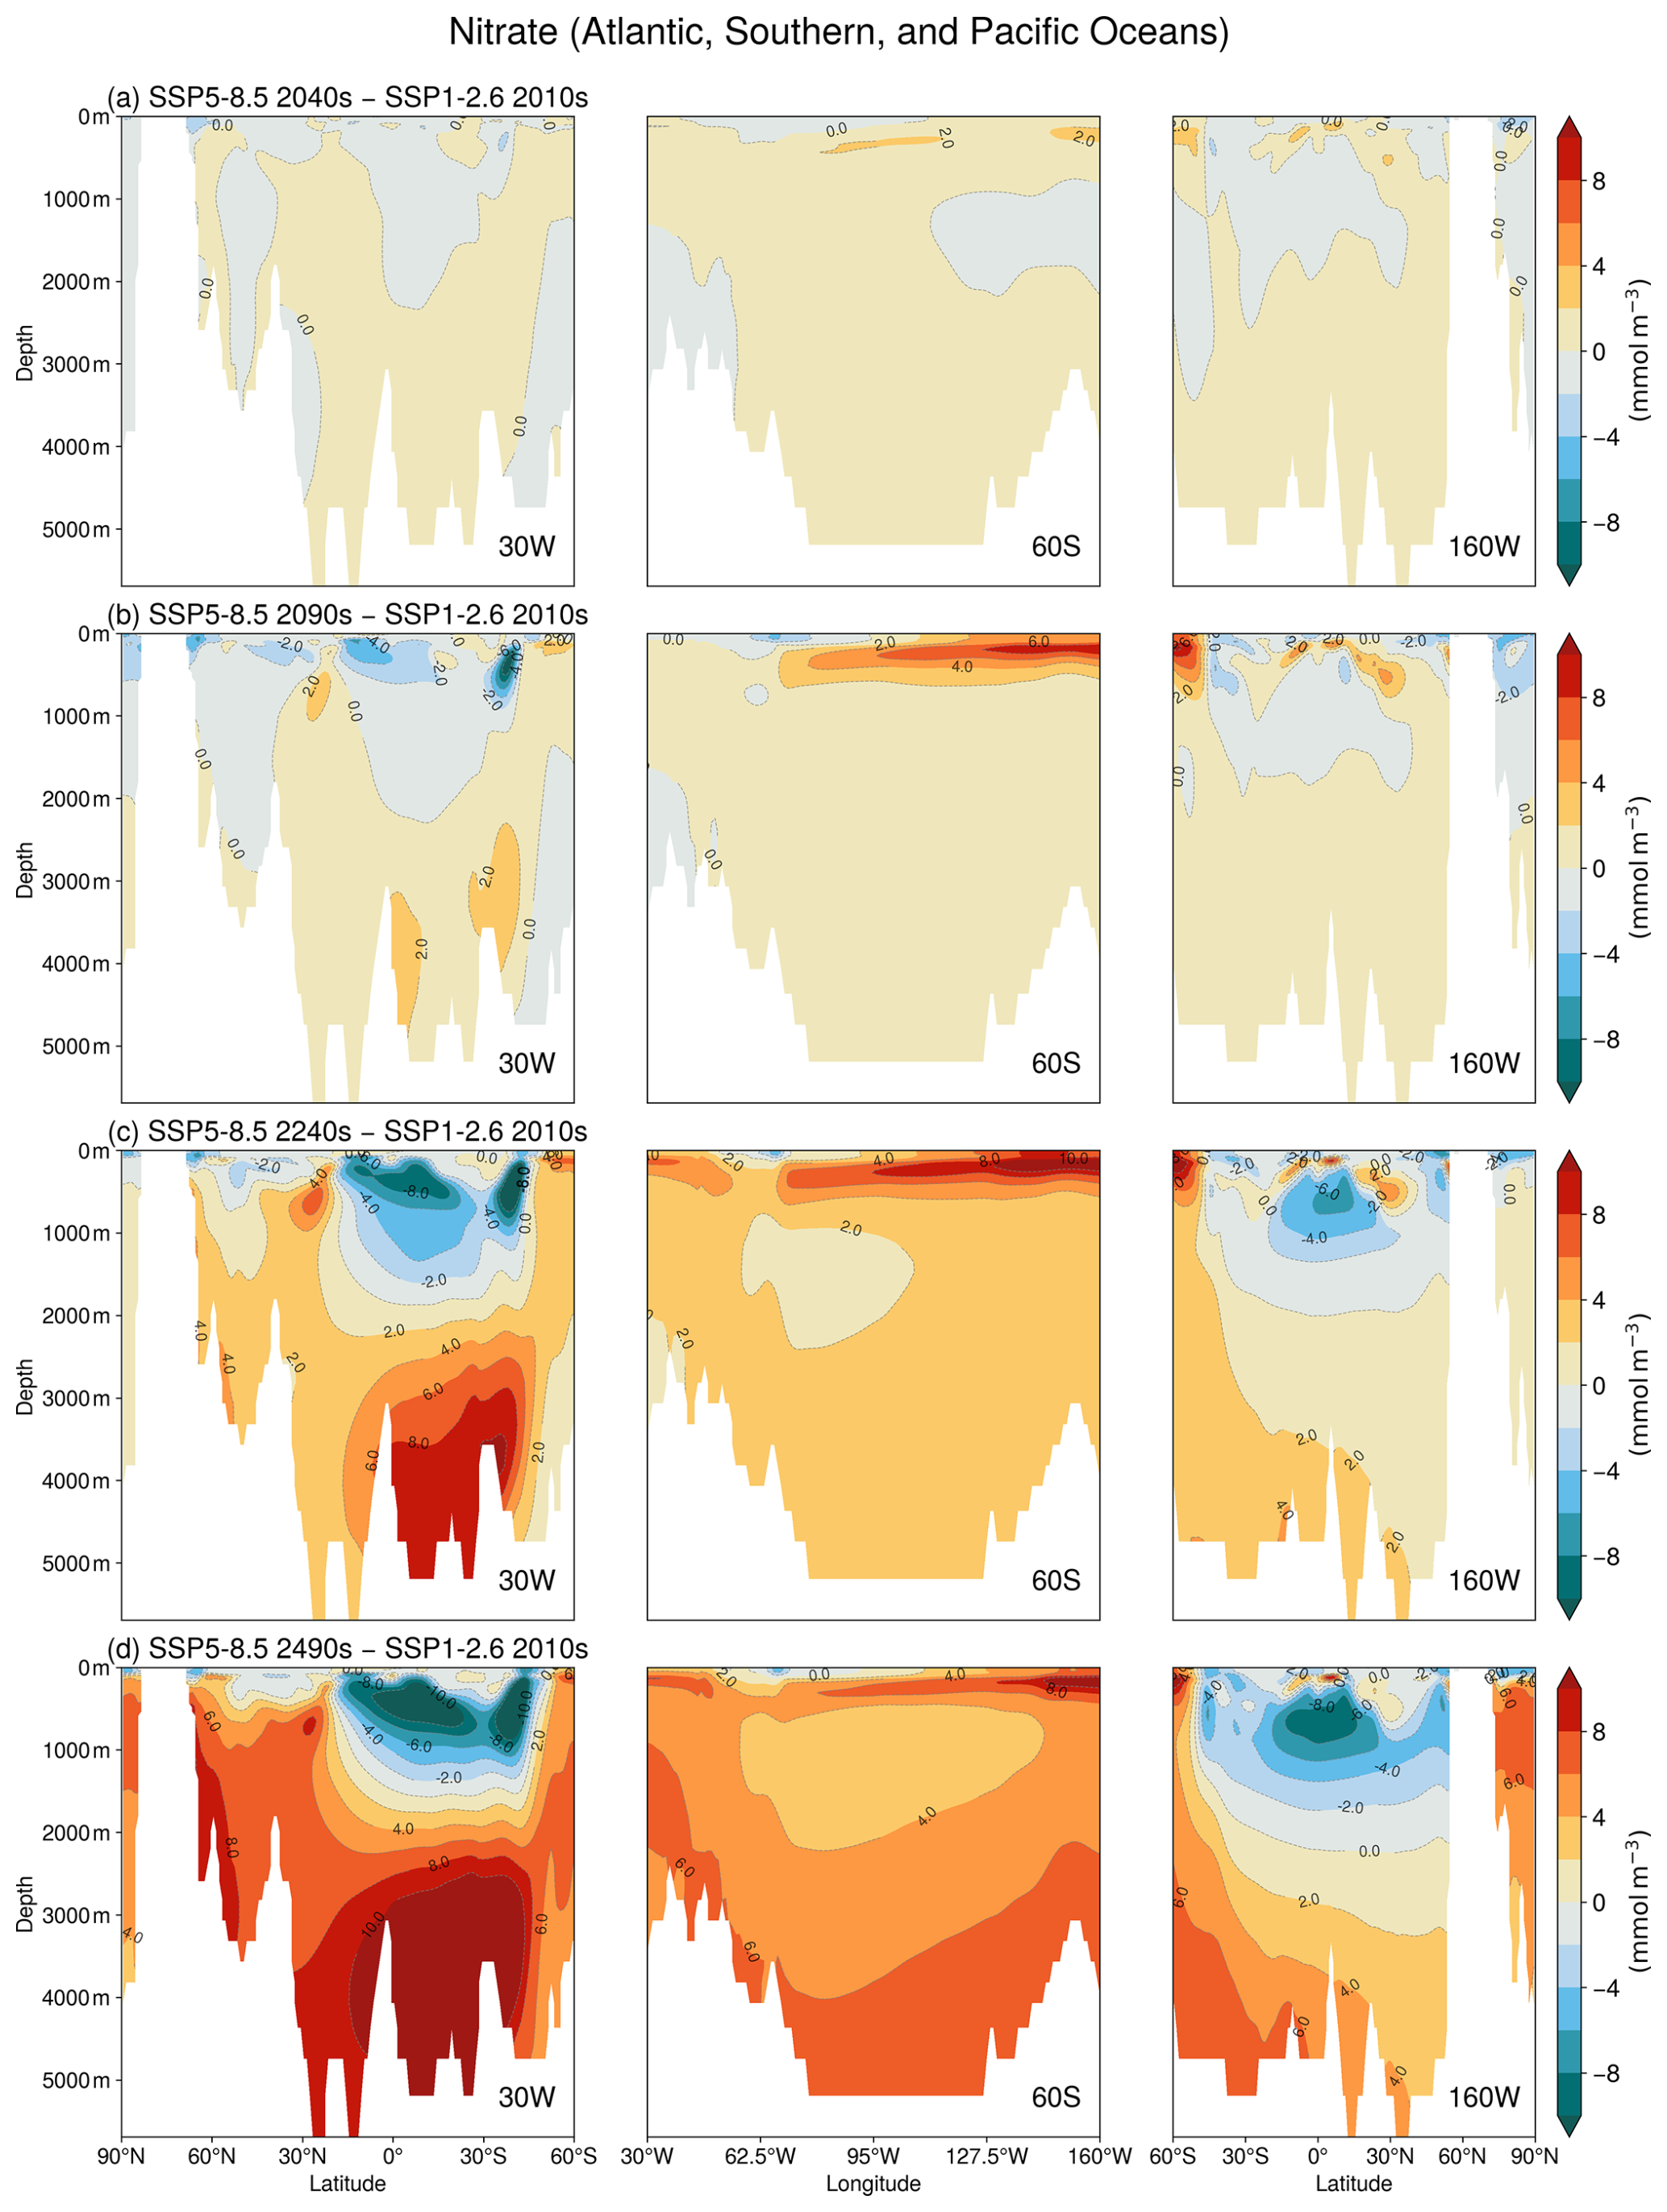
Figure A4Nutrients accumulate in AABW cells, whereas subsurface nutrients decrease in low latitudes. Zonal mean vertical sections of nitrate concentration anomalies (unit: mmol m−3) under SSP5–8.5. From left to right, the panels show longitudinally averaged sections for the Atlantic, Southern, and Pacific Oceans. From top to bottom, rows represent anomalies for the (a) 2040s, (b) 2090s, (c) 2240s, and (d) 2490s, relative to the 2010s average under SSP1–2.6.
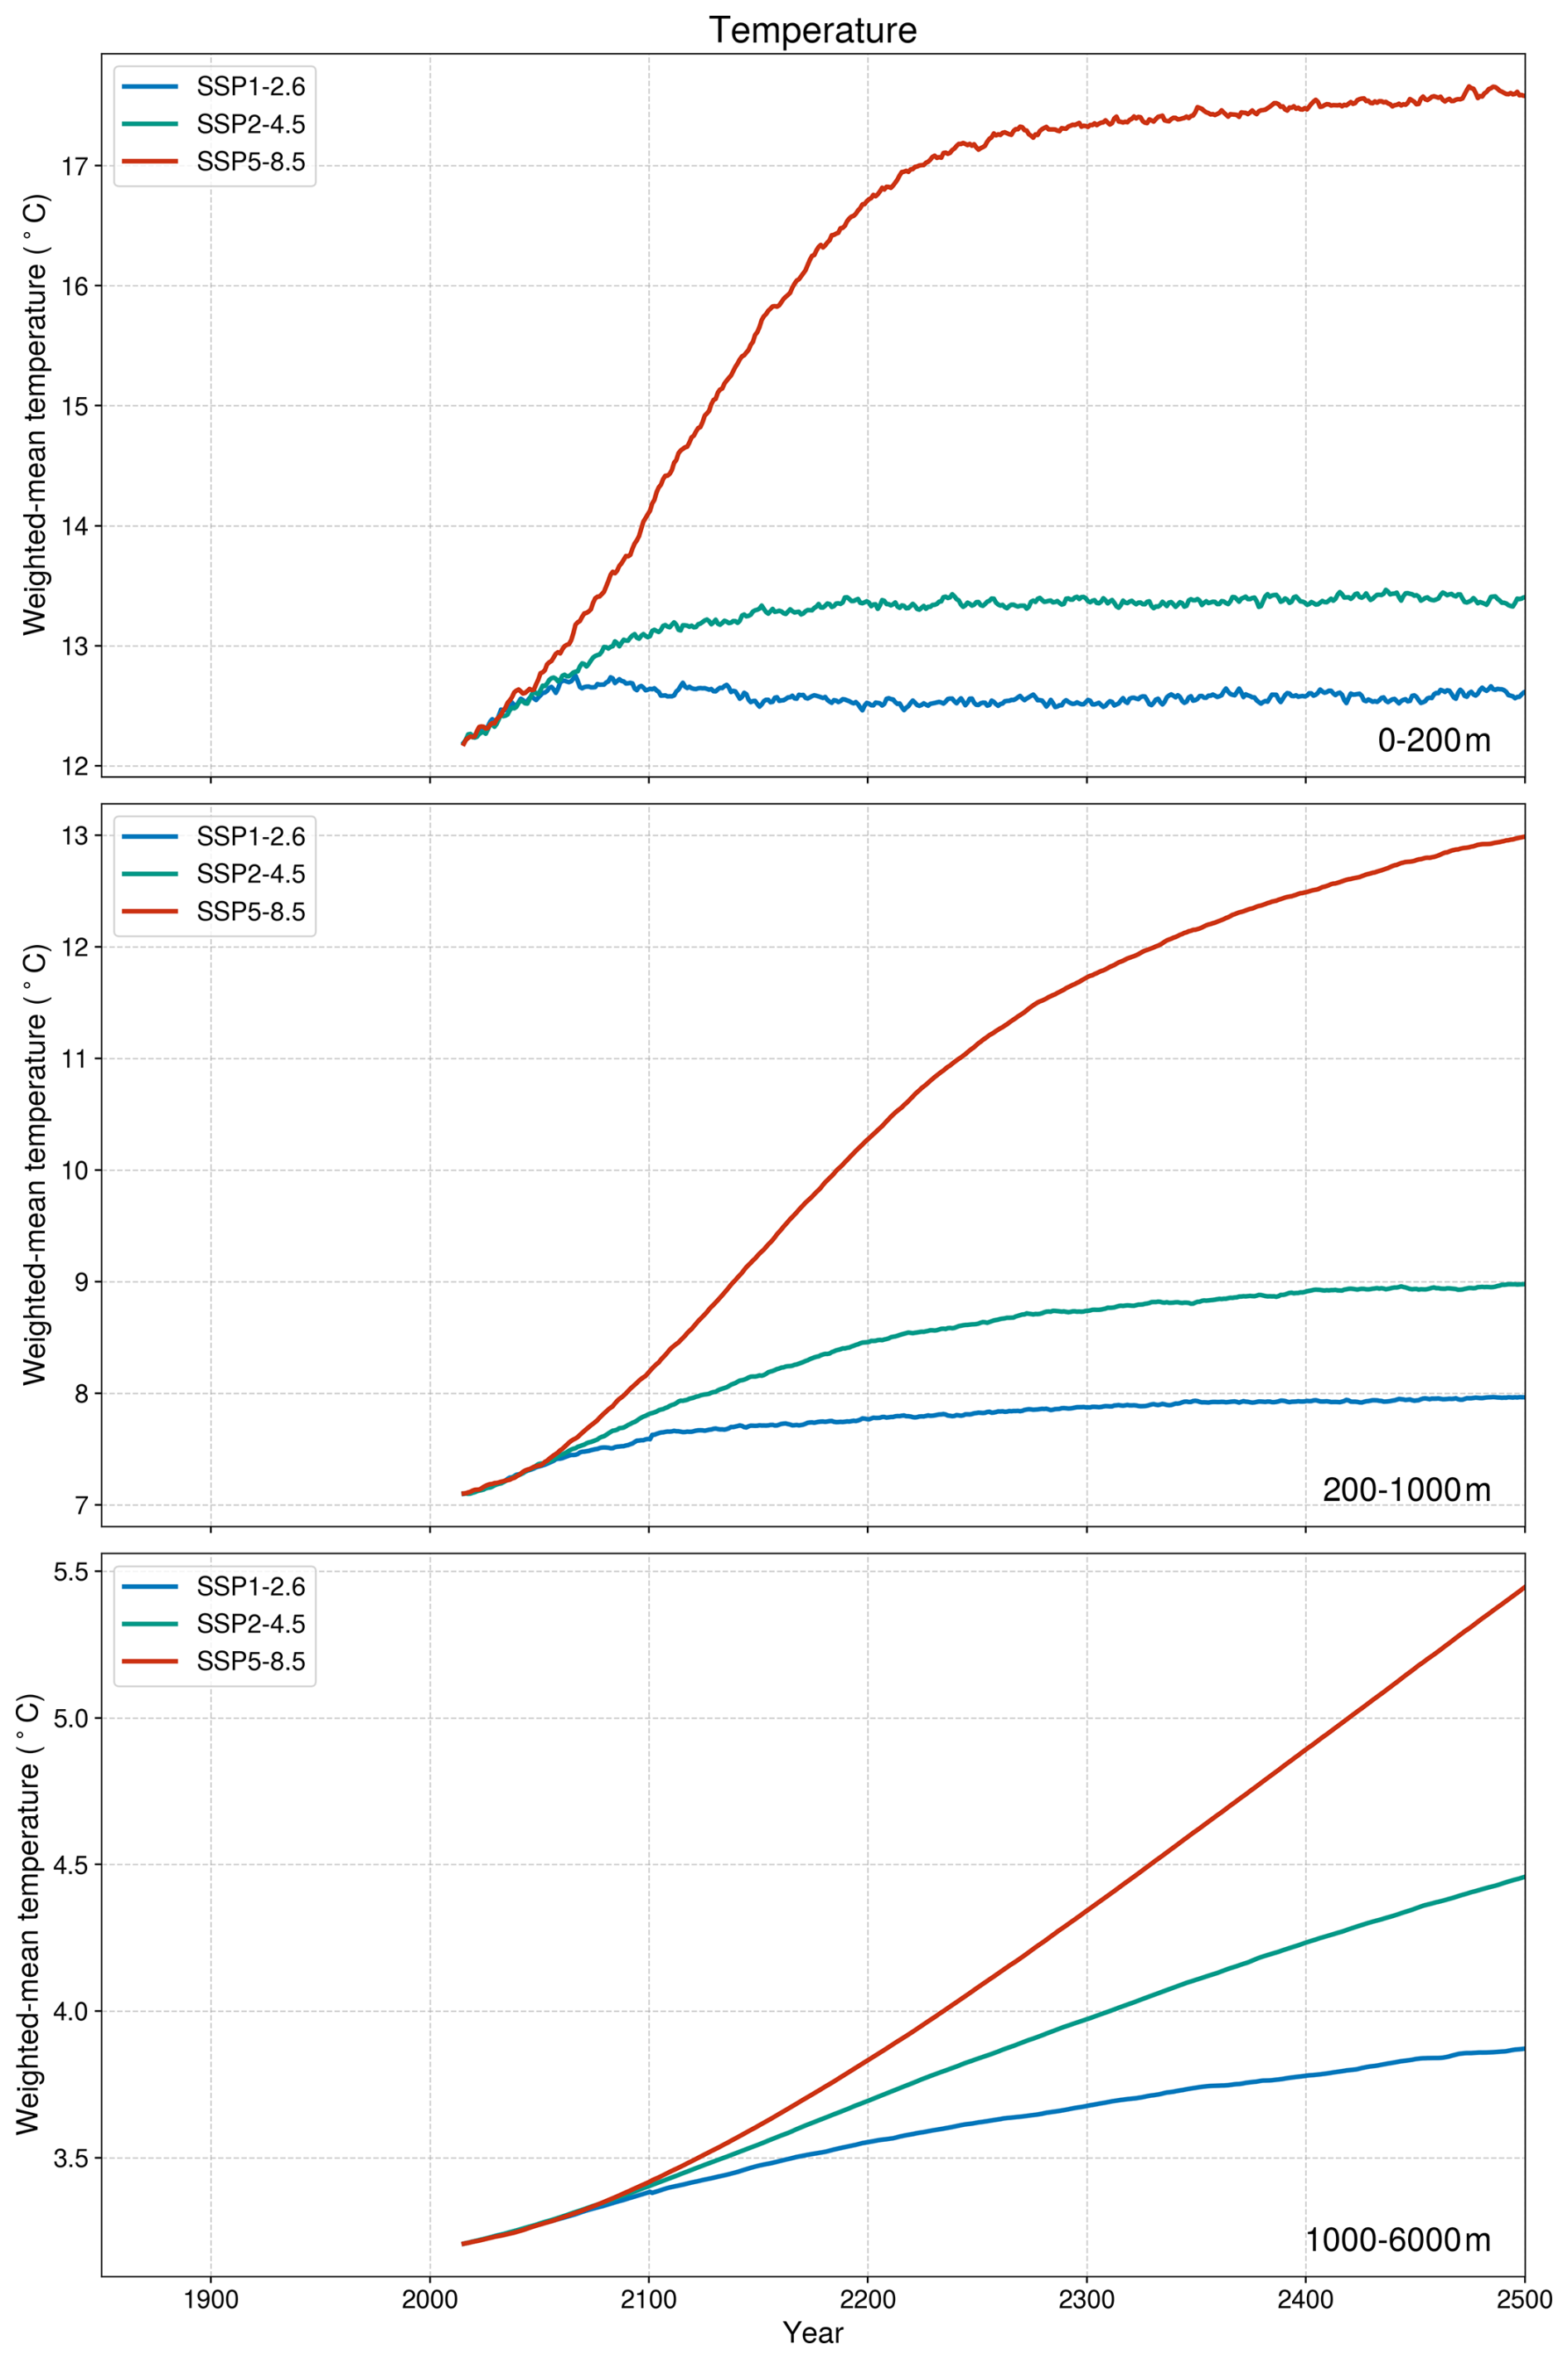
Figure A5Ocean temperatures at the surface stabilize, whereas temperatures below the depth of 200 m continue to rise over centuries across all scenarios. Depth-integrated temperature (unit: °C) in three ocean layers (0–200, 200–1000, and 1000–6000 m), simulated under the extended SSP scenarios.
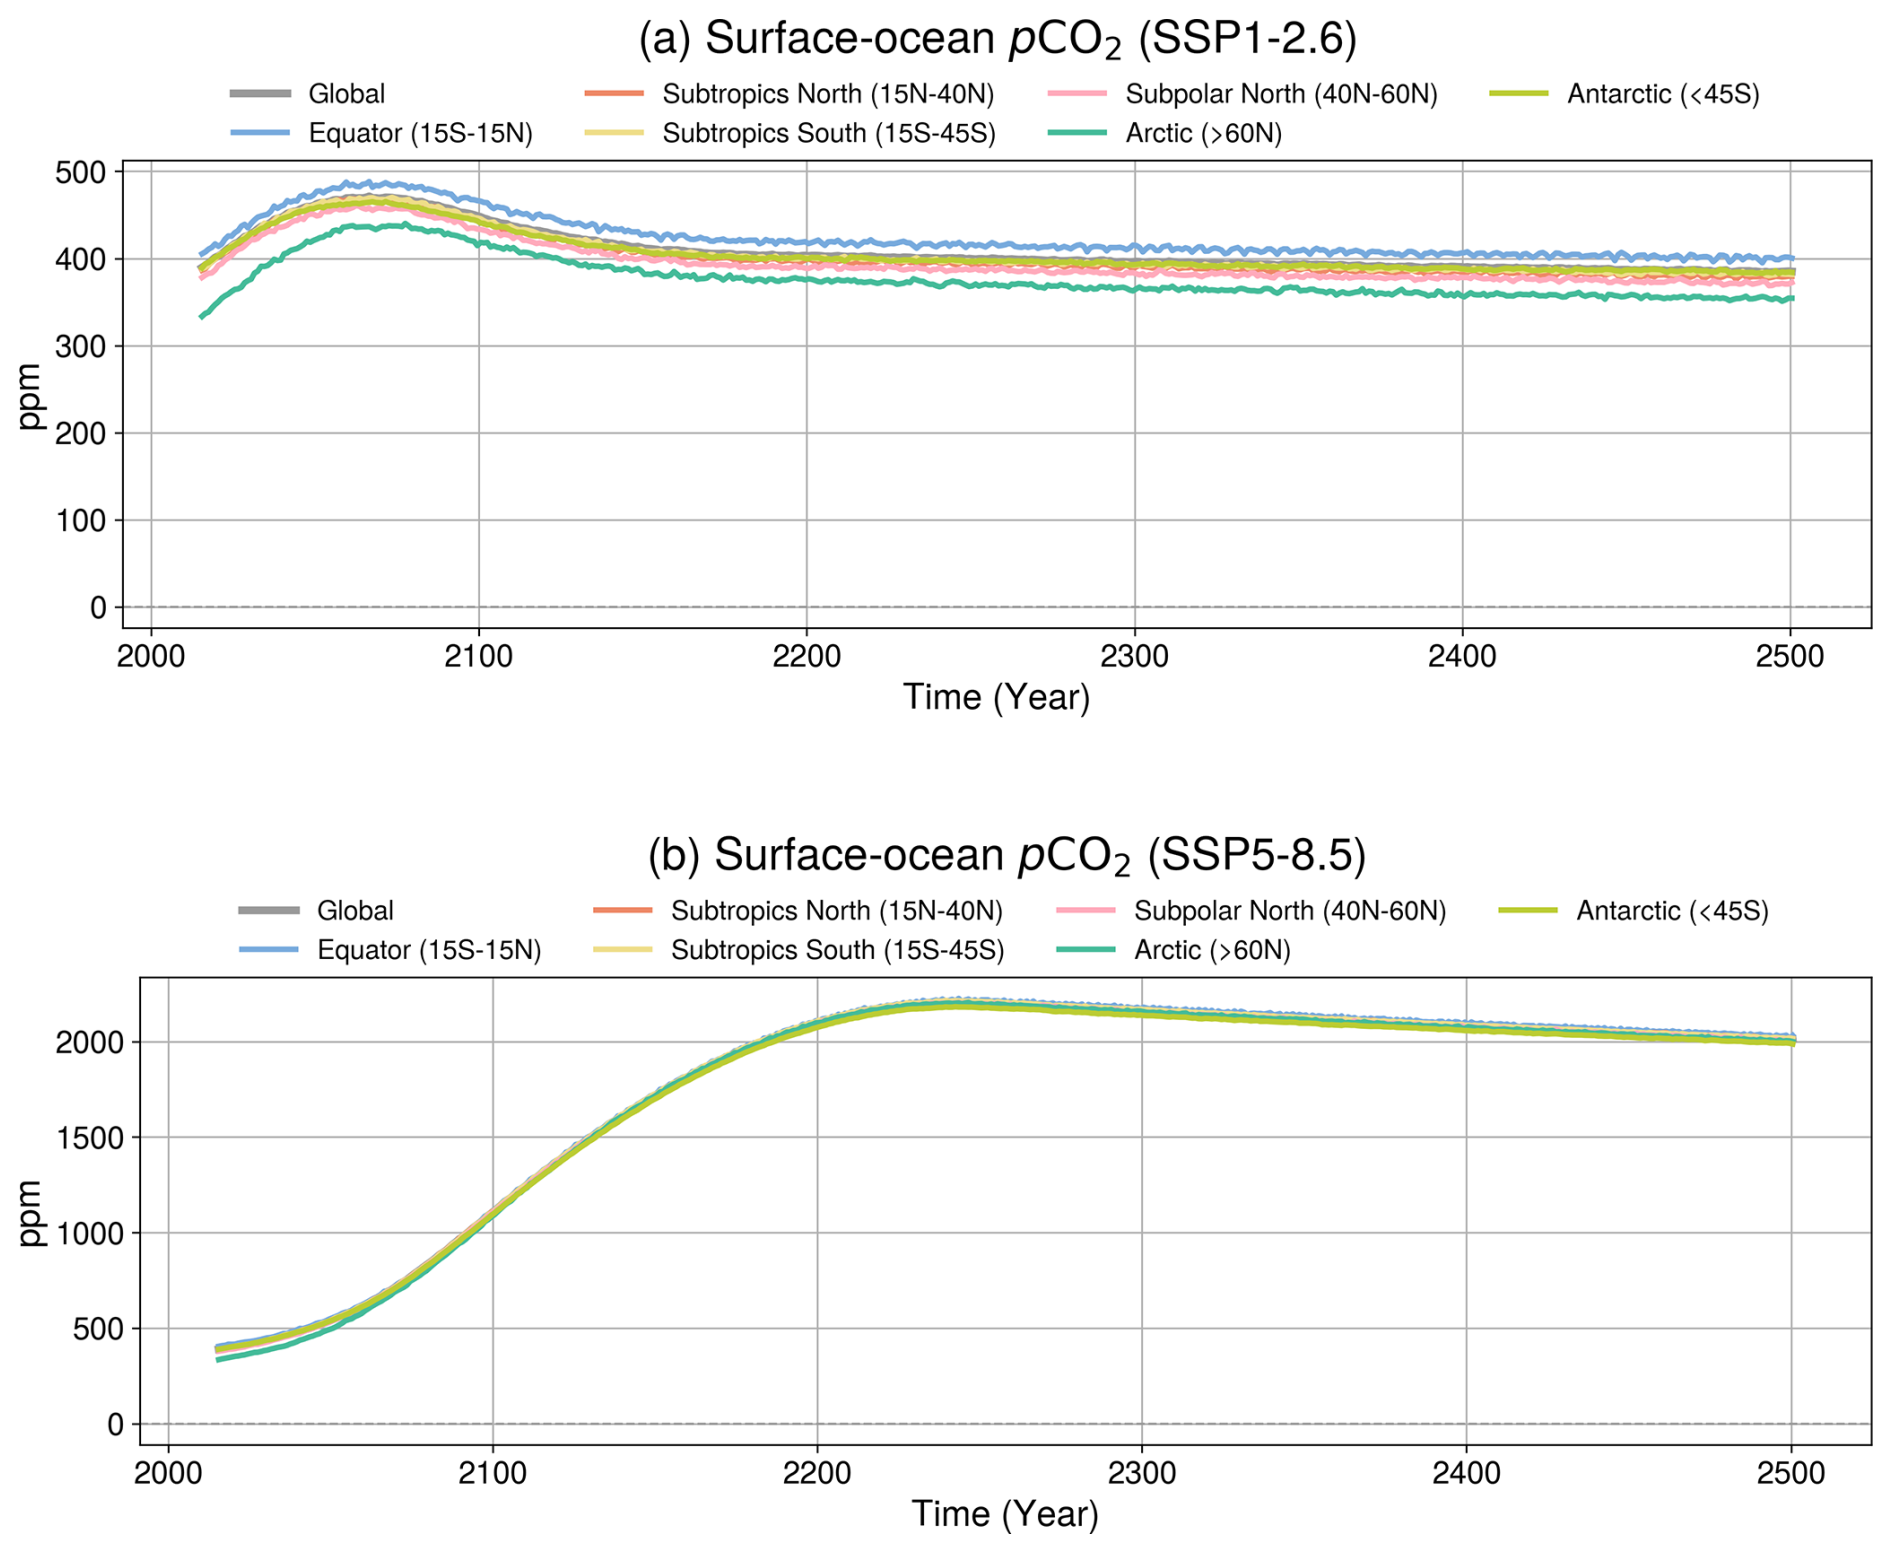
Figure A6Surface-ocean pCO2 broadly tracks atmospheric pCO2, despite regional air–sea differences. Annual-mean changes in pCO2 in the surface ocean (unit: ppm) by latitude band, simulated under (a) SSP1–2.6 and (b) SSP5–8.5. Colored lines represent different latitude bands as follows: gray (global mean), dark blue (equatorial: 15° S–15° N), orange (northern subtropics: 15–40° N), yellow (southern subtropics: 15–45° S), pink (northern subpolar: 40–60° N), green (Arctic: >60° N), and light green (Antarctic: <45° S).
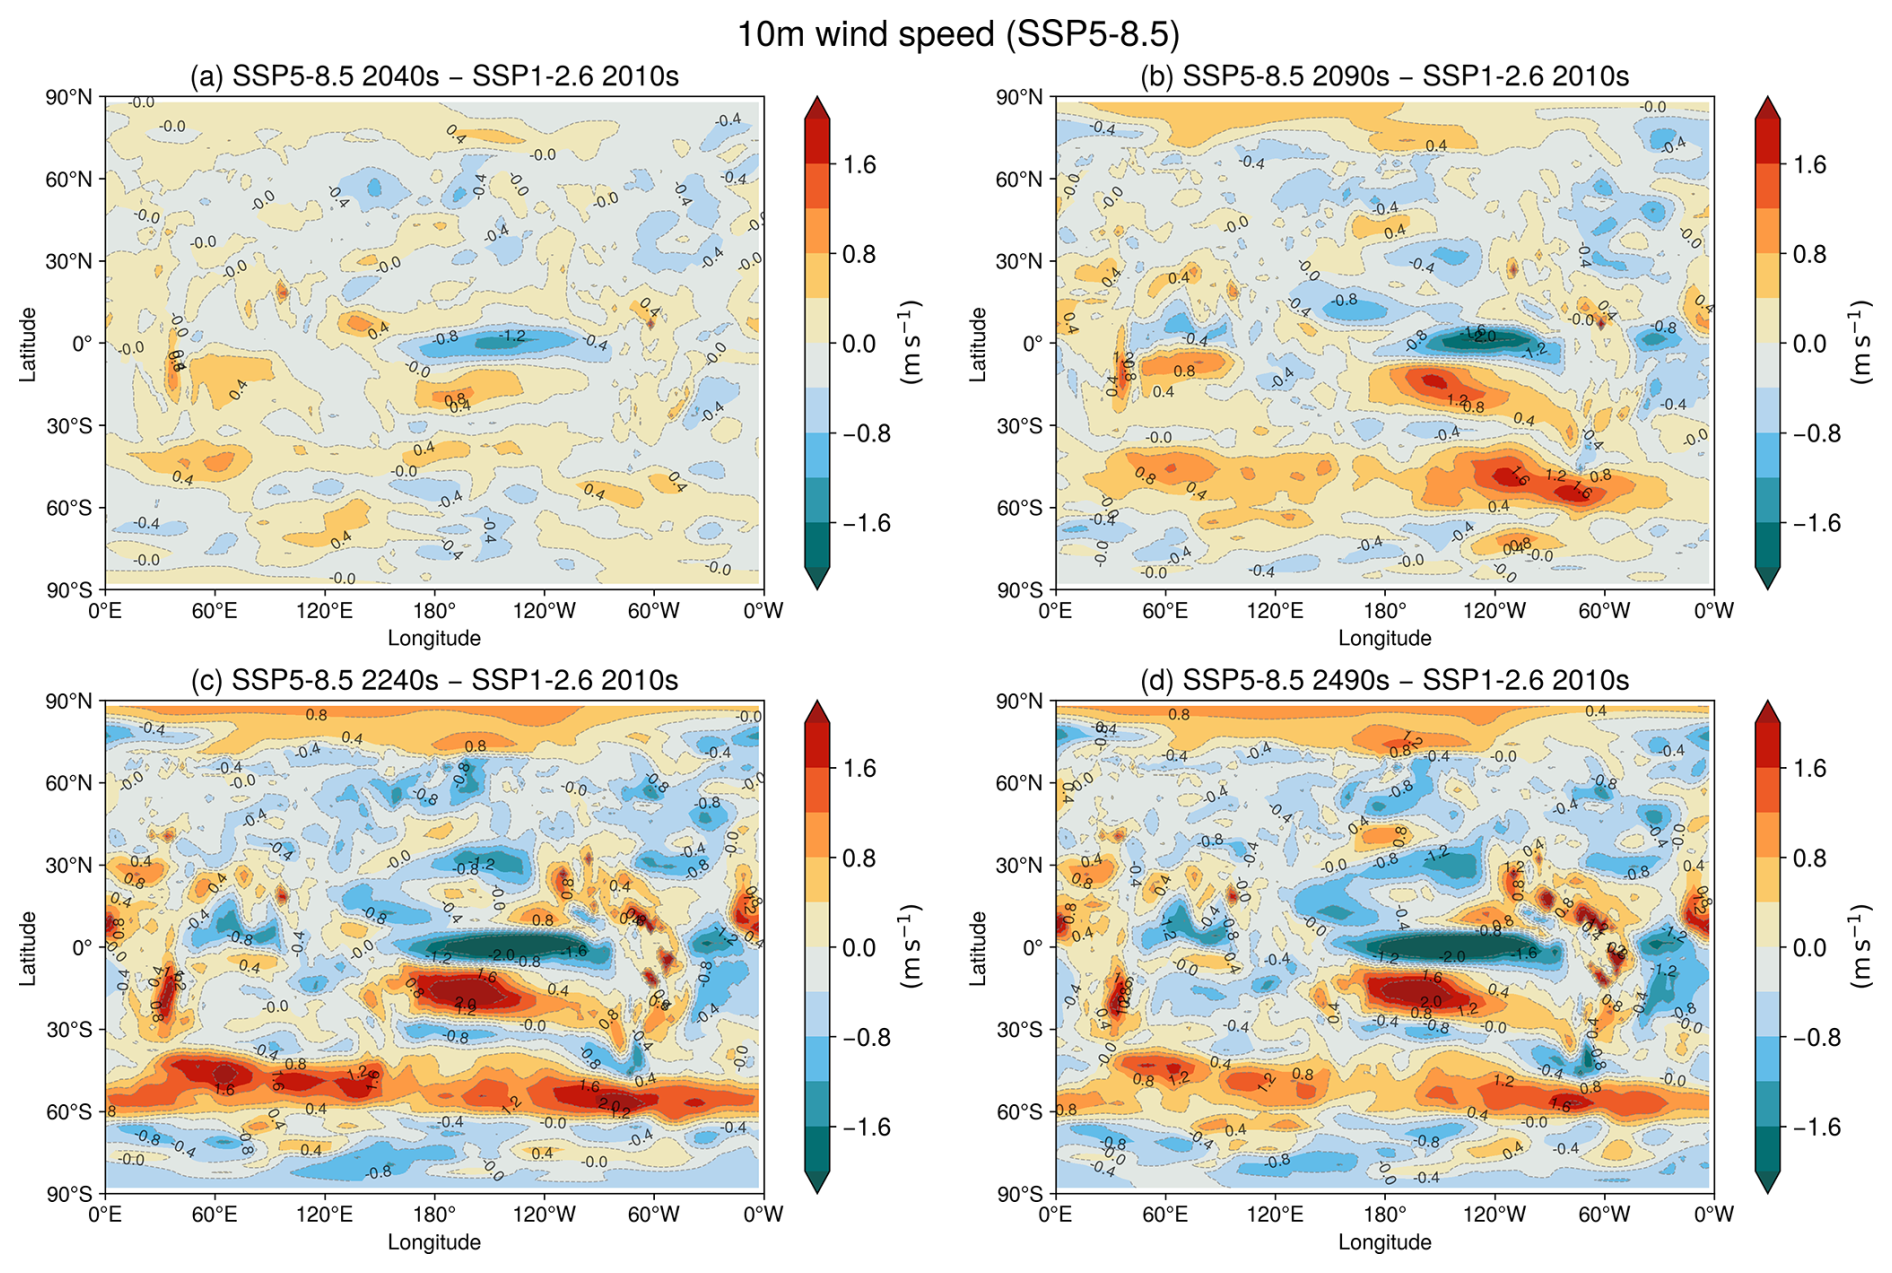
Figure A7The Southern Hemisphere westerlies strengthen under SSP5–8.5. 10 m wind speed anomalies (unit: m s−1) under SSP5–8.5, relative to the 2010s mean under SSP1–2.6. Panels show the (b) 2040s, (c) 2090s, (d) 2240s, and (e) 2490s.
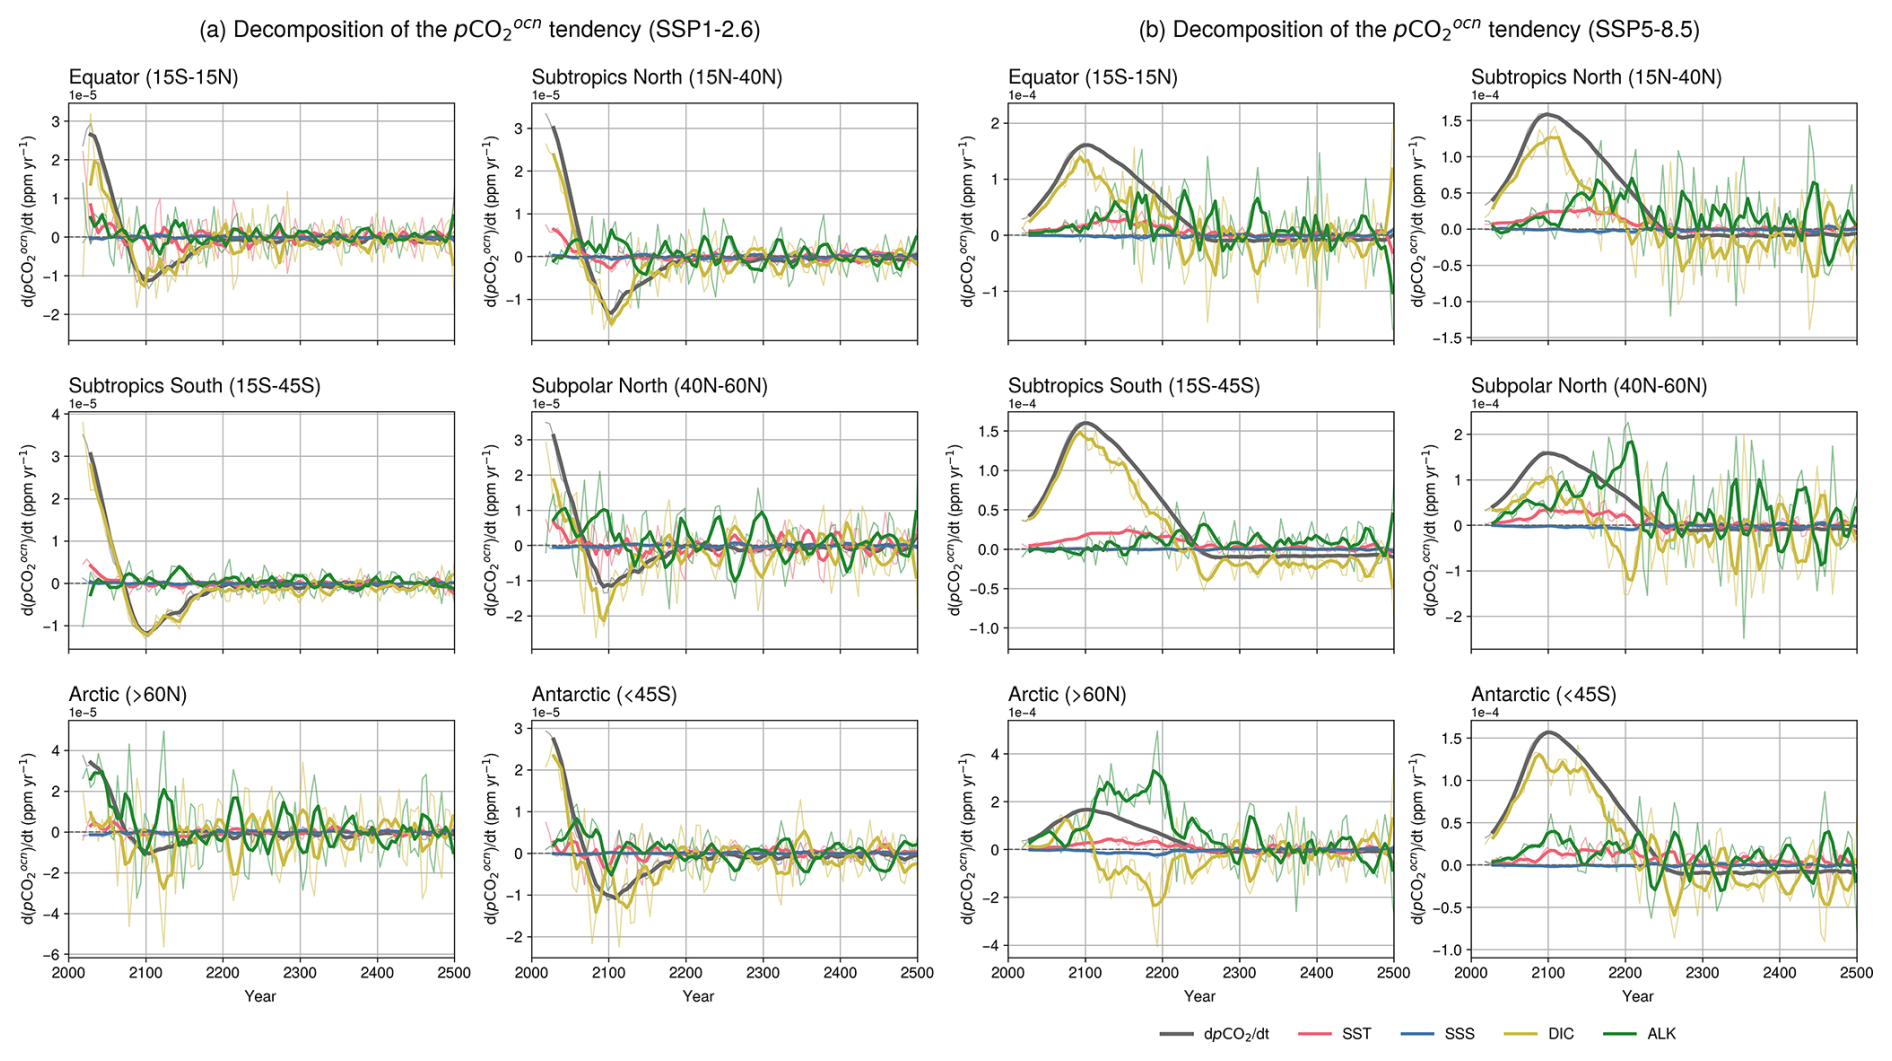
Figure A8Surface DIC is the primary driver of pCO2 changes, but under SSP5–8.5 in the mid–22nd century, alkalinity also makes a secondary yet notable contribution. Regional contributions of temperature (red), salinity (blue), DIC (yellow), and alkalinity (green) to the temporal change of surface (black) under (a) SSP1–2.6 and (b) SSP5–8.5. Thick lines represent 20-year running means, whereas thin lines indicate 5-year mean values. The horizontal axis represents time (years), and the vertical axis shows the time derivative of pCO2 (, unit: ppm yr−1).
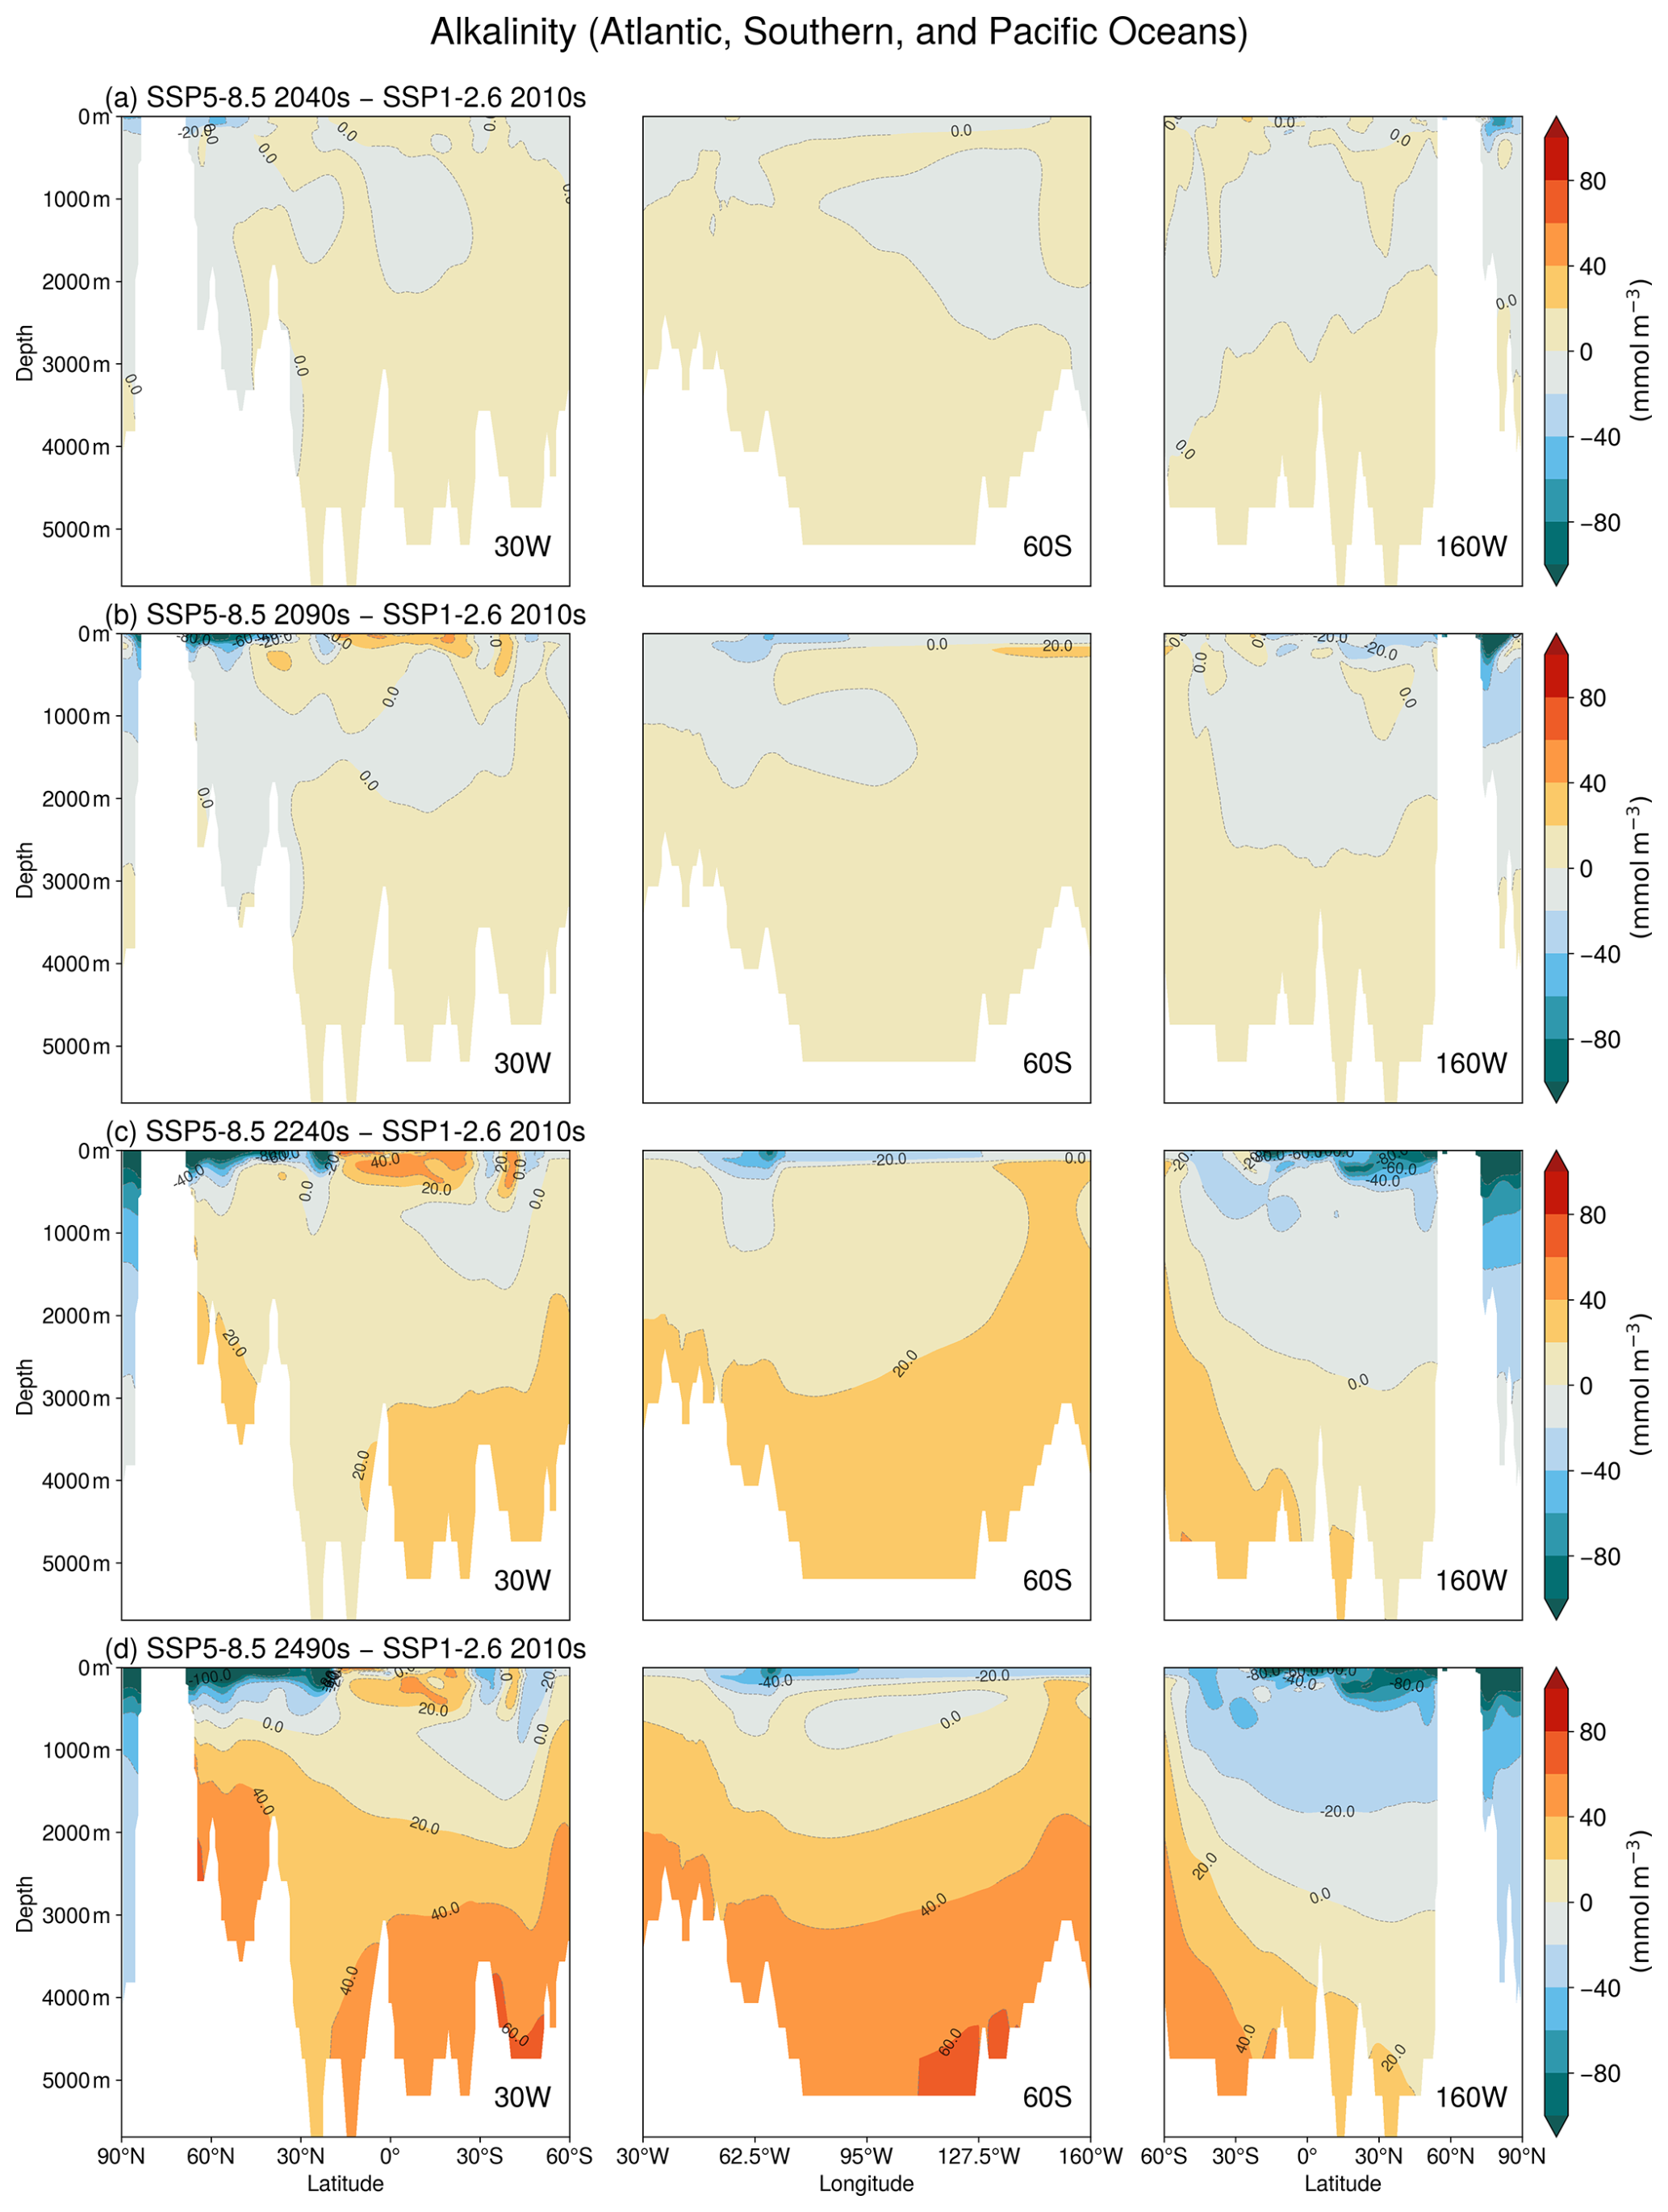
Figure A9The vertical gradient in alkalinity between the surface and deep ocean intensifies. Zonal mean vertical sections of alkalinity concentration anomalies (unit: mmol m−3) under SSP5–8.5. From left to right, the panels show longitudinally averaged sections for the Atlantic, Southern, and Pacific Oceans. From top to bottom, rows represent anomalies for the (a) 2040s, (b) 2090s, (c) 2240s, and (d) 2490s, relative to the 2010s average under SSP1–2.6.
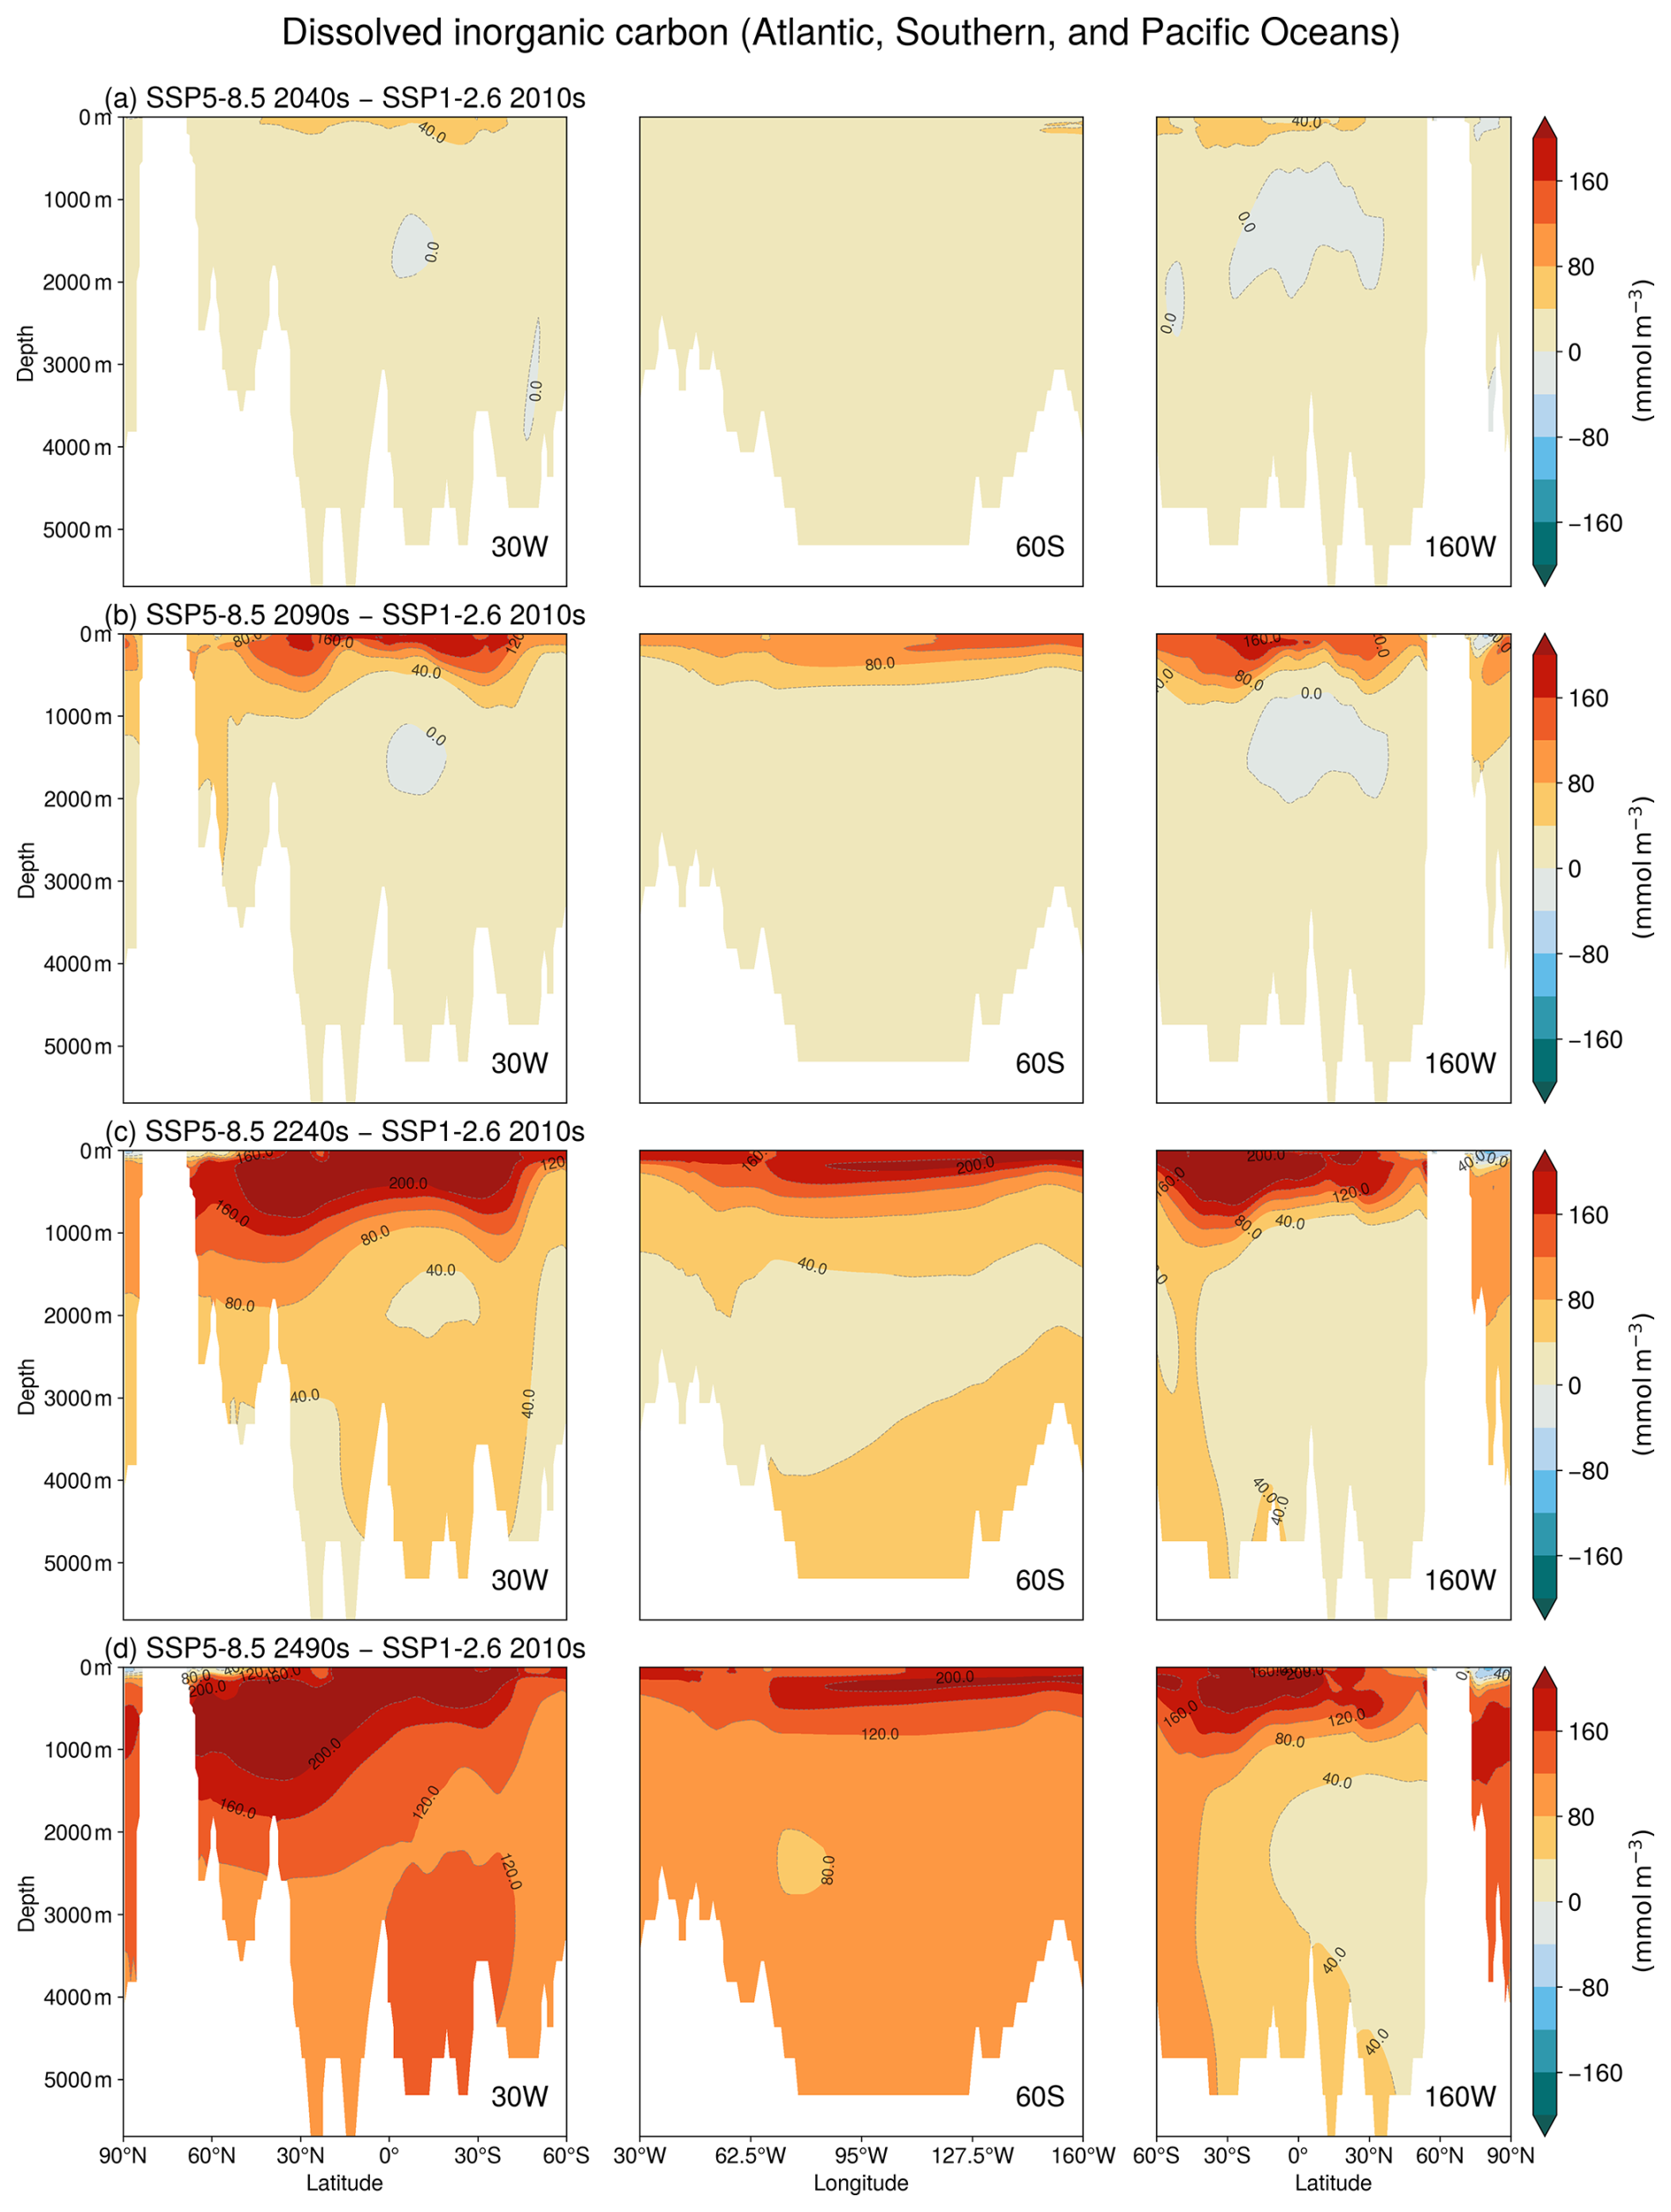
Figure A10Deep-ocean DIC continues to increase over centuries along the AABW pathway. Zonal mean vertical sections of DIC concentration anomalies (unit: mmol m−3) under SSP5–8.5. From left to right, the panels show longitudinally averaged sections for the Atlantic, Southern, and Pacific Oceans. From top to bottom, rows represent anomalies for the (a) 2040s, (b) 2090s, (c) 2240s, and (d) 2490s, relative to the 2010s average under SSP1–2.6.
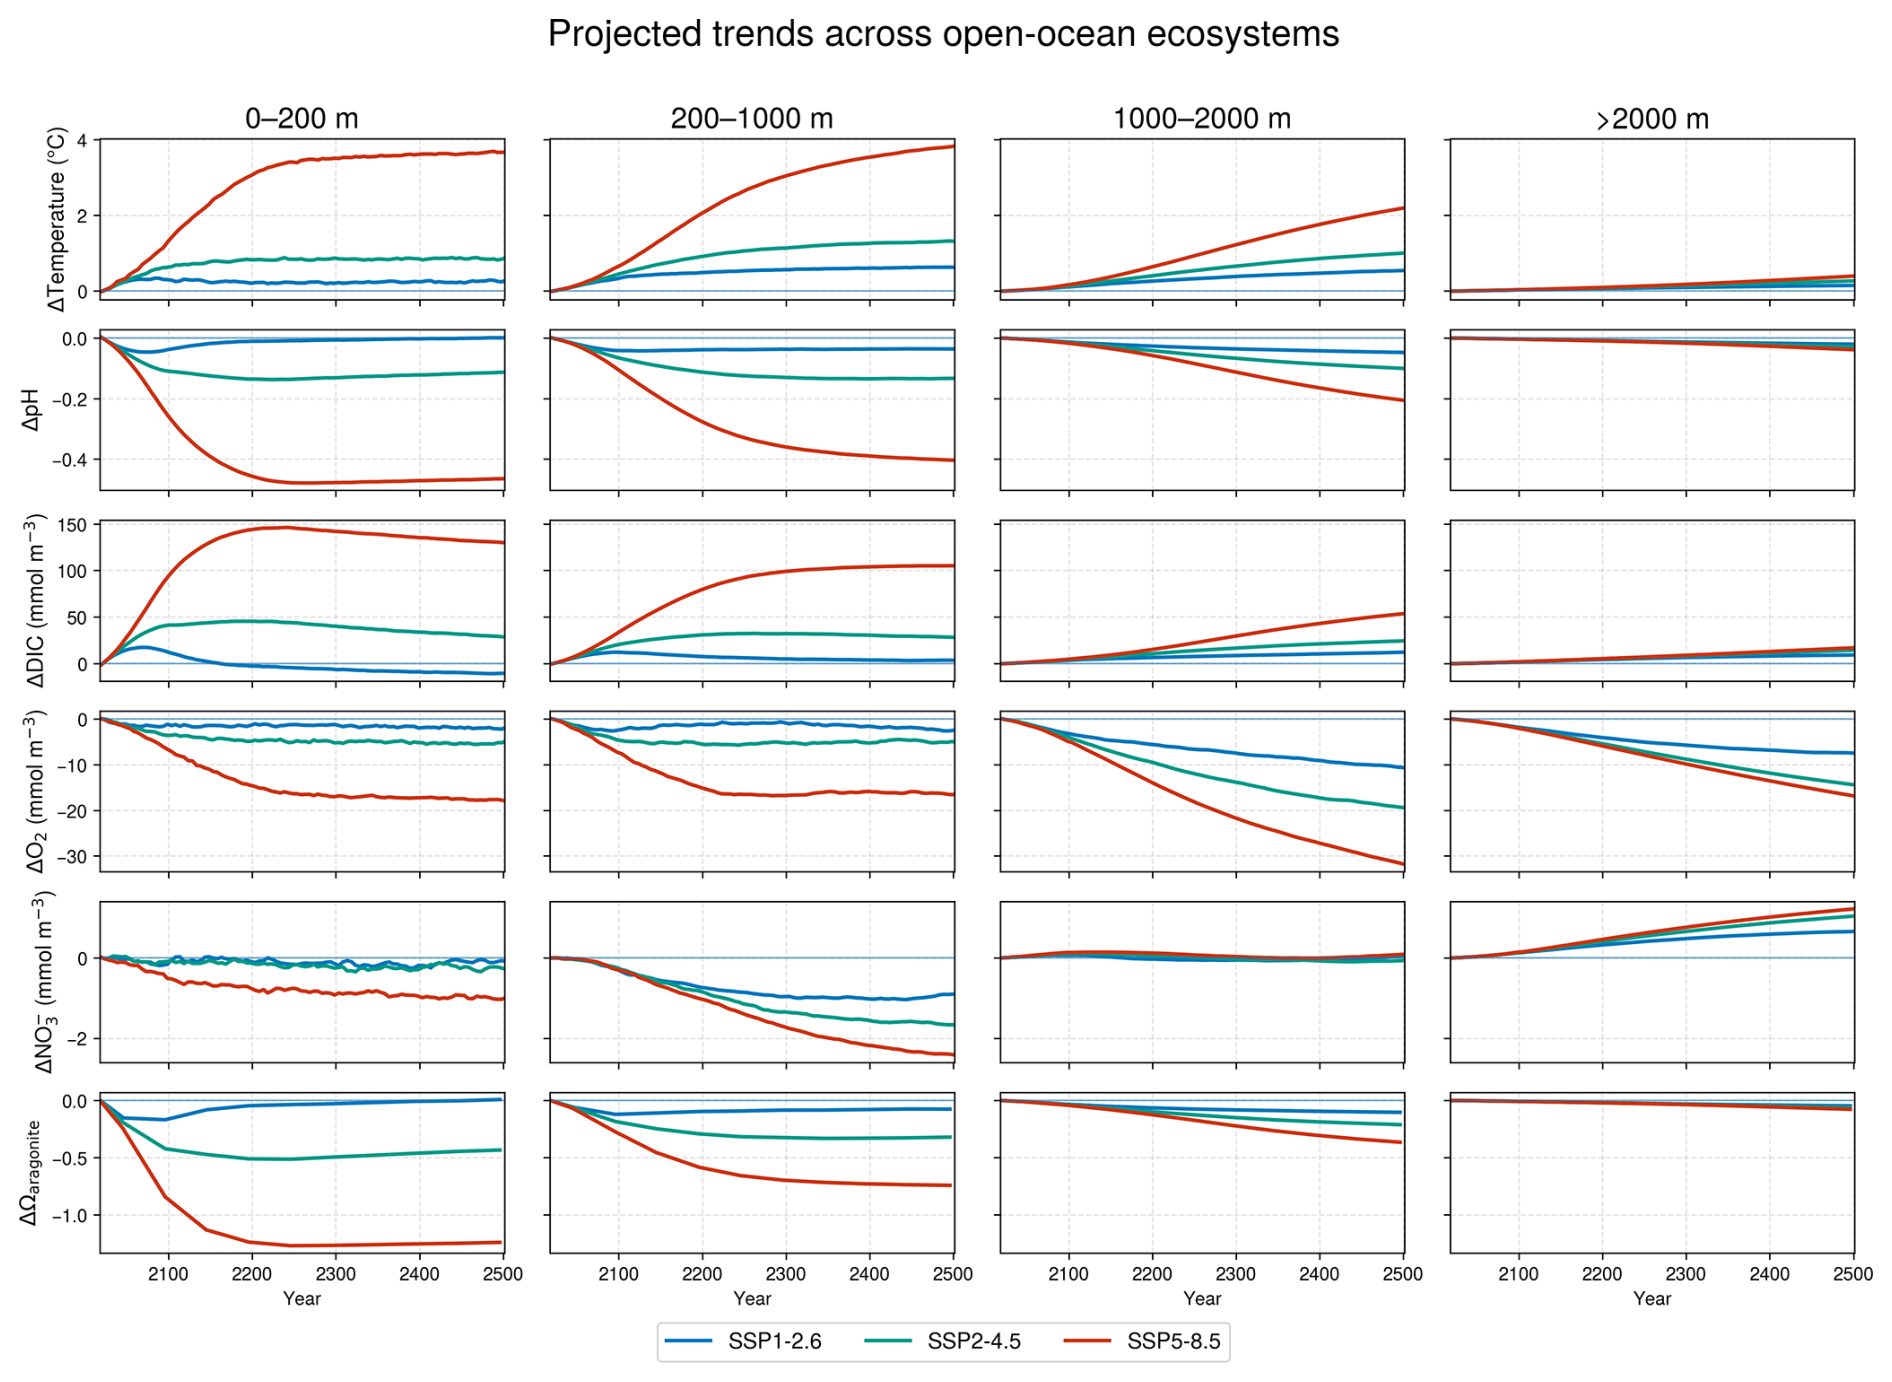
Figure A11Even under the low-emission SSP1–2.6 scenario, it takes until around the year 2200 for surface ocean temperature, acidification, deoxygenation, and aragonite saturation state to return to near modern levels. Projected time series of open-ocean temperature, pH, DIC, O2, , and Ωaragonite under SSP1–2.6, SSP2–4.5, SSP3–7.0, and SSP5–8.5. Results are shown for four depth ranges (0–200, 200–1000, 1000–2000, and >2000 m).
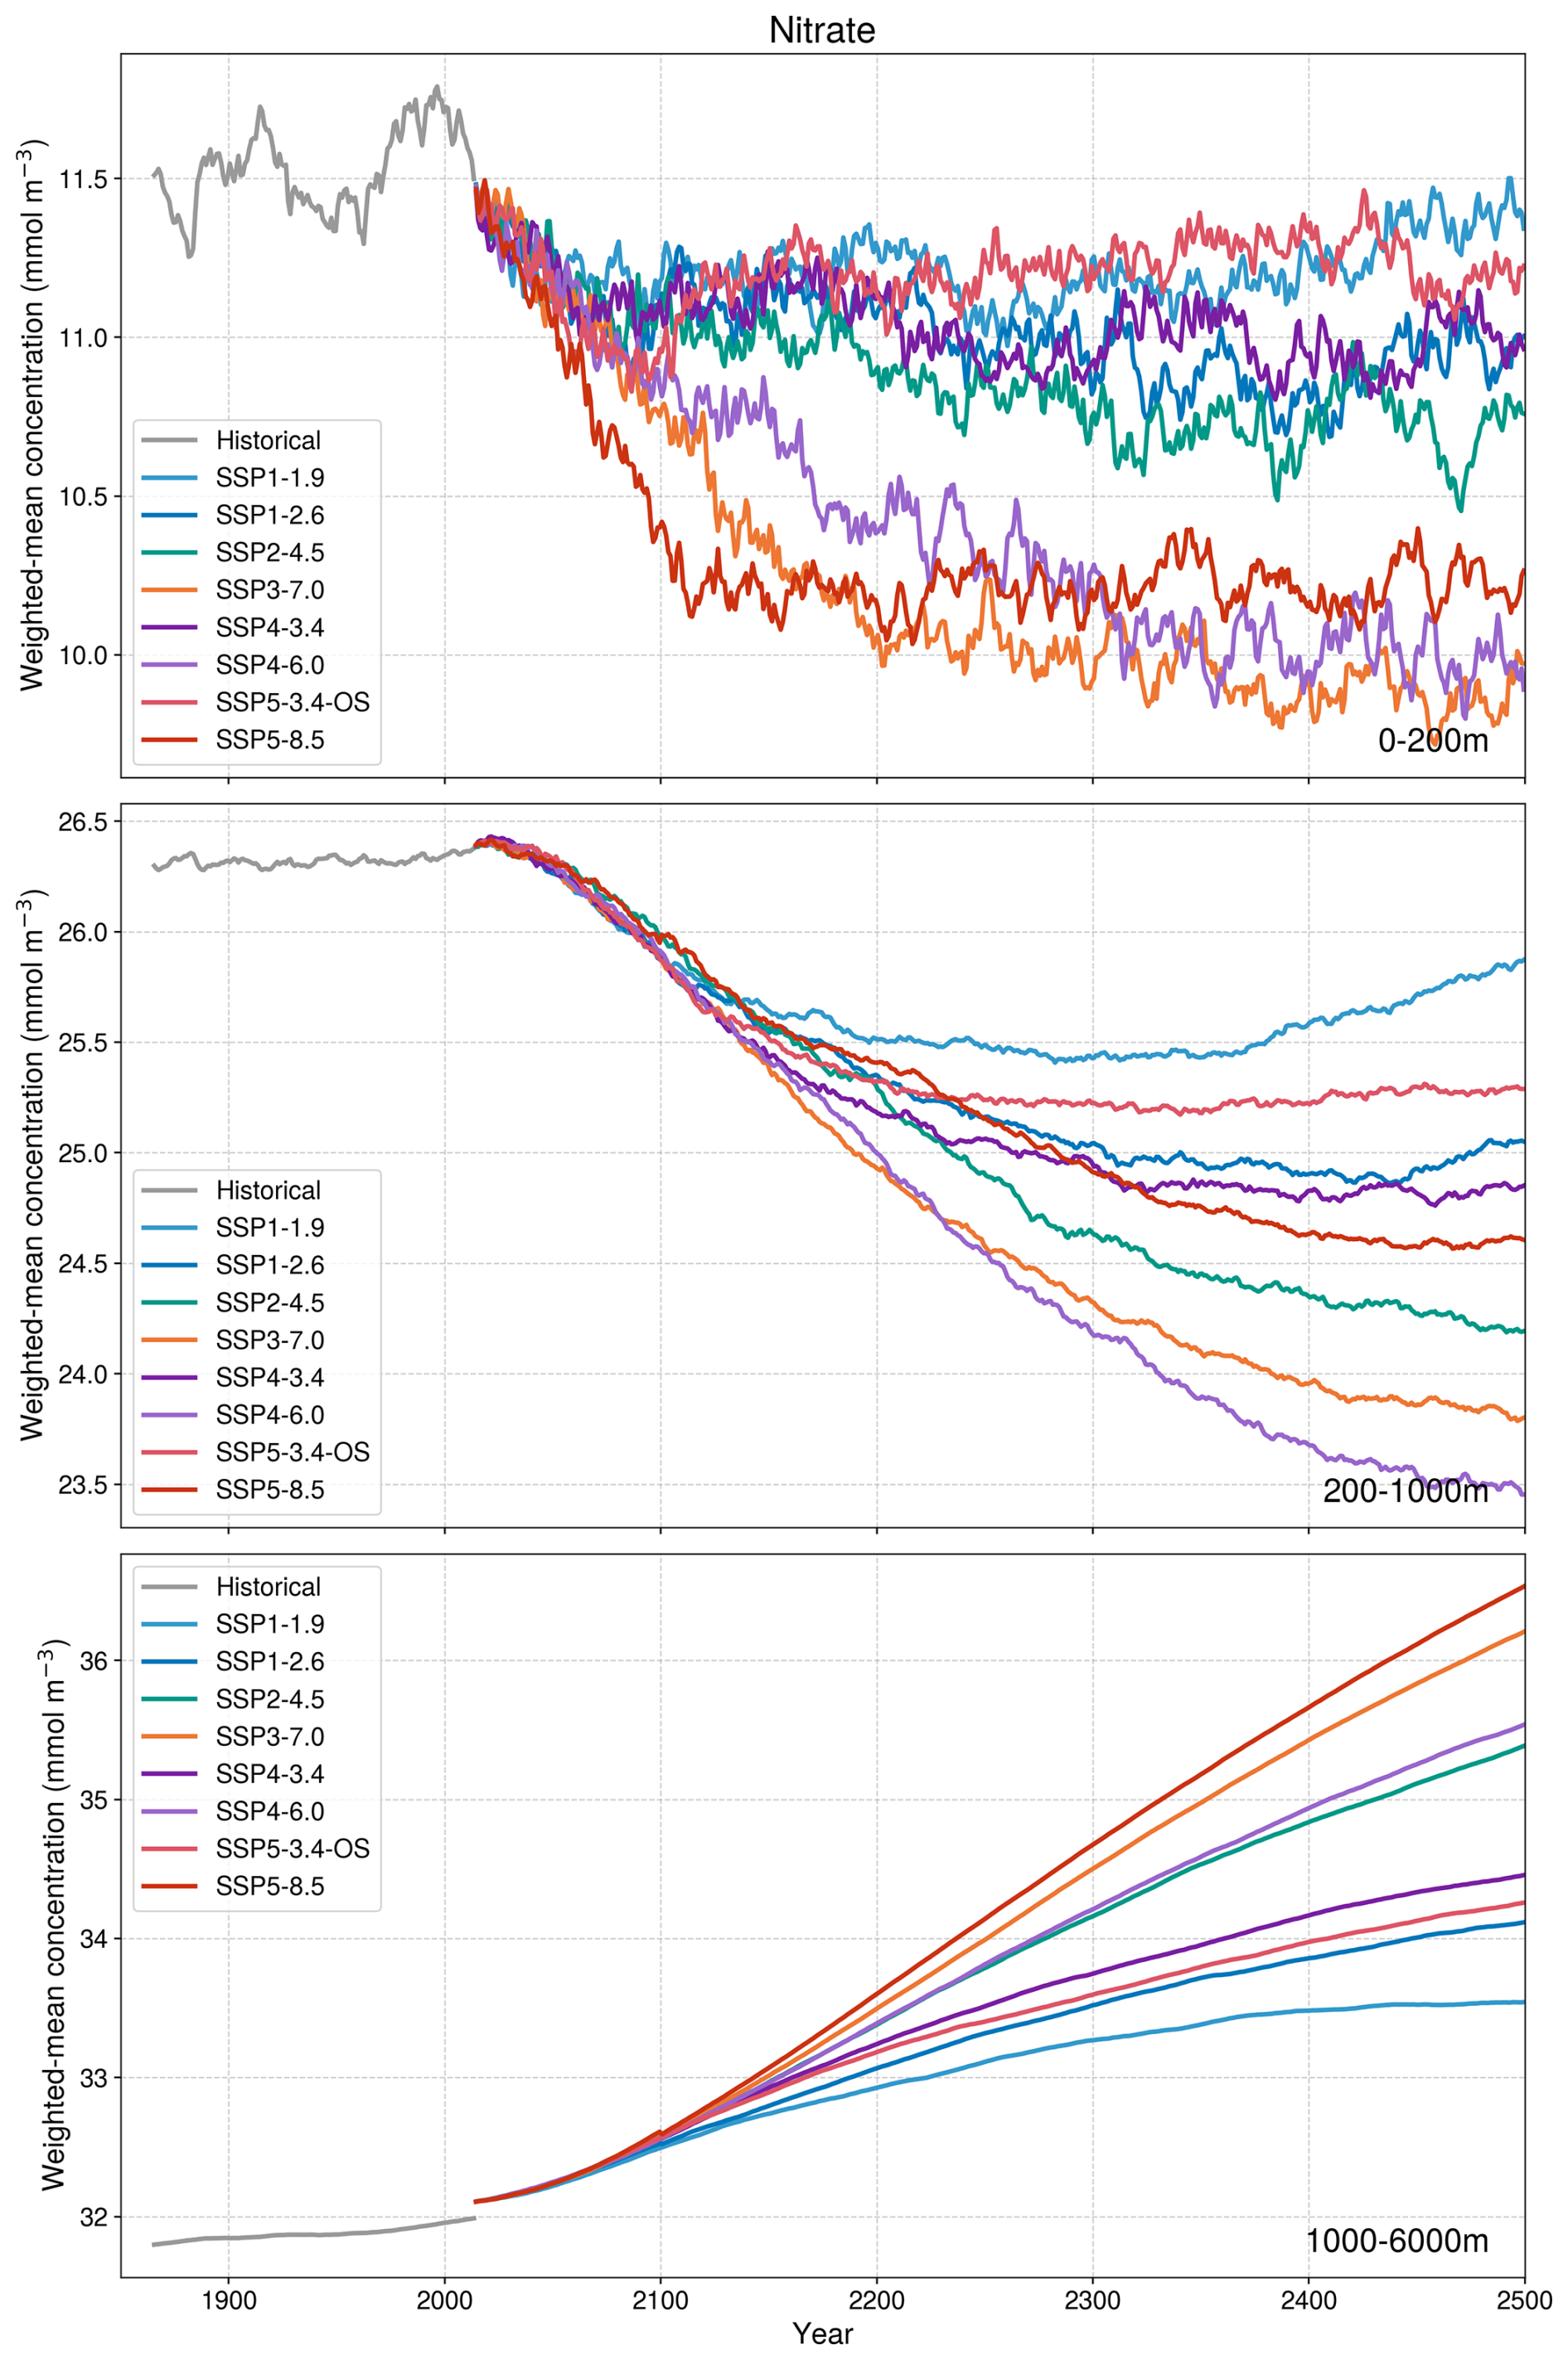
Figure A12Surface-ocean nitrate stabilizes and slowly recovers under low emissions, while deep-ocean nitrate continues to accumulate. Depth-integrated nitrate concentrations (unit: mmol m−3) in three ocean layers (0–200, 200–1000, and 1000–6000 m), simulated under the extended SSP scenarios.
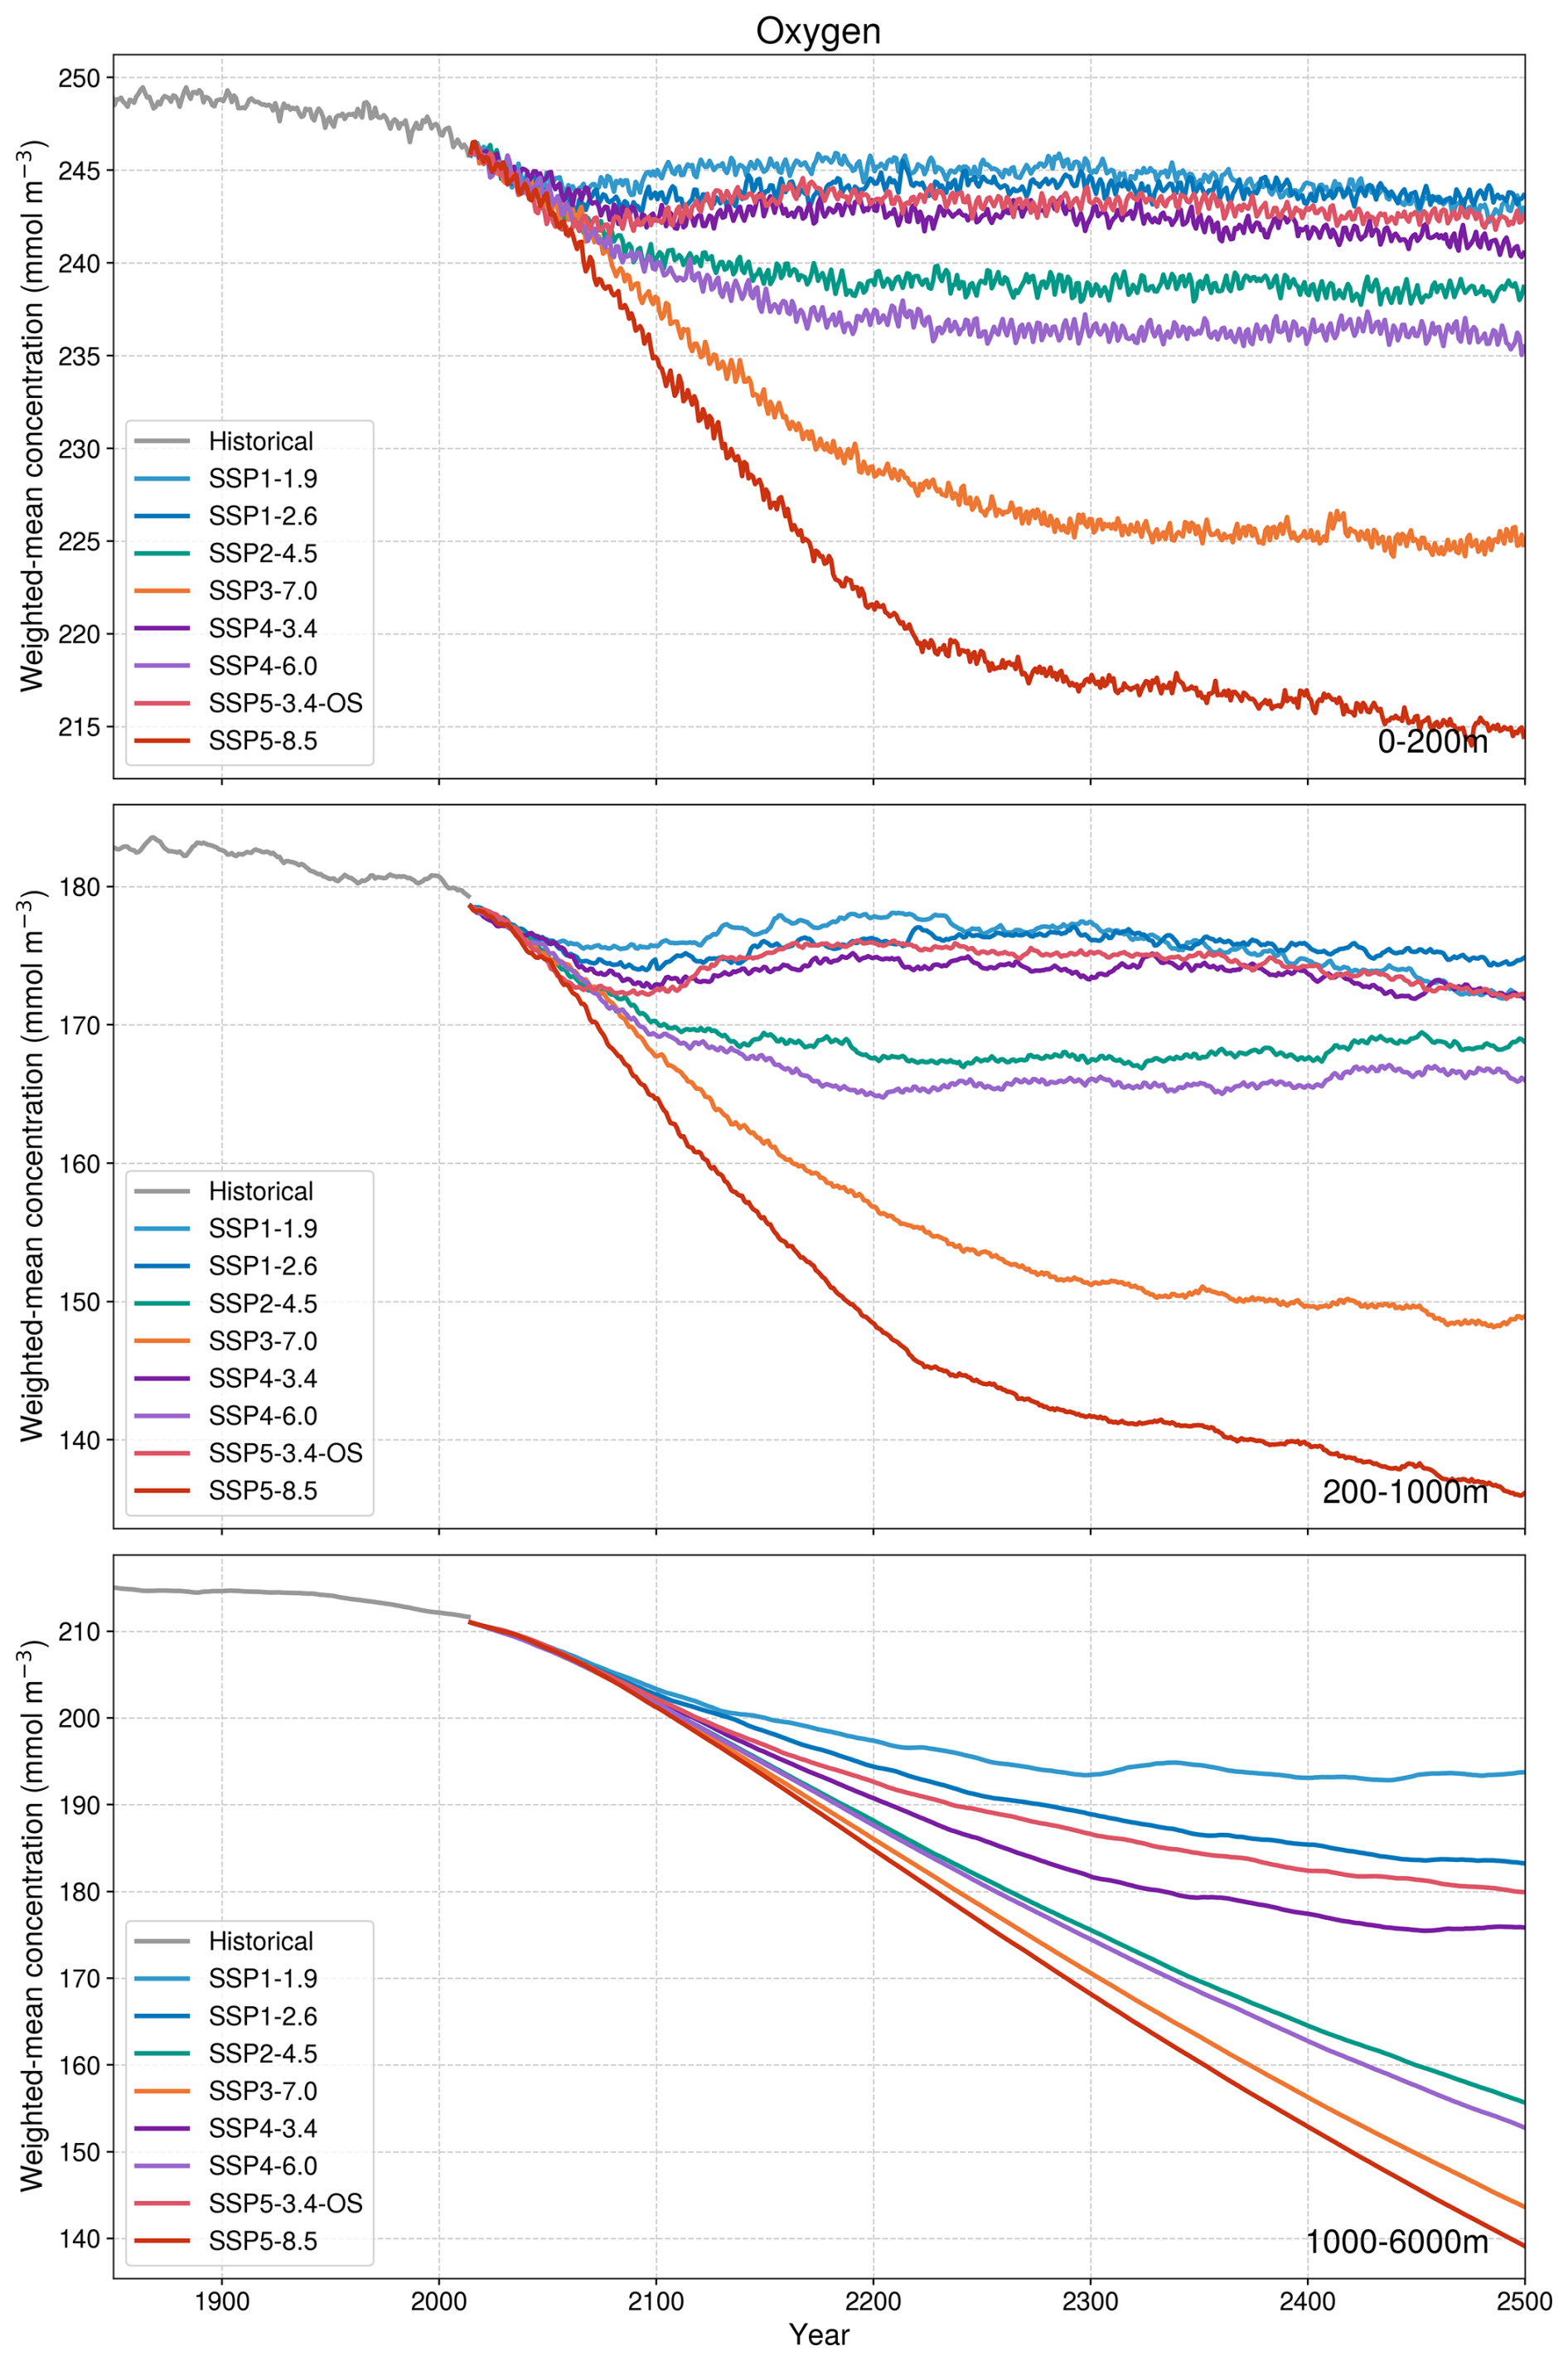
Figure A13Deep-ocean oxygen declines persistently across emission scenarios. Depth-integrated oxygen concentrations (unit: mmol m−3) in three ocean layers (0–200, 200–1000, and 1000–6000 m), simulated under the extended SSP scenarios.
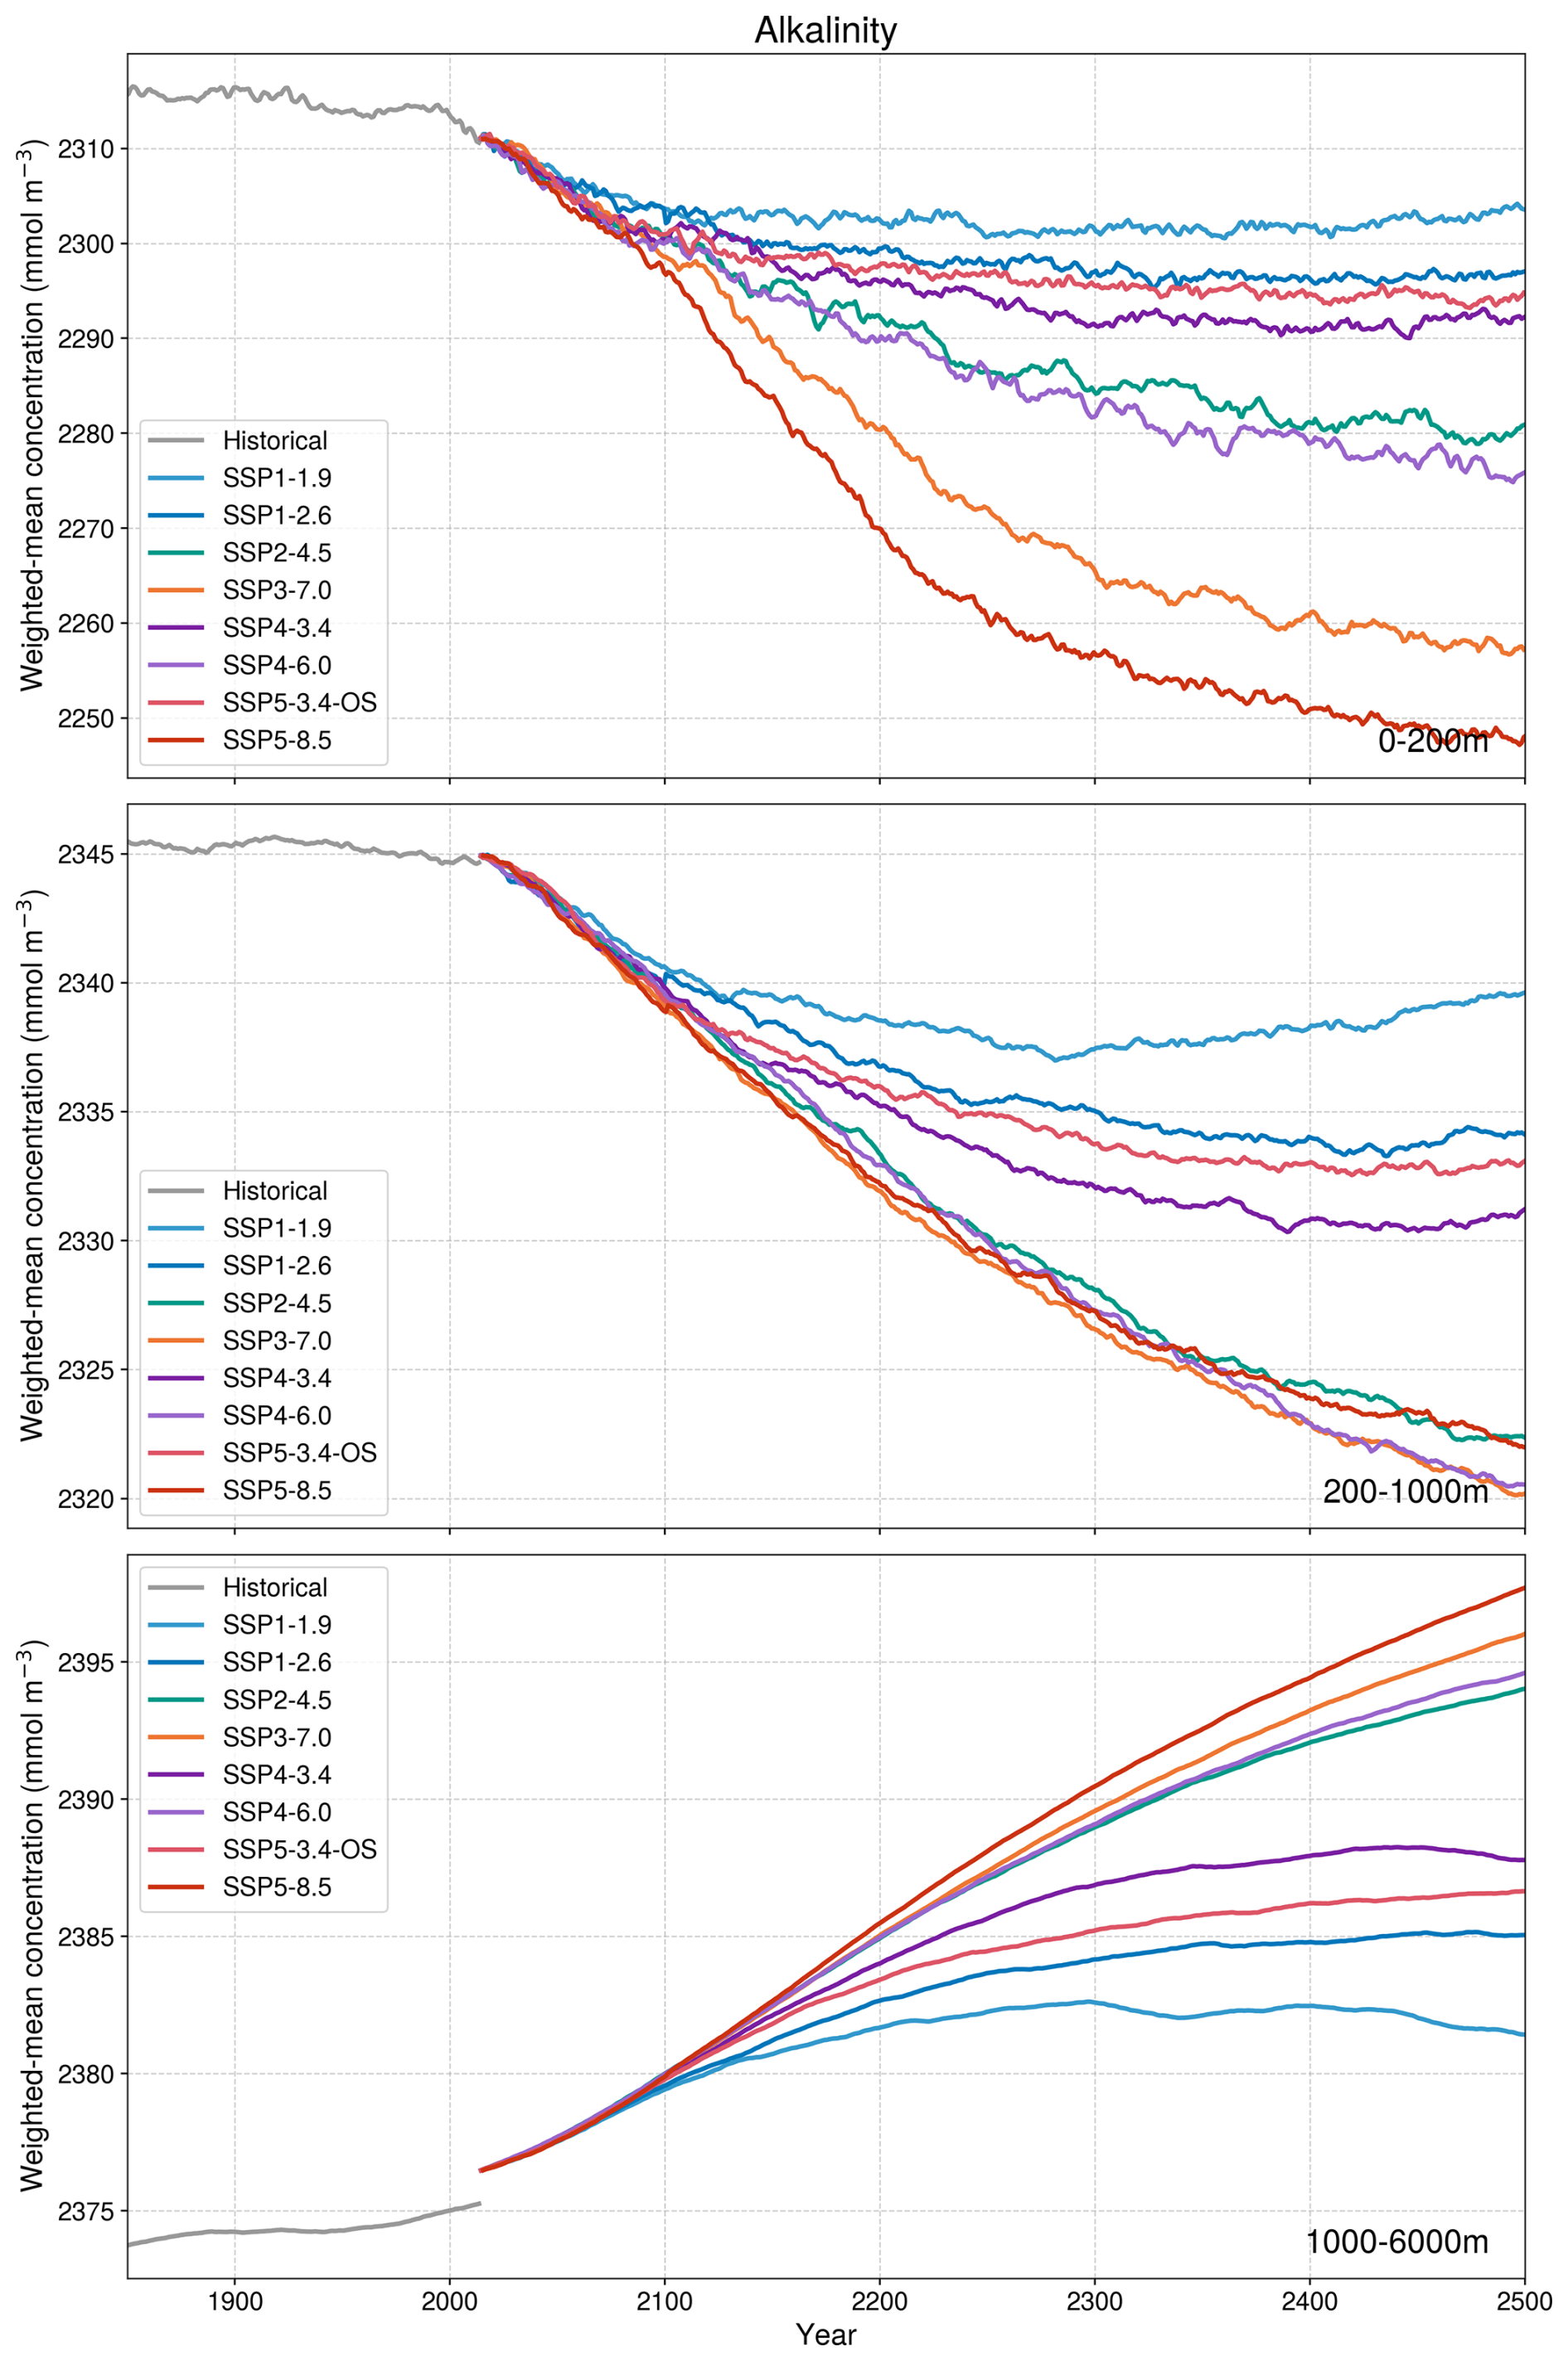
Figure A14Surface-ocean alkalinity declines under climate forcing, while deep-ocean alkalinity continues to increase. Depth-integrated alkalinity concentrations (unit: mmol m−3) in three ocean layers (0–200, 200–1000, and 1000–6000 m), simulated under the extended SSP scenarios.
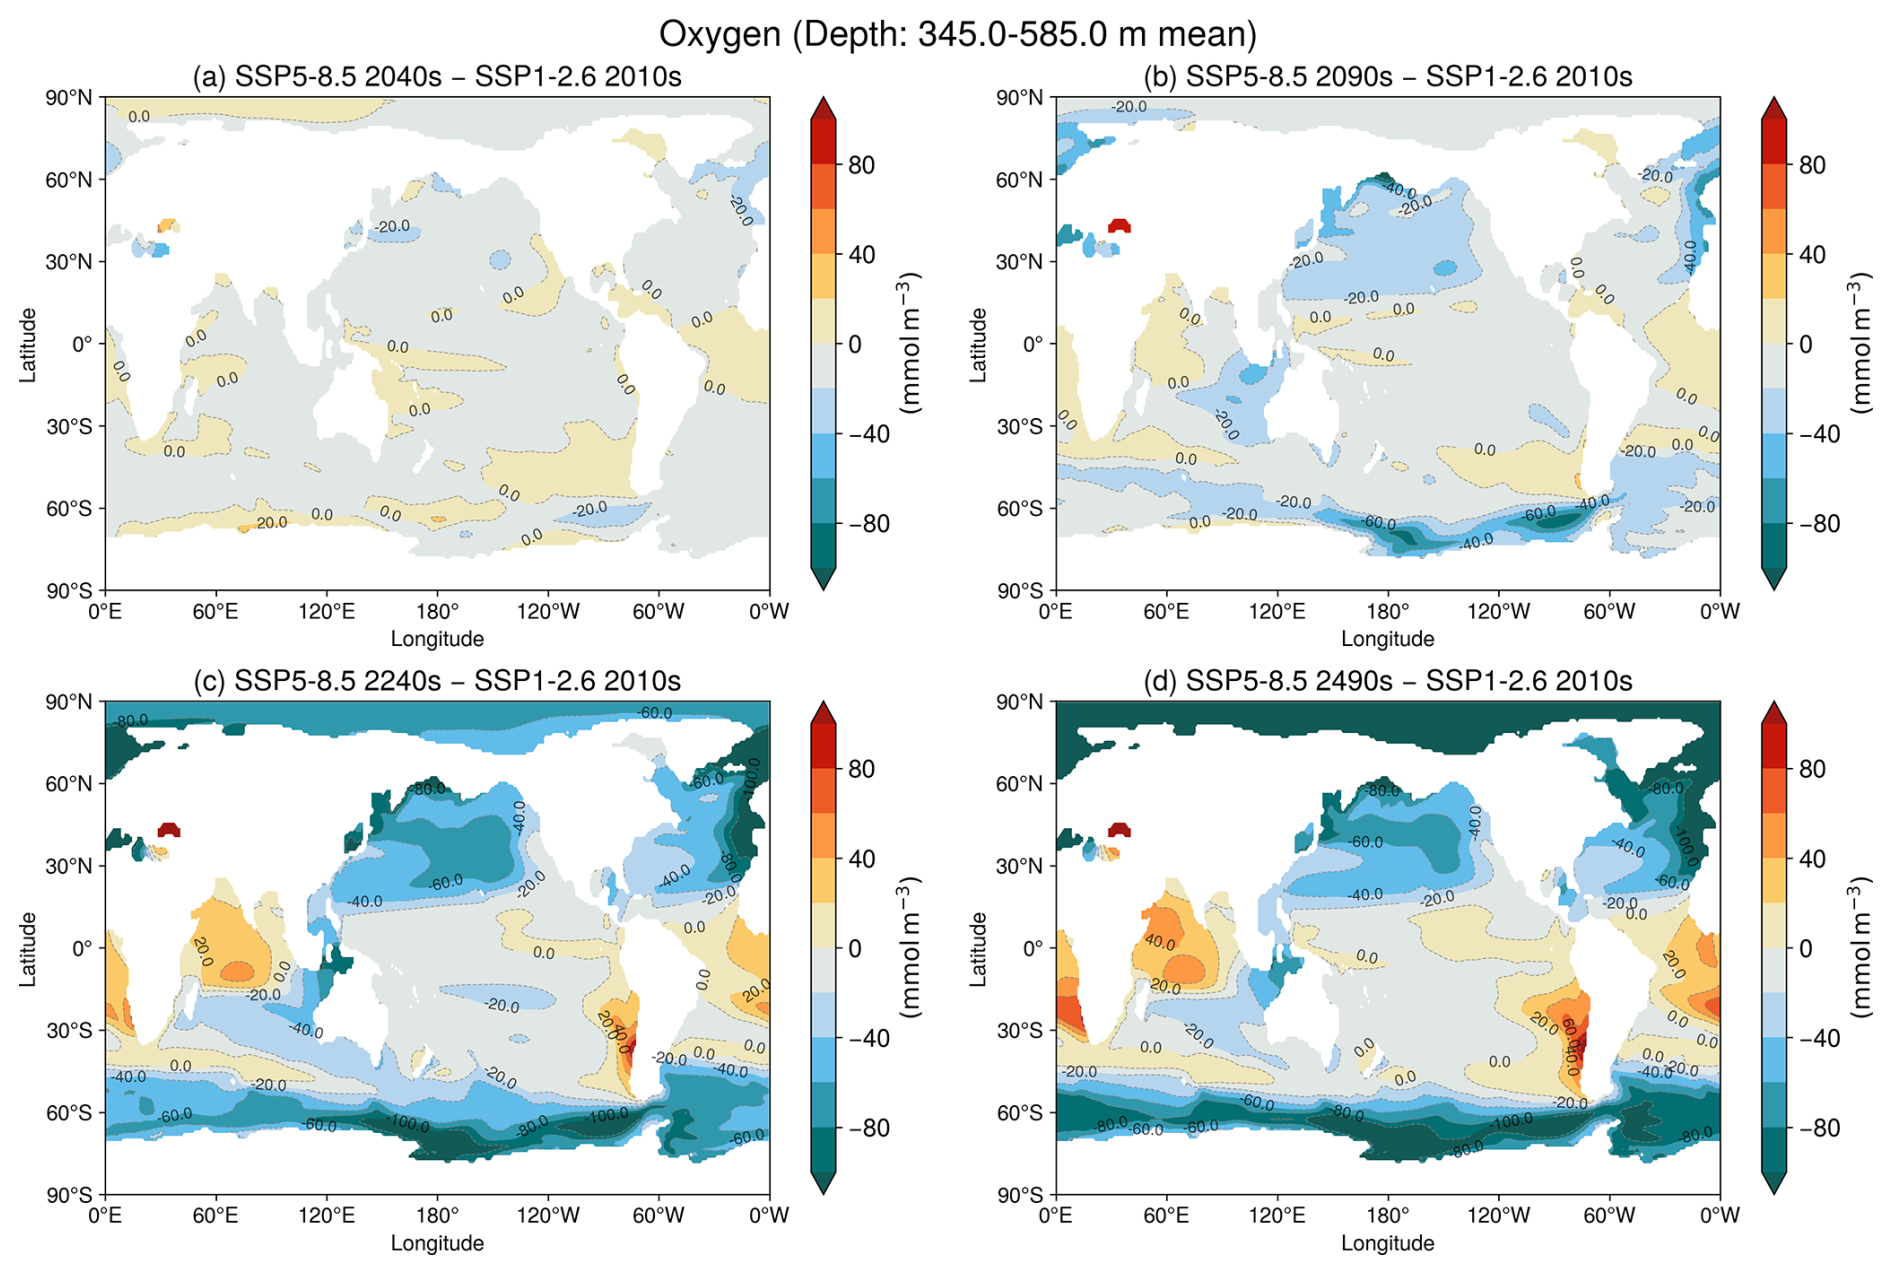
Figure A15Subsurface oxygen concentrations decrease substantially at high latitudes, whereas changes within equatorial OMZs are small. Dissolved oxygen anomalies (unit: mmol m−3) under SSP5–8.5, relative to the 2010s mean of SSP1–2.6. Panels show the (b) 2040s, (c) 2090s, (d) 2240s, and (e) 2490s.
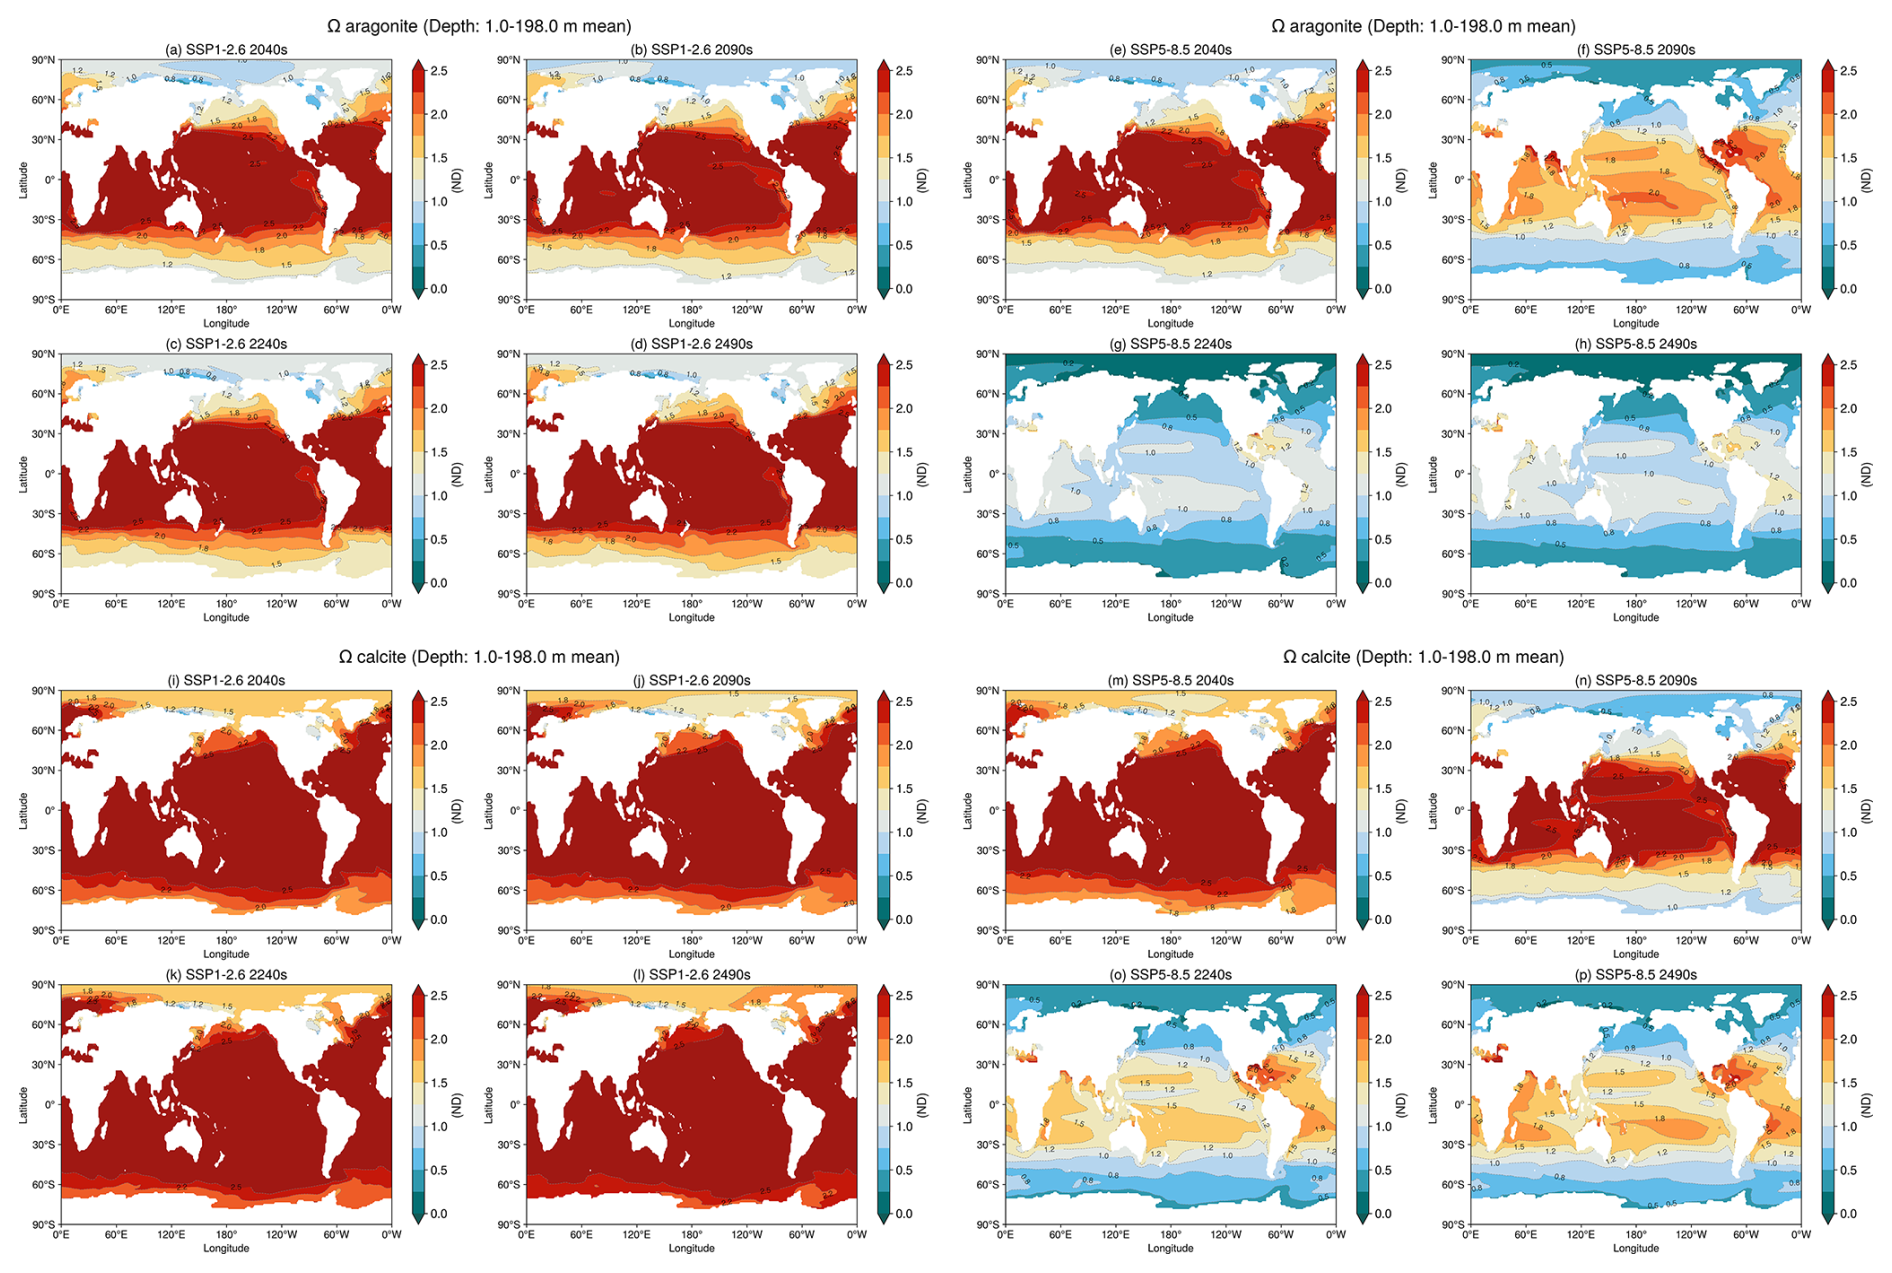
Figure A16Under SSP5–8.5, the aragonite saturation state falls below 1 after the 21st century, except in parts of the subtropics. Aragonite saturation state (Ωarag) under (a–d) SSP1–2.6 and (e–h) SSP5–8.5 for the upper ocean (0–200 m) in the (a, e) 2040s, (b, f) 2090s, (c, g) 2240s, and (d, h) 2490s. Calcite saturation state (Ωcalc) under (i–l) SSP1–2.6 and (m–p) SSP5–8.5 for the upper ocean (0–200 m) in the (i, m) 2040s, (j, n) 2090s, (k, o) 2240s, and (l, p) 2490s.
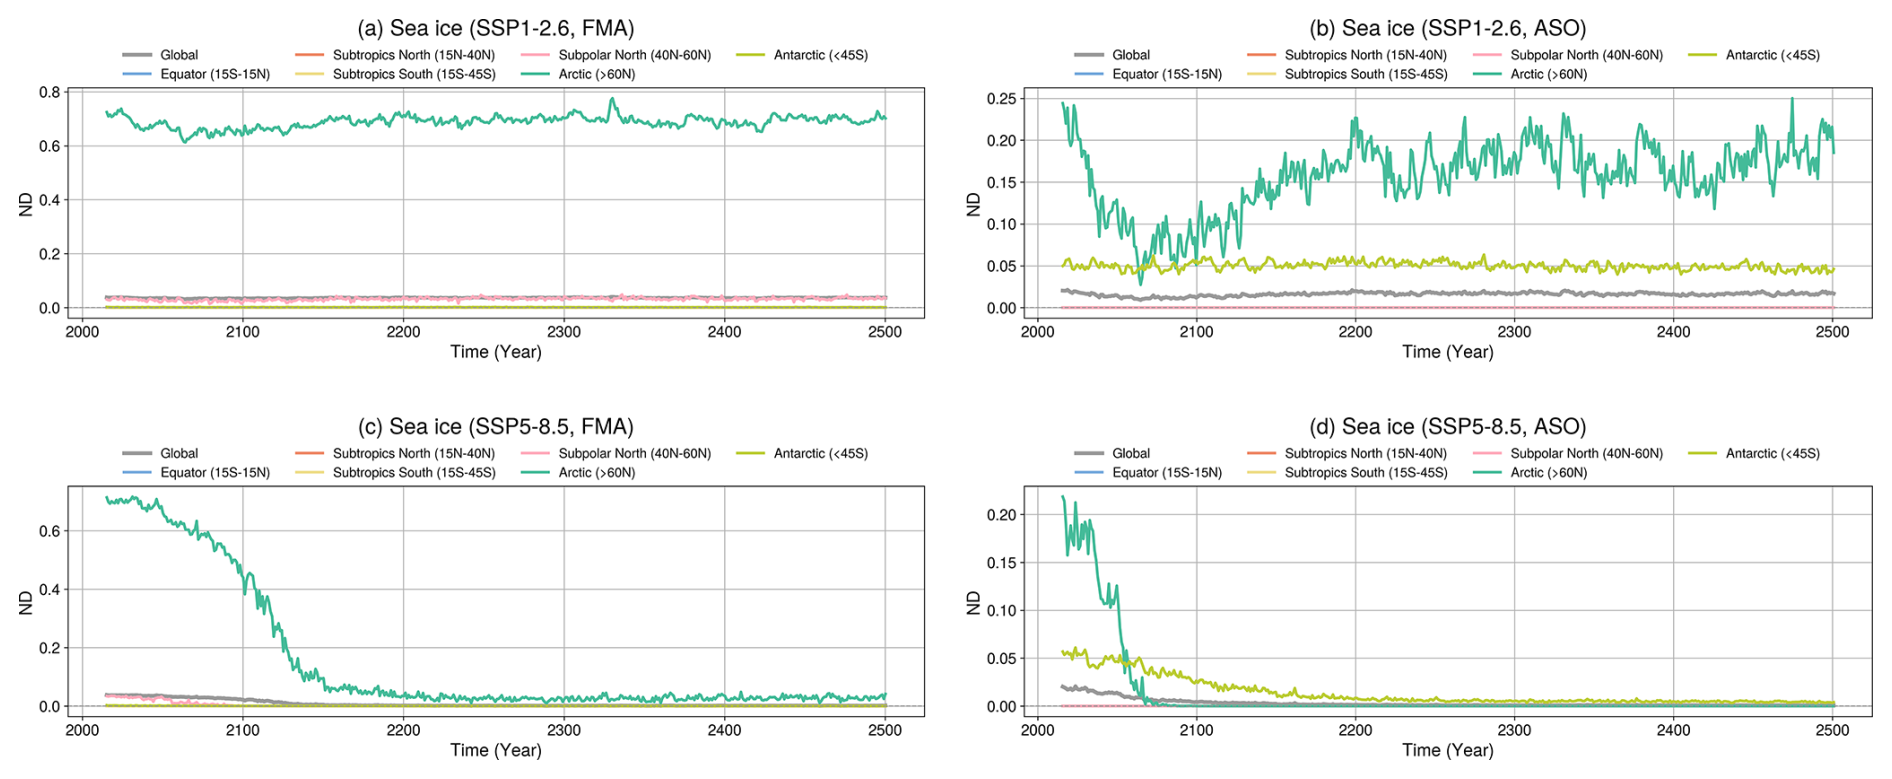
Figure A17Under SSP5–8.5, summer sea ice reaches a minimum by the mid–21st century, and winter sea ice does so within the 22nd century. Changes in sea-ice concentration by latitude band under four scenarios: (a) SSP1–2.6 (February–April; FMA), (b) SSP1–2.6 (August–October; ASO), (c) SSP5–8.5 (February–April; FMA), and (d) SSP5–8.5 (August–October; ASO). Colored lines represent different latitude bands as follows: gray (global mean), dark blue (equatorial: 15° S–15° N), orange (northern subtropics: 15–40° N), yellow (southern subtropics: 15–45° S), pink (northern subpolar: 40–60° N), green (Arctic: >60° N), and light green (Antarctic: <45° S).
Biogeochemical changes are strongly modulated by the physical state of the ocean, not only through source and sink processes but also via advection and diffusion, which transport biogeochemical tracers throughout the ocean interior. Therefore, in this section, we provide a brief overview of the key physical responses of deep ocean circulation, temperature, salinity, stratification, and sea-ice, focusing on aspects that are the most relevant to the interpretation of biogeochemical changes.
Global-scale ocean heat uptake and enhanced stratification lead to a pronounced weakening of the AMOC (Fig. A3). Under high-emission scenarios in particular, NADW formation declines substantially by the year 2100, with the associated deep ocean volume transport decreasing from approximately 30 Sv (where ) in the preindustrial era to about 5 Sv. This pronounced decline occurs primarily within the first 100 years of the simulation. In the Pacific Ocean, the deep circulation driven by AABW also weakens considerably, with transport rates approaching zero as global temperature reaches its maximum. As a result, the structure of the deep ocean circulation is substantially different from that of the present day.
With increasing , SST rises accordingly, and tends to remain elevated once the CO2 concentration stabilizes (Fig. A5). Under SSP5–8.5, the global mean SST increases by approximately +2 °C by 2100 and reaches around +4 °C by 2200. This warming exhibits substantial regional variability; SST increases more rapidly in the Arctic. Warming progresses more slowly in the Southern Ocean (south of 60° S) and the subantarctic region (30–60° S), where the rate of increase is roughly half that observed in the Arctic.
In contrast to the surface ocean, deep ocean temperatures continue to increase beyond 2300 under SSP5–8.5 approximately linearly (Fig. A5). This deep ocean warming is particularly pronounced in the Arctic, where the rate of temperature increase is roughly 3 times that in other regions. By 2500, the temperature increase below the depth of 1000 m in the Arctic Ocean exceeds 7 °C, compared to a global mean increase of approximately 2 °C at the same depth. Such regional differences are likely attributable to variations in the propagation of heat into the deep ocean and differences in deep ocean circulation. Under the low-emission scenario SSP1–2.6, the temperature increase in the upper 200 m of the ocean peaks in the latter half of the 21st century, reaching approximately +0.8 °C. By contrast, below 1000 m, warming continues gradually and reaches a comparable magnitude of about +0.8 °C by 2500.
Moreover, there is significant warming in the mid-depth layer (approximately 500–1000 m) even under low-emission scenarios, and this warming persists through to the year 2500. As a result, although surface warming enhances stratification, the subsurface is influenced by warming from intermediate depths, potentially weakening the stratification beneath the surface layer in some regions.
Timescales of sea-ice change are relatively short compared with those of changes of other physical variables. Under SSP5–8.5, wintertime sea-ice concentration reaches its minimum in the Arctic Ocean by the mid–22nd century and in the Southern Ocean around 2200 (Fig. A17). By contrast, summertime sea ice nearly disappears by the late 21st century.
The projected future loss of sea ice is expected to further amplify surface warming in the polar regions through reduced albedo. It is expected to enhance surface stratification and potentially impact biogeochemical cycles through changes in both the light environment and vertical nutrient supply.
The code of MIROC-ES2L is not publicly archived because of the copyright policy of the MIROC community. Readers are requested to contact the corresponding author if they wish to validate the model configurations of MIROC-ES2L and conduct replication experiments.
HK: Conceptualization; Methodology; Data analysis; Visualization; Writing – original draft. TY: Investigation (experiments); Data curation; Resources; Writing – review and editing. AY: Methodology; Model development; Writing – review and editing. TH: Methodology; Model development; Writing – review and editing. HT: Methodology; Model development; Writing – review and editing. AO: Supervision; Writing – review and editing. KR: Conceptualization; Supervision; Writing – review and editing. All authors discussed the results and commented on the manuscript.
The contact author has declared that none of the authors has any competing interests.
Publisher's note: Copernicus Publications remains neutral with regard to jurisdictional claims made in the text, published maps, institutional affiliations, or any other geographical representation in this paper. The authors bear the ultimate responsibility for providing appropriate place names. Views expressed in the text are those of the authors and do not necessarily reflect the views of the publisher.
The authors acknowledge support from the Program for the Advanced Studies of Climate Change Projection (SENTAN), PRESTO of the Japan Science and Technology Agency (JST), the Environment Research and Technology Development Fund, and the Japan Society for the Promotion of Science (JSPS). K.B.R. acknowledges support from the World Premier International Research Center Initiative (WPI), funded by the Ministry of Education, Culture, Sports, Science and Technology (MEXT), Japan. Numerical simulations were performed on the Earth Simulator 4 at JAMSTEC. We appreciate Takashi Obase’s comments regarding careful structuring of the text. Finally, we thank Tina Tin, from Edanz (http://jp.edanz.com/ac, last access: 18 October 2026) for editing a draft of this manuscript and helping to draft the abstract.
This research has been supported by the Ministry of Education, Culture, Sports, Science and Technology (MEXT), Japan (SENTAN, grant no. JPMXD0722681344), the Japan Science and Technology Agency (JST; PRESTO, grant no. JPMJPR23G4), the Environmental Restoration and Conservation Agency (ERCA) through the Environment Research and Technology Development Fund (grant no. JPMEERF23S21109), and the Japan Society for the Promotion of Science (JSPS; KAKENHI, grant nos. JP24H02339, JP24H02346, JP24K03061, and JP25H01902).
This paper was edited by Jack Middelburg and reviewed by two anonymous referees.
Archer, D. and Brovkin, V.: The millennial atmospheric lifetime of anthropogenic CO2, Clim. Change, 90, 283–297, https://doi.org/10.1007/s10584-008-9413-1, 2008. a
Archer, D., Kheshgi, H., and Maier-Reimer, E.: Dynamics of fossil fuel CO2 neutralization by marine CaCO3, Global Biogeochem. Cy., 12, 259–276, https://doi.org/10.1029/98gb00744, 1998. a
Armstrong McKay, D. I., Staal, A., Abrams, J. F., Winkelmann, R., Sakschewski, B., Loriani, S., Fetzer, I., Cornell, S. E., Rockström, J., and Lenton, T. M.: Exceeding 1.5 °C global warming could trigger multiple climate tipping points, Science, 377, https://doi.org/10.1126/science.abn7950, 2022. a
Bates, N. R., Moran, S. B., Hansell, D. A., and Mathis, J. T.: An increasing CO2 sink in the Arctic Ocean due to sea–ice loss, Geophys. Res. Lett., 33, https://doi.org/10.1029/2006gl027028, 2006. a
Bopp, L., Resplandy, L., Orr, J. C., Doney, S. C., Dunne, J. P., Gehlen, M., Halloran, P., Heinze, C., Ilyina, T., Séférian, R., Tjiputra, J., and Vichi, M.: Multiple stressors of ocean ecosystems in the 21st century: projections with CMIP5 models, Biogeosciences, 10, 6225–6245, https://doi.org/10.5194/bg-10-6225-2013, 2013. a, b
Bopp, L., Aumont, O., Kwiatkowski, L., Clerc, C., Dupont, L., Ethé, C., Gorgues, T., Séférian, R., and Tagliabue, A.: Diazotrophy as a key driver of the response of marine net primary productivity to climate change, Biogeosciences, 19, 4267–4285, https://doi.org/10.5194/bg-19-4267-2022, 2022. a, b
Broecker, W. S. and Peng, T.-H.: Tracers in the Sea, Eldigio Press (Lamont-Doherty Geological Observatory), Columbia University, Palisades, New York, ISBN: 978-9993186724, 1982. a
Bronselaer, B., Winton, M., Griffies, S. M., Hurlin, W. J., Rodgers, K. B., Sergienko, O. V., Stouffer, R. J., and Russell, J. L.: Change in future climate due to Antarctic meltwater, Nature, 564, 53–58, https://doi.org/10.1038/s41586-018-0712-z, 2018. a
Bronselaer, B., Russell, J. L., Winton, M., Williams, N. L., Key, R. M., Dunne, J. P., Feely, R. A., Johnson, K. S., and Sarmiento, J. L.: Importance of wind and meltwater for observed chemical and physical changes in the Southern Ocean, Nat. Geosci., 13, 35–42, https://doi.org/10.1038/s41586-018-0712-z, 2020. a
Chen, H., Haumann, F. A., Talley, L. D., Johnson, K. S., and Sarmiento, J. L.: The Deep Ocean's Carbon Exhaust, Global Biogeochem. Cy., 36, https://doi.org/10.1029/2021gb007156, 2022. a
Chen, J., Swart, N. C., Beadling, R., Cheng, X., Hattermann, T., Jüling, A., Li, Q., Marshall, J., Martin, T., Muilwijk, M., Pauling, A. G., Purich, A., Smith, I. J., and Thomas, M.: Reduced Deep Convection and Bottom Water Formation Due To Antarctic Meltwater in a Multi–Model Ensemble, Geophys. Res. Lett., 50, https://doi.org/10.1029/2023gl106492, 2023. a
Chikamoto, M. O. and DiNezio, P.: Multi–Century Changes in the Ocean Carbon Cycle Controlled by the Tropical Oceans and the Southern Ocean, Global Biogeochem. Cy., 35, https://doi.org/10.1029/2021gb007090, 2021. a, b
Chikamoto, M. O., DiNezio, P., and Lovenduski, N.: Long–Term Slowdown of Ocean Carbon Uptake by Alkalinity Dynamics, Geophys. Res. Lett., 50, https://doi.org/10.1029/2022gl101954, 2023. a, b, c, d
Claussen, M., Mysak, L., Weaver, A., Crucifix, M., Fichefet, T., Loutre, M.-F., Weber, S., Alcamo, J., Alexeev, V., Berger, A., Calov, R., Ganopolski, A., Goosse, H., Lohmann, G., Lunkeit, F., Mokhov, I., Petoukhov, V., Stone, P., and Wang, Z.: Earth system models of intermediate complexity: closing the gap in the spectrum of climate system models, Clim. Dynam., 18, 579–586, https://doi.org/10.1007/s00382-001-0200-1, 2002. a
Cooley, S., Schoeman, D., Bopp, L., Boyd, P., Donner, S., Ghebrehiwet, D. Y., Ito, S.-I., Kiessling, W., Martinetto, P., Ojea, E., Racault, M.-F., Rost, B., and Skern-Mauritzen, M.: Oceans and Coastal Ecosystems and Their Services, in: Climate Change 2022: Impacts, Adaptation and Vulnerability. Contribution of Working Group II to the Sixth Assessment Report of the Intergovernmental Panel on Climate Change, edited by: Pörtner, H.-O., Roberts, D. C., Tignor, M., Poloczanska, E. S., Mintenbeck, K., Alegría, A., Craig, M., Langsdorf, S., Löschke, S., Möller, V., Okem, A., and Rama, B., 379–550, Cambridge University Press, Cambridge, UK and New York, NY, USA, https://doi.org/10.1017/9781009325844.005, 2022. a
Egleston, E. S., Sabine, C. L., and Morel, F. M. M.: Revelle revisited: Buffer factors that quantify the response of ocean chemistry to changes in DIC and alkalinity, Global Biogeochem. Cy., 24, https://doi.org/10.1029/2008gb003407, 2010. a, b
Fassbender, A. J., Carter, B. R., Sharp, J. D., Huang, Y., Arroyo, M. C., and Frenzel, H.: Amplified Subsurface Signals of Ocean Acidification, Global Biogeochem. Cy., 37, https://doi.org/10.1029/2023gb007843, 2023. a
Forster, P. M., Maycock, A. C., McKenna, C. M., and Smith, C. J.: Latest climate models confirm need for urgent mitigation, Nat. Clim. Change, 10, 7–10, https://doi.org/10.1038/s41558-019-0660-0, 2019. a
Friedlingstein, P., Cox, P., Betts, R., Bopp, L., von Bloh, W., Brovkin, V., Cadule, P., Doney, S., Eby, M., Fung, I., Bala, G., John, J., Jones, C., Joos, F., Kato, T., Kawamiya, M., Knorr, W., Lindsay, K., Matthews, H. D., Raddatz, T., Rayner, P., Reick, C., Roeckner, E., Schnitzler, K.-G., Schnur, R., Strassmann, K., Weaver, A. J., Yoshikawa, C., and Zeng, N.: Climate–Carbon Cycle Feedback Analysis: Results from the C4MIP Model Intercomparison, J. Climate, 19, 3337–3353, https://doi.org/10.1175/jcli3800.1, 2006. a
Friedlingstein, P., Meinshausen, M., Arora, V. K., Jones, C. D., Anav, A., Liddicoat, S. K., and Knutti, R.: Uncertainties in CMIP5 Climate Projections due to Carbon Cycle Feedbacks, J. Climate, 27, 511–526, https://doi.org/10.1175/jcli-d-12-00579.1, 2014. a
Friedlingstein, P., O'Sullivan, M., Jones, M. W., Andrew, R. M., Hauck, J., Landschützer, P., Le Quéré, C., Li, H., Luijkx, I. T., Olsen, A., Peters, G. P., Peters, W., Pongratz, J., Schwingshackl, C., Sitch, S., Canadell, J. G., Ciais, P., Jackson, R. B., Alin, S. R., Arneth, A., Arora, V., Bates, N. R., Becker, M., Bellouin, N., Berghoff, C. F., Bittig, H. C., Bopp, L., Cadule, P., Campbell, K., Chamberlain, M. A., Chandra, N., Chevallier, F., Chini, L. P., Colligan, T., Decayeux, J., Djeutchouang, L. M., Dou, X., Duran Rojas, C., Enyo, K., Evans, W., Fay, A. R., Feely, R. A., Ford, D. J., Foster, A., Gasser, T., Gehlen, M., Gkritzalis, T., Grassi, G., Gregor, L., Gruber, N., Gürses, Ö., Harris, I., Hefner, M., Heinke, J., Hurtt, G. C., Iida, Y., Ilyina, T., Jacobson, A. R., Jain, A. K., Jarníková, T., Jersild, A., Jiang, F., Jin, Z., Kato, E., Keeling, R. F., Klein Goldewijk, K., Knauer, J., Korsbakken, J. I., Lan, X., Lauvset, S. K., Lefèvre, N., Liu, Z., Liu, J., Ma, L., Maksyutov, S., Marland, G., Mayot, N., McGuire, P. C., Metzl, N., Monacci, N. M., Morgan, E. J., Nakaoka, S.-I., Neill, C., Niwa, Y., Nützel, T., Olivier, L., Ono, T., Palmer, P. I., Pierrot, D., Qin, Z., Resplandy, L., Roobaert, A., Rosan, T. M., Rödenbeck, C., Schwinger, J., Smallman, T. L., Smith, S. M., Sospedra-Alfonso, R., Steinhoff, T., Sun, Q., Sutton, A. J., Séférian, R., Takao, S., Tatebe, H., Tian, H., Tilbrook, B., Torres, O., Tourigny, E., Tsujino, H., Tubiello, F., van der Werf, G., Wanninkhof, R., Wang, X., Yang, D., Yang, X., Yu, Z., Yuan, W., Yue, X., Zaehle, S., Zeng, N., and Zeng, J.: Global Carbon Budget 2024, Earth Syst. Sci. Data, 17, 965–1039, https://doi.org/10.5194/essd-17-965-2025, 2025. a, b
Gregory, J. M., Ingram, W. J., Palmer, M. A., Jones, G. S., Stott, P. A., Thorpe, R. B., Lowe, J. A., Johns, T. C., and Williams, K. D.: A new method for diagnosing radiative forcing and climate sensitivity, Geophys. Res. Lett., 31, https://doi.org/10.1029/2003gl018747, 2004. a
Hajima, T., Watanabe, M., Yamamoto, A., Tatebe, H., Noguchi, M. A., Abe, M., Ohgaito, R., Ito, A., Yamazaki, D., Okajima, H., Ito, A., Takata, K., Ogochi, K., Watanabe, S., and Kawamiya, M.: Development of the MIROC-ES2L Earth system model and the evaluation of biogeochemical processes and feedbacks, Geosci. Model Dev., 13, 2197–2244, https://doi.org/10.5194/gmd-13-2197-2020, 2020a. a, b, c, d
Hajima, T., Yamamoto, A., Kawamiya, M., Su, X., Watanabe, M., Ohgaito, R., and Tatebe, H.: Millennium time-scale experiments on climate-carbon cycle with doubled CO2 concentration, Progress in Earth and Planetary Science, 7, https://doi.org/10.1186/s40645-020-00350-2, 2020b. a
Hasumi, H.: CCSR Rep. 25, chap. CCSR Ocean Component Model (COCO) Version 4.0, 103 pp., Center for Climate System Research, Univ. of Tokyo, Japan, 2006. a
Hayashi, M., Yokohata, T., Shiogama, H., Ogura, T., Hajima, T., Jin, F.-F., Zhao, S., and Stuecker, M. F.: Unraveling non-monotonic responses of the El Nino–Southern Oscillation to post-2100 global warming, npj Climate and Atmospheric Science, 9, https://doi.org/10.1038/s41612-026-01375-y, 2026. a
Henson, S. A., Laufkötter, C., Leung, S., Giering, S. L. C., Palevsky, H. I., and Cavan, E. L.: Uncertain response of ocean biological carbon export in a changing world, Nat. Geosci., 15, 248–254, https://doi.org/10.1038/s41561-022-00927-0, 2022. a
Ito, A. and Inatomi, M.: Water-Use Efficiency of the Terrestrial Biosphere: A Model Analysis Focusing on Interactions between the Global Carbon and Water Cycles, J. Hydrometeorol., 13, 681–694, https://doi.org/10.1175/jhm-d-10-05034.1, 2012. a
Ito, T., Bracco, A., Deutsch, C., Frenzel, H., Long, M., and Takano, Y.: Sustained growth of the Southern Ocean carbon storage in a warming climate, Geophys. Res. Lett., 42, 4516–4522, https://doi.org/10.1002/2015gl064320, 2015. a
Khatiwala, S., Strachan, O., and Schmittner, A.: Multi-centennial response of marine carbon pumps to global warming, Nat. Clim. Change, 16, 947–955, https://doi.org/10.1038/s41558-026-02686-x, 2026. a
Koven, C. D., Arora, V. K., Cadule, P., Fisher, R. A., Jones, C. D., Lawrence, D. M., Lewis, J., Lindsay, K., Mathesius, S., Meinshausen, M., Mills, M., Nicholls, Z., Sanderson, B. M., Séférian, R., Swart, N. C., Wieder, W. R., and Zickfeld, K.: Multi-century dynamics of the climate and carbon cycle under both high and net negative emissions scenarios, Earth Syst. Dynam., 13, 885–909, https://doi.org/10.5194/esd-13-885-2022, 2022. a, b
Kwiatkowski, L. and Orr, J. C.: Diverging seasonal extremes for ocean acidification during the twenty-first century, Nat. Clim. Change, 8, 141–145, https://doi.org/10.1038/s41558-017-0054-0, 2018. a
Kwiatkowski, L., Torres, O., Bopp, L., Aumont, O., Chamberlain, M., Christian, J. R., Dunne, J. P., Gehlen, M., Ilyina, T., John, J. G., Lenton, A., Li, H., Lovenduski, N. S., Orr, J. C., Palmieri, J., Santana-Falcón, Y., Schwinger, J., Séférian, R., Stock, C. A., Tagliabue, A., Takano, Y., Tjiputra, J., Toyama, K., Tsujino, H., Watanabe, M., Yamamoto, A., Yool, A., and Ziehn, T.: Twenty-first century ocean warming, acidification, deoxygenation, and upper-ocean nutrient and primary production decline from CMIP6 model projections, Biogeosciences, 17, 3439–3470, https://doi.org/10.5194/bg-17-3439-2020, 2020. a, b, c, d, e, f, g
Kwiatkowski, L., Planchat, A., Pyolle, M., Torres, O., Bouttes, N., Comte, A., and Bopp, L.: Declining coral calcification to enhance twenty-first-century ocean carbon uptake by gigatonnes, Proc. Natl. Acad. Sci. USA, 122, https://doi.org/10.1073/pnas.2501562122, 2025. a
Kwon, E. Y., Sreeush, M. G., Timmermann, A., Karl, D. M., Church, M. J., Lee, S.-S., and Yamaguchi, R.: Nutrient uptake plasticity in phytoplankton sustains future ocean net primary production, Sci. Adv., 8, https://doi.org/10.1126/sciadv.add2475, 2022. a
Lacroix, F., Ilyina, T., and Hartmann, J.: Oceanic CO2 outgassing and biological production hotspots induced by pre-industrial river loads of nutrients and carbon in a global modeling approach, Biogeosciences, 17, 55–88, https://doi.org/10.5194/bg-17-55-2020, 2020. a
Lago, V. and England, M. H.: Projected Slowdown of Antarctic Bottom Water Formation in Response to Amplified Meltwater Contributions, J. Climate, 32, 6319–6335, https://doi.org/10.1175/jcli-d-18-0622.1, 2019. a
Lee, S.-S., Sharma, S., Rosenbloom, N., Rodgers, K. B., Kim, J.-E., Kwon, E. Y., Franzke, C. L. E., Kim, I.-W., Sreeush, M. G., and Stein, K.: Multi-centennial climate change in a warming world beyond 2100, Earth Syst. Dynam., 16, 1427–1451, https://doi.org/10.5194/esd-16-1427-2025, 2025. a
Lenton, T. M., Held, H., Kriegler, E., Hall, J. W., Lucht, W., Rahmstorf, S., and Schellnhuber, H. J.: Tipping elements in the Earth's climate system, P. Natl. Acad. Sci. USA, 105, 1786–1793, https://doi.org/10.1073/pnas.0705414105, 2008. a
Lotze, H. K., Tittensor, D. P., Bryndum-Buchholz, A., Eddy, T. D., Cheung, W. W. L., Galbraith, E. D., Barange, M., Barrier, N., Bianchi, D., Blanchard, J. L., Bopp, L., Büchner, M., Bulman, C. M., Carozza, D. A., Christensen, V., Coll, M., Dunne, J. P., Fulton, E. A., Jennings, S., Jones, M. C., Mackinson, S., Maury, O., Niiranen, S., Oliveros-Ramos, R., Roy, T., Fernandes, J. A., Schewe, J., Shin, Y.-J., Silva, T. A. M., Steenbeek, J., Stock, C. A., Verley, P., Volkholz, J., Walker, N. D., and Worm, B.: Global ensemble projections reveal trophic amplification of ocean biomass declines with climate change, P. Natl. Acad. Sci. USA, 116, 12907–12912, https://doi.org/10.1073/pnas.1900194116, 2019. a
MacDougall, A. H., Frölicher, T. L., Jones, C. D., Rogelj, J., Matthews, H. D., Zickfeld, K., Arora, V. K., Barrett, N. J., Brovkin, V., Burger, F. A., Eby, M., Eliseev, A. V., Hajima, T., Holden, P. B., Jeltsch-Thömmes, A., Koven, C., Mengis, N., Menviel, L., Michou, M., Mokhov, I. I., Oka, A., Schwinger, J., Séférian, R., Shaffer, G., Sokolov, A., Tachiiri, K., Tjiputra , J., Wiltshire, A., and Ziehn, T.: Is there warming in the pipeline? A multi-model analysis of the Zero Emissions Commitment from CO2, Biogeosciences, 17, 2987–3016, https://doi.org/10.5194/bg-17-2987-2020, 2020. a
Masson-Delmotte, V., Zhai, P., Pirani, A., Connors, S., Pean, C., Berger, S., Caud, N., Chen, Y., Goldfarb, L., Gomis, M., Huang, M., Leitzell, K., Lonnoy, E., Matthews, J., Maycock, T., Waterfield, T., Yelekci, O., Yu, R., and Zhou, B. (Eds.): Climate Change 2021: The Physical Science Basis. Contribution of Working Group I to the Sixth Assessment Report of the Intergovernmental Panel on Climate Change, Cambridge University Press, Cambridge, United Kingdom and New York, NY, USA, https://doi.org/10.1017/9781009157896, 2021. a, b, c
Meinshausen, M., Nicholls, Z. R. J., Lewis, J., Gidden, M. J., Vogel, E., Freund, M., Beyerle, U., Gessner, C., Nauels, A., Bauer, N., Canadell, J. G., Daniel, J. S., John, A., Krummel, P. B., Luderer, G., Meinshausen, N., Montzka, S. A., Rayner, P. J., Reimann, S., Smith, S. J., van den Berg, M., Velders, G. J. M., Vollmer, M. K., and Wang, R. H. J.: The shared socio-economic pathway (SSP) greenhouse gas concentrations and their extensions to 2500, Geosci. Model Dev., 13, 3571–3605, https://doi.org/10.5194/gmd-13-3571-2020, 2020. a
Mikaloff Fletcher, S. E., Gruber, N., Jacobson, A. R., Gloor, M., Doney, S. C., Dutkiewicz, S., Gerber, M., Follows, M., Joos, F., Lindsay, K., Menemenlis, D., Mouchet, A., Müller, S. A., and Sarmiento, J. L.: Inverse estimates of the oceanic sources and sinks of natural CO2 and the implied oceanic carbon transport, Global Biogeochem. Cy., 21, https://doi.org/10.1029/2006gb002751, 2007. a
Mongwe, P., Gregor, L., Tjiputra, J., Hauck, J., Ito, T., Danek, C., Vichi, M., Thomalla, S., and Monteiro, P. M. S.: Projected poleward migration of the Southern Ocean CO2 sink region under high emissions, Commun. Earth Environ., 5, https://doi.org/10.1038/s43247-024-01382-y, 2024. a
Moore, J. K., Fu, W., Primeau, F., Britten, G. L., Lindsay, K., Long, M., Doney, S. C., Mahowald, N., Hoffman, F., and Randerson, J. T.: Sustained climate warming drives declining marine biological productivity, Science, 359, 1139–1143, https://doi.org/10.1126/science.aao6379, 2018. a, b
Nakamura, Y. and Oka, A.: CMIP5 model analysis of future changes in ocean net primary production focusing on differences among individual oceans and models, J. Oceanogr., 75, 441–462, https://doi.org/10.1007/s10872-019-00513-w, 2019. a
Numaguti, A., Sugata, S., Takahashi, M., Nakajima, T., and Sumi, A.: Study on the climate system and mass transport by a climate model, Cent. Glob. Environ. Res. Supercomput. Monogr. Rep., 3, 1–48, 1997. a
Ohgaito, R., Yamamoto, A., Hajima, T., O'ishi, R., Abe, M., Tatebe, H., Abe-Ouchi, A., and Kawamiya, M.: PMIP4 experiments using MIROC-ES2L Earth system model, Geosci. Model Dev., 14, 1195–1217, https://doi.org/10.5194/gmd-14-1195-2021, 2021. a
Orr, J. C., Fabry, V. J., Aumont, O., Bopp, L., Doney, S. C., Feely, R. A., Gnanadesikan, A., Gruber, N., Ishida, A., Joos, F., Key, R. M., Lindsay, K., Maier-Reimer, E., Matear, R., Monfray, P., Mouchet, A., Najjar, R. G., Plattner, G.-K., Rodgers, K. B., Sabine, C. L., Sarmiento, J. L., Schlitzer, R., Slater, R. D., Totterdell, I. J., Weirig, M.-F., Yamanaka, Y., and Yool, A.: Anthropogenic ocean acidification over the twenty-first century and its impact on calcifying organisms, Nature, 437, 681–686, https://doi.org/10.1038/nature04095, 2005. a, b, c
Orr, J. C., Kwiatkowski, L., and Pörtner, H.-O.: Arctic Ocean annual high in pCO2 could shift from winter to summer, Nature, 610, 94–100, https://doi.org/10.1038/s41586-022-05205-y, 2022. a, b
Planchat, A., Bopp, L., Kwiatkowski, L., and Torres, O.: The carbonate pump feedback on alkalinity and the carbon cycle in the 21st century and beyond, Earth Syst. Dynam., 15, 565–588, https://doi.org/10.5194/esd-15-565-2024, 2024. a, b
Rahmstorf, S.: Ocean circulation and climate during the past 120,000 years, Nature, 419, 207–214, https://doi.org/10.1038/nature01090, 2002. a
Regnier, P., Resplandy, L., Najjar, R. G., and Ciais, P.: The land-to-ocean loops of the global carbon cycle, Nature, 603, 401–410, https://doi.org/10.1038/s41586-021-04339-9, 2022. a
Riebesell, U., Körtzinger, A., and Oschlies, A.: Sensitivities of marine carbon fluxes to ocean change, P. Natl. Acad. Sci. USA, 106, 20602–20609, https://doi.org/10.1073/pnas.0813291106, 2009. a
Rodgers, K. B., Aumont, O., Toyama, K., Resplandy, L., Ishii, M., Nakano, T., Sasano, D., Bianchi, D., and Yamaguchi, R.: Low-latitude mesopelagic nutrient recycling controls productivity and export, Nature, 632, 802–807, https://doi.org/10.1038/s41586-024-07779-1, 2024. a, b, c
Sarmiento, J. L. and Gruber, N. (Eds.): Ocean biogeochemical dynamics, Princeton University Press, ISBN: 978-0691017075, 2006. a, b
Stock, C. A., John, J. G., Rykaczewski, R. R., Asch, R. G., Cheung, W. W. L., Dunne, J. P., Friedland, K. D., Lam, V. W. Y., Sarmiento, J. L., and Watson, R. A.: Reconciling fisheries catch and ocean productivity, P. Natl. Acad. Sci. USA, 114, https://doi.org/10.1073/pnas.1610238114, 2017. a
Swingedouw, D., Bopp, L., Matras, A., and Braconnot, P.: Effect of land–ice melting and associated changes in the AMOC result in little overall impact on oceanic CO2 uptake, Geophys. Res. Lett., 34, https://doi.org/10.1029/2007gl031990, 2007. a
Takata, K., Emori, S., and Watanabe, T.: Development of the minimal advanced treatments of surface interaction and runoff, Glob. Planet. Change, 38, 209–222, https://doi.org/10.1016/s0921-8181(03)00030-4, 2003. a
Takemura, T.: Simulation of climate response to aerosol direct and indirect effects with aerosol transport-radiation model, J. Geophys. Res., 110, D02202, https://doi.org/10.1029/2004jd005029, 2005. a
Takemura, T., Okamoto, H., Maruyama, Y., Numaguti, A., Higurashi, A., and Nakajima, T.: Global three–dimensional simulation of aerosol optical thickness distribution of various origins, J. Geophys. Res.-Atmos., 105, 17853–17873, https://doi.org/10.1029/2000jd900265, 2000. a
Terhaar, J., Frölicher, T. L., and Joos, F.: Observation-constrained estimates of the global ocean carbon sink from Earth system models, Biogeosciences, 19, 4431–4457, https://doi.org/10.5194/bg-19-4431-2022, 2022. a
Tittensor, D. P., Novaglio, C., Harrison, C. S., Heneghan, R. F., Barrier, N., Bianchi, D., Bopp, L., Bryndum-Buchholz, A., Britten, G. L., Büchner, M., Cheung, W. W. L., Christensen, V., Coll, M., Dunne, J. P., Eddy, T. D., Everett, J. D., Fernandes-Salvador, J. A., Fulton, E. A., Galbraith, E. D., Gascuel, D., Guiet, J., John, J. G., Link, J. S., Lotze, H. K., Maury, O., Ortega-Cisneros, K., Palacios-Abrantes, J., Petrik, C. M., du Pontavice, H., Rault, J., Richardson, A. J., Shannon, L., Shin, Y.-J., Steenbeek, J., Stock, C. A., and Blanchard, J. L.: Next-generation ensemble projections reveal higher climate risks for marine ecosystems, Nat. Clim. Change, 11, 973–981, https://doi.org/10.1038/s41558-021-01173-9, 2021. a, b
Tjiputra, J. F., Olsen, A., Bopp, L., Lenton, A., Pfeil, B., Roy, T., Segschneider, J., Totterdell, I., and Heinze, C.: Long-term surface pCO2 trends from observations and models, Tellus B, 66, 23083, https://doi.org/10.3402/tellusb.v66.23083, 2014. a
Tsutsui, J.: Diagnosing Transient Response to CO2 Forcing in Coupled Atmosphere–Ocean Model Experiments Using a Climate Model Emulator, Geophys. Res. Lett., 47, https://doi.org/10.1029/2019gl085844, 2020. a
Watanabe, S., Hajima, T., Sudo, K., Nagashima, T., Takemura, T., Okajima, H., Nozawa, T., Kawase, H., Abe, M., Yokohata, T., Ise, T., Sato, H., Kato, E., Takata, K., Emori, S., and Kawamiya, M.: MIROC-ESM 2010: model description and basic results of CMIP5-20c3m experiments, Geosci. Model Dev., 4, 845–872, https://doi.org/10.5194/gmd-4-845-2011, 2011. a
Weber, S. L.: The utility of Earth system Models of Intermediate Complexity (EMICs), Wiley Interdisciplinary Reviews: Climate Change, 1, 243–252, https://doi.org/10.1002/wcc.24, 2010. a
Weijer, W., Cheng, W., Drijfhout, S. S., Fedorov, A. V., Hu, A., Jackson, L. C., Liu, W., McDonagh, E. L., Mecking, J. V., and Zhang, J.: Stability of the Atlantic Meridional Overturning Circulation: A Review and Synthesis, J. Geophys. Res.-Oceans, 124, 5336–5375, https://doi.org/10.1029/2019jc015083, 2019. a
Weijer, W., Cheng, W., Garuba, O. A., Hu, A., and Nadiga, B. T.: CMIP6 Models Predict Significant 21st Century Decline of the Atlantic Meridional Overturning Circulation, Geophys. Res. Lett., 47, https://doi.org/10.1029/2019gl086075, 2020. a
Wilson, J. D., Andrews, O., Katavouta, A., de Melo Virissimo, F., Death, R. M., Adloff, M., Baker, C. A., Blackledge, B., Goldsworth, F. W., Kennedy-Asser, A. T., Liu, Q., Sieradzan, K. R., Vosper, E., and Ying, R.: The biological carbon pump in CMIP6 models: 21st century trends and uncertainties, P. Natl. Acad. Sci. USA, 119, https://doi.org/10.1073/pnas.2204369119, 2022. a
Yamamoto, A., Abe-Ouchi, A., and Yamanaka, Y.: Long-term response of oceanic carbon uptake to global warming via physical and biological pumps, Biogeosciences, 15, 4163–4180, https://doi.org/10.5194/bg-15-4163-2018, 2018. a
Yamamoto, A., Hajima, T., Yamazaki, D., Noguchi Aita, M., Ito, A., and Kawamiya, M.: Competing and accelerating effects of anthropogenic nutrient inputs on climate-driven changes in ocean carbon and oxygen cycles, Sci. Adv., 8, https://doi.org/10.1126/sciadv.abl9207, 2022. a
Yoshikawa, C., Kawamiya, M., Kato, T., Yamanaka, Y., and Matsuno, T.: Geographical distribution of the feedback between future climate change and the carbon cycle, J. Geophys. Res.-Biogeo., 113, https://doi.org/10.1029/2007jg000570, 2008. a