
the Creative Commons Attribution 4.0 License.
the Creative Commons Attribution 4.0 License.
 | 10 Nov 2026
Dynamics of inorganic nitrogen cycling, redox conditions, and microbial community composition in a floodplain soil induced by a heavy rainfall after summer drought
Johanna Schlögl
Clemens Karwautz
Lena Cramaro
Wolfgang Wanek
Judith Prommer
Theresa Böckle
Andreas Kappler
Stefan B. Haderlein

Christian Griebler
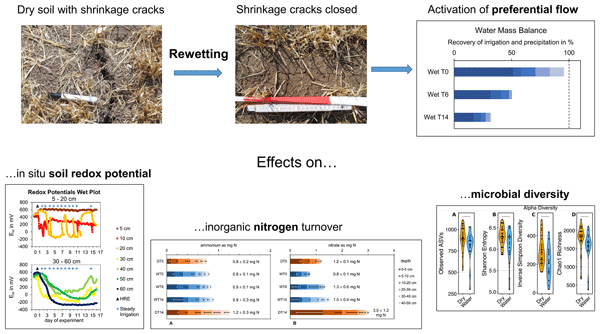
Climate change is increasing the frequency of droughts followed by heavy rainfall in temperate regions, with important consequences for water flow, nitrogen transport, redox dynamics, and microbial activity in floodplain soils. We investigated these coupled responses in a field experiment on a fine-textured arable Gleysol after prolonged summer drought. A simulated heavy rainfall event was applied using D2O-labeled water as a hydrological tracer, followed by recurrent moderate irrigation with non-labeled water. Soil cores to 50 cm depth were collected from irrigated and dry control plots over 14 d and analyzed for soil water content, δ2H signatures, nitrate and ammonium masses, bacterial community composition based on DNA and RNA, and extracellular enzyme activities. In situ redox potentials were monitored along the soil profile. Within two hours after the simulated heavy rainfall, labeled water had reached at least 50 cm depth, indicating rapid preferential flow through drought-induced shrinkage cracks. This was accompanied by a significant decline in nitrate mass in the topsoil without nitrate accumulation at 50 cm depth, suggesting nitrate transport below the investigated profile. In contrast, ammonium remained largely retained and increased only in the uppermost soil layer, consistent with a short-term rewetting-induced mineralization pulse. Subsequent moderate irrigation was retained mainly in the topsoil, likely because shrinkage cracks had closed after initial wetting. Redox potentials declined after irrigation, and were associated with later changes in nitrate pools, although transformation rates were not directly measured. Bacterial community composition remained stable at both DNA and RNA levels, whereas β-glucosidase and exochitinase activities increased after irrigation. Overall, heavy rainfall after drought created a short hydrological window for rapid nitrate displacement through preferential flow pathways, potentially bypassing nitrogen retention in the biologically active topsoil and nitrate transfer to deeper soil layers or shallow groundwater.
- Article
(4785 KB) - Full-text XML
- BibTeX
- EndNote


Floodplains are biogeochemically active interfaces between terrestrial and aquatic systems and play an important role in nitrogen retention and turnover (Lair et al., 2009; Venterink et al., 2003). Their soils are often exposed to recurrent inundation, drying, and fluctuations in groundwater level, which cause pronounced shifts in oxygen availability and redox conditions (Baldwin and Mitchell, 2000; Coby et al., 2011). These redox fluctuations regulate the dominant pathways of inorganic nitrogen transformation (Baldwin and Mitchell, 2000; Hefting et al., 2004). Organic matter mineralization releases ammonium, which may accumulate under reducing conditions or be oxidized to nitrate under oxic conditions. Conversely, nitrate is reduced under low-oxygen conditions, mainly through denitrification to N2O and N2 via nitrite and nitric oxide. Thus, floodplain soils are hotspots of nitrogen transformation, but the balance between nitrogen retention, gaseous loss, and leaching depends strongly on hydrological connectivity and redox dynamics.
Climate change is expected to increase the frequency and intensity of weather extremes, including droughts and heavy rainfall events, in temperate regions of Central Europe (Coumou and Rahmstorf, 2012; Horton et al., 2016; Perkins et al., 2012). Heavy rainfall following summer drought can trigger rapid hydrological and biogeochemical responses, particularly in fine-textured, loamy soils. During drought, shrinkage cracks may form and create preferential flow paths that allow water, dissolved solutes, and particle-associated compounds to bypass much of the soil matrix and move rapidly into deeper soil layers (Beven and Germann, 2013; Jarvis et al., 2016; Nimmo, 2021). Such preferential flow has been shown to enhance the vertical transport of nutrients and agrochemicals during subsequent rainfall events (Bronswijk et al., 1995; Kelly and Pomes, 1998; Schlögl et al., 2022). For inorganic nitrogen, this process is particularly relevant because ammonium and nitrate differ strongly in mobility. Ammonium is retained by sorption to negatively charged mineral surfaces, especially clay minerals, whereas nitrate is weakly sorbed and can therefore be transported with percolating and infiltrating water (Blume et al., 2016). Heavy rainfall after drought may therefore decouple the vertical redistribution of water, nitrate, and ammonium, with potential implications for nitrogen retention in the soil profile and nitrate transfer to deeper soil layers or groundwater.
In addition to physical transport, rewetting of dry soil can stimulate short-lived pulses of microbial activity and nitrogen mineralization, commonly referred to as the Birch effect. This effect describes the transient release of inorganic nitrogen after rewetting, as observed in both laboratory and field studies (Birch, 1958, 1960; Cui and Caldwell, 1997). It is commonly attributed to microbial cell lysis, the mineralization of dead microbial biomass, and the decomposition of osmoregulatory compounds released during rewetting (Fierer and Schimel, 2002; Jarvis et al., 2007; Saetre and Stark, 2005; Unger et al., 2010). In the field, this pulse can last several days, with the strongest nitrogen release often occurring within the first few days after rewetting (Cui and Caldwell, 1997). However, after the initial rewetting pulse, inorganic nitrogen pools may increasingly reflect the combined effects of continued mineralization, nitrification, denitrification, microbial immobilization, and transport. Distinguishing these processes from pool-size data alone is challenging, particularly under field conditions where water flow and redox conditions vary strongly with depth and time.
Microbial communities mediate most nitrogen transformation processes in soils, but their responses to drought and rewetting are complex. Soil microbial communities can adapt to repeated drying–rewetting cycles, depending on the frequency, intensity, and duration of such disturbances (Armstrong et al., 2016; Fierer et al., 2003; Veach and Zeglin, 2020). Floodplain soils may therefore show contrasting responses: microbial activity may respond rapidly to rewetting, whereas community composition may remain comparatively stable over short time scales because of spatial heterogeneity, dormancy, or prior exposure to fluctuating environmental conditions (Moche et al., 2015; Rinklebe and Langer, 2006). Combining microbial community analyses with extracellular enzyme activities can therefore help distinguish whether drought–rewetting primarily affects microbial activity or also leads to detectable shifts in community composition.
Despite extensive knowledge on preferential flow, the Birch effect, redox-dependent nitrogen transformations, and microbial responses to wetting and drying, these processes are rarely investigated together under realistic field conditions. In particular, it remains difficult to determine how heavy rainfall after summer drought simultaneously affects (i) the depth distribution of newly infiltrated water, (ii) the redistribution of nitrate and ammonium, (iii) the development of redox conditions along the soil profile, and (iv) microbial community composition and activity. This integrated perspective is needed because drought-induced preferential flow may rapidly transport nitrate beyond the biologically active topsoil, while subsequent soil wetting may alter redox conditions and microbial activity in ways that affect inorganic nitrogen pools over the following days.
The objective of this study was therefore to assess how a simulated heavy rainfall event after summer drought affects water infiltration, inorganic nitrogen redistribution, redox dynamics, and microbial responses in a fine-textured floodplain soil. Specifically, we aimed to (i) quantify the depth distribution of infiltrating water after heavy rainfall using D2O-labeled irrigation water, (ii) assess whether nitrate and ammonium differ in their vertical redistribution after rewetting, (iii) evaluate how in situ redox potentials develop during subsequent moderate irrigation and how these dynamics relate to inorganic nitrogen pools, and (iv) determine whether microbial community composition and extracellular enzyme activities respond to rewetting over a 14 d period. To this end, we conducted a field experiment on a Gleysol with pronounced drought-induced shrinkage cracks. A one-hour simulated heavy rainfall event with D2O-labeled water was followed by recurrent moderate irrigation with non-labeled water. We monitored depth-resolved in situ redox potentials, collected soil cores to 50 cm depth from irrigated and dry control plots on day 0, day , and day 14, and analyzed soil water content, δ2H signatures of pore water, extractable ammonium and nitrate, total and active microbial community composition based on DNA and RNA, and extracellular enzyme activities.
2.1 Study site
The study site is located in the Ammer valley floodplain, approximately 7 km west of Tübingen, southwestern Germany (48.521266° N, 8.972687° E, 394 m a.s.l.). The Ammer catchment is situated in the South German Escarpment within geological units of the Middle and Upper Triassic. The western part of the catchment lies within the Muschelkalk unit, whereas the eastern part lies within Keuper units, which mainly consist of terrestrial sediments such as sandstones, mudstones, and dolostones (Geyer et al., 2011; Grathwohl et al., 2013; Martin et al., 2020; Schwientek et al., 2013). The floodplain containing the study site is located in the eastern part of the catchment and is bordered by Keuper hills to the south and north. The hydrostratigraphy of the floodplain comprises, from bottom to top, Keuper rocks as basement, an aquifer mainly composed of gravel and clay (gravel aquifer), a regional aquitard (lower clay aquitard), a confined aquifer composed of calcareous tufa sediments (tufa aquifer), and an upper regional aquitard (upper clay aquitard) (Martin et al., 2020). The investigated soil developed within the upper clay aquitard, which is, on average, 2 m thick and consists of fine-grained, clay-mineral-rich alluvial sediments derived from the surrounding Keuper hills. The lower part of this aquitard is water-saturated throughout the year. The soils are classified as Gleysols and show typical gleyic properties, including visually distinguishable reduced and oxidized horizons (Appendix A; Martin et al., 2020). The 50 cm soil cores collected in this study sampled only the Ah and Go horizons. Although the site is geomorphologically part of the Ammer floodplain, the Ammer currently flows in a regulated riverbed. Regular overbank flooding of the investigated area is therefore unlikely under present conditions. This information is relevant for interpreting microbial responses to drying–rewetting and flooding-related redox fluctuations.
The soil organic matter content, quantified as total organic carbon (TOC; methodological details in Appendix B), was 2 wt %–2.5 wt % in the upper 15 cm and approximately 1 wt % between 15 and 50 cm depth. Soil texture was relatively uniform within the upper 50 cm, with 11 ± 4 wt % sand, 56 ± 6 wt % silt, and 32 ± 4 wt % clay (Appendix C; determined according to DIN EN ISO 17892-4). Soil pH ranged from 7.0 to 7.3 and was determined on six samples from irrigated plots, with two samples each from 0–10, 20–30, and 40–50 cm depth, after stirring the soil in a 1:1 (v:w) mixture with deionized water for 30 min.
The experiment was conducted on arable land after the harvest of summer barley and after a prolonged summer dry period (see Sect. 2.2 for meteorological details). Information on previous land use was provided by the farmer. During winter 2018/2019, before the cultivation of summer barley, a catch crop consisting of radish and mustard was planted and incorporated into the soil with a cultivator in February 2019. The plot was fertilized with horse manure in winter 2018/2019 and with calcium ammonium nitrate fertilizer (27 % N) in spring 2019. During barley cultivation, the herbicide Ariane-C was applied, containing 100 g L−1 fluroxypyr (as methylheptyl ester, 144 g L−1), 80 g L−1 clopyralid, and 2.5 g L−1 florasulam.
2.2 Meteorological conditions
The climate at the experimental site is temperate oceanic, with a long-term mean annual precipitation of 718 mm and a mean annual temperature of 9.4 °C for the period 1981–2010 (German Meteorological Service (DWD), 2024). Meteorological data were retrieved from a weather station in Tübingen-Unterjesingen (48.52950° N, 8.98380° E, 439 m a.s.l.), located close to the study site (Agrarmeteorologie Baden-Württemberg, 2021; Appendix D). The experiment was conducted from 16 to 30 July 2019. During the two weeks preceding the start of the experiment, daily temperatures exceeded 20 °C on all but 2 d, and three moderate rainfall events occurred, with 9.1, 5.1, and 33.1 mm precipitation, respectively, according to the classification of the American Meteorological Society (2026).
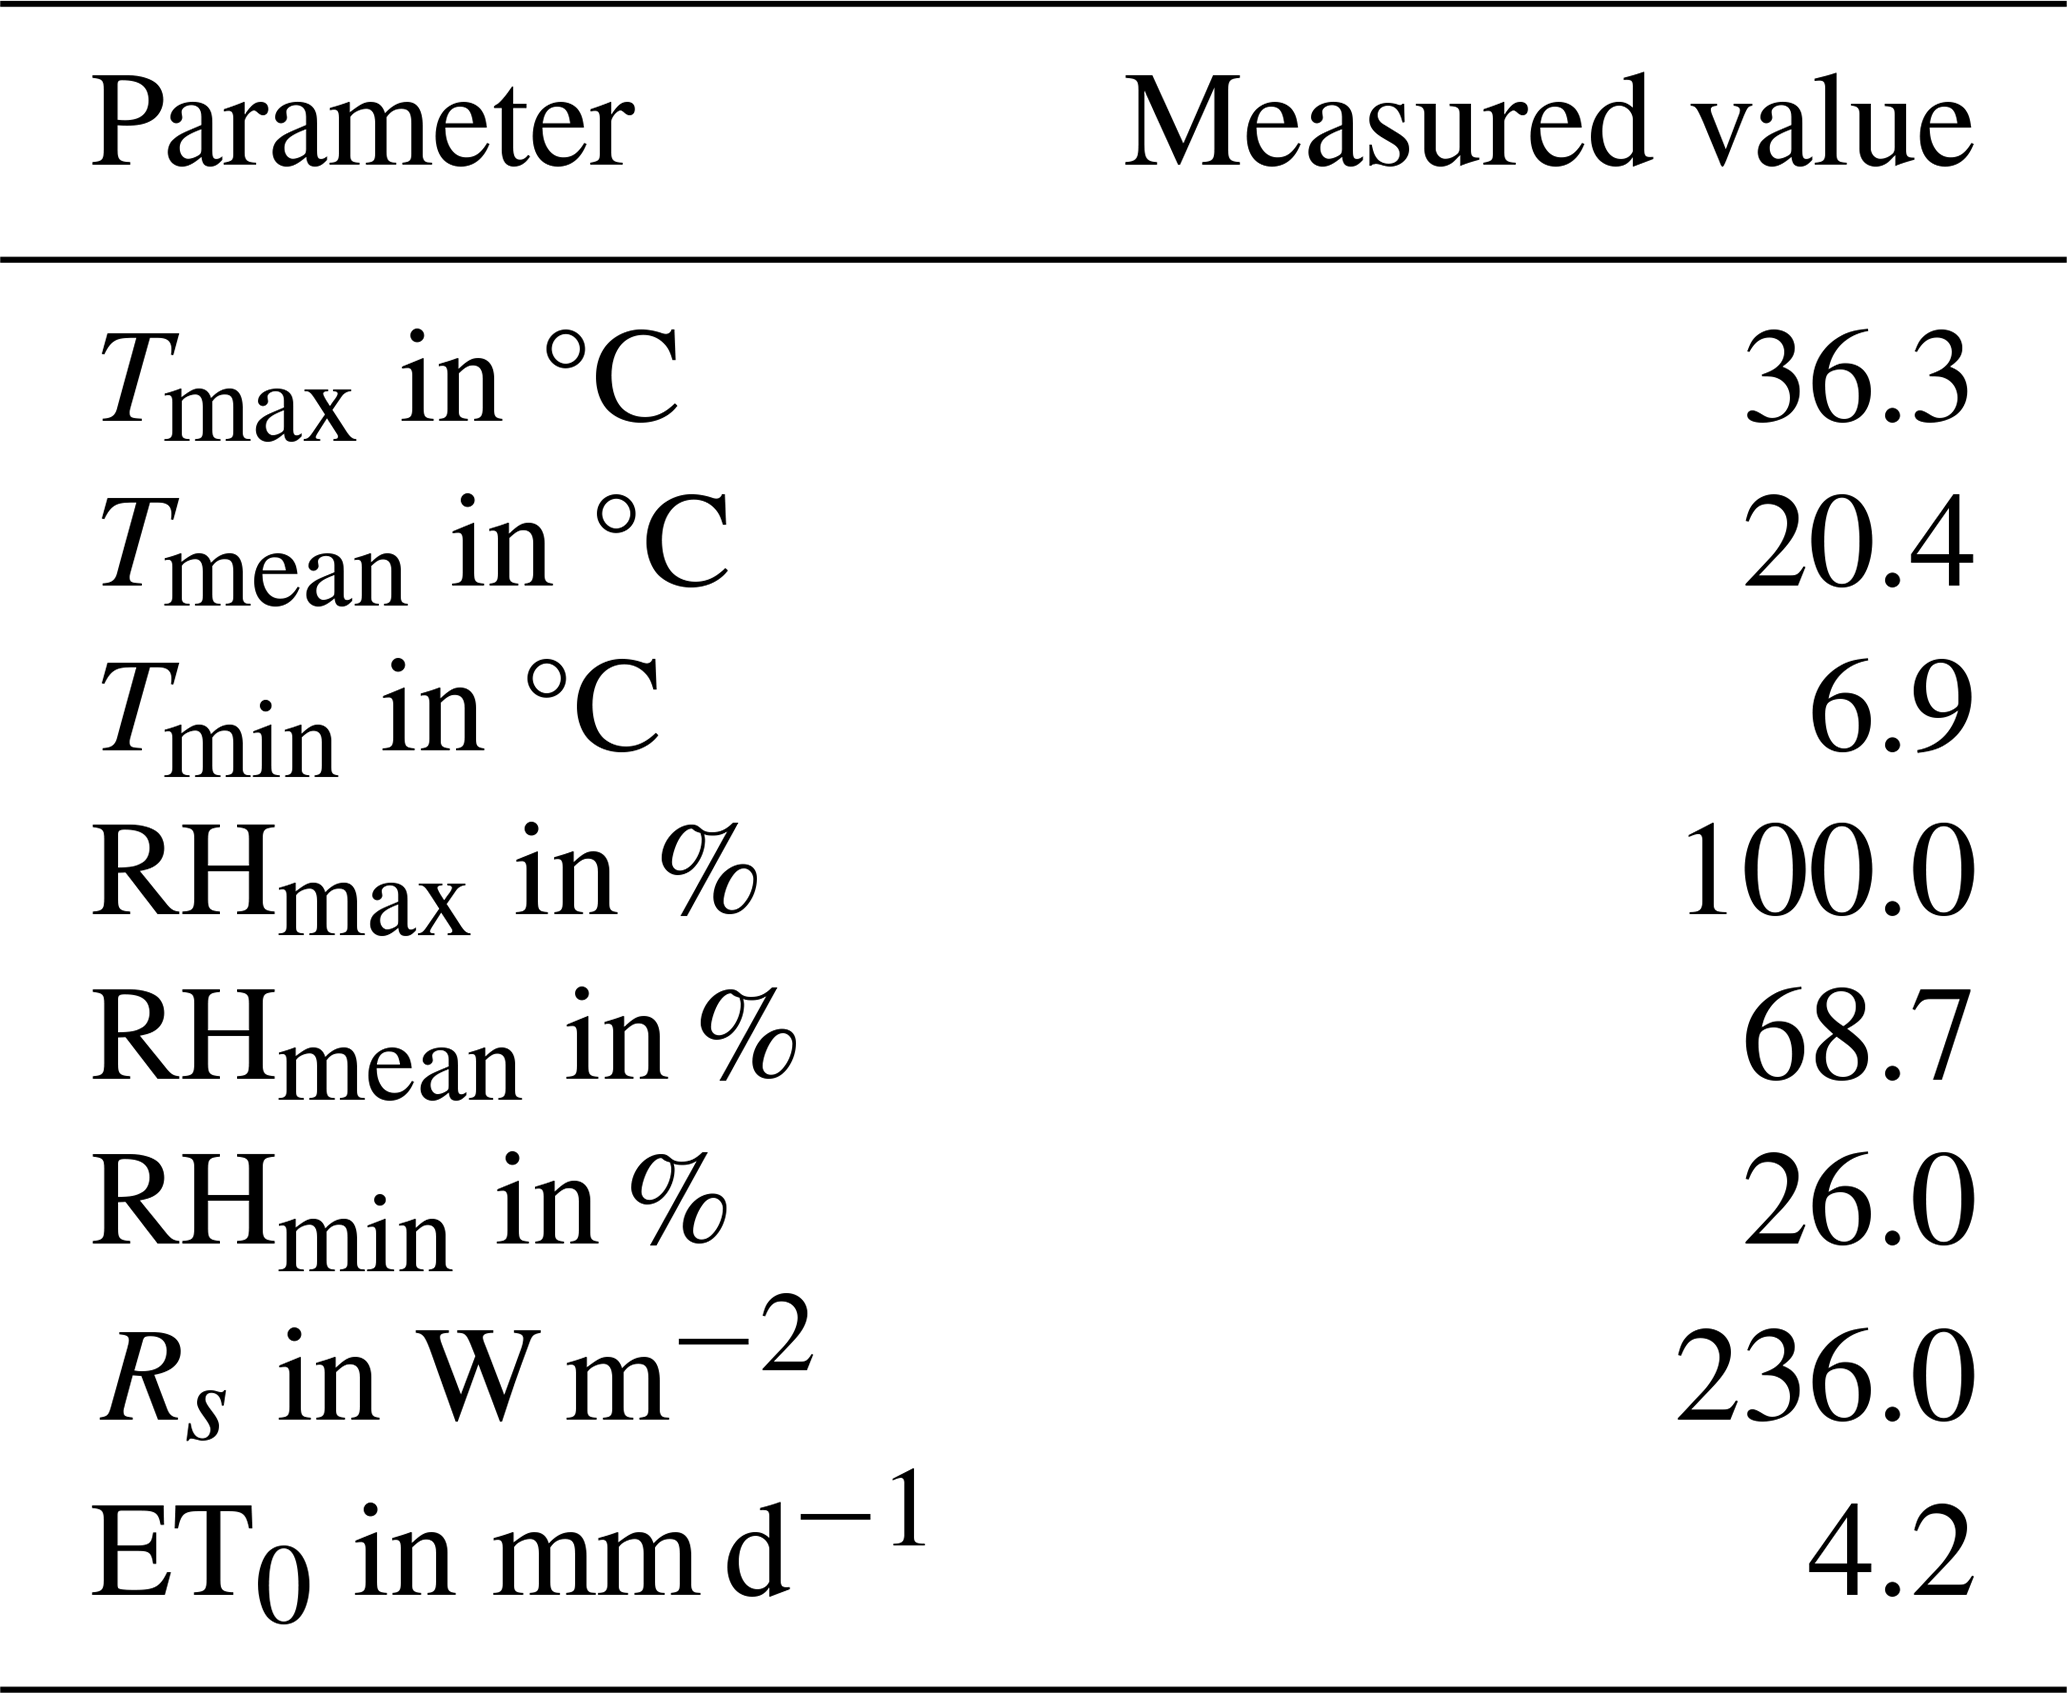
During the experiment, the minimum night-time temperature was 10.2 °C, with an average night-time temperature of 17.7 °C. The maximum daytime temperature was 36.3 °C, with an average daytime temperature of 24.5 °C. Temperatures exceeded 25 °C on 12 d and 30 °C on 6 d. Following the FAO guideline (Allen et al., 1998), the reference evapotranspiration (ET0) for July 2019 was calculated as 4.2 mm d−1 (Appendix E). Because the experimental plots had been harvested before the experiment, ET0 is used here as a meteorological reference for atmospheric evaporative demand rather than as a direct estimate of plot-scale evapotranspiration.
Between 16 and 30 July 2019, two natural rainfall events occurred: one on 21 July from 02:00 to 05:00 local time (2.5 mm), and one heavy rainfall event from 26 July at 20:00 LT to 27 July at 05:00 LT (24.7 mm; Appendix D). During both events, the dry control plots were covered with plastic foil. However, during the natural heavy rainfall event from 26 to 27 July, the plastic foil covering plot D2, where the redox probes were installed, was removed by wind.
2.3 Experimental setup
2.3.1 Plot design
The experimental design comprised nine plots arranged as a Latin square with three treatments (Fig. 1). Each plot had a lateral length of 2.4 m and was separated from adjacent plots by 50 cm access strips. Within each plot, a 2 m × 2 m inner sampling area was defined to minimize boundary effects. Three treatments were established, but only two are relevant for the present study: (i) irrigated plots (W), where a heavy rainfall event (HRE) after drought was simulated, and (ii) dry control plots (D), which remained dry. The third treatment included glyphosate application before irrigation; results from these plots are presented elsewhere (Schlögl et al., 2022; Wirsching et al., 2022).
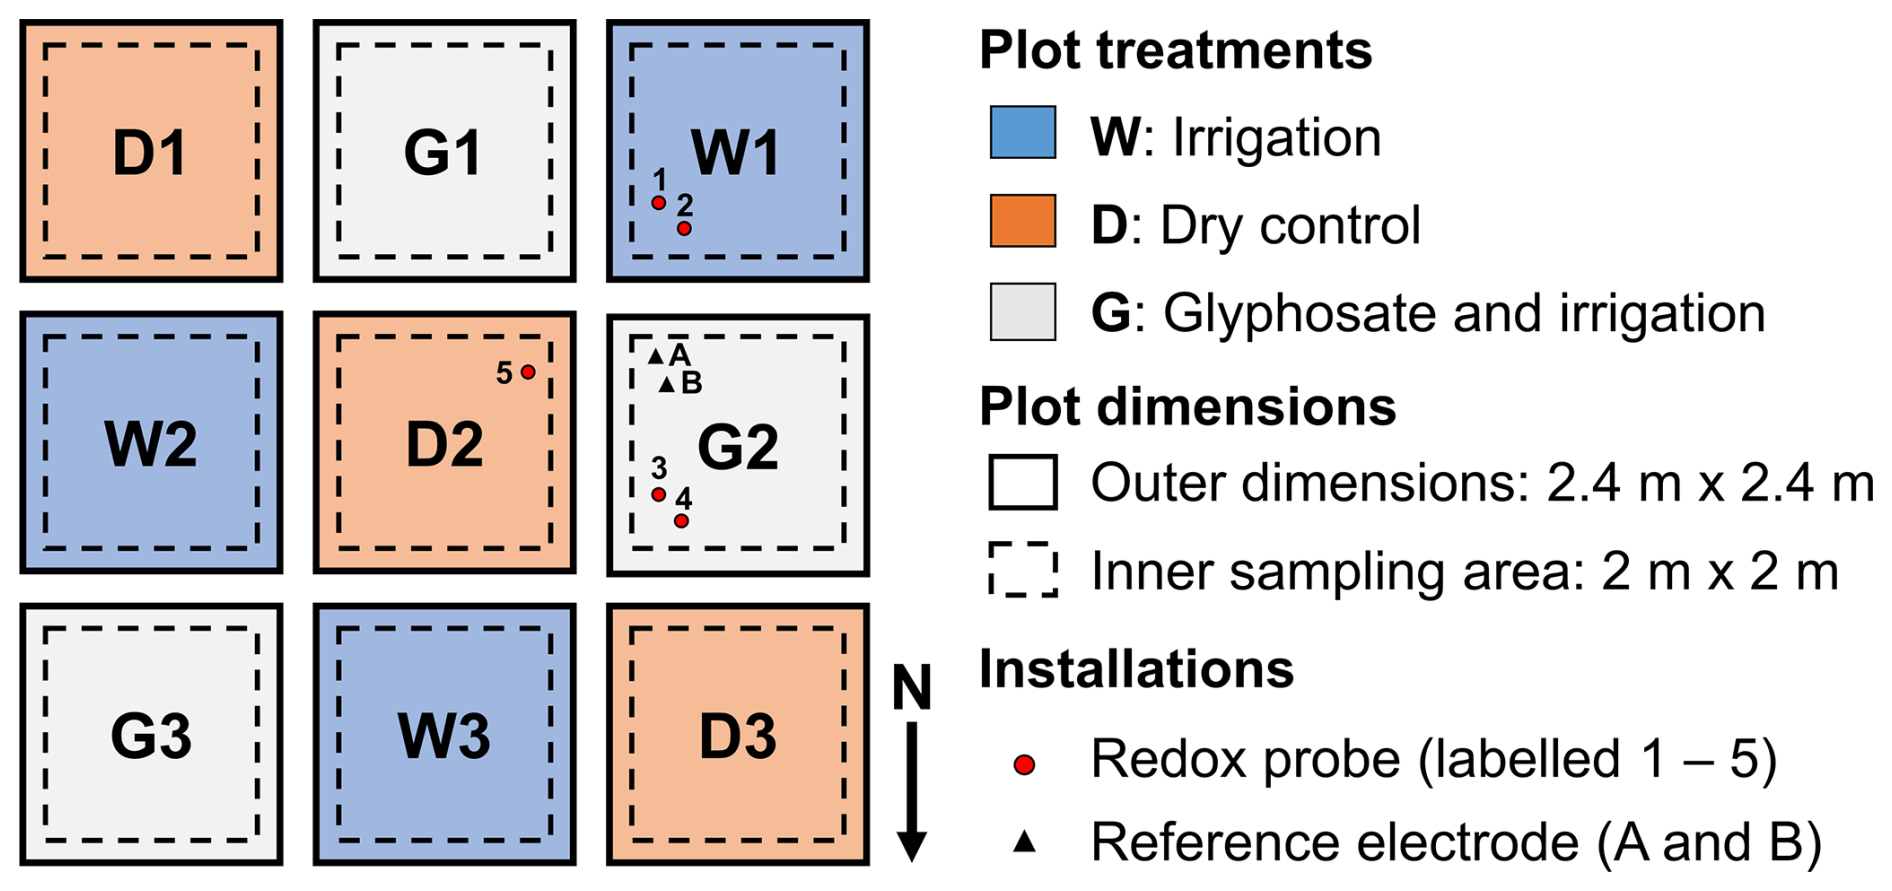
Figure 1Plot design and treatments in the field experiment. Nine plots of 2.4 m × 2.4 m lateral length were arranged as a Latin square, and three treatments were established in triplicate. A heavy rainfall event was simulated on day 0, followed by light daily irrigation for 14 d on irrigated plots (W plots, blue). Dry control plots (D plots, orange) remained dry. Glyphosate-treated plots (G plots, grey) received glyphosate before the same irrigation treatment as the W plots. The inner sampling area (dashed line) was defined to minimize boundary effects. For in situ monitoring of redox potentials, redox sensors (red circles) were installed on plots W1, D2, and G2, and two reference electrodes (black triangles A and B, with B serving as a system control) were installed on plot G2 approximately equidistant from all redox sensors. Figure adapted from Schlögl et al. (2022).
2.3.2 Plot treatment
Irrigation was conducted from 16 to 31 July 2019, with the day of the simulated heavy rainfall event (16 July) defined as day 0 (T0; Fig. 2). All plots were covered for one week before the experiment to establish dry initial conditions. The heavy rainfall event, defined as 7.6 to 50 mm h−1 according to the American Meteorological Society (2026), was simulated by applying 24.3 mm deionized water over approximately one hour using watering cans. The irrigation water was labeled with deuterated water (D2O) as a conservative hydrological tracer. Two litres of D2O (99.9 at. %, Carl Roth, Germany) were mixed with 1000 L irrigation water, resulting in an input δ2H signature of 12 730 ‰ relative to Vienna Standard Mean Ocean Water (VSMOW).
On days 1 to 10 and on day 14, light irrigation with non-labeled water was applied at a rate of 5.2 mm d−1. This moderate recurrent irrigation was intended to keep the soil moist, promote the closure of shrinkage cracks, and allow monitoring of the subsequent development of in situ redox potentials, inorganic nitrogen pools, and microbial responses. Daily irrigation was paused from T11 to T13 because of a natural heavy rainfall event on the evening of T10 and continued natural rainfall on T11 and T12. The dry control plots were covered with greenhouse foil between T10 and T14 to prevent wetting by natural rainfall. During the natural heavy rainfall event from 26 to 27 July, the plastic foil covering plot D2, where the redox probes were installed, was removed by wind.
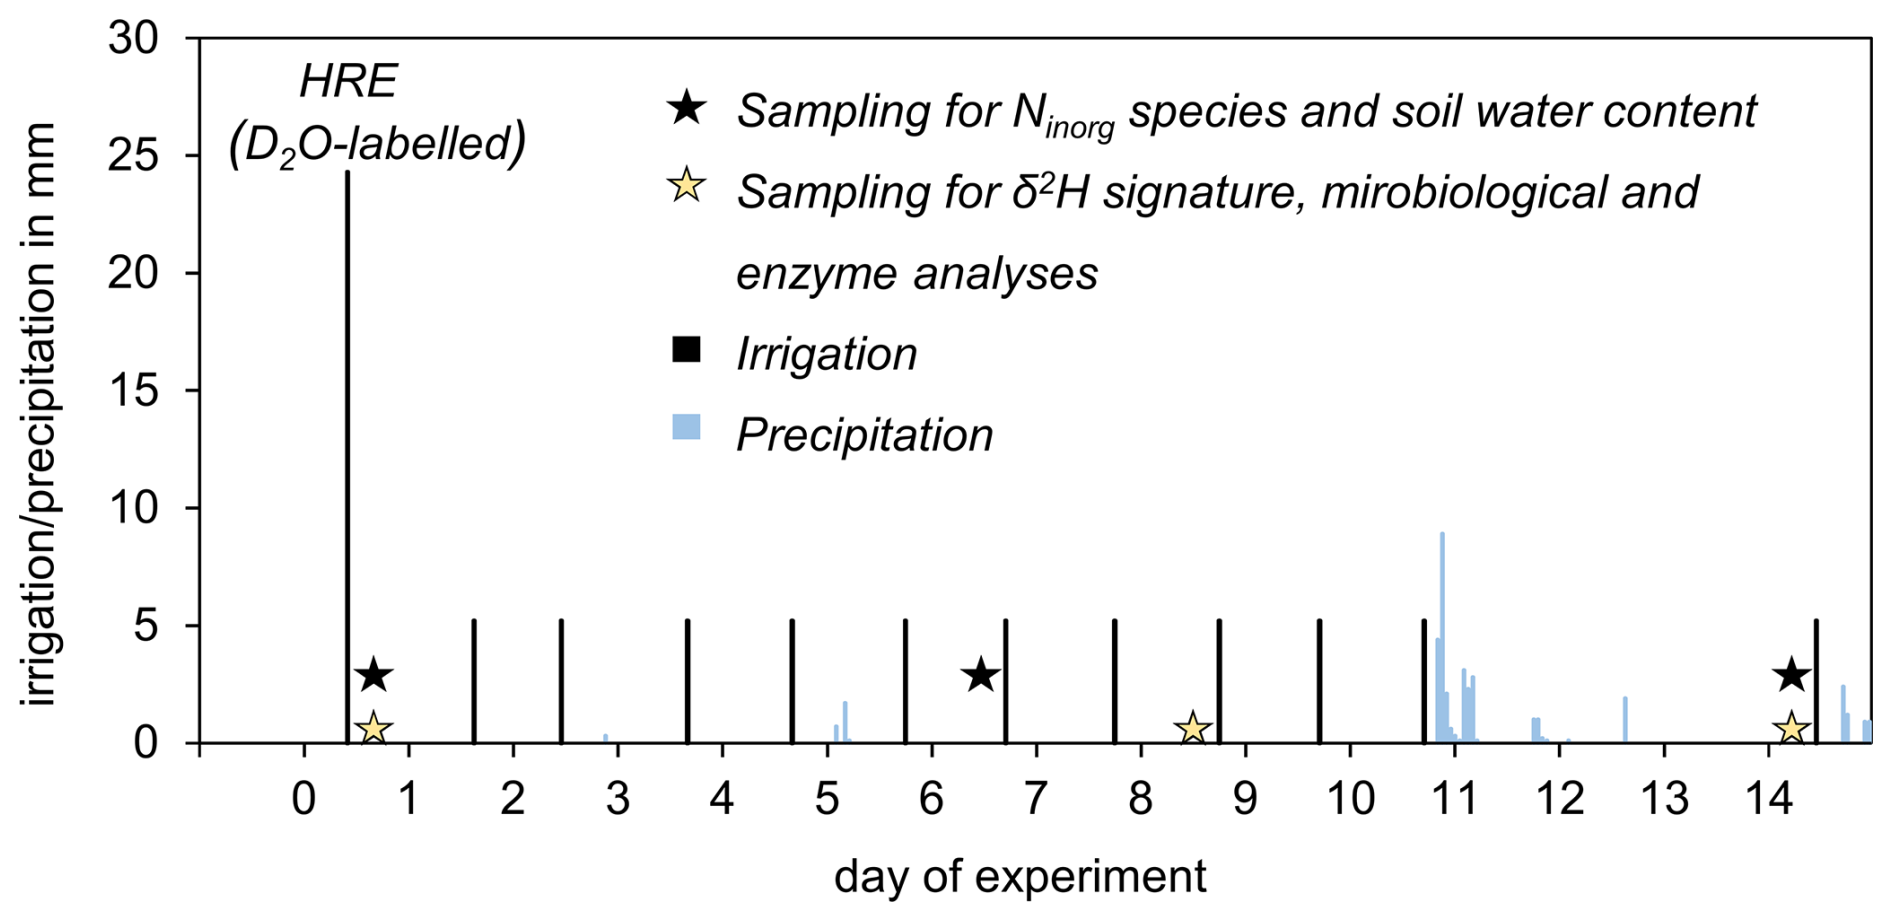
Figure 2Irrigation and sampling scheme. Irrigation (black bars; bar length indicates intensity) included a simulated heavy rainfall event (HRE) with D2O-labeled water on day 0, followed by light daily irrigation with non-labeled water on W plots. Natural precipitation is indicated by light-blue bars and was excluded from D plots but not from W plots. Sampling for inorganic nitrogen species (Ninorg) and soil water content took place on days 0, 6, and 14 (black stars). Samples for analyses of δ2H signatures, microbial communities, and enzyme activities were collected on days 0, 8, and 14 (golden stars). Figure adapted from Schlögl et al. (2022).
2.3.3 Sampling
Soil sampling was performed with a stainless-steel soil corer (Humax, Hasli-Rüegsau, Switzerland). Soil cores were collected in PVC liners of 50 cm length and 3.5 cm diameter and were immediately placed on dry ice. In the laboratory, cores were stored at −80 °C for microbiological analyses, enzyme analyses, and δ2H analyses, and at −21 °C for inorganic nitrogen analyses. Sampling holes in the field were filled with bentonite. Two sampling schemes were used: one for inorganic nitrogen species and soil water content, and one for soil pore-water δ2H, microbial community structure, and extracellular enzyme activities (Fig. 2). For soil-water δ2H analysis, cores were collected from W plots along shrinkage cracks. Additional cores from D plots were collected to determine the natural δ2H background. Samples for inorganic nitrogen species, soil water content, and microbiological analyses were also collected from W and D plots along shrinkage cracks. The initial shrinkage cracks were marked before the first irrigation so that their locations remained identifiable during later sampling.
Exact sampling positions within each plot were not recorded. However, all samples were taken from within the inner sampling area and at least 20 cm away from plot borders to minimize boundary effects. Later samples were collected at least 10 cm away from previous sampling holes. Because the holes were filled with bentonite immediately after coring, direct resampling of disturbed locations was avoided. Sample codes are defined as follows: treatment (dry control, D; irrigated, W), followed by the plot replicate number (1, 2, or 3) and the sampling time point T plus the experimental day. For example, W1T8 refers to irrigated plot W1 sampled on day 8, whereas WT8 refers collectively to all three irrigated plots sampled on day 8.
2.3.4 In situ monitoring of redox potentials
In situ soil redox potentials were monitored to assess temporal and depth-resolved changes in soil redox conditions after irrigation. Measurements were performed on one irrigated plot (W1) with two independent redox sensors (sensors 1 and 2) and on one dry control plot (D2) with one redox sensor (sensor 5; Fig. 1). Thus, redox measurements provide high-resolution temporal information but were spatially limited to one irrigated and one dry control plot. The multilevel redox sensors (PaleoTerra, Oijen, the Netherlands) consisted of fibreglass and epoxy tubes with a total length of 1.20 m. Each sensor contained 10 platinum electrodes. For installation, vertical holes were drilled into the soil with a diameter 2 mm smaller than that of the sensors to ensure contact between the electrodes and the surrounding soil after installation. Sensors were installed such that the uppermost electrode was positioned 5 cm below ground level (bgl), with additional electrodes placed at 10 cm intervals below the surface. Two Ag/AgCl reference electrodes (A and B; saturated KCl; E0=0.199 V) were installed on plot G2, approximately equidistant from the redox sensors (Fig. 1). One reference electrode was used for the measurements, and the second served as a system control. The redox sensors and reference electrodes were installed on 15 July 2019, one day before the start of the irrigation experiment. Measured redox potentials (Emeas) are reported relative to the standard hydrogen electrode (SHE; E0=0 V by definition) as . Measurement precision was ±10 mV. Sensors and reference electrodes were connected to a data logger (Campbell Scientific, Logan, Utah, USA), which recorded redox potentials at 30 min intervals throughout the experiment. In situ soil redox conditions were classified according to Mansfeldt (2003) for EH values at circumneutral pH as follows: oxidizing (> +400 mV vs. SHE), weakly reducing (+400 to +200 mV), moderately reducing (+200 to −100 mV), and strongly reducing (< −100 mV).
2.3.5 Soil water content
Gravimetric soil water content was determined for 50 cm soil cores from irrigated (W) and dry control (D) plots. Cores were divided into 5 cm increments for 0–10 cm depth and into 10 cm increments for 10–50 cm depth. From each increment, three aliquots of approximately 1.5 g field-moist soil were weighed before and after freeze-drying. Small pebbles were removed before weighing. Gravimetric water content (g g−1) was calculated as water loss relative to dry soil mass. Soil water content of D plots on day 0 was used as the reference condition and is hereafter referred to as the initial soil water content.
2.4 Chemical and isotopic analyses
2.4.1 δ2H signature of soil water
The δ2H signature of soil pore water was determined by H2O(liquid)–H2O(vapor) equilibration followed by cavity ring-down laser spectroscopy (Picarro L2120-i and L2130-i; Wassenaar et al., 2008). Frozen core samples from WT0, WT8, WT14, and DT0 were sliced into 10 cm segments. Aliquots of 66–170 g from each segment were double-bagged in 1 L Ziploc freezer bags and stored at 4 °C. Before analysis, the bags were filled with laboratory dry air and stored for an additional three days to allow equilibration between pore water and headspace water vapour. Each analysis lasted up to 30 min, until the signal reached a stable plateau within the expected measurement accuracy, defined as a standard deviation < 1.0 ‰ for δ2H of water vapor. The average signal over the final minute of analysis was recorded. After every third sample, an internal standard consisting of water with known isotopic composition in a freezer bag was measured for calibration. Isotopic signatures are reported relative to Vienna Standard Mean Ocean Water (VSMOW) in delta notation as , where R is the 2H 1H isotope ratio of the sample or standard, respectively. For determination of the natural δ2H background in DT0 cores, the uppermost segment was excluded to avoid potential contamination by wind drift or water vapor from irrigation. Gravimetric water content of each analyzed segment was additionally determined from the weight difference before and after drying at 105 °C. These values were used for isotope mass-balance calculations.
2.4.2 Water mass balance
A water mass balance was calculated to estimate how much of the total water input from irrigation and natural precipitation was stored within the sampled 0–50 cm soil profile on days 0, 6, and 14. Total water inputs to W plots were 24.3 mm by day 0, 60.0 mm by day 6, and 115.0 mm by day 14. The measured gravimetric soil water contents from WT0, WT6, WT14, and DT0 (Appendix F) were converted to volumetric water contents using known bulk densities of the corresponding depth segments. The change in water storage within each depth segment was calculated relative to the initial soil water content of the dry control plots on day 0 and expressed as water volume per square metre. The resulting water mass balance represents apparent water recovery within the sampled 0–50 cm soil profile. It does not constitute a closed hydrological balance, because water loss by evaporation and drainage below 50 cm depth could not be quantified directly from soil water content measurements alone. Potential losses below the sampled depth were therefore evaluated indirectly using the δ2H isotope mass balance of the labeled heavy-rainfall water.
2.4.3 Isotope mass balance
The irrigation water applied during the simulated heavy rainfall event on day 0 (IrrHRE) was labeled with D2O. A two-component mixing model was used to calculate the fraction of IrrHRE in each depth segment ():
where δ2H is the measured isotope ratio in the ith depth segment, δ2HIWis the isotope ratio of the simulated heavy-rainfall irrigation water on day 0 (12 730 ‰), and δ2H0 is the average natural background δ2H of pore water before irrigation (−47.6 ‰). To calculate the amount of Irr_HRE in each depth segment, the volumetric water content calculated as described in Sect. 2.4.2 was multiplied by the fraction of irrigation water .
2.4.4 Extraction and analysis of inorganic nitrogen
Extractable inorganic nitrogen was analyzed to assess changes in nitrate and ammonium pools after the simulated heavy rainfall event and during subsequent irrigation. Inorganic nitrogen was extracted from approximately 1.2 g frozen soil aliquots with 12 mL 2 M KCl (p.a., Honeywell, Germany) prepared in ultrapure water (GenPure Pro UV-TOC, Thermo Fisher Scientific, Germany). Samples were shaken for 30 min on a horizontal shaker (IKA, Germany) at 160 motions min−1 and then centrifuged at room temperature for 15 min at 5000 × g (centrifuge 5430 R, Eppendorf, Germany). Extracts were filtered through 0.2 µm regenerated cellulose filters (Sartorius, Germany), stored at 4 °C, and analyzed within a maximum of 2 d.
Ammonium and nitrate concentrations were determined by continuous flow analysis (CFA) using an AA3 HR AutoAnalyzer System (Seal Analytical, Germany). All chemicals were obtained from Sigma-Aldrich, Germany, and were of ACS grade. Standard curves ranged from 0 to 7.5 mg N L−1 for both analytes and showed high linearity (R2=0.999–1.000). Nitrate was determined according to ISO 13395 (1996), where nitrate is reduced to nitrite by hydrazine and then reacts with sulfanilamide and NEDD to form a pink complex measured at 550 nm. Nitrite present in the original sample was determined independently without hydrazine addition and subtracted from nitrate concentrations. Ammonium was determined according to ISO 11732 (2005), where ammonium reacts with salicylate and dichloroisocyanuric acid to form a blue complex measured at 660 nm. To account for potential matrix effects caused by 2 M KCl, standards for both nitrogen species were also prepared in 2 M KCl.
2.4.5 Nitrate and ammonium mass balance
Measured nitrate and ammonium concentrations (mg N L−1) were corrected for baseline and blank values, and the masses of nitrate and ammonium in the extraction solution were calculated. The original mass of the frozen soil sample was corrected to dry mass using gravimetric water content. The mass of ammonium-N and nitrate-N per gram dry soil was then calculated. Using bulk density and the volume of each soil core segment, ammonium-N and nitrate-N masses were calculated for each depth interval and for the entire 0–50 cm soil core.
2.5 Microbiological Analyses
2.5.1 Molecular Analysis
For molecular analysis of bacteria and archaea, soil cores were placed on dry ice immediately after sampling and stored at −80 °C in the laboratory until analysis. Frozen cores were cut into depth segments of 0–10, 20–30, and 40–50 cm using an electric saw sterilized with 2 % sodium hypochlorite solution. Representative subsamples of 10–15 g soil were thawed at room temperature and homogenized with a sterile spatula. Duplicate aliquots of 400 mg from each subsample were used for DNA extraction. DNA was extracted using the DNeasy PowerSoil Kit (Qiagen, Hilden, Germany) according to the manufacturer's protocol. RNA was extracted using a modified commercial DNA extraction protocol according to Tournier et al. (2015), combining the FastDNA SPIN™ Kit for Soil (MP Biomedicals) with the RNaid® Kit (MP Biomedicals, LLC, Illkirch, France). Instead of the standard sample mass of 0.25 g, 0.5 g soil was used to increase RNA yield. RNA was purified using the RNeasy Micro Kit (Qiagen). Residual DNA was removed with DNase I, and RNA was reverse-transcribed to cDNA using the RevertAid RT Reverse Transcription Kit (Thermo Scientific) with random hexamer primers. A primer combination of 515F (5′-GTGYCAGCMGCCGCGGTAA-3′) and 806R (5′-GGACTACNVGGGTWTCTAAT-3′), targeting the V4 region of the 16S rRNA gene, was used for amplification following the PCR protocol described by Pjevac et al. (2017). Sequencing was performed on an Illumina MiSeq platform (Illumina, San Diego, CA, USA) using v3 chemistry with 600 cycles (2 × 300 bp paired-end reads) in two separate runs.
Raw reads were processed in R version 4.1.1 using DADA2 version 1.20.0, as outlined by Callahan et al. (2017). Amplicon sequence variants (ASVs) were inferred across all samples in pooled mode. Details on sequence trimming and quality filtering are provided in Pjevac et al. (2017). ASV sequences were aligned and classified using SINA version 1.7.2 and the SILVA SSU Ref NR 99 database release 138.1 with default parameters. ASVs classified as eukaryotes, mitochondria, or chloroplasts, as well as ASVs not classified at domain level, were removed before downstream analysis. ASVs classified as archaea were also removed from the dataset before downstream analysis; the resulting dataset therefore represents bacterial 16S rRNA gene and transcript diversity. Statistical analyses were performed in R, and plots were created using ggplot2. Alpha and beta diversity indices were calculated and compared using vegan. Non-metric multidimensional scaling (NMDS) based on Aitchison distances was used for ordination.
2.5.2 Extracellular Enzyme Activities
Potential activities of three hydrolytic soil enzymes, β-glucosidase (BG), N-acetylglucosaminidase (NAG; exochitinase), and acid phosphatase (AP), were measured fluorometrically using artificial substrates (Tian et al., 2023). The following 4-methylumbelliferyl (MUF)-based substrates were used: MUF-β-D-glucopyranoside for BG, MUF-N-acetyl-β-D-glucosaminide for NAG, and MUF-phosphate for AP. Soil slurries were prepared in 50 mM sodium acetate buffer (pH 5) at a soil-to-buffer ratio of 1:100 (w:v) and dispersed by ultrasonication with an energy input of approximately 350 J. Substrates were added to soil slurries in black microplates in five analytical replicates and incubated in the dark for 180 min, with repeated measurements of sample fluorescence. Microplates were read using a TECAN Infinite® M200 spectrophotometer at an excitation wavelength of 365 nm and an emission wavelength of 450 nm. Sample fluorescence was corrected for quenching, and MUF concentrations released by enzymatic activity were calibrated using standards added to soil slurries.
3.1 Soil water distribution and in situ redox potentials
The simulated heavy rainfall event rapidly increased soil water storage throughout the sampled 0–50 cm profile, whereas the recurrent moderate irrigation applied thereafter was retained mainly in the upper soil layers (Fig. 3a). On day 0 (T0), 95.6 % of the applied irrigation water was recovered within the 0–50 cm profile. Apparent recovery of the cumulative water input decreased to 50.3 % at T6 and 32.1 % at T14.
Two hours after the simulated heavy rainfall event, 54.2 % of the recovered water was located in the upper 10 cm, while 19.9 % occurred at 10–30 cm depth and 25.9 % had already reached 30–50 cm depth (Fig. 3a). At T6 and T14, more than half of the recovered water was again located in the upper 10 cm. In contrast, only small fractions of the recovered water were found at 30–50 cm depth at T6 and T14 (4.7 % and 14.4 %, respectively). Thus, the initial heavy rainfall event caused rapid deep infiltration, whereas subsequent moderate irrigation contributed mainly to water storage in the topsoil.
The isotope mass balance confirmed rapid redistribution of the D2O-labeled heavy-rainfall water throughout the sampled soil profile (Fig. 3b). Recovery of the labeled heavy-rainfall water was 108 % at T0, 82 % at T8, and 63 % at T14. Recovery of more than 100 % result from slightly uneven irrigation intensity or confluence of the irrigation water at the shrinkage crack sites where the samples were taken. At T0, 30 % of the recovered labeled water was found in the upper 10 cm, while the remaining labeled water was distributed relatively evenly across the deeper 10 cm depth intervals, each containing 15 %–22 % of the recovered label. At T8 and T14, only 13 % and 4 %, respectively, of the recovered labeled water remained in the upper 10 cm. The relative decrease in labeled water recovery over time was therefore strongest in the topsoil.
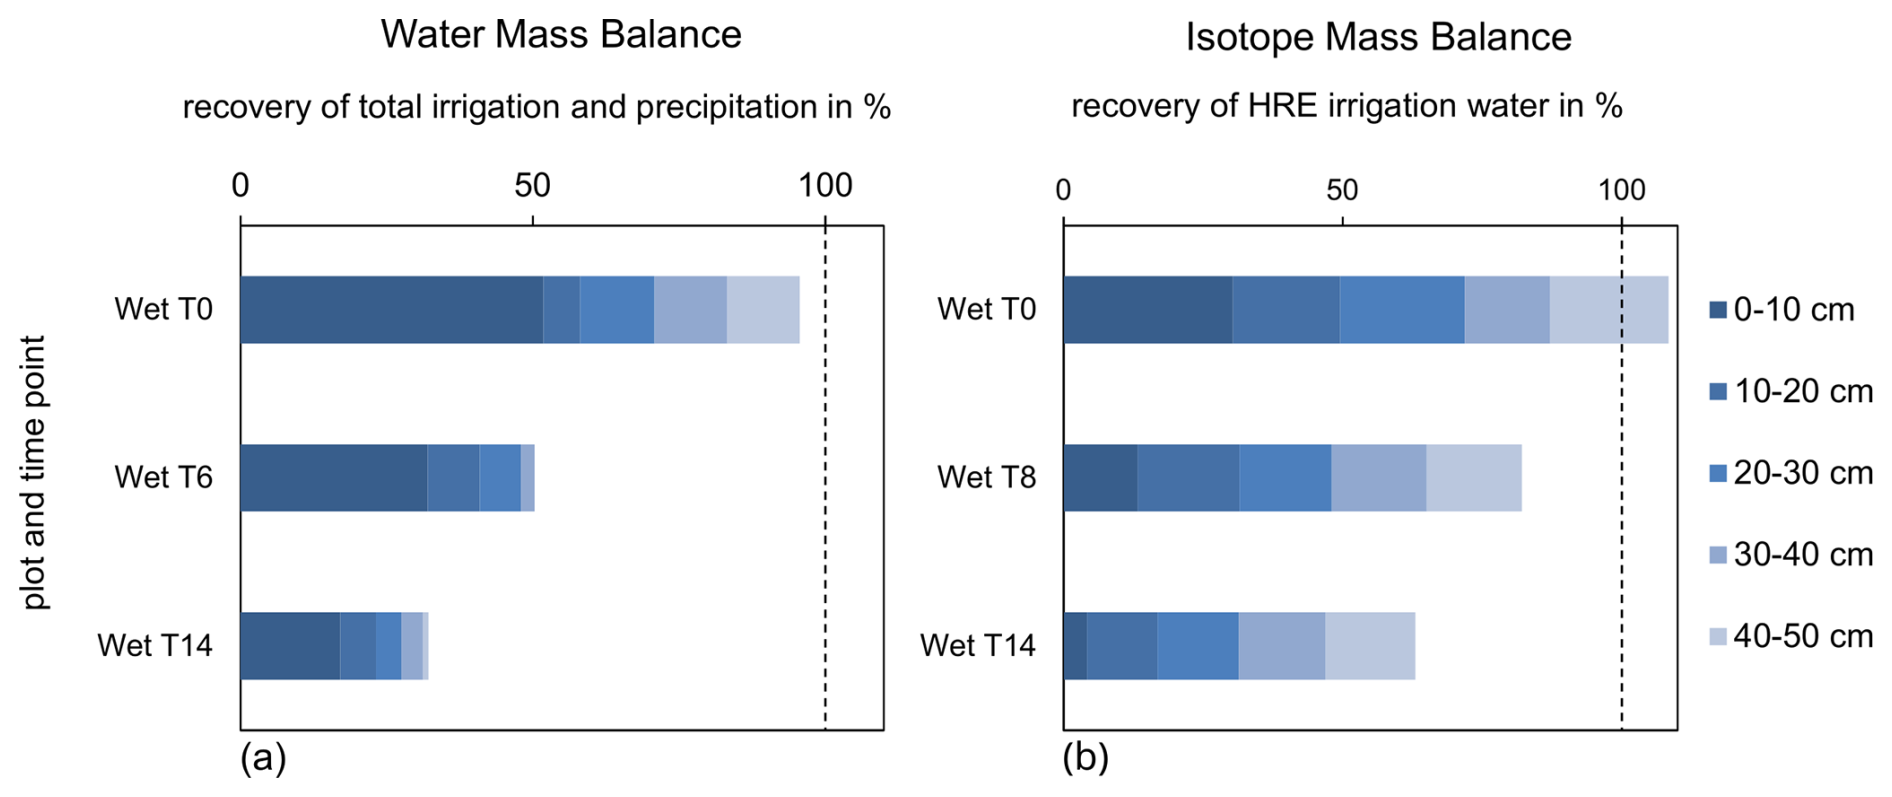
Figure 3(a) Water mass balance for days 0, 6, and 14 (T0, T6, and T14) in five 10 cm soil depth intervals. Recovery is shown relative to the total water input from irrigation and natural rainfall received by the plots by each time point (Irrtot; 100 % line). (b) Isotope mass balance for days 0, 8, and 14 (T0, T8, and T14) in five 10 cm soil depth intervals. Recovery is shown relative to the amount of D2O-labeled irrigation water applied during the simulated heavy rainfall event on T0 (IrrHRE). The colour gradient from dark to light blue indicates increasing soil depth from 0–10 to 40–50 cm.
In situ redox potentials responded strongly to irrigation and showed pronounced variation with depth and time (Fig. 4). At the start of the experiment, redox conditions were oxidizing throughout the monitored soil profile (> +400 mV vs. SHE). In the irrigated plot, redox potentials declined at all monitored depths after the simulated heavy rainfall event. In the upper soil layers (5–20 cm below ground), redox potentials mostly shifted to reducing conditions within 24 h. In the subsoil (30–50 cm below ground), the decline was slower and more variable; the time required to reach +200 mV ranged from one day at 30 cm depth in sensor 2 to 6 d at 30 cm depth in sensor 1.
After this initial decline, redox potentials at 10, 20, and 30 cm depth showed strong temporal variation and also differed between the two sensors installed in the irrigated plot. Values fluctuated between oxidizing and moderately reducing conditions. At 40–60 cm depth, the decrease in redox potential after irrigation was more gradual and persistent. The strongest short-term fluctuations occurred at 10 cm depth in sensor 1, where redox potentials varied between weakly oxidizing and moderately reducing conditions during the phase of recurrent irrigation. When daily irrigation was interrupted between T10 and T14, redox potentials increased again, reaching weakly reducing to oxidizing conditions even at 30–50 cm depth.
In the dry control plot, redox potentials remained oxidizing throughout most of the experiment (Fig. 4). The only exception occurred between T10 and T14 at 10 and 20 cm depth, when the plastic foil covering plot D2 was removed by wind during a natural heavy rainfall event.
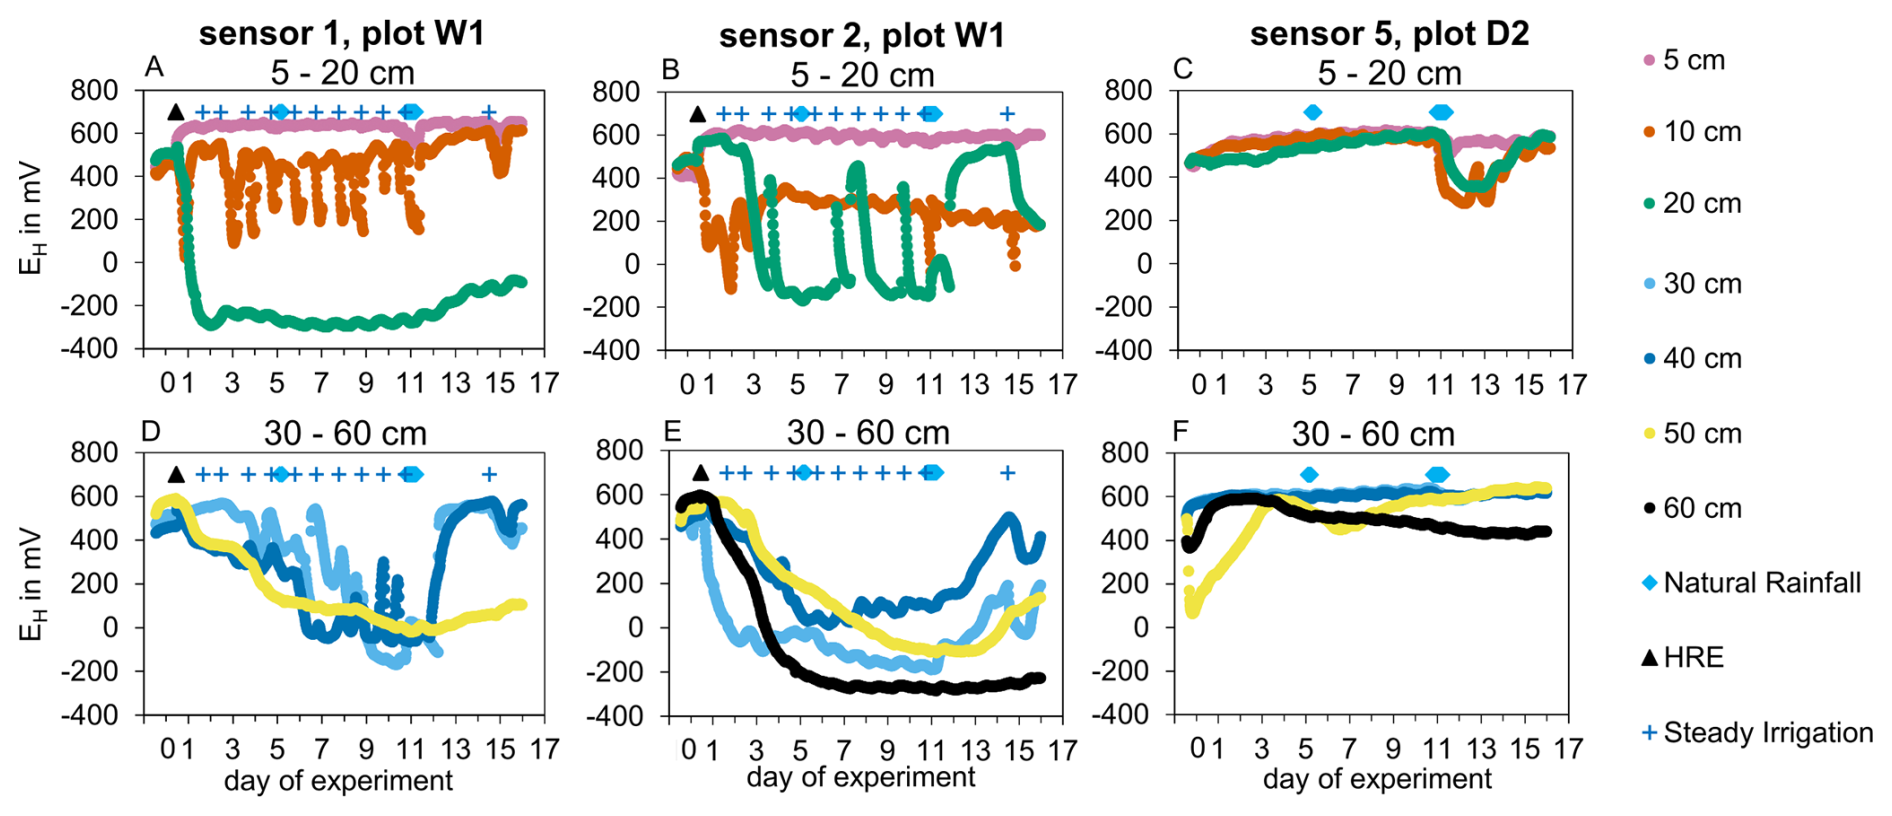
Figure 4In situ redox potentials, reported as EH in mV vs. SHE, measured on irrigated plot W1 with two sensors and on dry control plot D2 with one sensor. Redox potentials are shown at 5, 10, and 20 cm depth (a–c) and at 30, 40, 50, and 60 cm depth (d–f). Measurements started on experiment day T−1 and are shown until T16. For plot W1, the simulated heavy rainfall event (HRE; black triangle) and the subsequent light irrigation events (blue crosses) are indicated, and for all plots, the natural heavy rainfall events (blue diamonds) are indicated.
3.2 Inorganic nitrogen masses
The simulated heavy rainfall event affected ammonium and nitrate masses differently (Fig. 5). Ammonium mass increased only in the uppermost soil layer after rewetting, whereas nitrate mass decreased across the upper part of the profile shortly after irrigation.
Two hours after the simulated heavy rainfall event, ammonium mass in the 0–5 cm layer nearly doubled, increasing from 0.08 ± 0.03 mg N in dry control plots at T0 to 0.15 ± 0.02 mg N in irrigated plots at T0 (p<0.05; Fig. 5a). In the same layer, ammonium mass further increased to 0.20 ± 0.01 mg N at T6 (p=0.058 compared with WT0) and 0.3 ± 0.2 mg N at T14 (p>0.05 compared with WT0). Below 5 cm depth, ammonium masses changed only slightly during the experiment. Consequently, total ammonium mass in the 0–50 cm profile remained similar in irrigated plots across T0, T6, and T14, ranging between 0.8 and 0.9 mg N.
In dry control plots, total ammonium mass increased from 0.8 ± 0.1 mg N at T0 to 1.2 ± 0.3 mg N at T14, although this increase was not statistically significant (p>0.05). The strongest relative increase occurred in the 0–5 cm layer, where ammonium mass increased approximately three-fold (p<0.05). At greater depth, ammonium mass increased by factors of 1.1 to 2.2, but these changes were not significant.
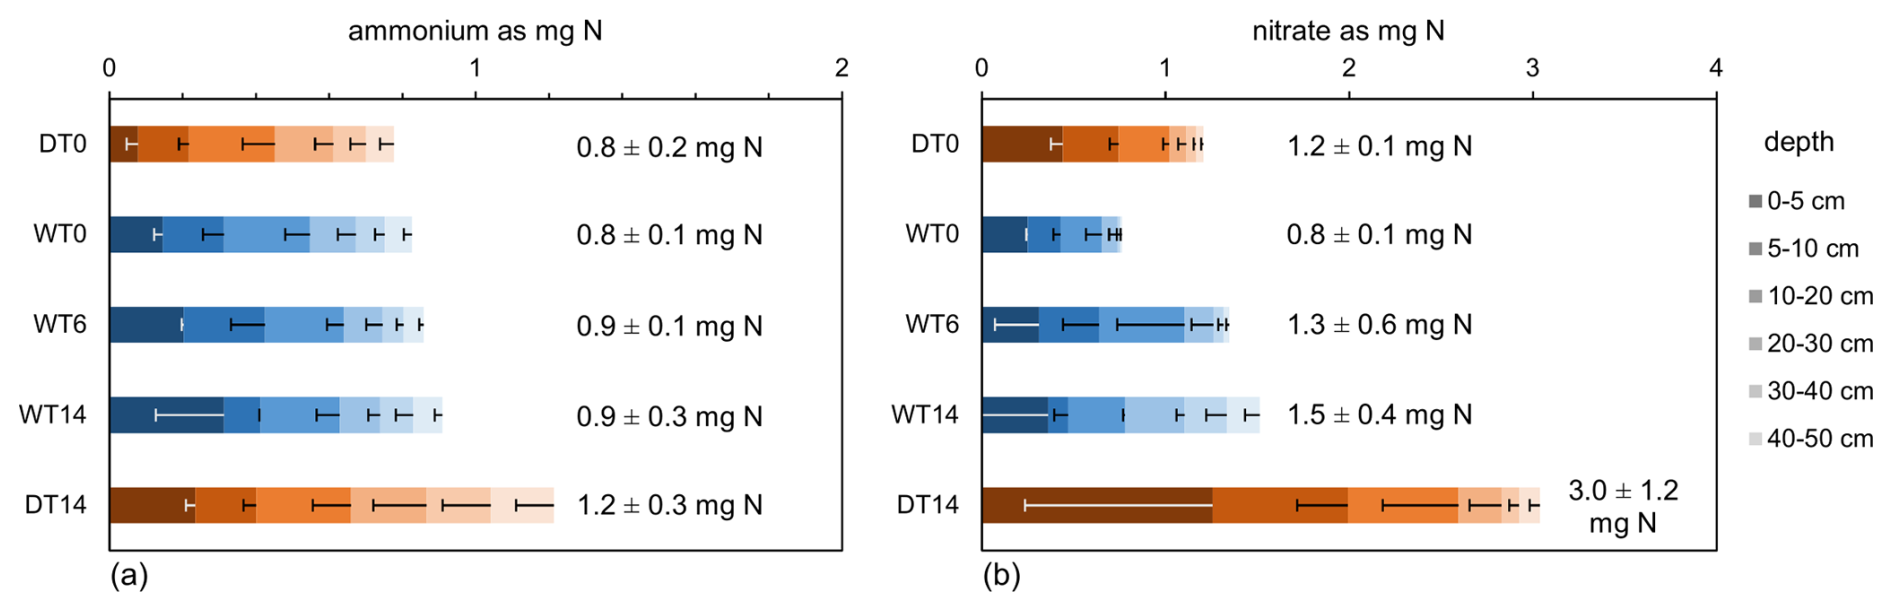
Figure 5Mass balance of ammonium (a) and nitrate (b), expressed as mg N per core segment, in dry control plots on days 0 and 14 (orange bars; DT0 and DT14) and in irrigated plots on days 0, 6, and 14 (blue bars; WT0, WT6, and WT14). Colour shading from dark to light indicates increasing soil depth. Bars show means of three replicate plots, and error bars indicate standard deviations. Total ammonium and nitrate masses in the 0–50 cm profile are shown to the right of the stacked bars, together with standard errors.
Nitrate showed a contrasting pattern. Total nitrate mass in the 0–50 cm profile decreased by approximately one third within two hours after irrigation, from 1.2 ± 0.1 mg N in dry control plots at T0 to 0.8 ± 0.1 mg N in irrigated plots at T0 (p<0.05; Fig. 5b). This decrease was driven mainly by losses from the upper soil layers. Nitrate mass decreased by approximately 40 % at both 0–5 and 5–10 cm depth (both p<0.05) and by 18 % at 10–20 cm depth (p>0.05).
During the following two weeks, nitrate mass in irrigated plots increased again. Total nitrate mass nearly doubled from 0.8 ± 0.1 mg N at WT0 to 1.5 ± 0.4 mg N at WT14 (p<0.05). From WT0 to WT6, nitrate mass increased mainly in the upper 20 cm, while changes below 20 cm were small. From WT6 to WT14, nitrate mass increased in the 0–5 cm layer and also below 20 cm depth, whereas nitrate masses at 5–10 and 10–20 cm depth decreased; however, these depth-specific changes were not significant.
In dry control plots, total nitrate mass increased from 1.2 ± 0.1 mg N at T0 to 3.0 ± 1.2 mg N at T14, but this increase was not statistically significant (p>0.05). The increase occurred mainly in the upper soil layers, with an approximately three-fold increase at 0–5 cm depth (p>0.05), a 2.4-fold increase at 5–10 cm depth (p<0.1), and a 2.2-fold increase at 10–20 cm depth (p>0.05).
3.3 Microbial community composition and extracellular enzyme activities
Microbial community composition showed high spatial variability but no clear separation between irrigated and dry control plots over the 14 d experiment. After quality filtering, the 16S rRNA amplicon dataset contained a mean of 7401 reads per sample for DNA and 6970 reads per sample for RNA. Because read numbers varied strongly among RNA samples, only samples with at least 300 reads were retained, reducing the RNA dataset from 54 to 46 samples. The retained samples contained, on average, 1334 amplicon sequence variants (ASVs).
Alpha diversity of the active bacterial community, based on the RNA fraction, did not differ significantly between dry control and irrigated plots (Fig. 6). Diversity indices tended to be slightly higher in dry control plots than in irrigated plots, but this pattern was not statistically significant. Shannon diversity of the active community did not differ between treatments (p=0.956).
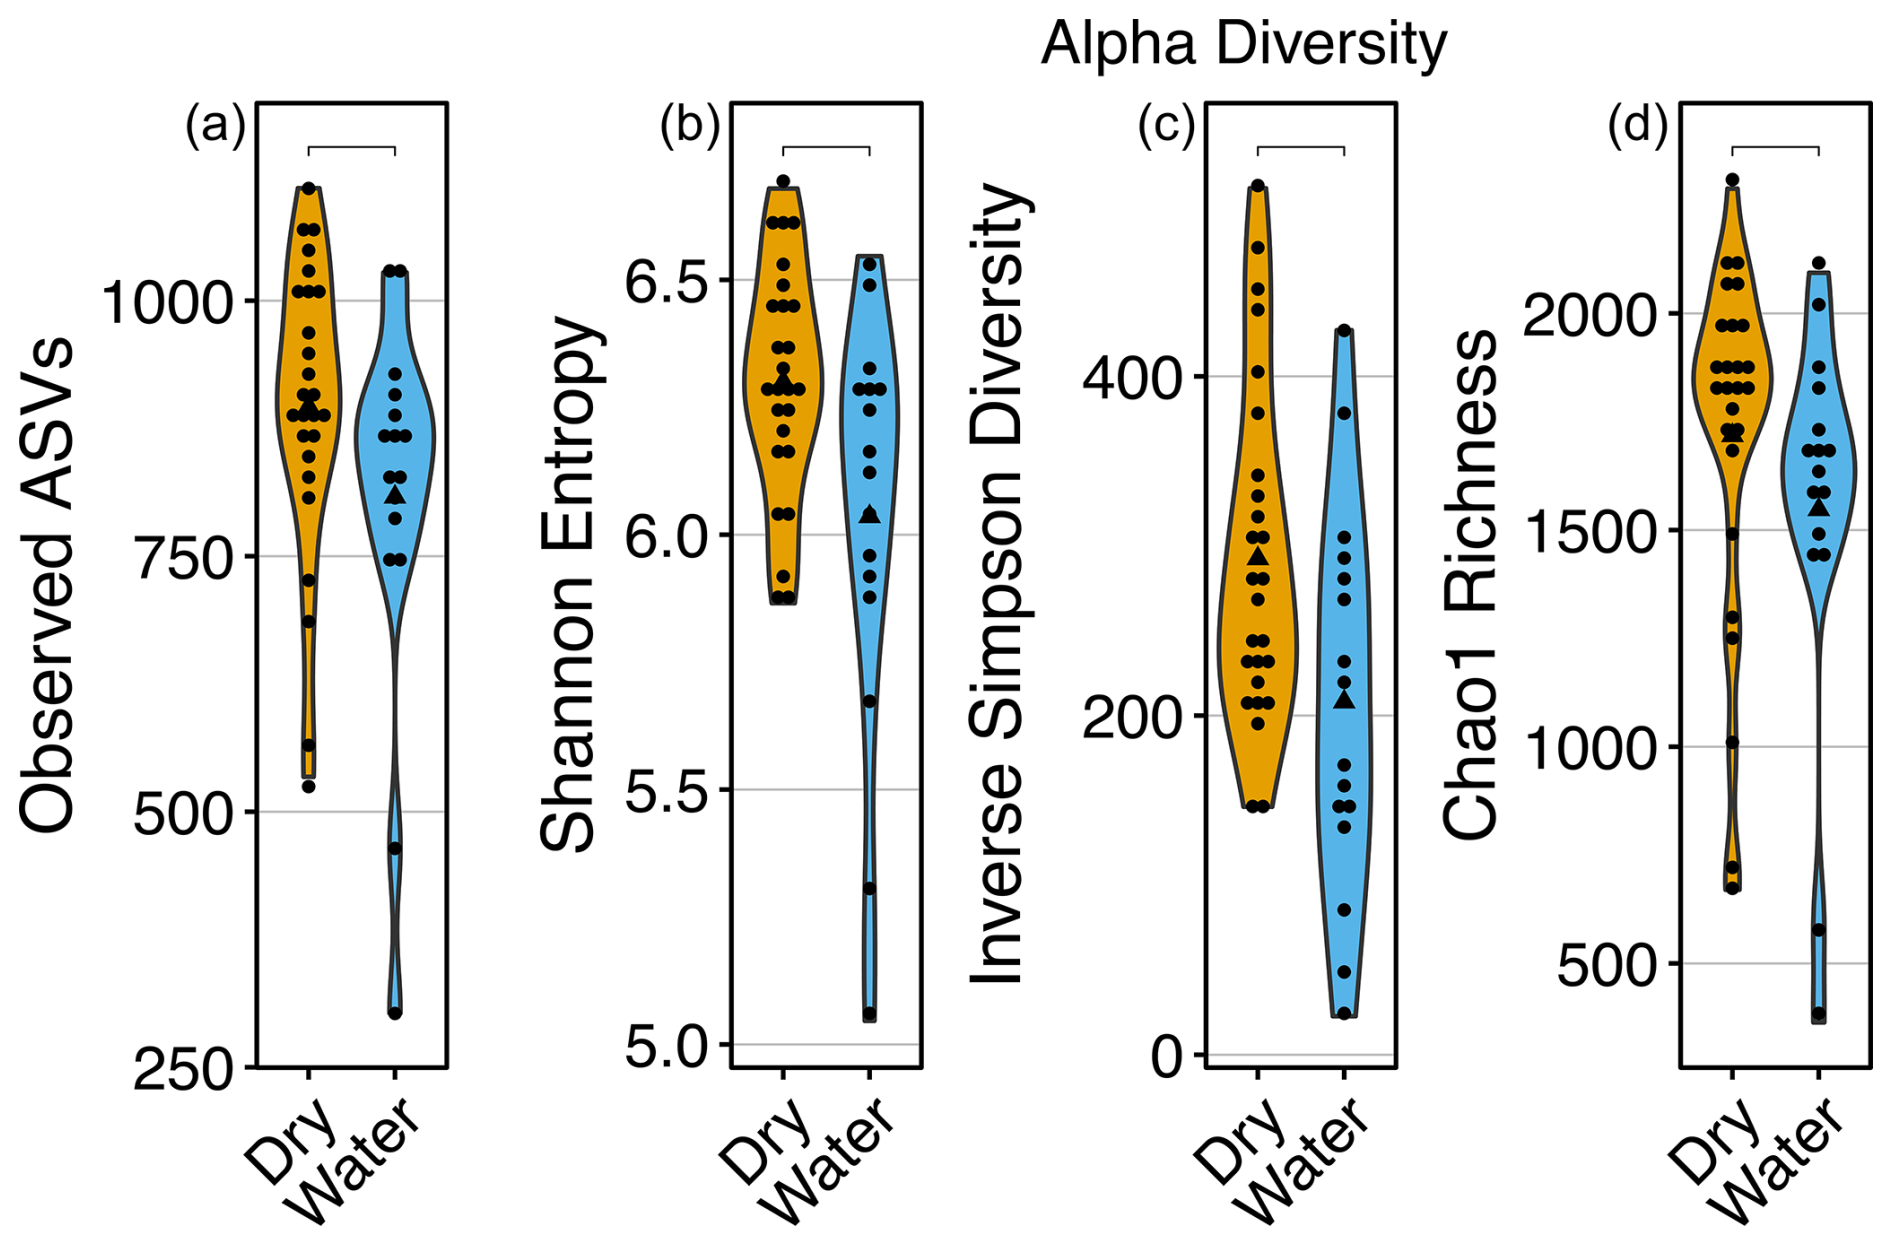
Figure 6Violin plots of observed amplicon sequence variants (ASVs; a) and alpha diversity indices (b–d) of active bacterial communities based on the RNA fraction in dry control plots (orange) and irrigated plots (blue). Differences between treatments were not significant (p>0.05).
Across all samples, the bacterial communities were dominated by Proteobacteria (17.4 ± 4.7 %), Acidobacteriota (14.5 ± 4.9 %), Actinobacteriota (13.5 ± 7.4 %), and Verrucomicrobiota (11.5 ± 5.2 %). These phyla remained dominant irrespective of treatment, depth, and sampling time (Appendix G). At family level, Pedosphaeraceae (Verrucomicrobiota), unclassified Vicinamibacterales (Acidobacteriota), Xiphinematobacteraceae (Verrucomicrobiota), and Nitrosomonadaceae (Gammaproteobacteria) were the most abundant groups, with mean relative abundances ranging from 3.2 % to 4.6 %.
Ordination of DNA- and RNA-based community composition showed no clear clustering by treatment or soil depth (Fig. 7). This indicates that neither total nor active bacterial community composition changed consistently in response to irrigation over the 14 d observation period.
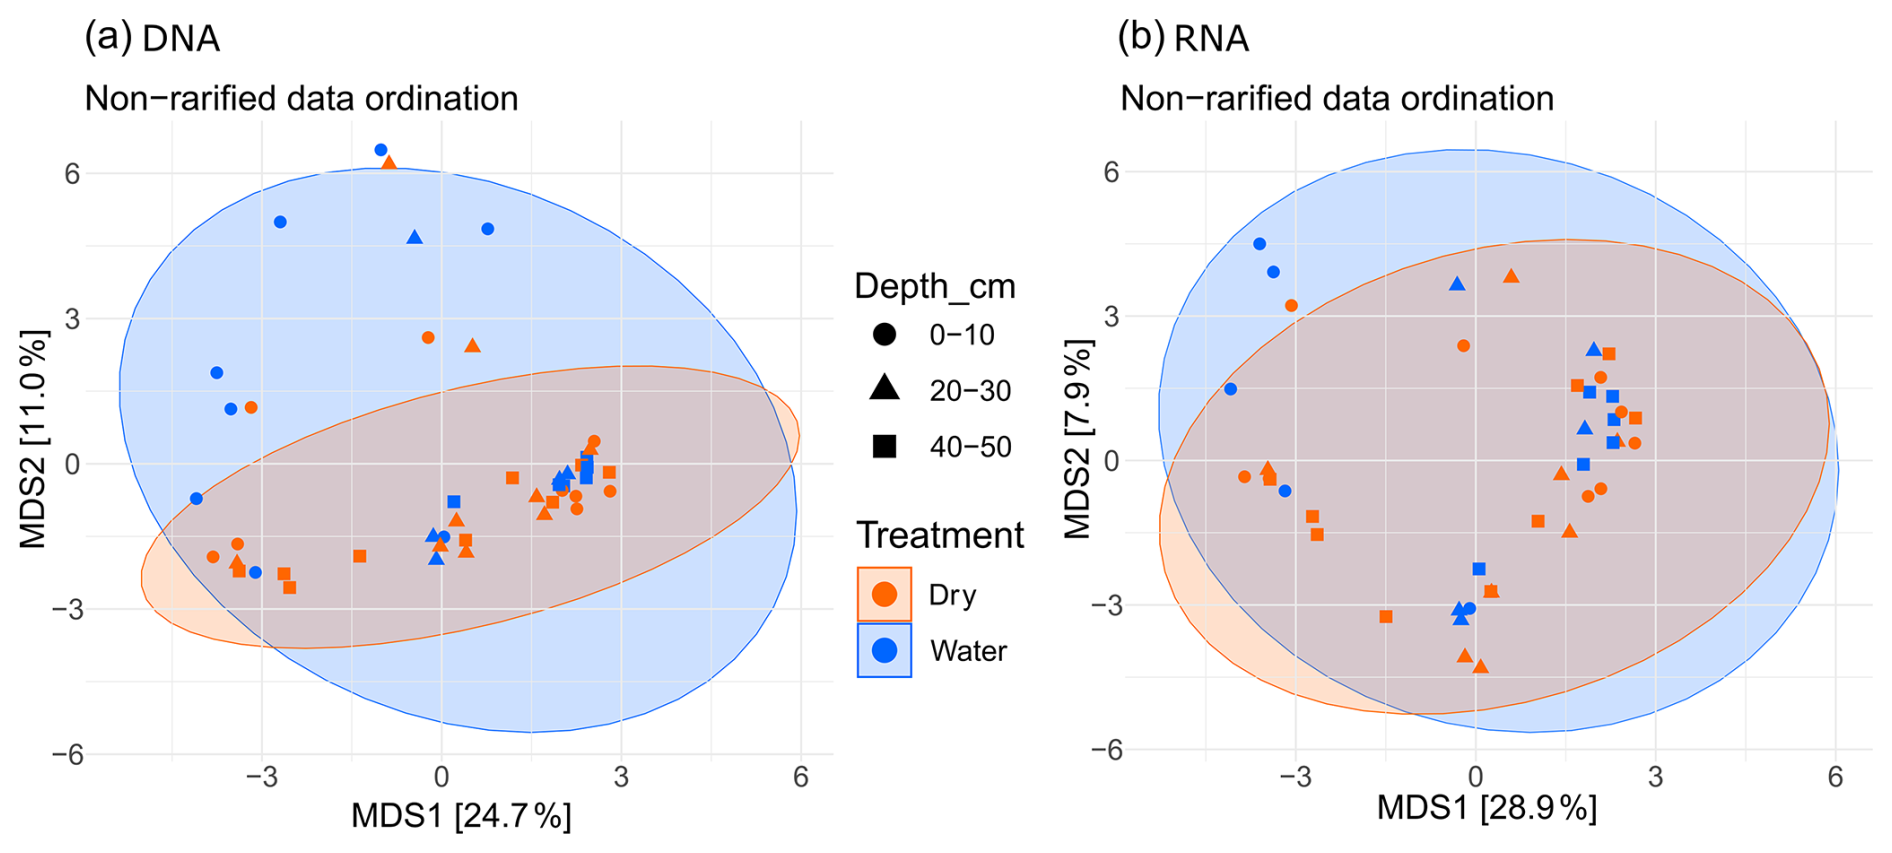
Figure 7Non-metric multidimensional scaling plots of bacterial community composition based on DNA (a) and RNA (b). Symbols indicate soil depth: 0–10 cm (circles), 20–30 cm (triangles), and 40–50 cm (squares). Colours indicate dry control plots (orange) and irrigated plots (blue).
In contrast to community composition, extracellular enzyme activities responded clearly to irrigation and soil depth (Fig. 8). Activities of β-glucosidase, exochitinase, and acid phosphatase all decreased significantly with soil depth (p < 0.05). β-glucosidase and exochitinase activities were significantly higher in irrigated plots than in dry control plots (p < 0.05), whereas acid phosphatase activity did not differ between treatments (p > 0.05). Sampling time after rewetting was not a significant factor for any of the three enzymes (p > 0.05). The stimulation of β-glucosidase and exochitinase by irrigation was strongest in the upper soil layer and declined with depth, as reflected by significant treatment × depth interactions for both enzymes (p < 0.05).
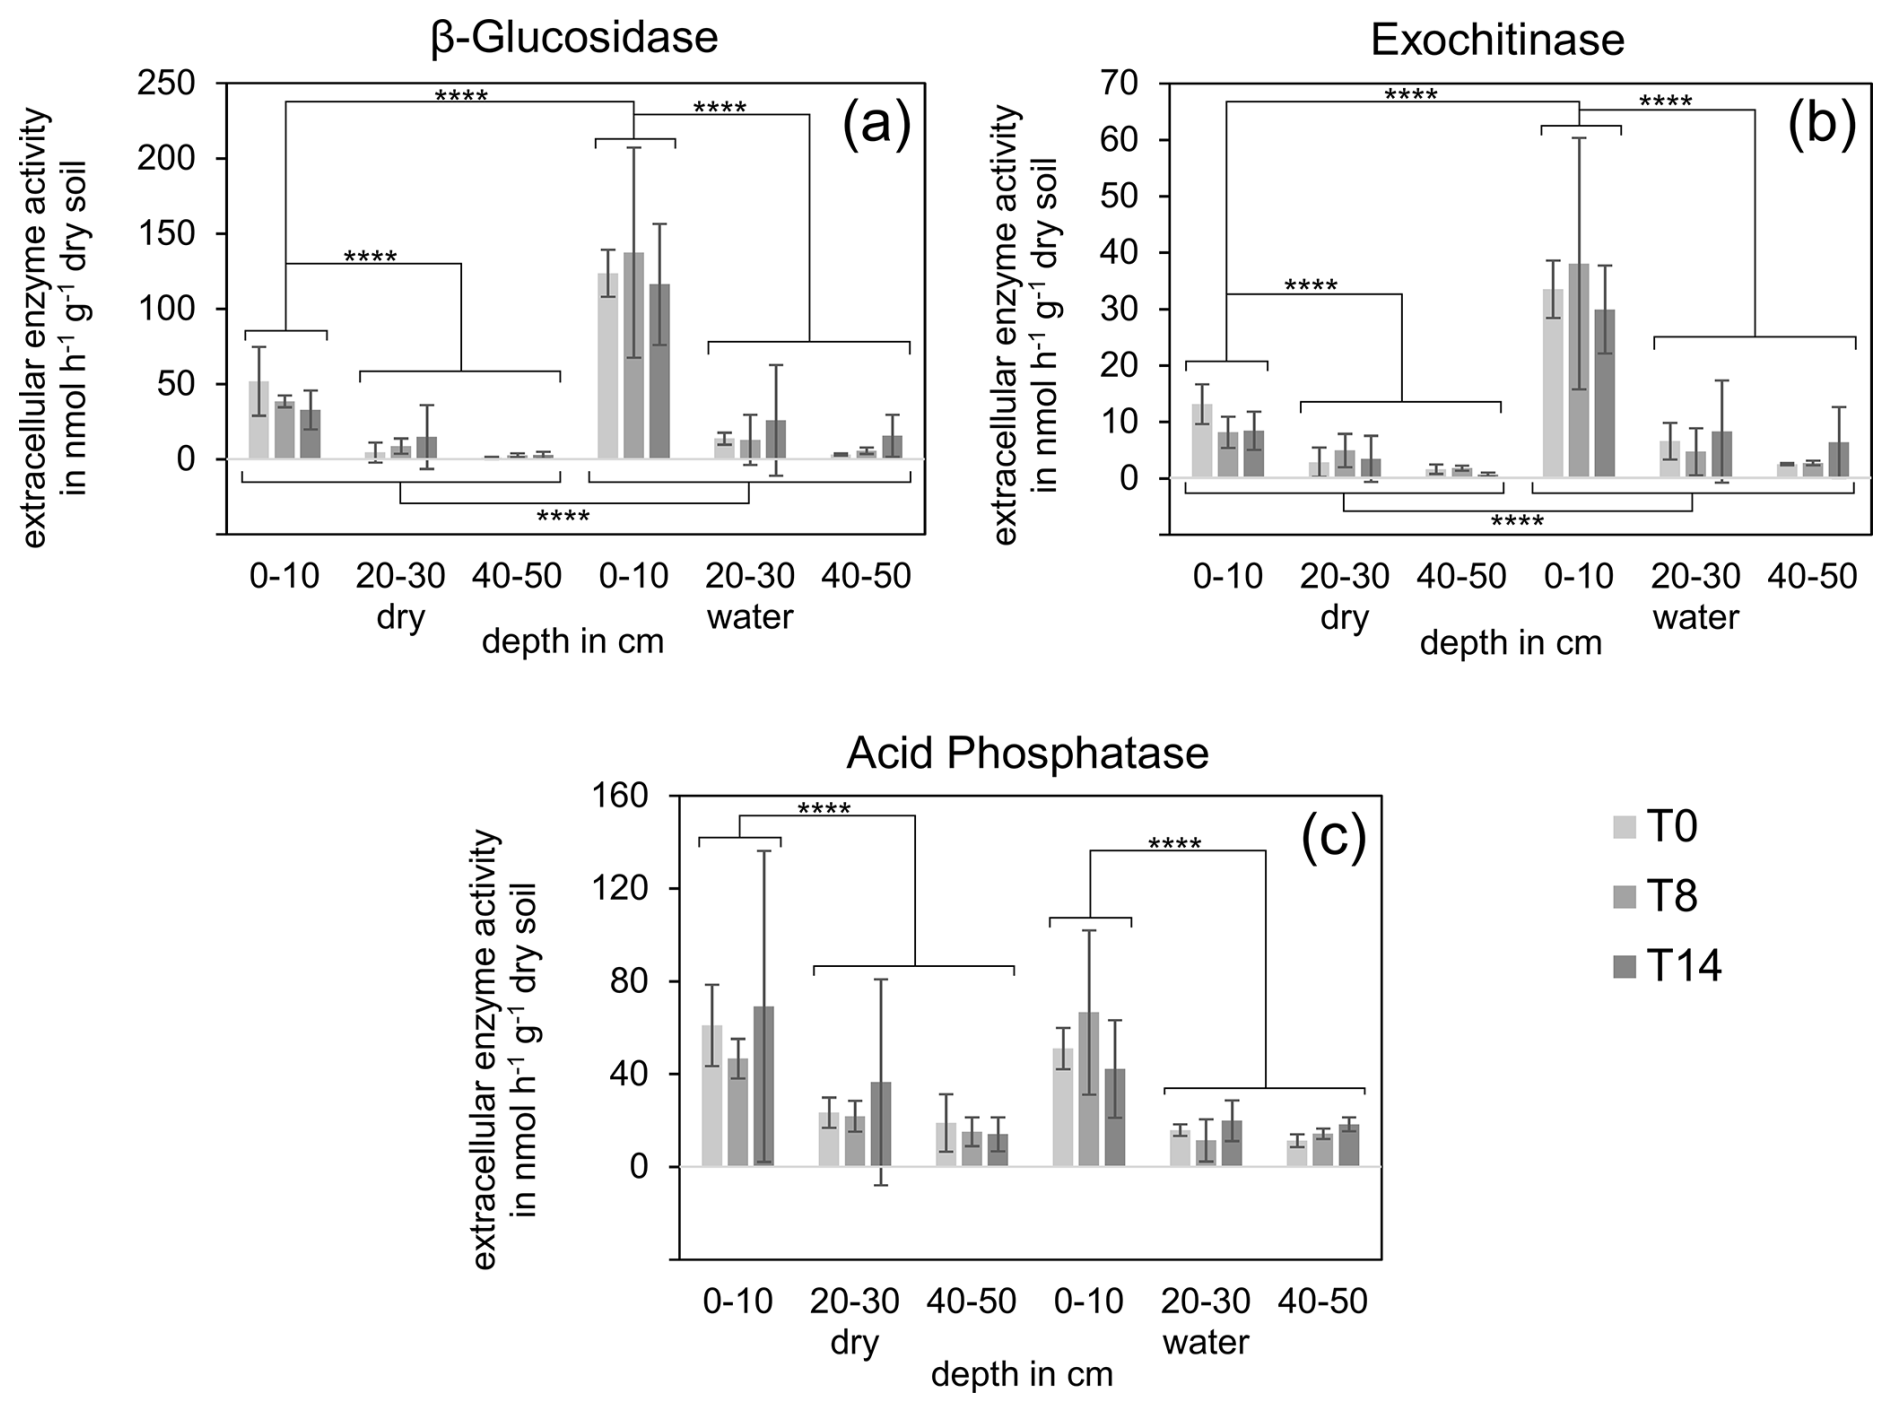
Figure 8Extracellular enzyme activities of β-glucosidase (a), exochitinase (b), and acid phosphatase (c) at three soil depths in dry control and irrigated plots. Sampling times T0, T8, and T14 are indicated by grey shading from light to dark. Error bars indicate standard deviations of three replicate plots. Significant treatment effects are indicated by asterisks ().
4.1 Preferential flow and contrasting nitrate and ammonium redistribution
The combined water and isotope mass balances showed that the simulated heavy rainfall event caused rapid infiltration throughout the sampled 0–50 cm profile. Two hours after irrigation, only about half of the recovered water was retained in the upper 20 cm, whereas a substantial fraction had already reached deeper soil layers (Fig. 3a). The δ2H isotope mass balance confirmed that D2O-labeled heavy-rainfall water was distributed across the entire sampled profile shortly after irrigation (Fig. 3b). This rapid deep infiltration is consistent with preferential flow through the pronounced shrinkage-crack network that formed in the fine-textured soil during the preceding drought period (Schlögl et al., 2022).
The hydrological response changed markedly after the initial wetting. During the subsequent phase of recurrent moderate irrigation, the apparent recovery of total water input within the sampled profile decreased from 96 % at T0 to 50 % at T6 and 32 % at T14 (Fig. 3a). At the same time, newly added water was retained mainly in the upper soil layers. This pattern indicates that the initial heavy rainfall event used open shrinkage cracks as preferential flow paths, whereas later moderate irrigation occurred after crack closure and therefore infiltrated more slowly into the soil matrix. Because the plots had been harvested before the experiment, water losses were likely driven mainly by evaporation and drainage below the sampled profile rather than by plant transpiration. The calculated ET0 of 4.2 mm d−1 therefore represents atmospheric evaporative demand rather than plot-scale evapotranspiration. The stronger decline in labeled-water recovery from the uppermost 10 cm compared with deeper layers further supports strong near-surface water loss after the initial event.
Nitrate and ammonium responded differently to this hydrological redistribution. Nitrate mass decreased strongly in the upper soil layers within two hours after the simulated heavy rainfall event, whereas ammonium mass did not show comparable profile-level losses (Fig. 5). This contrast is consistent with the different mobility of the two inorganic nitrogen species. Nitrate is weakly sorbed and can be transported rapidly with percolating and infiltrating water, whereas ammonium is retained more strongly by cation exchange at negatively charged mineral surfaces, particularly clay minerals (Blume et al., 2016). Thus, preferential flow after drought likely caused rapid vertical nitrate displacement, while ammonium remained largely retained in the sampled soil profile.
The decrease in nitrate mass in the upper soil profile was not accompanied by a corresponding nitrate accumulation at 30–50 cm depth. This suggests that at least part of the displaced nitrate may have moved below the sampled 50 cm profile. Alternative explanations, such as denitrification or plant uptake, are less likely to fully explain the immediate nitrate decrease. Redox potentials were still oxidizing shortly after the simulated heavy rainfall event, and crops had been harvested before the experiment. Microbial immobilization may have contributed, but the rapid timing and magnitude of the nitrate decrease are more consistent with hydrological export along preferential flow paths. Nevertheless, because nitrate was not measured below 50 cm depth, nitrate transfer beyond the sampled profile should be interpreted as a likely but indirect inference.
The potential transfer of nitrate below the biologically active topsoil is relevant for groundwater quality, particularly in fine-textured floodplain soils, where shrinkage cracks can bypass the soil matrix. The study site is underlain by a shallow tufa aquifer below the upper clay-rich layer (Martin et al., 2020). If nitrate reaches such deeper zones repeatedly, its fate will depend on the local redox status and denitrification capacity of the subsurface. Therefore, heavy rainfall following drought may represent a short but important hydrological window during which nitrate can bypass retention and transformation in the upper soil profile.
4.2 Inorganic nitrogen pools after rewetting: evidence for a short-term rewetting pulse and redox-associated nitrate dynamics
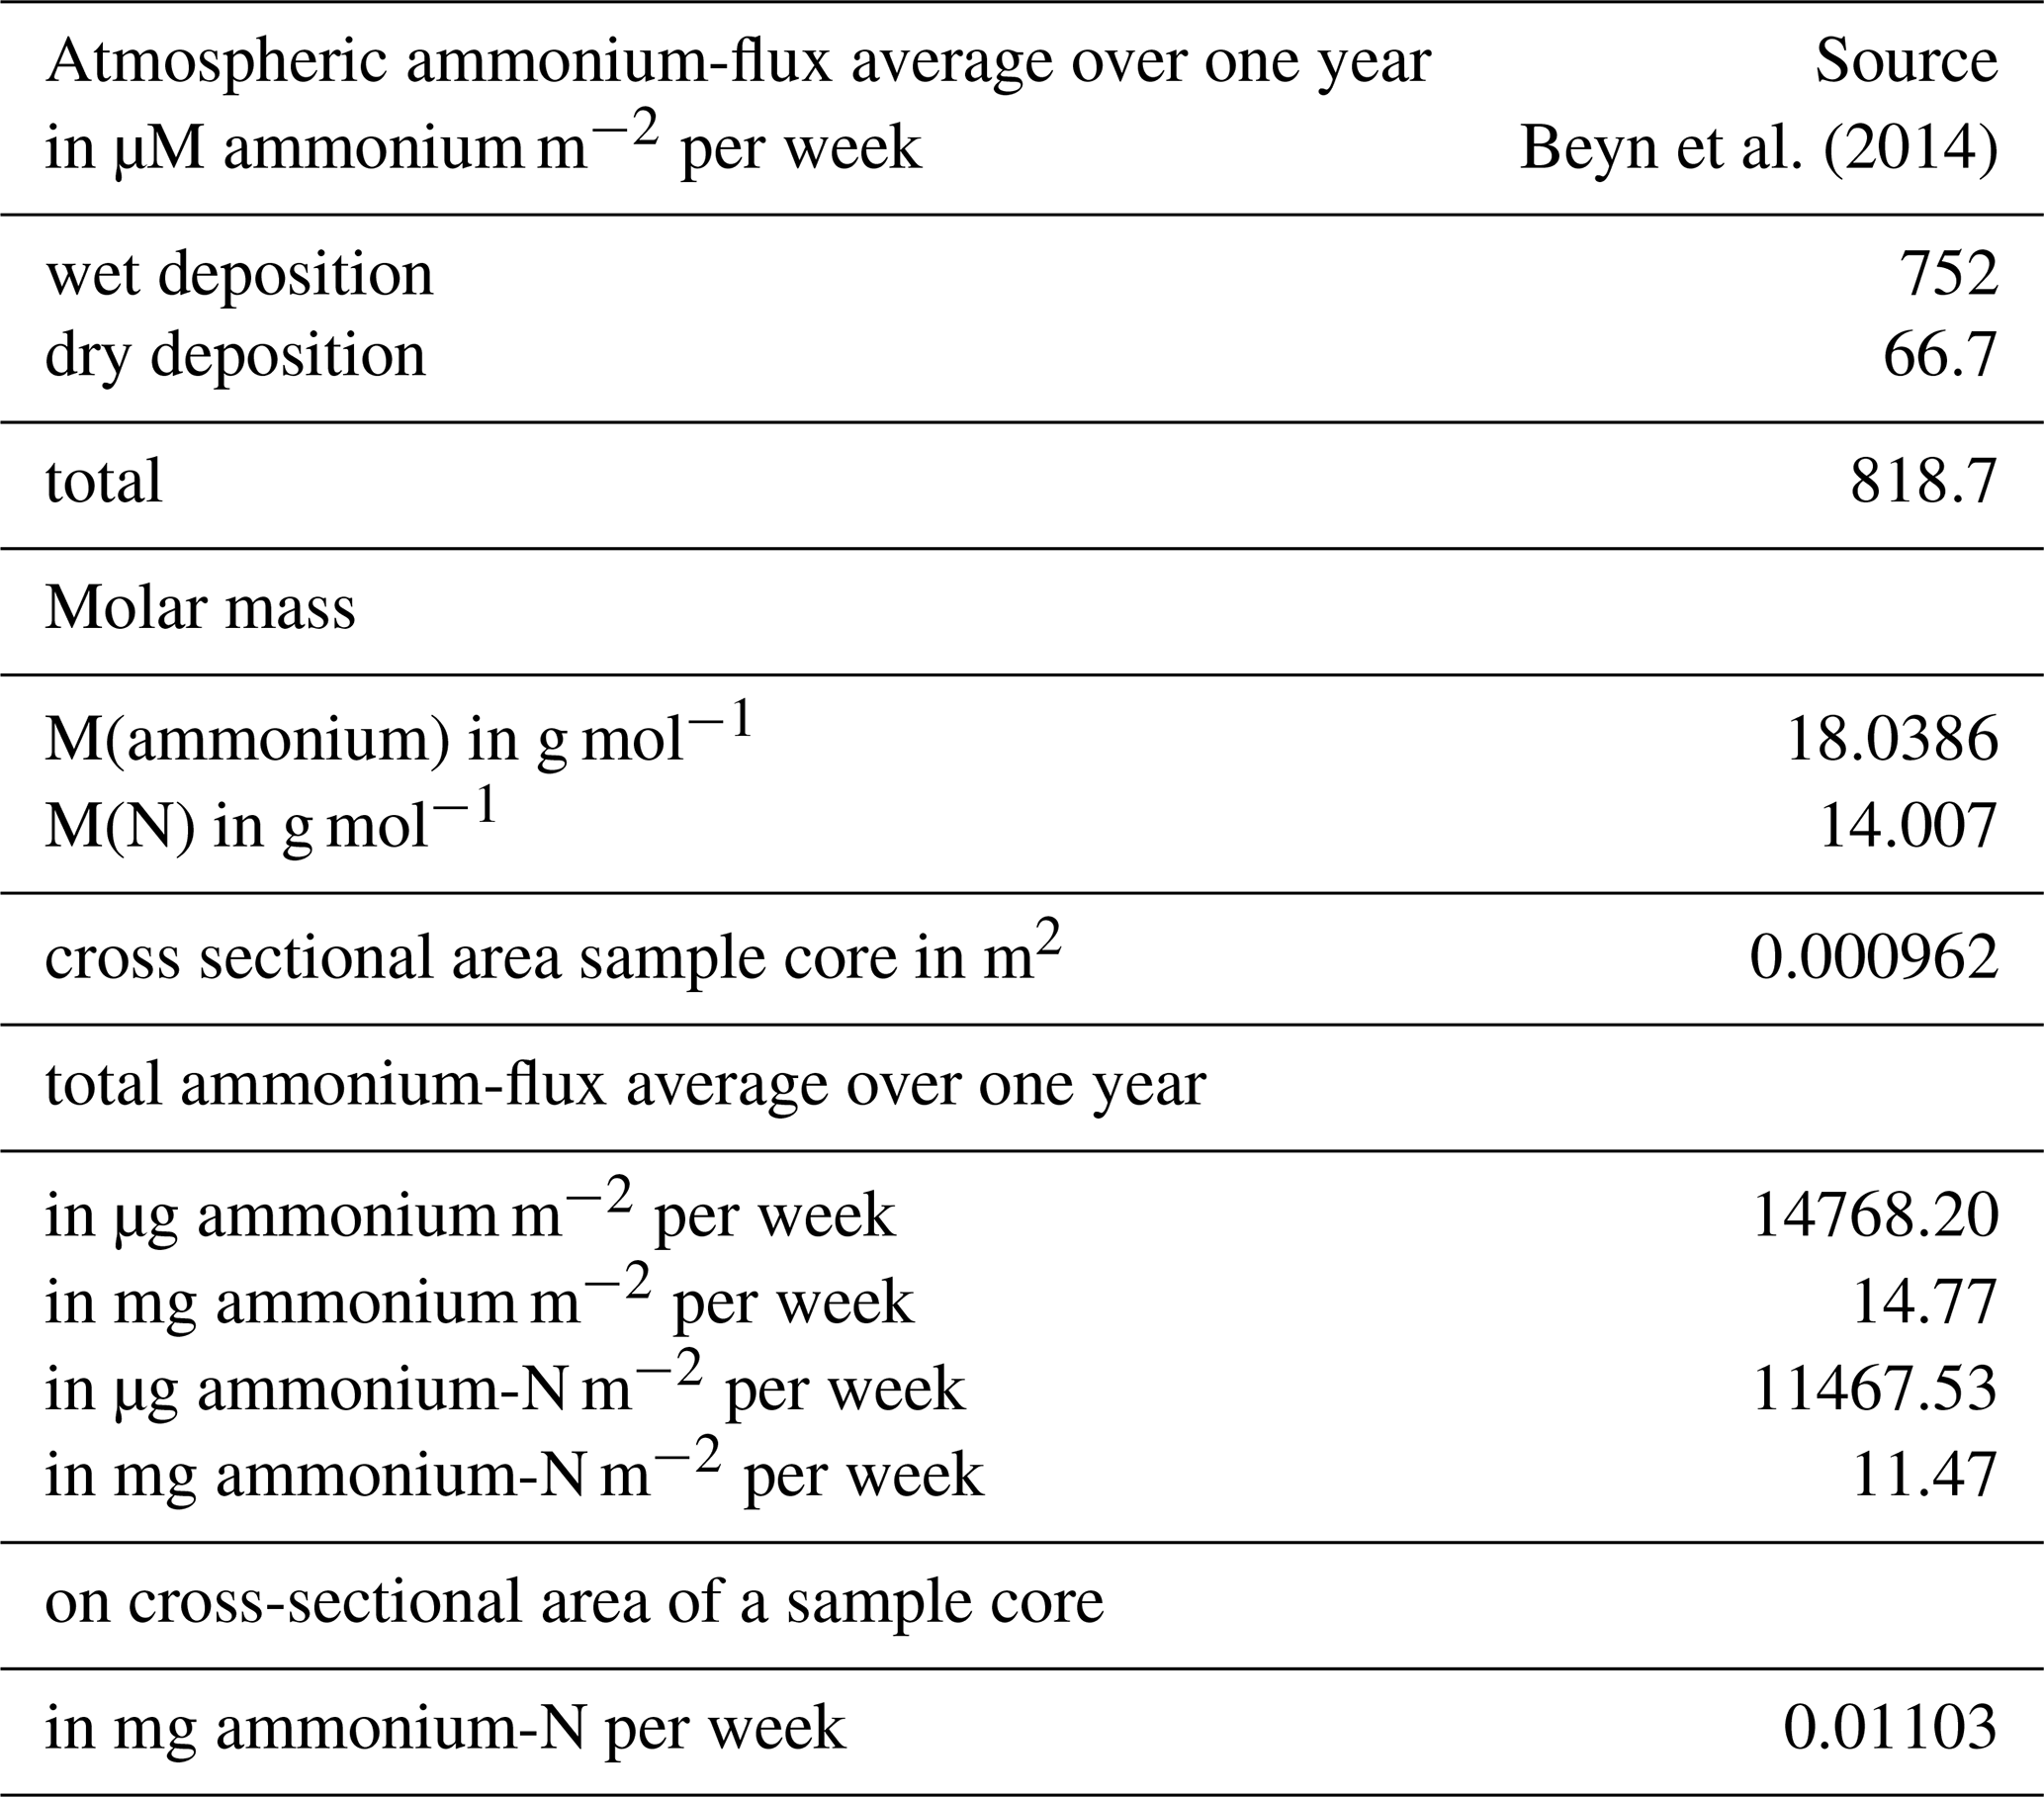
The increase in ammonium mass in the uppermost soil layer shortly after irrigation is consistent with a rewetting-induced mineralization pulse, commonly referred to as the Birch effect. Ammonium mass nearly doubled in the 0–5 cm layer within two hours after the simulated heavy rainfall event (Fig. 5a). This response agrees with earlier observations that rewetting of dry soils can cause a transient release of inorganic nitrogen through microbial cell lysis, mineralization of dead microbial biomass, and decomposition of osmoregulatory compounds released during drought and rewetting (Birch, 1958, 1960; Fierer and Schimel, 2002; Jarvis et al., 2007; Saetre and Stark, 2005; Unger et al., 2010). The simultaneous increase in β-glucosidase and exochitinase activities supports the interpretation that rewetting rapidly stimulated microbial and enzymatic activity in the topsoil. The increase in ammonium mass cannot solely be caused by atmospheric deposition (Appendix I). This mineral nitrogen pulse necessarily implies mobilization and mineralization of organic nitrogen, potentially including labile soil organic nitrogen and nitrogen released from drought-stressed or lysed microbial biomass. Drying–rewetting can increase the availability of such organic nitrogen substrates and stimulate net nitrogen mineralization after rewetting, although the contribution of individual organic nitrogen pools cannot be quantified from the present measurements (Maxwell et al., 2022; Schimel, 2018).
Below 5 cm depth, ammonium masses changed only weakly in irrigated plots. Three, non-exclusive mechanisms may explain this limited response. First, labile organic matter decreased with depth (Appendix B), reducing the potential for rewetting-induced ammonium release. Second, ammonium may have been retained by sorption to clay minerals and partly fixed in 2:1 clay interlayers, reducing its mobility and microbial accessibility (Buss et al., 2004; Cavalli et al., 2015). Third, newly produced ammonium may have been balanced by microbial uptake or oxidation under locally oxic conditions. Because gross nitrogen transformation rates were not measured, these mechanisms cannot be separated quantitatively.
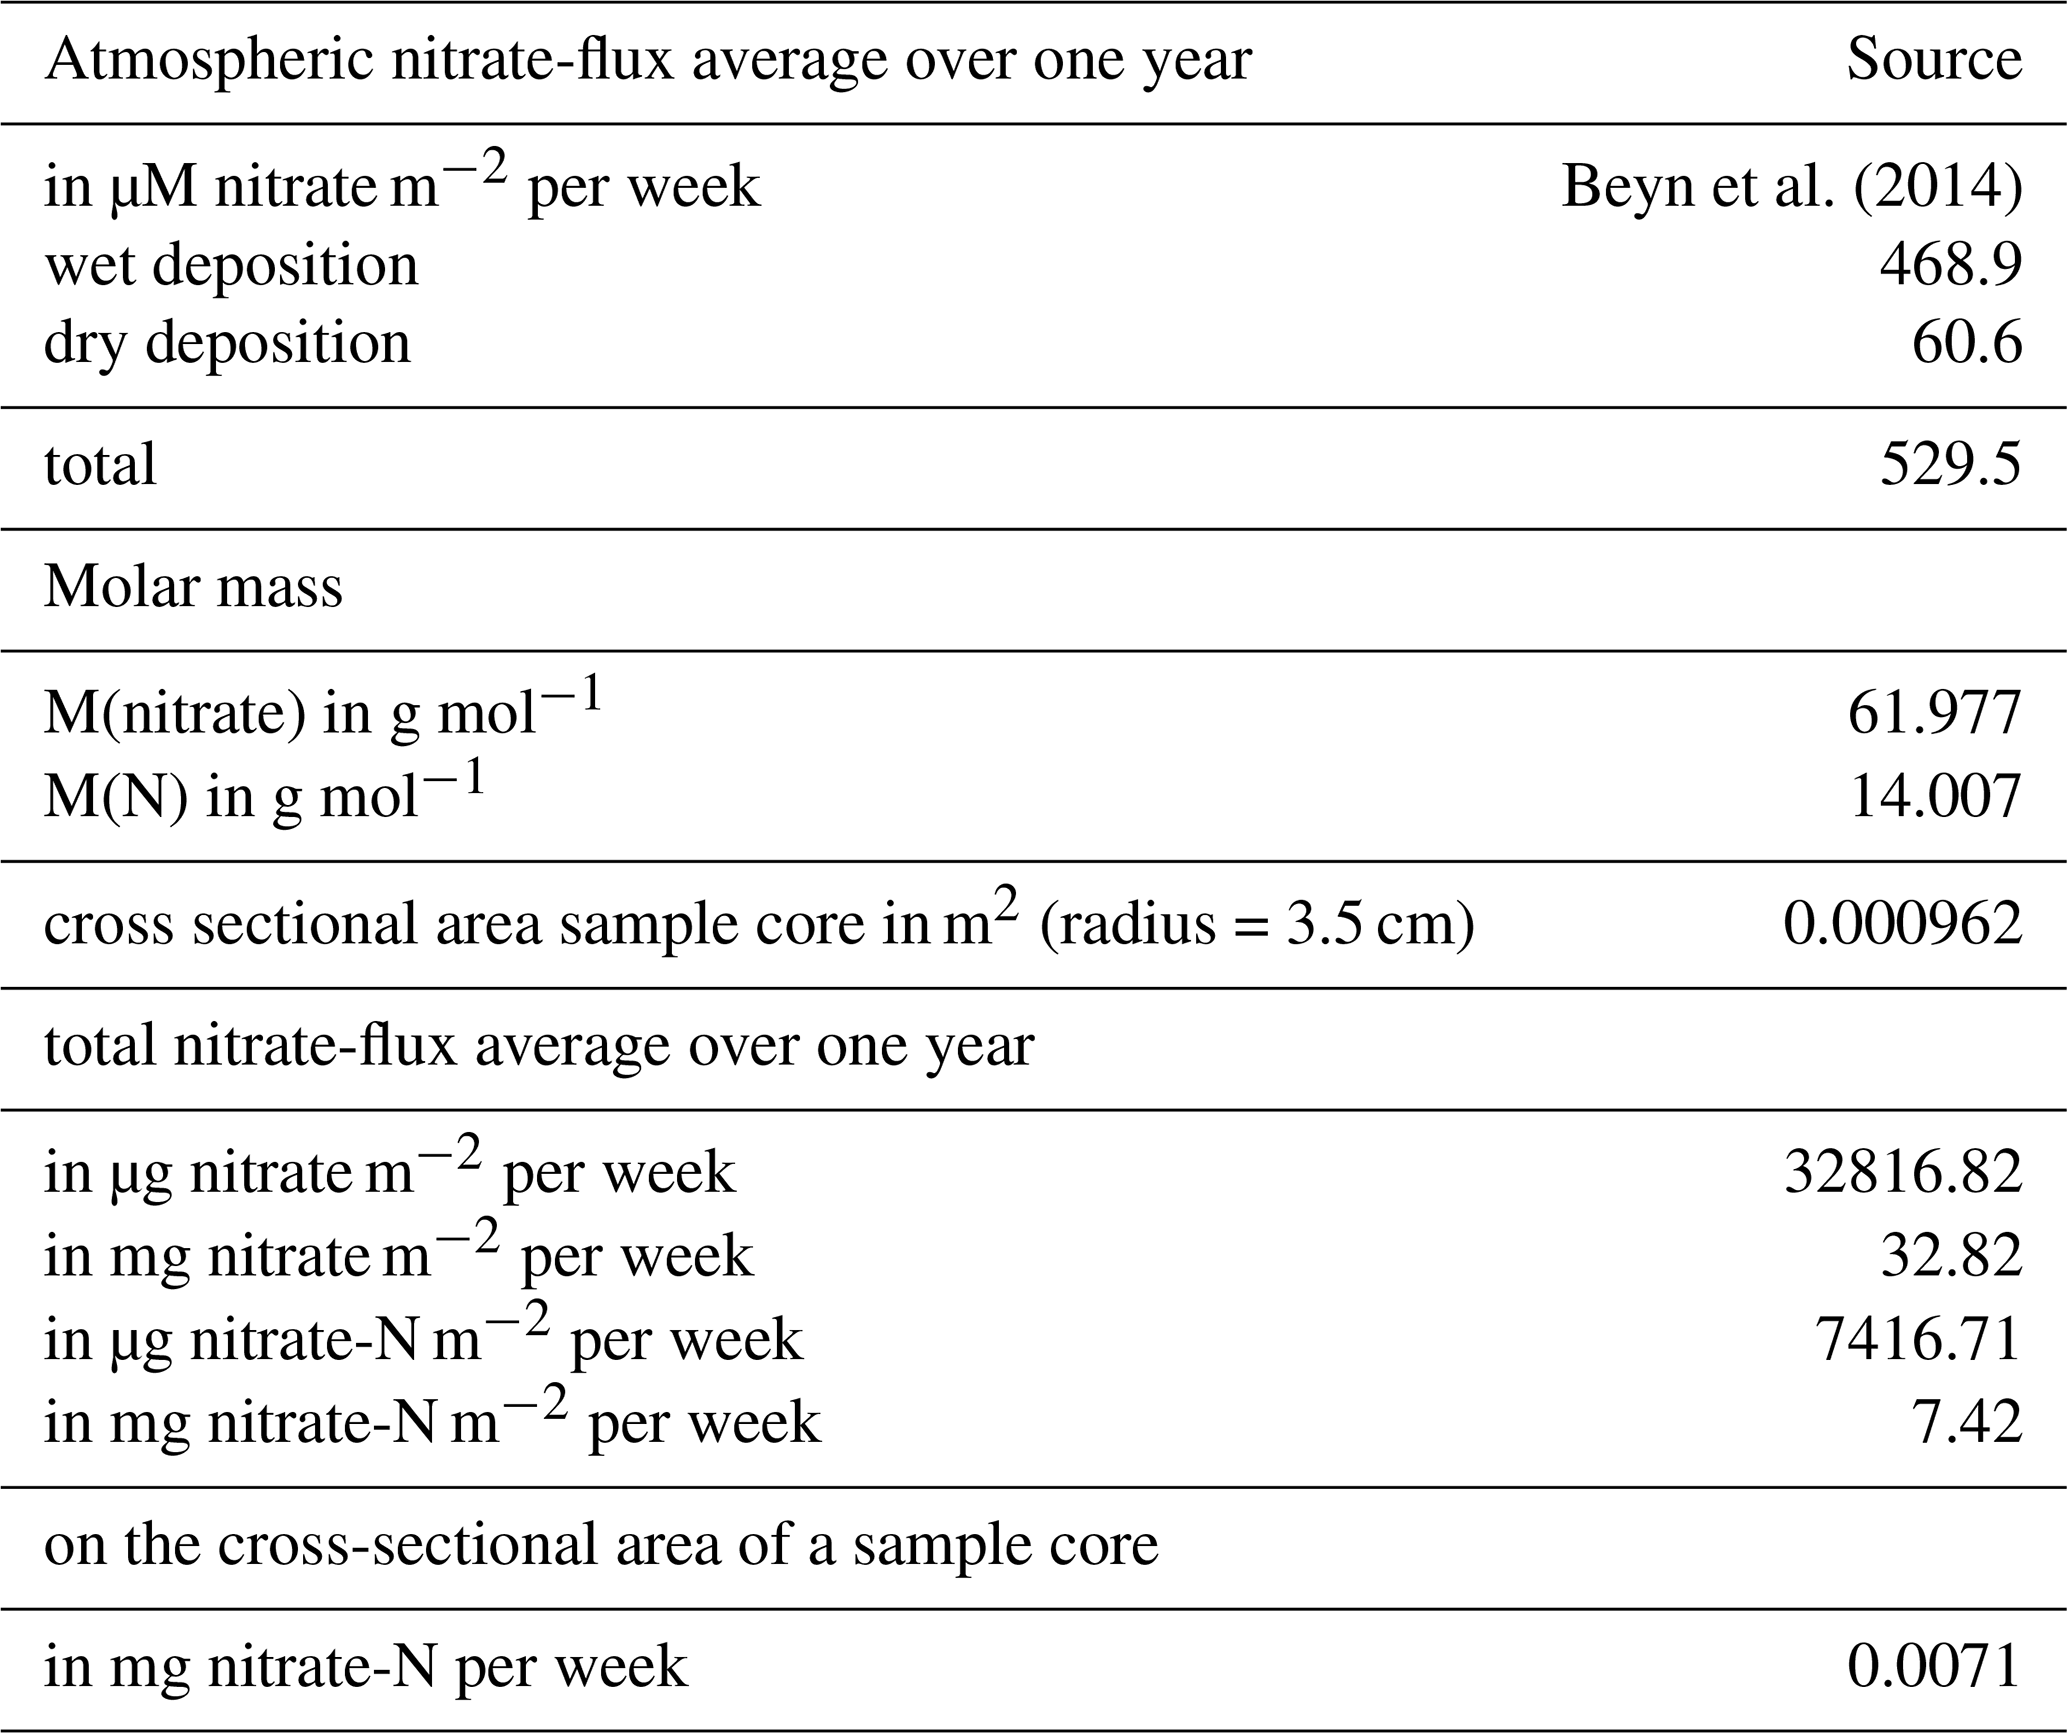
Nitrate dynamics after the initial rainfall event were more complex. After the immediate decline in nitrate mass at T0, total nitrate mass in irrigated plots increased again by T14 (Fig. 5b). This increase cannot be fully explained by atmospheric nitrate deposition, which was small relative to the observed nitrate changes (Appendix J). Periods with higher redox potentials may have favored nitrification, whereas lower redox potentials may have favored nitrate reduction. The redox records support this interpretation qualitatively: redox potentials declined after irrigation but showed strong temporal variation, particularly at 10–30 cm depth, and increased again during the interruption of daily irrigation between T10 and T14 (Fig. 4).
However, these data do not allow direct quantification of nitrification, denitrification, immobilization, or mineralization rates. Therefore, we interpret the observed nitrate patterns as redox-associated changes in inorganic nitrogen pools, not as direct evidence for a process-level switch in nitrogen cycling. This distinction is important because nitrate and ammonium pool sizes integrate multiple simultaneous processes, including production, consumption, immobilization, and transport. In addition, redox potentials were measured with high temporal resolution but only in one irrigated and one dry control plot. The sometimes very marked differences in the sensors' responses can be caused, for example, by the highly uneven distribution of dry cracks or remaining root fragments from the harvested plants. The redox data therefore provide valuable mechanistic context, but spatial extrapolation to all replicate plots must remain cautious.
The strong spatial and temporal variability in nitrate and ammonium masses further highlights the difficulty of inferring nitrogen process rates from pool-size data alone. Coefficients of variation (Appendix H) showed that inorganic nitrogen distributions did not simply mirror the spatial pattern of the D2O-labeled water. While preferential flow clearly governed rapid water redistribution during the initial event, nitrate and ammonium masses were also shaped by sorption, biological transformations, and local soil heterogeneity. Thus, drought-induced cracks were important for rapid water and nitrate displacement, but they were not the only control on inorganic nitrogen pool distributions during the subsequent 14 d.
The increase in ammonium and nitrate masses in dry control plots between T0 and T14 also illustrates this interpretive complexity. Because these plots remained dry for longer, continued drought may have intensified microbial stress and contributed to organic matter and microbial biomass turnover, with subsequent accumulation of inorganic nitrogen. As atmospheric nitrogen inputs were too small to account for this increase, part of the additional inorganic N must ultimately have originated from net mineralization of soil organic nitrogen and/or microbial biomass nitrogen (Appel, 1998). The simultaneous accumulation of NH and particularly NO is therefore consistent with continued organic nitrogen mineralization followed by nitrification, although neither process can be quantified from the observed pool changes alone. In addition, evaporation may have promoted upward redistribution and concentration of dissolved nitrate in the upper soil layers. The temporary plastic cover used to exclude natural rainfall may also have altered temperature and moisture conditions near the soil surface. These explanations remain tentative, but they emphasize that inorganic nitrogen pools can change substantially even without experimental irrigation.
Overall, the nitrogen data support two main conclusions. First, rewetting caused a rapid but spatially restricted ammonium increase in the topsoil, consistent with a short-term Birch-effect response. Second, nitrate pools after the initial event were associated with changing hydrological and redox conditions, but the underlying process rates cannot be resolved without direct measurements of gross mineralization, nitrification, immobilization, and denitrification.
4.3 Microbial community composition and extracellular enzyme activities
Microbial responses to drought and rewetting differed between community composition and extracellular enzyme activity. Bacterial community composition showed no consistent treatment-related separation at either the DNA or RNA level during the 14 d experiment (Fig. 7). Alpha diversity of the active community also did not differ significantly between dry control and irrigated plots (Fig. 6). These results indicate that the short-term rewetting event did not cause a detectable restructuring of bacterial community composition at the taxonomic resolution captured by 16S rRNA amplicon sequencing.
The absence of a clear compositional response does not imply that microorganisms were inactive. In contrast, β-glucosidase and exochitinase activities increased significantly in irrigated plots, especially in the upper soil layer (Fig. 8). This indicates that rewetting rapidly affected microbial activity or extracellular enzyme availability, even though community composition remained comparatively stable. Such a decoupling between microbial activity and community composition is plausible because enzyme activities can respond within hours to changes in water availability, substrate diffusion, cell lysis, and microbial metabolic activation, whereas detectable shifts in community composition may require longer time scales or stronger selective pressure.
Several factors may explain why microbial community composition remained stable. First, floodplain and arable soils are highly heterogeneous at small spatial scales, and such micro-scale variability can mask treatment effects in community ordinations (Vos et al., 2013). Second, DNA can persist in soils as relic DNA or in dormant cells, which may obscure short-term changes in the living community (Carini et al., 2016; Lennon et al., 2018). Although RNA was analyzed as a proxy for the active community, rRNA-based community profiles may still reflect both activity and standing ribosome pools rather than instantaneous growth or process rates. Third, the 14 d observation period may have been too short to detect consistent taxonomic restructuring, particularly if the community response was mainly physiological.
The slightly higher RNA-based diversity indices in dry control plots than in irrigated plots were not statistically significant and should therefore not be interpreted as evidence for selection of better-adapted taxa. Rewetting can impose osmotic stress and can eliminate sensitive cells, while also stimulating dormant or rare taxa (Aanderud et al., 2015; Barnard et al., 2013; Blazewicz et al., 2014; Schimel, 2018). However, our data provide stronger evidence for an activity response than for compositional selection. Therefore, the microbial results are best interpreted as showing rapid functional activation after rewetting without detectable community restructuring over the short experimental period.
This interpretation is consistent with the enzyme and nitrogen results. Increased β-glucosidase and exochitinase activities after irrigation indicate enhanced potential for C and N acquisition from organic substrates and support the observed short-term ammonium increase in the topsoil. In contrast, the lack of a clear microbial community shift suggests that the immediate biogeochemical response was driven primarily by altered microbial activity, substrate accessibility, and physical–chemical conditions rather than by major changes in bacterial community composition.
Heavy rainfall after summer drought caused rapid preferential infiltration through drought-induced shrinkage cracks in this fine-textured floodplain soil. Within two hours, D2O-labeled water reached at least 50 cm depth, and nitrate mass declined in the upper soil profile without accumulating in the sampled subsoil, suggesting possible nitrate transport below 50 cm. In contrast, ammonium was largely retained within the soil profile and increased only in the uppermost layer, consistent with a short-term rewetting-induced mineralization pulse. Subsequent moderate irrigation was retained mainly in the topsoil, most likely because shrinkage cracks had closed after initial wetting. Redox potentials declined strongly after irrigation and were associated with later changes in nitrate pools, but these patterns cannot be interpreted as direct estimates of nitrogen transformation rates. Microbial community composition remained stable at both DNA and RNA levels, whereas β-glucosidase and exochitinase activities increased after irrigation, indicating rapid functional activation rather than detectable community restructuring. These findings show that heavy rainfall after drought can create a brief but important window for nitrate displacement through preferential flow pathways, potentially bypassing nitrogen retention in the biologically active topsoil and increasing nitrate transfer to deeper soil layers or shallow groundwater. The study, conducted under realistic field conditions, demonstrated that the interaction of the processes under investigation is complex and that, for example, the exact mechanisms of nitrogen cycling could not be adequately explained using the chosen approach. Future work should combine tracer-based hydrology with direct measurements of gross nitrogen transformation rates to disentangle transport from microbial nitrogen cycling during drought–rewetting events.
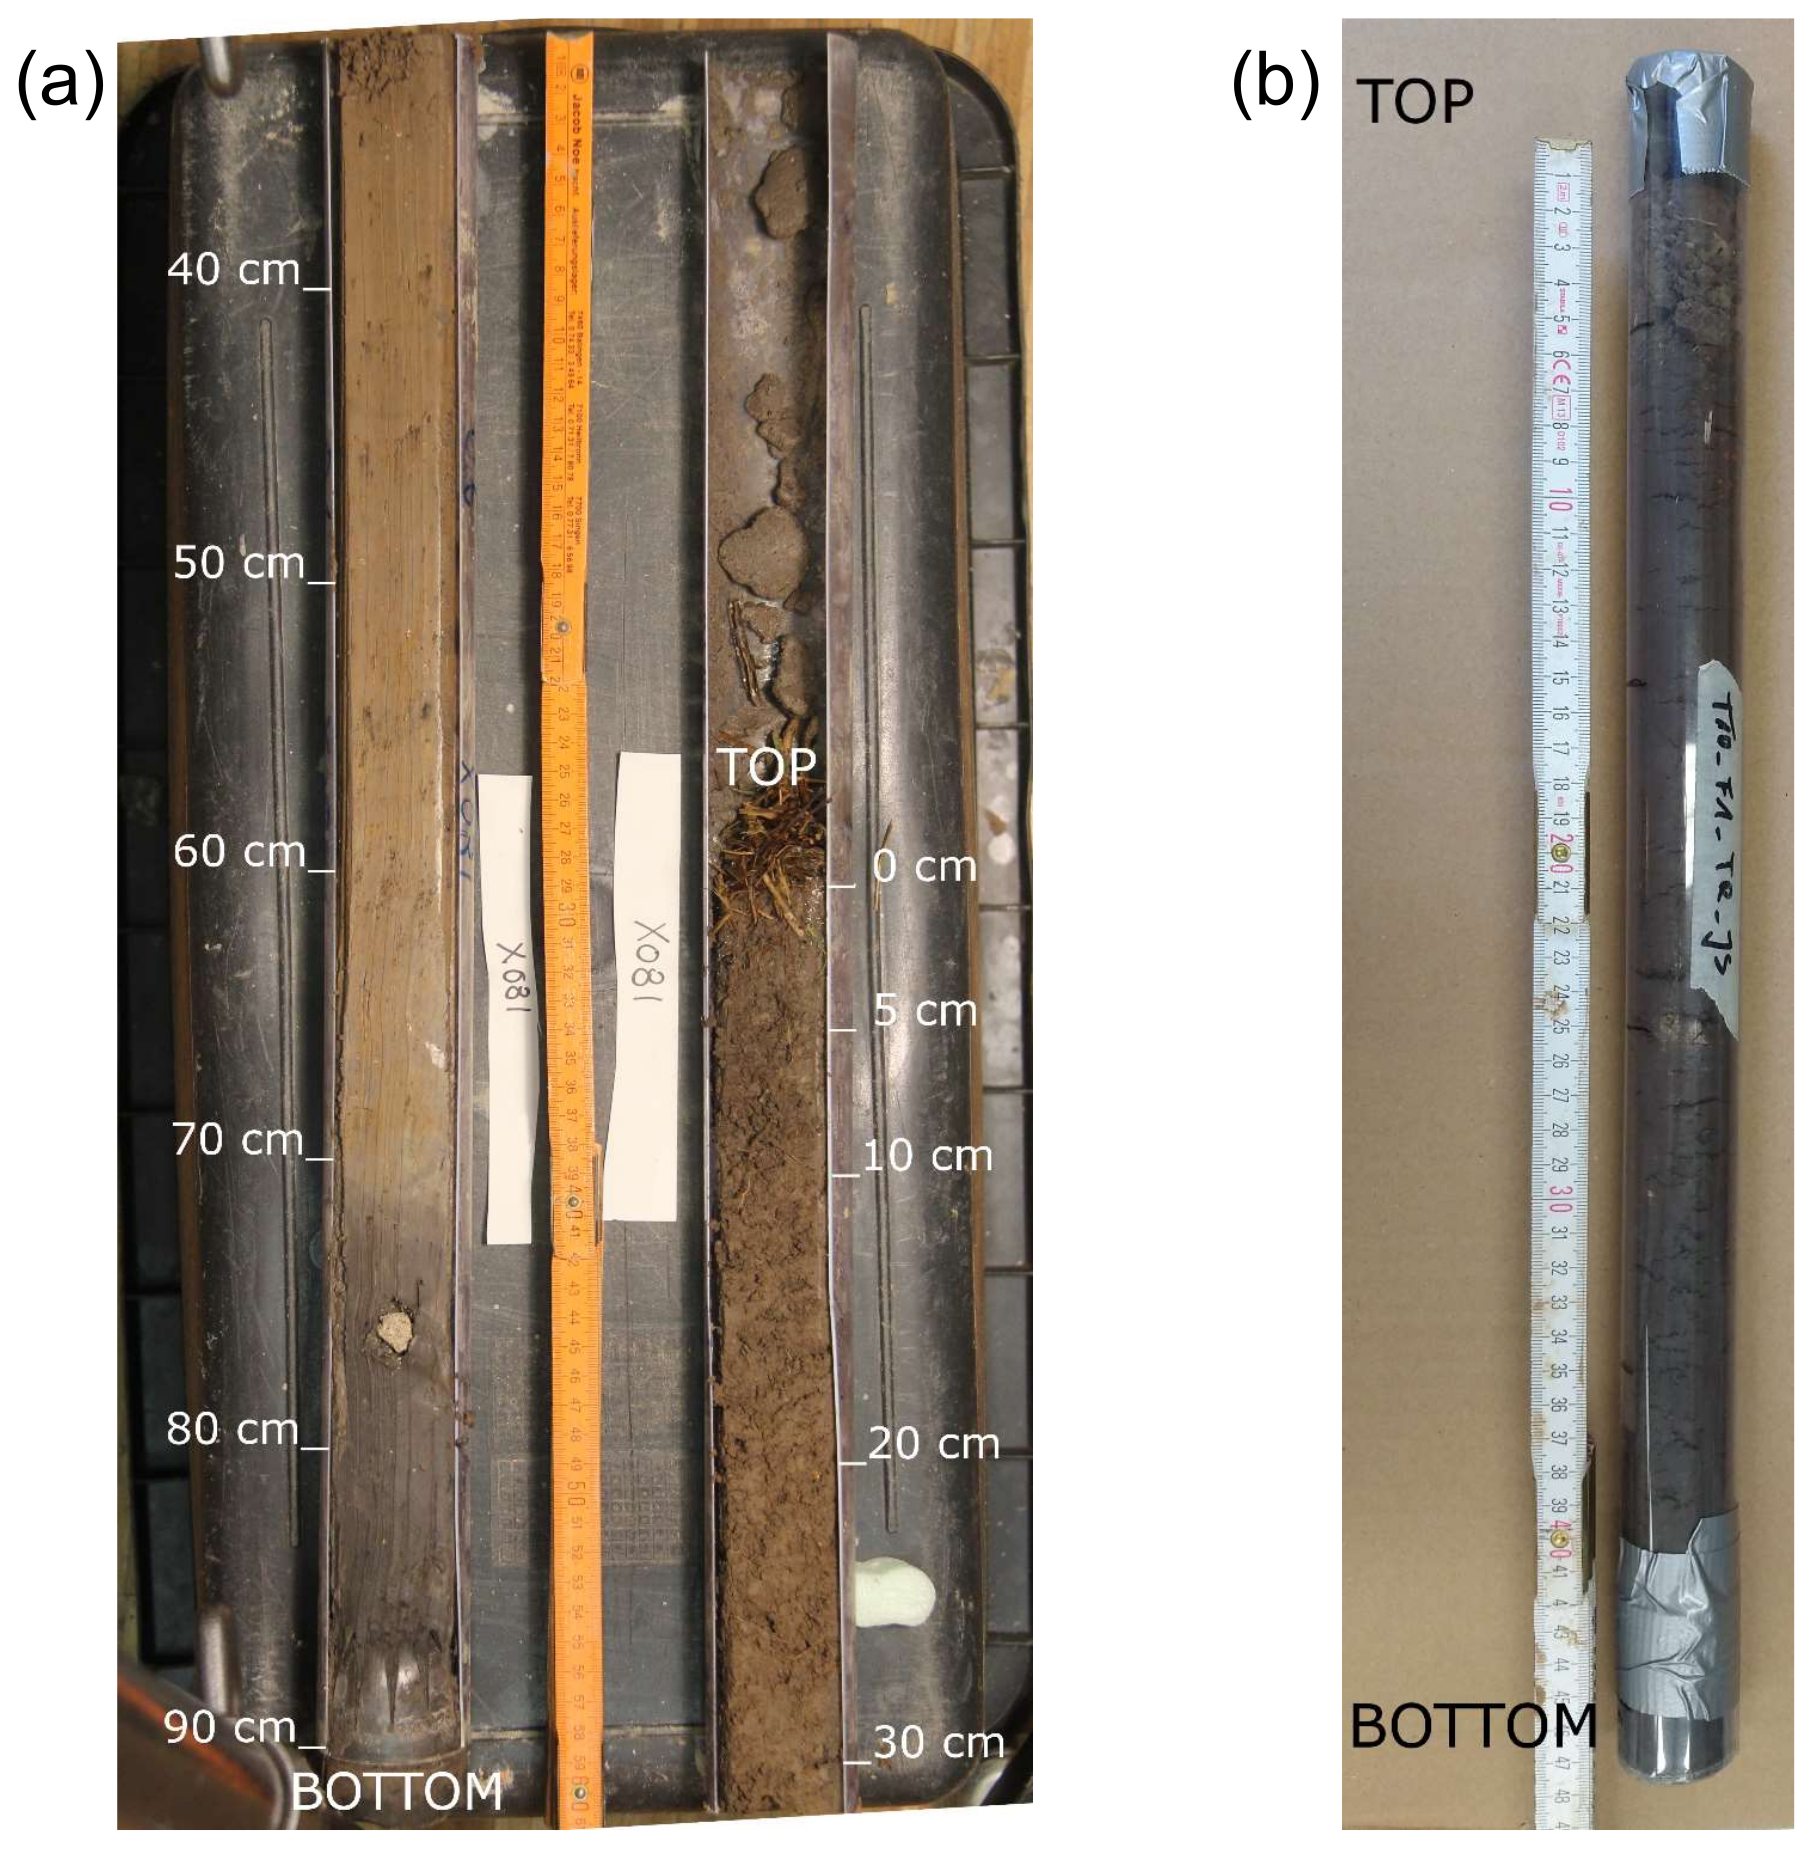
Figure A1(a) Photo of the upper 90 cm soil profile from a location 100 m NW of the study site. A 1.20 m deep core was retrieved with a direct push probe (6610 DT, Geoprobe, Salina, Kansas, US), the core was cut in two parts lengthwise for better visibility of the sediments and crosswise at 0.6 m for taking the photo. The missing 30 cm are due to core loss at the bottom of the core. Depth in cm below ground level is depicted besides the core. The upper 70 cm of the core are of uniform red-brown color until at 71 cm the color abruptly changes to grey marking the transition from the Go to the Gr horizon in this Gleysol. Maximum sampling depth of the presented study was 50 cm, which was well within the Go horizon. (The photo is courtesy of Stefan Klinger and Simon Martin.) (b) Photo of a 50 cm soil core from the presented study (plot D1). The uniform red-brown color is visible through the plastic liner. (Figure reproduced from Schlögl et al. (2022) with permission from the Royal Society of Chemistry.)
B1 Determination of total organic carbon (TOC)
For the analysis of soil organic matter as total organic carbon (TOC), cores from plots D1–3 (Day 10) and from W1–3 (Day 14) were cut into the following segments: 0–5, 5–15, 15–25, 25–35, 35–45, 45–50 cm depth. The corresponding depth segments from all D plots and from all W plots, respectively, were combined and aliquots of 10 g of soil were freeze-dried (CHRIST ALPHA 1–4, CHRIST, Germany) and were ground to a grain size of < 63 µm with a planetary ball mill. One 1 g aliquot of each sample was decalcified with 16 % aqueous HCl and subsequently washed with ultrapure water until reaching at minimum a pH of 5. The sample was again dried and then weighed to determine the amount of inorganic carbon. Inorganic carbon was independently determined by acid titration of a second subsample to ascertain the decalcification.
The dried and decalcified subsample was analyzed for TOC in an elemental analyzer (Elementar vario EL, Elementar, Hanau, Germany) with four replicate measurements per sample. TOC was then normalized to the initial dry weight of the sample and expressed as weight %.
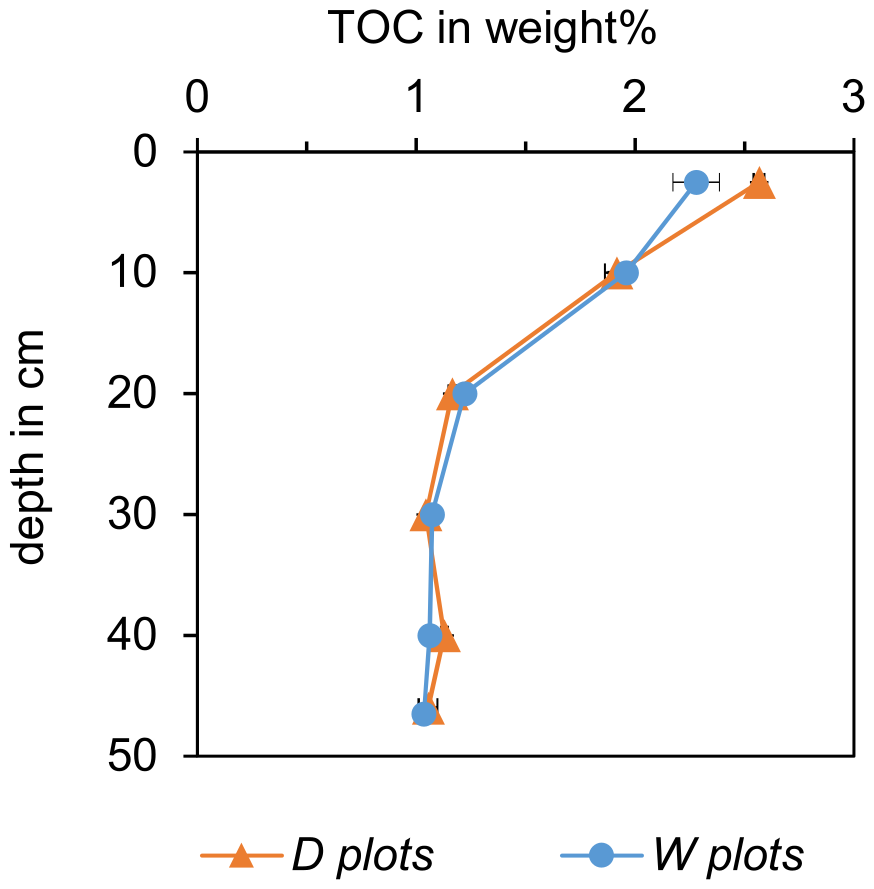
Figure B1Distribution of soil organic carbon (as TOC) in weight % in a 50 cm depth profile of the studied Gleysol on irrigated plots after 14 d of irrigation (W plots, blue dots) and dry control plots (D plots, orange triangles). (Figure reproduced from Schlögl et al. (2022) with permission from the Royal Society of Chemistry.)
C1 Determination of soil texture
For the analysis of grain size distribution, cores from plots D1–3 (Day 10) and from W1–3 (Day 14) were cut into the following segments: 0–5, 5–15, 15–25, 25–35, 35–45, 45–50 cm depth. The corresponding depth segments from all D plots and from all W plots, respectively, were combined. For each depth segment, grain size analysis was conducted following the German Standard (DIN Deutsches Institut für Normung e.V., 2017). Aliquots of 50 g per sample were sieved wet through sieves of 2 mm, 1 mm and 125 µm mesh size to separate the fraction smaller than 125 µm. The fraction bigger than 125 µm was dried and sieved dry through sieves of 500, 250, and 125 µm. The fraction smaller than 125 µm was further analyzed by sedimentation analysis using the integral suspension pressure method (ISP) (Durner et al., 2017) using a PARIO device (Meter Group, Munich, Germany).
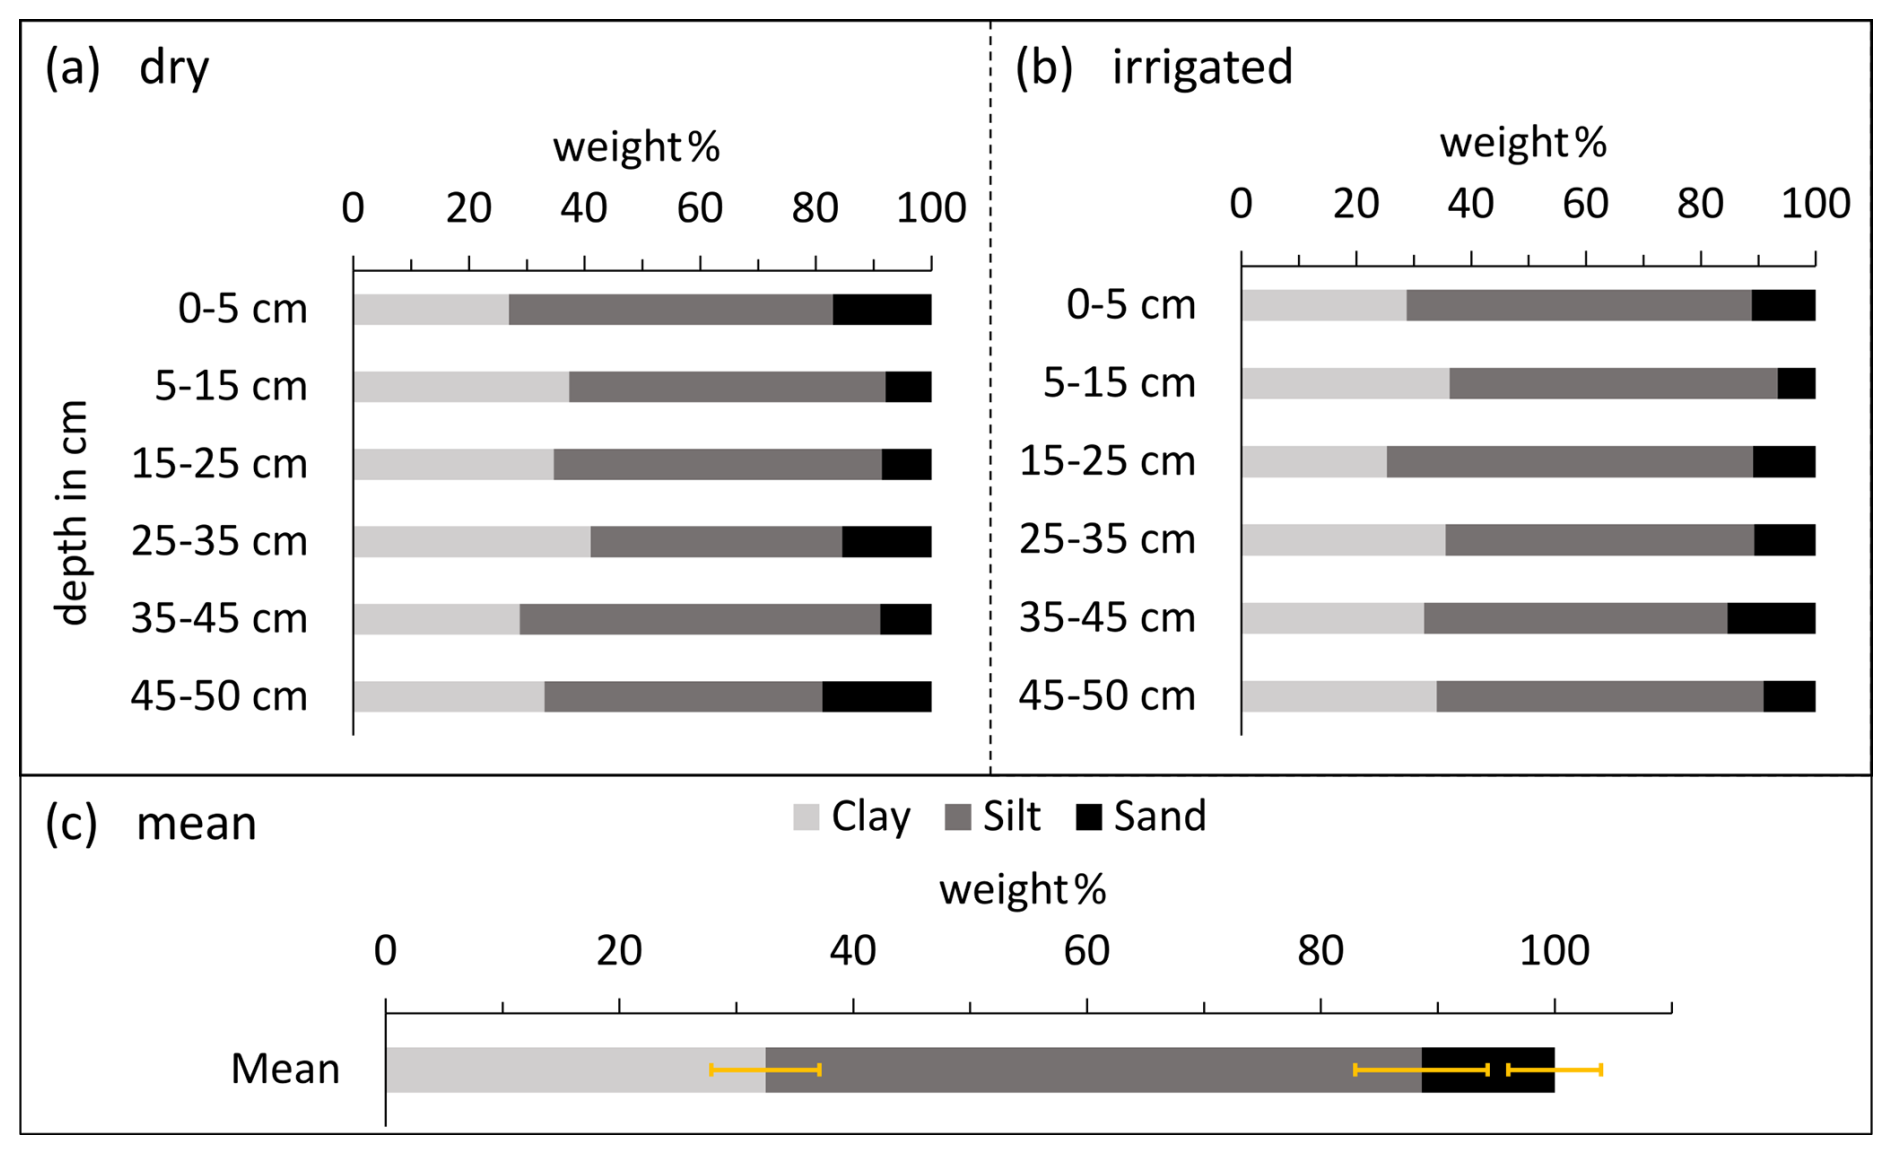
Figure C1Grain size distribution in weight % of clay (light grey), silt (dark grey), and sand (black). (a, b) Grain size distribution in 50 cm soil profiles of the studied Gleysol on dry control plots (a) and irrigated plots (b). (c). Mean values and standard deviations (yellow bars) of the grain size distribution calculated from all samples and depths from dry and irrigated plots (n=12). The soil is a silty clay loam. (Figure reproduced from Schlögl et al. (2022) with permission from the Royal Society of Chemistry.)
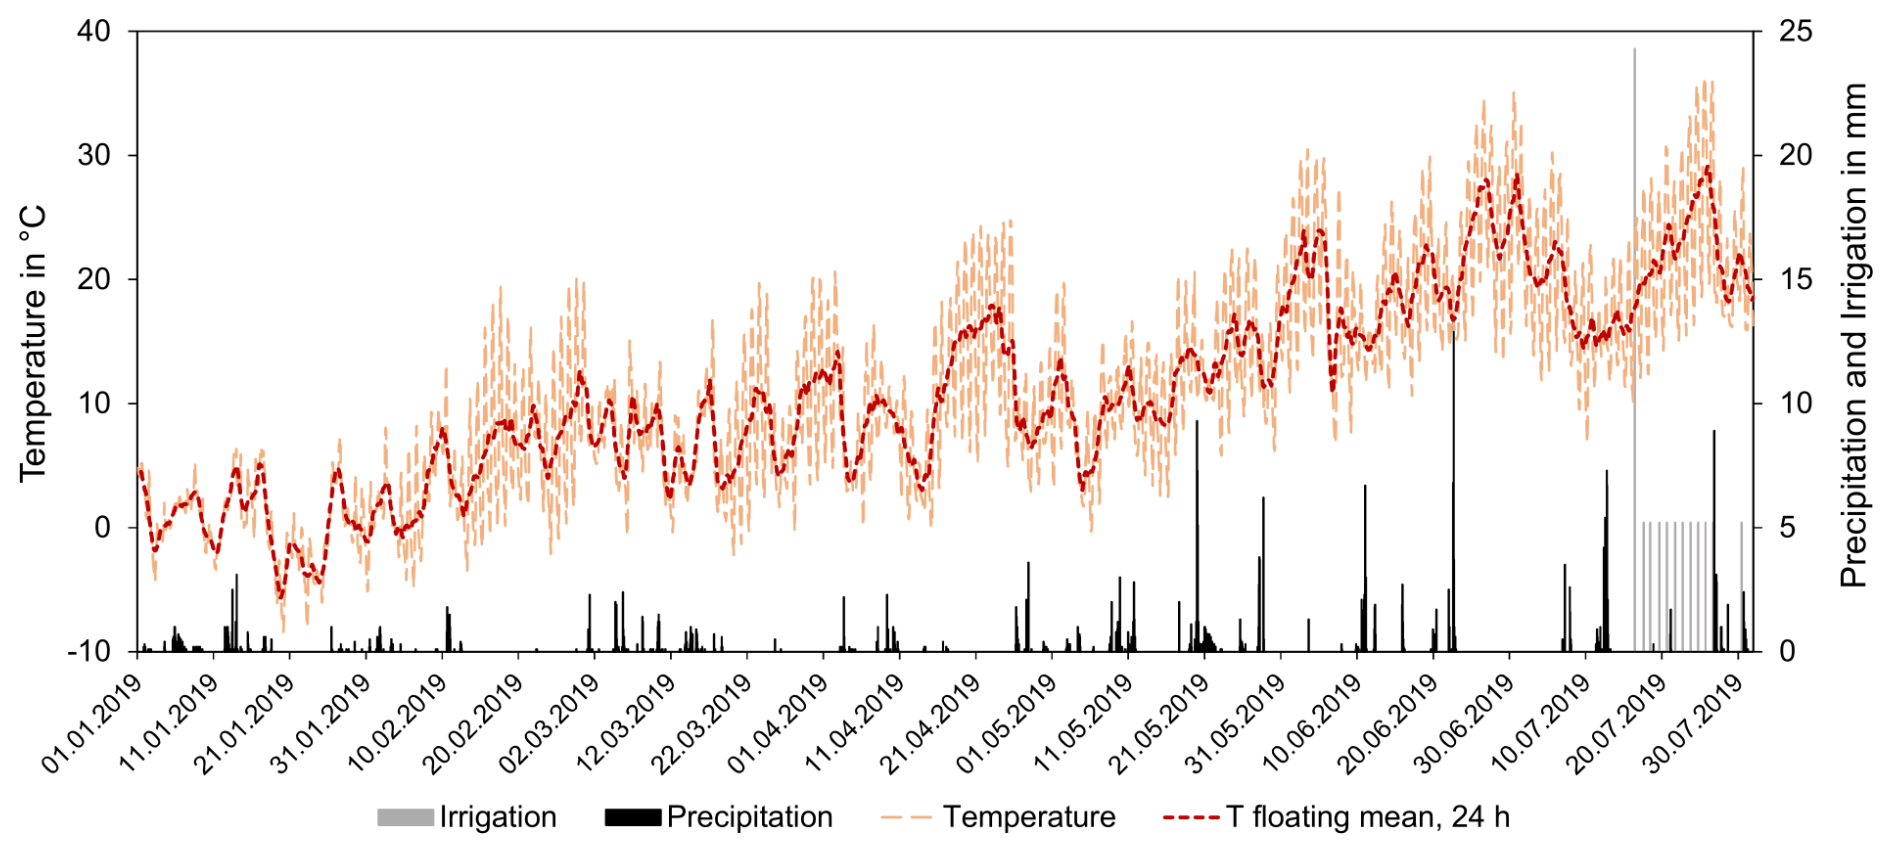
Figure D1Hourly data of temperature (T) in °C (light red line), natural precipitation (black bars) and irrigation (grey bars) in mm and a 24 h floating mean of the temperature in °C for the period from 1 January 2019 until 31 July 2019 from the weather station in Tübingen-Unterjesingen. The experiment took place from 16 July 2019 until 30 July 2019. (Figure reproduced from Schlögl et al. (2022) with permission from the Royal Society of Chemistry.)
The reference evaporation ET0 was calculated according to FAO Irrigation and Drainage Paper No. 56 (Allen et al., 1998).
Table E1Data on temperature (T), relative humidity (RH) and global radiation (Rs) from the weather station in Tübingen-Unterjesingen used for the calculation of the reference evapotranspiration ET0 for the period 1 to 31 July 2019.
The methodology is described in the main text.
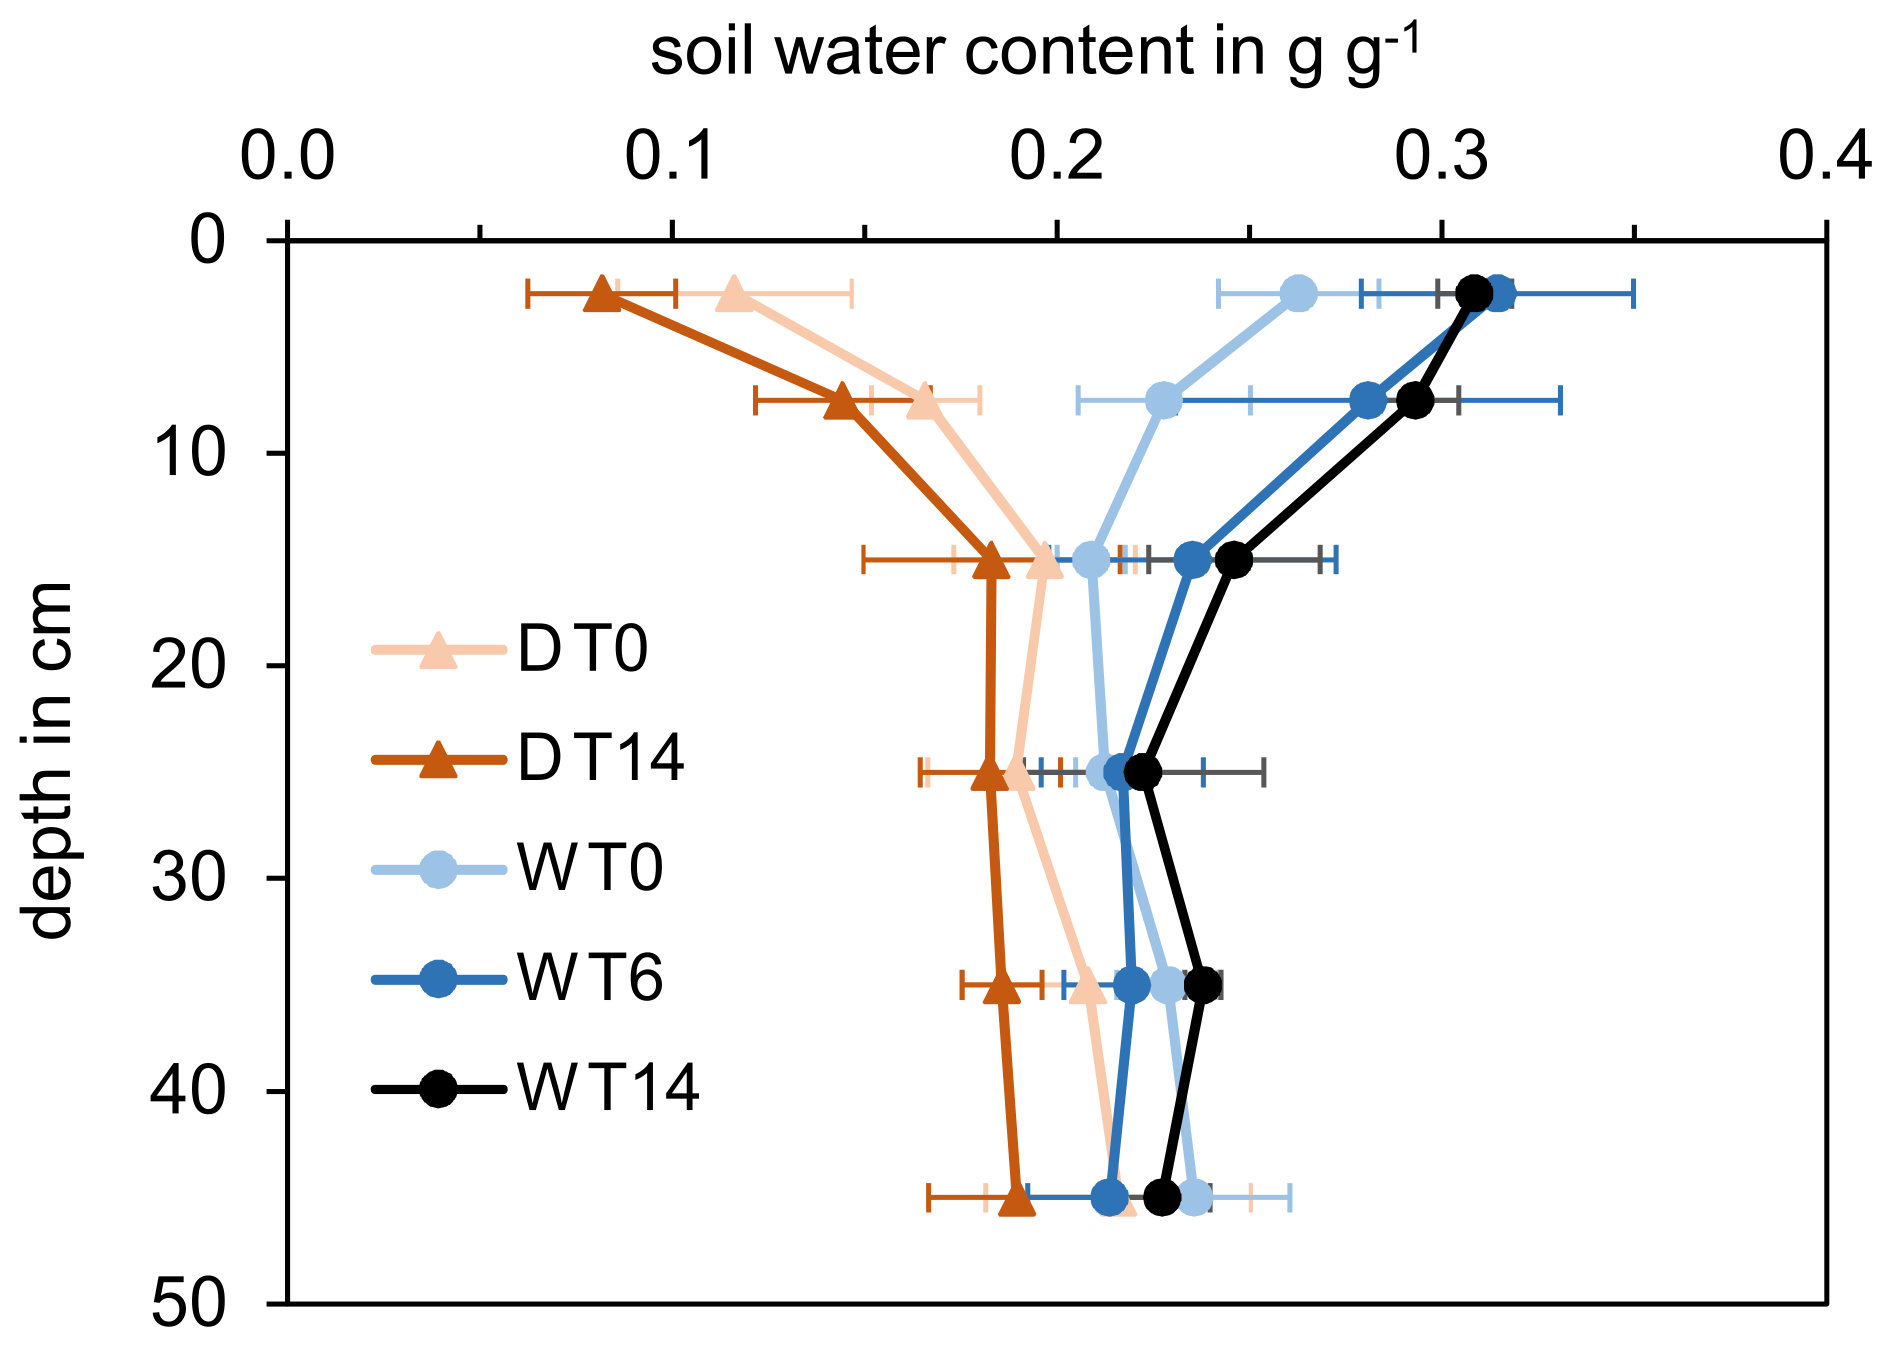
Figure F1Gravimetric soil water content in g g−1 on Dry (D) and irrigated (W) plots on Days 0, 6 and 14 (T0, T, T14). Mean values and standard deviations of replicates from three experimental plots are shown. (Figure reproduced from Schlögl et al. (2022) with permission from the Royal Society of Chemistry.)
G1 Relative sequence abundance
The methodology is described in the main text.
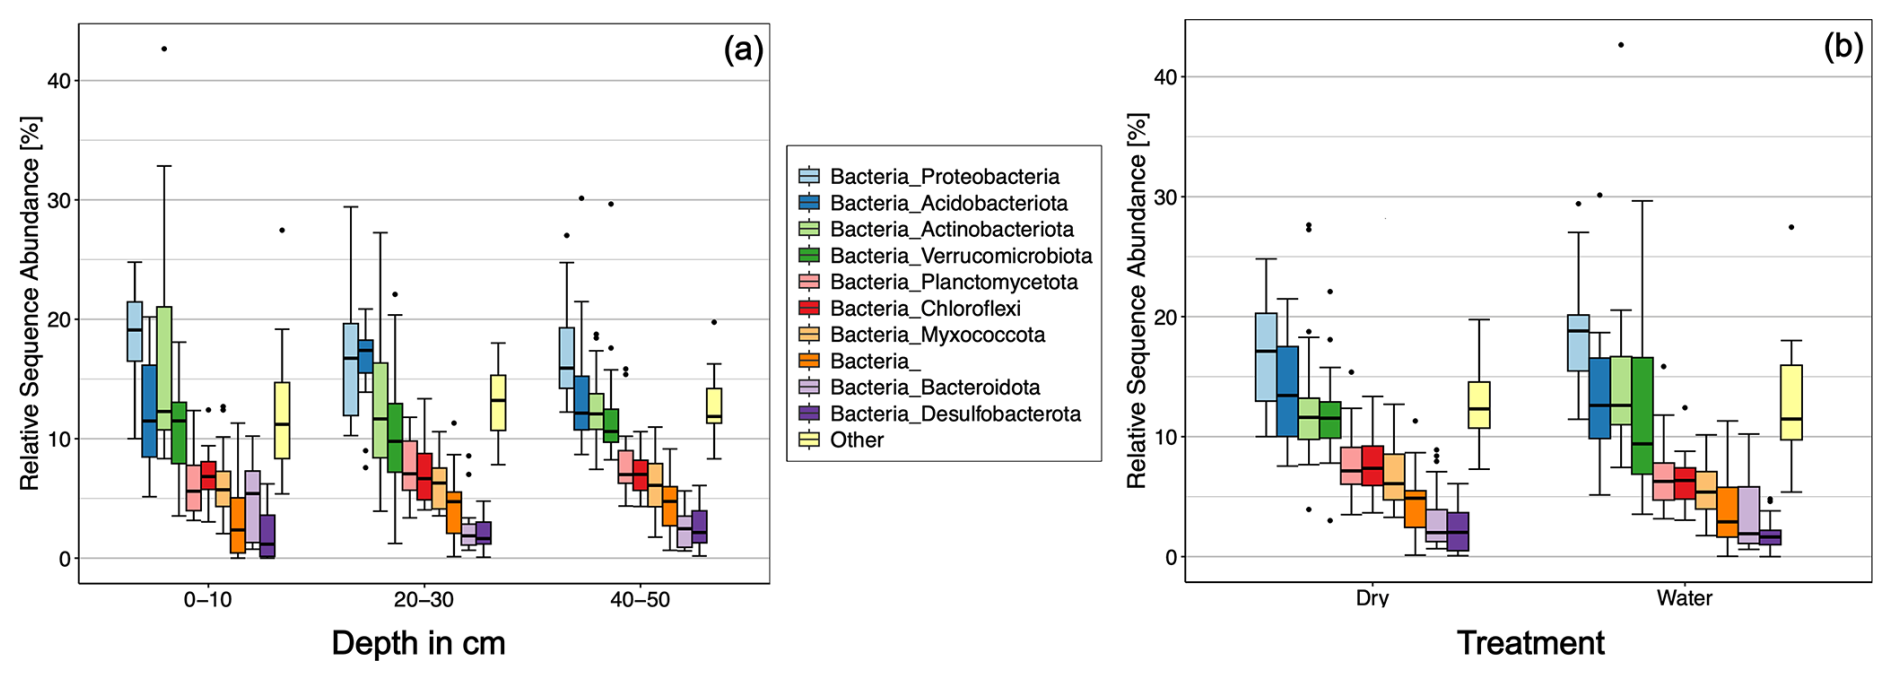
Figure G1Relative sequence abundance of bacteria phyla in the studied soil sorted by depth (a) and treatment (b).
Coefficients of variation were calculated from mean values and standard deviations (n=3) of nitrate and ammonium masses along the soil profile.
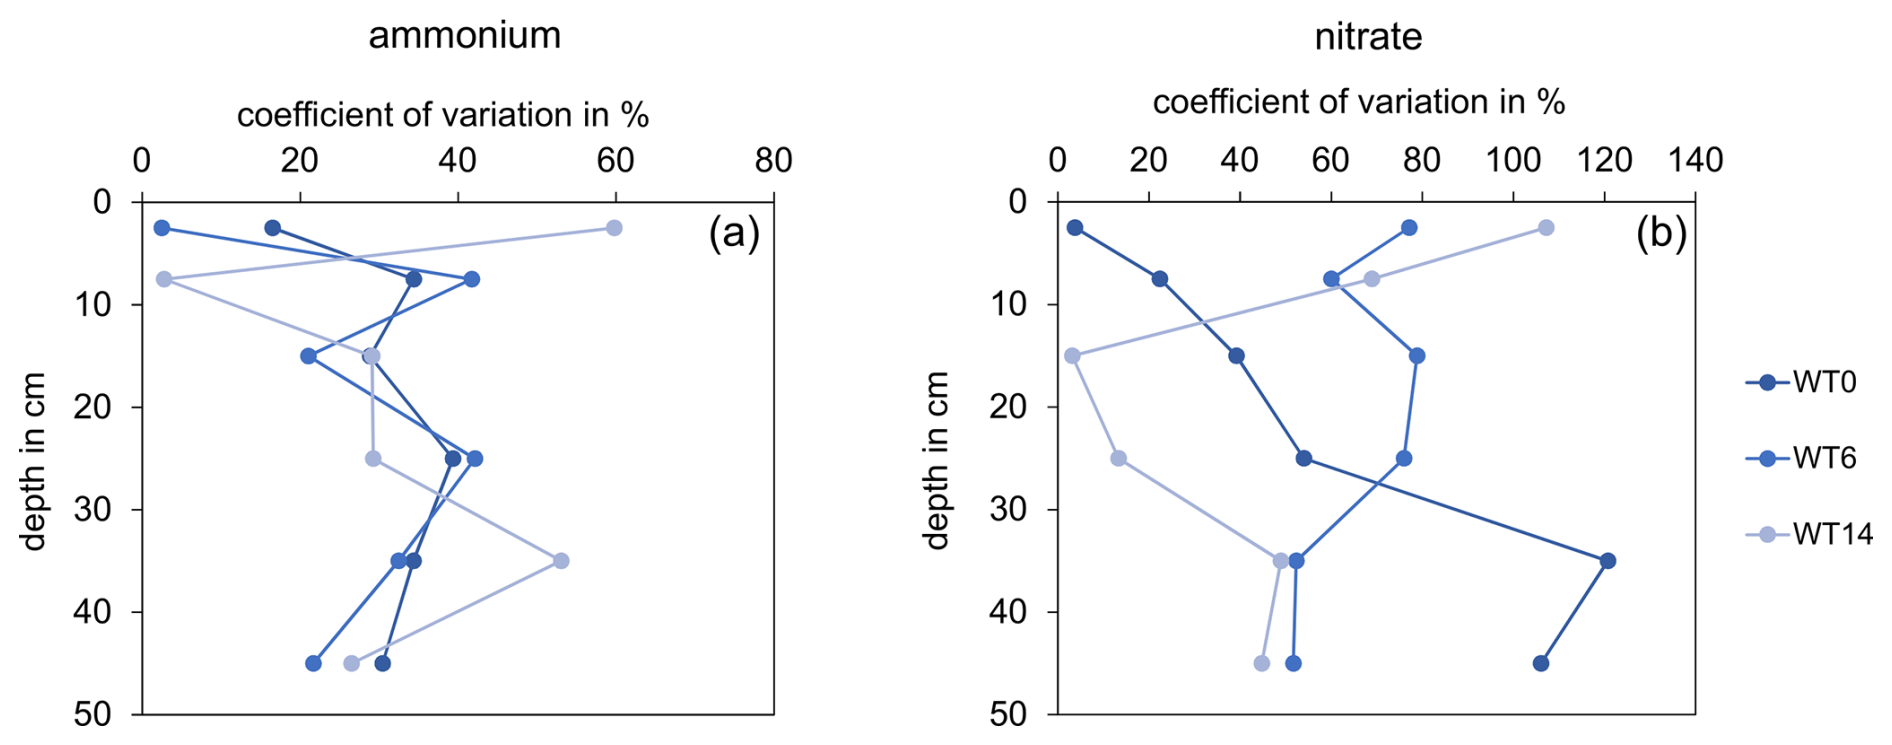
Figure H1Coefficients of variation of ammonium (a) and nitrate (b) masses on W plots at Days T0, T6 and T14.
The atmospheric ammonium-N deposition on the cross-sectional area of an experimental soil core was calculated to evaluate potential sources of ammonium increase observed in the topsoil. Weekly atmospheric ammonium fluxes averaged over one year were taken from Beyn et al. (2014).
Table I1Calculation of the atmospheric ammonium-N deposition on the cross-sectional area of a soil core with a diameter of 3.5 cm within one week.
The atmospheric nitrate-N deposition on the cross-sectional area of an experimental soil core was calculated to evaluate potential sources of nitrate increase observed in the topsoil. Weekly atmospheric nitrate fluxes averaged over one year were taken from Beyn et al. (2014).
Table J1Calculation of the atmospheric nitrate-N deposition on the cross-sectional area of a soil core with a diameter of 3.5 cm within one week.
The data presented in this paper are published in the database of the project “CAMPOS – Catchments as Reactors” at the University of Tübingen, available online (https://doi.org/10.57754/FDAT.qz8p1-3dr53, Schlögl et al., 2026).
Gene amplicon sequencing data, generated by the JMF under Project IDsJMF-2006-4 and JMF-2010-08, were deposited under the BioProject accession number PRJEB87326.
JS: Conceptualization, Methodology, Investigation, Data curation, Formal analysis, Validation, Visualization, Writing – original draft preparation; CK: For the data on microbial community composition: Data curation, Formal analysis, Visualization, Writing – original draft preparation; LC: Conceptualization, Methodology, Investigation (data on microbial community composition), Data curation (data on microbial community composition); WW: Investigation (extracellular enzyme activities), Formal analysis (extracellular enzyme activities), Writing – review and editing; JP: Sample analysis (extracellular enzyme activities), Writing – review and editing; TB: Sample analysis (extracellular enzyme activities), Writing – review and editing; AK: Funding acquisition, Writing – review and editing; SH: Conceptualization, Methodology, Funding acquisition, Project administration, Resources, Writing – review and editing; CG: Conceptualization, Methodology, Funding acquisition, Project administration, Resources, Writing – review and editing.
The contact author has declared that none of the authors has any competing interests.
Publisher's note: Copernicus Publications remains neutral with regard to jurisdictional claims made in the text, published maps, institutional affiliations, or any other geographical representation in this paper. The authors bear the ultimate responsibility for providing appropriate place names. Views expressed in the text are those of the authors and do not necessarily reflect the views of the publisher.
We acknowledge the help of M. Jantz during the preparation of the field experiment, of M. Jantz, T. Siller, F. Straub and D. Sanchez Anaya for assistance during the field work, of M. Engelhardt for analyses of soil texture and total organic carbon and for assistance with the extraction of inorganic nitrogen species, and of H. Schulz for freeze drying of soil samples (all from University of Tübingen). We thank C. Stumpp (University of Natural Resources and Life Sciences, Vienna) for the analysis of soil water stable isotopes and the assistance with the data evaluation, S. Klingler and S. Martin (both University of Tübingen) for providing information on and a photo of one of their cores taken in the Ammer valley, and the landowner for permission to conduct the field work on his farmland.
Financial support was provided by the German Research Foundation by the Collaborative Research Center 1253 CAMPOS Grant Agreement SFB 1253/1 2017 (Project 4: Floodplain Biogeochemistry and Project 6: Controls for the Fate of Agrochemicals in Soils).
This paper was edited by Nicolas Brüggemann and reviewed by Kristin Boye and one anonymous referee.
Aanderud, Z. T., Jones, S. E., Fierer, N., and Lennon, J. T.: Resuscitation of the rare biosphere contributes to pulses of ecosystem activity, Front. Microbiol., 6, https://doi.org/10.3389/fmicb.2015.00024, 2015.
Agrarmeteorologie Baden-Württemberg: Wetterdaten, Station Unterjesingen, https://www.wetter-bw.de/Internet/AM/NotesBwAM.nsf/bwweb/4262596897754529c1257ca8002f9d19?OpenDocument, last access: 14 October 2021.
Allen, R. G., Pereira, L. S., Raes, D., and Smith, M.: FAO Irrigation and drainage paper 56 – Crop evapotranspiration – Guidelines for computing crop water requirements, FAO – Food and Agriculture Organization of the United Nations, Rome, ISBN 92-5-104219-5, 1998.
American Meteorological Society: “Rain”. Glossary of Meteorology, https://glossary.ametsoc.org/wiki/Rain (last access: 29 October 2026), 2026.
Appel, T.: Non-biomass soil organic N – the substrate for N mineralization flushes following soil drying–rewetting and for organic N rendered CaCl2-extractable upon soil drying, Soil Biol. Biochem., 30, 1445–1456, https://doi.org/10.1016/S0038-0717(97)00230-7, 1998.
Armstrong, A., Valverde, A., Ramond, J.-B., Makhalanyane, T. P., Jansson, J. K., Hopkins, D. W., Aspray, T. J., Seely, M., Trindade, M. I., and Cowan, D. A.: Temporal dynamics of hot desert microbial communities reveal structural and functional responses to water input, Sci. Rep., 6, 34434, https://doi.org/10.1038/srep34434, 2016.
Baldwin, D. S. and Mitchell, A. M.: The effects of drying and re-flooding on the sediment and soil nutrient dynamics of lowland river–floodplain systems: a synthesis, Regul. River., 16, 457–467, https://doi.org/10.1002/1099-1646(200009/10)16:5<457::AID-RRR597>3.0.CO;2-B, 2000.
Barnard, R. L., Osborne, C. A., and Firestone, M. K.: Responses of soil bacterial and fungal communities to extreme desiccation and rewetting, ISME J., 7, 2229-2241, https://doi.org/10.1038/ismej.2013.104, 2013.
Beven, K. and Germann, P.: Macropores and water flow in soils revisited, Water Resour. Res., 49, 3071–3092, https://doi.org/10.1002/wrcr.20156, 2013.
Beyn, F., Matthias, V., and Dähnke, K.: Changes in atmospheric nitrate deposition in Germany – An isotopic perspective, Environ. Pollut., 194, 1–10, https://doi.org/10.1016/j.envpol.2014.06.043, 2014.
Birch, H. F.: The effect of soil drying on humus decomposition and nitrogen availability, Plant Soil, 10, 9–31, https://doi.org/10.1007/BF01343734, 1958.
Birch, H. F.: Nitrification in soils after different periods of dryness, Plant Soil, 12, 81–96, https://doi.org/10.1007/BF01377763, 1960.
Blazewicz, S. J., Schwartz, E., and Firestone, M. K.: Growth and death of bacteria and fungi underlie rainfall-induced carbon dioxide pulses from seasonally dried soil, Ecology, 95, 1162–1172, https://doi.org/10.1890/13-1031.1, 2014.
Blume, H.-P., Brümmer, G. W., Fleige, H., Horn, R., Kandeler, E., Kögel-Knabner, I., Kretzschmar, R., Stahr, K., and Wilke, B.-M.: Scheffer/Schachtschabel Soil Science, Springer, Berlin, Heidelberg, Berlin, Heidelberg, XVIII, 618 pp., https://doi.org/10.1007/978-3-642-30942-7, 2016.
Bronswijk, J. J. B., Hamminga, W., and Oostindie, K.: Rapid nutrient leaching to groundwater and surface water in clay soil areas, Eur. J. Agron., 4, 431–439, https://doi.org/10.1016/S1161-0301(14)80095-6, 1995.
Buss, S., Herbert, A., Morgan, P., Thornton, S., and Smith, J.: A Review of Ammonium Attenuation in Soil and Groundwater, Q. J. Eng. Geol. Hydroge., 37, 347–359, https://doi.org/10.1144/1470-9236/04-005, 2004.
Callahan, B. J., McMurdie, P. J., and Holmes, S. P.: Exact sequence variants should replace operational taxonomic units in marker-gene data analysis, ISME J., 11, 2639–2643, https://doi.org/10.1038/ismej.2017.119, 2017.
Carini, P., Marsden, P. J., Leff, J. W., Morgan, E. E., Strickland, M. S., and Fierer, N.: Relic DNA is abundant in soil and obscures estimates of soil microbial diversity, Nat. Microbiol., 2, 16242, https://doi.org/10.1038/nmicrobiol.2016.242, 2016.
Cavalli, D., Consolati, G., Marino, P., and Bechini, L.: Measurement and simulation of soluble, exchangeable, and non-exchangeable ammonium in three soils, Geoderma, 259–260, 116–125, https://doi.org/10.1016/j.geoderma.2015.05.011, 2015.
Coby, A. J., Picardal, F., Shelobolina, E., Xu, H., and Roden, E. E.: Repeated anaerobic microbial redox cycling of iron, Appl. Environ. Microb., 77, 6036–6042, https://doi.org/10.1128/AEM.00276-11, 2011.
Coumou, D. and Rahmstorf, S.: A decade of weather extremes, Nat. Clim. Change, 2, 491–496, https://doi.org/10.1038/nclimate1452, 2012.
Cui, M. and Caldwell, M. M.: A large ephemeral release of nitrogen upon wetting of dry soil and corresponding root responses in the field, Plant Soil, 191, 291–299, https://doi.org/10.1023/A:1004290705961, 1997.
DIN Deutsches Institut für Normung e.V.: DIN EN ISO 17892-4 Geotechnical investigation and testing – Laboratory testing of soil – Part 4: Determination of particle size distribution, Beuth, Berlin, 7, https://doi.org/10.3403/30295182, 2017.
Durner, W., Iden, S. C., and von Unold, G.: The integral suspension pressure method (ISP) for precise particle-size analysis by gravitational sedimentation, Water Resour. Res., 53, 33–48, https://doi.org/10.1002/2016WR019830, 2017.
Fierer, N. and Schimel, J. P.: Effects of drying–rewetting frequency on soil carbon and nitrogen transformations, Soil Biol. Biochem., 34, 777–787, https://doi.org/10.1016/S0038-0717(02)00007-X, 2002.
Fierer, N., Schimel, J. P., and Holden, P. A.: Influence of Drying–Rewetting Frequency on Soil Bacterial Community Structure, Microb. Ecol., 45, 63–71, https://doi.org/10.1007/s00248-002-1007-2, 2003.
German Meteorological Service (DWD): Monatliche Mittel/Summen, Niederschlag, Station Stuttgart-Echterdingen, https://www.dwd.de/DE/leistungen/kvo/baden_wuerttemberg.html?nn=480164, last access: 2 February 2024.
Geyer, O. F., Gwinner, M. P., Geyer, M., Nitsch, E., and Simon, T.: Geologie von Baden-Württemberg, ISBN 978-3-510-65267-9, 2011.
Grathwohl, P., Rügner, H., Wöhling, T., Osenbrück, K., Schwientek, M., Gayler, S., Wollschläger, U., Selle, B., Pause, M., Delfs, J.-O., Grzeschik, M., Weller, U., Ivanov, M., Cirpka, O. A., Maier, U., Kuch, B., Nowak, W., Wulfmeyer, V., Warrach-Sagi, K., Streck, T., Attinger, S., Bilke, L., Dietrich, P., Fleckenstein, J. H., Kalbacher, T., Kolditz, O., Rink, K., Samaniego, L., Vogel, H.-J., Werban, U., and Teutsch, G.: Catchments as reactors: a comprehensive approach for water fluxes and solute turnover, Environ. Earth Sci., 69, 317–333, https://doi.org/10.1007/s12665-013-2281-7, 2013.
Hefting, M., Clément, J. C., Dowrick, D., Cosandey, A. C., Bernal, S., Cimpian, C., Tatur, A., Burt, T. P., and Pinay, G.: Water table elevation controls on soil nitrogen cycling in riparian wetlands along a European climatic gradient, Biogeochemistry, 67, 113–134, https://doi.org/10.1023/B:BIOG.0000015320.69868.33, 2004.
Horton, R. M., Mankin, J. S., Lesk, C., Coffel, E., and Raymond, C.: A Review of Recent Advances in Research on Extreme Heat Events, Current Climate Change Reports, 2, 242–259, https://doi.org/10.1007/s40641-016-0042-x, 2016.
ISO 13395: Water quality – Determination of nitrite nitrogen and nitrate nitrogen and the sum of both by flow analysis (CFA and FIA) and spectrometric detection International Organization for Standardization (ISO), Geneva, Switzerland, https://doi.org/10.31030/7304958, 1996.
ISO 11732: Water quality – Determination of ammonium nitrogen – Method by flow analysis (CFA and FIA) and spectrometric detection International Organization for Standardization (ISO), Geneva, Switzerland, 2005.
Jarvis, N., Koestel, J., and Larsbo, M.: Understanding Preferential Flow in the Vadose Zone: Recent Advances and Future Prospects, Vadose Zone J., 15, 1–11, https://doi.org/10.2136/vzj2016.09.0075, 2016.
Jarvis, P., Rey, A., Petsikos, C., Wingate, L., Rayment, M., Pereira, J., Banza, J., David, J., Miglietta, F., Borghetti, M., Manca, G., and Valentini, R.: Drying and wetting of Mediterranean soils stimulates decomposition and carbon dioxide emission: the “Birch effect”, Tree Physiol., 27, 929–940, https://doi.org/10.1093/treephys/27.7.929, 2007.
Kelly, B. P. and Pomes, M. L.: Preferential Flow and Transport of Nitrate and Bromide in Clay pan Soil, Groundwater, 36, 484–494, https://doi.org/10.1111/j.1745-6584.1998.tb02820.x, 1998.
Lair, G. J., Zehetner, F., Fiebig, M., Gerzabek, M. H., Van Gestel, C. A. M., Hein, T., Hohensinner, S., Hsu, P., Jones, K. C., Jordan, G., and Koelmans, A. A.: How do long-term development and periodical changes of river-floodplain systems affect the fate of contaminants? Results from European rivers, Environ. Pollut., 157, 3336–3346, https://doi.org/10.1016/j.envpol.2009.06.004, 2009.
Lennon, J. T., Muscarella, M. E., Placella, S. A., and Lehmkuhl, B. K.: How, when, and where relic DNA affects microbial diversity, mBio, 9, https://doi.org/10.1128/mbio.00637-18, 2018.
Mansfeldt, T.: In situ long-term redox potential measurements in a dyked marsh soil, J. Plant Nutr. Soil Sc., 166, 210–219, https://doi.org/10.1002/jpln.200390031, 2003.
Martin, S., Klingler, S., Dietrich, P., Leven, C., and Cirpka, O. A.: Structural controls on the hydrogeological functioning of a floodplain, Hydrogeol. J., 28, 2675–2696, https://doi.org/10.1007/s10040-020-02225-8, 2020.
Maxwell, T. L., Canarini, A., Bigdanovic, I., Böckle, T., Martin, V., Noll, L., Prommer, J., Seneca, J., Simon, E., Piepho, H.-P., Herndl, M., Pötsch, E. M., Kaiser, C., Richter, A., Bahn, M., and Wanek, W.: Contrasting drivers of belowground nitrogen cycling in a montane grassland exposed to a multifactorial global change experiment with elevated CO2, warming, and drought, Glob. Change Biol., 28, 2425–2441, https://doi.org/10.1111/gcb.16035, 2022.
Moche, M., Gutknecht, J., Schulz, E., Langer, U., and Rinklebe, J.: Monthly dynamics of microbial community structure and their controlling factors in three floodplain soils, Soil Biol. Biochem., 90, 169–178, https://doi.org/10.1016/j.soilbio.2015.07.006, 2015.
Nimmo, J. R.: The processes of preferential flow in the unsaturated zone, Soil Sci. Soc. Am. J., 85, 1–27, https://doi.org/10.1002/saj2.20143, 2021.
Perkins, S. E., Alexander, L. V., and Nairn, J. R.: Increasing frequency, intensity and duration of observed global heatwaves and warm spells, Geophys. Res. Lett., 39, https://doi.org/10.1029/2012GL053361, 2012.
Pjevac, P., Schauberger, C., Poghosyan, L., Herbold, C. W., van Kessel, M. A. H. J., Daebeler, A., Steinberger, M., Jetten, M. S. M., Lücker, S., Wagner, M., and Daims, H.: AmoA-Targeted Polymerase Chain Reaction Primers for the Specific Detection and Quantification of Comammox Nitrospira in the Environment, Front. Microbiol., 8, https://doi.org/10.3389/fmicb.2017.01508, 2017.
Rinklebe, J. and Langer, U.: Microbial diversity in three floodplain soils at the Elbe River (Germany), Soil Biol. Biochem., 38, 2144–2151, https://doi.org/10.1016/j.soilbio.2006.01.018, 2006.
Saetre, P. and Stark, J. M.: Microbial dynamics and carbon and nitrogen cycling following re-wetting of soils beneath two semi-arid plant species, Oecologia, 142, 247–260, https://doi.org/10.1007/s00442-004-1718-9, 2005.
Schimel, J. P.: Life in Dry Soils: Effects of Drought on Soil Microbial Communities and Processes, Annu. Rev. Ecol. Evol. S., 49, 409–432, https://doi.org/10.1146/annurev-ecolsys-110617-062614, 2018.
Schlögl, J., Wimmer, B., Cramaro, L., Wirsching, J., Poll, C., Pagel, H., Kandeler, E., Huhn, C., Griebler, C., Stumpp, C., and Haderlein, S. B.: Heavy rainfall following a summer drought stimulates soil redox dynamics and facilitates rapid and deep translocation of glyphosate in floodplain soils, Environ. Sci.-Proc. Imp., 24, 825–838, https://doi.org/10.1039/D1EM00527H, 2022.
Schlögl, J., Karwautz, C., Cramaro, L., Wanek, W., Prommer, J., Böckle, T., Kappler, A., Haderlein, S., and Griebler, C.: Data from an irrigation experiment in the Ammer valley 2019 – Data on soil nitrate and ammonium, and extracellular enzyme activities, University of Tübingen [data set], https://doi.org/10.57754/FDAT.qz8p1-3dr53, 2026.
' Schwientek, M., Osenbrück, K., and Fleischer, M.: Investigating hydrological drivers of nitrate export dynamics in two agricultural catchments in Germany using high-frequency data series, Environ. Earth Sci., 69, 381–393, https://doi.org/10.1007/s12665-013-2322-2, 2013.
Tian, Y., Schindlbacher, A., Malo, C. U., Shi, C., Heinzle, J., Kwatcho Kengdo, S., Inselsbacher, E., Borken, W., and Wanek, W.: Long-term warming of a forest soil reduces microbial biomass and its carbon and nitrogen use efficiencies, Soil Biol. Biochem., 184, 109109, https://doi.org/10.1016/j.soilbio.2023.109109, 2023.
Tournier, E., Amenc, L., Pablo, A. L., Legname, E., Blanchart, E., Plassard, C., Robin, A., and Bernard, L.: Modification of a commercial DNA extraction kit for safe and rapid recovery of DNA and RNA simultaneously from soil, without the use of harmful solvents, MethodsX, 2, 182–191, https://doi.org/10.1016/j.mex.2015.03.007, 2015.
Unger, S., Máguas, C., Pereira, J. S., David, T. S., and Werner, C.: The influence of precipitation pulses on soil respiration – Assessing the “Birch effect” by stable carbon isotopes, Soil Biol. Biochem., 42, 1800–1810, https://doi.org/10.1016/j.soilbio.2010.06.019, 2010.
Veach, A. M. and Zeglin, L. H.: Historical Drought Affects Microbial Population Dynamics and Activity During Soil Drying and Re-Wet, Microb. Ecol., 79, 662–674, https://doi.org/10.1007/s00248-019-01432-5, 2020.
Venterink, H. O., Wiegman, F., Van der Lee, G. E. M., and Vermaat, J. E.: Role of Active Floodplains for Nutrient Retention in the River Rhine, J. Environ. Qual., 32, 1430–1435, https://doi.org/10.2134/jeq2003.1430, 2003.
Vos, M., Wolf, A. B., Jennings, S. J., and Kowalchuk, G. A.: Micro-scale determinants of bacterial diversity in soil, FEMS Microbiol. Rev., 37, 936–954, https://doi.org/10.1111/1574-6976.12023, 2013.
Wassenaar, L. I., Hendry, M. J., Chostner, V. L., and Lis, G. P.: High Resolution Pore Water δ2H and δ18O Measurements by H2O(liquid)−H2O(vapor) Equilibration Laser Spectroscopy, Environ. Sci. Technol., 42, 9262–9267, https://doi.org/10.1021/es802065s, 2008.
Wirsching, J., Wimmer, B., Ditterich, F., Schlögl, J., Martin-Laurent, F., Huhn, C., Haderlein, S., Kandeler, E., and Poll, C.: 13C assimilation as well as functional gene abundance and expression elucidate the biodegradation of glyphosate in a field experiment, Environ. Pollut., 306, 119382, https://doi.org/10.1016/j.envpol.2022.119382, 2022.
- Abstract
- Introduction
- Materials and Methods
- Results
- Discussion
- Conclusions
- Appendix A: Soil profile in a soil core from the Ammer valley
- Appendix B: Soil organic matter
- Appendix C: Soil texture
- Appendix D: Weather data
- Appendix E: Calculation of reference evapotranspiration ET0
- Appendix F: Gravimetric soil water content
- Appendix G: Microbial community analysis
- Appendix H: Coefficients of variation of nitrate and ammonium masses on W plots
- Appendix I: Calculation atmospheric ammonium-N deposition
- Appendix J: Calculation atmospheric nitrate-N deposition
- Data availability
- Author contributions
- Competing interests
- Disclaimer
- Acknowledgements
- Financial support
- Review statement
- References
- Abstract
- Introduction
- Materials and Methods
- Results
- Discussion
- Conclusions
- Appendix A: Soil profile in a soil core from the Ammer valley
- Appendix B: Soil organic matter
- Appendix C: Soil texture
- Appendix D: Weather data
- Appendix E: Calculation of reference evapotranspiration ET0
- Appendix F: Gravimetric soil water content
- Appendix G: Microbial community analysis
- Appendix H: Coefficients of variation of nitrate and ammonium masses on W plots
- Appendix I: Calculation atmospheric ammonium-N deposition
- Appendix J: Calculation atmospheric nitrate-N deposition
- Data availability
- Author contributions
- Competing interests
- Disclaimer
- Acknowledgements
- Financial support
- Review statement
- References