the Creative Commons Attribution 4.0 License.
the Creative Commons Attribution 4.0 License.
 | 30 Jan 2026
Carbon sequestration along a gradient of tidal marsh degradation in response to sea level rise
Mona Huyzentruyt
Maarten Wens
Gregory S. Fivash
David Walters
Steven Bouillon
Joel Carr
Glenn Guntenspergen
Matt L. Kirwan
Stijn Temmerman
Tidal marshes are considered one of the world's most efficient ecosystems for belowground organic carbon sequestration and hence climate mitigation. Marsh systems are however also vulnerable to degradation due to climate-induced sea level rise, whereby marsh vegetation conversion to open water often follows distinct spatial patterns: levees (i.e. marsh zones < 10 m from tidal creeks) show lower vulnerability of vegetation conversion to open water than basins (i.e. interior marsh zones > 30 m from creeks). Here, we use sediment cores to investigate spatial variations in organic carbon accumulation rates (OCAR) in a microtidal system (Blackwater marshes, Maryland, USA): (1) across a gradient of marsh zones with increasing marsh degradation, assessed as increasing ratio of unvegetated versus vegetated marsh area and (2) by comparing levees versus basins. We show that OCAR is up to four times higher on marsh levees than in adjacent basins. The data suggest that this is caused by spatial variation in three processes: sediment accretion rate, vegetation productivity, and sediment compaction, which are all higher on levees. Additionally, OCAR was observed to increase with increasing degree of marsh degradation in response to sea level rise. We hypothesize this may be due to more soil waterlogging in more degraded marsh zones, which may decrease carbon decomposition. Our results highlight that tidal marsh levees, in a microtidal system, are among the fastest soil organic carbon sequestration systems on Earth, and that both levees and basins sustain their carbon accumulation rate along gradients of increasing marsh degradation in response to sea level rise.
- Article
(3670 KB) - Full-text XML
- Companion paper
-
Supplement
(777 KB) - BibTeX
- EndNote


Tidal marsh ecosystems are among the most efficient ecosystems on Earth in terms of long-term carbon sequestration per surface area, with an average organic carbon accumulation rate (OCAR) of 250 g m−2 yr−1 and high-end values up to 1800 g m−2 yr−1 (Huyzentruyt et al., 2024; Temmink et al., 2022). This efficiency stems from the fact that the organic carbon can originate from two main sources: (1) locally produced carbon by highly productive marsh vegetation and (2) externally derived (e.g. terrestrial or marine) carbon supplied as suspended matter in the water and deposited by tidal inundation (McLeod et al., 2011; Middelburg et al., 1997; Williamson et al., 2025). Additionally, due to tidal inundation, the marsh sediment bed is waterlogged for a large part of the tidal cycle, reducing the amount of oxygen available for carbon decomposition (Luo et al., 2019). A final reason for their high carbon sequestration efficiency is that as more sediment is accreted on the marsh surface, the previous layers get buried and reach more anoxic soil environments, which slows down the mineralisation of the present soil organic carbon (Kirwan and Mudd, 2012; Müller and Suess, 1979; Van de Broek et al., 2016).
The long-term stability of tidal marsh systems is impacted by anthropogenic and natural processes, and how this affects their carbon sequestration efficiency remains relatively poorly studied. One of the major threats that these systems are facing is climate-change induced sea level rise (Craft et al., 2009; Day et al., 2024; Kirwan and Megonigal, 2013; Morris et al., 2002; Schuerch et al., 2018). On the one hand certain marshes can keep up with sea level rise, due to positive feedbacks between tidal inundation duration, sediment accretion, and surface elevation gain, in particular macro-tidal marshes with high sediment supply (Kirwan et al., 2016). For such marsh sites previous studies have found an increase in organic carbon accumulation rate with increasing sea level rise rate, due to the earlier mentioned positive feedback increasing the organic carbon accumulation rate (Herbert et al., 2021; Huyzentruyt et al., 2024; Suello et al., 2025; Wang et al., 2021). On the other hand, there are marsh sites where sediment accretion rates cannot keep up with the local relative sea level rise rate, which is a particular risk in micro-tidal marshes with limited sediment supply and high rates of relative sea level rise (Kirwan et al., 2016). This is for instance the case in the Chesapeake Bay (Ganju et al., 2013; Kearney et al., 1988; Qi et al., 2021; Schepers et al., 2017), the Mississippi River delta (DeLaune and White, 2012; Herbert et al., 2021; Ortiz et al., 2017) and the Venice Lagoon (Fagherazzi et al., 2006). A global scale study has estimated that coastal wetland (mangrove and marsh) loss will range between 0 % and 30 % by 2100 (Schuerch et al., 2018). Within these systems, certain marsh zones are experiencing sediment accretion rates that are too low to keep up with sea level rise, resulting in increasing tidal inundation stress on marsh vegetation, reduced vegetation productivity and eventually vegetation die-off. The resulting bare soil patches or shallow ponds that form inside marshes, and their surface area relative to the surrounding remaining vegetated marsh area (so-called unvegetated-vegetated ratio, UVVR), is considered here a proxy for the state or degree of marsh degradation (with higher UVVR indicating a higher degree of degradation), in line with previous studies (Ganju et al., 2017). An important question is how this degree of marsh degradation (measured as UVVR) in response to sea level rise affects the organic carbon sequestration efficiency in the remaining vegetated marsh zones.
Marshes with a sediment accretion deficit lose elevation relative to the rising sea level and hence experience increasing tidal inundation duration, which will likely affect organic carbon sequestration (Morris et al., 2002; Mudd et al., 2009). Increased inundation duration is likely to lead to a decrease in available oxygen in the sediment and an increase in the build-up of phytotoxins, such as sulphides, in the sediment (Himmelstein et al., 2021; Linthurst, 1979; Mendelssohn and Mckee, 1988), both of which negatively affect vegetation growth. The relationship between vegetation productivity and inundation duration varies between different species (Janousek et al., 2016; Kirwan and Guntenspergen, 2015; Snedden et al., 2015; Watson et al., 2014). Some species, such as Schoenoplectus americanus show a parabolic relation, with a maximal biomass productivity for an intermediate inundation duration (Kirwan and Guntenspergen, 2015; Langley et al., 2013). Other species such as Spartina patens and Spartina alterniflora show a decrease in biomass and productivity with increased inundation duration (Janousek et al., 2016; Kirwan and Guntenspergen, 2015; Langley et al., 2013; Snedden et al., 2015; Watson et al., 2014). A decrease of vegetation productivity with increasing inundation duration could potentially result in a lower OCAR in the remaining marsh, because of lower organic inputs and lower trapping of external sediment. However, increased inundation duration is also expected to result in lower aerobic microbial mineralization of the extant sediment organic carbon, which could result in higher OCAR rates in the remaining marsh. Further, increased inundation duration may induce to some extent increased supply and deposition of external sediment and organic carbon. Hence, it is difficult to predict what the overall response is of OCAR to increased tidal marsh inundation, where sea level rise rate is higher than sediment accretion rate.
The degradation of marsh vegetation in response to sea level rise is typically not a spatially uniform process (Schepers et al., 2017), so we may also expect that changes in OCAR in response to a different degree of marsh degradation will follow distinct spatial patterns within marshes. Reduced vegetation productivity and vegetation die-off in response to increased tidal inundation especially occurs in low elevation, sediment starved interior marsh basins, located further away from tidal channels, whereas marsh zones bordering tidal channels often show lower vulnerability to reduced vegetation productivity and die-off (Kearney et al., 1988; Luk et al., 2023; Schepers et al., 2017). This spatio-temporal pattern of reduced vegetation productivity and die-off is shown to be related to the typical micro-topographical gradient that forms in tidal marshes (Schepers et al., 2017), with higher elevated levees close to (< 10–20 m from) tidal channels and lower elevated basins further away from channels (∼ 20–100 m). Levees can be typically 10–40 cm higher than the basins (Christiansen et al., 2000; Redfield, 1972; Temmerman et al., 2003). This micro-topographical gradient is formed by higher sedimentation rates close to the creeks (French et al., 1995; Reed et al., 1999; Temmerman et al., 2003) and results in differences in hydrological (Ursino et al., 2004; Van Putte et al., 2020) and biogeochemical (Kostka et al., 2002) processes between levees and basins. Levees are known to have more sediment pore water drainage and thus higher sediment oxygen levels (Ursino et al., 2004; Van Putte et al., 2020), associated with higher vegetation productivity compared to basins (Gleason and Zieman, 1981; Linthurst, 1979; Mendelssohn, 1981). Further, research has shown that there is a difference in microbial decomposition between levee and basin sites, with higher rates of decomposition occurring on levees and to deeper depths compared to basin sites (Kostka et al., 2002). While these geomorphic differences between levees and basin are well known, it remains understudied to what extent the rate of organic carbon accumulation differs between both, and which processes contribute to this difference. Moreover, there are currently no studies that have investigated the dynamics of OCAR along levee-basin gradients in marsh zones with a different degree of marsh degradation in response to sea level rise, which hampers our ability to predict the long-term stability of carbon in these systems as they progressively degrade in response to sea level rise.
With this study we aim to quantify OCAR in vegetated marsh zones along two spatial gradients reflecting changing environmental conditions: (1) a gradient from levees to basins and (2) a gradient in marsh degradation (UVVR). The Blackwater marshes in Maryland, USA, provide a unique opportunity to address these open questions. Schepers et al. (2017) found that the spatial gradient in marsh degradation observed within this marsh complex can be considered a chronosequence of increasing marsh degradation in response to sea level rise. In this study, we utilize this gradient to investigate how OCAR varies: (1) across marsh zones with increasing degree of degradation (increasing UVVR), and (2) within marsh zones, across the micro-topographic gradient from levees to basins.
2.1 Study area
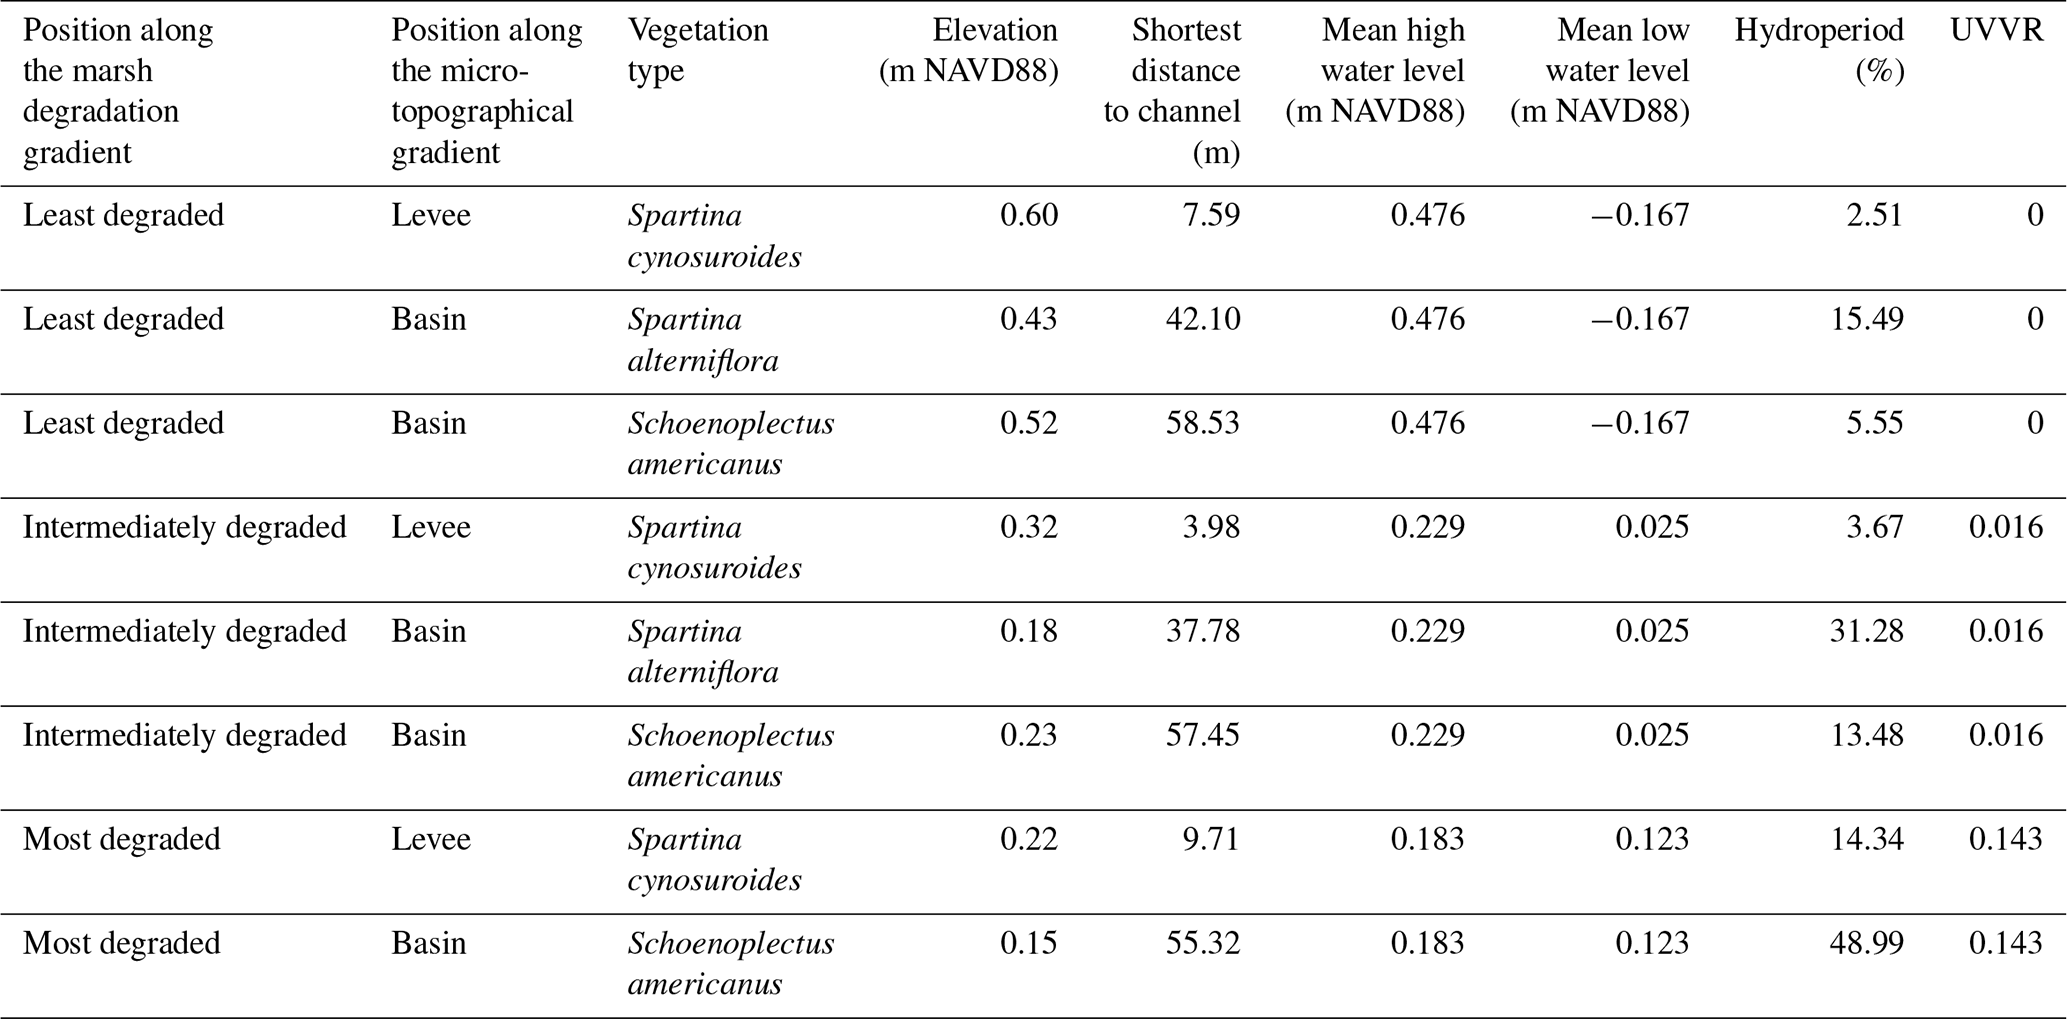
The Blackwater marshes are located along the Blackwater and Transquaking rivers (Fig. 1), which discharge into the Fishing Bay, a tributary embayment of the Chesapeake Bay (Maryland, USA, Fig. 1). These marshes are organogenic and micro-tidal, with a spring tidal range varying between less than 0.2 m upstream to over 1.0 m at the Fishing Bay (Ganju et al., 2013). In the marshes a mixture of mesohaline, intertidal vegetation can be found, including Spartina cynosuroides (L.) Roth on the levees, forming a belt of ca. 10–20 m wide adjacent to channels, and patches of Schoenoplectus americanus (Pers.) and a mixture of Spartina alterniflora Loisel and Spartina patens Roth in the basins, at more than 10-20 m from channels. In this system, the measured difference in surface elevation between levees and basins is usually 0.07–0.17 m (Table 1). The part of the Chesapeake Bay closest to the Blackwater marshes experiences a regional relative sea level rise rate of 4.06 mm yr−1 (measured between 1943 and 2024; NOAA station Cambridge, MD, 8571892, https://tidesandcurrents.noaa.gov/sltrends/, last access: 30 June 2025), which is higher than the average historical sediment accretion rate of 3.9 mm yr−1 measured in the Blackwater marshes (Ganju et al., 2013). The average accretion deficit has led to severe marsh degradation. The spatial gradient in tidal range and marsh elevation (Table 1) along the river result in different tidal inundation regimes at the different marsh locations. This has led to a spatial gradient in marsh degradation, with undegraded marshes close to the Fishing Bay and increasing historical conversion of marsh to ponds moving upstream along the Blackwater River (Schepers et al., 2017).
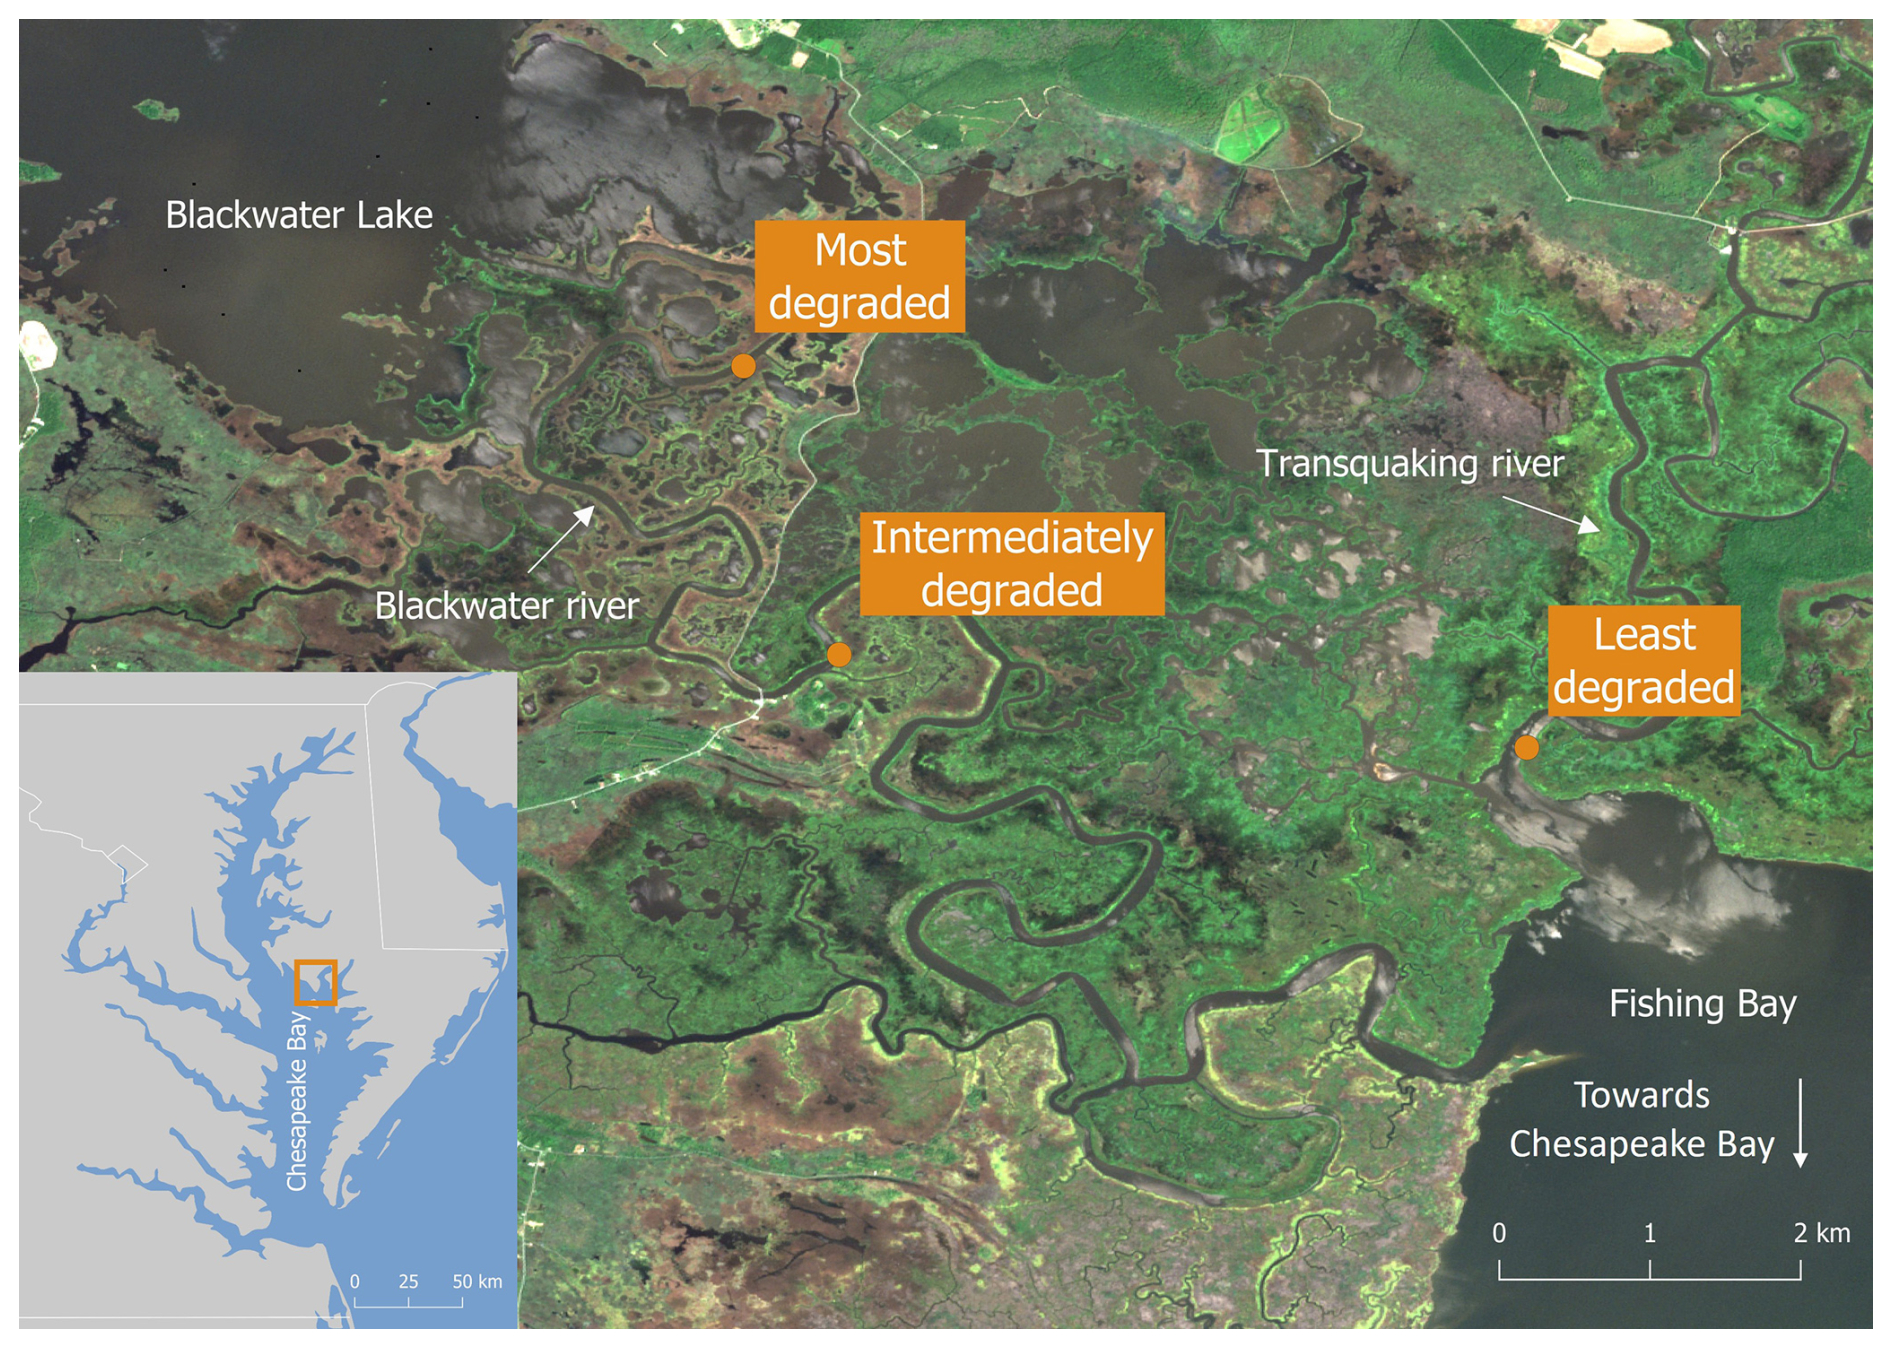
Figure 1Map showing the location of (left) the Blackwater marshes in the Chesapeake Bay and (right) the location of the selected zones along the marsh degradation gradient (Imagery © 2024 ESA, Map data © 2025 Google).
2.2 Fieldwork setup
Three marsh zones were selected along the marsh degradation gradient, based on an increasing unvegetated-vegetation ratio (UVVR, Ganju et al., 2017). These sites will further be referred to as (1) least degraded (UVVR = 0), (2) intermediately degraded (UVVR = 0.016) and (3) most degraded (UVVR = 0.143) (Figs. 1, Supplement Fig. S1, Table 1). Degraded zones consist of a mosaic of vegetation marsh zones and large pools of open water, the latter having sediment beds consisting of fluid mud where sampling fixed sediment volumes was not feasible. Therefore, we sampled only vegetated marsh sediment beds in each zone. Within each zone, samples were collected levee and vegetated basin locations. Because the basins of the least degraded and intermediately degraded zone contained distinct patches of two vegetation types, samples were taken within these zones at two basin locations, i.e. in each of the two vegetation types (one dominated by S. americanus, a C3 species and the other by a mixture of S. alterniflora and S. patens, C4 species), but only one levee location was sampled (dominated by S. cynosuroides, a C4 species). In the most degraded zone, one levee location (dominated by S. cynosuroides) and one basin location (dominated by S. americanus) were sampled, because no S. alterniflora and S. patens community was present here.
The selection of study sites resulted in eight sampling location (Table 1), two in the most degraded zone and 3 in the intermediately and most degraded zone. At each sampling location, four replicate soil cores were collected approximately one meter apart. Three replicates were used for organic carbon analysis (see Sect. 2.3.1 and 2.3.4) and one was used for radiometric to determine the sediment accretion rate (see Sect. 2.3.2). Of the total of 32 cores, 8 were used for radiometric dating and the remaining 24 for organic carbon analysis. Every core was between 25 and 50 cm long and was sliced in increments of about 1 cm. For the organic carbon analysis every other depth interval was used, leading to 12 to 25 data points for each core and a total number of 329 data points.
Table 1Overview of the different sampling sites and their corresponding vegetation, elevation with relation to the North American Vertical Datum of 1988 (NAVD88), shortest distance to the edge of the channel, the mean high and low water level with relation to the NAVD88, the hydroperiod (%), and the unvegetated-vegetated ratio (UVVR). Surface elevations were measured at each site using Real-Time Network (RTN) surveys, collected with a Trimble R10 GNSS receiver with cm-level accuracy. The hydroperiod is the average proportion of time that the marsh surface is inundated in each tidal cycle. The UVVR was calculated within a 200 m region in each degradation zone (more information in Supplement).
2.3 Sample collection and analysis
Prior to sediment sampling, above ground vegetation biomass was clipped from a 25 cm × 25 cm surface area, transported to the laboratory and stored cool prior to drying. Sediment samples were collected by vertically pushing down a metal coring tube with a diameter of 10 cm and length of 60 cm and a razor blade at the bottom to cut through the below-ground roots and plant structures. Before extraction of the tube, the inner and outer length of the tube were measured (Fig. S2), in order to calculate the total rate of compaction of the sediment core inside the tube. After core extraction, each core was transported to the laboratory, where it was frozen. After freezing, the cores were sliced at intervals of approximately 1 cm, their exact thickness was measured, and they were stored in the freezer until drying. The sediment and vegetation samples were dried at 55 °C for at least 48 h. For the sediment samples, every other depth was used for further analysis.
2.3.1 Bulk density
The volume of each sediment sample was calculated based on the diameter of the tube and the measured thickness of each slice, and was corrected for the measured compaction during coring, to obtain an estimate of in situ sediment volume. After drying, the samples were weighed and the bulk density was calculated by dividing the weight by the volume.
2.3.2 Sediment accretion rates
The sediment accretion rates were calculated using radiometric dating, which was done on one replicate core for each location. The dried sediment was finely ground and tightly packed into a pre-weighed petri dish of known volume. The petri dishes were sealed using vinyl electrical tape and paraffin wax and left to rest for a minimum of 30 d, to establish an equilibrium between the radionuclides (226Ra and daughter products 214Pb and 214Bi). After the resting period, each sample was analysed for 210Pb (46.5 keV photopeak), 214Pb (295, 352 keV photopeaks), and 214Bi (609 keV photopeak) activity by gamma spectroscopy using shielded ultra-low background Canberra GL 2020 Low Energy Germanium (LEGe) for periods of 24 h (FitzGerald et al., 2021). The values are corrected for background noise and adjusted for sample depth attenuation and detector sensitivity. After these adjustments, the concentration of total 210Pb, supported 210Pb, which is derived from the decay of the naturally occurring 226Ra, and excess 210Pbxs was computed. For each sample, the difference between the total and supported 210Pb is calculated as the atmospherically deposited excess 210Pbxs. The accretion rates were calculated from the 210Pb rates with a Constant Flux-Constant Sedimentation (CF-CS; Krishnaswamy et al., 1971) model, where a constant rate of sediment accumulation and a constant 210Pb flux is assumed. The accretion rate is calculated from the slope of the linear regression line between the natural log of the 210Pbxs activity against sample depth (Eq. 1 and refer to Supplement Sect. S3 for more information).
where λ is the decay constant for 210Pb (0.03101 yr−1) and m is the slope of the previously mentioned regression.
2.3.3 Suspended sediment
Water samples were collected to analyse the suspended sediment for their δ13C value (see Sect. 2.3.4), to be able to evaluate whether the sediment organic carbon was mainly plant derived or coming from the tidal deposition of suspended sediments. As the delivered sediment comes from the tidal channel, water samples were collected at one location from the Blackwater River. After collection, the samples were stored in the fridge until further analysis. The water samples were filtered using pre-weighed, pre-baked (for 4–5 h at 450 °C) glass microfiber paper filters (0.7 µm pore size, GE Bio-Sciences 1825-047). After filtration, the filters were dried at 55 °C and stored in petri dishes. Afterwards, the filters were acidified with HCl fumigation to remove carbonates.
2.3.4 Organic carbon content and sources of carbon
The three remaining sediment cores obtained for each sampling location were used for organic carbon analysis. To determine the organic carbon content of the sediment samples, the dried sediment was first ground finely. The organic carbon content and δ13C of the samples was determined using EA-IRMS (Thermo EA 1110 coupled to a Thermo Delta V Advantage isotope ratio mass spectrometer), after acidification of the samples to exclude inorganic carbonates. The calibration of the EA-IRMS was done using three different standards. First the IAEA-600 (caffeine), which is a certified standard distributed by the International Atomic Energy Agency. In addition to caffeine, Leucine and Tuna are used as in-house standards of the laboratory and are calibrated against certified standards (IAEA-600, IAEA-N1, IAEA-CH-6). The measured δ13C values are expressed relative to the international standard VPDB (Vienna PeeDee Belemnite) and show an analytical uncertainty of 0.15 ‰ or better.
The δ13C values were also measured for above-ground vegetation, by analysing finely ground vegetation samples, and for the suspended sediment samples. The δ13C signature of C3 and C4 vegetation is very different (Bouillon and Boschker, 2006; Farquhar et al., 1989), with C4 vegetation typically having a signature around −14‰, and C3 around −26 ‰ (Bouillon and Boschker, 2006). Since incoming sediment often has a δ13C signature similar to C3 vegetation, it is more straightforward to distinguish between vegetation and externally derived carbon within C4 vegetation. For the analysis of the suspended sediment samples, the filters were cut into four equal parts and one part was used for the δ13C analysis. Additional blank filters were pre-baked and used to blank-correct the δ13C data. Aboveground vegetation and suspended sediment are seen as the potential sources of autochthonous versus allochthonous carbon, respectively. The δ13C values of the sediment samples were compared with these values to estimate the contribution of autochthonous versus allochthonous sources to the organic carbon preserved in the sediment.
2.3.5 Organic carbon density and accumulation rate
From the organic carbon content (OC; %) and the bulk density (BD; g cm−3), the organic carbon density (OCD; g cm−3) is calculated (Eq. 2)
The organic carbon accumulation rate (OCAR; g m−2 yr−1) is calculated from the organic carbon density (OCD) and the sediment accretion rate (SAR; mm yr−1; Eq. 3).
2.4 Statistical analysis
For sediment accretion rates the difference between levee and basin locations with Schoenoplectus and Spartina was investigated using ANOVA in R version 4.4.1 (R Core Team, 2022). For the organic carbon content, density and accumulation rate, the separate effects of degradation zone and location were investigated using linear mixed effects models, including core and depth as random factors, using the lme4 package (Bates et al., 2015). Besides the simple effect of location and degradation zone, we ran an additional model with their interaction effect. To see which locations and zones differed from each other a Tukey post-hoc test was done, using the emmeans package in R (Lenth, 2025). Bulk density was analysed in a similar way, but only looking at the difference between levee and basin locations. No statistical testing was done on the δ13C values, but they were used to estimate the origin of the sediment organic carbon values, the local vegetation values and the external suspended sediment values.
3.1 Bulk density and sediment accretion
Bulk density was significantly higher (p < 0.05) in the levee locations (0.34 g cm−3; Fig. 2A) compared to the basin locations with Spartina (0.14 g cm−3) and with Schoenoplectus (0.127 g cm−3). Sediment accretion rates (more information in Sect. S3) were significantly different (p < 0.05) between the levees (10.88 mm yr−1; Fig. 2B) and the basins with Schoenoplectus (3.83 mm yr−1) and basins with Spartina (3.56 mm yr−1).
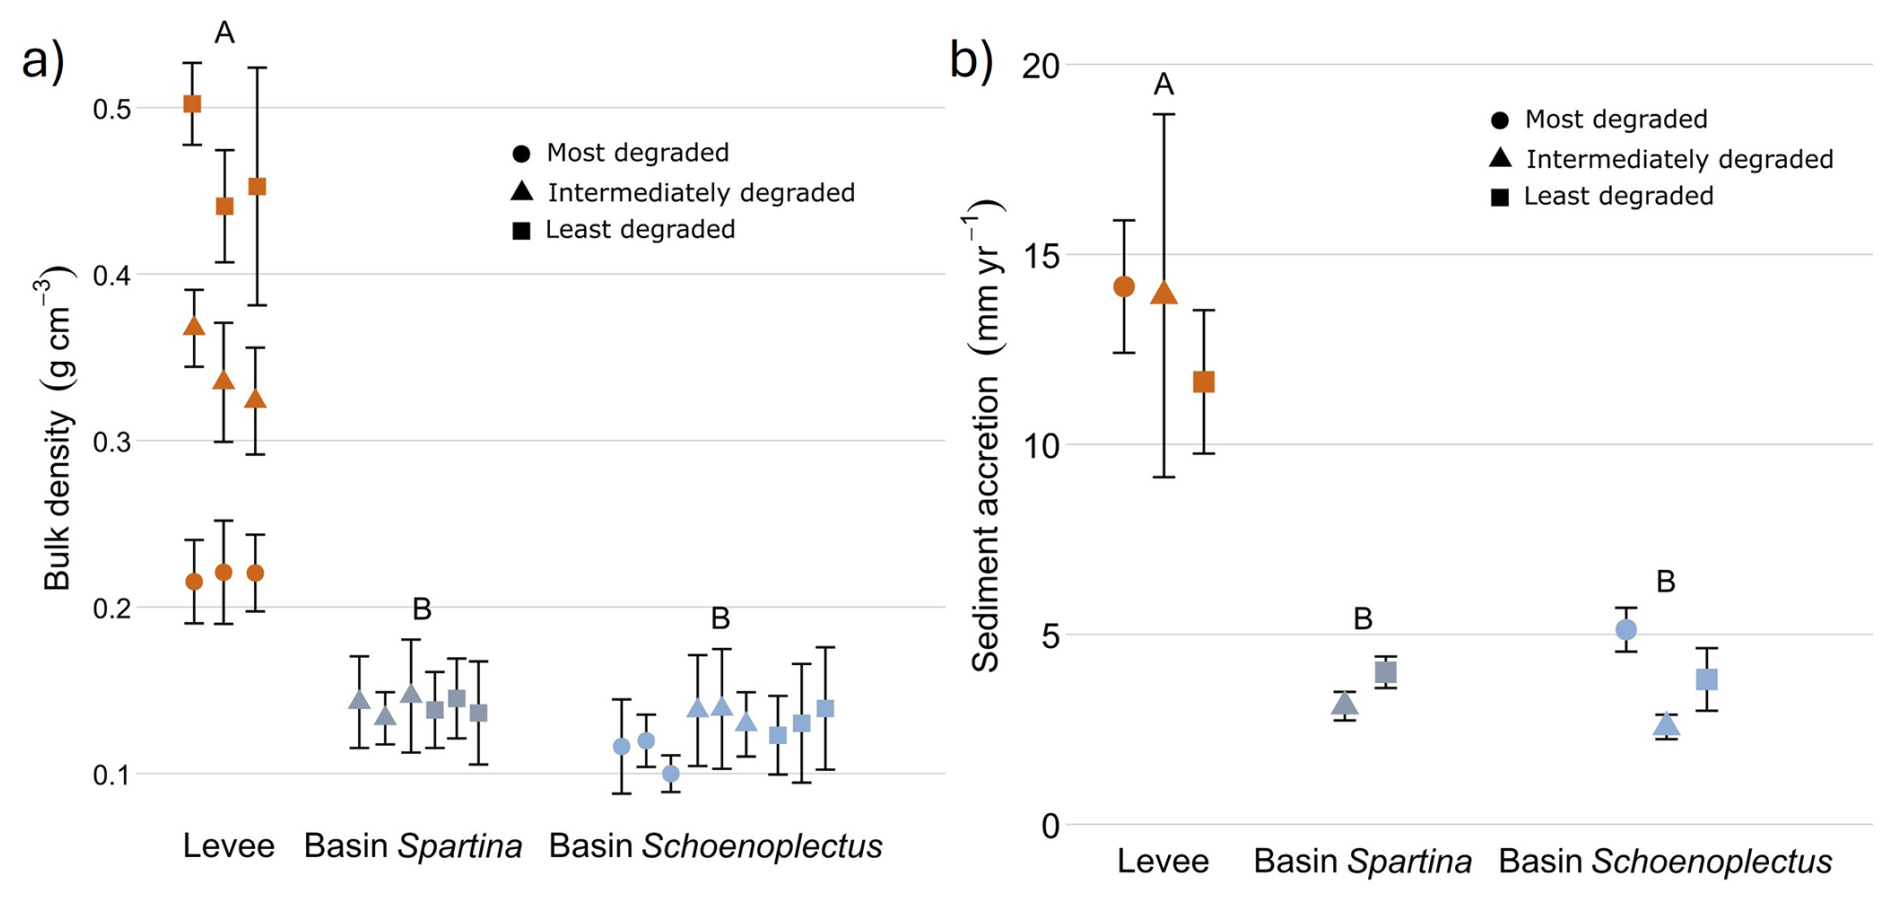
Figure 2Dry bulk density (left) and sediment accretion rates (right) determined with radiometric dating along the levee basin gradient. The coloured points indicate the average value for each core and the error bars show the standard deviation for each core. The data shown are pooled for the least degraded, intermediately degraded and most degraded zone. The letters above indicate the significance of the differences between levee, basin Spartina and basin Schoenoplectus, where observations with the same letters are not significantly different from each other (derived from ANOVA for the sediment accretion and from linear mixed models for bulk density).
3.2 Organic carbon content, density and accumulation rate
The organic carbon content (%; OC) along the marsh degradation gradient at every zone was significantly lower (p < 0.05) on the levees than in the basins with Schoenoplectus and Spartina. The only exception was the intermediately degraded zone, where the basin location with Spartina (50.7 %) was not significantly different from the levee location (44.2 %). In the intermediately and least degraded zones, there was no significant difference (p > 0.05) between the basin with Spartina (50.7 % and 47.7 %, respectively) and the basin with Schoenoplectus (55.9 % and 42.6 %, respectively), but the basin with Schoenoplectus in the intermediately degraded zone had a significantly higher (p < 0.05) OC than the basin with Schoenoplectus in the least degraded zone. The OC in the basin with Schoenoplectus of the most degraded zone (62.55 %) was significantly higher (p > 0.05) than in both basins in the least degraded zone and the basin with Spartina in the intermediately zone (Fig. 3).
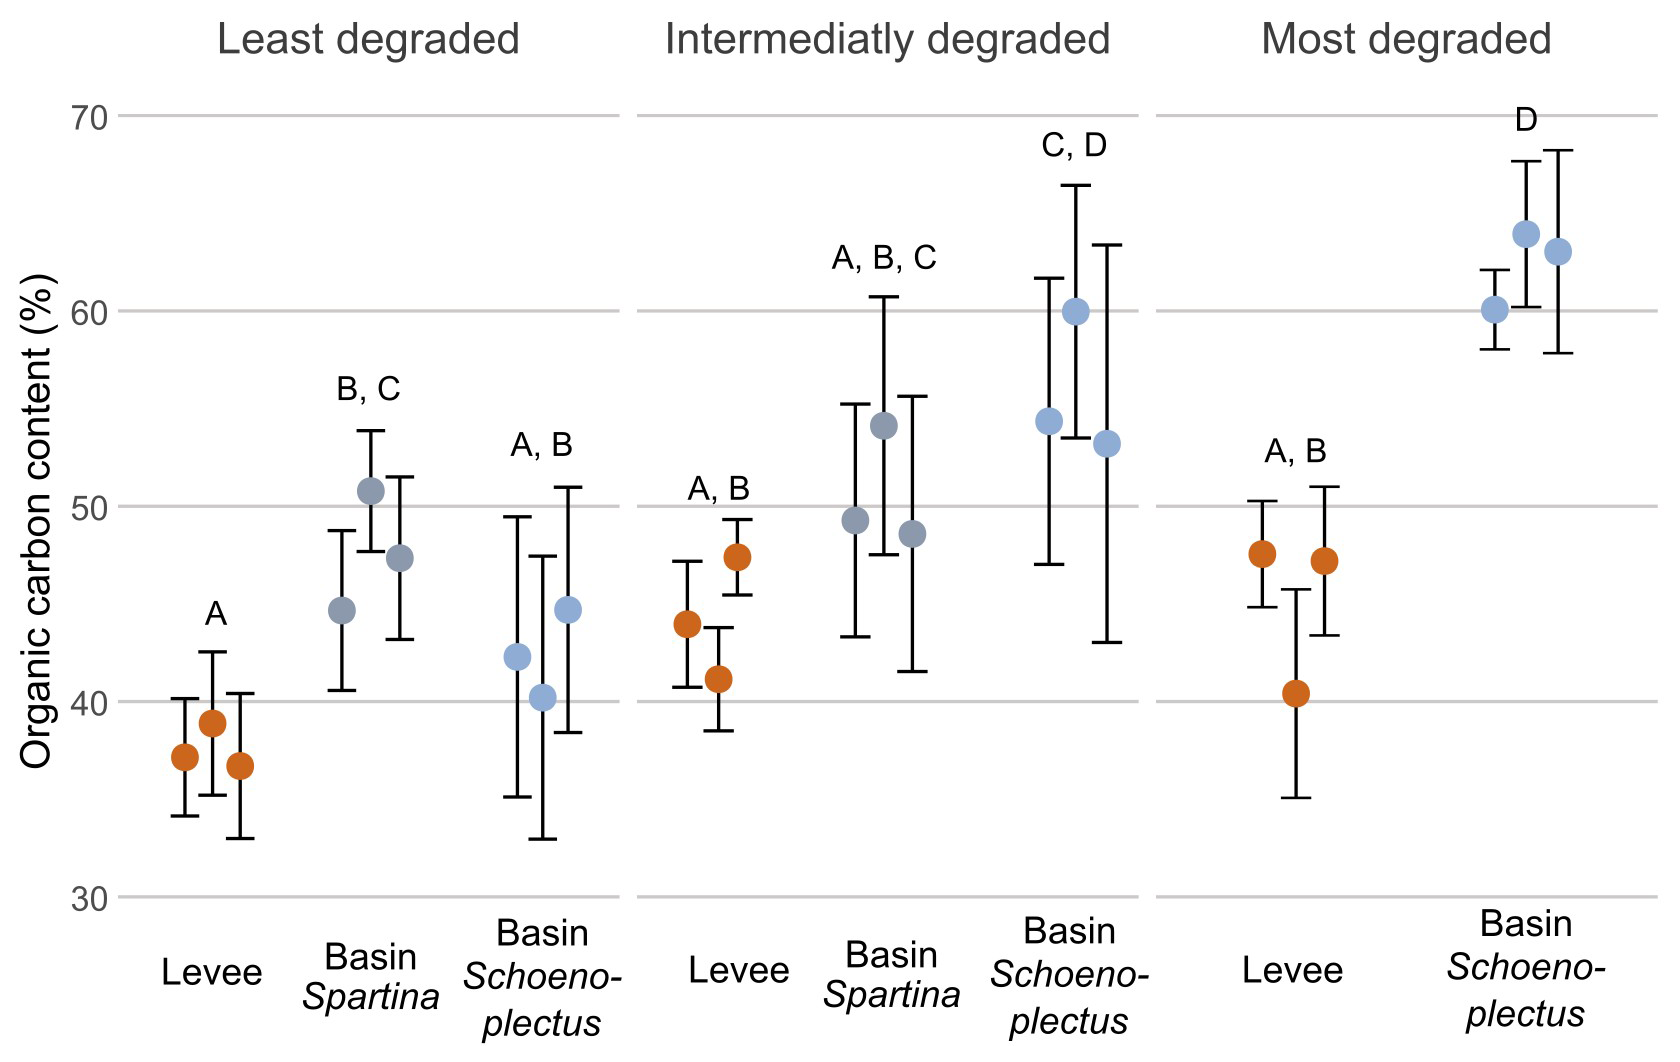
Figure 3Organic carbon content along the marsh degradation and levee-basin gradients. The coloured points indicate the average value for each core, the error bars indicate the standard deviation for each core. The colours of the points correspond to the sampling location along the levee-basin gradient. The letters above indicate the significance of the differences between observations of the different zones and locations, based on the results of the linear mixed models, where observations with the same letters are not significantly different from each other.
For organic carbon densities (g cm−3; OCD; Fig. 4) the values were significantly higher (p < 0.05) on the levees compared to the basins, for all zones along the marsh degradation gradient. There was however no significant difference between the values in the basins or levees of the different zones (Fig. 4).
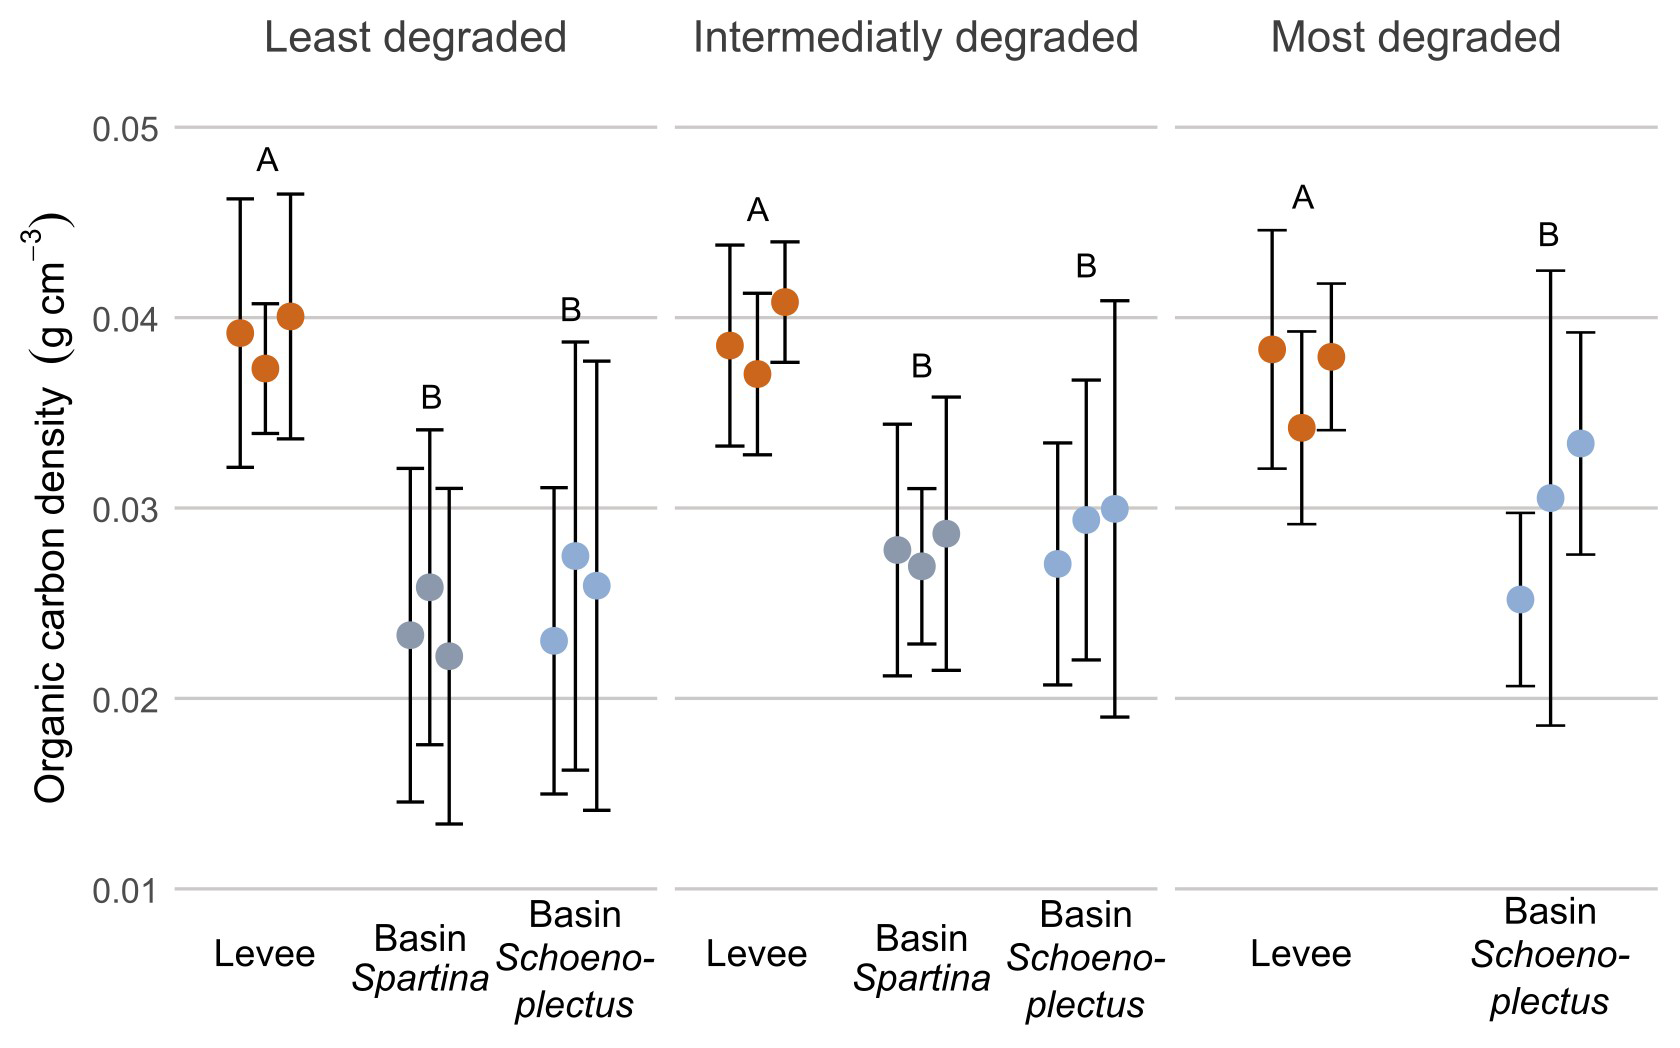
Figure 4Organic carbon density along the degradation and levee-basin gradient. The coloured points indicate the average value for each core, the error bars indicate the standard deviation for each core. The colours of the points correspond to the sampling location along the levee-basin gradient. The letters above indicate the significance of the differences between observations of the different zones and locations, based on the results of the linear mixed models, where observations with the same letters are not significantly different from each other.
The organic carbon accumulation rate (g m−2 yr−1; OCAR) was significantly higher (p < 0.05) on the levees compared to the basins in all zones. When looking at levees only, OCAR was significantly lower in the least degraded zone (452.4 g m−2 yr−1) compared to the intermediately (539.6 g m−2 yr−1) and most degraded (521.1 g m−2 yr−1) zones. The OCAR in the basin with Schoenoplectus at the most degraded zone (152.1 g m−2 yr−1) was significantly higher (p < 0.05) than in the basins with Schoenoplectus at the intermediately (73.7 g m−2 yr−1) and least degraded (97.2 g m−2 yr−1) zones. Within the least and intermediately degraded zone, there was no difference between the basin with Schoenoplectus (97.2 and 73.7 g m−2 yr−1 resp.) and the basin with Spartina (95.3 and 86.4 g m−2 yr−1 resp.; Fig. 5).
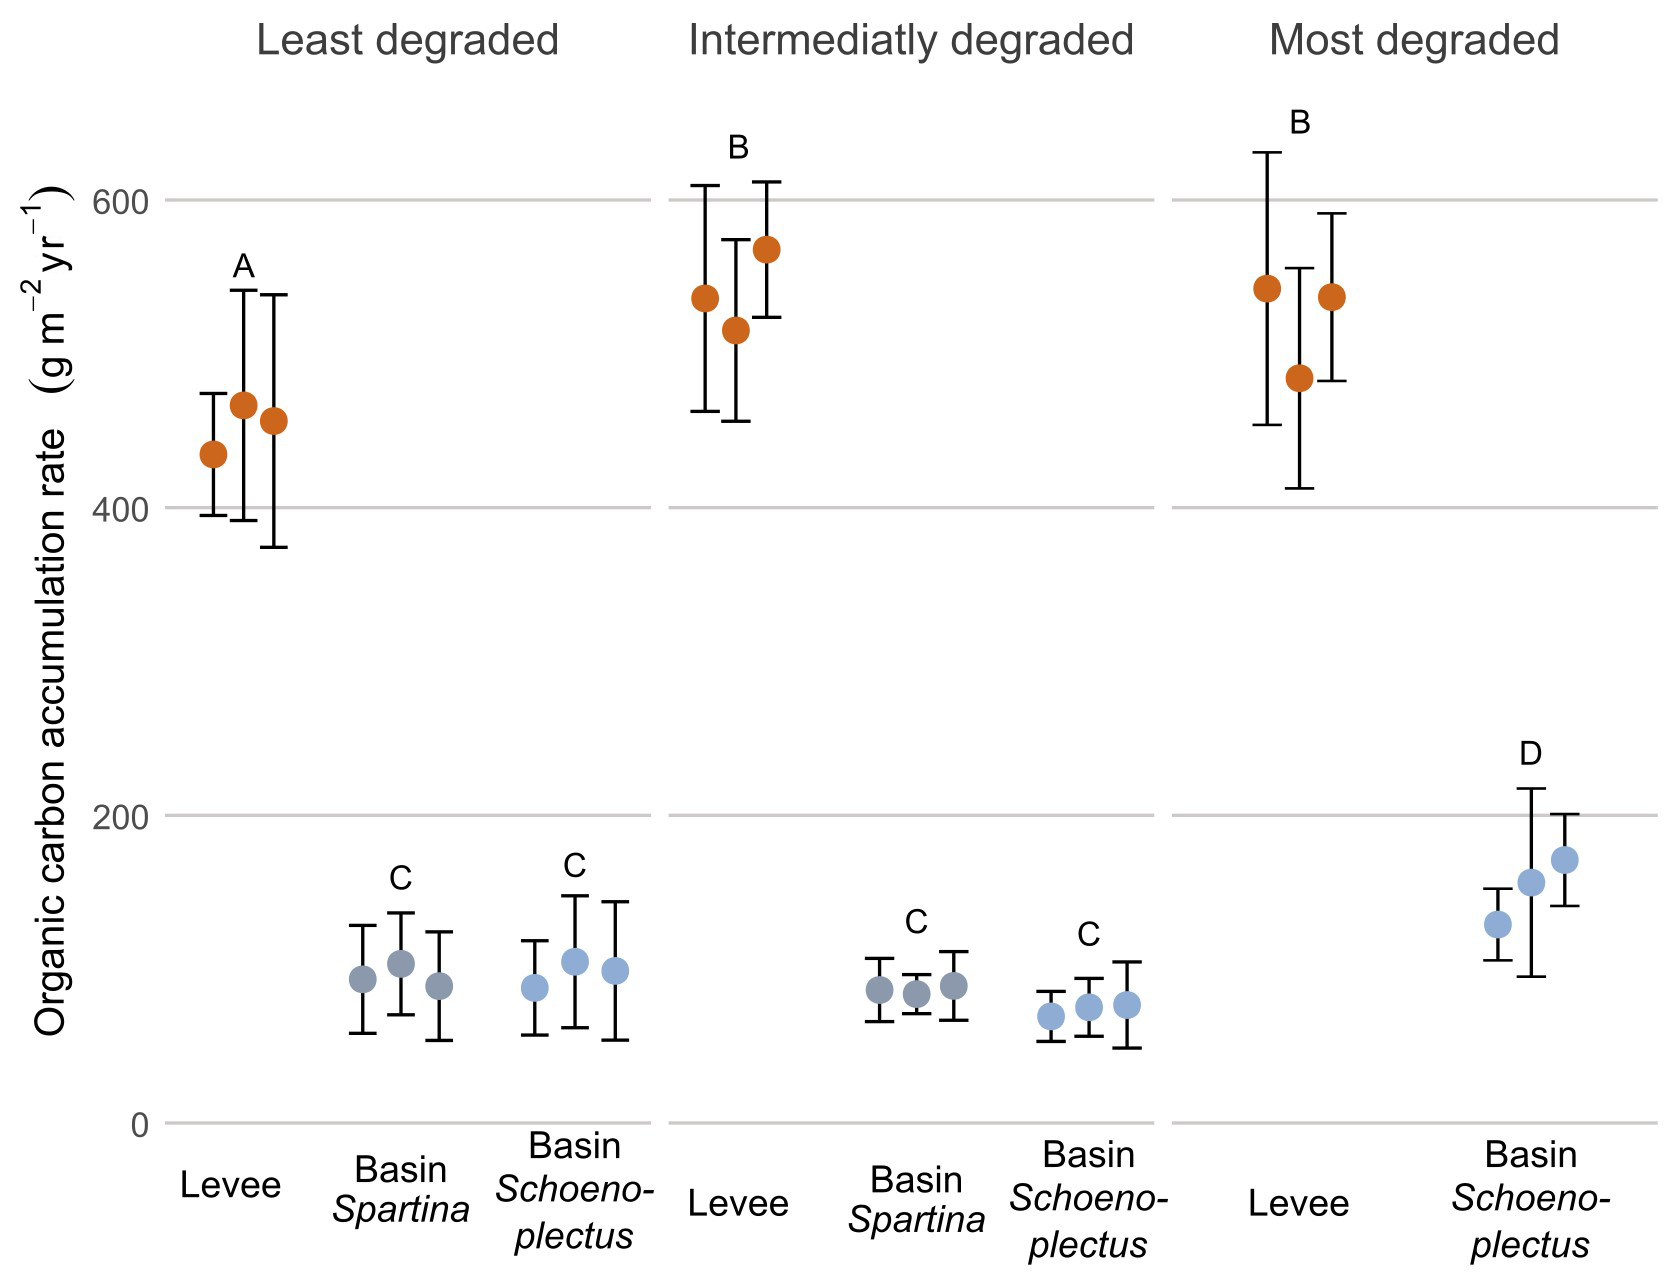
Figure 5Organic carbon accumulation rate along the degradation and levee-basin gradient. The coloured points indicate the average value for each core, the error bars indicate the standard deviation for each core. The colours of the points correspond to the sampling location along the levee-basin gradient. The letters above indicate the significance of the differences between observations of the different zones and locations, based on the results of the linear mixed model, where observations with the same letters are not significantly different from each other.
3.3 Sources of carbon
For the basin locations with a mix of Spartina alterniflora and S. patens vegetation, the average δ13C value of the sediment OC (SOC) was approximately −16 ‰ for the least and the intermediately degraded zone, which is close to the δ13C value of the C4 Spartina vegetation of both the levee and the basin with Spartina (−14.4 ‰). For the levee locations, which are dominated by Spartina cynosuroides vegetation, the average SOC δ13C value was approximately −21 ‰, which is between the C4 (−14.4 ‰) and suspended sediment (−26.3 ‰) δ13C values. For the basin with Schoenoplectus, there was a high variation in δ13C values in the least degraded and intermediate zones, ranging from SOC δ13C values close to the C4 vegetation values to values closer to the C3 Schoenoplectus vegetation value (−24.9 ‰). In the basin with Schoenoplectus at the most degraded zones, the average SOC δ13C value (−24.4 ‰) corresponded to that of the C3 vegetation (Fig. 6).
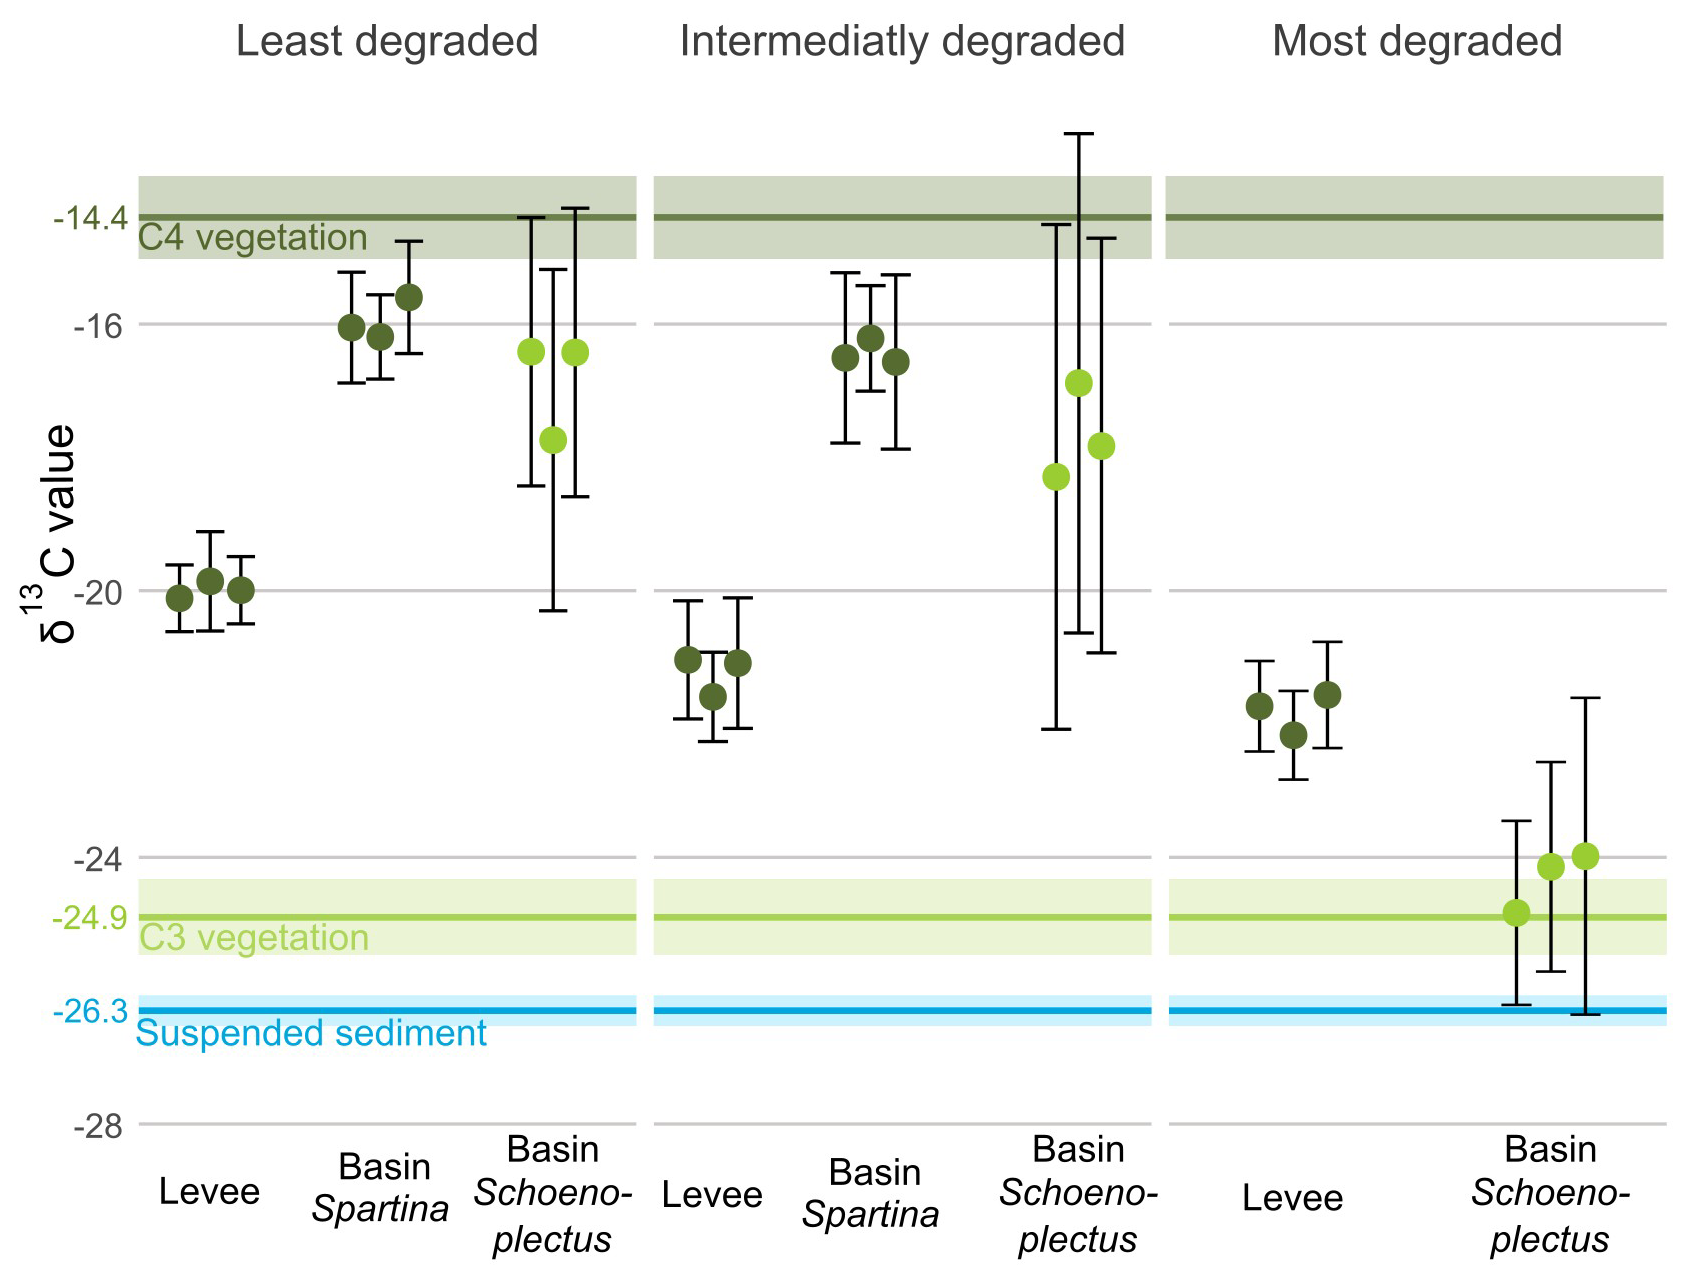
Figure 6δ13C values along the degradation and levee-basin gradient. The coloured points indicate the average value for each core, the error bars indicate the standard deviation for each core. The colours of the points correspond to the photosynthetic pathway of the dominant vegetation (light green for C3, dark green for C4). The horizontal coloured lines correspond with the δ13C values of C3 vegetation (light green), C4 vegetation (dark green) and suspended sediment (blue). The lighter-coloured area around the lines correspond to the 95 % confidence interval of the δ13C values.
Tidal marshes are generally known to be hotspots for organic carbon sequestration into their sediment beds (Temmink et al., 2022; Fig. 7). However, marshes are heterogeneous landscapes where inputs of sediment organic carbon and biogeochemistry vary across local gradients that may affect the rate at which they accumulate organic carbon. In particular, knowledge is limited on sediment organic carbon accumulation rates (OCAR) along gradients in marsh degradation and levee-basin gradients. In this study, we found that marsh levees are hotspots of OCAR, accumulating organic carbon four times faster on average than in adjacent marsh basins. Even though their area is limited (in this case a band of 10–20 m width along the river), we believe that taking the difference in carbon accumulation rate between levees and basins into account can make a big difference for system-scale carbon estimates. Based on our findings, marsh levees in a micro-tidal, organogenic marsh system appear to be among the fastest soil carbon accumulating environments on Earth sssof known rates (Fig. 7). Below, we discuss three processes that likely govern the remarkably high accumulation rates observed on marsh levees (Fig. 8): these are (1) high vegetation productivity, (2) high volumes of sediment accretion directly adjacent to tidal channels and (3) well-drained sediment beds adjacent to tidal channels, which promotes sediment compaction, creating extra accommodation space for sediment accretion.
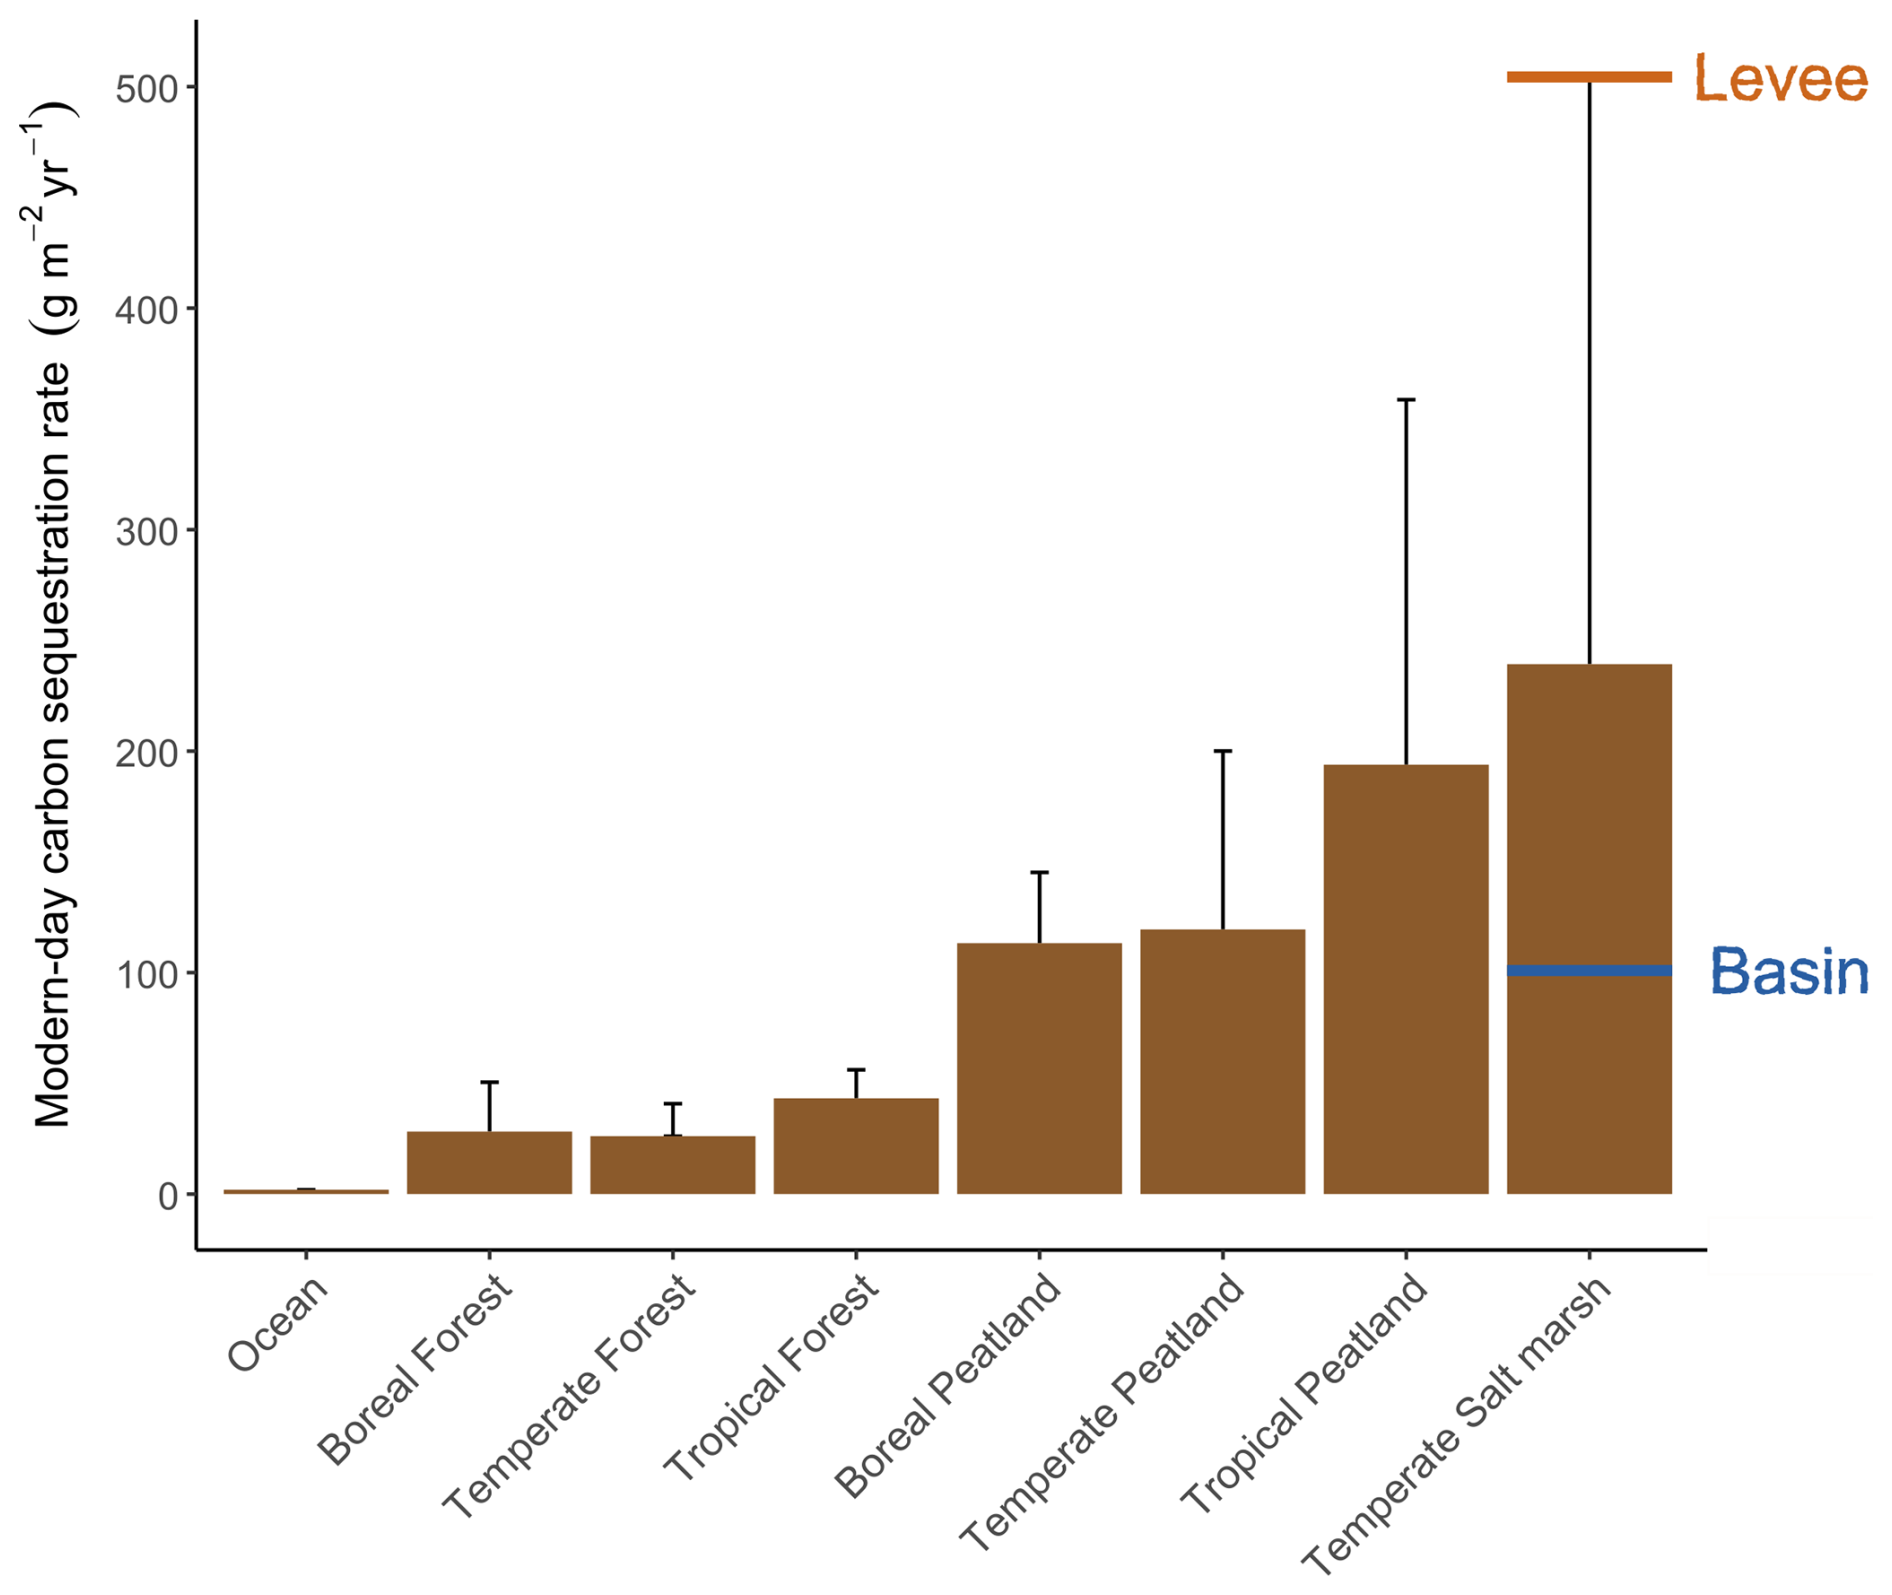
Figure 7Overview of the modern-day carbon sequestration rates (expressed in g C m−2 yr−1) in different ecosystems (adjusted from Temmink et al., 2022), including indications of the average rates measured on our levee and basin locations. Error bars indicate the standard deviation of measurements.
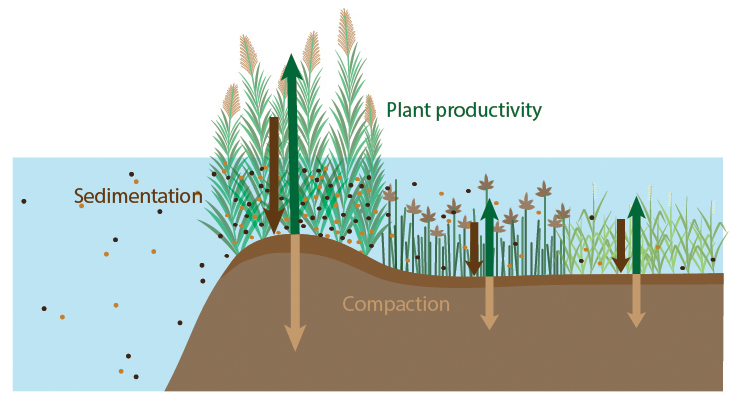
Figure 8Conceptual overview of processes that likely contribute to the much higher organic carbon accumulation rate on levees compared to basins. Length of the arrows indicate the gradient in sedimentation (dark brown), compaction (light brown) and vegetation productivity (green).
Our results also indicate that the rate of carbon accumulation slightly increases in areas where marsh degradation is more severe. This degradation is characterised by conversion of vegetated marsh area into more unvegetated marsh area (increasing UVVR), which is considered a consequence of increasing inundation stress due to sea level rise that is not fully compensated for by marsh elevation gain. Below we discuss that the higher carbon accumulation rate is potentially related to increased inundation duration (Gonneea et al., 2019) and/or redeposition of eroded material from degraded marsh patches (Hopkinson et al., 2018).
4.1 Higher OCAR on levees than basins
4.1.1 Levees enhance vegetation productivity
Our results show higher aboveground vegetation biomass on the levees compared to the basins (Fig. S4). A first potential reason for this higher biomass is that soil pore water drainage during low tides is typically observed to be deeper on levees as compared to basins in tidal marshes. This is a consequence of facilitated pore water drainage towards creeks that are located next to levees, while pore water drainage from basins is hindered as they are much farther away from creeks (Armstrong et al., 1985; Balling and Resh, 1983; Mendelssohn and Seneca, 1980; Ursino et al., 2004; Van Putte et al., 2020). The deeper drainage on levees leads to better soil aeration during low tides (Mendelssohn and Seneca, 1980) and thus better conditions for vegetation growth (Callaway et al., 1997; Kirby and Gosselink, 1976). Other studies have found a similar pattern for multiple species, such as Salicornia (Balling and Resh, 1983) and Spartina alterniflora (Kirby and Gosselink, 1976). In our system, there is a clear species zonation between the levee, dominated by the tall Spartina cynosuroides and the basins, dominated by the shorter Spartina alterniflora or Schoenoplectus americanus. The higher productivity of the levees could thus also be an intrinsic species trait of Spartina cynosuroides (Stalter and Lonard, 2022). A second potential reason is the higher mineral sediment content on the levees (refer to Sect. 4.1.2), which has been shown to have beneficial effects on vegetation growth, such as higher availability of cations (Bricker-Urso et al., 1998; Nyman et al., 1993).
The effect of greater vegetation biomass on higher OCAR values may be twofold: more productive vegetation on levees may result in (1) more organic matter inputs into the sediment and (2) more efficient attenuation of tidal flow and related trapping of external suspended sediment delivered to the marsh during tidal inundations (Duarte et al., 2005; McLeod et al., 2011).
4.1.2 Levees have higher sediment accretion rates
Our results show that sediment accretion rates are higher on levees compared to basins (Fig. 2A), which is consistent with findings in other tidal marsh areas (Coleman et al., 2020; Friedrichs and Perry, 2001; Hatton et al., 1983; Reed et al., 1999; Temmerman et al., 2003), including our microtidal study area (Duran Vinent et al., 2021). In microtidal systems, such as the one investigated here, low flow velocities during high tides that inundate the marsh surface provide conditions for rapid settling of incoming suspended sediments on the marsh. Due to these low flow velocities, combined with dense vegetation on the levees, the sediment accretion rate is higher on the levees when water flows from creeks into the levee vegetation, while much less suspended sediments can reach the inner marsh basins (Reed et al., 1999). Because the suspended sediment concentration in the main tidal creek (i.e. Blackwater River) is relatively low (55 mg L−1; Ganju et al., 2013), we may hypothesize that most of the suspended sediment is deposited on the levees and the basin locations are sediment starved. This pattern in sediment deposition is confirmed by the δ13C value of the levee sediments (Fig. 6), where the average value (−21.0 ‰) indicates a mixture of different sources of carbon, from local C4 vegetation (−14.4 ‰) and incoming suspended sediment (−26.3 ‰). The basins under C4 vegetation in the least and intermediately degraded zones, however, have a δ13C value of (−16.2 ‰) that is relatively close to that of the vegetation (−14.4 ‰). For the basin under C3 vegetation, i.e. in the most degraded zone, we cannot be sure whether the soil organic carbon is mainly from autochthonous origin, since the δ13C value of the local C3 vegetation is close to that of the allochthonous suspended sediment. A previous study in our study area has shown that mineral sediment deposition in basins is indeed limited and mainly occurs during storm surges (Stevenson et al., 1985). This implies that accretion in the basin locations is mostly reliant on organic matter accumulation by the local vegetation, which may explain the much lower accretion rates in the basins versus levees. The sporadic storm tides may explain why the δ13C value of the basin sediments with Spartina vegetation is slightly more negative than the value for the C4 vegetation.
Even though it may be expected that sediment pore water drainage is deeper in levees (Armstrong et al., 1985; Balling and Resh, 1983; Mendelssohn and Seneca, 1980; Ursino et al., 2004; Van Putte et al., 2020), the observed higher accretion rate on the levees results in faster burial of the carbon, so that it may faster reach layers below the sediment drainage level where oxygen is less available. This could imply lower rates of decomposition and thus better preservation of the present carbon (Rietl et al., 2021). Additionally, the suspended sediment that is deposited onto the marsh can contain substantial amounts of organic carbon. This organic carbon can originate from outside the system (e.g. from algae growth in the water or organic debris supplied with the tide) or can be the result of marsh soil material that is eroded from elsewhere in the marsh system and redeposited (Herbert et al., 2021; Hopkinson et al., 2018). When looking at the δ13C value of the suspended sediment (−26.3 ‰) from the river, it is relatively close to the value we found for C3 vegetation (−24.9 ‰), which may potentially indicate a large contribution of internally eroded marsh soil material that can be redeposited on the marsh levees.
4.1.3 Levees experience a higher degree of sediment compaction
Our results indicate that the bulk density is much higher on the levees compared to the basin locations (Fig. 2B). A first potential reason for that is that sediment deposition is higher on the levees than compared to the basins, resulting in a higher fraction of mineral particles on the levee (refer to Sect. 4.1.2 and Coleman et al., 2020; Duran Vinent et al., 2021; Friedrichs and Perry, 2001; Hatton et al., 1983; Reed et al., 1999; Temmerman et al., 2003). This higher mineral deposition can explain the higher bulk density as mineral sediments typically are heavier and more densely packed than organic material (Arvidsson, 1998). The results also indicate that the organic matter content of the basins is much higher than on the levees (Fig. 3), and higher sediment organic matter content is generally associated with lower sediment bulk densities (Hatton et al., 1983; Huyzentruyt et al., 2024; Nyman et al., 1993; Fig. S5). A second reason may be that the sediment on the levees is more compacted after deposition. Auto-compaction of sediments is the process where, due to soil pore water drainage and continuous sediment deposition, water is expelled from the soil pores under the weight of the new layers, leading to contraction of soil pores and thus compaction of the sediment profile (Allen, 2000; Chen et al., 2012; Gehrels, 1999). The potential reason why levee sediments experience more compaction than basin sediments may be related to the deeper pore water drainage during low tides on levees compared to basins, because of their closer proximity to creeks, as has been observed in many marsh studies (Armstrong et al., 1985; Balling and Resh, 1983; Mendelssohn and Seneca, 1980; Ursino et al., 2004; Van Putte et al., 2020). This higher compaction on the levees would then allow higher sediment and carbon accumulation rates by creating extra accommodation space (i.e. vertical space for sediment deposition) compared to the locations in the basin.
4.2 Higher OCAR in more degraded marsh zones
The results indicate that there is an increase in OCAR with increasing degree of marsh degradation in response to sea level rise, which is assessed here as an increase in the unvegetated-vegetated area ratio (UVVR). This is observed both on two of the levees as well as in one of the basin locations (Fig. 5). It is however important to note that only three points along the degradation gradient were measured, so general conclusions should be made with caution. However, this result does correspond with positive relationships found between sea level rise rate and OCAR in meta-analyses based on datasets compiled from sites across continents and the globe (Herbert et al., 2021; Huyzentruyt et al., 2024; Rogers et al., 2019; Wang et al., 2019). The main explanatory mechanism discussed in these continental- to global-scale studies is that higher sea level rise rate is associated with more marsh tidal inundation, hence higher sediment accretion rate, which drives higher OCAR. However, a major difference between our study and previous meta-data studies, is that our marsh degradation zones experience the same rate of regional relative sea level rise (i.e. for the Chesapeake Bay region) but show different degrees of local marsh degradation in response to the regional relative sea level rise, while previous meta-data studies are based on data from geographically distant areas experiencing different rates of sea level rise. Hence an alternative explanation must be sought for the results in the Blackwater marshes.
We hypothesise that the levee and the basin in the most degraded zone may experience longer waterlogged sediment conditions, as their sediment surface elevations are lower compared to the least degraded zone (Table 1), allowing less pore water drainage during low tides in the most degraded versus least degraded zone. This may reduce oxygenation of the sediments, thereby limiting microbial decomposition of sediment organic carbon and hence contributing to higher OCAR values. This hypothesis is also suggested by Gonneea et al. (2019) and supported by the higher levels of organic carbon content (%) that are found in the levee and basin of the most degraded versus least degraded zone (Fig. 3). Another potential mechanism is suggested by Herbert et al. (2021), who found that marshes along the Louisiana coast with a higher rate of marsh loss (i.e. marsh vegetation converting to ponds resulting in increase in UVVR) show a higher rate of OCAR. They hypothesise that when marsh degradation progresses, ponds form within the marsh and enlarge, which may produce eroded marsh sediment and thus organic carbon that is redistributed and redeposited in vegetated marsh zones during high tides (Hopkinson et al., 2018; Valentine et al., 2023). Finally, the levee of the least degraded site could be subject to the “priming effect”, where higher vegetation productivity increases the input of new carbon and oxygen into the sediment, therefore leading to higher microbial decomposition rates and thus lower overall sediment organic carbon contents (Rietl et al., 2021). This priming effect could explain why, even though vegetation is more productive in the least degraded zone than the intermediately degraded zone, the OCAR is lower (Fig. S4). On the levees, we may expect little difference in pore water drainage along the marsh degradation gradient, as they are always located close to the creek and thus well drained, potentially explaining why there is no large difference in OCAR values between levee locations along the degradation gradient.
Besides the difference in OCAR rates we found in the levees and basins along the degradation gradient, we highlight that there is an increasing surface area of ponds (Schepers et al., 2017) within the marsh zones with increasing degree of degradation (higher UVVR). Increasing conversion of marsh vegetation to ponds is likely to have important implications for carbon sequestration, however the processes that lead to the development and growth remain poorly understood (Redfield, 1972; Schepers et al., 2020; van Huissteden and van de Plassche, 1998) and is one of the main remaining knowledge gaps in the carbon budget of these degrading marsh systems.
The data used for this paper is available at https://doi.org/10.5281/zenodo.15470320 (Huyzentruyt et al., 2025).
The supplement related to this article is available online at https://doi.org/10.5194/bg-23-851-2026-supplement.
MH, ST conceptualised the study with the help of MK, DW, JC and GG. MH, MW, GF and DW carried out the fieldwork and lab analysis with resources provided by GG, MK and SB. MH, MW and GF analysed and visualised the data. MH, GF and ST prepared the manuscript with contributions from all co-authors.
At least one of the (co-)authors is a member of the editorial board of Biogeosciences. The peer-review process was guided by an independent editor, and the authors also have no other competing interests to declare.
Any use of trade, firm, or product names is for descriptive purposes only and does not imply endorsement by the U.S. Government.
Publisher's note: Copernicus Publications remains neutral with regard to jurisdictional claims made in the text, published maps, institutional affiliations, or any other geographical representation in this paper. The authors bear the ultimate responsibility for providing appropriate place names. Views expressed in the text are those of the authors and do not necessarily reflect the views of the publisher.
We would like to thank Desmond Mackell and McKenna Bristow for their indispensable field assistance and Jennifer E. Connel (VIMS), Lore Fondu and Yannick Stroobandt (KULeuven) for their assistance in the lab.
This research has been supported by the Fonds Wetenschappelijk Onderzoek (grant no. G039022N) and the U.S. Geological Survey, Western Ecological Research Center, U.S. Geological Survey (grant no. Ecosystems Land Change Science Program).
This paper was edited by Trisha Atwood and reviewed by Karen Beard and two anonymous referees.
Allen, J. R. L.: Morphodynamics of Holocene salt marshes: a review sketch from the Atlantic and Southern North Sea coasts of Europe, Quaternary Science Reviews, https://doi.org/10.1016/S0277-3791(99)00034-7, 2000.
Armstrong, W., Wright, E. J., Lythe, S., and Gaynard, T. J.: Plant Zonation and the Effects of the Spring-Neap Tidal Cycle on Soil Aeration in a Humber salt marsh, Journal of Ecology, 73, 323–339, 1985.
Arvidsson, J.: Influence of soil texture and organic matter content on bulk density, air content, compression index and crop yield in field and laboratory compression experiments, Soil and Tillage Research, 49, 159–170, https://doi.org/10.1016/S0167-1987(98)00164-0, 1998.
Balling, S. S. and Resh, V. H.: The influence of mosquito control recirculation ditches on plant biomass, production and composition in two San Francisco Bay salt marshes, Estuarine, Coastal and Shelf Science, 16, 151–161, https://doi.org/10.1016/0272-7714(83)90137-3, 1983.
Bates, D., Mächler, M., Bolker, B., and Walker, S.: Fitting Linear Mixed-Effects Models Using lme4. Journal of Statistical Software, 67, 1–48, https://doi.org/10.18637/jss.v067.i01, 2015.
Bouillon, S. and Boschker, H. T. S.: Bacterial carbon sources in coastal sediments: a cross-system analysis based on stable isotope data of biomarkers, Biogeosciences, 3, 175–185, https://doi.org/10.5194/bg-3-175-2006, 2006.
Bricker-Urso, S., Nixon, S. W., Cochran, J. K., Hirschberg, D. J., and Hunt, C.: Accretion rates and sediment accumulation in Rhode Island salt marshes, Estuaries, 12, 300–317, https://doi.org/10.2307/1351908, 1998.
Callaway, J. C., Delaune, I. R. D., and Patrick, W. H.: Sediment Accretion Rates from Four Coastal Wetlands Along the Gulf of Mexico, Journal of Coastal Research, 13, 181–191, 1997.
Chen, Y., Thompson, C. E. L., and Collins, M. B.: Saltmarsh creek bank stability: Biostabilisation and consolidation with depth. Continental Shelf Research, 35, 64–74, https://doi.org/10.1016/j.csr.2011.12.009, 2012.
Christiansen, T., Wiberg, P. L., and Milligan, T. G.: Flow and sediment transport on a tidal salt marsh surface, Estuarine, Coastal and Shelf Science, 50, 315–331, https://doi.org/10.1006/ecss.2000.0548, 2000.
Coleman, D. J., Ganju, N. K., and Kirwan, M. L.: Sediment Delivery to a Tidal Marsh Platform Is Minimized by Source Decoupling and Flux Convergence, Journal of Geophysical Research: Earth Surface, 125, https://doi.org/10.1029/2020JF005558, 2020.
Craft, C., Clough, J., Ehman, J., Jove, S., Park, R., Pennings, S., Guo, H., and Machmuller, M.: Forecasting the effects of accelerated sea-level rise on tidal marsh ecosystem services, Frontiers in Ecology and the Environment, 7, 73–78, https://doi.org/10.1890/070219, 2009.
Day, J., Anthony, E., Costanza, R., Edmonds, D., Gunn, J., Hopkinson, C., Mann, M. E., Morris, J., Osland, M., Quirk, T., Rovai, A., Rybczyk, J., Spencer, T., Stephens, J., Syvitski, J., Twilley, R., Visser, J., and White, J. R.: Coastal Wetlands in the Anthropocene, 56, https://doi.org/10.1146/annurev-environ-121922-041109, 2024.
DeLaune, R. D. and White, J. R.: Will coastal wetlands continue to sequester carbon in response to an increase in global sea level?: A case study of the rapidly subsiding Mississippi river deltaic plain, Climatic Change, 110, 297–314, https://doi.org/10.1007/s10584-011-0089-6, 2012.
Duarte, C. M., Middelburg, J. J., and Caraco, N.: Major role of marine vegetation on the oceanic carbon cycle, Biogeosciences, 2, 1–8, https://doi.org/10.5194/bg-2-1-2005, 2005.
Duran Vinent, O., Herbert, E. R., Coleman, D. J., Himmelstein, J. D., and Kirwan, M. L.: Onset of runaway fragmentation of salt marshes, One Earth, 4, 506–516, https://doi.org/10.1016/j.oneear.2021.02.013, 2021.
Fagherazzi, S., Carniello, L., D'alpaos, L., and Defina, A.: Critical bifurcation of shallow microtidal landforms in tidal flats and salt marshes, PNAS, 103, https://doi.org/10.1073/pnas.0508379103, 2006.
Farquhar, G. D., Ehleringer, I. J. R., and Hubick, K. T.: Carbon isotope discrimination and photosynthesis, Annu. Rev. Plant Physiol. Plant Mol. Biol., 40, https://doi.org/10.1146/annurev.pp.40.060189.002443, 1989.
FitzGerald, D. M., Hein, C. J., Connell, J. E., Hughes, Z. J., Georgiou, I. Y., and Novak, A. B.: Largest marsh in New England near a precipice, Geomorphology, 379, https://doi.org/10.1016/j.geomorph.2021.107625, 2021.
French, J., Spencer, T., Murray, A., and Arnold, N.: Geostatistical Analysis of Sediment Deposition In Two Small Tidal Wetlands, Norfolk, UK, Journal of Coastal Research, https://www.jstor.org/stable/4298342 (last access: 14 May 2025), 1995.
Friedrichs, C. T. and Perry, J. E.: Tidal Salt Marsh Morphodynamics: A Synthesis, Journal of Coastal Research, 27, 7–37, 2001.
Ganju, N. K., Nidzieko, N. J., and Kirwan, M. L.: Inferring tidal wetland stability from channel sediment fluxes: Observations and a conceptual model, Journal of Geophysical Research: Earth Surface, 118, 2045–2058, https://doi.org/10.1002/jgrf.20143, 2013.
Ganju, N. K., Defne, Z., Kirwan, M. L., Fagherazzi, S., D'Alpaos, A., and Carniello, L.: Spatially integrative metrics reveal hidden vulnerability of microtidal salt marshes, Nature Communications, 8, https://doi.org/10.1038/ncomms14156, 2017.
Gehrels, W. R.: Middle and Late Holocene Sea-Level Changes in Eastern Maine Reconstructed from Foraminiferal Saltmarsh Stratigraphy and AMS 14C Dates on Basal Peat, Quaternary Research, 52, 350–359, https://doi.org/10.1006/qres.1999.2076, 1999.
Gleason, M. L. and Zieman, J. C.: Influence of Tidal Inundation on Internal Oxygen Supply of Spartina alterniflora and Spartina patens, Estuarine, Coastal and Shelf Science, 13, https://doi.org/10.1016/S0302-3524(81)80104-1, 1981.
Gonneea, M. E., Maio, C. V., Kroeger, K. D., Hawkes, A. D., Mora, J., Sullivan, R., Madsen, S., Buzard, R. M., Cahill, N., and Donnelly, J. P.: Salt marsh ecosystem restructuring enhances elevation resilience and carbon storage during accelerating relative sea-level rise, Estuarine, Coastal and Shelf Science, 217, 56–68, https://doi.org/10.1016/j.ecss.2018.11.003, 2019.
Hatton, R. S., DeLaune, R. D., and Patrick, W. H.: Sedimentation, accretion, and subsidence in marshes of Barataria Basin, Louisiana, Limnology and Oceanography, 28, 494–502, https://doi.org/10.4319/lo.1983.28.3.0494, 1983.
Herbert, E. R., Windham-Myers, L., and Kirwan, M. L.: Sea-level rise enhances carbon accumulation in United States tidal wetlands, One Earth, 4, 425–433, https://doi.org/10.1016/j.oneear.2021.02.011, 2021.
Himmelstein, J., Vinent, O. D., Temmerman, S., and Kirwan, M. L.: Mechanisms of Pond Expansion in a Rapidly Submerging Marsh, Frontiers in Marine Science, 8, https://doi.org/10.3389/fmars.2021.704768, 2021.
Hopkinson, C. S., Morris, J. T., Fagherazzi, S., Wollheim, W. M., and Raymond, P. A.: Lateral Marsh Edge Erosion as a Source of Sediments for Vertical Marsh Accretion, Journal of Geophysical Research: Biogeosciences, 123, 2444–2465, https://doi.org/10.1029/2017JG004358, 2018.
Huyzentruyt, M., Belliard, J. P., Saintilan, N., and Temmerman, S.: Identifying drivers of global spatial variability in organic carbon sequestration in tidal marsh sediments, Science of the Total Environment, 957, https://doi.org/10.1016/j.scitotenv.2024.177746, 2024.
Huyzentruyt, M., Wens, M., Fivash, G., Walters, D., Bouillon, S., Carr, J., Guntenspergen, G., Kirwan, M., and Temmerman, S.: Carbon sequestration along a gradient of tidal marsh degradation in response to sea level rise; supporting data, Zenodo [data set], https://doi.org/10.5281/zenodo.15470320, 2025.
Janousek, C. N., Buffington, K. J., Thorne, K. M., Guntenspergen, G. R., Takekawa, J. Y., and Dugger, B. D.: Potential effects of sea-level rise on plant productivity: Species-specific responses in northeast Pacific tidal marshes, Marine Ecology Progress Series, 548, 111–125, https://doi.org/10.3354/meps11683, 2016.
Kearney, M. S., Grace, R. E., and Stevenson, J. C.: Marsh Loss in Nanticoke Estuary, Geographical Review, 78, https://doi.org/10.2307/214178, 1988.
Kirby, C. J. and Gosselink, J. G.: Primary Production in a Louisiana Gulf Coast Spartina Alterniflora Marsh, Ecology, 27, 1052–1059, https://doi.org/10.2307/1941070, 1976.
Kirwan, M. L. and Guntenspergen, G. R.: Response of plant productivity to experimental flooding in a stable and a submerging marsh, Ecosystems, 18, 903–913, https://doi.org/10.1007/s10021-015-9870-0, 2015.
Kirwan, M. L. and Megonigal, J. P.: Tidal wetland stability in the face of human impacts and sea-level rise, Nature, 504, 53–60, https://doi.org/10.1038/nature12856, 2013.
Kirwan, M. L. and Mudd, S. M.: Response of salt-marsh carbon accumulation to climate change. Nature, 489, 550–553, https://doi.org/10.1038/nature11440, 2012.
Kirwan, M. L., Temmerman, S., Skeehan, E. E., Guntenspergen, G. R., and Fagherazzi, S.: Overestimation of marsh vulnerability to sea level rise, Nature Climate Change, 6, 253–260, https://doi.org/10.1038/nclimate2909, 2016.
Kostka, J. E., Roychoudhury, A., and Van Cappellen, P.: Rates and controls of anaerobic microbial respiration across spatial and temporal gradients in saltmarsh sediments, Biogeochemistry, 60, 49–76, https://doi.org/10.1023/A:1016525216426, 2002.
Krishnaswamy, D. L., Martin, J. M., and Meybeck, M.: Geochronology of lake sediments, Earth and Planetary Science Letters, 11, 407–414, https://doi.org/10.1016/0012-821X(71)90202-0, 1971.
Langley, A. J., Mozdzer, T. J., Shepard, K. A., Hagerty, S. B., and Megonigal, P. J.: Tidal marsh plant responses to elevated CO2, nitrogen fertilization, and sea level rise, Global Change Biology, 19, 1495–1503, https://doi.org/10.1111/gcb.12147, 2013.
Lenth, R., Piaskowski, J., Banfai, B., Buerkner, P., Giné-Vázquez, I., Hervé, M., Jung, M., Love, J., Miguez, F., Riebl, H., and Singmann, H.: emmeans: Estimated Marginal Means, aka Least-Squares Means, R package version 1.11.2-80001, https://doi.org/10.32614/CRAN.package.emmeans, 2025.
Linthurst, R. A.: The effect of aeration on the growth of Spartina alterniflora Loisel, American Journal of Botany, 66, 685–691, https://doi.org/10.1002/j.1537-2197.1979.tb06272.x, 1979.
Luk, S., Eagle, M. J., Mariotti, G., Gosselin, K., Sanderman, J., and Spivak, A. C.: Peat Decomposition and Erosion Contribute to Pond Deepening in a Temperate Salt Marsh, Journal of Geophysical Research: Biogeosciences, 128, https://doi.org/10.1029/2022JG007063, 2023.
Luo, M., Huang, J. F., Zhu, W. F., and Tong, C.: Impacts of increasing salinity and inundation on rates and pathways of organic carbon mineralization in tidal wetlands: a review, Hydrobiologia 827, 31–49, https://doi.org/10.1007/s10750-017-3416-8, 2019.
McLeod, E., Chmura, G. L., Bouillon, S., Salm, R., Björk, M., Duarte, C. M., Lovelock, C. E., Schlesinger, W. H., and Silliman, B. R.: A blueprint for blue carbon: Toward an improved understanding of the role of vegetated coastal habitats in sequestering CO2, Frontiers in Ecology and the Environment, 9, 552–560, https://doi.org/10.1890/110004, 2011.
Mendelssohn, I. A.: Eco-physiological aspects of the height forms of Spartina alterniflora in North Carolina: nitrogen nutrition and soil waterlogging, PhD thesis, North Carolina State University, Raleigh, 1981.
Mendelssohn, I. A. and Mckee, K. L.: Spartina Alterniflora Die-Back in Louisiana: Time-Course Investigation of Soil Waterlogging Effects, Journal of Ecology, 76, https://www.jstor.org/stable/2260609 (last access: 14 May 2025), 1988.
Mendelssohn, I. A. and Seneca, E. D.: The influence of soil drainage on the growth of salt marsh cordgrass Spartina alterniflora in North Carolina, Estuarine and Coastal Marine Science, 11, 27–40, https://doi.org/10.1016/S0302-3524(80)80027-2, 1980.
Middelburg, J. J., Nieuwenhuize, J., Lubberts, R. K., and Van De Plassche, O.: Organic Carbon Isotope Systematics of Coastal Marshes, Estuarine, Coastal and Shelf Science, 45, https://doi.org/10.1006/ecss.1997.0247, 1997.
Morris, J. T., Sundareshwar, P. V., Nietch, C. T., Kjerfve, B., and Cahoon, D. R.: Responses of coastal wetlands to rising sea level, Ecology, 83, 2869–2877, https://doi.org/10.1890/0012-9658(2002)083[2869:ROCWTR]2.0.CO;2, 2002.
Mudd, S. M., Howell, S. M., and Morris, J. T.: Impact of dynamic feedbacks between sedimentation, sea-level rise, and biomass production on near-surface marsh stratigraphy and carbon accumulation, Estuarine, Coastal and Shelf Science, 82, 377–389, https://doi.org/10.1016/j.ecss.2009.01.028, 2009.
Müller, P. J. and Suess, E.: Productivity, sedimentation rate, and sedimentary organic matter in the oceans – I. Organic carbon preservation, Deep-Sea Research, 26, 1347–1362, https://doi.org/10.1016/0198-0149(79)90003-7, 1979.
Nyman, J. A., Delaune, R. D., Roberts, H. H., and Patrick, W. H.: Relationship between vegetation and soil formation in a rapidly submerging coastal marsh, Marine Ecology Progress Series, 96, 269–279, https://doi.org/10.3354/meps096269, 1993.
Ortiz, A. C., Roy, S., and Edmonds, D. A.: Land loss by pond expansion on the Mississippi River Delta Plain, Geophysical Research Letters, 44, 3635–3642, https://doi.org/10.1002/2017GL073079, 2017.
Qi, M., MacGregor, J., and Gedan, K.: Biogeomorphic patterns emerge with pond expansion in deteriorating marshes affected by relative sea level rise, Limnology and Oceanography, 66, 1036–1049, https://doi.org/10.1002/lno.11661, 2021.
R Core Team: R: A language and environment for statistical computing, R foundation for Statistical Computing, Vienna, Austria, https://www.R-project.org/ (last access: 16 October 2025), 2022.
Redfield, A. C.: Development of a New England Salt Marsh, Ecological Monographs, 42, https://doi.org/10.2307/1942263, 1972.
Reed, D. J., Spencer, T., Murray, A. L., French, J. R, and Leonard, L.: Marsh surface sediment deposition and the role of tidal creeks: Implications for created and managed coastal marshes, Journal of Coastal Conservation, 5, 81–90, https://doi.org/10.1007/BF02802742, 1999.
Rietl, A. J., Megonigal, J. P., Herbert, E. R., and Kirwan, M. L.: Vegetation Type and Decomposition Priming Mediate Brackish Marsh Carbon Accumulation Under Interacting Facets of Global Change, Geophysical Research Letters, 48, https://doi.org/10.1029/2020GL092051, 2021.
Rogers, K., Kelleway, J. J., Saintilan, N., Megonigal, J. P., Adams, J. B., Holmquist, J. R., Lu, M., Schile-Beers, L., Zawadzki, A., Mazumder, D., and Woodroffe, C. D.: Wetland carbon storage controlled by millennial-scale variation in relative sea-level rise, Nature, 567, 91–95, https://doi.org/10.1038/s41586-019-0951-7, 2019.
Schepers, L., Kirwan, M., Guntenspergen, G., and Temmerman, S.: Spatio-temporal development of vegetation die-off in a submerging coastal marsh, Limnology and Oceanography, 62, 137–150, https://doi.org/10.1002/lno.10381, 2017.
Schepers, L., Kirwan, M. L., Guntenspergen, G. R., and Temmerman, S.: Evaluating indicators of marsh vulnerability to sea level rise along a historical marsh loss gradient, Earth Surface Processes and Landforms, 45, 2107–2117, https://doi.org/10.1002/esp.4869, 2020.
Schuerch, M., Spencer, T., Temmerman, S., Kirwan, M. L., Wolff, C., Lincke, D., McOwen, C. J., Pickering, M. D., Reef, R., Vafeidis, A. T., Hinkel, J., Nicholls, R. J., and Brown, S.: Future response of global coastal wetlands to sea-level rise. Nature, 561, 231–234, https://doi.org/10.1038/s41586-018-0476-5, 2018.
Snedden, G. A., Cretini, K., and Patton, B.: Inundation and salinity impacts to above- and belowground productivity in Spartina patens and Spartina alterniflora in the Mississippi River deltaic plain: Implications for using river diversions as restoration tools, Ecological Engineering, 81, 133–139, https://doi.org/10.1016/j.ecoleng.2015.04.035, 2015.
Stalter, R. and Lonard, R. I.: Biological Flora of Coastal Wetlands: Sporobolus cynosuroides (L.) P.M. Peterson & Saarela, Journal of Coastal Research 38(5), 1061–1069, https://doi.org/10.2112/JCOASTRES-D-22A-00002.1, 2022.
Stevenson, J. C., Kearney, M. S., and Pendleton, E. C.: Sedimentation and erosion in a brackish marsh system, Marine Geology, 67, 213–235, https://doi.org/10.1016/0025-3227(85)90093-3, 1985.
Suello, R. H., Temmerman, D., Bouillon, S., Khalifeh, Z., van Puijenbroek, M., Elschot, K., Pelckmans, I., Andersen, T. J., Smit, C., Bakker, J., and Temmerman, S.: Increased sea level rise accelerates carbon sequestration in a macro-tidal salt marsh, Science of the Total Environment, 958, https://doi.org/10.1016/j.scitotenv.2024.178075, 2025.
Temmerman, S., Govers, G., Wartel, S., and Meire, P.: Spatial and temporal factors controlling short-term sedimentation in a salt and freshwater tidal marsh, Scheldt estuary, Belgium, SW Netherlands, Earth Surface Processes and Landforms, 28, 739–755, https://doi.org/10.1002/esp.495, 2003
Temmink, R. J. M., Lamers, L. P. M., Angelini, C., Bouma, T. J., Fritz, C., van de Koppel, J., Lexmond, R., Rietkerk, M., Silliman, B. R., Joosten, H., and van der Heide, T.: Recovering wetland biogeomorphic feedbacks to restore the world's biotic carbon hotspots, Science, 376, 6593, https://doi.org/10.1126/science.abn1479, 2022.
Ursino, N., Silvestri, S., and Marani, M.: Subsurface flow and vegetation patterns in tidal environments, Water Resources Research, 40, https://doi.org/10.1029/2003WR002702, 2004.
Valentine, K., Herbert, E. R., Walters, D. C., Chen, Y., Smith, A. J., and Kirwan, M. L.: Climate-driven tradeoffs between landscape connectivity and the maintenance of the coastal carbon sink, Nature Communications, 14, https://doi.org/10.1038/s41467-023-36803-7, 2023.
Van de Broek, M., Temmerman, S., Merckx, R., and Govers, G.: Controls on soil organic carbon stocks in tidal marshes along an estuarine salinity gradient, Biogeosciences, 13, 6611–6624, https://doi.org/10.5194/bg-13-6611-2016, 2016.
van Huissteden, J. and van de Plassche, O.: Sulphate reduction as a geomorphological agent in tidal marshes (`Great Marshes' at Barnstable, Cape Cod, USA), Earth Surface Processes and Landforms, 23, 223–236, https://doi.org/10.1002/(SICI)1096-9837(199803)23:3<223::AID-ESP843>3.0.CO;2-I, 1998.
Van Putte, N., Temmerman, S., Verreydt, G., Seuntjens, P., Maris, T., Heyndrickx, M., Boone, M., Joris, I., and Meire, P.: Groundwater dynamics in a restored tidal marsh are limited by historical soil compaction, Estuarine, Coastal and Shelf Science, 244, https://doi.org/10.1016/j.ecss.2019.02.006, 2020.
Wang, F., Lu, X., Sanders, C. J., and Tang, J.: Tidal wetland resilience to sea level rise increases their carbon sequestration capacity in United States, Nature Communications, 10, https://doi.org/10.1038/s41467-019-13294-z, 2019.
Wang, F., Sanders, C. J., Santos, I. R., Tang, J., Schuerch, M., Kirwan, M. L., Kopp, R. E., Zhu, K., Li, X., Yuan, J., Liu, W., and Li, Z.: Global blue carbon accumulation in tidal wetlands increases with climate change, National Science Review, 8, https://doi.org/10.1093/nsr/nwaa296, 2021.
Watson, E. B., Oczkowski, A. J., Wigand, C., Hanson, A. R., Davey, E. W., Crosby, S. C., Johnson, R. L., and Andrews, H. M.: Nutrient enrichment and precipitation changes do not enhance resiliency of salt marshes to sea level rise in the Northeastern U.S., Climatic Change, 125, 501–509, https://doi.org/10.1007/s10584-014-1189-x, 2014.
Williamson, P., Gore, C., Johannessen, S., Kristensen, E., Michaelowa, A., Wang, F., and Zhang, J.: Additionality Revisited for Blue Carbon Ecosystems: Ensuring Real Climate Mitigation, Global Change Biology, 31, https://doi.org/10.1111/gcb.70181, 2025.