
the Creative Commons Attribution 4.0 License.
the Creative Commons Attribution 4.0 License.
 | 20 Nov 2026
Climate warming-induced agricultural nitrous oxide emissions can offset mitigation benefits of fertiliser reduction

Lenny H. E. Winkel
Andrea Stenke
Magdalena Necpalova
Moritz Laub
Iris Feigenwinter
Nina Buchmann
Johan Six
Agriculture is the dominant source of anthropogenic nitrous oxide (N2O), a potent greenhouse gas with a high global warming potential. In Switzerland, substantial changes in fertiliser use alongside climatic conditions have occurred over the past four decades, yet the relative contributions of management practices versus environmental change to long-term N2O emission trends remain incompletely understood. Here, we applied the biogeochemical model DayCent at 1 km resolution across Switzerland, integrating spatially explicit datasets on climate, soil properties and agricultural management, to quantify N2O emissions for the period 1981–2020 from croplands and grasslands and attribute emission changes to management versus climate drivers. Simulated national N2O emissions from agricultural soils declined by roughly 5 % from 4.0 to 3.8 kt N yr−1 between the 1980s and 2010s, primarily due to a 25 % reduction in N fertiliser use. Our attribution simulations suggested that under real climate conditions, such a decrease in fertiliser N inputs (−25 %) over the period studied lowered emissions by 15.2 % in croplands and by 12.0 % in grasslands (including permanent meadows and pastures, and high alpine summer pastures). However, compared to a control scenario (in the absence of climate change), rising temperatures over the past 40 years offset these gains, increasing emissions by 5.7 % in croplands and 13.6 % in grasslands. These results show that warming-induced N2O emissions partially negate mitigation from improved fertiliser management, highlighting the need for integrated agricultural N2O mitigation strategies to meet emission reduction targets under future warming.
- Article
(7192 KB) - Full-text XML
-
Supplement
(3574 KB) - BibTeX
- EndNote


Nitrous oxide (N2O) is both a potent greenhouse gas (GHG) and an ozone-depleting substance (Ravishankara et al., 2009). With a 100-year global warming potential approximately 273 times that of carbon dioxide (CO2), it accounts for 6.4 % of the total global radiative forcing during 1750–2022 (IPCC, 2021). Since pre-industrial times, atmospheric N2O concentration has increased from 270 ppb in 1750 to 338 ppb in 2024 (Ghosh et al., 2023; Zhu et al., 2025), with the rate of increase accelerating in recent years, from 0.82±0.33 ppb yr−1 (1980–2020) to 1.15±0.12 ppb yr−1 (2021–2024) (Ghosh et al., 2023; Zhu et al., 2025). Agriculture is the primary source of anthropogenic N2O, contributing more than half of global emissions (Tian et al., 2020), largely through nitrogen (N) inputs such as field application of synthetic fertilisers, livestock excreta and other reactive N (Nr) sources (Tian et al., 2020, 2024; Zhu et al., 2025). As global food demand continues to rise, regulating agricultural N2O emissions has become increasingly critical for climate change mitigation (Davidson, 2012; Reay et al., 2012).
Quantifying N2O emissions from agricultural soils remains challenging due to the complex underlying processes. Mechanistically, N2O is primarily produced through two key processes: nitrification and denitrification (Butterbach-Bahl et al., 2013). Microbial activities responsible for both processes are controlled by environmental factors such as temperature, soil moisture, soil N and oxygen levels, and soil pH (Butterbach-Bahl et al., 2013; Flechard et al., 2007; Skiba and Smith, 2000). In addition, agricultural practices including fertiliser application and harvesting also influence N2O fluxes. In particular, fertiliser application elevates soil N availability and is a primary driver of increased agricultural N2O emissions. Alteration of soil structure, such as by compaction and drying-rewetting cycles, affects N2O production through their impacts on soil water content and aeration status (Beare et al., 2009; Decock et al., 2015; Liu et al., 2018). Interactions among these factors often result in very dynamic N2O emissions, characterised by spatial “hotspots” and temporal “hot moments” (Butterbach-Bahl et al., 2013; Groffman et al., 2009). This intrinsic variability makes it difficult to derive reliable estimates from directly upscaling field measurements for larger spatial and temporal scales.
National greenhouse gas (GHG) inventories commonly rely on emission factor (EF) approaches to estimate N2O emissions from agricultural soils. Many Annex I countries (i.e., industrialised countries and countries with economies in transition) report annual N2O emissions to the United Nations Framework Convention on Climate Change (UNFCCC) predominantly based on Tier I methodologies (FOEN, 2026), which estimate emissions as a fixed proportion of N inputs (i.e., a default aggregated EF of 1 % for fertiliser-induced emissions as N2O-N after accounting for soil organic matter turnover; Buendia et al., 2019). These approaches provide a transparent and consistent framework for estimating management-related emissions at the national scale. However, because EFs are typically fixed in space and time and do not take into account the influence of climatic conditions, soil properties, and local crop and field management on N2O emissions, they only provide a limited representation of spatial and temporal variability in emissions. In contrast, process-based models explicitly represent the mechanisms governing soil N dynamics and simulate the responses of processes such as nitrification and denitrification to environmental drivers and management practices. As a result, they offer the possibility to distinguish effects of agricultural management from environmentally driven variability in N2O emissions and to provide spatially resolved estimates across heterogeneous landscapes. Consequently, they are increasingly recommended for GHG inventory development using Tier II or Tier III approaches (Buendia et al., 2019), especially in regions characterised by strong environmental gradients and rapid climatic change.
Switzerland presents a particularly relevant case for assessing agricultural N2O emissions because it has implemented nationwide agricultural reforms aimed at reducing N losses (Decrem et al., 2007; Herzog et al., 2008; Spiess, 2011). Moreover, Switzerland has a Net-Zero target to reduce all GHG from the agricultural sector by 40 % until 2050 (FOEN, 2025). At the same time, the country has experienced pronounced climate change over recent decades, with warming approximately twice the global average (MeteoSwiss, 2025). These changes in management practices and climatic conditions are expected to alter N availability and soil conditions, which are key controls of nitrification and denitrification processes, thereby influencing N2O emissions (Feigenwinter et al., 2023a; Maier et al., 2022). However, the extent to which climate change and fertiliser management have affected agricultural N2O emissions in Switzerland remains poorly quantified. In particular, long-term national-scale assessments that capture both the spatial and temporal variability of emissions across different agricultural soils are still insufficient.
In this study, we investigated the effects of fertiliser management and climate change on N2O emissions, and present an assessment of N2O emissions from agricultural soils across Switzerland over the past four decades using high-resolution process-based modelling. We compiled spatially explicit datasets on climate (temperature and precipitation), soil properties (soil texture, pH and organic matter) and agricultural management information (crop rotation and distribution, fertiliser application rates, and time of planting and harvesting), and applied the well-calibrated and validated biogeochemical model DayCent at a high spatial resolution of 1 km ×1 km. We also calculated N2O EFs from the difference in N2O emissions between the baseline and no-fertiliser simulations relative to applied synthetic and organic fertiliser N. These modelling-derived EFs were compared with the IPCC Tier 1 EF, which is defined for a broader set of N inputs, including synthetic and organic fertilisers, crop residues and N mineralisation associated with changes in soil organic matter. We use our modelling-derived EFs as a diagnostic measure of the spatial and temporal variability in fertiliser-induced N2O emissions. Specifically, our objectives were to (i) quantify N2O emissions from two major agricultural systems (croplands and grasslands) between 1981 and 2020, (ii) characterise their spatial and temporal variability (both inter-annual and seasonal) and analyse emission drivers, and (iii) assess the influence of fertiliser management versus climate change (temperature increase and changes in precipitation) on emissions.
2.1 Study region
This study focused on Swiss agricultural land, which covers approximately 1.5 million ha (BFS, 2024). Collectively, Switzerland's land use exhibits diverse agro-pastoral functions as a result of complex mountainous terrain and pedoclimatic conditions. Three primary land use types characterise Swiss agriculture: cropland, managed permanent grassland (meadow and pasture), and high alpine summer pastures (SPA) (Fig. S1 in the Supplement). Cropland accounts for nearly 27 % of Switzerland's agricultural area (BFS, 2024) and is predominantly concentrated on the Swiss Plateau, the most densely populated region of Switzerland, where moderate topography, fertile soils and temperate climate provide ideal conditions for intensive arable production. Managed permanent grassland occupies over 40 % of the national agricultural area (BFS, 2024). It includes both lowland meadows and pastures on the plateau and extensive areas within the Pre-Alpine zones. Managed as meadows or pastures, these grasslands provide the essential resources for Switzerland's ruminant livestock sector, particularly dairy and beef production. Management practices (mowing, grazing) are closely adapted to local climatic and topographic conditions. SPA, covering over 30 % of the total agricultural area (BFS, 2024), are situated in the mountainous regions and are utilised exclusively during the summer months (from June to August/September). These summer pastures provide high-quality forage to grazing livestock. Beyond agricultural production, SPA provide other vital ecosystem services (e.g., biodiversity conservation, soil carbon storage, cultural heritage; Schils et al., 2022) and are subject to strict environmental regulations (Meyer et al., 2025; Pauler et al., 2025).
2.2 DayCent model
We used the biogeochemical model DayCent (DayCent17centEVI version), which simulates N and C dynamics of the soil-plant-atmosphere interface at a daily time step (Del Grosso et al., 2001). The model simulates plant growth, soil organic matter (SOM) decomposition, soil emission of trace gases, and changes in key state variables (e.g., soil temperature and soil water content) under varying climatic and land use conditions.
DayCent includes a mechanistic representation of the N cycle in terrestrial ecosystems with differentiated mineral and organic N pools, and simulates major transformation processes such as mineralisation, immobilisation, nitrification and denitrification. These processes respond to environmental factors such as temperature, soil moisture, oxygen status, soil texture, organic matter availability and soil pH (Del Grosso et al., 2000, 2001).
For this study, a key advantage of DayCent is its representation of N2O production driven by nitrification and denitrification. This process-based structure enables simulation of N2O emissions under changing environmental and management conditions at moderate computational cost. Previous studies have demonstrated that calibrations to site-specific soil and climate characteristics improved model performance in reproducing observed N2O emission patterns (Del Grosso et al., 2000; Gurung et al., 2021; Laub et al., 2024; Necpalova et al., 2018). For Switzerland, DayCent was calibrated and evaluated using experimental and measurement data from four long-term experimental sites in Switzerland (Therwil, Frick, Changins and Reckenholz), covering more than 14 major crops and a range of pedoclimatic conditions (Büchi et al., 2017; Hüppi et al., 2015; Krauss et al., 2017; Mayer et al., 2015). The evaluation included crop productivity, soil C dynamics and soil N2O emissions (Necpalova et al., 2018). DayCent was subsequently further calibrated and evaluated using Swiss (as well as French and German) cropland and grassland observations (Ammann et al., 2007, 2009, 2020; Emmel et al., 2018; Feigenwinter et al., 2023a; Fuchs et al., 2018; Merbold et al., 2021), with particular emphasis on key N dynamic parameters and their influences on observed N2O emissions (Dos Reis Martins et al., 2022, 2024). Thus, the seven key N dynamic parameters used in this study were based on values that had been extensively calibrated and evaluated in these previous studies. These previous studies therefore provide a good basis for applying these parameter values across Switzerland, while acknowledging that the available sites do not cover the full climatic, topographic and soil conditions of the country.
2.3 Model input data
We used the same input datasets as in our companion study (Jiang et al., 2026), which we briefly described here for completeness. Model input data include daily weather data, soil properties and land use.
Daily meteorological variables including daily maximum and minimum temperature, and precipitation were obtained at 1 km ×1 km resolution for the period 1981–2020 from the Federal Office of Meteorology and Climatology (MeteoSwiss) (MeteoSwiss, 2025; https://opendatadocs.meteoswiss.ch/c-climate-data/c3-ground-based-climate-data, last access: 6 July 2026). Soil properties, including soil texture (sand, silt and clay content), pH and SOM, were obtained from a national soil database recently developed by the National Competence Center for Soil (“Kompetenzzentrum Boden”) (Stumpf et al., 2024). These data (originally 30 m ×30 m resolution) were resampled to 1 km ×1 km resolution using conservative remapping (CDO; Schulzweida, 2023). Additional properties such as soil bulk density, field capacity, wilting point and saturated hydraulic conductivity were estimated by pedotransfer functions using the built-in DayCent utility programme (Saxton et al., 1986; Saxton and Rawls, 2006).
Land use data for croplands and grasslands (i.e., managed permanent and SPA) were obtained from the Federal Statistical Office (“Bundesamt für Statistik”, BFS) (BFS, 2024). Permanent grasslands in Switzerland are classified into meadows and pastures, with further differentiation by management intensity (intensively-managed, less intensively-managed, extensively-managed types) following national fertiliser guidelines (Sinaj et al., 2017). Switzerland was represented using 24 agri-climatic zones capturing climatic, topographic and regional differences as well as agricultural management (Wüst-Galley et al., 2020). For each zone, annual areas of different cropping systems and grasslands were provided.
2.4 Agricultural management in the simulations
Agricultural management are detailed in DayCent schedule files that represent daily sequences of common operations, including cropping systems (e.g., crop types and rotations), nutrient inputs (e.g., organic and synthetic fertilisation), cultivation, irrigation and harvest. In our simulations, we specified N inputs from both organic and synthetic fertilisers.
Organic fertiliser inputs included animal manure, compost, sewage sludge and digestates, following the categories used in the Swiss National Greenhouse Gas Inventory (NIR; FOEN, 2026). As the dominant share of these organic inputs, manure (including both solid manure and slurry) quantities were estimated from livestock number, livestock-specific C and N excretion rates, and adjusted for losses in housing and storage systems (FOEN, 2026; Wüst-Galley et al., 2020). Spatial allocation of organic fertilisers to croplands and grasslands followed the approach specified in Wüst-Galley et al. (2020), accounting for (i) farm-level application preferences for manure, slurry, or poultry manure to different crop groups (Sinaj et al., 2017), and (ii) fertiliser requirements of various grassland types across elevation zones (Sinaj et al., 2017).
Synthetic fertiliser inputs were derived from national import statistics (FOEN, 2026) and assumed to be applied as ammonium nitrate, which is a major type of fertiliser used in Switzerland. All imported synthetic fertiliser was assumed to be applied in the corresponding year. For each crop and managed grassland, a provisional synthetic fertiliser application rate was estimated as the difference between the recommended mineral N application rate specified in the Swiss guidelines “Principles for the fertilisation of agricultural crops in Switzerland” (Sinaj et al., 2017) and the mineral N supplied by organic fertilisers (assuming 50 % of N in organic fertilisers is in mineral form). The provisional application rates were summed across all crops and managed grasslands to obtain a national synthetic fertiliser requirement in each year. We then calculated a correction factor as the ratio of the total annual amount of imported synthetic fertiliser to the national annual requirement. This correction factor (∼1.7 for the 1980s and ∼1.3 for the 2010s; indicating declined excessive N inputs through synthetic fertilisers) was applied uniformly to the provisional application rates, ensuring that the resulting national synthetic fertiliser use was consistent with the corresponding statistical data. Additional management information (e.g., tillage, planting, fertilisation schedules, and harvest practices) was obtained from the Swiss guidelines “Principles for the fertilisation of agricultural crops in Switzerland” (Sinaj et al., 2017) and previous DayCent implementations for Switzerland (Lee et al., 2020a, b), e.g., a static calendar was used for the whole country, which has fixed dates for each management practice rather than dynamic dates varying by years.
For cropland simulations, we used the same crop rotations as in Jiang et al. (2026), reflecting the common practice for crop production in Switzerland. The crop rotations followed the probability scheme of Lee et al. (2020a, b), which integrates survey data, literature, long-term experiments and agronomic principles, with details presented in Supplement Table S1. Our crop rotation scheme considers both nationwide recommendations for agricultural production and real practices sourced from farmers. We applied this scheme to determine the most likely crop rotation through an iterative allocation procedure, in which cropland area was sequentially allocated to crop types according to their ranked areas, with crop types having larger areas allocated first (Jiang et al., 2026). This approach ensured that the modelled areas of individual crops were consistent with statistical data for the 24 agri-climatic zones (Wüst-Galley et al., 2020) and at the national level. This approach was adopted because spatially explicit crop rotation data are not available at the national scale, while allowing consistency with reported crop distributions across Switzerland at the agri-climatic zone level. Each 1 km ×1 km grid was assigned to its corresponding agri-climatic zone, and the annual mean crop-specific fertiliser application rate for that zone was assigned to all grids within the zone. For grassland simulations, the number of mowing and grazing events and their timing were derived from grassland-use intensity maps generated using Sentinel-2 and Landsat 8 satellite data (Weber et al., 2024).
2.5 Model simulations
The simulations were performed using the same framework as described in Jiang et al. (2026). We applied DayCent at a spatial resolution of 1 km ×1 km across the entire simulated region (Switzerland), resulting in 14 926 and 36 140 grid-specific simulations for croplands and grasslands, respectively. Each simulation included a long spin-up prior to the baseline simulations, following the general approach of Lee et al. (2020a, b). A spin-up of 1980 years was used to stabilise soil C and N pools. This was followed by transient simulations of the study period from 1981 to 2020.
Cropland simulations included 15 major crops representing more than 95 % of Swiss cropland area, including grass-clover ley (i.e., temperate grassland in crop rotation), winter wheat, silage maize, winter barley, rapeseed, sugar beet, grain maize, potato, triticale, spelt, sunflower, pea, rye, soybean, and oat. Annual crop distributions were derived from the crop rotation scheme described above and were consistent with national and regional statistics across 24 agri-climatic zones (Wüst-Galley et al., 2020). As DayCent runs continuously throughout the simulated years at a daily time step, N2O emissions during the period between harvest of one crop and planting of the next were captured, and we calculated these emissions as bare soil emissions.
Grassland simulations used mowing and grazing intensity derived from the 2020 grassland-use intensity maps (Weber et al., 2024). Fertilisation frequency and intensity were linked to management intensity and altitude (Sinaj et al., 2017). We assumed that fertilisers were applied within two weeks after a mowing event. Combining management intensity data and management practice reported by Feigenwinter et al. (2023a, b) and Hörtnagl et al. (2025), a fertilisation timing scenario was developed and applied to the entire country for meadows. For less intensely managed- and high-elevation grassland, mowing and fertiliser intensity are lower (i.e., less mowing events and lower fertiliser inputs), while the timing of fertilisation was assumed to follow the same scenario in our simulations.
For grazing, instead of using DayCent's grazing module, we simulated grazing N inputs as manure application to the field. This alternative approach was chosen to keep the deposited manure during livestock grazing consistent with the input C and N data. For SPA, grazing takes place during the summer months. We assumed a three-month grazing period (from June to end of August) and set synthetic fertilisers to zero for SPA.
Annual total N2O emissions (, kt N yr−1) from Swiss croplands and grasslands were calculated using the following equation,
where N is total number of grid cells belong to any given land use (N is 14 926 and 36 140 for croplands and grasslands, respectively). is the N2O flux in grid i (kg N ha−1 yr−1), and Ai is the timing-varying area of cropland or grassland in grid i (ha).
In parallel to baseline simulations (“baseline”; Table 1) for quantifying total N2O emission from fertilised agricultural soils, we simulated a scenario with no fertiliser inputs (“nofert”; Table 1) to quantify background N2O emissions (Fbg, kg N ha−1 yr−1; defined as N2O emissions from soils that are not fertilised during the simulation period between 1981–2020 so that emissions are from SOM mineralisation and non-fertiliser N sources (e.g., biological N2 fixation (BNF), atmospheric N deposition and return of crop residues), and may also reflect residual N and influences of previous agricultural management represented in the modelled soil pools). Synthetic and organic fertilisers (including manure N deposition during grazing) were set to zero in the “nofert” scenario, while the other practices (e.g., planting, cultivation, harvest) specified in DayCent's schedule files were the same as the baseline simulations. Subsequently, the following equation is used to calculate modelling-derived EF (EF)
where Nfert is the applied fertiliser rate (kg N ha−1 yr−1) in baseline simulations.
Table 1Model simulations performed using DayCent, and corresponding fertiliser input and meteorological input for each scenario of simulation.

a Fertiliser N input fixed to the 1980s level. b Meteorological input (temperature and precipitation) fixed to the 1980s level.
In addition, we quantified the extent to which changes in national N2O emissions were driven by fertiliser reduction or climate change employing two model scenarios. To investigate the fertiliser reduction effect, we fixed the fertiliser application rates of individual crop types at the 1980s level (“unchanged fertiliser”; “fert1980” in Table 1) throughout the study period, while simulating emissions under time-varying meteorological inputs (“real climate”, i.e., climate inputs varying with time) as used in the baseline simulations. The difference between this model scenario and the baseline simulation was attributed to changes in fertiliser inputs. Note that the national total fertiliser inputs also depend on land use areas which changed land use over the past 40 years, especially for croplands. Our simulations accounted for these temporal changes in land use areas, and the corresponding land use area in each year was used to calculate the national N2O emissions as specified in Eq. (1). To investigate the climate effect, we fixed the climate representative for ∼1980 (“unchanged climate”; “clim1980”; Table 1) for the entire study period, while simulating emissions under time-varying fertiliser inputs (“real fertiliser inputs”, i.e., inputs varying with time) as used in the baseline simulations. For this model scenario, the meteorological input data were detrended and anchored to the climatology of 1975–1985, while the seasonal cycle and the inter-annual variability over the past 40 years were preserved. The difference in N2O emissions compared to the baseline simulations thus resulted from the climate effect.
2.6 Statistical analysis and sensitivity tests
We investigated the effects of environmental drivers, plant performance, and management practices on N2O fluxes and EFs through correlation analysis and Principal Component Analysis (PCA). The statistical analysis was conducted using the 40-year average values of variables and simulated fluxes in each grid cell. The environmental drivers included mean annual temperature (MAT), mean annual precipitation (MAP), soil pH, soil clay content, soil bulk density (BD) and SOM. We used the modelled N use efficiency (NUE) that is calculated from N removed through harvests divided by total N input as an indicator for plant performance. To quantify pairwise relationships between N2O metrics (flux and EF), environmental drivers and plant performance, both Pearson and Spearman correlation coefficients were calculated.
PCA was performed on the N2O metrics, environmental variables and NUE. The analysis was conducted using singular value decomposition of the covariance matrix. Principal components (PCs) were ranked according to the proportion of total variance explained. The first three principal components (PC1–PC3) were retained for interpretation, as they together captured the majority (∼65 %) of variability in the dataset.
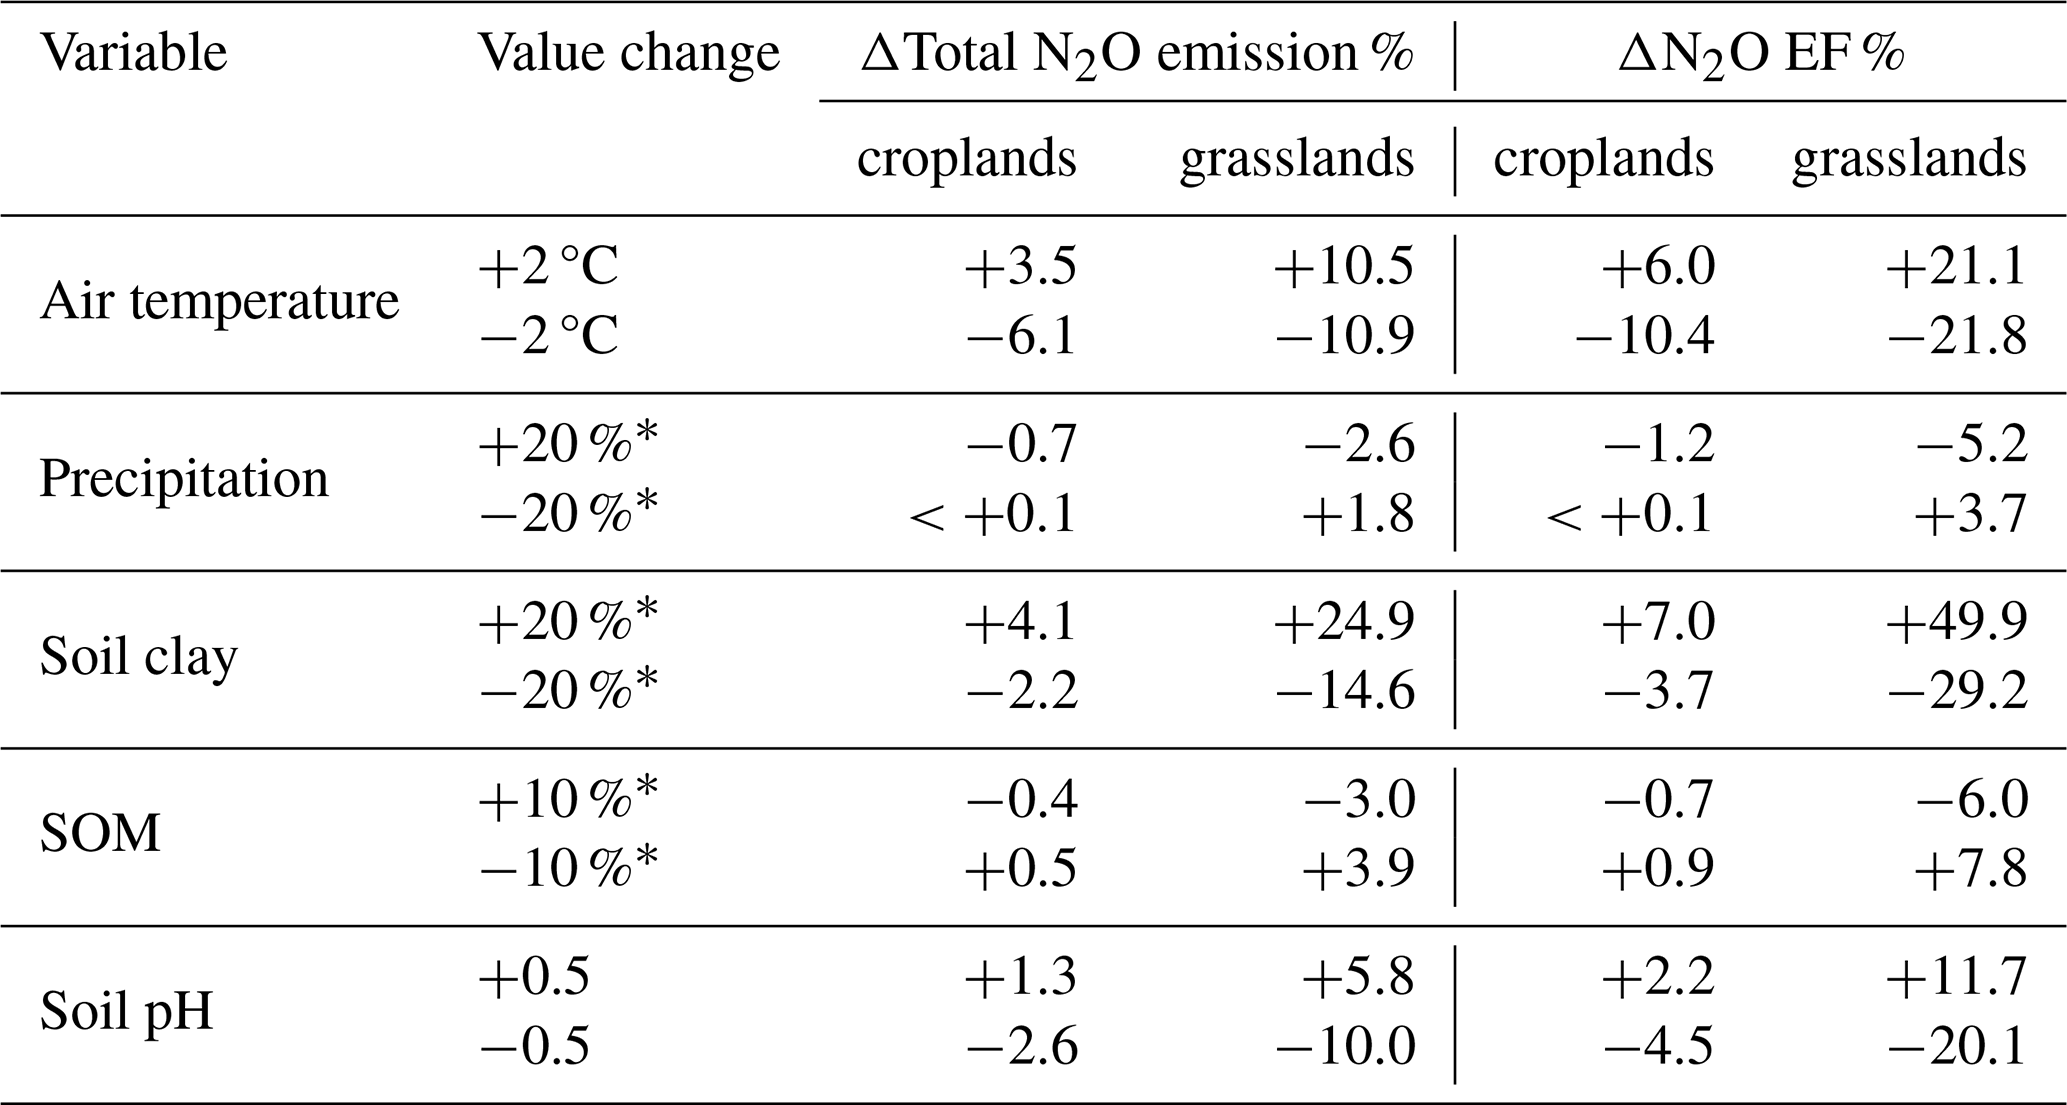
We also conducted sensitivity tests by selecting five key input variables (air temperature, precipitation, soil clay content, SOM and soil pH). These variables were perturbed one-at-a-time within a specified range to examine their effects on modelled N2O emissions (see Table 2 for details). These sensitivity tests were performed on the national scale and applied the same model settings as the baseline simulations. For climate inputs, daily values were changed in these sensitivity simulations. The changes in 40-year average N2O emissions and EFs between the baseline results and sensitivity tests were reported.
Table 2Results of sensitivity tests of environmental variables and soil properties for their effects on N2O emission and EF in the model. Changes in total N2O emission and EF were calculated using the national annual total values averaged over the simulated period (1981–2020), with absolute values of the baseline simulations shown in Table S3.
* These changes are relative values.
Because comprehensive historical records of field-specific fertilisation, planting and harvest (mowing) dates were unavailable, we could not reconstruct year-specific management timing. We therefore conducted two additional rounds sensitivity tests in which dates of management practices were rescheduled. For croplands, planting, fertilisation and harvest dates were advanced by (a) 7 and (b) 14 d for spring crops relative to the prescribed crop calendar, whereas autumn planting dates of winter crops were kept identical to those in the baseline simulations and fertilisation and harvest dates in the following year were advanced by 7 and 14 d. For grasslands, fertilisation and mowing dates were shifted by ±14 d to assess the sensitivity of N2O emissions to management timing.
2.7 Uncertainty evaluation
Uncertainty in modelled national N2O emissions was evaluated using a Monte Carlo ensemble approach based on 200 parameter realizations generated using Latin Hypercube Sampling (LHS), combined with a spatially explicit implementation of the DayCent model. We focused on quantifying the uncertainty arising from N cycle parameters in DayCent (details in Table S2), which have been shown to substantially influence model performance and cumulative N2O emissions (Dos Reis Martins et al., 2022, 2024).
Uncertainty distributions for the selected model parameters was defined based on the default, mean and range of calibrated values reported by Dos Reis Martins et al. (2022, 2024). A total of 200 parameter sets were generated using LHS to provide broad and approximately uniform coverage of the multidimensional parameter space. The baseline simulations comprised more than 50 000 grids. Running 200 times over the full simulation domain was computationally expensive. We therefore used Conditioned Latin Hypercube Sampling (cLHS) to create a representative subset (n=400) of the simulated grids. The subset grids were conducted using key environmental and management variables that influence N2O emissions, including MAT, MAP, SOM, soil pH, soil clay content, fertiliser intensity and organic fertiliser fraction. The selected grids were used to represent the multivariate heterogeneity of environmental conditions and management practices from the full simulation domain. For each of the 200 parameter sets, DayCent was run independently for all representative grids.
The ensemble of these modelled N2O emission estimates was summarized using its empirical percentiles. The 2.5th and 97.5th percentiles were used to define a 95 % simulation interval, representing the central 95 % of modelled emission outcomes generated by propagating the prescribed parameter uncertainty through the DayCent model. This interval represents uncertainty associated with the selected DayCent N cycle parameters rather than a statistical confidence interval for the true N2O emissions or their mean (von Brömssen and Röös, 2020). The uncertainty analysis does not account for uncertainties associated with model structure, climate inputs, soil datasets or management data.
3.1 Simulated N2O emissions from Swiss croplands and grasslands
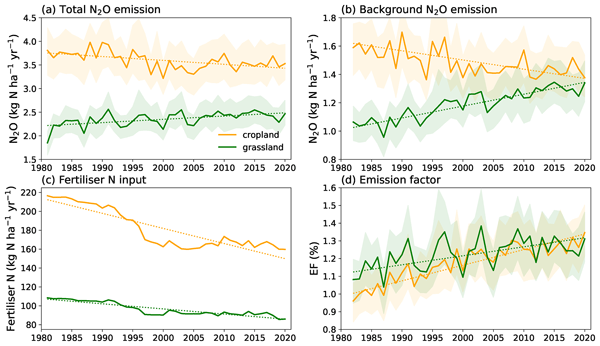
Our simulations suggest that total N2O emissions per unit area from Swiss croplands decreased from 3.8 kg N ha−1 yr−1 in the 1980s (average for 1981–1990) to 3.5 kg N ha−1 yr−1 in the 2010s (average for 2011–2020) (Fig. 1a and Table S3), while modelled background N2O emissions (i.e., emissions without N additions from synthetic and organic fertilisers, representing SOM mineralisation, BNF of legumes and grass-clover mixture, and atmospheric deposition) declined from 1.6 to 1.4 kg N ha−1 yr−1 (Fig. 1b and Table S3). Over the past four decades, there was a ∼22 % reduction in N inputs through synthetic and manure fertilisers to croplands (Fig. 1c and Table S3), while cropland area also decreased by 12 % (Table S3). Contrary to the decreasing trends of emissions, modelled N2O EF for croplands increased substantially over time (Fig. 1d and Table S3), from approximately 1.0 % in the 1980s to around 1.3 % in the 2010s.
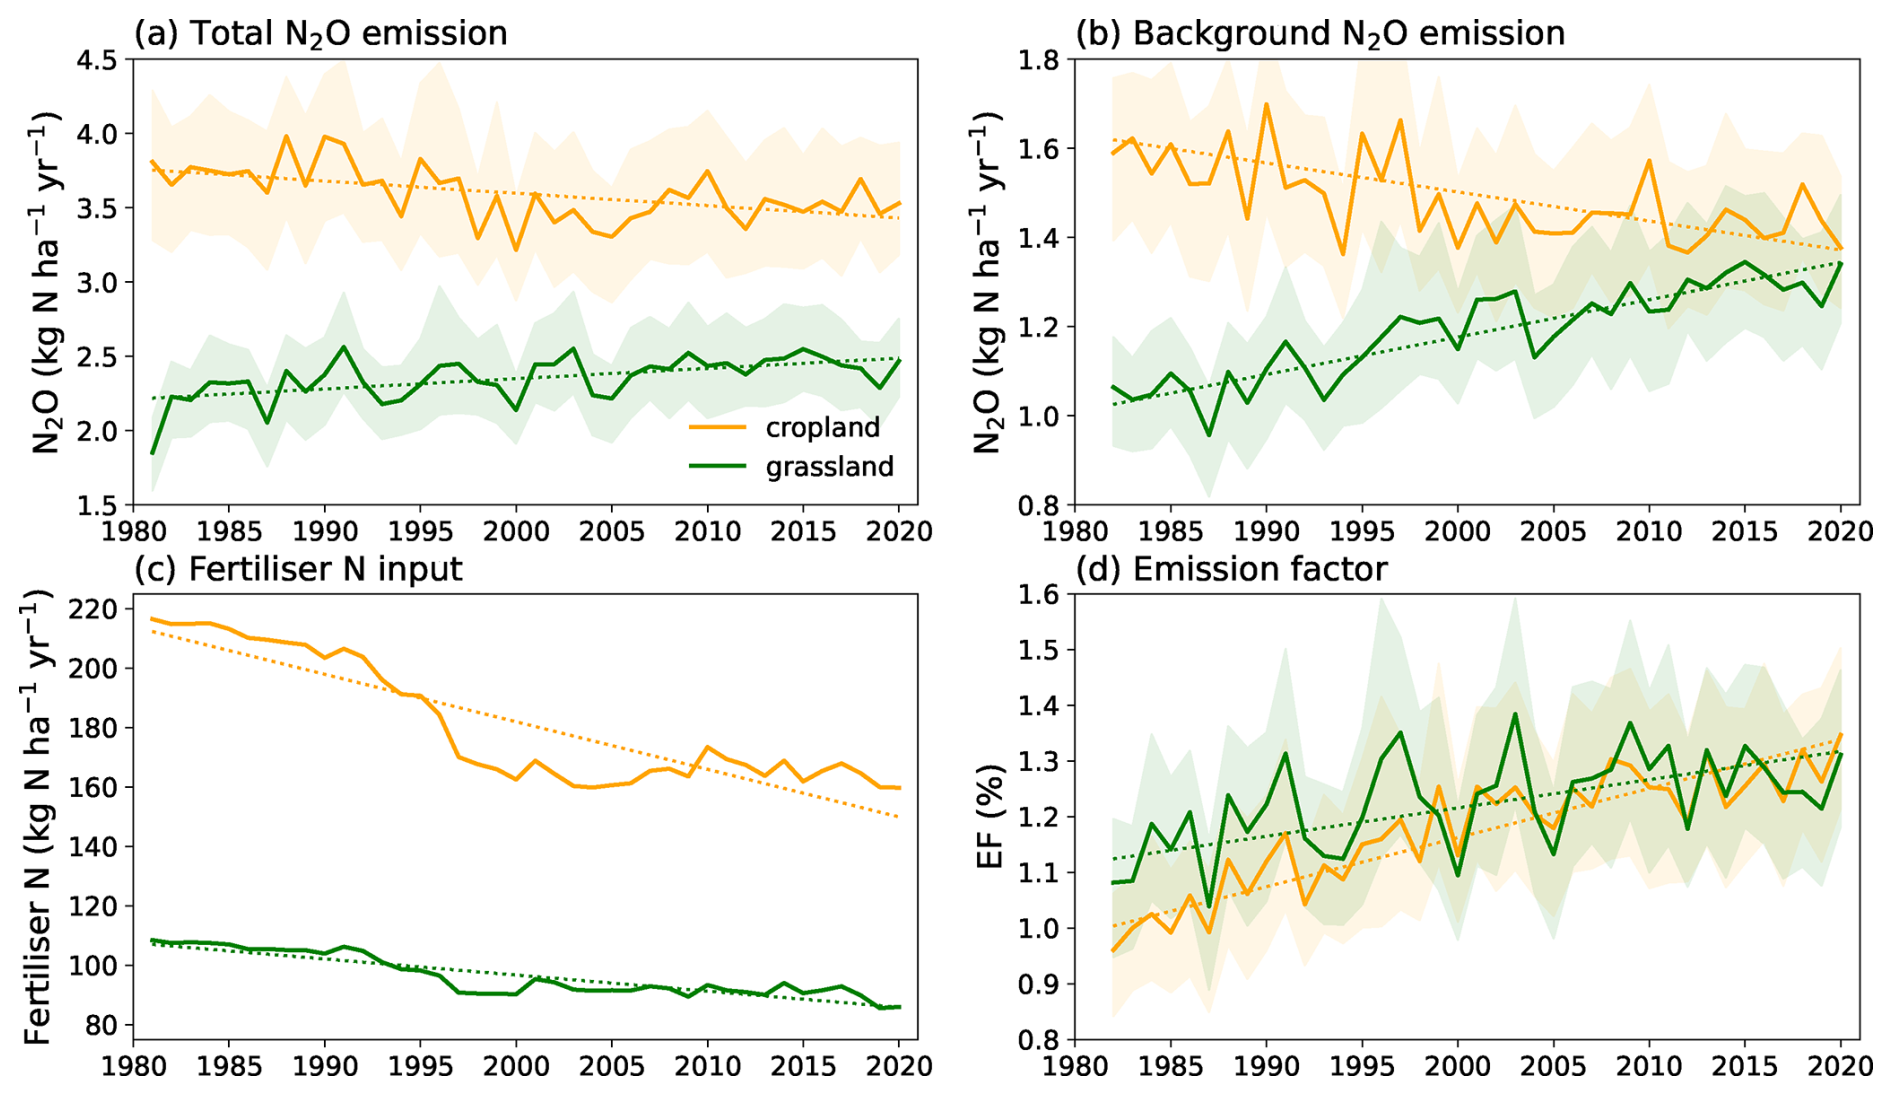
Figure 1Timeseries results for Swiss cropland (yellow) and grassland (green) from DayCent modelling for 1981 to 2020. (a) Simulated total N2O emissions per unit area (kg N ha−1 yr−1). (b) Simulated background N2O flux per unit area (kg N ha−1 yr−1) without fertiliser inputs. (c) Fertiliser N inputs per unit area (kg N ha−1 yr−1) to agricultural land based on national statistics, including both synthetic and organic fertilisers. Manure deposition on pastures during grazing is accounted. (d) Annual mean N2O emission factors (%) derived from DayCent modelling. Grassland includes managed permanent meadows and pastures, and summer pastures. Dotted lines show statistically significant trends over the simulated 40 years determined by Mann-Kendall Trend test (with significance level P<0.001). Shaded areas indicate uncertainty (95 % uncertainty interval) due to model parameters estimated from the Monte Carlo approach (Sect. 2.7). Note that the y-axes of each panel do not start from zero. National total results for simulated variables are shown in Fig. S2.
Compared to croplands, N2O emissions from Swiss grasslands (including permanent managed meadows and pastures, and SPA) exhibited a slightly increasing trend over the past 40 years. In the 1980s, simulated grassland N2O emissions were 2.2 kg N ha−1 yr−1. Although fertiliser inputs dropped by ∼15 % in the 1990s (average for 1991–2000), emissions did not show a significant reduction during this period. Instead, modelled N2O emissions gradually increased by 9 %, reaching 2.4 kg N ha−1 yr−1 in the 2010s. The area of Swiss grasslands showed smaller changes than croplands (Table S3), with a <1 % reduction in permanent grassland and a 7 % reduction in SPA between the 1980s and the 2010s (Table S3). In contrast to croplands, simulated background N2O fluxes from grasslands exhibited a long-term increasing trend (Fig. 1b). Similar to cropland, modelled EFs for grassland increased (Fig. 1d).
3.2 Spatial and temporal variations in modelled N2O emissions
In the 2010s, modelled background N2O emissions in Swiss croplands (due to SOM mineralisation, BNF and atmospheric deposition) ranged between 1.0 and 2.0 kg N ha−1 yr−1across the Swiss Plateau (Fig. 2a), while background fluxes in grasslands were mostly below 1.0 kg N ha−1 yr−1 in SPA and many parts of the Swiss Plateau (Fig. 2b). Total emissions from both croplands and grasslands exhibited strong spatial heterogeneity (Fig. 2c, d). Emissions from croplands were largely confined to the Swiss Plateau, the primary crop-production zone, with emissions generally exceeding 3.0 kg N ha−1 yr−1.We found that N2O emissions during the bare soil period accounted for 24 %–28 % of total emissions from cropland (Table S3 and Fig. S3). In accordance with the wider distribution of grasslands across Switzerland, simulated grassland N2O emissions differed substantially in space, showing a sharp north-south gradient across the lowlands and Alpine regions. Our model results showed that grasslands had higher emissions per unit area than croplands in the northern and northwestern regions, with emissions exceeding 6.0 kg N ha−1 yr−1. In SPA areas, N2O fluxes remained below 1.0 kg N ha−1 yr−1, very close to the background levels. Total N2O emissions from Swiss grasslands were modelled as nearly double those of croplands at the national scale (Fig. S2a), reflecting the larger land use area (∼70 % of Swiss agricultural area is grassland). Notably, for both land use types, the highest emissions were found in the northwestern part of the country, i.e., northern part of the Jura region, with values exceeding 4.0 and 7.0 kg N ha−1 yr−1, respectively.
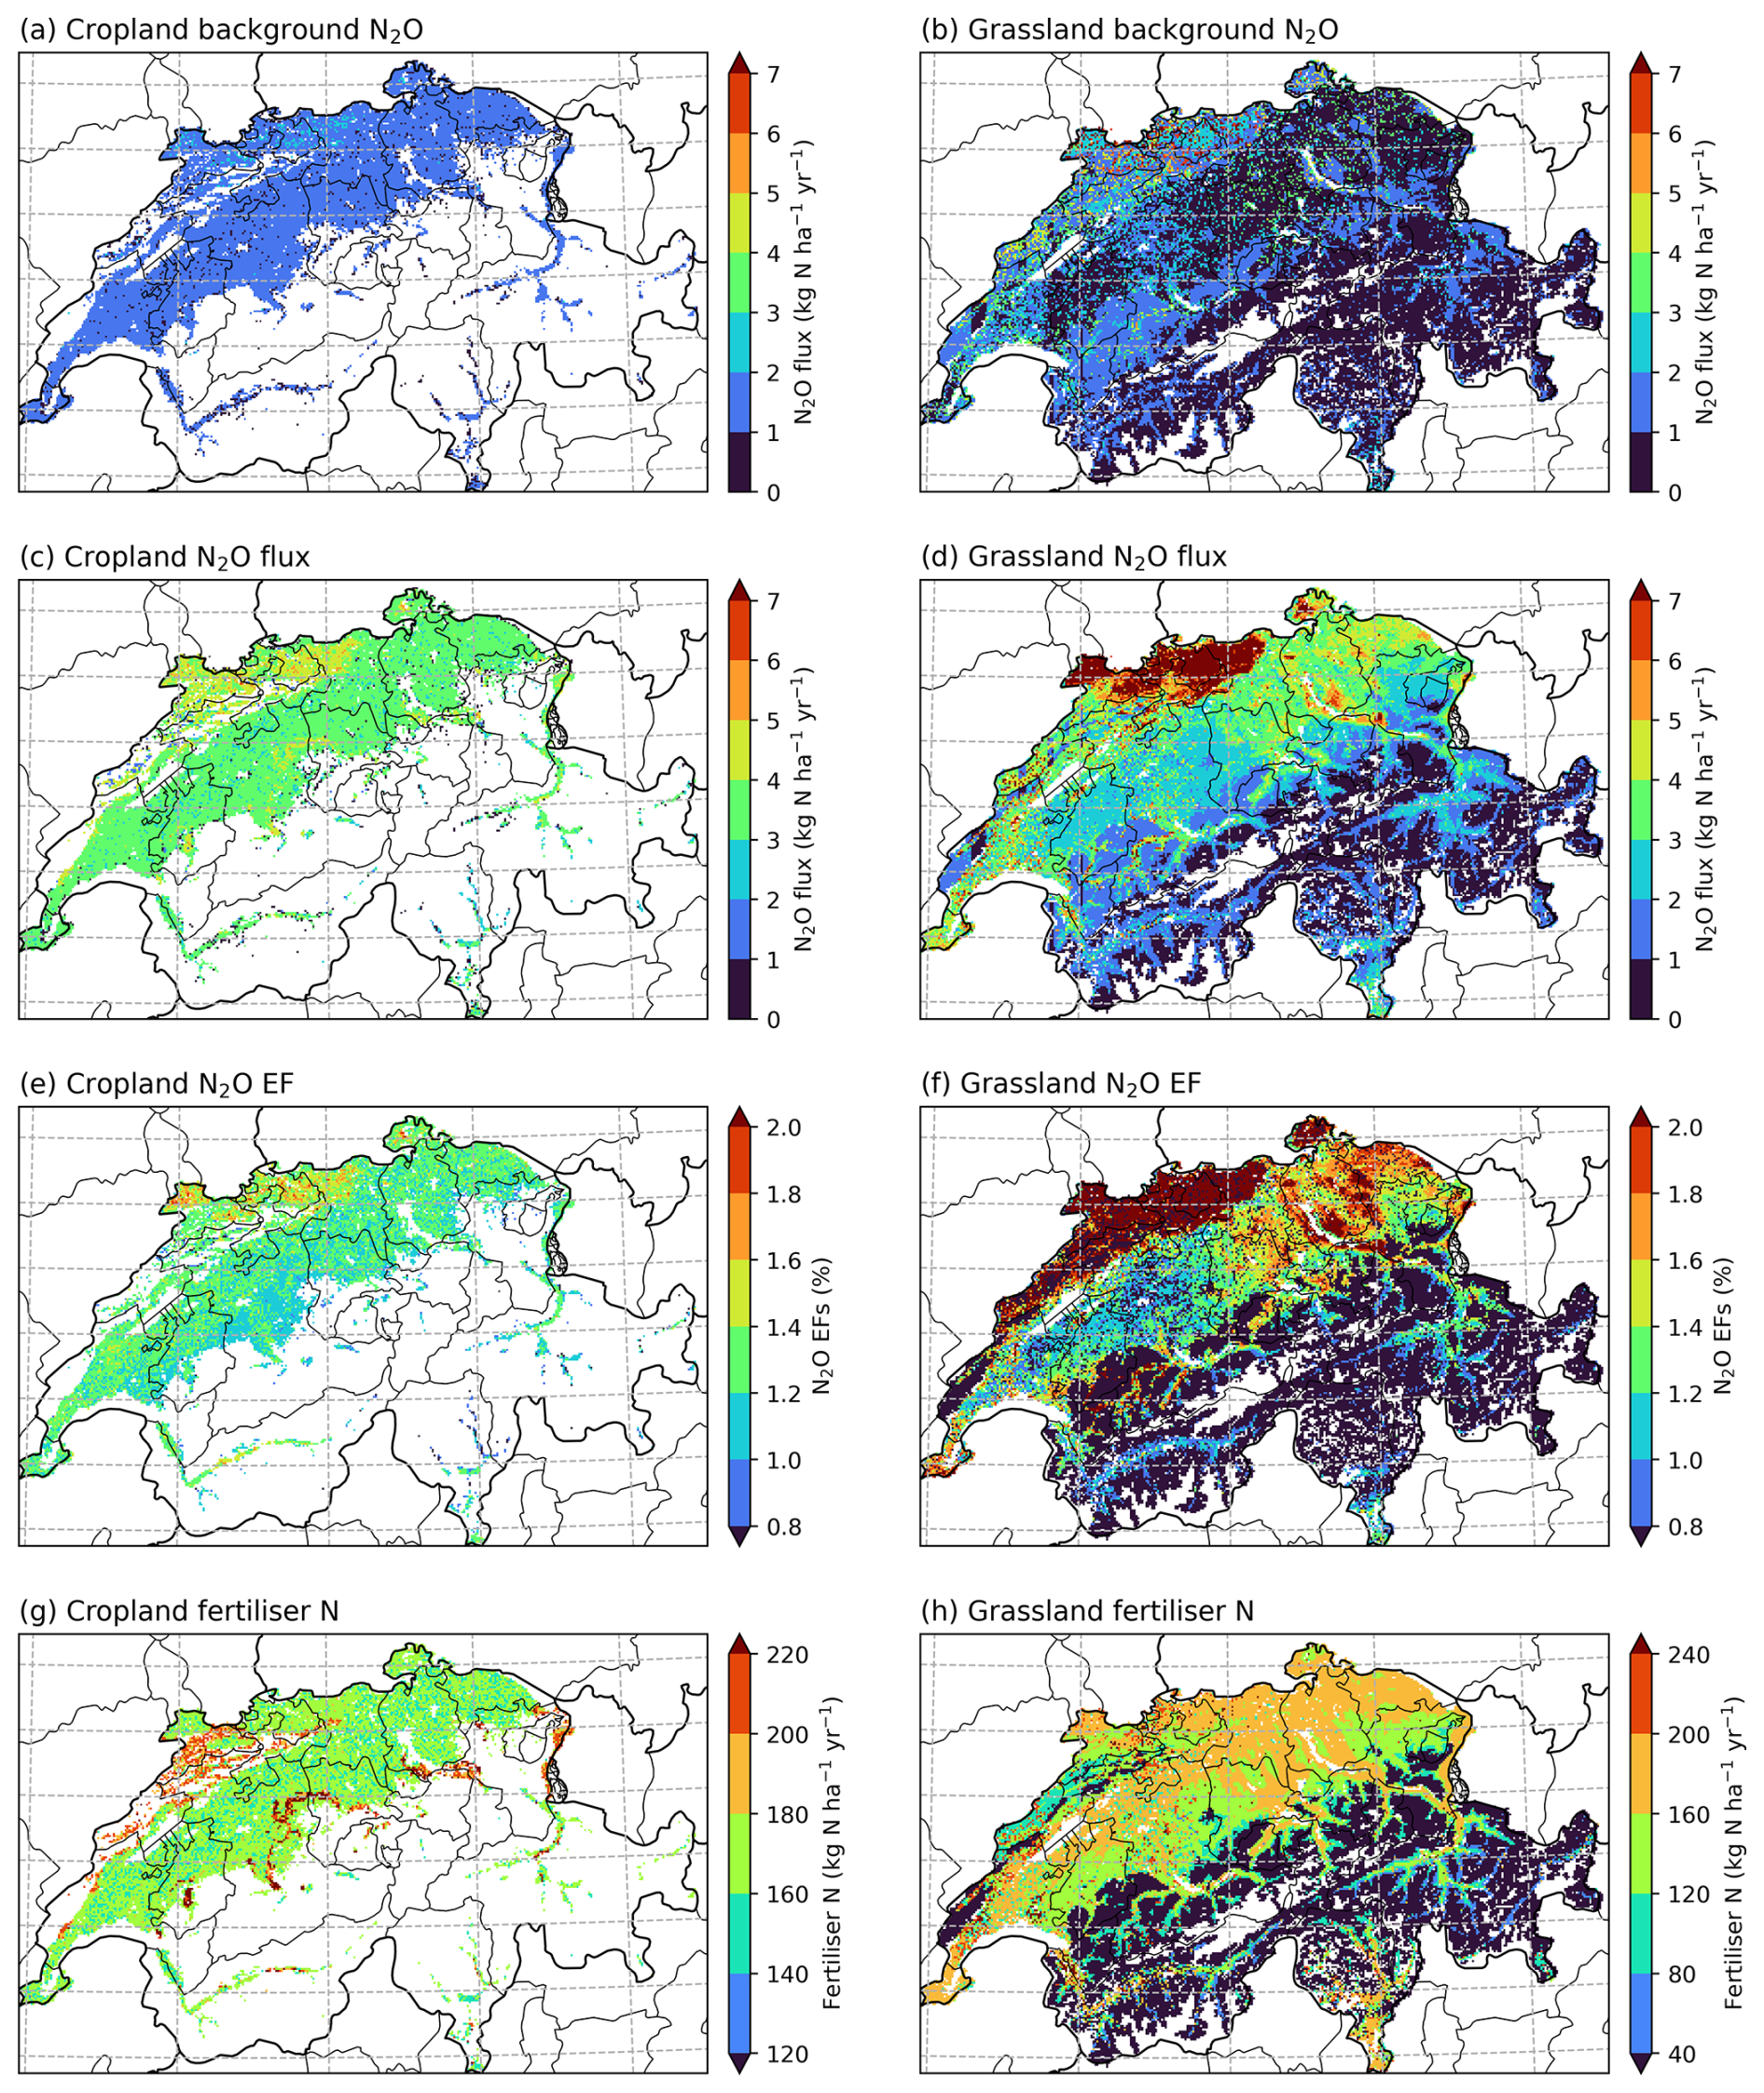
Figure 2Simulated annual mean values for (a, b) background N2O flux (i.e., no-fertilisation, representing soil organic matter mineralisation, biological N2 fixation and atmospheric deposition), (c, d) total N2O flux, (e, f) model-derived N2O emission factors, and (g, h) fertiliser N inputs (including both synthetic and organic fertilisers) for Swiss cropland and grassland in the 2010s (from 2011 to 2020). Grassland includes managed permanent meadows and pastures, and summer pastures. White areas indicate no N2O emissions due to zero activity data.
The model-derived EFs showed distinct differences between the two land use types (Fig. 2e, f). Croplands EFs were more spatially uniform than those of grasslands in the lowland regions, with most of the Swiss Plateau exhibiting EFs between 1.0 and 1.4 %. By comparison, grassland EFs exhibited extreme spatial variations; high EFs (>1.6 %) were found in intensive grassland zones such as the eastern Swiss Plateau, whereas in the Alpine regions, EFs fell below 0.8 % in less intensively managed systems (extensive pastures and SPA). Again, mirroring the spatial pattern of N2O fluxes, the highest EFs (>2 %) occurred in the northwest (Jura region), more than doubling the IPCC default value (aggregated value for synthetic and manure fertilisers).
Seasonal trends in modelled N2O fluxes differed between croplands and grasslands (Fig. 3). Intensive spring fertilisation (between March and May, as shown in Fig. 3b) took place before the summer season when vigorous crop growth started, resulting in the largest monthly emissions (>0.5 kg N ha−1 per month) in May and June. In general, modelled cropland N2O emissions were high from April to September (Fig. 3c). Simulated grassland emissions peaked later than croplands, with highest monthly values (∼0.4 kg N ha−1 per month) from July to September, coinciding with high N inputs as well as warm and humid conditions. Moreover, grazing in SPA that largely takes place in these months caused additional emissions. Compared to spring and summer seasons, emissions in winter were lower, reflecting minimal N inputs and lower temperature. Simulated background N2O emissions showed similar seasonality as total N2O emissions (Fig. 3d), largely driven by SOM mineralisation (Fig. S4a). Percentage of background N2O emission was higher in months without intense fertiliser application (i.e., December–January–February; Fig. S4b).
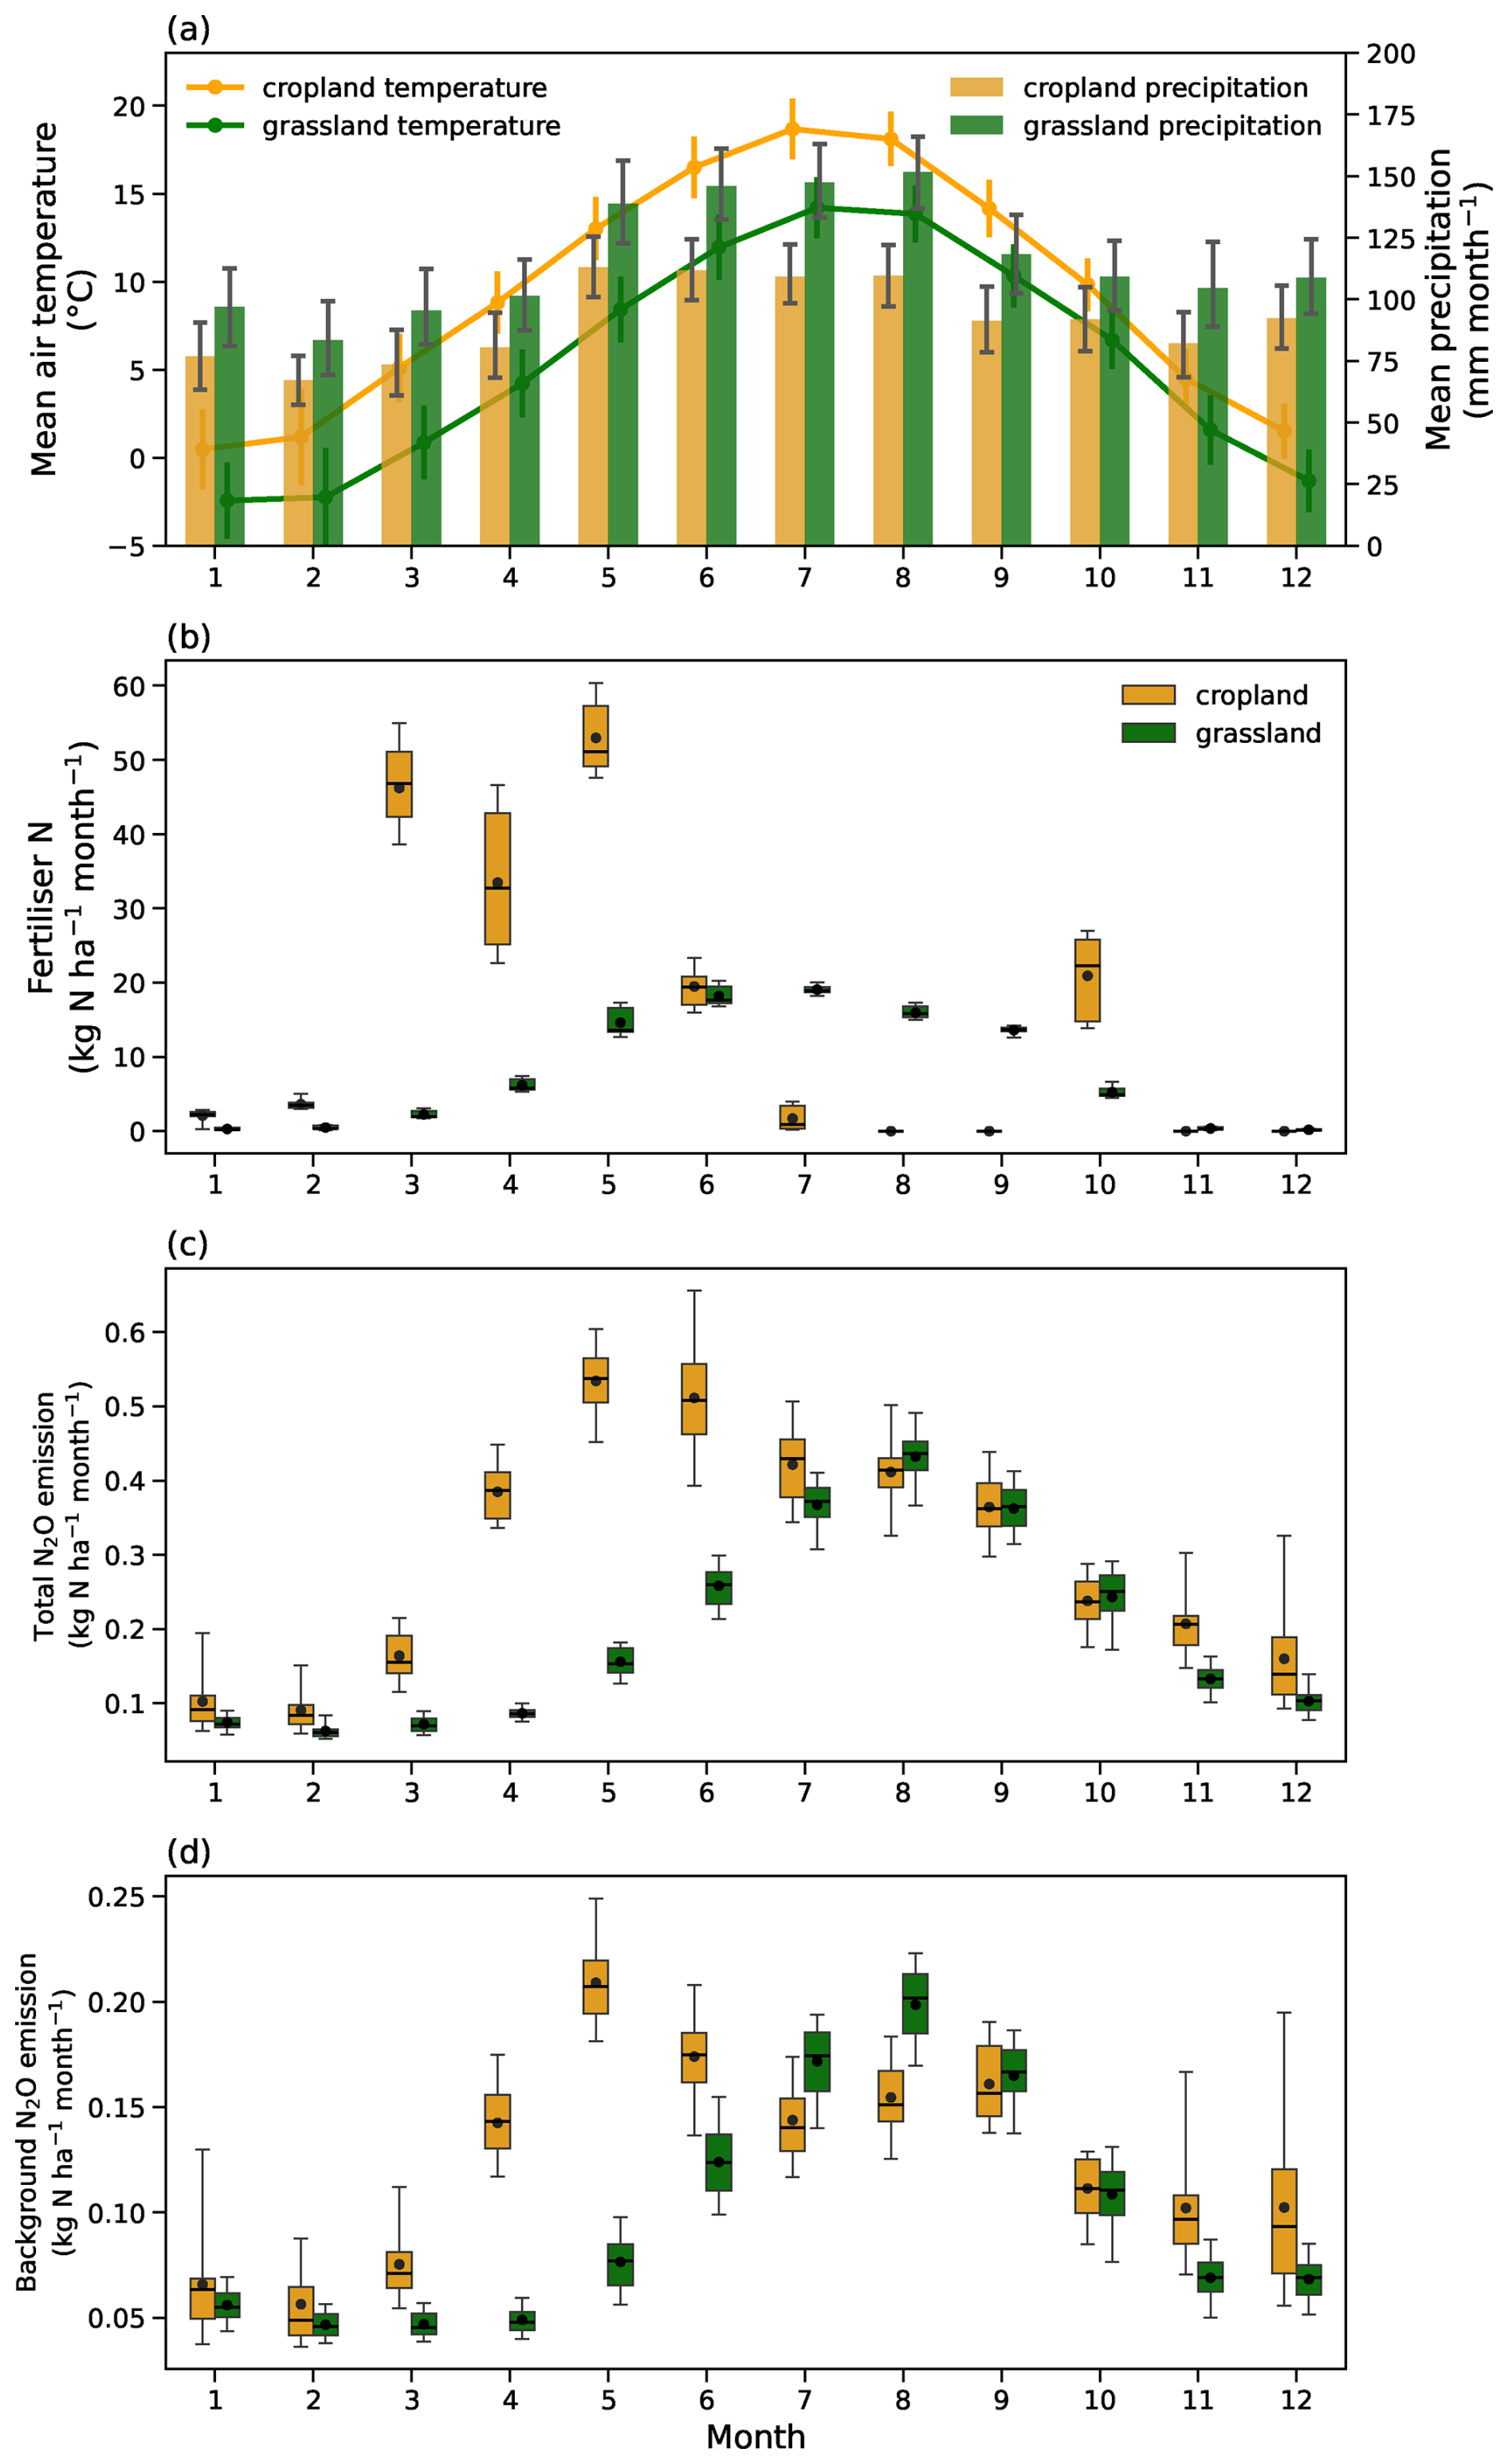
Figure 3Monthly (a) climatic conditions, (b) fertilisation intensity, (c) modelled total N2O emissions and (d) modelled background N2O emissions for Swiss croplands and grasslands (including managed permanent grasslands and summer pastures). The curves and bars in panel (a) represent monthly average temperature (°C) and monthly total precipitation (mm per month). The boxplots show the mean (dots), median (horizontal lines), 25th to 75th percentile (boxes) and 5th to 95th percentile (whiskers) of the values from 1981 to 2020.
3.3 Factors affecting N2O emissions from agricultural land
Carrying out correlation analyses on 40-year average values of all simulated grids, it was found that emissions (and EFs) from agricultural soils across Switzerland were positively correlated with soil clay content (Pearson's r=0.47 for croplands and 0.62 for grassland), pH (r=0.38 and 0.61, respectively) and MAT (r=0.11 and 0.58, respectively), but showed negative correlations with NUE ( and −0.63, respectively), MAP (0.16 and −0.37, respectively) and SOM ( and −0.26, respectively; Fig. 4a and d). Increased emissions and EFs were also associated with higher soil BD in grasslands.
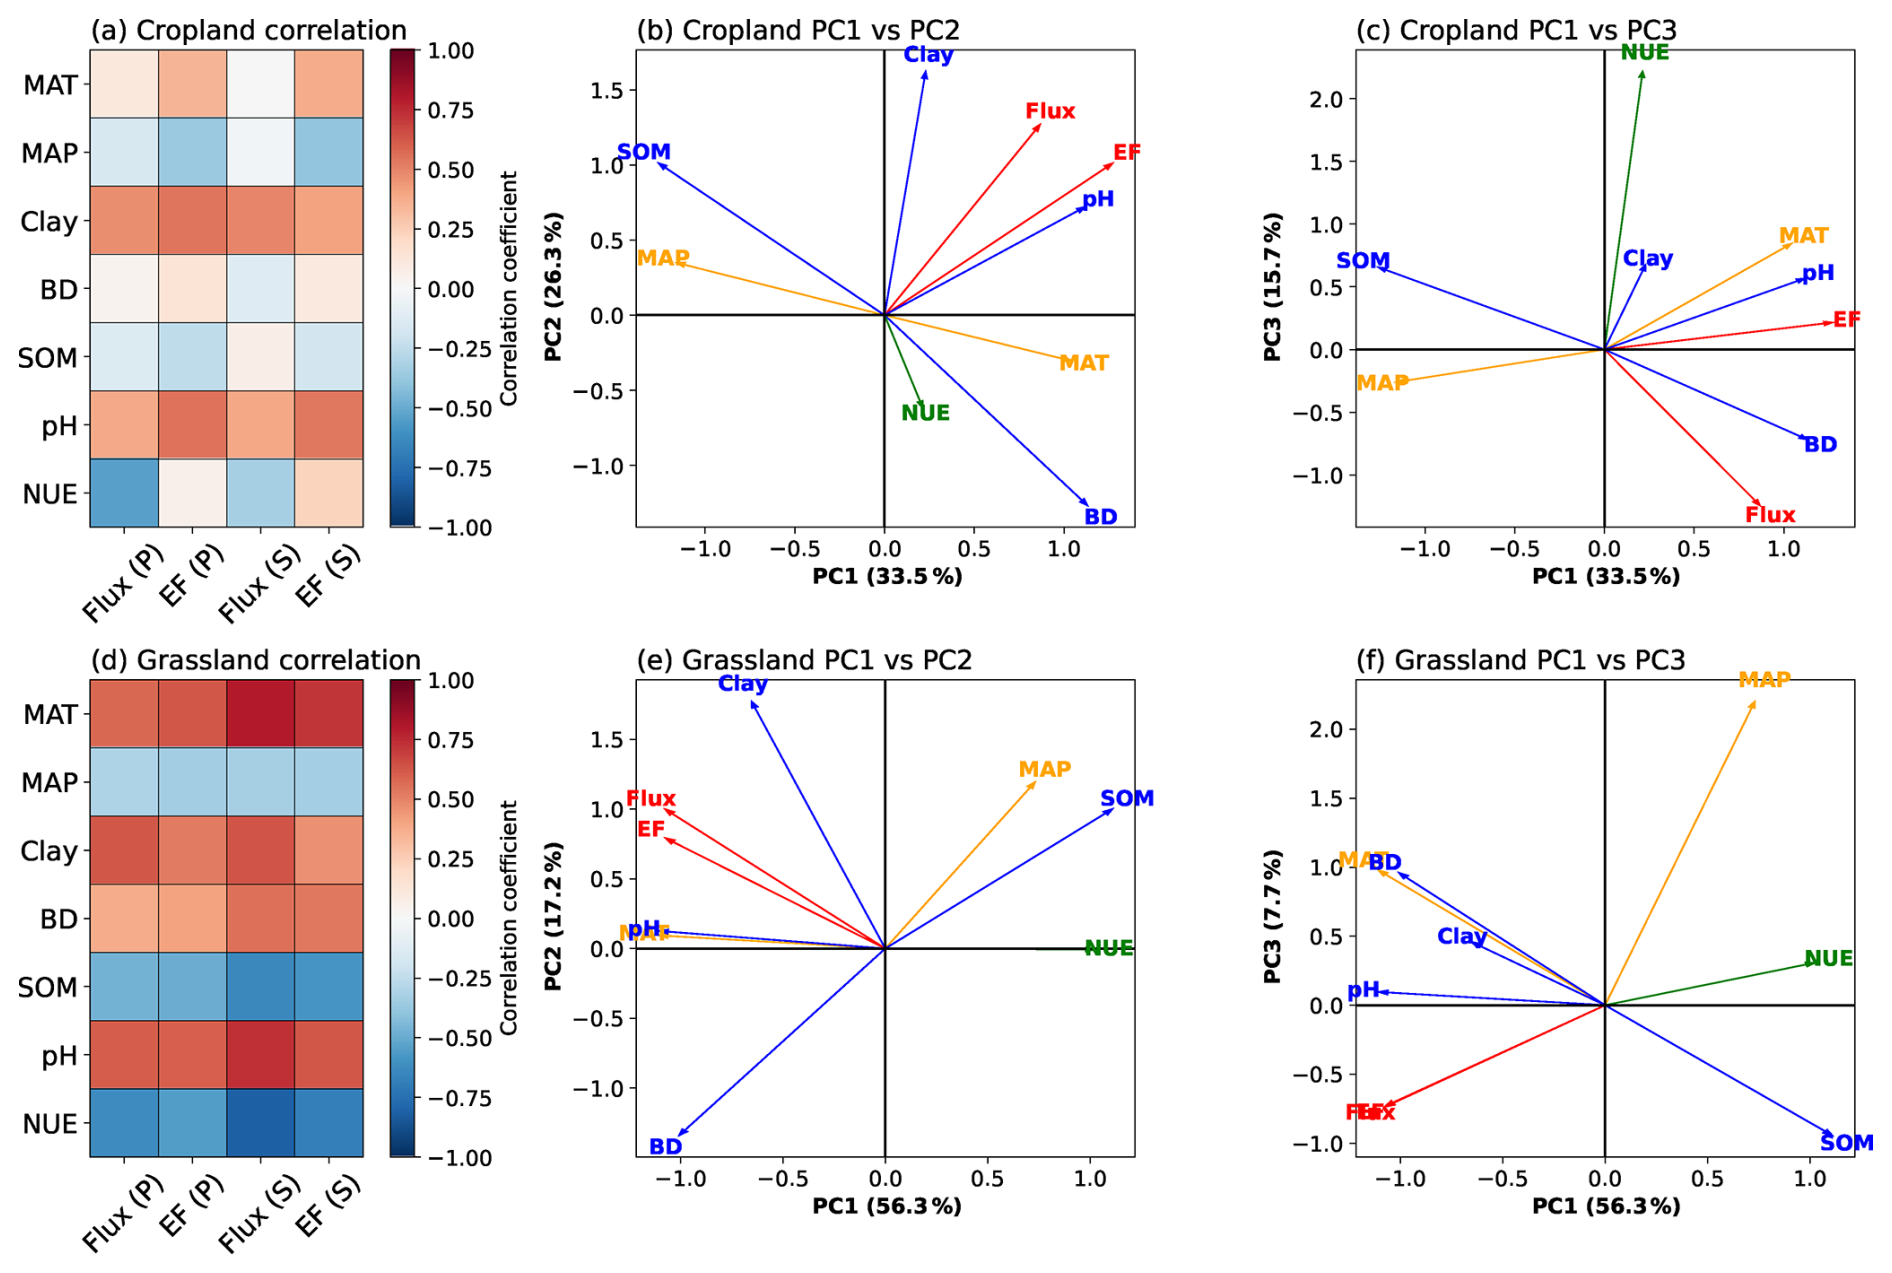
Figure 4Effect of environmental variables (mean annual temperature–MAT, mean annual precipitation–MAP), soil properties (clay content, bulk density, soil organic matter, pH) and plant growth (N use efficiency–NUE) on modelled N2O emissions and emission factors of Swiss cropland (a–c) and grassland (d–e). (a, d) Linear correlation matrix between analysed variables with modelled N2O flux and EFs. Colours represent Pearson (P) and Spearman (S) correlation coefficients. (b, e) PCA loading plot of all variables on PC1 (cropland: 33.5 %; grassland: 56.3 %) and PC2 (cropland: 26.3 %; grassland: 17.2 %). (c, f) PCA loading plot of all variables on PC1 and PC3 (cropland: 15.7 %; grassland: 7.7 %). Colours of PCA loading plots indicate variable groups: red (N2O flux and EF), orange (climate variables), blue (soil physicochemical properties) and green (plant growth).
The PCA results corroborated the correlation analysis. N2O fluxes and EFs clustered tightly along PC1 (Fig. 4b, e), indicating that they were governed by the same factors, i.e., soil characteristics (clay content and pH) and climatic conditions (MAT). High emissions were linked to high-clay soils, whereas low emissions were associated with high NUE. We found that emissions increased as SOM decreased and as soil pH increased, especially in grasslands (Fig. 4e).
In general, the results of the model sensitivity tests were consistent with the correlation analysis (Table 2). Air temperature, soil texture and pH had more significant and positive impacts on modelled N2O emissions and EFs than precipitation and SOM which showed negative effects; higher simulated emissions and EFs tended to occur in hotter environments, more alkaline soils and soils with higher clay content. In contrast, wetter and more SOM-rich soils suppressed simulated N2O emissions, although these effects were found to be limited for Swiss croplands.
3.4 N2O emission changes driven by fertilisation and climate
Over the past four decades, decreased fertiliser N inputs reduced N2O emissions, whereas emissions increased in a warmer and slightly drier climate (Fig. 5a, b). According to our model simulations (i.e., baseline simulations and scenario simulations with time-varying climate but fixed fertiliser inputs at the 1980s level, i.e., fert1980; Table 1), emissions between 2011 and 2020 would have declined by 15.2 % in croplands and 12.0 % in grasslands because of a substantial reduction in fertiliser use, which occurred mainly in the Swiss Plateau, with nationwide decreases in emissions ranging between 12 %–20 % (Fig. 5c, d). In SPA, this effect was limited because most N inputs came from grazing, which only changed to a limited extent.
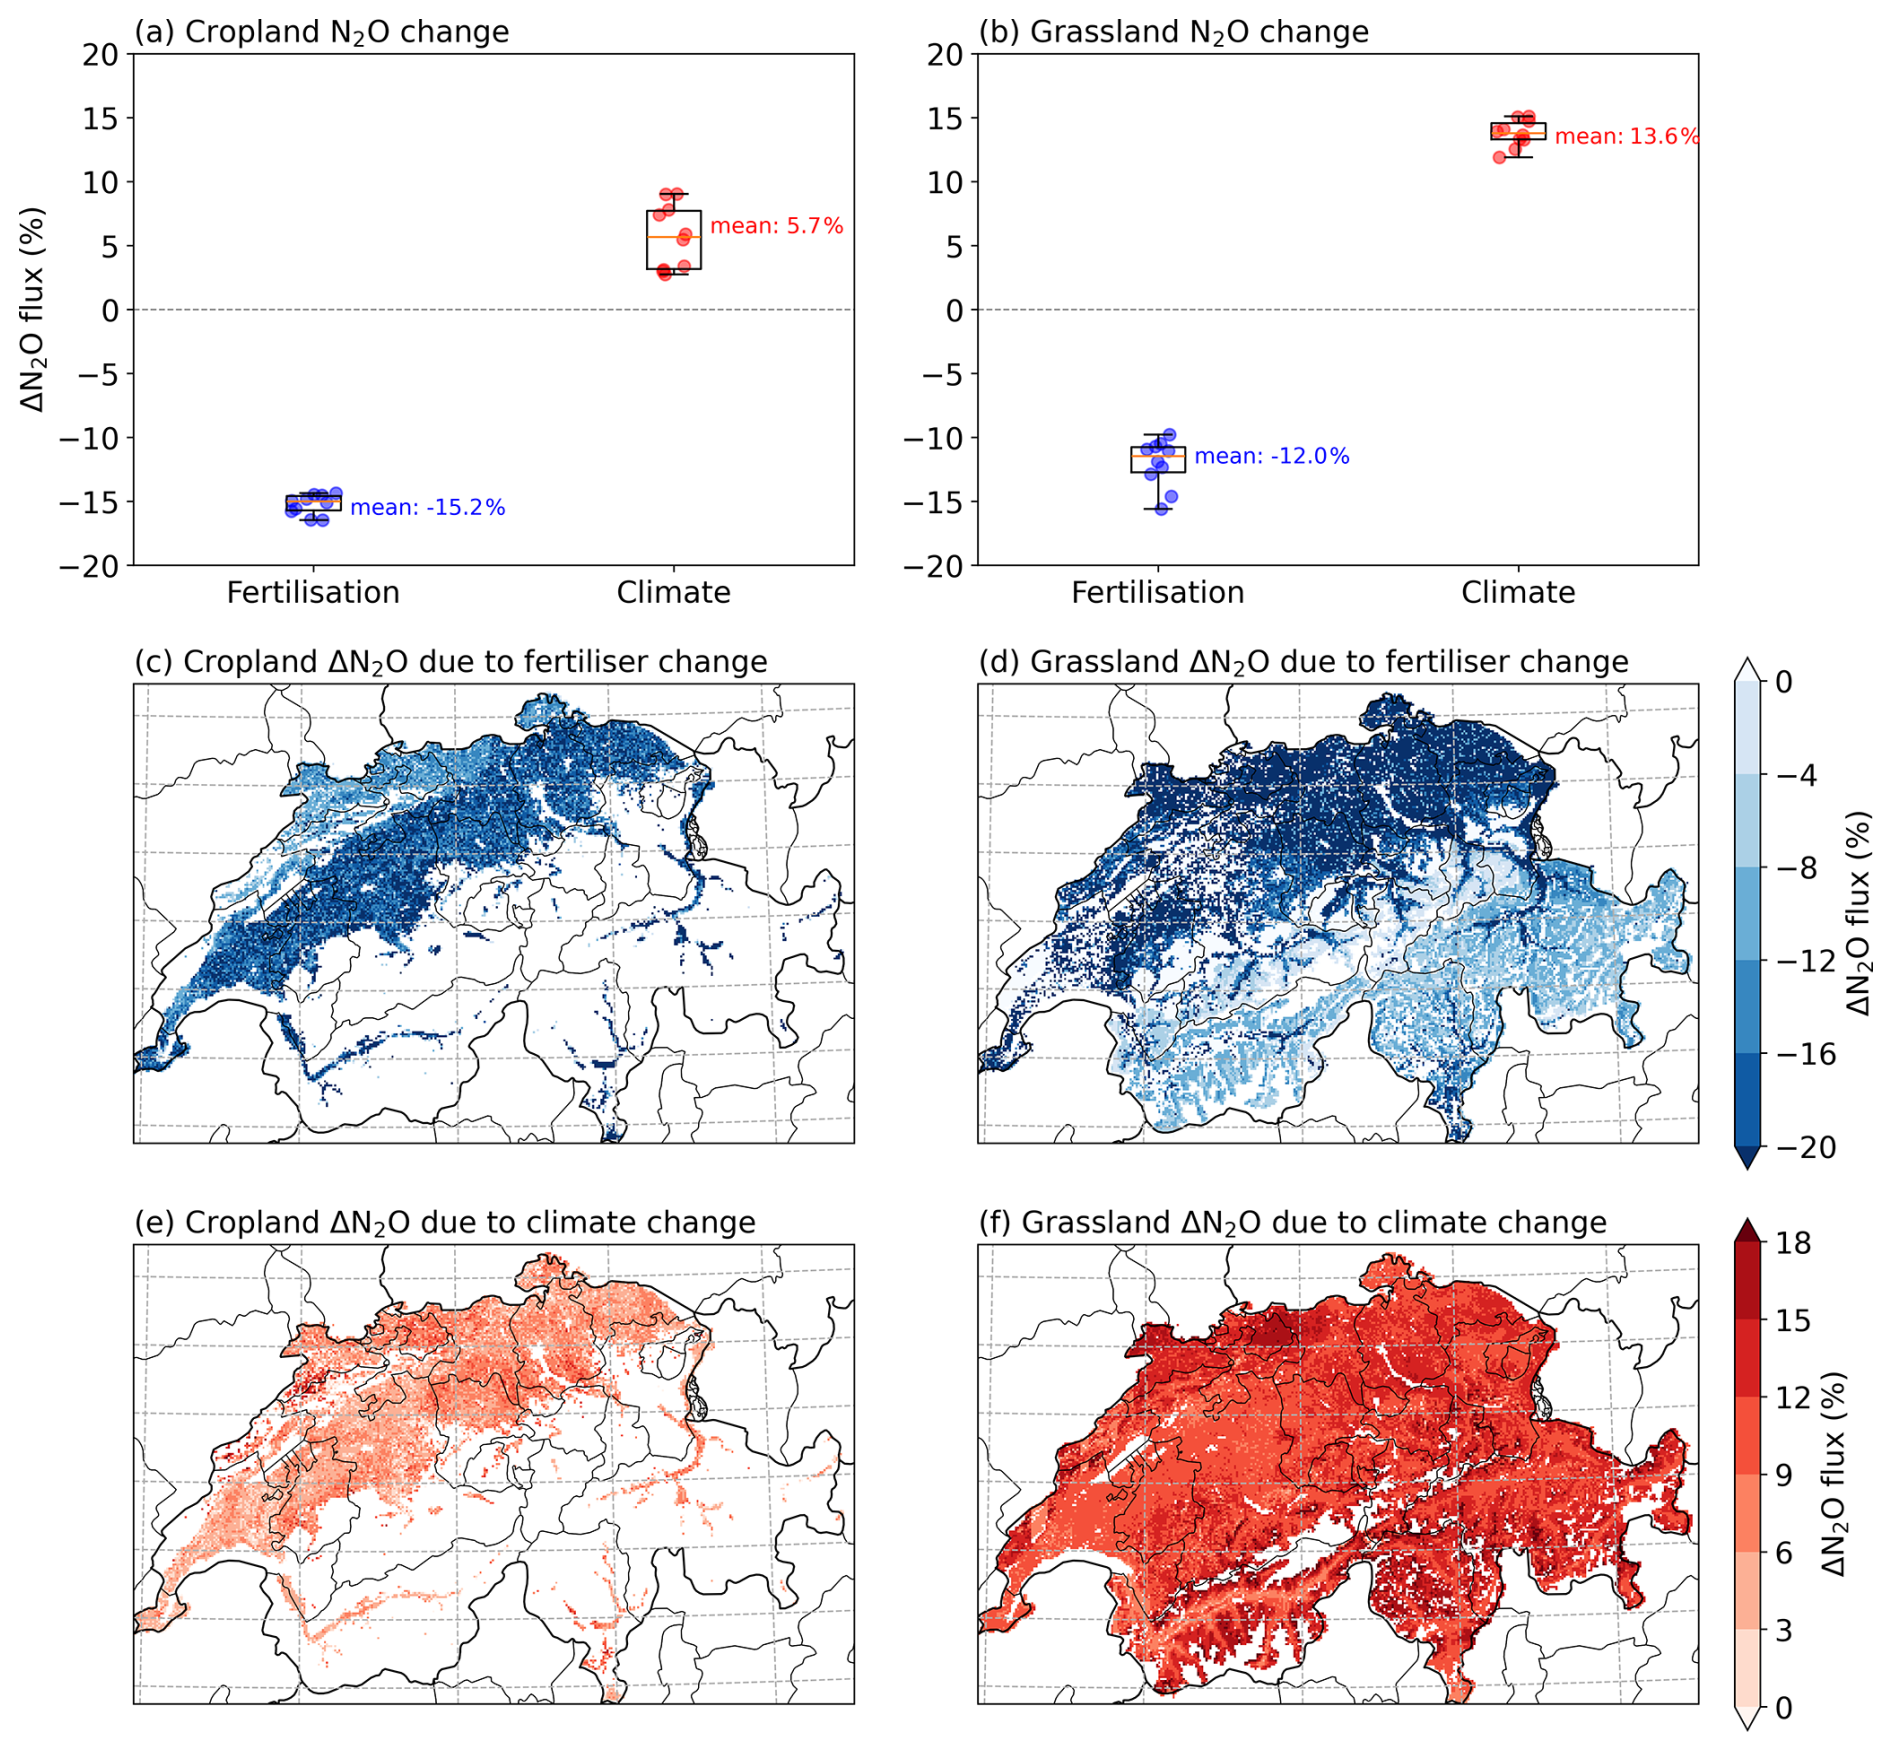
Figure 5Impact of changing fertiliser use and climate change on modelled N2O emissions from agricultural soils in Switzerland in the 2010s (average for 2011–2020). National average change in (a) croplands and (b) grasslands for 2011–2020. Spatial analysis for (c, e) croplands and (d, f) grasslands. Values that show changes in N2O emissions due to fertiliser use changes are calculated from the difference between the “baseline” and “fert1980” simulations (time-varying climate and fixed fertiliser inputs at the 1980s level). Values that show changes in N2O emissions due to climate change are calculated from the difference between the “baseline” and “clim1980” simulations (time-varying fertiliser inputs but fixed climate representative (temperature and precipitation) for the 1980s).
In contrast, climate change significantly increased N2O emissions, especially for grasslands. Between 1981 and 2020, the annual mean temperature across Switzerland increased by about 1.6 °C while annual precipitation slightly decreased (Fig. S5 in the Supplement) (MeteoSwiss and ETH Zurich, 2025). Based on the difference between the baseline simulations and the scenario simulations with time-varying fertiliser but fixed climate representative for the 1980s (clim1980; Table 1), modelled decadal mean N2O emissions increased by 5.7 % in croplands and 13.6 % in grasslands between 2011 and 2020 due to the climatic effect (difference between “baseline” and “clim1980” simulations), with larger relative increases found in grassland across the country (Fig. 5f). Across the management-timing sensitivity tests, the estimated climatic effect ranged from 3.5 % to 5.2 % in croplands and from 13.0 % to 13.9 % in grasslands.
In this study, we applied the biogeochemical model DayCent to present a process-based estimate of N2O emissions from agricultural soils across Switzerland over the past four decades. We observe, as expected, that modelled agricultural N2O emissions are highly dynamic, exhibiting strong spatial-temporal variations driven by interactions among environmental factors, soil conditions and local management practices. This variability is also reflected in the simulated EFs, highlighting that N2O emission cannot be adequately represented by a single constant EF across diverse environmental conditions for different agricultural systems. Furthermore, our scenario analyses disentangled the relative contributions of climate variability and agricultural management to long-term changes in N2O emissions. Before discussing these findings in detail, we first evaluate uncertainty and limitations of the modelling framework to provide context for interpreting the results.
4.1 Modelling uncertainty and limitations
For both agricultural systems, total N2O emissions were predominantly produced through nitrification based on our simulations using DayCent, which accounted for 93 % of cropland emissions and 66 % grassland emissions (data not shown), whereas measurement studies using isotope techniques demonstrated that denitrification is the more important process (Ibraim et al., 2020; Rainford et al., 2026; Turco et al., 2026; Wolf et al., 2015). This discrepancy indicates that the model likely overestimates nitrification-driven N2O emissions, which has also been reported in previous research (Fuchs et al., 2019; Zimmermann et al., 2018). Moreover, DayCent does not include a sophisticated module for ammonia volatilisation, resulting in higher prediction of soil ammonium pools and thus greater production of nitrate through nitrification. Additionally, the pedotransfer functions we used may not adequately represent soil hydraulic properties. As soil moisture is one of the dominant controls on nitrification and denitrification, biases in simulated water dynamics may lead to overestimation of N2O emissions from nitrification when soils drain too fast. In contrast, we found that at the national scale, elevated N2O emissions were associated with clay-rich soils (Fig. 4 and Table 2), i.e., high emissions in the Jura regions with high clay content (Fig. S8a in the Supplement). This can be attributed to the high water retention of clays, which creates anaerobic conditions needed for denitrification (Charles et al., 2017; Lesschen et al., 2011; Zhang et al., 2024). Although the modelled N2O production pathways are uncertain, the cumulative N2O emissions are considered robust as the DayCent model has been extensively calibrated to reproduce the total amount of N2O (e.g., Dos Reis Martins et al., 2022: r2=0.63 between observed and modelled cropland N2O emissions across four Swiss and two French sites; and Dos Reis Martins et al. (2024): r2=0.65 between observed and modelled grassland N2O emissions across two Swiss and two German sites). Nevertheless, in future studies, long-term measurements of N2O fluxes with isotope analyses differentiating N2O production pathways are useful for constraining model parameters and improving the representation of relevant processes. For example, Rainford et al. (2026) showed that integrating isotope measurements into the model calibration substantially improved estimates of N2O production pathways, i.e., nitrification vs. denitrification. These observations, together with improved soil, crop and management datasets, will further enhance the reliability of such assessments in future research.
Nevertheless, despite the above-outlined limitations, the use of process-based models provides advantages compared with simpler EF approaches by explicitly representing the interactions between climate, soil and management for national scale N2O emission estimates.
4.2 N2O emissions from Swiss agriculture
Using DayCent biogeochemical modelling, we estimated that agricultural N2O emissions in Switzerland have decreased by about 5 %, from 4.0 kt N yr−1 in the 1980s (average for 1981–1990) to 3.8 kt N yr−1 in the 2010s (average for 2011–2020), with croplands contributing about 40 % and grasslands about 60 % to total emissions, respectively. Between 1990 and 2020, the National Greenhouse Gas Inventory (NIR) reported a ∼18 % reduction in N2O emissions from agricultural soils (FOEN, 2026), while DayCent simulations suggested a ∼9 % decreasing of N2O emissions for this period; thus a same order of mangitude change. However, our N2O emission estimates are ∼40 % higher than the NIR (2.7 kt N yr−1 averaged between 1990 and 2020; the sources of NIR N2O included for comparison are presented in Table S5; FOEN, 2026), and modelled EFs are 10 %–30 % larger than the default IPCC EF. These differences are presumably associated with the larger estimated background N2O fluxes and the climate impacts reflected in our simulations. Since the NIR uses a fixed EF of 1 % for most of agricultural activities (i.e., various N inputs to fields such as fertiliser application and livestock grazing), the ∼18 % reduction in N2O emissions reported in NIR largely reflected the corresponding changes in N inputs.
Our modelling results suggested that the national total N2O emissions from croplands declined by 18 % between 1981–1990 and the 2011–2020, whereas grassland emissions increased by 2 %. These simulated long-term changes can be attributed to three different factors: land use change, fertiliser use reduction and climate change. Between the 1980s and the 2010s, croplands shrank by 12 %, reflecting gradual urbanisation, while permanent grassland areas remained roughly stable (−1 %; BFS, 2024). Total fertiliser application (including both synthetic and organic) in Switzerland decreased by ∼25 % over the studied period (Fig. S2c). These reductions resulted from a series of agri-environmental policy reforms in the 1990s, including a direct payment scheme and Proof of Ecological Performance (PEP) (Decrem et al., 2007; Herzog et al., 2008; Spiess, 2011). The implementation of these schemes, alongwith decreased livestock number (due to improved productivity, e.g., milk yield), led to a decline in synthetic fertiliser consumption and less manure application (Fig. S6). Note that reducing fertiliser use alone would have led to a nonlinear reduction in N2O emissions in croplands (−15.2 %) and in grasslands (−12.0 %) based on our model scenarios between 2011 and 2020. Two further aspects, however, had additional and profound impacts on the N2O flux. On the one hand, climate change offset reductions driven by decreased fertiliser rates through warming-induced N2O emissions, especially in grasslands, based on our model scenarios (Fig. 5). More specifically, continuous warming and slightly drier conditions over the past 40 years in the country (Fig. S5) were recorded, discussed in more detail in the next section. On the other hand, simulated background N2O fluxes (per unit area) showed contrasting trends between croplands and grasslands over the studied period (Fig. 1b). These differences were closely linked to changes in SOM mineralisation, which decreased in croplands while increased in grasslands, and showed a strong positive correlation with background N2O fluxes for both agroecosystem types (Fig. S7a). The decline in cropland SOM has been reported by both field measurements and nationwide monitoring. For example, Emmel et al. (2018) found that a Swiss cropland field lost more than 16 t C ha−1 between 2004 and 2016. At the national scale, Wollmann et al. (2025) reported that mean topsoil (0–20 cm) total organic carbon (TOC) in Swiss croplands declined from 54 to 46 t TOC ha−1 between 1985–1989 and 2015–2019. In contrast, topsoil TOC in grassland is 1.4–1.6 times higher than in croplands and remained stable at approximately 76 t TOC ha−1 (Wollmann et al., 2025).
4.3 Factors affecting modelled N2O emissions
We found that plant performance played a crucial role in regulating N2O emissions, with simulated N2O emissions and EFs exhibiting strong negative correlations with NUE (Fig. 4). This finding is consistent with existing studies. Using gross primary productivity (Turco et al., 2026) and vegetation height (Maier et al., 2022; Feigenwinter et al., 2023a) as proxies for plant N uptake, all studies identified vegetation performance as an important driver of cropland and grassland N2O emissions, with enhanced plant growth suppressing N2O losses. From a N budget perspective, reduced plant N uptake (e.g., due to environmental stress, improper management, and mismatch between plant N demand and supply) leads to an accumulation of soil mineral N (e.g., ammonium and nitrate); this excess mineral N becomes available for microbial processes and can be readily lost as N2O under favourable environmental conditions (Omonode et al., 2017). Conversely, healthy and actively growing plants take up more mineral N and outcompete soil microorganisms for available mineral N, thereby reducing microbial pathways that produce N2O (Maier et al., 2022; Feigenwinter et al., 2023a; Turco et al., 2026).
Our results also indicated that soil pH is a critical factor governing simulated N2O fluxes and EFs. For Switzerland, modelled N2O was generally higher in more alkaline soils in both croplands and grasslands. Nitrification in the model is enhanced at high soil pH, which leads to nitrite accumulation and oxygen depletion, stimulating N2O production (Li et al., 2023). Since nitrification was likely overestimated in our simulations, the soil pH effects may not be properly represented. Nevertheless, high pH values have also been shown to increase SOM pools through Ca-mediated soil stabilisation (Rowley et al., 2018), which in turn could provide substrates for nitrification and N2O production. On the other hand, previous studies suggested that N2O production is often suppressed when soil pH is high (Wang et al., 2018). For example, liming as an effective agronomical practice to alleviate soil acidification has been shown to reduce N2O emissions (Hénault et al., 2019; Shaaban et al., 2020). Microbial studies demonstrated that the enzyme N2O reductase is inhibited at low pH, leading to incomplete denitrification and higher N2O emissions (Bergaust et al., 2010; Krause et al., 2017; Liu et al., 2014). Soil pH also influences the abundance and activities of microbial communities, making the relationship between soil pH and N2O flux complex and usually nonlinear. A recent global synthesis showed that N2O emissions peak at intermediate pH levels (5.6–6.3) (Qiu et al., 2024). Under suboptimal conditions (very acidic or alkaline soils), N2O emissions tend to decrease (Cheng et al., 2021; Qiu et al., 2024). Thus, currently, our understanding and parametrisation of process-models for N2O production are still limited.
Other soil properties, such as SOM, showed weak negative correlations with simulated total N2O emissions and EFs across Switzerland (0.14 and −0.48 in cropland and grassland, respectively). In DayCent, SOM is partitioned into three pools: active, slow and passive. Both labile and stable SOM fractions can influence N2O fluxes (De Figueiredo et al., 2018). Higher labile C can stimulate N2O production by providing more substrates (Del Grosso et al., 2000; Guenet et al., 2021), whereas SOM accumulated in more stable fractions is physically protected and therefore less accessible to microbes in the short term, reducing N2O production (Sato et al., 2019). In the model, SOM can influence N2O emissions through two distinct mechanisms: first, greater labile C enhanced mineralisation and increased mineral N supply, stimulating N2O production from nitrification (Table S4 and Fig. S7); and second, higher labile C can modify soil physical and biochemical conditions, promoting more complete reduction of N2O to N2 during denitrification (as shown in Table S4) and thereby lowering total emissions (Lazcano et al., 2021). Based on sensitivity tests in croplands, where more than 90 % of simulated N2O emissions were produced from nitrification, these opposing effects largely offset each other, leading to only minor changes in total N2O emissions. In contrast, in grasslands, where more than 30 % of emissions originated from denitrification, the enhanced reduction of N2O to N2 dominated, resulting in lower simulated total N2O emissions with increasing SOM.
4.4 N2O emissions under a changing climate
Environmental factors, particularly temperature and moisture, strongly influence N2O emissions (Butterbach-Bahl et al., 2013; Decock et al., 2015; Flechard et al., 2007; Skiba and Smith, 2000). Global warming is expected to increase N2O emissions by accelerating microbial activities that enhance nitrification and denitrification. Our sensitivity tests showed that temperature was a dominant environmental driver of N2O production (Table 2). Under the prescribed fertilisation and management schedules, our results indicate that N2O emissions would have increased by 5.7 % in croplands and 13.6 % in grasslands due to warming and changes in precipitation patterns between 2011 and 2020 (Fig. 5a, b). We found that advancing management timing resulted in 0.5 % to 2.2 % lower N2O emissions in croplands and changes of −0.6 % to +0.3 % in grasslands relative to the baseline simulations. The simulated increase in N2O emissions associated with the changing climate remained positive across all tested management-timings, ranging from 3.5 % to 5.2 % in croplands and from 13.0 % to 13.9 % in grasslands. These results indicate that the direction and estimated climate-induced increase in N2O emissions are robust across the tested changes in management timing. These increases in N2O emissions, in turn, intensify warming and create a positive feedback loop to climate change (Harris et al., 2022; Li et al., 2020; Smith, 1997; Xu-Ri et al., 2012), with significant implications for future climate mitigation and agricultural management. Given the high global warming potential of N2O, a more sustainable development scenario would reinforce emission mitigation, whereas a poor scenario could lead to amplified warming. However, agricultural Nr species may have a net cooling effect on the climate globally (excluding the effect of CO2 related to fertiliser manufacturing and transport; Gong et al., 2024), because the warming related to agricultural N2O emissions might be potentially outweighed by Nr-enhanced terrestrial carbon sequestration (i.e., N deposition to forests) and aerosol cooling related to agricultural NH3 (Gong et al., 2024). Therefore, management strategies that aim to reduce N loss should address multiple Nr gases (i.e., long-lived vs. short-lived climate forcers) and eventual changes in soil C stocks simultaneously to avoid trade-offs that could result in a net climate penalty.
Sensitivity tests showed that changes in precipitation had a less significant influence on N2O than temperature (Table 2). This is partly because we only modified the absolute amount of precipitation while precipitation patterns were unchanged in the sensitivity tests. As a result, there was a limited reduction in N2O flux under wetter conditions (or increased flux under drier conditions) at the national scale (Table 2, and Fig. 4), presumably because of enhanced reduction to N2 in denitrification, as reflected by higher N2:dnit-N2O ratio and increased total N2 emissions (Table S4). Admittedly, changes in precipitation patterns or variability can have equally important impacts on N2O emissions as the amount of rainfall. Furthermore, the interactions between temperature and soil moisture further complicate N2O dynamics. Thus, as extremes (heatwaves, droughts or compound events) are expected to become more frequent under climate change (IPCC, 2023), the magnitude of N2O emissions and their changes can vary depending on the timing, intensity and concurrence of temperature and precipitation anomalies.
Our simulations suggest that N2O fluxes from grasslands (both per unit and national total) were more strongly affected by climate warming than those from croplands (Fig. 5). Modelled EFs increased in both systems over the past four decades, indicating higher fertiliser-induced N2O emissions (Fig. 2d). In grasslands, warming stimulated SOM mineralisation and elevated background N2O emissions, resulting in substantial increases in total N2O emissions. In contrast, croplands likely experienced declines in SOM pools, reflected by lower simulated gross mineralisation rate and negative simulated soil N balances, as reported by Jiang et al. (2026). Consequently, background N2O fluxes decreased, partially offsetting increases in fertiliser-induced emissions. As a result, total N2O emissions from croplands showed smaller overall responses to warming than those from grasslands.
4.5 Mitigation of N2O emissions
According to our simulations, reducing fertiliser rates is an effective measure for N2O mitigation, providing evidence that supports the implementation of nationwide agri-environmental policies. Field experiments have demonstrated reduced N2O emissions from unfertilised grassland with higher fraction of cultivated legumes compared to slurry-fertilised grassland (Feigenwinter et al., 2023a; Fuchs et al., 2018), with no substantial decrease in yield but potentially improved yield quality. However, this long-term field experiment also demonstrated a relevant, often neglected trade-off: reduced N2O emissions came at the cost of a substantial loss in soil C sequestration (Feigenwinter et al., 2023b).
As highlighted by both, this modelling study and recent field-based investigations, improving plant performance represents a promising strategy for reducing N2O losses from agricultural soils (Maier et al., 2022; Omonode et al., 2017; Turco et al., 2026; Feigenwinter et al., 2023a). A key objective is to improve the synchrony between fertiliser N supply and plant N demand through optimisation of the type, amount, timing and place of fertiliser application, known as the “4R” principle (Johnston and Bruulsema, 2014; Snyder, 2017). Equally important is the promotion of rapid and sustained plant growth (Turco et al., 2026), which enhances plant N uptake and shortens bare soil period when a substantial portion of N2O emissions can occur (Maier et al., 2025; Verhoeven et al., 2017).
Thus, although it has been extensively researched, mitigation of agricultural N2O emissions still remains challenging (Cui et al., 2024; Decock et al., 2015; Nyameasem et al., 2026). Three main aspects need to be addressed. First, as shown and discussed in this study, climate change might increase N2O emissions. We showed modelling results that benefits of reducing fertiliser use can be partly or entirely offset by the warming effect, underscoring that future mitigation strategies need to be more ambitious within the context of climate change. Second, the effects of management practices are spatially variable and context specific. Existing experimental and modelling studies demonstrated inconsistent effectiveness of mitigation measures at different places. For example, nitrification inhibitors applied with fertiliser are found generally effective in reducing agricultural soil N2O emissions, whereas other practices such as manure substitution (full or partial), reduced- or no-tillage and irrigation have shown variable effects, with both increased and decreased N2O emissions reported (Charles et al., 2017; Mei et al., 2018; Van Kessel et al., 2013; Velthof and Mosquera, 2011; You et al., 2024). This implies that generalized scenarios for N2O reduction might be insufficient given the varying pedoclimatic conditions, management practices, and highly dynamic nature of N2O fluxes. Therefore, site-specific mitigation strategies developed from monitoring, process-based modelling and field experiments should be considered. Our management-timing sensitivity tests further suggest that advancing planting and fertilisation dates under a changing climate could reduce simulated N2O emissions, highlighting the potential role of adaptive management timing as part of climate change mitigation strategies. Third, N losses through N2O emissions represent only a small but climate-relevant fraction of total N inputs to the agricultural system, while other N losses (e.g., leaching and volatilization) are usually more substantial, albeit not directly climate-relevant. A crucial question is how different forms of N losses can be tackled simultaneously without comprising yield or increasing other C or N losses. Successful strategies should minimise potential trade-offs (i.e., pollution swapping, yield decline, loss of C sequestration) and pursue synergies across productivity, environmental quality, soil health and climate benefits. This requires a better understanding of the coupling between the climate system and the N cycle, as well as an integrated approach to N management in the future.
Process-based models provide a useful alternative to EF-based approaches by explicitly representing the effects of environmental factors and management practices on N2O emissions. In this study, we conducted high-resolution simulations using the biogeochemical model DayCent to quantify N2O emissions from Swiss croplands and grasslands over the past 40 years. We estimated that total N2O emissions from Swiss agricultural land decreased by 5 % between 1981–1990 and 2011–2020, a smaller reduction than suggested by NIR. Our modelling results indicate that reductions in N fertiliser use driven by nationwide policy intervention have effectively mitigated N2O emissions, consistent with inventory trends. However, this mitigation was partly offset by climate change, specifically warming, which increased fertiliser-induced N2O emissions, as reflected by increased modelling-derived EFs in both croplands and grasslands. These findings highlight that climate-induced increases in agricultural soil N2O emissions can partially offset the reductions achieved through declining fertiliser inputs, resulting in smaller net reductions in N2O emissions than would occur in the absence of the climate change. While management changes have reduced emissions, ongoing warming can partly cancel out these benefits, particularly in countries experiencing intense warming like Switzerland. Our results therefore suggest long-term integrated measures such as optimising fertiliser application and improving plant performance are needed to effectively mitigate N2O emissions from agricultural soils in a changing climate.
Modelling results of the nitrogen budgets presented in this study are in netCDF format and are deposited at https://doi.org/10.3929/ethz-c-000802619 (Jiang, 2026). Code of the DayCent model is publicly available at https://www.soilcarbonsolutionscenter.com/daycent (last access: 21 December 2023). For specific versions, please contact the developers directly.
The supplement related to this article is available online at https://doi.org/10.5194/bg-23-8537-2026-supplement.
J.J. and J.S. conceptualised the study. J.J. designed and performed the modelling simulations, and analysed the data. A.S. processed and prepared climate input. M.N. and M.L. assisted with software and modelling. I.F. and N.B. provided eddy-covariance flux measurements and site management data. L.H.E.W. and J.S. supervised the project and acquired funding. J.J. wrote the original draft of paper. All authors contributed to interpretation of results, intensive discussions and critical revision of the paper.
The contact author has declared that none of the authors has any competing interests.
Publisher's note: Copernicus Publications remains neutral with regard to jurisdictional claims made in the text, published maps, institutional affiliations, or any other geographical representation in this paper. The authors bear the ultimate responsibility for providing appropriate place names. Views expressed in the text are those of the authors and do not necessarily reflect the views of the publisher.
We acknowledge the following colleagues from Agroscope: Chloé Wüst-Galley and Daniel Bretscher for providing national carbon and nitrogen data as model input, for reviewing the manuscript and giving feedback; Márcio dos Reis Marins for providing model parameters and constructive comments; Christof Ammann and Sonja Keel for reviewing the manuscript and useful discussions.
We thank Melannie Hartman from Colorado State University for helping with software and DayCent modelling. We thank Matti Barthel and Britta Jahn-Humphrey from ETH Zurich, and Yi Wang from Lund University (previously at ETH Zurich) for their support on measurements, soil sampling and analysis. We thank Hans-Martin Krause, Adrian Lustenberger and Frédéric Perrochet from FiBL and Jochen Mayer from Agroscope for sharing agricultural management information on the DOK trial. We thank Thomas Baur, Ivo Beck, Philip Maier, Peter Ravelhofer, Martin Rüegg, and Markus Staudinger for their excellent technical support with the flux measurements as well as Kathrin Fuchs, Lukas Hörtnagl, Regine Maier, and Lutz Merbold for their scientific inputs.
We also thank the ETH Zurich high-performance cluster Euler.
This research is part of the ReCLEAN Joint Initiative supported by the ETH Board under the Joint Initiatives scheme in the Strategic Area Energy, Climate and Environmental Sustainability. Long-term N2O flux measurements were funded by the SNF projects M4P (grant no. 40FA40_154245) and InnoFarm (grant no. 407340_172433) as well as the EU projects SUPER-G (grant no. 774124) and NextGenCarbon (grant no. 101184989). Moreover, funding from the ETH Board and from ETH Zurich is greatly acknowledged. In addition, IF acknowledges funding from the SNF project ICOS-CH Phase 4 (20FI-0_229655).
This paper was edited by Ivonne Trebs and reviewed by Johan Karlsson and one anonymous referee.
Ammann, C., Flechard, C. R., Leifeld, J., Neftel, A., and Fuhrer, J.: The carbon budget of newly established temperate grassland depends on management intensity, Agr. Ecosyst. Environ., 121, 5–20, https://doi.org/10.1016/j.agee.2006.12.002, 2007.
Ammann, C., Spirig, C., Leifeld, J., and Neftel, A.: Assessment of the nitrogen and carbon budget of two managed temperate grassland fields, Agr. Ecosyst. Environ., 133, 150–162, https://doi.org/10.1016/j.agee.2009.05.006, 2009.
Ammann, C., Neftel, A., Jocher, M., Fuhrer, J., and Leifeld, J.: Effect of management and weather variations on the greenhouse gas budget of two grasslands during a 10-year experiment, Agr. Ecosyst. Environ., 292, 106814, https://doi.org/10.1016/j.agee.2019.106814, 2020.
Beare, M. H., Gregorich, E. G., and St-Georges, P.: Compaction effects on CO2 and N2O production during drying and rewetting of soil, Soil Biol. Biochem., 41, 611–621, https://doi.org/10.1016/j.soilbio.2008.12.024, 2009.
Bergaust, L., Mao, Y., Bakken, L. R., and Frostegård, Å.: Denitrification response patterns during the transition to anoxic respiration and posttranscriptional effects of suboptimal pH on nitrogen oxide Reductase in Paracoccus denitrificans, Appl. Environ. Microb., 76, 6387–6396, https://doi.org/10.1128/AEM.00608-10, 2010.
BFS: Arealstatistik: Variablenliste, Swiss Federal Statistical Office, https://www.bfs.admin.ch/bfs/en/home/services/geostat/swiss-federal-statistics-geodata/land-use-cover-suitability/swiss-land-use-statistics.assetdetail.32376296.html (last access: 3 February 2023), 2024.
Büchi, L., Wendling, M., Amossé, C., Jeangros, B., Sinaj, S., and Charles, R.: Long and short term changes in crop yield and soil properties induced by the reduction of soil tillage in a long term experiment in Switzerland, Soil Till. Res., 174, 120–129, https://doi.org/10.1016/j.still.2017.07.002, 2017.
Buendia, E. E. C., Tanabe, K., Kranjc, A., Jamsranjav, B., Fukuda, M., Ngarize, S., Osako, A., Pyrozhenko, Y., Shermanau, P., and Federici, S.: 2019 Refinement to the 2006 IPCC Guidelines for National Greenhouse Gas Inventories, Switzerland, https://www.ipcc.ch/report/2019-refine ment-to-the-2006-ipcc-guidelines-for-national-greenhouse-gas-inventories/ (last access: 20 December 2025), 2019.
Butterbach-Bahl, K., Baggs, E. M., Dannenmann, M., Kiese, R., and Zechmeister-Boltenstern, S.: Nitrous oxide emissions from soils: how well do we understand the processes and their controls?, Phil. Trans. R. Soc. B, 368, 20130122, https://doi.org/10.1098/rstb.2013.0122, 2013.
Charles, A., Rochette, P., Whalen, J. K., Angers, D. A., Chantigny, M. H., and Bertrand, N.: Global nitrous oxide emission factors from agricultural soils after addition of organic amendments: A meta-analysis, Agr. Ecosyst. Environ., 236, 88–98, https://doi.org/10.1016/j.agee.2016.11.021, 2017.
Cheng, Y., Zhang, H., Chen, Z., Wang, J., Cai, Z., Sun, N., Wang, S., Zhang, J., Chang, S. X., Xu, M., Cai, Z., and Müller, C.: Contrasting effects of different pH -raising materials on N2O emissions in acidic upland soils, Eur. J. Soil Sci., 72, 432–445, https://doi.org/10.1111/ejss.12964, 2021.
Cui, X., Bo, Y., Adalibieke, W., Winiwarter, W., Zhang, X., Davidson, E. A., Sun, Z., Tian, H., Smith, P., and Zhou, F.: The global potential for mitigating nitrous oxide emissions from croplands, One Earth, 7, 401–420, https://doi.org/10.1016/j.oneear.2024.01.005, 2024.
Davidson, E. A.: Representative concentration pathways and mitigation scenarios for nitrous oxide, Environ. Res. Lett., 7, 024005, https://doi.org/10.1088/1748-9326/7/2/024005, 2012.
De Figueiredo, C. C., De Oliveira, A. D., Dos Santos, I. L., Ferreira, E. A. B., Malaquias, J. V., De Sá, M. A. C., De Carvalho, A. M., and Dos Santos, J. D. D. G.: Relationships between soil organic matter pools and nitrous oxide emissions of agroecosystems in the Brazilian Cerrado, Sci. Total Environ., 618, 1572–1582, https://doi.org/10.1016/j.scitotenv.2017.09.333, 2018.
Decock, C., Lee, J., Necpalova, M., Pereira, E. I. P., Tendall, D. M., and Six, J.: Mitigating N2O emissions from soil: from patching leaks to transformative action, SOIL, 1, 687–694, https://doi.org/10.5194/soil-1-687-2015, 2015.
Decrem, M., Spiess, E., Richner, W., and Herzog, F.: Impact of Swiss agricultural policies on nitrate leaching from arable land, Agron. Sustain. Dev., 27, 243–253, https://doi.org/10.1051/agro:2007012, 2007.
Del Grosso, S. J., Parton, W. J., Mosier, A. R., Ojima, D. S., Kulmala, A. E., and Phongpan, S.: General model for N2O and N2 gas emissions from soils due to dentrification, Global Biogeochem. Cy., 14, 1045–1060, https://doi.org/10.1029/1999GB001225, 2000.
Del Grosso, S. J., Parton, W. J., Mosier, A. R., Hartman, M. D., Brenner, J., Ojima, D. S., and Schimel, D. S.: Simulated inter-action of carbon dynamics and nitrogen trace gas fluxes using the DayCent model, in: Modeling carbon and nitrogen dynamics for soil management, edited by: Shaffer, M. J., Ma, L., and Hansen, S., CRC Press, Boca Raton, 303–332, https://doi.org/10.1201/9781420032635.ch8, 2001.
Dos Reis Martins, M., Necpalova, M., Ammann, C., Buchmann, N., Calanca, P., Flechard, C. R., Hartman, M. D., Krauss, M., Le Roy, P., Mäder, P., Maier, R., Morvan, T., Nicolardot, B., Skinner, C., Six, J., and Keel, S. G.: Modeling N2O emissions of complex cropland management in Western Europe using DayCent: Performance and scope for improvement, Eur. J. Agron., 141, 126613, https://doi.org/10.1016/j.eja.2022.126613, 2022.
Dos Reis Martins, M., Ammann, C., Boos, C., Calanca, P., Kiese, R., Wolf, B., and Keel, S. G.: Reducing N fertilization in the framework of the European Farm to Fork strategy under global change: Impacts on yields, N2O emissions and N leaching of temperate grasslands in the Alpine region, Agr. Syst., 219, 104036, https://doi.org/10.1016/j.agsy.2024.104036, 2024.
Emmel, C., Winkler, A., Hörtnagl, L., Revill, A., Ammann, C., D'Odorico, P., Buchmann, N., and Eugster, W.: Integrated management of a Swiss cropland is not sufficient to preserve its soil carbon pool in the long term, Biogeosciences, 15, 5377–5393, https://doi.org/10.5194/bg-15-5377-2018, 2018.
Feigenwinter, I., Hörtnagl, L., and Buchmann, N.: N2O and CH4 fluxes from intensively managed grassland: The importance of biological and environmental drivers vs. management, Sci. Total Environ., 903, 166389, https://doi.org/10.1016/j.scitotenv.2023.166389, 2023a.
Feigenwinter, I., Hörtnagl, L., Zeeman, M. J., Eugster, W., Fuchs, K., Merbold, L., and Buchmann, N.: Large inter-annual variation in carbon sink strength of a permanent grassland over 16 years: Impacts of management practices and climate, Agr. Forest Meteorol., 340, 109613, https://doi.org/10.1016/j.agrformet.2023.109613, 2023b.
Flechard, C. R., Ambus, P., Skiba, U., Rees, R. M., Hensen, A., Van Amstel, A., Dasselaar, A. V. D. P., Soussana, J.-F., Jones, M., Clifton-Brown, J., Raschi, A., Horvath, L., Neftel, A., Jocher, M., Ammann, C., Leifeld, J., Fuhrer, J., Calanca, P., Thalman, E., Pilegaard, K., Di Marco, C., Campbell, C., Nemitz, E., Hargreaves, K. J., Levy, P. E., Ball, B. C., Jones, S. K., Van De Bulk, W. C. M., Groot, T., Blom, M., Domingues, R., Kasper, G., Allard, V., Ceschia, E., Cellier, P., Laville, P., Henault, C., Bizouard, F., Abdalla, M., Williams, M., Baronti, S., Berretti, F., and Grosz, B.: Effects of climate and management intensity on nitrous oxide emissions in grassland systems across Europe, Agr. Ecosyst. Environ., 121, 135–152, https://doi.org/10.1016/j.agee.2006.12.024, 2007.
FOEN: Switzerland's second nationally determined contribution under the Paris Agreement 2031–2035, https://www.bafu.admin.ch/en/paris-agreement (last access: 19 May 2026), 2025.
FOEN: Switzerland's National Inventory Document 2026 (GHG inventory 1990–2024), https://www.bafu.admin.ch/en/latest-ghg-inventory (last access: 12 June 2026), 2026.
Fuchs, K., Hörtnagl, L., Buchmann, N., Eugster, W., Snow, V., and Merbold, L.: Management matters: testing a mitigation strategy for nitrous oxide emissions using legumes on intensively managed grassland, Biogeosciences, 15, 5519–5543, https://doi.org/10.5194/bg-15-5519-2018, 2018.
Fuchs, K., Merbold, L., Buchmann, N., Bretscher, D., Brilli, L., Fitton, N., Topp, C. F. E., Klumpp, K., Lieffering, M., Martin, R., Newton, P. C. D., Rees, R. M., Rolinski, S., Smith, P., and Snow, V.: Multimodel evaluation of nitrous oxide emissions from an intensively managed grassland, J. Geophys. Res.-Biogeo., 125, e2019JG005261, https://doi.org/10.1029/2019JG005261, 2019.
Ghosh, S., Toyoda, S., Buizert, C., Etheridge, D. M., Langenfelds, R. L., Yoshida, N., Kim, S., and Ahn, J.: Concentration and Isotopic Composition of Atmospheric N2O Over the Last Century, J. Geophys. Res.-Atmos., 128, e2022JD038281, https://doi.org/10.1029/2022JD038281, 2023.
Gong, C., Tian, H., Liao, H., Pan, N., Pan, S., Ito, A., Jain, A. K., Kou-Giesbrecht, S., Joos, F., Sun, Q., Shi, H., Vuichard, N., Zhu, Q., Peng, C., Maggi, F., Tang, F. H. M., and Zaehle, S.: Global net climate effects of anthropogenic reactive nitrogen, Nature, 632, 557–563, https://doi.org/10.1038/s41586-024-07714-4, 2024.
Groffman, P. M., Butterbach-Bahl, K., Fulweiler, R. W., Gold, A. J., Morse, J. L., Stander, E. K., Tague, C., Tonitto, C., and Vidon, P.: Challenges to incorporating spatially and temporally explicit phenomena (hotspots and hot moments) in denitrification models, Biogeochemistry, 93, 49–77, https://doi.org/10.1007/s10533-008-9277-5, 2009.
Guenet, B., Gabrielle, B., Chenu, C., Arrouays, D., Balesdent, J., Bernoux, M., Bruni, E., Caliman, J., Cardinael, R., Chen, S., Ciais, P., Desbois, D., Fouche, J., Frank, S., Henault, C., Lugato, E., Naipal, V., Nesme, T., Obersteiner, M., Pellerin, S., Powlson, D. S., Rasse, D. P., Rees, F., Soussana, J., Su, Y., Tian, H., Valin, H., and Zhou, F.: Can N2O emissions offset the benefits from soil organic carbon storage?, Glob. Change Biol., 27, 237–256, https://doi.org/10.1111/gcb.15342, 2021.
Gurung, R. B., Ogle, S. M., Breidt, F. J., Parton, W. J., Del Grosso, S. J., Zhang, Y., Hartman, M. D., Williams, S. A., and Venterea, R. T.: Modeling nitrous oxide mitigation potential of enhanced efficiency nitrogen fertilizers from agricultural systems, Sci. Total Environ., 801, 149342, https://doi.org/10.1016/j.scitotenv.2021.149342, 2021.
Harris, E., Yu, L., Wang, Y.-P., Mohn, J., Henne, S., Bai, E., Barthel, M., Bauters, M., Boeckx, P., Dorich, C., Farrell, M., Krummel, P. B., Loh, Z. M., Reichstein, M., Six, J., Steinbacher, M., Wells, N. S., Bahn, M., and Rayner, P.: Warming and redistribution of nitrogen inputs drive an increase in terrestrial nitrous oxide emission factor, Nat. Commun., 13, 4310, https://doi.org/10.1038/s41467-022-32001-z, 2022.
Hénault, C., Bourennane, H., Ayzac, A., Ratié, C., Saby, N. P. A., Cohan, J.-P., Eglin, T., and Gall, C. L.: Management of soil pH promotes nitrous oxide reduction and thus mitigates soil emissions of this greenhouse gas, Sci. Rep., 9, 20182, https://doi.org/10.1038/s41598-019-56694-3, 2019.
Herzog, F., Prasuhn, V., Spiess, E., and Richner, W.: Environmental cross-compliance mitigates nitrogen and phosphorus pollution from Swiss agriculture, Environ. Sci. Policy, 11, 655–668, https://doi.org/10.1016/j.envsci.2008.06.003, 2008.
Hörtnagl, L., Feigenwinter, I., Wang, Y., and Buchmann, N.: Ecosystem fluxes measured by the eddy covariance method (CO2, H2O, H, N2O, CH4), meteorological data and detailed management information for the intensively managed grassland site Chamau in Switzerland, collected between 2005 and 2024, ETH Zurich [data set], https://doi.org/10.3929/ethz-b-000747025, 2025.
Hüppi, R., Felber, R., Neftel, A., Six, J., and Leifeld, J.: Effect of biochar and liming on soil nitrous oxide emissions from a temperate maize cropping system, SOIL, 1, 707–717, https://doi.org/10.5194/soil-1-707-2015, 2015.
Ibraim, E., Denk, T., Wolf, B., Barthel, M., Gasche, R., Wanek, W., Zhang, S., Kiese, R., Butterbach-Bahl, K., Eggleston, S., Emmenegger, L., Six, J., and Mohn, J.: Denitrification Is the Main Nitrous Oxide Source Process in Grassland Soils According to Quasi-Continuous Isotopocule Analysis and Biogeochemical Modeling, Global Biogeochem. Cy., 34, e2019GB006505, https://doi.org/10.1029/2019GB006505, 2020.
IPCC: Climate Change 2021 – The Physical Science Basis, Working Group I Contribution to the Sixth Assessment Report of the Intergovernmental Panel on Climate Change, Cambridge University Press, Cambridge, United Kingdom and New York, NY, USA, https://doi.org/10.1017/9781009157896, 2021.
IPCC: Synthesis Report of the IPCC Sixth Assessment Report (AR6), Intergovernmental Panel on Climate Change (IPCC), Geneva, Switzerland, https://doi.org/10.59327/IPCC/AR6-9789291691647, 2023. Jiang, J.: Modelling of nitrous oxide (N2O) emissions from Swiss agricultural soils, ETH Zurich [data set], https://doi.org/10.3929/ethz-c-000802619, 2026.
Jiang, J., Winkel, L. H. E., Wüst-Galley, C., Bretscher, D., Necpalova, M., Stenke, A., and Six, J.: Balancing nitrogen use efficiency, losses and soil nitrogen depletion to evaluate national scale agri-environmental performance over 40 years, Biogeosciences, 23, 6741–6761, https://doi.org/10.5194/bg-23-6741-2026, 2026.
Johnston, A. M. and Bruulsema, T. W.: 4R Nutrient Stewardship for Improved Nutrient Use Efficiency, Procedia Engineer., 83, 365–370, https://doi.org/10.1016/j.proeng.2014.09.029, 2014.
Krause, H.-M., Thonar, C., Eschenbach, W., Well, R., Mäder, P., Behrens, S., Kappler, A., and Gattinger, A.: Long term farming systems affect soils potential for N2O production and reduction processes under denitrifying conditions, Soil Biol. Biochem., 114, 31–41, https://doi.org/10.1016/j.soilbio.2017.06.025, 2017.
Krauss, M., Ruser, R., Müller, T., Hansen, S., Mäder, P., and Gattinger, A.: Impact of reduced tillage on greenhouse gas emissions and soil carbon stocks in an organic grass-clover ley – winter wheat cropping sequence, Agr. Ecosyst. Environ., 239, 324–333, https://doi.org/10.1016/j.agee.2017.01.029, 2017.
Laub, M., Necpalova, M., Van de Broek, M., Corbeels, M., Ndungu, S. M., Mucheru-Muna, M. W., Mugendi, D., Yegon, R., Waswa, W., Vanlauwe, B., and Six, J.: Modeling integrated soil fertility management for maize production in Kenya using a Bayesian calibration of the DayCent model, Biogeosciences, 21, 3691–3716, https://doi.org/10.5194/bg-21-3691-2024, 2024.
Lazcano, C., Zhu-Barker, X., and Decock, C.: Effects of organic fertilizers on the soil microorganisms responsible for N2O emissions: A Review, Microorganisms, 9, 983, https://doi.org/10.3390/microorganisms9050983, 2021.
Lee, J., Necpálová, M., and Six, J.: Biophysical potential of organic cropping practices as a sustainable alternative in Switzerland, Agr. Syst., 181, 102822, https://doi.org/10.1016/j.agsy.2020.102822, 2020a.
Lee, J., Necpálová, M., Calitri, F., and Six, J.: Simulation of a regional soil nitrogen balance in Swiss croplands, Nutr. Cycl. Agroecosyst., 118, 9–22, https://doi.org/10.1007/s10705-020-10078-6, 2020b.
Lesschen, J. P., Velthof, G. L., De Vries, W., and Kros, J.: Differentiation of nitrous oxide emission factors for agricultural soils, Environ. Pollut., 159, 3215–3222, https://doi.org/10.1016/j.envpol.2011.04.001, 2011.
Li, L., Zheng, Z., Wang, W., Biederman, J. A., Xu, X., Ran, Q., Qian, R., Xu, C., Zhang, B., Wang, F., Zhou, S., Cui, L., Che, R., Hao, Y., Cui, X., Xu, Z., and Wang, Y.: Terrestrial N2O emissions and related functional genes under climate change: A global meta-analysis, Glob. Change Biol., 26, 931–943, https://doi.org/10.1111/gcb.14847, 2020.
Li, Y., Ju, X., and Wu, D.: Transient nitrite accumulation explains the variation of N2O emissions to N fertilization in upland agricultural soils, Soil Biol. Biochem., 177, 108917, https://doi.org/10.1016/j.soilbio.2022.108917, 2023.
Liu, B., Frostegård, Å., and Bakken, L. R.: Impaired Reduction of N2O to N2 in Acid Soils Is Due to a Posttranscriptional Interference with the Expression of nosZ, mBio, 5, e01383-14, https://doi.org/10.1128/mBio.01383-14, 2014.
Liu, S., Schloter, M., and Brüggemann, N.: Accumulation of NO during periods of drying stimulates soil N2 O emissions during subsequent rewetting, Eur. J. Soil Sci., 69, 936–946, https://doi.org/10.1111/ejss.12683, 2018.
Maier, R., Hörtnagl, L., and Buchmann, N.: Greenhouse gas fluxes (CO2, N2O and CH4) of pea and maize during two cropping seasons: Drivers, budgets, and emission factors for nitrous oxide, Sci. Total Environ., 849, 157541, https://doi.org/10.1016/j.scitotenv.2022.157541, 2022.
Maier, R., Hörtnagl, L., and Buchmann, N.: Large nitrous oxide emissions from arable soils after crop harvests prior to sowing, Nutr. Cycl. Agroecosyst., 130, 161–175, https://doi.org/10.1007/s10705-024-10395-0, 2025.
Mayer, J., Gunst, L., Mäder, P., Samson, M.-F., Carcea, M., Narducci, V., Thomsen, I. K., and Dubois, D.: Productivity, quality and sustainability of winter wheat under long-term conventional and organic management in Switzerland, Eur. J. Agron., 65, 27–39, https://doi.org/10.1016/j.eja.2015.01.002, 2015.
Mei, K., Wang, Z., Huang, H., Zhang, C., Shang, X., Dahlgren, R. A., Zhang, M., and Xia, F.: Stimulation of N2O emission by conservation tillage management in agricultural lands: A meta-analysis, Soil Till. Res., 182, 86–93, https://doi.org/10.1016/j.still.2018.05.006, 2018.
Merbold, L., Decock, C., Eugster, W., Fuchs, K., Wolf, B., Buchmann, N., and Hörtnagl, L.: Are there memory effects on greenhouse gas emissions (CO2, N2O and CH4) following grassland restoration?, Biogeosciences, 18, 1481–1498, https://doi.org/10.5194/bg-18-1481-2021, 2021.
MeteoSwiss: MeteoSwiss spatial climate analyses: documentation of datasets for users, Swiss Federal Office of Meteorology and Climatology, https://opendatadocs.meteoswiss.ch/c-climate-data (last access: 12 January 2024), 2025.
MeteoSwiss and ETH Zurich: Climate CH2025 – Scientific Report, MeteoSwiss & ETH Zurich, Federal Office of Meteorology and Climatology MeteoSwiss, Zurich, https://doi.org/10.18751/climate/scenarios/ch2025/sr/1.0/, 2025.
Meyer, M., Contzen, S., Feller, M., Pauler, C. M., Probo, M., Röösli, A., Schmidt, R. S., and Schneider, M. K.: Resilience of Swiss summer farms: An interdisciplinary analysis of key challenges and adaptations, Agr. Syst., 227, 104365, https://doi.org/10.1016/j.agsy.2025.104365, 2025.
Necpalova, M., Lee, J., Skinner, C., Büchi, L., Wittwer, R., Gattinger, A., Van Der Heijden, M., Mäder, P., Charles, R., Berner, A., Mayer, J., and Six, J.: Potentials to mitigate greenhouse gas emissions from Swiss agriculture, Agr. Ecosyst. Environ., 265, 84–102, https://doi.org/10.1016/j.agee.2018.05.013, 2018.
Nyameasem, J. K., Seidel, S. J., Ulrich, M., Möller, M., Kühling, I., Andrino, A., Kautz, T., Brüggemann, N., and Hernandez-Ochoa, I. M.: Nitrous oxide emissions from soil: A review of cropping practices and their consideration in process-based models, Sci. Total Environ., 1019, 181506, https://doi.org/10.1016/j.scitotenv.2026.181506, 2026.
Omonode, R. A., Halvorson, A. D., Gagnon, B., and Vyn, T. J.: Achieving Lower Nitrogen Balance and Higher Nitrogen Recovery Efficiency Reduces Nitrous Oxide Emissions in North America's Maize Cropping Systems, Front. Plant Sci., 8, 1080, https://doi.org/10.3389/fpls.2017.01080, 2017.
Pauler, C. M., Homburger, H., Lüscher, A., Scherer-Lorenzen, M., and Schneider, M. K.: Ecosystem services in mountain pastures: A complex network of site conditions, climate and management, Agr. Ecosyst. Environ., 377, 109272, https://doi.org/10.1016/j.agee.2024.109272, 2025.
Qiu, Y., Zhang, Y., Zhang, K., Xu, X., Zhao, Y., Bai, T., Zhao, Y., Wang, H., Sheng, X., Bloszies, S., Gillespie, C. J., He, T., Wang, Y., Chen, H., Guo, L., Song, H., Ye, C., Wang, Y., Woodley, A., Guo, J., Cheng, L., Bai, Y., Zhu, Y., Hallin, S., Firestone, M. K., and Hu, S.: Intermediate soil acidification induces highest nitrous oxide emissions, Nat. Commun., 15, 2695, https://doi.org/10.1038/s41467-024-46931-3, 2024.
Rainford, S., Havsteen, J. C., Mohn, J., Ammann, C., and Keel, S. G.: Coupling observational methods and the DayCent model to improve examinations of N2O production pathways, Nutr. Cycl. Agroecosyst., 133, 6, https://doi.org/10.1007/s10705-026-10504-1, 2026.
Ravishankara, A. R., Daniel, J. S., and Portmann, R. W.: Nitrous Oxide (N2O): The Dominant Ozone-Depleting Substance Emitted in the 21st Century, Science, 326, 123–125, https://doi.org/10.1126/science.1176985, 2009.
Reay, D. S., Davidson, E. A., Smith, K. A., Smith, P., Melillo, J. M., Dentener, F., and Crutzen, P. J.: Global agriculture and nitrous oxide emissions, Nat. Clim. Change, 2, 410–416, https://doi.org/10.1038/nclimate1458, 2012.
Rowley, M. C., Grand, S., and Verrecchia, É. P.: Calcium-mediated stabilisation of soil organic carbon, Biogeochemistry, 137, 27–49, https://doi.org/10.1007/s10533-017-0410-1, 2018.
Sato, J. H., De Figueiredo, C. C., Marchão, R. L., De Oliveira, A. D., Vilela, L., Delvico, F. M., Alves, B. J. R., and De Carvalho, A. M.: Understanding the relations between soil organic matter fractions and N2O emissions in a long-term integrated crop–livestock system, Eur. J. Soil Sci., 70, 1183–1196, https://doi.org/10.1111/ejss.12819, 2019.
Saxton, K. E. and Rawls, W. J.: Soil Water Characteristic Estimates by Texture and Organic Matter for Hydrologic Solutions, Soil Sci. Soc. Am. J., 70, 1569–1578, https://doi.org/10.2136/sssaj2005.0117, 2006.
Saxton, K. E., Rawls, W. J., Romberger, J. S., and Papendick, R. I.: Estimating Generalized Soil-water Characteristics from Texture, Soil Sci. Soc. Am. J., 50, 1031–1036, https://doi.org/10.2136/sssaj1986.03615995005000040039x, 1986.
Schils, R. L. M., Bufe, C., Rhymer, C. M., Francksen, R. M., Klaus, V. H., Abdalla, M., Milazzo, F., Lellei-Kovács, E., Berge, H. T., Bertora, C., Chodkiewicz, A., Dǎmǎtîrcǎ, C., Feigenwinter, I., Fernández-Rebollo, P., Ghiasi, S., Hejduk, S., Hiron, M., Janicka, M., Pellaton, R., Smith, K. E., Thorman, R., Vanwalleghem, T., Williams, J., Zavattaro, L., Kampen, J., Derkx, R., Smith, P., Whittingham, M. J., Buchmann, N., and Price, J. P. N.: Permanent grasslands in Europe: Land use change and intensification decrease their multifunctionality, Agr. Ecosyst. Environ., 330, 107891, https://doi.org/10.1016/j.agee.2022.107891, 2022.
Schulzweida, U.: CDO user guide, Version 2.3.0, Zenodo, https://doi.org/10.5281/zenodo.10020800, 2023.
Shaaban, M., Wu, Y., Wu, L., Hu, R., Younas, A., Nunez-Delgado, A., Xu, P., Sun, Z., Lin, S., Xu, X., and Jiang, Y.: The Effects of pH Change through Liming on Soil N2O Emissions, Processes, 8, 702, https://doi.org/10.3390/pr8060702, 2020.
Sinaj, S., Charles, R., Baux, A., Dupuis, B., Hiltbrunner, J., Levy, L., Pellet, D., Blanchet, G., and Jeangros, B.: 8/ Düngung von Ackerkulturen: Grundlagen für die Düngung landwirtschaftlicher Kulturen in der Schweiz (GRUD), Agrarforsch. Schweiz, 8, 1–46, 2017.
Skiba, U. and Smith, K. A.: The control of nitrous oxide emissions from agricultural and natural soils, Chemosphere, 2, 379–386, https://doi.org/10.1016/S1465-9972(00)00016-7, 2000.
Smith, K.: The potential for feedback effects induced by global warming on emissions of nitrous oxide by soils, Glob. Change Biol., 3, 327–338, https://doi.org/10.1046/j.1365-2486.1997.00100.x, 1997.
Snyder, C. S.: Enhanced nitrogen fertiliser technologies support the `4R' concept to optimise crop production and minimise environmental losses, Soil Res., 55, 463, https://doi.org/10.1071/SR16335, 2017.
Spiess, E.: Nitrogen, phosphorus and potassium balances and cycles of Swiss agriculture from 1975 to 2008, Nutr. Cycl. Agroecosyst., 91, 351–365, https://doi.org/10.1007/s10705-011-9466-9, 2011.
Stumpf, F., Behrens, T., Schmidt, K., and Keller, A.: Exploiting Soil and Remote Sensing Data Archives for 3D Mapping of Multiple Soil Properties at the Swiss National Scale, Remote Sens., 16, 2712, https://doi.org/10.3390/rs16152712, 2024.
Tian, H., Xu, R., Canadell, J. G., Thompson, R. L., Winiwarter, W., Suntharalingam, P., Davidson, E. A., Ciais, P., Jackson, R. B., Janssens-Maenhout, G., Prather, M. J., Regnier, P., Pan, N., Pan, S., Peters, G. P., Shi, H., Tubiello, F. N., Zaehle, S., Zhou, F., Arneth, A., Battaglia, G., Berthet, S., Bopp, L., Bouwman, A. F., Buitenhuis, E. T., Chang, J., Chipperfield, M. P., Dangal, S. R. S., Dlugokencky, E., Elkins, J. W., Eyre, B. D., Fu, B., Hall, B., Ito, A., Joos, F., Krummel, P. B., Landolfi, A., Laruelle, G. G., Lauerwald, R., Li, W., Lienert, S., Maavara, T., MacLeod, M., Millet, D. B., Olin, S., Patra, P. K., Prinn, R. G., Raymond, P. A., Ruiz, D. J., Van Der Werf, G. R., Vuichard, N., Wang, J., Weiss, R. F., Wells, K. C., Wilson, C., Yang, J., and Yao, Y.: A comprehensive quantification of global nitrous oxide sources and sinks, Nature, 586, 248–256, https://doi.org/10.1038/s41586-020-2780-0, 2020.
Tian, H., Pan, N., Thompson, R. L., Canadell, J. G., Suntharalingam, P., Regnier, P., Davidson, E. A., Prather, M., Ciais, P., Muntean, M., Pan, S., Winiwarter, W., Zaehle, S., Zhou, F., Jackson, R. B., Bange, H. W., Berthet, S., Bian, Z., Bianchi, D., Bouwman, A. F., Buitenhuis, E. T., Dutton, G., Hu, M., Ito, A., Jain, A. K., Jeltsch-Thömmes, A., Joos, F., Kou-Giesbrecht, S., Krummel, P. B., Lan, X., Landolfi, A., Lauerwald, R., Li, Y., Lu, C., Maavara, T., Manizza, M., Millet, D. B., Mühle, J., Patra, P. K., Peters, G. P., Qin, X., Raymond, P., Resplandy, L., Rosentreter, J. A., Shi, H., Sun, Q., Tonina, D., Tubiello, F. N., van der Werf, G. R., Vuichard, N., Wang, J., Wells, K. C., Western, L. M., Wilson, C., Yang, J., Yao, Y., You, Y., and Zhu, Q.: Global nitrous oxide budget (1980–2020), Earth Syst. Sci. Data, 16, 2543–2604, https://doi.org/10.5194/essd-16-2543-2024, 2024.
Turco, F., Feigenwinter, I., Allemann, L., Hörtnagl, L., Liebisch, F., and Buchmann, N.: What matters when? Temporal development of drivers and sources of nitrous oxide emissions in winter wheat, Biogeosciences, 23, 7151–7182, https://doi.org/10.5194/bg-23-7151-2026, 2026.
Van Kessel, C., Venterea, R., Six, J., Adviento-Borbe, M. A., Linquist, B., and Van Groenigen, K. J.: Climate, duration, and N placement determine N2O emissions in reduced tillage systems: A meta-analysis, Glob. Change Biol., 19, 33–44, https://doi.org/10.1111/j.1365-2486.2012.02779.x, 2013.
Velthof, G. L. and Mosquera, J.: The impact of slurry application technique on nitrous oxide emission from agricultural soils, Agr. Ecosyst. Environ., 140, 298–308, https://doi.org/10.1016/j.agee.2010.12.017, 2011.
Verhoeven, E., Pereira, E., Decock, C., Garland, G., Kennedy, T., Suddick, E., Horwath, W. R., and Six, J.: N2O emissions from California farmlands: A review, Calif. Agr., 71, 148–159, https://doi.org/10.3733/ca.2017a0026, 2017.
von Brömssen, C. and Röös, E.: Why statistical testing and confidence intervals should not be used in comparative life cycle assessments based on Monte Carlo simulations, Int. J. Life Cycle Ass., 25, 2101–2105, https://doi.org/10.1007/s11367-020-01827-4, 2020.
Wang, Y., Guo, J., Vogt, R. D., Mulder, J., Wang, J., and Zhang, X.: Soil pH as the chief modifier for regional nitrous oxide emissions: New evidence and implications for global estimates and mitigation, Glob. Change Biol., 24, https://doi.org/10.1111/gcb.13966, 2018.
Weber, D., Schwieder, M., Ritter, L., Koch, T., Psomas, A., Huber, N., Ginzler, C., and Boch, S.: Grassland-use intensity maps for Switzerland based on satellite time series: Challenges and opportunities for ecological applications, Remote Sensing in Ecology and Conservation, 10, 312–327, https://doi.org/10.1002/rse2.372, 2024.
Wolf, B., Merbold, L., Decock, C., Tuzson, B., Harris, E., Six, J., Emmenegger, L., and Mohn, J.: First on-line isotopic characterization of N2O above intensively managed grassland, Biogeosciences, 12, 2517–2531, https://doi.org/10.5194/bg-12-2517-2015, 2015.
Wollmann, I., Klaudy, N., Suter, D., Zimmermann, R., Shavit, N., and Hirte, J.: The development of carbon stocks in topsoil and subsoil at national soil monitoring sites over 30 years, Agroscope, 216, https://doi.org/10.34776/AS216E, 2025.
Wüst-Galley, C., Keel, S. G., and Leifeld, J.: A model-based carbon inventory for Switzerland's mineral agricultural soils using RothC, Agroscope, 105, https://doi.org/10.34776/AS105E, 2020.
Xu-Ri, Prentice, I. C., Spahni, R., and Niu, H. S.: Modelling terrestrial nitrous oxide emissions and implications for climate feedback, New Phytol., 196, 472–488, https://doi.org/10.1111/j.1469-8137.2012.04269.x, 2012.
You, L., Ros, G. H., Chen, Y., Zhang, F., and De Vries, W.: Optimized agricultural management reduces global cropland nitrogen losses to air and water, Nature Food, 5, 995–1004, https://doi.org/10.1038/s43016-024-01076-w, 2024.
Zhang, Z., Eddy, W. C., Stuchiner, E. R., DeLucia, E. H., and Yang, W. H.: A conceptual model explaining spatial variation in soil nitrous oxide emissions in agricultural fields, Commun. Earth Environ., 5, 730, https://doi.org/10.1038/s43247-024-01875-w, 2024.
Zhu, G., Shi, H., Zhong, L., He, G., Wang, B., Shan, J., Han, P., Liu, T., Wang, S., Liu, C., Zhang, N., Jiang, L., Yu, L., Zhan, C., Tang, Z., Wen, T., Ma, B., Su, X., Zhang, S., Zhang, J., Di, H., Hou, L., Krichels, A. H., Trimmer, M., Jetten, M. S. M., Peng, Y., Löffler, F. E., Tian, H., and Zhu, Y.-G.: Nitrous oxide sources, mechanisms and mitigation, Nat. Rev. Earth Environ., https://doi.org/10.1038/s43017-025-00707-5, 2025.
Zimmermann, J., Carolan, R., Forrestal, P., Harty, M., Lanigan, G., Richards, K. G., Roche, L., Whitfield, M. G., and Jones, M. B.: Assessing the performance of three frequently used biogeochemical models when simulating N2O emissions from a range of soil types and fertiliser treatments, Geoderma, 331, 53–69, https://doi.org/10.1016/j.geoderma.2018.06.004, 2018.