the Creative Commons Attribution 4.0 License.
the Creative Commons Attribution 4.0 License.
 | 09 Feb 2022
Estimation of the natural background of phosphate in a lowland river using tidal marsh sediment cores
Florian Lauryssen
Philippe Crombé
Tom Maris
Elliot Van Maldegem
Marijn Van de Broek
Stijn Temmerman
Erik Smolders
Elevated phosphate (PO4) concentrations can harm the ecological status in water by eutrophication. In the majority of surface waters in lowland regions such as Flanders (Belgium), the local PO4 levels exceed the limits defined by environmental policy and fail to decrease, despite decreasing total phosphorus (P) emissions. In order to underpin the definition of current limits, this study was set up to identify the pre-industrial background PO4 concentration in surface water of the Scheldt River, a tidal river in Flanders. We used the sedimentary records preserved in tidal marsh sediment cores as an archive for reconstructing historical changes in surface water PO4. For sediment samples at sequential depths below the sediment surface, we dated the time of sediment deposition and analysed the extractable sediment P. The resulting time series of sediment P was linked to the time series of measured surface water-PO4 concentrations (data 1967–present). By combining those datasets, the sorption characteristics of the sediment could be described using a Langmuir-type sorption model. The calibrated sorption model allowed us to estimate a pre-industrial background surface water PO4 levels, based on deeper sediment P that stabilized at concentrations smaller than the modern. In three out of the four cores, the sediment P peaked around 1980, coinciding with the surface water PO4. The estimated pre-industrial (∼1800) background PO4 concentration in the Scheldt River water was 62 [57; 66 (95 % CI)] µg PO4-P L−1. That concentration exceeds the previously estimated natural background values in Flanders (15–35 µg TP L−1) and is about half of the prevailing limit in the Scheldt River (120 µg PO4-P L−1). In the 1930s, river water concentrations were estimated at 140 [128; 148] µg PO4-P L−1, already exceeding the current limit. The method developed here proved useful for reconstructing historical background PO4 concentrations of a lowland tidal river. A similar approach can apply to other lowland tidal rivers to provide a scientific basis for local catchment-specific PO4 backgrounds.
- Article
(934 KB) - Full-text XML
-
Supplement
(653 KB) - BibTeX
- EndNote


Excess phosphorus (P) concentrations in surface waters is a global problem (Azevedo et al., 2015; Dodds and Smith, 2016; Elser et al., 2007). Eutrophication by excess nutrients, including phosphate (PO4) and nitrogen (N), can lead to hypoxia, acidification, and harmful algal blooms (Azevedo et al., 2015; Correll, 1998; Watson et al., 2018). Therefore, limiting P concentrations in the surface water is crucial to ensure a good ecological status. Lowland river systems are at higher risk for eutrophication than upland streams (Watson et al., 2018). As a result, eutrophication of lowland rivers is on the international agenda (Jarvie et al., 2006; Mainstone and Parr, 2002; Reynolds, 2000). This study focuses on dissolved orthophosphate (PO4), almost identical to the reactive P determined by a colour reaction. Other P forms present in surface water include organic P fractions and P adsorbed to mineral colloids. Total P (TP) refers to all P forms together. The environmental limits for P are expressed as reactive P (equated to PO4-P limits), TP limits, or both.
The lowland rivers of densely populated regions do not achieve good water quality mainly due to the excess of nutrients (Bitschofsky and Nausch, 2019; Huet, 1990; Van Der Molen et al., 1998; Van Puijenbroek et al., 2014; Rönspieß et al., 2020; Schulz and Herzog, 2004). For example, since 2004, the average PO4 concentration in Flemish waterways has stabilized at 290 µg PO4-P L−1. That concentration is well above the limits varying between 70–140 µg PO4-P L−1 for different river types (Smolders et al., 2017; VMM, 2018). Despite the current net-zero P balance in agricultural soils in that region, the situation has not improved since 2004 (VMM, 2017). The question arises when or even whether these limits can be achieved.
Since 2000, the European Union has regulated surface water quality with the Water Framework Directive 2000/60/EC (WFD), which does not prescribe limits but provides a framework for local regulations. The WFD has identified a high ecological status of a river if nutrient conditions remain within the range associated with undisturbed conditions, i.e natural background levels (European Commission, 2000). However, the definition of the natural background has been subject to debate for many river basins (Matschullat et al., 2000; van Raaphorst et al., 2000). The natural background can be defined as the situation (concentration range) found in the environment without any human activity, reflecting only natural geochemical processes (Laane, 1992; Reimann and Garrett, 2005). This definition implies that concentrations must be estimated before human activity, which is not always feasible. Therefore, a pre-industrial background can be defined instead, inferred from samples dating before the industrial revolution (Reimann and Garrett, 2005). The pre-industrial background can logically be affected by anthropogenic processes. Alternatively, natural background concentrations can be estimated by sampling regions with an expected minimal anthropogenic influence, i.e. reference lakes and rivers (Cardoso et al., 2007). Natural background concentrations have been established for different chemical elements in rivers in Europe; however that did not include TP or PO4-P (Salminen et al., 2005).
For P in densely populated regions such as Flanders, the natural background concentrations can only be inferred indirectly. Natural background TP concentrations for Flanders were set at 15–35 µg P L−1, inferred from reference lakes sampled in central and Baltic states in Europe (Cardoso et al., 2007). However, the natural background PO4-P concentrations of lowland rivers may be higher than those of upland rivers. For example, diatom assemblages revealed natural eutrophic conditions in the Spree River in Germany with TP concentrations of 80 µg L−1, compared to recent data of 120 µg TP L−1 (Schönfelder and Steinberg, 2004; Zak et al., 2006).
Lowland rivers can be significantly loaded with P derived from the riverbed sediment, defined as internal loading (Froelich, 1988). The internal loading of P better explains temporal and spatial trends in river P concentrations than the P emissions of the lowland river system of Flanders (Smolders et al., 2017). Biogeochemical processes in the sediment explain that result. Ferric iron (Fe(III)) and aluminium oxyhydroxides have a high affinity for PO4 anions and limit the PO4 in solution (Borggaard et al., 1990; Holtan et al., 1988). However, anoxic conditions lead to the reductive dissolution of those Fe(III) minerals, releasing the associated P to the overlying water when the sediment is strongly reduced (Baken et al., 2015; van Dael et al., 2020). The small rivers and ditches in lowland regions have a low water velocity and are nutrient-rich, leading to anoxic conditions during summer and autumn. Those anoxic events explain the typical summer peaks in PO4 in small rivers. Moreover, regional differences in sediment P Fe concentration ratios explain regional differences in surface water PO4 concentrations (Smolders et al., 2017).
Sediment analysis is linked to surface water P and can be a valuable tool for assessing historical river water quality. In surface waters, sediments can serve as a sink or a source of PO4, depending on the sediment surface chemistry and water concentrations (Froelich, 1988; House and Denison, 1998; Simpson et al., 2021; van der Zee et al., 2007). For example, P storage on fine bed sediments can amount to 60 % of a catchment nutrient budget (Ballantine et al., 2009; Svendsen and Kronvang, 1993). The essential processes for PO4 are adsorption and desorption from Fe oxyhydroxides, present in the suspended matter or bed sediments (Froelich, 1988; van Raaphorst and Kloosterhuis, 1994; van der Zee et al., 2007). Sediment P concentrations can likely predict surface water P concentrations and have been relevant for the long-term reconstruction of P in the environment (Wang et al., 2009; Zhou et al., 2005). For example, Boyle et al. (2015) used P profiles from lake sediments in the UK to infer catchment P inputs over the last 10 000 years and linked that to the historical evolution in population density. Similarly, banded iron formations in deep oceanic waters allowed the inference of oceanic P concentrations of over 2 billion years ago (Bjerrum and Canfield, 2002). Likewise, the sediments deposited by rivers or lakes react with surface water PO4 and are deposited in regularly flooded areas. Thus, those sediments can serve as an archive for reconstructing historical P emissions trends and provide useful information on historical P concentrations in adjacent water bodies (Birch et al., 2008).
In lowland rivers with tidal influence, like the Scheldt, vegetated tidal marshes develop along the river banks. Tidal marshes directly adjacent to tidal rivers are regularly flooded during high tides: these flooding events deposit sediments and associated elements like P on the densely vegetated marsh surface (Friedrichs and Perry, 2001; De Swart and Zimmerman, 2009; Temmerman et al., 2004a). The net accumulation of sediments increases the elevation of tidal marshes over time (Temmerman et al., 2003a). Therefore, researchers have used tidal marshes as sediment archives of deposited substances other than P, such as organic carbon (Van de Broek et al., 2019) and silicon (Struyf et al., 2007). However, it remains to be investigated to what extent P concentrations measured in tidal marsh sediment archives can be used to reconstruct historical changes in PO4 concentrations in the adjacent estuary.
This study tested and evaluated a methodology to estimate the pre-industrial background water PO4 concentrations based on the analysis of tidal marsh sediment. Those sediments had been deposited over multiple centuries on the banks of Flanders' largest tidal river, the Scheldt. Using sediment analysis and a sorption model provided the first estimate of pre-industrial PO4 levels in a large lowland river. First, we described the tidal marsh sediment sorption characteristics by linking the P concentration of tidal marsh sediments to historical measurements of PO4 in the Scheldt River water. Those sorption characteristics allowed an estimation of historical river water PO4 concentrations. This estimate was based on an analysis of sediments deposited in the 1800s or before industrialization. The underlying assumption is that sediment P remains immobile and that the sediment's depth profile reflects the historical trend of PO4 in the Scheldt River. Accordingly, we argue that the sediment P composition in deeper sediment layers of tidal marshes provides an archive of the historic PO4 concentration of the adjacent river. A database containing measurements of the PO4 concentration in the Scheldt River's surface water (1967–current) verified this assumption. This study hypothesizes that the previously estimated natural background P of this major lowland river is larger than that estimated earlier for lakes (15–35 µg P L−1).
2.1 Study area
Freshwater tidal marshes were sampled at four locations along the Scheldt River (Fig. 1 and Table S1 in the Supplement). The Scheldt estuary is located in northern Belgium and the southwestern Netherlands and flows into the North Sea. The river basin of the Scheldt covers a large part of Flanders (71 %) and the adjacent region of northern France; the total catchment area is approximately 22 000 km2. The population living in the river basin is about 10 million (Meire et al., 2005). The tidal wave extends from the mouth (Vlissingen) to 160 km upstream near Ghent, where sluices stop the tidal wave. The estuary's freshwater tidal zone reaches from Ghent to Rupelmonde (Fig. 1). This research focused on freshwater tidal marshes, i.e. located in this freshwater tidal zone of the estuary. Brackish waters experience the mixing of seawater, making it difficult to distinguish the anthropogenic sources from seawater influence. Furthermore, saltwater in the North Sea has PO4 concentrations about a factor of 10 lower than fresh water in the Scheldt River (Burson et al., 2016). This research was focused on freshwater lowland river systems and the human influence on the P concentrations; saltwater environments were beyond the scope of this study.

Figure 1Map of the Scheldt estuary: triangles indicate the locations of the sampled tidal marshes. Old1 and Young1 were only 250 m apart, and on the scale of the map, they overlap.
Sediment accreting in tidal marshes originates from the deposition of riverine suspended matter, including inorganic mineral sediment and organic matter (Callaway et al., 1996). We discriminate between old and young tidal marshes, hereafter referred to as marshes. Old marshes have a higher elevation compared to young marshes. As a general mechanism, young marsh surfaces accumulate sediments quickly and increase their elevation asymptotically up to an equilibrium level, which is around the mean high water level (MHWL) (Pethick, 1981; Temmerman et al., 2003a). Temmerman et al. (2003a) defined an old marsh as visible on topographic maps of Ferraris (1774–1777), so it was formed before the 19th century (Temmerman et al., 2003a). Young marshes in the Scheldt estuary were formed more recently, by the natural establishment of pioneer marsh vegetation on formerly bare tidal mudflats, generally after 1944. During the last decades, the young marshes had a surface elevation below MHWL. As a result, young marshes experienced more frequent inundations and had larger sediment accretion rates than old marshes. For example, between 1931 and 1951, young marshes accumulated at rates of 1.6 to 3.2 cm yr−1. In contrast, the elevation of old marshes was very close to the yearly MHWL increase rate of 0.3 to 0.6 cm yr−1 in the western Scheldt (Temmerman et al., 2003a).
This study analysed depth profiles of sediment cores originating from tidal marshes along the freshwater Scheldt River. The analysis contained two old and two young marshes, Old1, Old2, Young1, and Young2 (locations indicated in Fig. 1). The coordinates of sampling locations can be found in Van de Broek et al. (2018, 2016) and Sect. SI.I in the Supplement. Marshes Old1 and Young1 originated from the tidal marsh named the Notelaer, Old 2 from Grembergen, and Young2 from Mariekerke. Eight cores were analysed: three replicate cores for both sites Old1 and Young 1 and one core for Old2 and Young2.
2.2 PO4 concentration in surface waters
The Flanders Marine Institute (IMIS) provided surface water phosphate (PO4) data measured colourimetrically on a filtered water sample and total phosphorus (TP) by acid digestion and a segmented flow analyser. Concentration data of PO4 in Scheldt River were available from 1967 to 2019, originating from different sources and compiled by the research programme Onderzoek Milieu Effecten Sigmaplan (OMES). The OMES programme did additional quality controls on the data (ECOBE – UA; The Flemish Waterway, 2019). The different sources are described in Sect. SI.V in the Supplement (De Pauw, 2007; ECOBE – UAntwerpen, 2007; Institute for Hygiene en Epidemiology (IHE), 2007; ECOBE-UA and De Vlaamse Waterweg, 2016; Van Meel, 1958).
The open-source software R (R Core Team, 2020) was used to compile all available datasets for PO4 closest to the study sites (Temse) and to calculate annual means by averaging all observations within a year. The annual means of PO4 were used to visualize the evolution of PO4 in the Scheldt River (Fig. 2). The emissions of P mainly originate from point sources due to domestic loading (Billen et al., 2005). As a result, the increasing surface water P concentration between 1950 and 1975 can be related to the rise in the number of households connected to sewer systems. At first, no wastewater treatment was in place, resulting in a sharp increase in nutrient loads to the river. However, since 1985, wastewater treatment has significantly improved the situation (Billen et al., 2005).
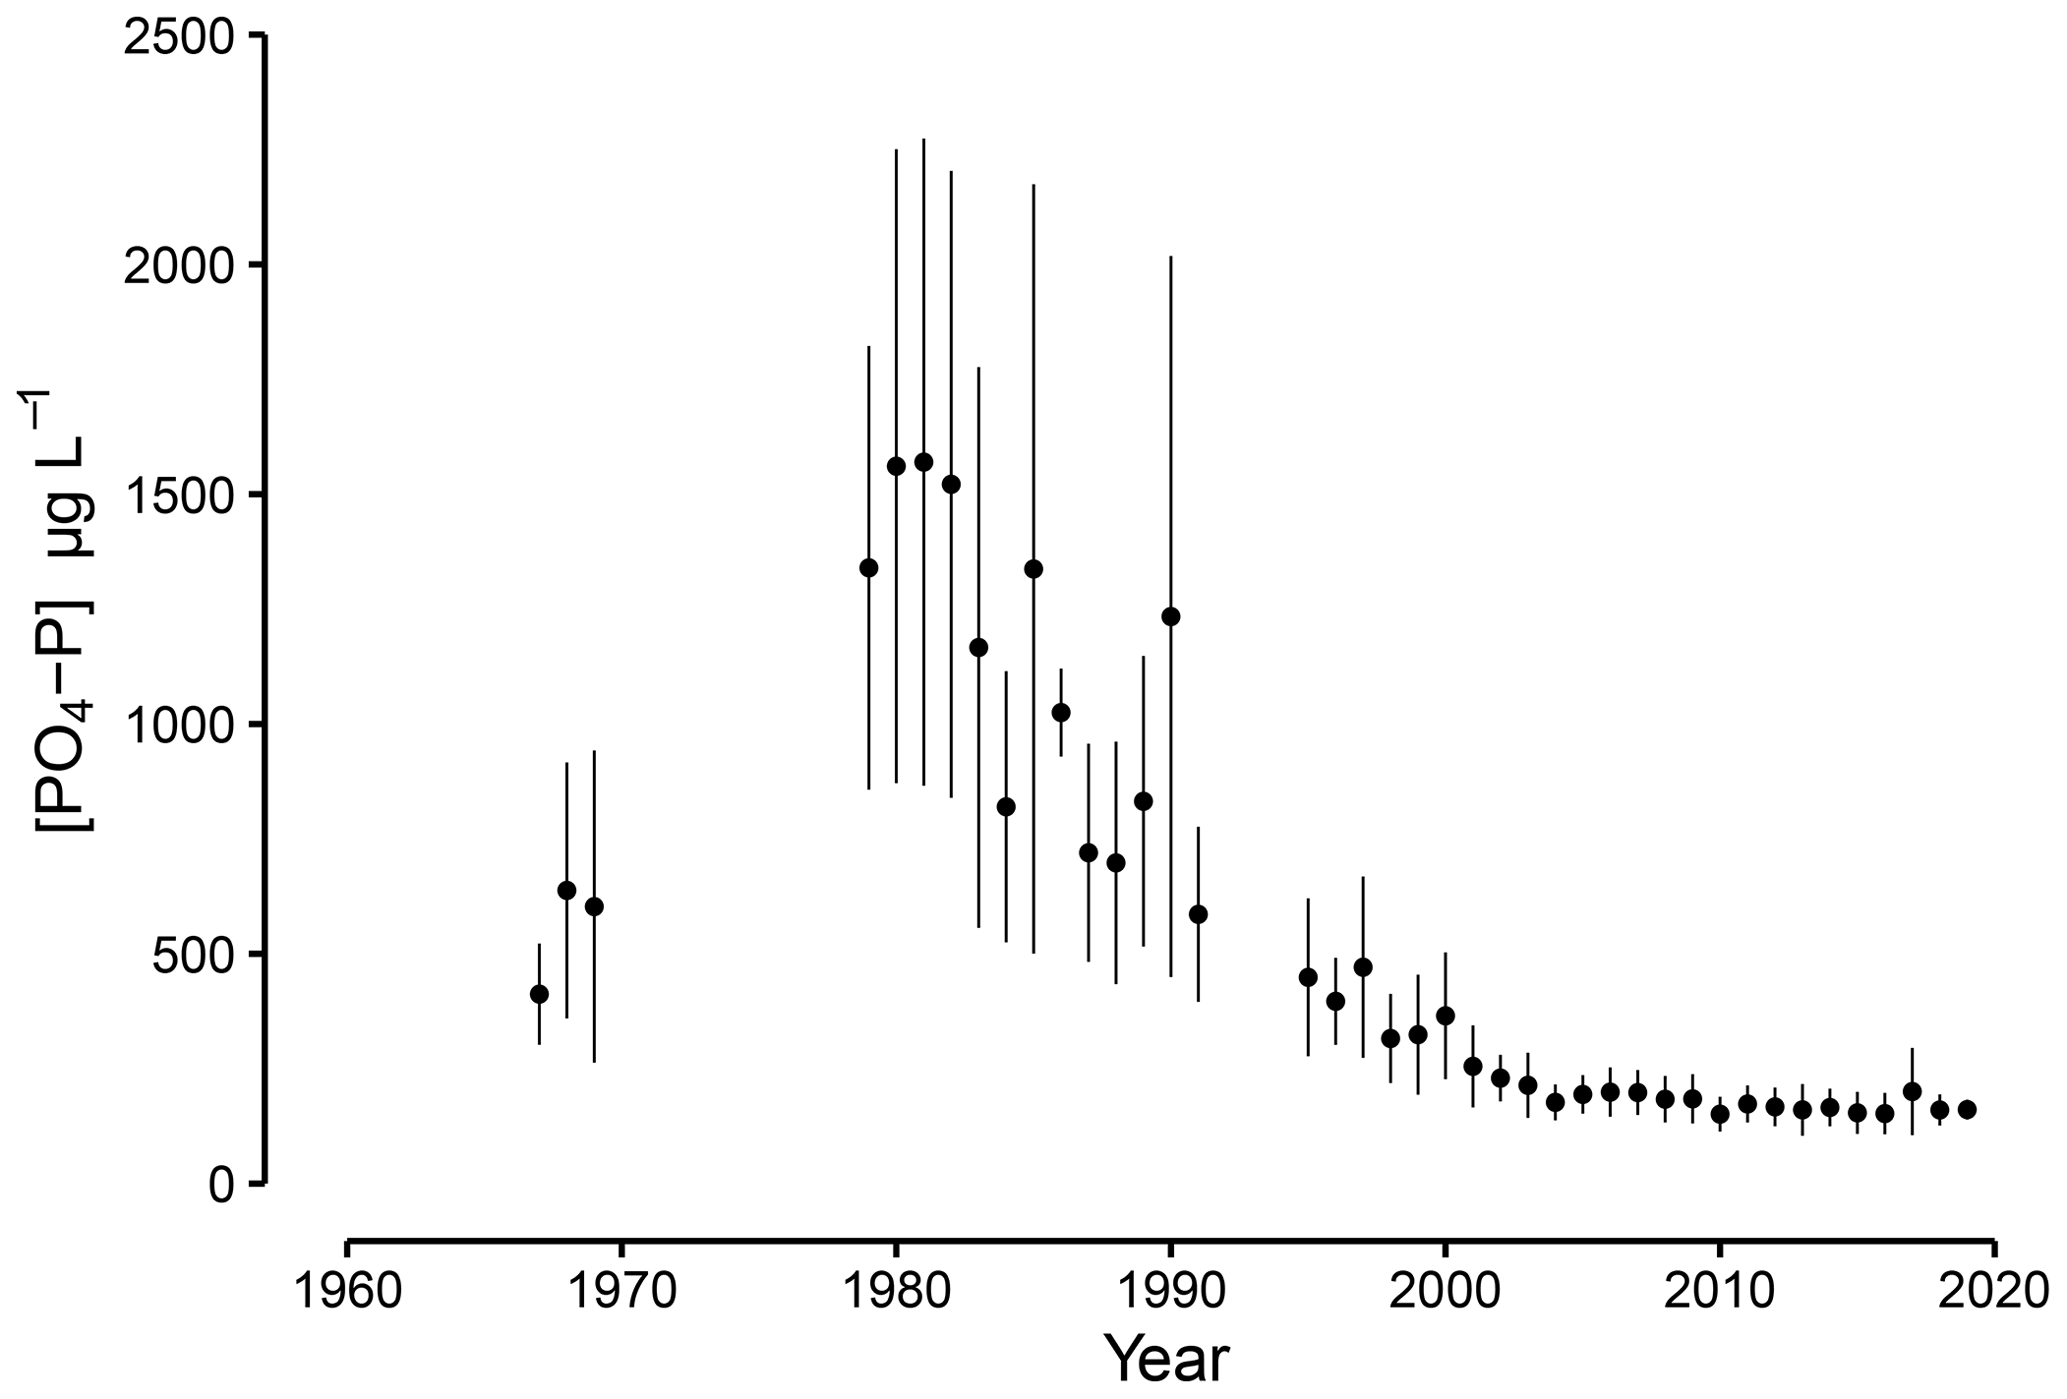
Figure 2Concentrations of phosphate in the Scheldt River at Temse, annual means and standard deviation (error bar) around the annual mean. Samples were taken in Temse close to tidal marsh sites (data sources: ECOBE-UA and De Vlaamse Waterweg, 2016; ECOBE – UAntwerpen, 2007; Institute voor Hygiëne en Epidemiologie (IHE), 2007; Van Meel, 1958; De Pauw, 2007).
2.3 Sediment sampling
The sediment samples used here had been collected during a previous study about carbon sequestration in tidal marsh sediments in the Scheldt estuary (Van de Broek et al., 2018, 2016). Collection of undisturbed sediment profiles on the tidal marshes took place between July and September 2016 (Old1, Young1, Old2, Young2; Fig. 1). Undisturbed sediment cores were taken at each sampling location using a gauge auger (0.06 m diameter). The cores were divided into subsamples with a 0.03 m interval. The sediment samples were dried at a maximum temperature of 50 ∘C for 48 h, crushed, and sieved to a <2 mm grain size. Macroscopic vegetation residues were removed manually using tweezers (Van de Broek et al., 2018). Bulk density, grain size distribution, and organic carbon (OC) content were analysed by Van de Broek et al. (2018). We refer to Van de Broek et al. (2016, 2018) for further sample collection and processing information.
2.4 Sediment analysis
The dried sediment samples were analysed for oxalate-extractable P, Fe, Al, and Mn (Pox, Feox, Alox, Mnox; Schwertmann, 1964). The preparation of extraction solution and dilutions were made with ultrapure water (Milli-Q®), and all glassware was acid-soaked overnight in a 1 % HCl acid bath to prevent P contamination. That acid oxalate extractant, a mixture of ammonium oxalate (0.2 M) and oxalic acid (0.2 M) at pH=3, targets poorly crystalline oxyhydroxides of Fe, Al, and Mn and the associated P (Schwertmann, 1964). Those poorly crystalline oxyhydroxides are the most reactive due to their large specific surface area (Hiemstra et al., 2010). The extraction was done with 1 g of dry sediment in 50 mL extraction solution over 2 h in an end-over-end shaker at 20 ∘C (26 rpm). The suspension was filtered through a 0.45 µm membrane filter (CHROMAFIL® Xtra PET – 45/25). Analytical blanks, internal reference samples, and duplicate samples were included in every batch to ensure the analysis's quality, purity, and reproducibility. The extracts were diluted 20 times and measured by inductively coupled plasma optical emission spectrometry (ICP-OES). The degree of P saturation (DPS; %) was calculated as in Eq. (1). The DPS represents the extractable (Pox) ratio to the P sorption capacity of the sediment. This P sorption capacity is estimated as half of the sum of oxalate Feox and Alox, because not all the Fe and Al in the soil are available for P sorption with Feox, Alox, and Pox in molar units.
The DPS is expressed as a percentage and can be interpreted as the ratio of sorption sites on the sediment occupied by P. Previous research used the DPS to identify agricultural areas sensitive to phosphate leaching and showed a good correlation with pore water P concentrations (Breeuwsma et al., 1995; Lookman et al., 1995; Schoumans and Chardon, 2015; Schoumans and Groenendijk, 2000; van der Zee, 1988). The DPS relation for porewater–soil systems was developed and verified by van der Zee et al. (1990). Lexmond et al. (1982) illustrated that the maximal sorbed P was about half the pool available after a long-term precipitation experiment. Therefore, the factor 0.5 is an empirical value representing the soil's sorption capacity. The parameter α primarily affects the maximum sorption capacity. So they set α at 0.5±0.1. However, even among soils, this parameter varied between 0.3 and 0.6 (Lexmond et al., 1982). For this research, low background concentrations are most important, so maximal sorption occurring at high PO4 concentrations is less relevant.
2.5 Age–depth model
The sediment analysis and the surface water PO4 data had to be linked by a corresponding date and location to fit a sorption model. Therefore, an age–depth model was used to calculate the time since deposition of each sediment sample. Temmerman et al. (2004b, a) developed a time-stepping marsh sedimentation model (MARSED). That model estimates sediment deposition rates and the resulting evolution of the tidal marsh elevation in the Scheldt estuary. Hence, we could use MARSED to determine the time since deposition of sediments throughout the sampled sediment profiles. The MARSED model simulates the tidal supply of suspended sediments and the settling to the marsh surface during tidal inundation cycles integrated over the years. The model was calibrated and validated against measured sediment deposition rates on the Scheldt estuary tidal marshes from 1945 until 2002 (Temmerman et al., 2003a, 2004b). The empirical data on sediment deposition rates were derived from radiometric and palaeoenvironmental dating of sediment cores at the exact locations sampled for the present study (Temmerman et al., 2004a, b).
For our current study, we extrapolated the MARSED model simulations of sediment accretion from 2002 until 2016, the sampling date of the sediment cores (Van de Broek et al., 2018). However, simulations overestimated the observed marsh surface elevation in 2016 by 25 cm for sampling location Old1, 29 cm for Young1, 19 cm for Old2, and 8 cm for Young2 (observed by RTK GPS surveying; Van de Broek et al., 2018; Poppelmonde, 2017). The MARSED model was initially designed to simulate the overall sediment accretion and surface elevation changes in tidal marshes in response to sea-level rise scenarios, for which those errors were acceptable. In contrast, the most important was the time of sediment deposition throughout the sediment profile for the present study. Therefore, the original age–depth relation calculated by MARSED was recalibrated using observed age–depth points. The observed age–depth points originated from GPS measurements of marsh elevation in 2016 (M. Van de Broek, unpublished data) and previously published radiometric and palaeoenvironmental dating (Temmerman et al., 2003, 2004). This rescaling procedure is explained in the Supplement (Figs. S1–S4 in the Supplement).
An approximate extrapolation procedure was used to estimate the sediment deposition time from depths below the oldest measured age–depth points (mentioned in the previous sentence). The observed age–depth points were available from 1958 for sampling site Old1, 1947 for Young1, 1963 for Old2, and 1968 for Young2 (Temmerman et al., 2004). This extrapolation procedure could only be applied for old marshes, which were defined as marshes that existed at least since the end of the 18th century (Temmerman et al., 2003a, 2004). Two sediment cores originated from old tidal marshes (Old1 and Old2). Based on observed age–depth points, it has been proven that the old marshes reached equilibrium with the MHWL before 1944. After 1944, the old marshes have built up their elevation at a rate comparable to local MHWL rise (Temmerman et al., 2003a). Here, we assumed that also between 1800 and 1944 these old marshes accreted at a rate comparable to the MHWL rise.
Historical tide gauge data of MHWL rise were available from 1901 for site Old1 and 1930 for site Old2 (ScheldeMonitor Team and VNSC, 2020; Temmerman et al., 2003a), and linear regression of the MHWL against time was used to estimate the marsh surface elevation before 1944 (Figs. S6 and S7 in the Supplement). However, the dating accuracy will be lower going further back in time. Furthermore, such extrapolation to earlier dates is not appropriate for young marshes, as they were only formed after 1950 by pioneer vegetation establishment on formerly bare mudflats (Temmerman et al., 2003a, 2004). Those mudflat sediment profiles do not have continuous sedimentary records as tidal marshes and are likely to be disturbed by erosion and sedimentation alternations (Belliard et al., 2019). Therefore, the sediment deposition time could not be extrapolated for the young marsh sampling locations.
2.6 Relating surface water PO4 with sediment P: the sediment–water model
The age–depth model and linear regression of MHWL provided a deposition year for each sediment sample. Thereby, the dataset of water PO4 between 1967–2016 was linked to the sediment DPS for each core. The resulting dataset contained all available surface water PO4 readings between 1967 and 2016, closest to the tidal marshes in Temse (n=1932) and a corresponding DPS value. The DPS value of a sediment sample originates from a specific layer of one sediment core or a mean DPS of the replicate sediment samples. This dataset allowed us to fit a sorption model further termed the sediment–water model. Schoumans and Groenendijk (2000) presented a Langmuir-type sorption model to predict PO4 concentration leaching from a soil layer based on the DPS Eq. (2).
with [PO4] phosphate concentration in kg L−1, K the sorption constant (L kg−1), and DPS (degree of P saturation; %). This model adequately described P sorption in soil across a wide range of pH values, including the Scheldt River pH (Schoumans and Groenendijk, 2000; Warrinnier et al., 2018). The model relies on surface complexation between PO4 and Fe and Al oxyhydroxides in the sediment. That complexation is determined by a chemical equilibrium between solid (adsorbed) and dissolved PO4 phase (Warrinnier et al., 2019). The parameter K of existing soil models has been calibrated for the soil–pore water system, and the sediment–water parameter (K) is unlikely equal. Therefore, the model was calibrated by fitting parameter K (Eq. 2) on sediment DPS measurements and recent Scheldt water PO4 measurements. As a result, the fitted K value is adapted to the local geochemistry of tidal marsh sediments and the surface water.
We explored 16 different scenarios to fit the sediment–water model Eq. (2). These scenarios illustrate the statistical uncertainty surrounding the estimated PO4 concentrations. The model was fitted separately for each site sediment core or on the combined replicate cores for Old1 and Young1 (Sect. SI.VI in the Supplement). Every sediment sample had between one and three replicates, depending on the depth and the site. The average value of these replicates was used or the individual replicate's DPS values. One sediment sample covered several deposition years, so multiple PO4 observations corresponded with each sediment sample. Again, the average of all corresponding PO4 readings was taken, or all available values were used separately. The combination of mean or individual DPS and PO4 resulted in 16 models (Table S2 in the Supplement). For each of these, the parameter K was fitted by non-linear least-squares regression with R using the Rstudio interface (R Core Team, 2020; RStudio Team, 2015).
2.7 Evaluation of model performance
The predictions of the sediment–water model were evaluated based on several parameters: the residual standard error (RSE), the Nash–Sutcliffe model efficiency (E), and the measured surface water PO4 plotted against predicted PO4 between 2007 and 2016 (Table S2 and Fig. S10 in the Supplement). Additionally, the percentage bias (PBIAS) was calculated for data points between 2007 and 2016. The PBIAS measures the average tendency of the simulated data to be larger or smaller than their observed counterparts. That difference is expressed as a percentage of deviation from the observations (Moriasi et al., 1983; Eq. 3). The predictions of recent years are interesting to evaluate the model's performance for two reasons. First, the most recent surface water PO4 concentrations are relatively low and more representative of background concentrations. Second, the monitoring data have a high temporal resolution, and the age–depth model is more accurate at shallow depths.
3.1 History of surface water PO4 concentrations
The Scheldt PO4 concentrations varied greatly over the past decades, with the peak in surface water PO4 concentrations between 1975 and 1985 (Fig. 2). In Temse, the annual mean concentrations rose from 410 µg PO4-P L−1 in 1967 and peaked in 1980 with 1570 µg PO4-P L−1. Between 1990 and 2003 concentrations decreased and stabilized between 160 and 200 µg PO4-P L−1 in Temse. The current PO4 levels are a factor of 2 lower than in 1967 and almost a factor of 10 lower than the peak in 1980 (Fig. 2 and Table 1).
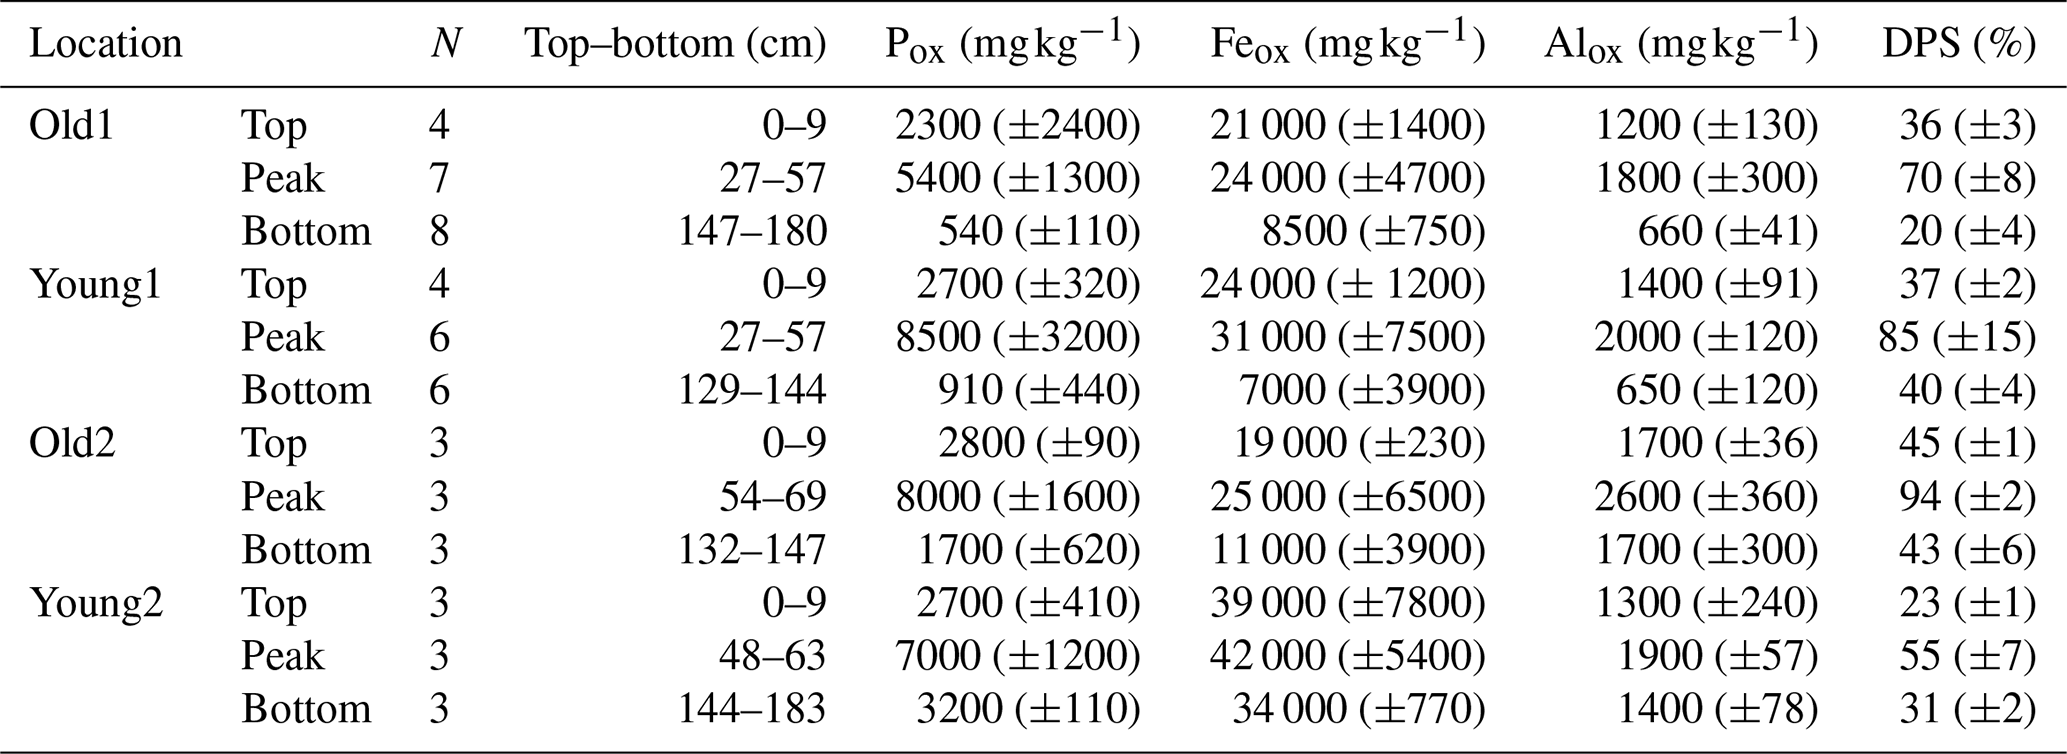
Table 1The sediment oxalate extractable P (Pox) and its degree of phosphate saturation (DPS) of the top, bottom, and peak sediment layers at four different tidal marsh locations. Top layers are the sediments closest to the surface, peak layers had maximal Pox and DPS, and bottom layers are those sediments sampled at the largest depth. Values of Pox and DPS are means (± standard deviation) of N sediment samples, between top and bottom (cm) depth.
3.2 Sediment cores
The Pox in the sediments ranged between 370 and 13 000 mg P kg−1, while the DPS ranged between 13 % and 94 % (Table 1). In all soil cores starting at the surface, the DPS and Pox increased with depth and peaked at about 0.5 m below the surface (Figs. S7 and S8 in the Supplement). In deeper (>1.0 m) sediment layers, Pox and DPS decreased and stabilized for Old1, Young1, and Young2 (Table 1). Overall, the Pox increased by an average factor of 3.5 between the surface and the maximum concentrations (Fig. S8 and Table 1). The sediments with these peak DPS values were deposited between 1960 and 1985 in three of the four sediment cores (Fig. 2). Only the core Old2 peaked earlier (ca. 1940–1950). Most importantly for this work, DPS for Old1 showed an apparent stabilization in deeper or older layers, which indicated undisturbed sediment layers (Figs. 3 and S7).
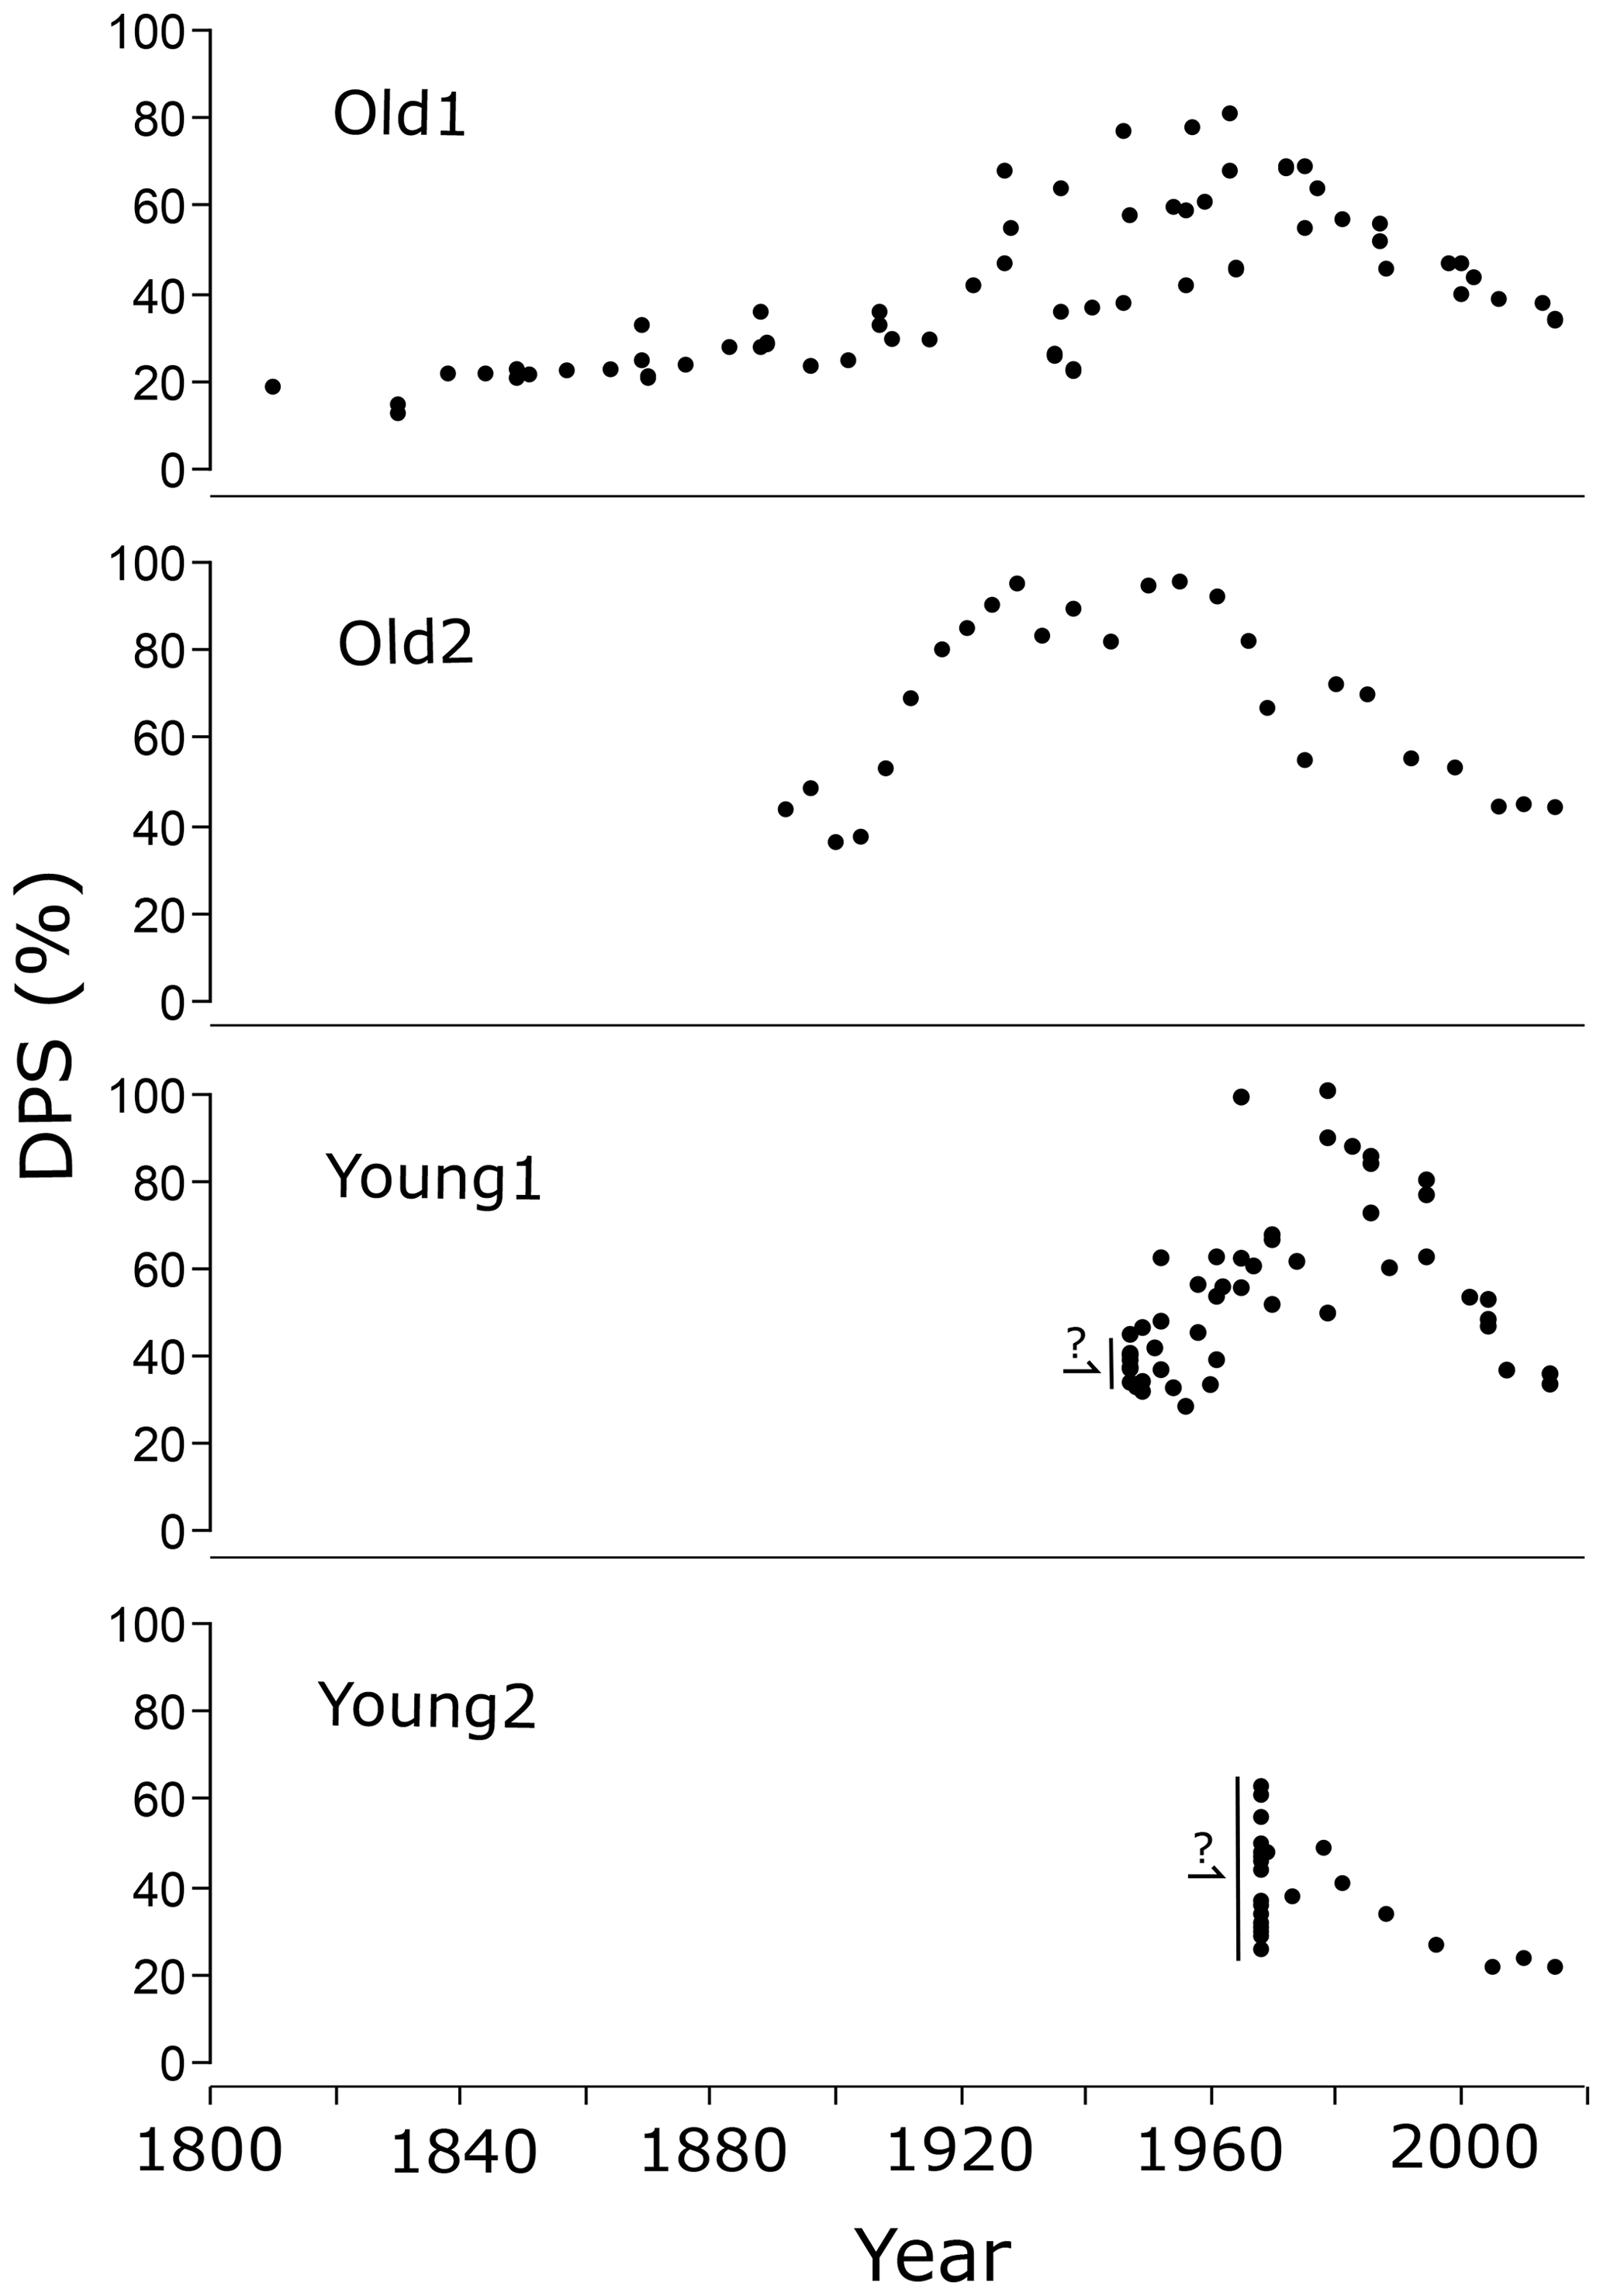
Figure 3The degree of phosphate saturation (DPS) timeline based on four tidal marsh sediment sites. Each dot represents a sediment analysis. The year assigned to each sediment analysis was calculated with the age–depth model. Before 1930, no model dates were available. Therefore a linear regression of the MHWL was used to extrapolate the dates for the old marshes. Dates before 1930 are increasingly uncertain going further back in time. For young marshes, such extrapolation was not possible. The points before the formation of the marshes are indicated with a question mark.
Within the first metre, Feox was stable in the three soil cores (Old1, Young1, Old2) with concentrations around 20 000 mg kg−1, except for Young2 for which Feox was a factor of 2 larger (Fig. S9 in the Supplement). For Young1 and Young2, Feox concentration decreased at depths >1 m. For Old1, Feox showed a steady decline from 20 000 mg kg−1 at the surface to 10 000 mg kg−1 at the bottom of the profile (Fig. S9). The Alox concentrations showed a similar trend as the Pox concentrations, with an initial increase followed by a decrease with depth. The strong correlations of Alox and Feox with Pox (rAl=0.73 and rFe=0.65) illustrate the positive effect of Fe and Al oxyhydroxides on P sorption.
3.3 Sediment core selection
Under the assumption that PO4 does not migrate, the tidal marsh sediment cores can provide an archive for river water PO4. Considering P migration, it is crucial to evaluate the distance from a creek within the tidal marsh. That distance is essential for two reasons. First, within 10 to 20 m of the creeks, the groundwater table fluctuates largely with the tides, which can induce vertical P migration (Van Putte et al., 2020). Secondly, sediment accretion is more difficult to predict at closer distances to the creeks and can affect the age–depth relation (Temmerman et al., 2003b). The distance from the sediment cores to the nearest creek was 21 m for Old1, 56 m for Young1, 35 m for Young2, and 5 m for Old2.
The assumption that PO4 does not migrate may be most violated at Old2 and Young2. The profile of Old2 indicated P migration because it had a peak of Pox at an earlier date (1950) than was expected from surface water data (1980) (Fig. 2). Consequently, Old2 was not taken up to interpret the relation between DPS and PO4. For core Young2, deeper sediment layers had a larger DPS than the surface layers (Table 2). Additionally, the age estimation of sediments older than 1968 was impossible due to this tidal marsh's young age. Furthermore, Feox concentrations were a factor of 2 larger than the other cores (Fig. S9) and a factor of 2 larger than the average sediment Fe concentration of the upper Scheldt basin (VMM, 2019). The local enrichment in iron lowers the DPS values and makes the core less representative of the average situation in the Scheldt. These observations made Young2 inappropriate to fit the relation between DPS and PO4.
Table 2The predicted concentrations of phosphate (PO4-P µg L−1) in the Scheldt River based on the degree of phosphate saturation (DPS) in the sediment layers of marsh Old1, dating back to 1800 (pre-industrial), where DPS values stabilized with depth at 20 %. The predicted concentration dated to 1930, where DPS stabilized at 36 %. The PBIAS is the mean difference of simulated and observed data between 2007 and 2016, expressed as a percentage of the observed data. The conversion of DPS to river phosphate concentration is based on the association of DPS with PO4-P. That association was calibrated to data from 1967–2016, thereby using different sediment–water models; the details of models are in Table S2. Model 3b (in italics) is proposed as the most accurate (see text).

The two remaining soil cores, Old1 and Young1, originated from the same tidal marsh area named “the Notelaer”, located near the city of Temse (Fig. 1). That marsh has been the topic of multiple studies on sediment accretion (Temmerman et al., 2004b, 2003a) and soil OC stocks (Van de Broek et al., 2018, 2016). The sediment profiles of both Old1 and Young1 sites rise and fall in DPS comparable to dynamics in surface water PO4 concentrations (Figs. 2 and 3). In deeper sediment layers, DPS and Pox stabilize below levels of recent deposits (Figs. S7 and S8). The time series of Old1 displayed a DPS peak around 1960, indicating a shift of 20 years (Fig. 2). However, the core Old1 was taken up for the model fitting because it dates back to 1800 at the deepest levels and is essential to predict the background. Furthermore, the DPS concentrations stabilized before 1920, indicating that P has not migrated to these depths, making it suitable for background prediction. These observations suggested a well-preserved Pox and DPS profile, essential for the DPS–PO4 relation. Therefore, Old1 and Young1 are considered the best profiles for applying the sediment–water model and interpretation of background concentrations.
3.4 Sediment–water model fit
The sediment–water model Eq. (2) was fitted on DPS–PO4 data from the different sediment cores (Table S2). Two observations were omitted because the DPS values were too large (0.99–1.02) and produced artefacts in the results. The Nash–Sutcliffe model efficiency (E) ranged between 0.04 and 0.85 depending on the input data (Table S2; Nash and Sutcliffe, 1970). The sediment–water model was fitted on each core's data separately and combined data from Old1 and Young1, as they came from the same tidal marsh location. The models fitted on data from sites Old2 and Young2 were not considered as migration likely affected those cores (see Sect. 3.3).
The models fitted on an average DPS (across replicates) associated with individual PO4 readings were considered most suitable (models 1b, 2b, 3b; Table S2). A single sediment sample analysis represents an average P signal over the sediment's deposition period. However, the age–depth relation can vary slightly due to the marsh surface elevation variation. By taking an average DPS from replicate cores, the variation in the independent variable was reduced. Furthermore, the prediction error increased in most models by relating individual rather than mean DPS values with individual PO4 measurements (Table S2). Models using unique DPS associated with single PO4 data duplicated or even triplicated the PO4 data, artificially creating more degrees of freedom (model 1c, 2c, 3c; Table S2). Using mean PO4 values artificially reduced the degrees of freedom, compromising the model predictions by increasing RSE and widening confidence intervals (models 1a, 2a, 3a; Table S2). The fitted parameter K (L kg−1) ranged between 1.0×10⁶ and 5.4×10⁶ for the different input datasets, with the 95 % confidence intervals ranging between 0.8×10⁶ and 7.2×10⁶. The variation in parameter K for the various input datasets was larger than the individual confidence limit variation (Table S2). Thus, the uncertainty was more pronounced due to the variability in sediment samples than due to the model fit.
3.5 Model performance
The sediment–water model performance was evaluated with several parameters (RSE, PBIAS, and E) and the actual PO4 by predicted plots of the PO4 concentrations over the last decade. Those recent PO4 concentrations are more comparable to the background (Fig. S10 in the Supplement and Table 2; mean Temse [2007–2016]=170 µg PO4-P L−1). Model 3b was considered the most suitable for predicting background concentrations. The PBIAS was the lowest for recent observations for model 3b. The average tendency of simulated data compared to the observations was only −14.9 %, which is within the acceptable range of ±25 % (Moriasi et al., 1983). Model 2b had an underestimation of observed data of more than 28 %, and model 1b overestimated recent observations by more than 60 %. Such an overestimation is unwanted for calculating the background, and therefore, both were considered unsuitable (Table 2). The actual PO4 by predicted plots illustrates a similar message (Fig. S10). Based on these observations, model 3b was considered the best model, although the residual standard error (RSE) was lower for model 2b (Table S2). The selected model 3b successfully reconstructs the rise and fall in surface water PO4 concentrations based on the sediment characteristic DPS (Fig. 4).
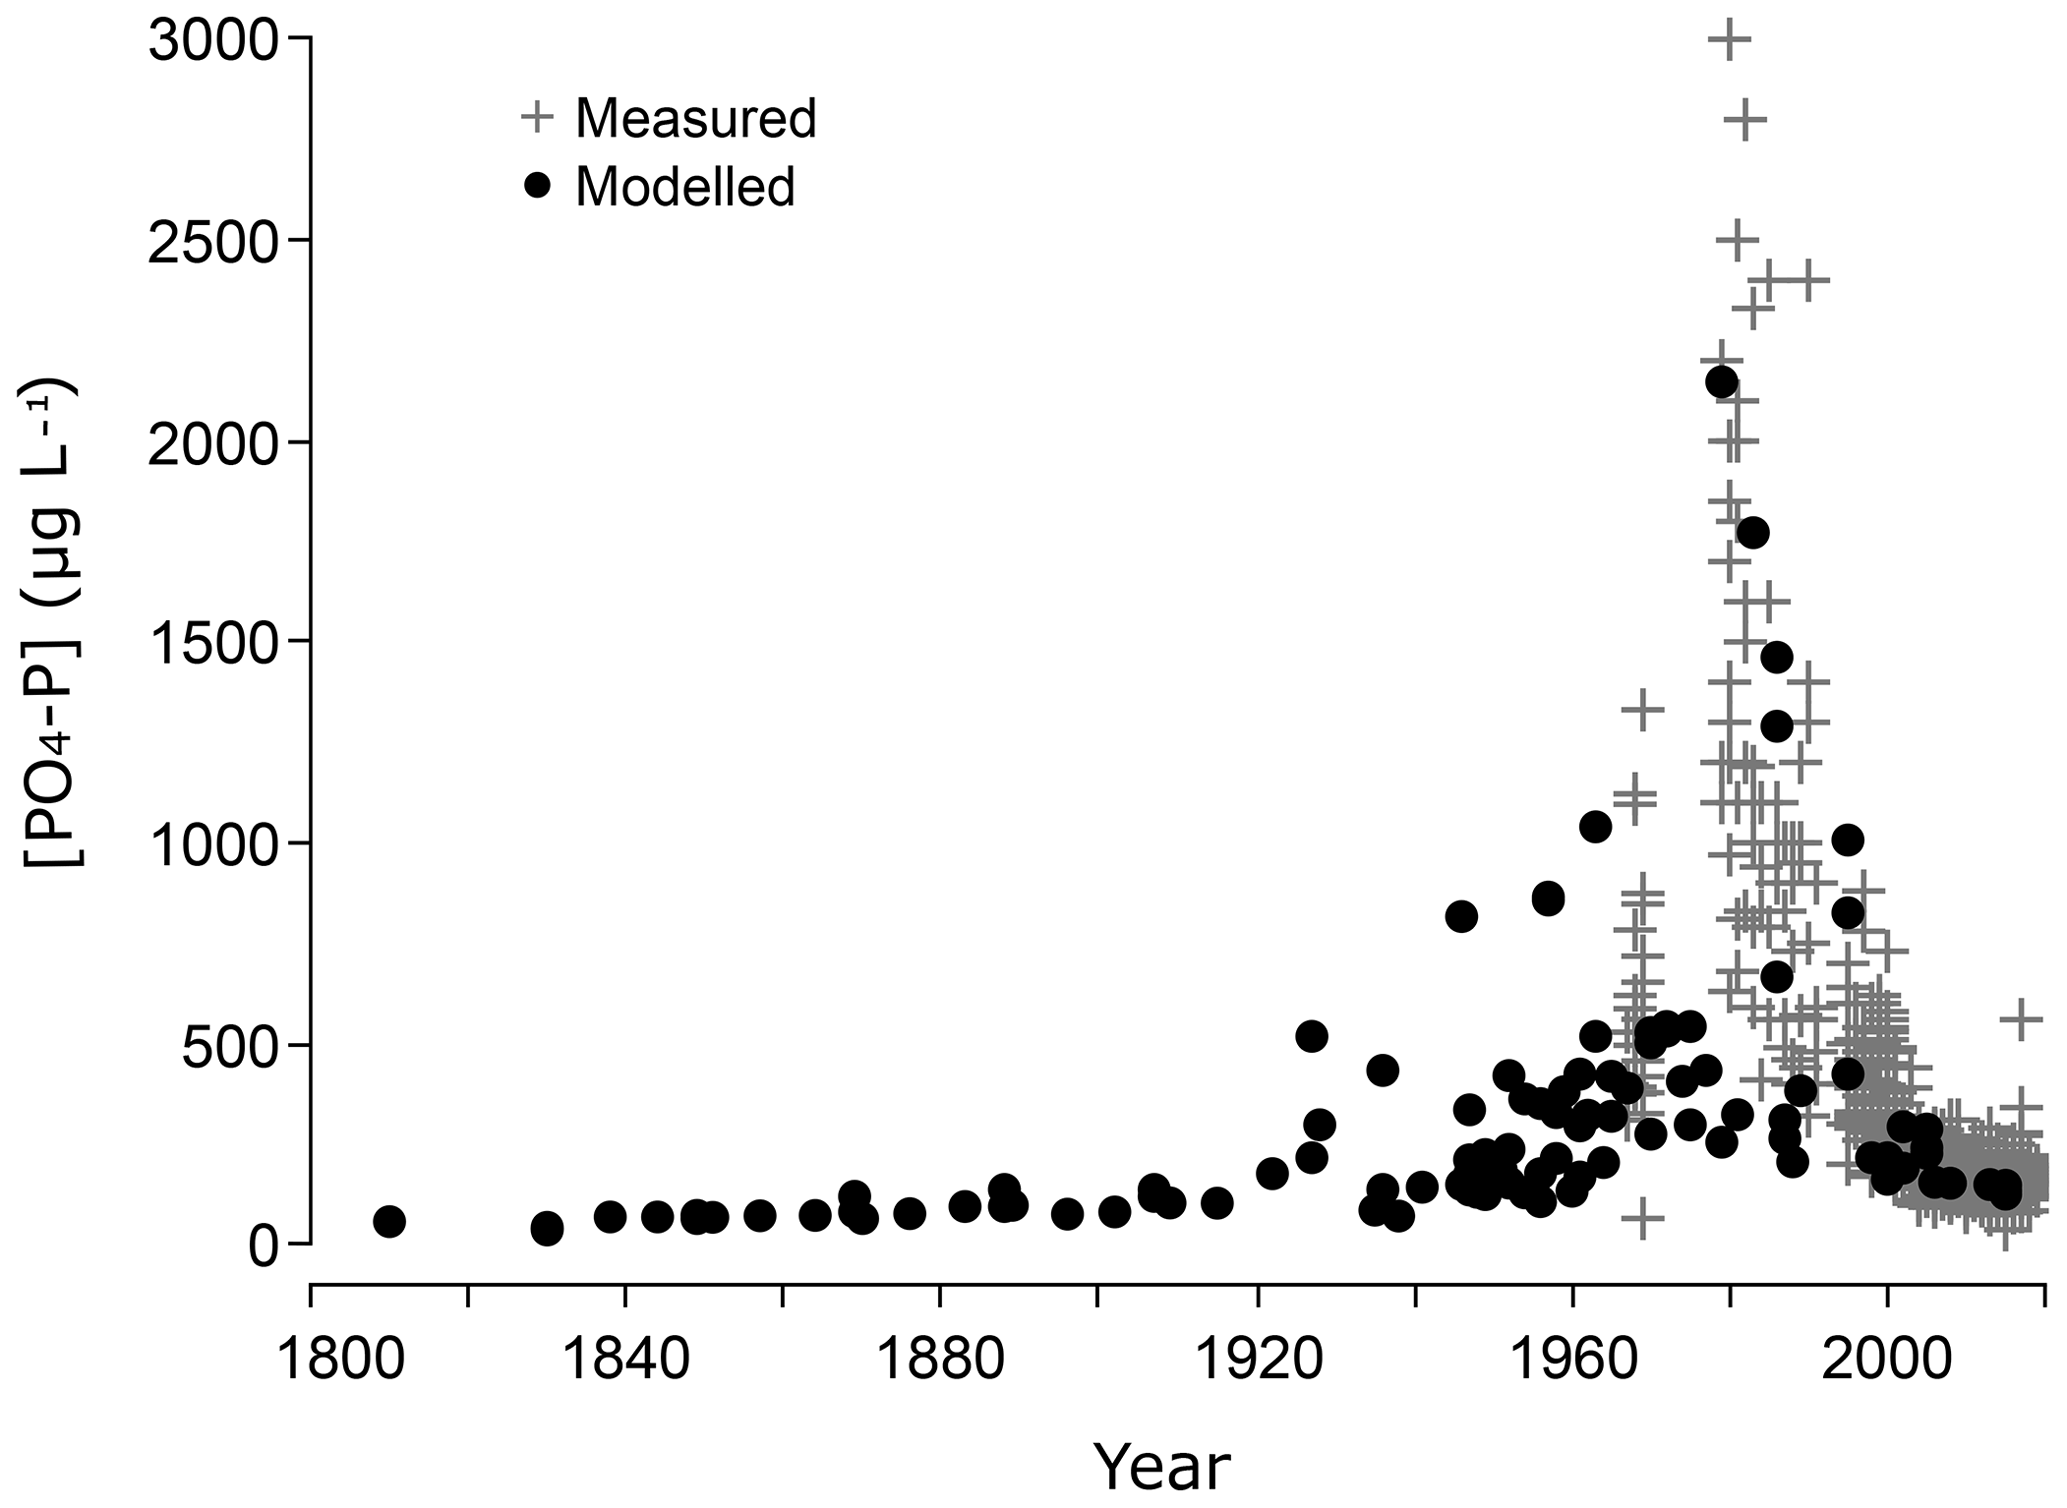
Figure 4Measured (grey crosses; +) and predicted (black points) PO4-P concentrations (µg L−1) in the Scheldt River in Temse. The concentrations are calculated from the sediment phosphate saturation (DPS) of the tidal marshes at Old1 and Young1, using sediment–water model 3b.
Maxima of monitored and predicted PO4 concentrations coincide in time and have a similar size (Fig. 4). For example, in 1973, the average PO4 concentration predicted by the model was 1200 µg PO4-P µg L−1, and measured concentrations were on average 1300 µg PO4-P µg L−1. The maximal predicted PO4 concentration was 2200 µg PO4-P L−1, while the maximal observed concentration was 3000 µg PO4-P L−1. Predictions for recent years are within 15 % of the observed data (e.g. 2015: model: 133 µg PO4-P L−1, measured 155 µg PO4-P L−1). Between 1940 and 1990, the modelled PO4 concentrations had more variation. Likewise, monitored PO4 data are spread more between 1967 and 1990 (Fig. 2). Before 1930, modelled PO4 concentrations stabilized at levels below current observations (Fig. 4).
3.6 Estimating background PO4 concentrations in the Scheldt River
The deepest sediment layers are most suitable for predicting background PO4 concentrations of the Scheldt River water. These layers are the oldest and expected to have experienced the lowest impact of P additions from anthropogenic sources. The Old1 marsh site was appropriate for this purpose as it developed before 1774, before the industrial revolution in Belgium. The average DPS for the bottom sediments, dated between 1800 and 1840, was 20 % for core Old1 (Table 1 and Fig. 2); these samples are considered to represent the pre-industrial background. That DPS value produced PO4 concentrations of 62 µg PO4-P L−1 [95 % CI (57; 66)] for the pre-industrial background, using sediment–water model 3b (Table 2). The sediment dated to 1930 had a DPS of 36 %. For that value, the same sediment–water model predicted a PO4 concentration of 140 µg PO4-P L−1 [95 % CI (128; 148)] (Table 2).
4.1 Pre-industrial background vs. ambient PO4 concentrations
This work presents a novel approach to reconstruct background surface water PO4 concentration in a tidal river using the DPS of adjacent tidal marsh sediments. The background concentration is essential in the context of developing local nutrient limits. The predicted pre-industrial background concentration (62 µg PO4-P L−1; Table 2) is about half of the current surface limit of the Scheldt (120 µg PO4-P L−1; Flemish Government, 1995). Remarkably, the predicted background concentrations are about a factor of 2 larger than the background estimates of lake waters for Flanders today (15–35 µg PO4-P L−1; Cardoso et al., 2007). That pre-industrial PO4 concentration is about 3 times lower than the current concentration in the Scheldt. For example, between 2007 and 2016, the mean PO4 concentration of the Scheldt in Temse was 170 µg PO4-P L−1. However, in the 1930s, the concentration was estimated at 140 µg PO4-P L−1 and larger than current limits, at a time before widespread connection to sewer systems, P-loaded detergents, and application of mineral fertilizers.
Those results suggest that the sediment internal loading triggered by summer anoxia in lowland rivers contributes to larger PO4 concentrations than estimated before (see introduction). The summer PO4 peak lasts about 5 months per year in Flanders and largely affects the rivers' mean P concentrations (Smolders et al., 2017). Summer anoxia can occur in eutrophic lakes or sometimes in oligotrophic brown water lakes (Nürnberg, 1995). Additionally, lowland rivers in Flanders are primarily groundwater-fed, and 73 % of streamflow can be attributed to base flow. The groundwater in Belgium has a median P concentration between 150–320 µg P L−1 (Edmunds and Shand, 2009). Therefore, groundwater feeding the river waters logically affects the river P concentrations. In contrast, primarily rain-fed lakes will have lower P concentrations, with rain P ranging between 1.5 and 120 µg P L−1 (Migon and Sandroni, 1999).
4.2 Limitations of the model
Care needs to be taken with background extrapolations to ensure that post-depositional processes have not modified the biogeochemical patterns and that the area represents the area of interest (Reimann and Garrett, 2005). Several factors can obscure the reconstructed background concentrations. First, vertical migration of P can enrich deeper sediment layers, causing an overestimation of the background. Second, the sediment profiles at the tidal marshes are almost permanently saturated, so the intrusion of P-rich groundwater could affect the P concentrations in the tidal marsh sediment. Moreover, depending on the tidal marsh elevation, periodic flooding occurs at an approximate range of 300–350 inundations per year (Temmerman et al., 2003b). These conditions could favour P migration due to the reductive dissolution of Fe (oxy)hydroxides (Baken et al., 2015; van Dael et al., 2020).
Two cores with indications of PO4 migration were removed from the analysis to address the issue (Old2 and Young2). These cores were identified by the DPS age profile and considering the distance from the nearby creeks (Figs. 2 and 1). Additionally, the DPS levels of the deepest sediment layers were compared with layers at the surface. The surface layers had lower DPS levels than the deepest layers for one core (Young 2). The two remaining cores (Old1, Young1) had lower DPS levels in deeper sediment layers (Fig. S7). More importantly, the modelled peak in PO4 concentrations based on the cores Old1 and Young1 were found within 2 years of the monitored peak and had a similar magnitude (Fig. 4). The coinciding peaks illustrate little migration of PO4 in Old1 and Young1, thereby justifying these cores as an archive for water PO4.
The limited migration is also logical: at the average DPS of 90 % in sediment showing at the peak, the sorption models predict that the solid–liquid P concentration ratio is 2900 L kg−1 with the average K value of models of Table 2. That solid–liquid ratio can be converted to a dimensionless retardation factor representing the ratio of the distance migrated by the PO4 compared to the distance travelled by percolating water. For example, the retardation was calculated to be 7500 with a bulk density (ρb) of 1.3, porosity (θ) of 0.5, and a net vertical annual water percolation of about 2 m. That retardation corresponds to a net vertical P migration rate of 2.5 cm over 100 years, i.e. vanishingly small (calculation details not shown).
Secondly, there is uncertainty on the age–depth estimation of the sampled sediment profiles. The age–depth model is expected to be most reliable for the Young1 sediment core, as it is based on a fitting of a modelled age–depth relation to four observed age–depth points, while we only had two observed age–depth points available for the other cores (Temmerman et al., 2004a). Additionally, observed age–depth points were not older than 1944. Hence, the extrapolation of the age–depth model to periods before the older available age–depth points is increasingly uncertain.
4.3 Pre-industrial and natural background values
The population increase between 1800 and 1930 can provide a first very crude estimate of the population–DPS relation in the Scheldt basin. In 1800 the population in Belgium was around 3 million. Later, in 1930, this number had more than doubled to 7 million (Vanhaute, 2003). A linear relation between both suggests that the DPS is 8 % for the pristine pre-anthropogenic environment, corresponding with a PO4 concentration of 19–41 µg PO4-P L−1, i.e. close to what researchers have indicated for pristine lakes. Such predictions need to be corroborated with older sediment observations and other archaeological information. The Scheldt River is logically more aerated than smaller lowland rivers where summer anoxia is naturally more present; i.e. the pristine PO4-P values will be higher.
Our study illustrated that tidal marsh sediments could evaluate pre-industrial background PO4 concentrations of the freshwater rivers like the Scheldt River. A sediment assessment can record time-integrated environmental events, providing useful spatial and temporal information. Our data estimated the pre-industrial background concentration at 62 µg PO4-P L−1 [95 % CI (57; 66)], about half of the environmental limits set for surface waters in Flanders and neighbouring countries. Around 1930, the PO4 levels were only about 20 % lower than today, which is a remarkably large concentration at a time before the massive application of mineral fertilizers, with lower population density and limited connection to sewer systems. The current PO4 concentrations decreased 10 times from the peak found 40 years ago, reflecting wastewater treatment efforts and reducing diffuse P emission. It is also clear from this study that the pristine, pre-anthropogenic PO4-P concentrations in the Scheldt River are well below the current ambient ones.
The Supplement provides the sediment data analysis and age–depth model results in csv format. In addition, results of surface water data are available upon request at the IMIS (Flanders Marine Institute).
The supplement related to this article is available online at: https://doi.org/10.5194/bg-19-763-2022-supplement.
FL, ES, and PC designed the research. FL conducted the investigation process and developed the methodology under supervision of ES. MVDB carried out the fieldwork and conceptualized the use of the samples. ST provided the methodology for the age–depth model and software. TM validated the use of the surface water data. EVM and FL placed the results in perspective with historical data. All the authors contributed to discussion and data interpretations, review, and editing of the work.
The contact author has declared that neither they nor their co-authors have any competing interests.
Publisher's note: Copernicus Publications remains neutral with regard to jurisdictional claims in published maps and institutional affiliations.
The results of this research greatly depended on the data collected by the OMES-monitoring and The Flemish Waterway. Many years of intensive data collection and quality assessment of the Scheldt River resulted in a unique and valuable phosphate time series. We have the utmost respect for their work and are thankful we could apply the dataset for this research. We acknowledge Dries Grauwels and Kristin Coorevits for technical assistance. We recognize the efforts from the anonymous reviewers for their constructive comments on the work, which improved the quality of the result. Finally, thanks to the Scheldt for providing this beautiful sediment archive to travel back in time and explore environmental history.
This research has been supported by the Research Foundation – Flanders (FWO), project identifier: G089319N.
This paper was edited by Aninda Mazumdar and reviewed by two anonymous referees.
Azevedo, L. B., Van Zelm, R., Leuven, R. S. E. W., Hendriks, A. J., and Huijbregts, M. A. J.: Combined ecological risks of nitrogen and phosphorus in European freshwaters, Environ. Pollut., 200, 85–92, https://doi.org/10.1016/J.ENVPOL.2015.02.011, 2015.
Baken, S., Verbeeck, M., Verheyen, D., Diels, J., and Smolders, E.: Phosphorus losses from agricultural land to natural waters are reduced by immobilisation in iron-rich sediments of drainage ditches, Water Res., 71, 160–170, https://doi.org/10.1016/j.watres.2015.01.008, 2015.
Ballantine, D. J., Walling, D. E., Collins, A. L., and Leeks, G. J. L.: The content and storage of phosphorus in fine-grained channel bed sediment in contrasting lowland agricultural catchments in the UK, Geoderma, 151, 141–149, https://doi.org/10.1016/j.geoderma.2009.03.021, 2009.
Belliard, J. P., Silinski, A., Meire, D., Kolokythas, G., Levy, Y., Van Braeckel, A., Bouma, T. J., and Temmerman, S.: High-resolution bed level changes in relation to tidal and wave forcing on a narrow fringing macrotidal flat: Bridging intra-tidal, daily and seasonal sediment dynamics, Mar. Geol., 412, 123–138, https://doi.org/10.1016/j.margeo.2019.03.001, 2019.
Billen, G., Garnier, J., and Rousseau, V.: Nutrient fluxes and water quality in the drainage network of the Scheldt basin over the last 50 years, Hydrobiologia, 540, 47–67, https://doi.org/10.1007/s10750-004-7103-1, 2005.
Birch, G. F., McCready, S., Long, E. R., Taylor, S. S., and Spyrakis, G.: Contaminant chemistry and toxicity of sediments in Sydney Harbour, Australia: Spatial extent and chemistry-toxicity relationships, Mar. Ecol. Prog. Ser., 363, 71–87, https://doi.org/10.3354/meps07445, 2008.
Bitschofsky, F. and Nausch, M.: Spatial and seasonal variations in phosphorus speciation along a river in a lowland catchment (Warnow, Germany), Sci. Total Environ., 657, 671–685, https://doi.org/10.1016/J.SCITOTENV.2018.12.009, 2019.
Bjerrum, C. J. and Canfield, D. E.: Ocean productivity before about 1.9 Gyr ago limited by phosphorus adsorption onto iron oxides, Nature, 417, 159–162, https://doi.org/10.1038/417159a, 2002.
Borggaard, O. K., Jdrgensen S. S., Moberg, J. P., and Raben-Lange, B.: Influence of organic matter on phosphate adsorption by aluminium and iron oxides in sandy soils, J. Soil Sci., 43, 3, https://doi.org/10.1111/j.1365-2389.1990.tb00078.x, 1990.
Boyle, J. F., Chiverrell, R. C., Davies, H., and Alderson, D. M.: An approach to modelling the impact of prehistoric farming on Holocene landscape phosphorus dynamics, Holocene, 25, 203–214, https://doi.org/10.1177/0959683614556381, 2015.
Breeuwsma, A., Reijerink, J. G. A., and Schoumans, O. F.: Impact of manure on accumulation and leaching of phosphate in areas of intensive livestock farming, in: Animal Waste and the Land-Water Interface (pp. 239–249), edited by: Steele, K. F., Lewis Publishers, ISBN 978-1566701891, 1995.
Burson, A., Stomp, M., Akil, L., Brussaard, C. P. D., and Huisman, J.: Unbalanced reduction of nutrient loads has created an offshore gradient from phosphorus to nitrogen limitation in the North Sea, Limnol. Oceanogr., 61, 869–888, https://doi.org/10.1002/LNO.10257, 2016.
Callaway, J. C., Nyman, J. A., and DeLaune, R. D.: Sediment accretion in coastal wetlands: A review and a simulation model of processes, Curr. Top. Wetl. Biogeochem., 2, 2–23, 1996.
Cardoso, A. C., Solimini, A., Premazzi, G., Carvalho, L., Lyche, A., and Rekolainen, S.: Phosphorus reference concentrations in European lakes, Hydrobiologia, 584, 3–12, 2007.
Correll, D. L.: The Role of Phosphorus in the Eutrophication of Receiving Waters: A Review, J. Environ. Qual., 27, 261–266, https://doi.org/10.2134/jeq1998.00472425002700020004x, 1998.
De Pauw, C.: The environment and plankton of the WesterScheldt estuary, Ghent, available at: http://www.vliz.be/en/imis?module=dataset&dasid=1390 (last access: 2 April 2020, 2007.
De Swart, H. E. and Zimmerman, J. T. F.: Morphodynamics of tidal inlet systems, Annu. Rev. Fluid Mech., 41, 203–229, https://doi.org/10.1146/annurev.fluid.010908.165159, 2009.
Dodds, W. K. and Smith, V. H.: Nitrogen, phosphorus, and eutrophication in streams, Inland Waters, 6, 155–164, https://doi.org/10.5268/IW-6.2.909, 2016.
ECOBE-UA and De Vlaamse Waterweg: OMES: Monitoring fysical-chemical water quality in the Zeeschelde, available at: http://www.vliz.be/en/imis?module=dataset&dasid=1069 (last access: 28 September 2020), 2016.
ECOBE – UA: The Flemish Waterway: OMES monitoring data Zeeschelde since 1995, ECOBE – UA [data set], available at: http://vliz.be/ (last access: 2 April 2020), 2019.
ECOBE – UAntwerpen: AZ monitoring water quality of the Scheldt, available at: http://www.vliz.be/en/imis?module=dataset&dasid=1468 (last access: 28 September 2020), 2007.
Edmunds, W. and Shand, P.: Natural groundwater quality, Blackwwell Publishing Ltd, ISBN 978-14051-5675-2, 2009.
Elser, J. J., Bracken, M. E. S., Cleland, E. E., Gruner, D. S., Harpole, W. S., Hillebrand, H., Ngai, J. T., Seabloom, E. W., Shurin, J. B., and Smith, J. E.: Global analysis of nitrogen and phosphorus limitation of primary producers in freshwater, marine and terrestrial ecosystems, Ecol. Lett., 10, 1135–1142, https://doi.org/10.1111/j.1461-0248.2007.01113.x, 2007.
European Commission: Directive 2000/60/EC of the European Parliament and of the Council of 23 October 2000 establishing a framework for Community action in the field of water policy, available at: http://data.europa.eu/eli/dir/2000/60/oj (last access: 28 September 2021), 2000.
Flemish Government: VLAREM II, Vlarem II, EMIS Navig, available at: https://navigator.emis.vito.be/mijn-navigator?woId = 263 (last access: 23 December 2020), 1995.
Friedrichs, C. T. and Perry, J. E.: Tidal Salt Marsh Morphodynamics: A Synthesis, J. Coastal Res., 27, 7–37, 2001.
Froelich, P. N.: Kinetic control of dissolved phosphate in natural rivers and estuaries: A primer on the phosphate buffer mechanism1, Limnol. Oceanogr., 33, 649–668, https://doi.org/10.4319/lo.1988.33.4part2.0649, 1988.
Hiemstra, T., Antelo, J., Rahnemaie, R., and van Riemsdijk, W. H.: Nanoparticles in natural systems I: The effective reactive surface area of the natural oxide fraction in field samples, Geochim. Cosmochim. Acta, 74, 41–58, https://doi.org/10.1016/j.gca.2009.10.018, 2010.
Holtan, H., Kamp-Nielsen, L., and Stuanes, A. O.: Phosphorus in soil, water and sediment: an overview, Hydrobiologia, 170, 19–34, https://doi.org/10.1007/BF00024896, 1988.
House, W. A. and Denison, F. H.: Phosphorus dynamics in a lowland river, Water Res., 32, 1819–1830, https://doi.org/10.1016/S0043-1354(97)00407-7, 1998.
Institute voor Hygiëne en Epidemiologie (IHE): Scheldt water quality data, available at: http://www.vliz.be/en/imis?module=dataset&dasid=1438 (last access: 28 September 2020), 2007.
Jarvie, H. P., Neal, C., and Withers, P. J. A.: Sewage-effluent phosphorus: A greater risk to river eutrophication than agricultural phosphorus?, Sci. Total Environ., 360, 246–253, https://doi.org/10.1016/j.scitotenv.2005.08.038, 2006.
Laane, R. W. P. M.: Background concentrations of natural compounds in rivers, sea water, atmosphere and mussels, The Hague, available at: http://publicaties.minienm.nl/documenten/ background-concentrations-of-natural-compounds-in-rivers-sea-wat (last access: 19 October 2020), 1992.
Lexmond, T. M., Riemsdijk, W. H. van, and Haan, F. A. M. de: Onderzoek naar fosfaat en koper in de bodem in het bijzonder in gebieden met intensieve veehouderij, L. H., available at: https://research.wur.nl/en/publications/onderzoek-naar- fosfaat-en-koper-in-de-bodem-in-het-bijzonder-in-g (last access: 15 September 2021), 1982.
Lookman, R., Vandeweert, N., Merckx, R., and Vlassak, K.: Geostatistical assessment of the regional distribution of phosphate sorption capacity parameters (FeOX and AlOX) in northern Belgium, Geoderma, 66, 285–296, https://doi.org/10.1016/0016-7061(94)00084-N, 1995.
Mainstone, C. P. and Parr, W.: Phosphorus in rivers – Ecology and management, Sci. Total Environ., 282–283, 25–47, https://doi.org/10.1016/S0048-9697(01)00937-8, 2002.
Matschullat, J., Ottenstein, R., and Reimann, C.: Geochemical background – Can we calculate it?, Environ. Geol., 39, 990–1000, https://doi.org/10.1007/s002549900084, 2000.
Meire, P., Ysebaert, T., Van Damme, S., Van Den Bergh, E., Maris, T., and Struyf, E.: The Scheldt estuary: A description of a changing ecosystem, Hydrobiologia, 540, 1–11, https://doi.org/10.1007/s10750-005-0896-8, 2005.
Migon, C. and Sandroni, V.: Phosphorus in rainwater: Partitioning inputs and impact on the surface coastal ocean, Limnol. Oceanogr., 44, 1160–1165, https://doi.org/10.4319/lo.1999.44.4.1160, 1999.
Moriasi, D. N., Arnold, J. G., Van Liew, M. W., Bingner, R. L., Harmel, R. D., and Veith, T. L.: Model Evaluation Guidelines for Systematic Quantification of Accuracy in Watershed Simulations, T. ASABE, 50, 885−-900, https://doi.org/10.13031/2013.23153, 1983.
Nash, J. E. and Sutcliffe, J. V.: River flow forecasting through conceptual models part I – A discussion of principles, J. Hydrol., 10, 282–290, https://doi.org/10.1016/0022-1694(70)90255-6, 1970.
Nürnberg, G. K.: Quantifying anoxia in lakes, Limnol. Oceanogr., 40, 1100–1111, https://doi.org/10.4319/LO.1995.40.6.1100, 1995.
Pethick, J. S.: Long-term accretion rates on tidal salt marshes, J. Sediment. Petrol., 51, 571–577, https://doi.org/10.1306/212F7CDE-2B24-11D7-8648000102C1865D, 1981.
Poppelmonde, D.: Organic carbon dynamics in tidal marshes of the Scheldt estuary A combined field and modelling approach, Master Thesis research, KU Leuven, VUB, 2017.
R Core Team: R: A language and environment for statistical computing, available at: https://www.r-project.org/ (last access: 8 November 2021), 2020.
Reimann, C. and Garrett, R. G.: Geochemical background – Concept and reality, Sci. Total Environ., 350, 12–27, https://doi.org/10.1016/j.scitotenv.2005.01.047, 2005.
Reynolds, C. S.: Phosphorus recycling in lakes: Evidence from large limnetic enclosures for the importance of shallow sediments, Freshwater Biol., 35, 623–645, https://doi.org/10.1111/j.1365-2427.1996.tb01773.x, 2000.
Rönspieß, L., Dellwig, O., Lange, X., Nausch, G., and Schulz-Bull, D.: Spatial and seasonal phosphorus dynamics in a eutrophic estuary of the southern Baltic Sea, Estuar. Coast. Shelf S., 233, 106532, https://doi.org/10.1016/J.ECSS.2019.106532, 2020.
RStudio Team: RStudio: Integrated Development for R, available at: http://www.rstudio.com/ (last access: 8 November 2021), 2015.
Salminen, R., Batista, M. J., Bidovec, M. D., Demetriades, A., De Vivo, B., De Vos, W., Duris, M., Gilucis, A., Gregorauskiene, V., Halamic, J., Heitzmann, P., Lima, A., Jordan, G., Klaver, G., Klein, P., Lis, J., Locutura, J., Marsina, K., Mazreku, A., O'Connor, P. J., Olsson, S. Å., Ottesen, R.-T., Petersell, V., Plant, J. A., Reeder, S., Salpeteur, I., Sandström, H., Siewers, U., Steenfelt, A., and Tarvainen, T.: Part 1 – Background information, methodology and maps, in: Geochemical Atlas of Europe, Espoo, Finland: Geological Survey of Finland, ISBN 951-690-913-2, 2005.
ScheldeMonitor Team and Vlaams-Nederlandse Schelde Comissie (VNSC), research and monitoring: Data downloaded from ScheldeMonitor: a data portal with information, data and products on the Scheldt Estuary, Data downloaded from ScheldeMonitor a data portal with information, data Prod. Scheldt Estuary, available at: https://rshiny.scheldemonitor.org/waterniveauschelde/ (last access: 12 April 2021), 2020.
Schönfelder, I. and Steinberg, C. E. W.: How did the nutrient concentrations change in northeastern German lowland rivers during the last four millennia? – A paleolimnological study of floodplain sediments, Mathematisch-Naturwissenschaftliche Fakultät I, https://doi.org/10.18452/9393, 2004.
Schoumans, O. F. and Chardon, W. J.: Phosphate saturation degree and accumulation of phosphate in various soil types in The Netherlands, Geoderma, 237, 325–335, https://doi.org/10.1016/j.geoderma.2014.08.015, 2015.
Schoumans, O. F. and Groenendijk, P.: Modeling Soil Phosphorus Levels and Phosphorus Leaching from Agricultural Land in the Netherlands, J. Environ. Qual., 29, 111–116, https://doi.org/10.2134/jeq2000.00472425002900010014x, 2000.
Schulz, M. and Herzog, C.: The influence of sorption processes on the phosphorus mass balance in a eutrophic German lowland river, Water Air Soil Pollut., 155, 291–301, https://doi.org/10.1023/B:WATE.0000026535.27164.56, 2004.
Schwertmann, U.: Differenzierung der Eisenoxide des Bodens durch Extraktion mit Ammoniumoxalat-Lösung, Zeitschrift für Pflanzenernährung, Düngung, Bodenkd., 105, 194–202, https://doi.org/10.1002/jpln.3591050303, 1964.
Simpson, Z. P., McDowell, R. W., Condron, L. M., McDaniel, M. D., Jarvie, H. P., and Abell, J. M.: Sediment phosphorus buffering in streams at baseflow: A meta-analysis, J. Environ. Qual., 50, 287–311, https://doi.org/10.1002/JEQ2.20202, 2021.
Smolders, E., Baetens, E., Verbeeck, M., Nawara, S., Diels, J., Verdievel, M., Peeters, B., De Cooman, W., and Baken, S.: Internal Loading and Redox Cycling of Sediment Iron Explain Reactive Phosphorus Concentrations in Lowland Rivers, Environ. Sci. Technol., 51, 2584–2592, https://doi.org/10.1021/acs.est.6b04337, 2017.
Struyf, E., Temmerman, S., and Meire, P.: Dynamics of biogenic Si in freshwater tidal marshes: Si regeneration and retention in marsh sediments (Scheldt estuary), Biogeochemistry, 82, 41–53, https://doi.org/10.1007/s10533-006-9051-5, 2007.
Svendsen, L. M. and Kronvang, B.: Retention of nitrogen and phosphorus in a Danish lowland river system: implications for the export from the watershed, in: Developments in Hydrobiology, edited by: Martens, K., Nutr. Dyn. Retent. Land/Water Ecotones Lowl. Temp. Lakes Rivers, Springer Publishing, 123–135, https://doi.org/10.1007/978-94-011-1602-2_15, 1993.
Temmerman, S., Govers, G., Meire, P., and Wartel, S.: Modelling long-term tidal marsh growth under changing tidal conditions and suspended sediment concentrations, Scheldt estuary, Belgium, Mar. Geol., 193, 151–169, https://doi.org/10.1016/S0025-3227(02)00642-4, 2003a.
Temmerman, S., Govers, G., Wartel, S., and Meire, P.: Spatial and temporal factors controlling short-term sedimentation in a salt and freshwater tidal marsh, scheldt estuary, Belgium, SW Netherlands, Earth Surf. Proc. Land, 28, 739–755, https://doi.org/10.1002/esp.495, 2003b.
Temmerman, S., Govers, G., Wartel, S., and Meire, P.: Modelling estuarine variations in tidal marsh sedimentation: Response to changing sea level and suspended sediment concentrations, Mar. Geol., 212, 1–19, https://doi.org/10.1016/j.margeo.2004.10.021, 2004a.
Temmerman, S., Govers, G., Meire, P., and Wartel, S.: Simulating the long-term development of levee-basin topography on tidal marshes, Geomorphology, 63, 39–55, https://doi.org/10.1016/j.geomorph.2004.03.004, 2004b.
van Dael, T., De Cooman, T., Verbeeck, M., and Smolders, E.: Sediment respiration contributes to phosphate release in lowland surface waters, Water Res., 168, 115168, https://doi.org/10.1016/j.watres.2019.115168, 2020.
Van de Broek, M., Temmerman, S., Merckx, R., and Govers, G.: Controls on soil organic carbon stocks in tidal marshes along an estuarine salinity gradient, Biogeosciences, 13, 6611–6624, https://doi.org/10.5194/bg-13-6611-2016, 2016.
Van de Broek, M., Vandendriessche, C., Poppelmonde, D., Merckx, R., Temmerman, S., and Govers, G.: Long-term organic carbon sequestration in tidal marsh sediments is dominated by old-aged allochthonous inputs in a macrotidal estuary, Global Change Biol., 24, 2497–2512, https://doi.org/10.1111/gcb.14089, 2018.
Van de Broek, M., Baert, L., Temmerman, S., and Govers, G.: Soil organic carbon stocks in a tidal marsh landscape are dominated by human marsh embankment and subsequent marsh progradation, Eur. J. Soil Sci., 70, 338–349, https://doi.org/10.1111/ejss.12739, 2019.
Van Der Molen, D. T., Portielje, R., Boers, P. C. M., and Lijklema, L.: Changes in sediment phosphorus as a result of eutrophication and oligotrophication in Lake Veluwe, The Netherlands, Water Res., 32, 3281–3288, https://doi.org/10.1016/S0043-1354(98)00117-1, 1998.
van der Zee, S. E. A. T. M.: Transport of reactive contaminants in heterogeneous soil systems, Doctoral thesis, Agricultural University, Wageningen, the Netherlands, available at: http://edepot.wur.nl/212029 (last access: 14 July 2020), 1988.
van der Zee, S. E. A. T. M., van Riemsdijk, W. H., and de Haan, F. A. M.: Het Protokol Fosfaatverzadigde Gronden, Research Report Wageningen university & research, sub-department of Soil Qualtiy, available at: https://edepot.wur.nl/394250 (last access: 30 September 2020), 1990.
van der Zee, C., Roevros, N., and Chou, L.: Phosphorus speciation, transformation and retention in the Scheldt estuary (Belgium/The Netherlands) from the freshwater tidal limits to the North Sea, Mar. Chem., 106, 76–91, https://doi.org/10.1016/j.marchem.2007.01.003, 2007.
Van Huet, H. J. W. J.: Phosphorus eutrophication research in the lake district of south western Friesland, The Netherlands. Preliminary results of abiotic studies, in: Developments in Hydrobiology, edited by: Martens, K., Trophic Relationships Inl. Waters, Springer Publishing, 75–85, https://doi.org/10.1007/978-94-009-0467-5_10, 1990.
Van Meel, L.: hydrobiology of the Sea-Scheldt near Liefkenshoek, available at: http://www.vliz.be/en/imis?module=dataset&dasid=1412 (last access: 28 September 2020), 1958.
Van Puijenbroek, P. J. T. M., Cleij, P., and Visser, H.: Aggregated indices for trends in eutrophication of different types of fresh water in the Netherlands, Ecol. Indic., 36, 456–462, https://doi.org/10.1016/J.ECOLIND.2013.08.022, 2014.
Van Putte, N., Temmerman, S., Verreydt, G., Seuntjens, P., Maris, T., Heyndrickx, M., Boone, M., Joris, I., and Meire, P.: Groundwater dynamics in a restored tidal marsh are limited by historical soil compaction, Estuar. Coast. Shelf Sci., 244, 106101, https://doi.org/10.1016/j.ecss.2019.02.006, 2020.
van Raaphorst, W. and Kloosterhuis, H. T.: Phosphate sorption in superficial intertidal sediments, Mar. Chem., 48, 1–16, https://doi.org/10.1016/0304-4203(94)90058-2, 1994.
van Raaphorst, W., de Jonge, V. N., Dijkhuizen, D., and Frederiks, B.: Natural background concentrations of phosphorus and nitrogen in the Dutch Wadden Sea, Rapp. voor Kust en Zee, Netherlands Institute for Sea Research (NIOZ), 53 pp., available at: https://edepot.wur.nl/174247 (last access: 24 December 2020), 2000.
Vanhaute, E.: En arbeid in België in de `lange negentiende eeuw', Bijdr. Meded. Geschied. Ned., 118, 153–178, 2003.
VMM: Milieurapport Vlaanderen – Systeembalans 2017, available at: http://www.milieurapport.be/Upload/main/0_topicrapporten/361312_Systeembalans2017_nieuw.pdf (last access: 24 December 2020), 2017.
VMM: Nutriënten – Vlaamse Milieumaatschappij, available at: https://www.vmm.be/water/kwaliteit-waterlopen/chemie/nutrienten#section-0 (last access: 10 February 2020), 2018.
VMM: Fysisch-chemische kwaliteit oppervlaktewater 2018 – Vlaamse Milieumaatschappij, available at: https://www.vmm.be/publicaties/fysisch-chemische-kwaliteit-oppervlaktewater-2018 (last access: 27 February 2020), 2019.
Wang, Y., Shen, Z., Niu, J., and Liu, R.: Adsorption of phosphorus on sediments from the Three-Gorges Reservoir (China) and the relation with sediment compositions, J. Hazard. Mater., 162, 92–98, https://doi.org/10.1016/j.jhazmat.2008.05.013, 2009.
Warrinnier, R., Goossens, T., Braun, S., Gustafsson, J. P., and Smolders, E.: Modelling heterogeneous phosphate sorption kinetics on iron oxyhydroxides and soil with a continuous distribution approach, Eur. J. Soil Sci., 69, 475–487, https://doi.org/10.1111/ejss.12549, 2018.
Warrinnier, R., Goossens, T., Amery, F., Vanden Nest, T., Verbeeck, M., and Smolders, E.: Investigation on the control of phosphate leaching by sorption and colloidal transport: Column studies and multi-surface complexation modelling, Appl. Geochem., 100, 371–379, https://doi.org/10.1016/j.apgeochem.2018.12.012, 2019.
Watson, S. J., Cade-Menun, B. J., Needoba, J. A., and Peterson, T. D.: Phosphorus Forms in Sediments of a River-Dominated Estuary, Front. Mar. Sci., 5, 302, https://doi.org/10.3389/FMARS.2018.00302, 2018.
Zak, D., Kleeberg, A., and Hupfer, M.: Sulphate-mediated phosphorus mobilisation in riverine sediments at increasing sulphate concentration, River Spree, NE Germany, Biogeochemistry, 80, 109–119, https://doi.org/10.1007/s10533-006-0003-x, 2006.
Zhou, A., Tang, H., and Wang, D.: Phosphorus adsorption on natural sediments: Modeling and effects of pH and sediment composition, Water Res., 39, 1245–1254, https://doi.org/10.1016/j.watres.2005.01.026, 2005.