the Creative Commons Attribution 4.0 License.
the Creative Commons Attribution 4.0 License.
 | 05 Jun 2023
Partitioning of carbon export in the euphotic zone of the oligotrophic South China Sea
Yifan Ma
Kuanbo Zhou
Weifang Chen
Junhui Chen
Jin-Yu Terence Yang
We conducted samplings of total and particulate 234Th, along with particulate organic carbon (POC), in the summer of 2017 to examine nutrient-dependent structures of export productivity within the euphotic zone (Ez) of the oligotrophic basin of the South China Sea (SCS). Nitrate concentrations throughout the study area were below detection limits in the nutrient-depleted layer (NDL) above the nutricline, while they sharply increased with depth in the nutrient-replete layer (NRL) across the nutricline until the base of the Ez. Based on our vertical profilings of 234Th–238U disequilibria, this study estimated for the first time POC export fluxes both out of the NDL and at the horizon of the Ez base. The total 234Th deficit relative to 238U was determined in the NDL at all study sites. By contrast, 234Th was mostly in equilibrium with 238U in the NRL, except at the northernmost station, SEATS (SouthEast Asian Time-series Study; 18∘ N, 116∘ E), where the 234Th deficit was also observed in the NRL. By combining 1D steady-state 234Th fluxes and ratios, we derived vertical patterns of POC export fluxes. The POC export fluxes at station SEATS were 1.6 ± 0.6 mmol C m−2 d−1 at the NDL base, accounting for approximately half of that at the base of the Ez. For the rest of the sampling sites, the POC export fluxes at the NDL base (averaged at 2.3 ± 1.1 mmol C m−2 d−1) were comparable with those at the base of the Ez (1.9 ± 0.5 mmol C m−2 d−1), suggesting rapid export of POC out of the NDL. This finding fundamentally changes our traditional view that the NDL, being depleted in nutrients, would not be a net exporter of POC. Furthermore, our results revealed a significant positive correlation between POC export fluxes at the NDL base and the potential of subsurface nutrient supplies, indicated by nutricline depth and nutrient concentrations obtained from both in situ measurements and numerical modeling. POC export fluxes (averaged at 3.4 ± 1.2 mmol C m−2 d−1) at the NDL base at stations with shallow nutriclines and high levels of subsurface nutrients approximately doubled those (averaged at 1.6 ± 0.5 mmol C m−2 d−1) at other stations. We subsequently used a two-endmember mixing model based on the mass and 15N isotopic balances to evaluate the relative contribution of different sources of new nitrogen that support the observed particle export at stations SEATS and SS1, located respectively in the northern and southern basin of the SCS with different hydrological features. We showed that more than 50 % of the particle flux out of the NDL was supported by nitrate sources likely supplied from depth and associated with episodic intrusions other than atmospheric deposition and nitrogen fixation. However, the exact mechanisms and pathways for subsurface nutrients to support the export production from the NDL merit additional careful and dedicated studies.
- Article
(4808 KB) - Full-text XML
-
Supplement
(1625 KB) - BibTeX
- EndNote


The marine biological carbon pump (BCP) plays a central role in sequestrating atmospheric CO2, thereby mitigating human-induced climate change. Despite great efforts that have been devoted to studying the BCP, there remain critical knowledge gaps in terms of its structure, function and efficiency (Siegel et al., 2021). Recently, the EXPORTS (EXport Processes in the Ocean from RemoTe Sensing) program has implemented comprehensive experiments which examine export flux pathways, plankton community composition, food web processes and biogeochemical properties of the ecosystem to achieve an improved understanding of export fluxes and the BCP (Siegel et al., 2016, 2021).
Among other factors, depth-dependent particle export at different horizons within the euphotic zone (Ez), and how these exports are sustained by different nutrient sources, remains largely unknown. Most previous studies have treated the Ez as a single box and chose a fixed depth (e.g., 100 or 150 m) as the export horizon (Benitez-Nelson et al., 2001; Cai et al., 2015; Zhou et al., 2020a). A recent study has suggested that using a fixed depth instead of the in situ Ez depth as the export horizon would lead to the magnitude of global POC export flux being underestimated by a factor of 2 (Buesseler et al., 2020a). In the oligotrophic oceans, permanent stratification limits nutrient supply from depth; the Ez thus could be divided into the following two-layer structure based on nutrient concentrations: (1) the nutrient-depleted layer (NDL) between the ocean surface and the top of the nutricline and (2) the nutrient-replete layer (NRL) between the nutricline and the base of the Ez (Du et al., 2017). Conventional concepts suggest that regenerated nutrients predominantly support biological productivity in the NDL, where export production is limited due to the absence of new nutrient supplies (Eppley and Peterson, 1979; Goldman, 1984). Meanwhile, Coale and Bruland (1987) noticed the layered structure of 234Th–238U disequilibria in the Ez, composed of an upper oligotrophic layer characterized by low new-production values and low net scavenging and a subsurface eutrophic layer with higher new-production values, and they suggested that new production rather than total primary production determined the scavenging of the reactive elements such as 234Th. Cai et al. (2008) also observed variable particle-scavenging rates in the upper euphotic zone (above 50 m) but consistently lower rates in the lower euphotic zone (between 50 and 100 m) in the oligotrophic South China Sea (SCS). With increasing high-resolution samplings, such partitionings of 234Th-based particle scavenging were frequently observable in oligotrophic ecosystems (Buesseler et al., 2009; Umhau et al., 2019; Zhou et al., 2020a; Stukel et al., 2022).
Along with the increasing attention on BCP in the oligotrophic ecosystems, some observations have, however, indicated that particles sourced from surface waters with extremely low nutrient concentrations may substantially contribute to the downward fluxes at depth. Scharek et al. (1999) observed that the diatom–diazotroph assemblages (Hemiaulus hauckii contained Richelia-type endosymbionts with heterocysts) in the surface nutrient-deficient mixed layer dominated downward particle fluxes collected by a sediment trap at 150 m depth at the oligotrophic station ALOHA (A Long-term Oligotrophic Habitat Assessment; 22∘45′ N, 158∘ W). Liu et al. (2007) observed consistent δ13CPOC values between sediment trap samples collected at 100 m and suspended particles in the upper 20 m in the SCS basin, likely suggesting that the trapped particles predominantly originated from the surface (i.e., 20 m). The ecosystem in nutrient-depleted surface waters may therefore play an important role in carbon export. Different pathways to introduce new nutrients have been suggested to support the carbon export from the NDL; for example, high rates of nitrogen fixation in the NDL could support 26 %–47 % of the particle fluxes at station ALOHA (Böttjer et al., 2017). In addition, episodic eddy events that uplift the nutricline and deliver deep stocks of nutrients to the NDL might also contribute to POC export from the upper ocean (Johnson et al., 2010). Nevertheless, it remains unclear how the different nutrient supplies to the surface waters affect the downward POC export flux at the NDL and Ez horizons.
The semi-enclosed SCS, the largest marginal sea in the North Pacific Ocean, is characterized by an oligotrophic basin due to intensive stratification (Du et al., 2017). Several previous studies quantified the 234Th-based POC export flux and explored the mechanisms controlling export in the SCS. Seasonally, POC export fluxes are elevated in winter, driven by the deepening of the mixed layer and nutrient supply from depth (Zhou et al., 2020a). Spatially, Cai et al. (2015) found that POC export fluxes decreased with distance offshore in the northern SCS due to reduced POC stocks. Mesoscale processes can also promote POC export by pumping nutrient-replete waters from depth into the Ez (Zhou et al., 2013, 2020b). Regardless, POC export fluxes at different export horizons, and the sources of new nutrients that support export, remain understudied in the oligotrophic SCS.
In this study, we conducted samplings of 234Th at a reasonably high depth resolution in the Ez during the summer of 2017 to examine the structure of export productivity partitioning in the SCS basin. We calculated POC export fluxes based on 234Th from both the NDL and Ez. Based on trap-derived masses and 15N isotopic balances, we estimated the relative contributions of different nutrient sources to export fluxes within the two-layer nutrient-based structure in the SCS at two stations with different hydrological features. Moreover, we related POC export fluxes from the two layers to their different biogeochemical forcings (especially the depth of the nutricline and the subsurface nutrient concentrations) to examine the controlling factors that potentially regulate POC export flux in the oligotrophic SCS.
2.1 Sample collection
Ship-based sampling was conducted from 5 to 27 June 2017 on the R/V Tan Kah Kee in the SCS basin (Fig. 1 and Table 1) under the umbrella of the CHOICE-C II project (Carbon Cycle in the South China Sea: budget, controls and global implications). We visited two mega stations (SEATS and SS1) and nine regular stations during the cruise. The in situ observation at station SEATS was conducted before a typhoon (Merbok) which potentially affected the biogeochemistry of the region, and the remaining stations were visited after the typhoon (listed in Table 1). To examine the spatial variability of 234Th, we sampled four closely clustered stations (H01, H06, H08 and H11) around station SS1. Seawater samples were collected using 12 or 10 L Niskin bottles attached to a Sea-Bird 911 conductivity–temperature–depth (CTD) profiler.
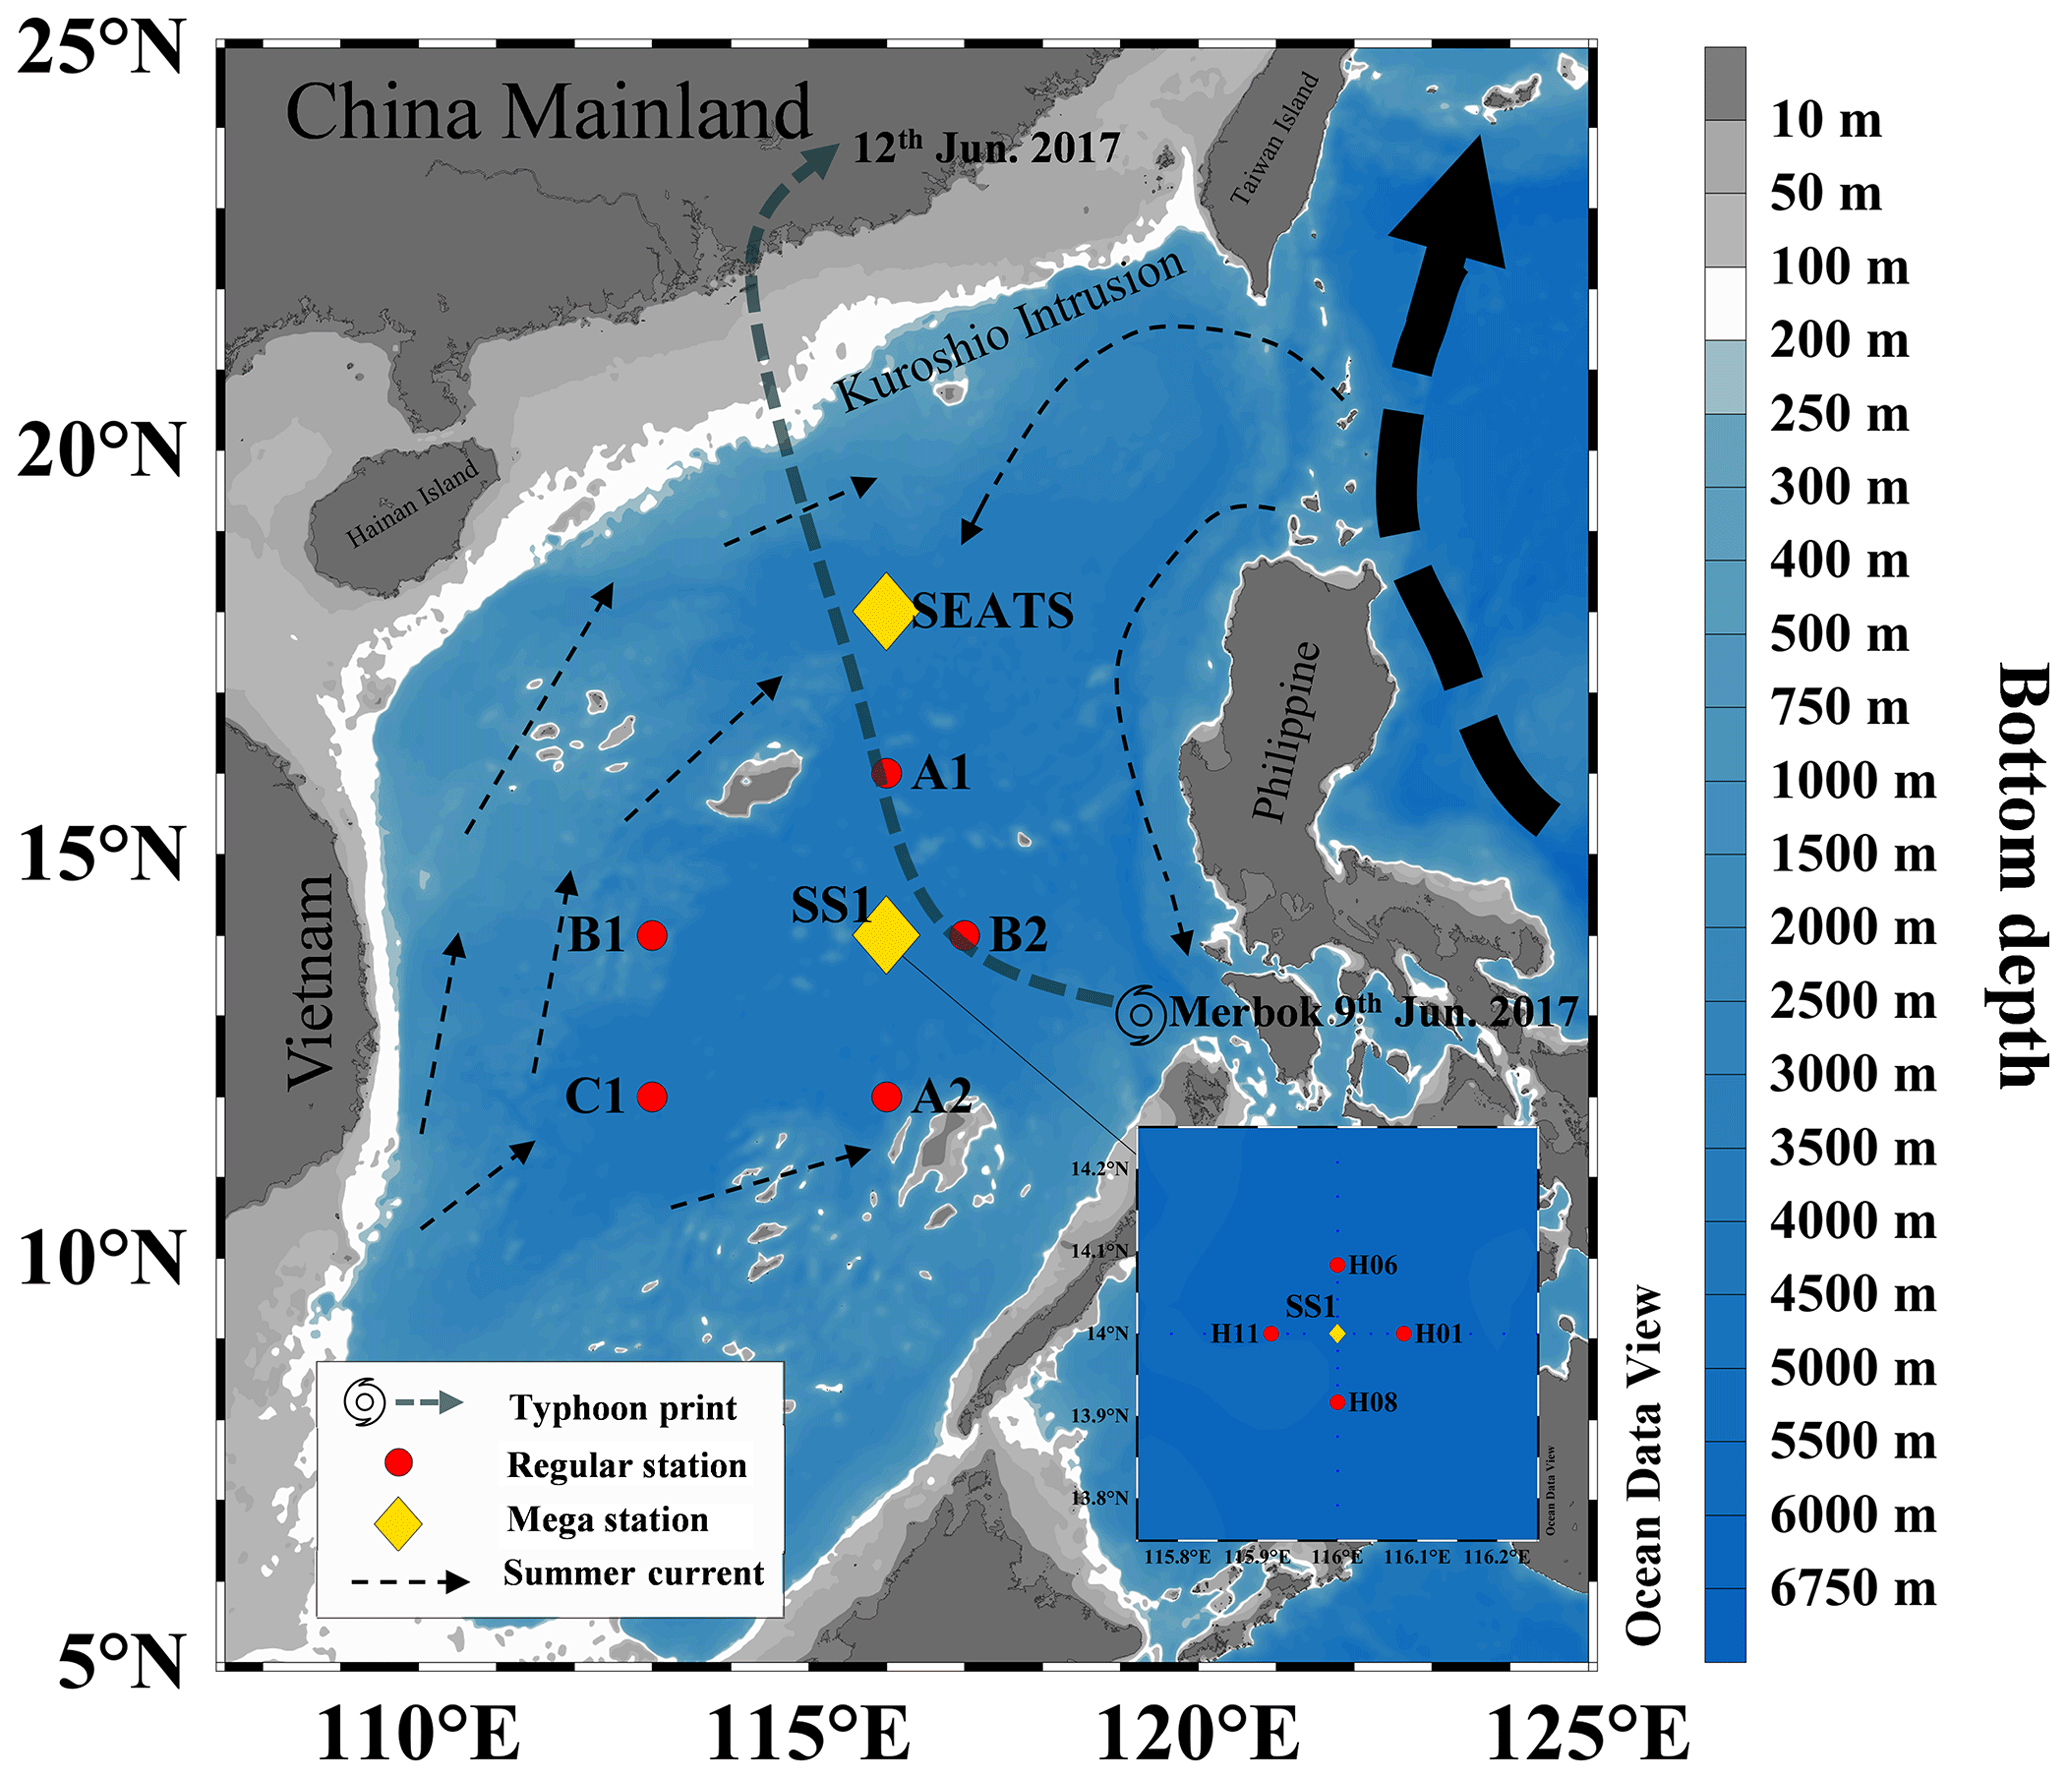
Figure 1Map of the South China Sea (SCS) with sampling stations during June 2017. Yellow diamonds denote mega stations (SEATS and SS1) where high-resolution sampling was conducted at a 10 m interval in the euphotic zone; red circles denote regular stations where samples were collected at typical sampling depths of 5, 25, 50, 75 and 100 m. The general circulation pattern (adapted from Liu et al., 2016) is also shown. The dominant summer currents are denoted by dashed black arrows. The dashed dark-blue line denotes the path of the typhoon Merbok (generated at the southeastern part of the SCS on 9 June 2017).
Table 1Sampling logs and site information along with the accessed parameters and their utilizations.
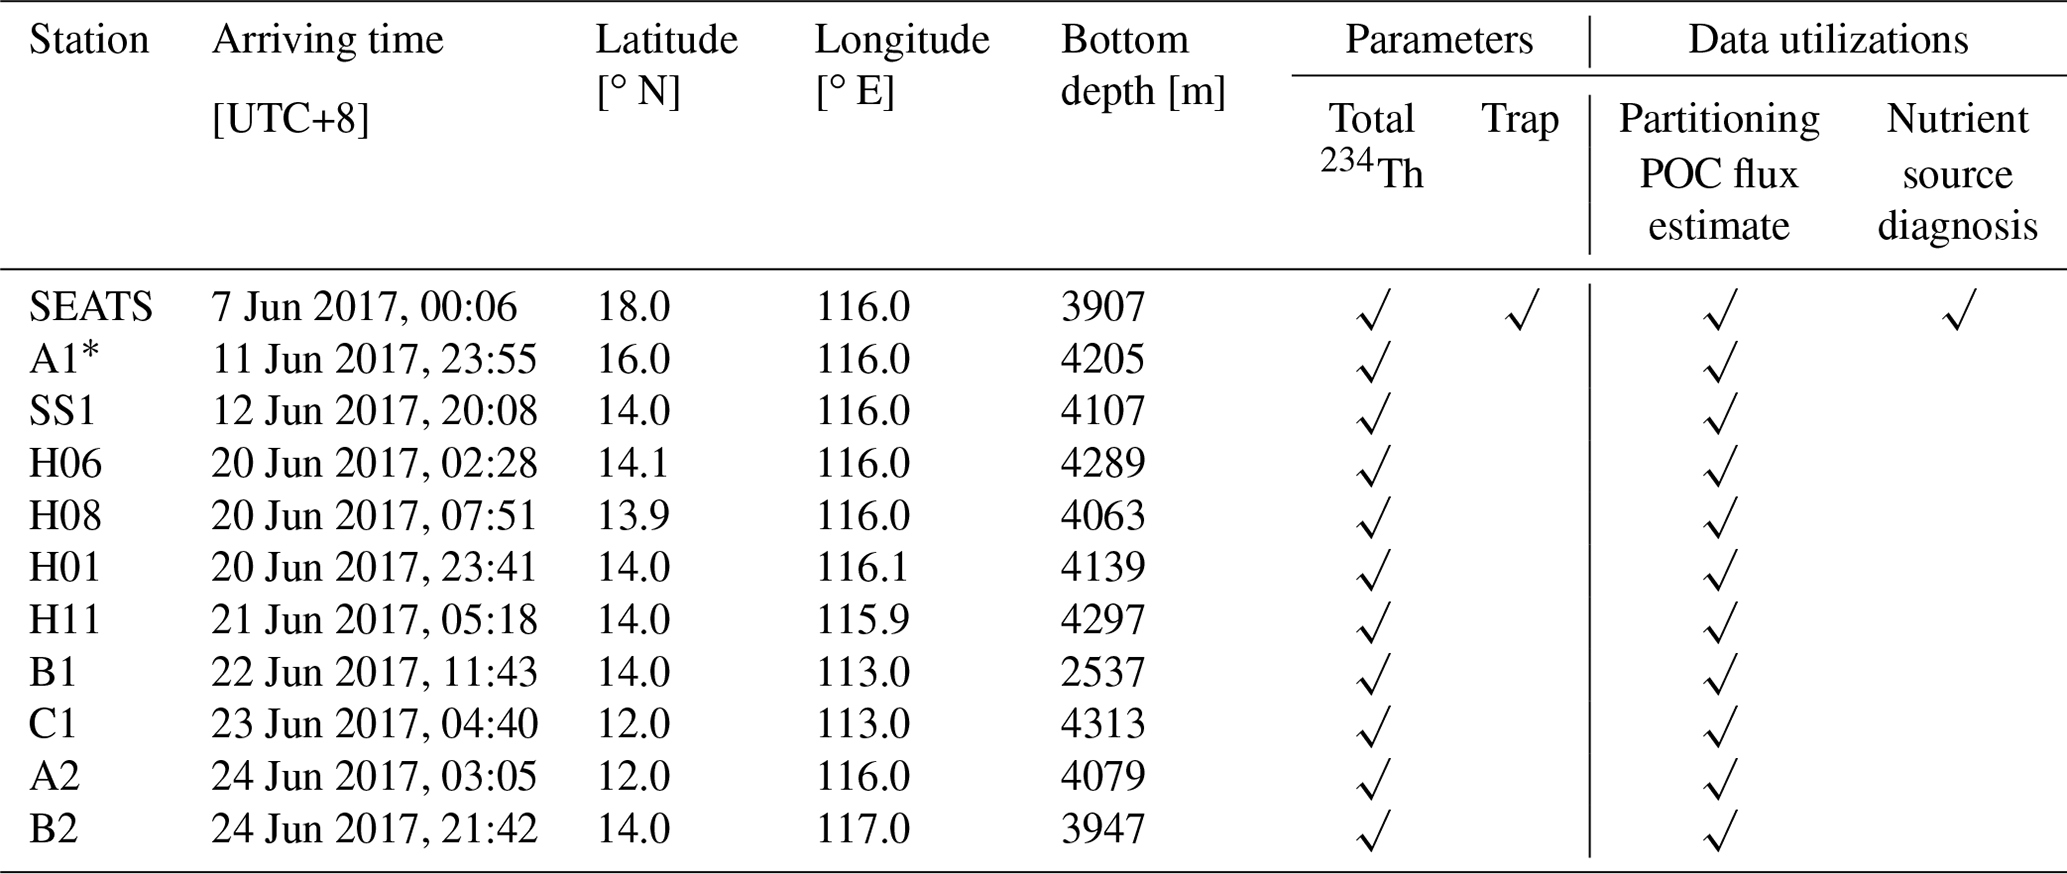
* Sampling station might be influenced by the typhoon event passing through the South China Sea. Station A1 was visited right after the typhoon Merbok, which was generated on 9 June 2017 at 13.1∘ N, 119.8∘ E in the southern South China Sea. Merbok landed on 12 June at 27.5∘ N, 117.3∘ E.
At the mega stations, high-vertical-resolution water samples were taken at a depth interval of 10 m within the Ez. For regular stations, lower-resolution (5, 25, 50, 75 and 100 m) samples were collected. Seawater volumes of 4 and 8 L were collected for total 234Th and particulate analysis, respectively. Samples were collected using acid-cleaned 4 L fluorinated bottles and filtered onto quartz microfiber (QMA) filters (25 mm diameter, 1.0 µm pore size). An amount of 500 mL of seawater was also collected for nutrient analysis from the Niskin bottles. Ancillary parameters, including potential temperature, salinity and fluorescence, were accessed using a Sea-Bird CTD sensor. We calibrated the sensor-derived fluorescence with the Chl a concentrations from discrete samples using the equation Chl a (mg m−3) = 0.855 × fluorescence (R2=0.87, n=139; Fig. S1 in the Supplement).
In addition, we deployed an array of floating sediment traps for 72 h at 50, 100 and 200 m at both mega stations, SEATS and SS1, to collect sinking particles during the survey. Retrieval of the trap at station SS1 was precluded by unfavorable sea conditions. Consequently, we utilized sediment trap data acquired during a 53 h deployment in July 2019. Our choice of alternative data collection is unlikely to engender bias in our analysis, as evidenced by the limited interannual variability in 15N signals of sinking particles obtained from sediment traps (see details in Sect. 3.5). At each depth of stations SEATS and SS1, 12 cylindrical acrylic tubes (with a height of 50 cm and diameter of 10 cm) were assembled for different biogeochemical measurements. Before deployment, the tubes were filled with prefiltered surface seawater, and NaCl was added to supersaturation. After recovery, the tubes were stored at temperatures under 4 ∘C until the particles settled to the bottom. After removing the overlying supernatant, the particles were prefiltered through Nitex filters (120 µm pore size) to remove the visible zooplankton and were then collected on QMA filters (1.0 µm pore size) for elemental and isotopic analyses.
2.2 234Th analysis
The small-volume (4 L) MnO2 co-precipitation method was used for the total 234Th analysis (Benitez-Nelson et al., 2001; Cai et al., 2006). The efficiency of thorium precipitation was monitored by 230Th. In detail, the seawater samples were acidified after collection and spiked with 200 µL of 230Th (17.38 dpm mL−1). After an 8 h period to allow equilibration between samples and tracers, the pH of seawater was raised to 8.05–8.20 using NH3 • H2O before 0.375 mL KMnO4 (3.0 g L−1) and 0.20 mL MnCl2 (8.0 g L−1) were added. The MnO2 precipitates were collected for a total 234Th analysis. The particles filtered for particulate 234Th from the seawater samples on a QMA filter (25 mm, 1.0 µm) were dried in the oven overnight under 45 ∘C. The filters were then packed with Teflon rings and disks (diameter of 23.5 cm, produced by RISØ National Laboratory, Denmark) covered by aluminum foil (density: 6.45 mg m−2) and Mylar film. A gas-flow-proportional low-level RISØ beta counter (model GM-25-5) was used for 234Th counting. The first count was carried out immediately after the samples were set up, and the second count was carried out after >6 months for the background measurement. All 234Th samples were counted for 1000 min each time. The 230Th recoveries were determined by inductively coupled plasma mass spectrometry (ICP-MS) (Agilent 7700x). The average of all the recoveries was 88 ± 12 % (mean ± 1σ, n=97, range 73 %–98 %). All 234Th data were recovery- and decay-corrected to the sampling time. The uncertainties of 234Th data were propagated from the counting error, uncertainty from recovery and detection efficiency. The 238U activity was estimated by the following equation assuming conservative behavior with respect to salinity (Owens et al., 2011):
2.3 POC, PN and δ15NPN analyses
Upon 234Th counting, the particulate samples were carefully removed from the disks and placed in glass dishes. Subsequently, the filters were dried at 50 ∘C for 24 h after adding 0.4 mL of HCl (1.0 µmol L−1) to remove inorganic carbon. POC and particulate nitrogen (PN) concentrations were determined by an elemental analyzer-isotope ratio mass spectrometer (EA-IRMS) system (EA: vario PYRO cube; IRMS: Isoprime 100). At station SS1, we conducted 10 replicate POC samplings at 5, 100 and 200 m water depth to investigate the precision of bottle-collected POC. Our results show that the standard deviations of our analyses were better than 13 %, which agrees well with the result from the JGOFS cookbook (Knap et al., 1996). The errors were included in the subsequent calculation of POC export fluxes. The particles from the sediment traps were treated the same as the suspended particles. The C and N contents and the isotopes of sinking particles were also analyzed by EA-IRMS.
2.4 The depth of the euphotic zone
The euphotic zone depth (Zeu or the Ez base, in m) is defined optically, based on Wu et al. (2021), as the depth where the usable solar radiation (USR) equals 0.9 % of the surface USR, which is close to the depth where the photosynthetically available radiation (PAR) equals 0.5 % of the PAR value at the sea surface. In situ Zeu during the cruise was obtained from profiling PAR data recorded by the optical sensor (Biospherical QCP2300-HP) on the CTD.
2.5 Nutrient analysis and nutricline depth
Nutrients were analyzed on board using a Four-channel Continuous Flow Technicon AA3 Auto-Analyzer (Bran-Lube GmbH). The detection limits for both N+N (nitrate plus nitrite – termed as dissolved inorganic nitrogen, DIN) and dissolved inorganic phosphorus (DIP) were 0.03 µmol L−1. The top of the nutricline in this study was defined as the depth at which the DIN concentration reached 0.1 µmol L−1 (Dore and Karl, 1996; Winn et al., 1995). The layers above and below to the base of Ez were defined as the as NDL and NRL, respectively.
2.6 234Th scavenging model
The mass balance for 234Th in seawater can be described using Eq. (1) (Buesseler et al., 1992):
where FTh is the 234Th scavenging flux at the export horizon. AU and are the 238U and total 234Th activities, and λ is the 234Th decay constant (0.02876 d−1); V, which is discussed below, is the term for physical effects, including advection and diffusion.
For particle export from the Ez, the deficit of total 234Th relative to 238U is integrated with depth to evaluate 234Th fluxes. Under the assumption of a steady state () and no physical transport (V=0), the 234Th export flux from the Ez () is integrated by Eq. (3) (as shown in Fig. 2):
Similarly, 234Th export flux from the base of the NDL, , is estimated as follows:
However, the assumption of no physical transport needs to be verified before 234Th flux is calculated. In this study, the physical transport is estimated as follows:
where u, v and w are the zonal, meridional and upwelling velocities, respectively; , and are 234Th activity gradients from west to east, south to north and upward. Kx, Ky and Kz are diffusivities from west to east, south to north and upward, respectively, and and are the second derivatives of 234Th activity distributions (Benitez-Nelson et al., 2001; Cai et al., 2008; Buesseler et al., 2020b).
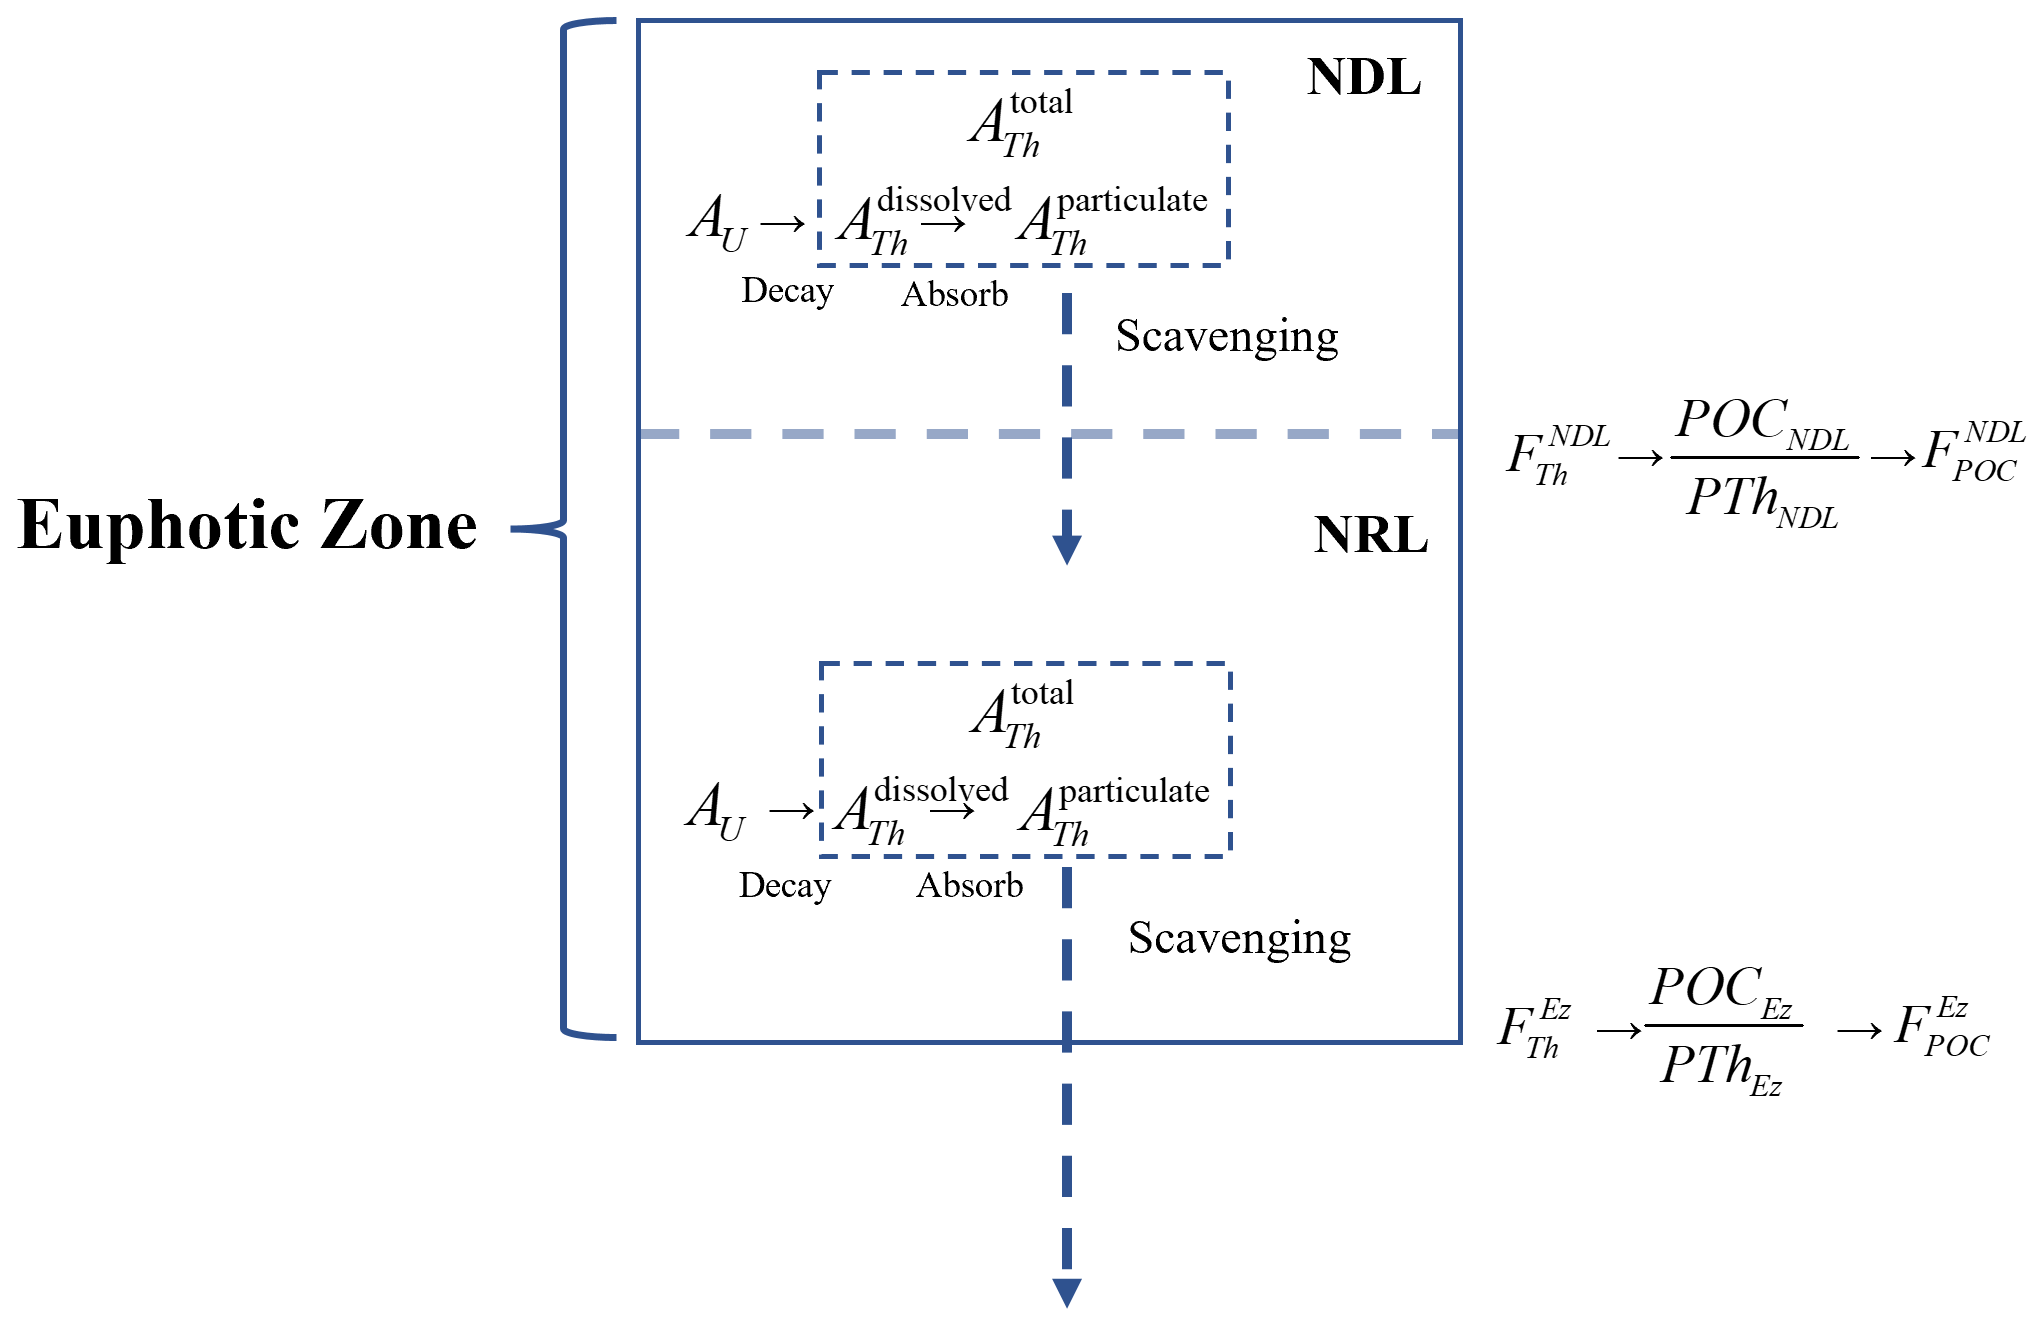
Figure 2Schematic of the 234Th model under the two-layer nutrient structure. The terms are defined in Eqs. (2)–(4) and (7)–(9).
To better constrain the 234Th flux in the SCS basin, we estimated the horizontal and vertical transports of 234Th at the station SS1. The climatological w and Kz from modeling results (Gan et al., 2016) were applied to the equation to evaluate the impacts of vertical advection and diffusion on the 234Th flux. The vertical transport fluxes were −2.0 ± 0.4 and −11.4 ± 0.1 dpm m−2 d−1 at the bases of the NDL and Ez, respectively, which can be considered to be negligible (less than 10 %) compared to the vertical scavenging flux at the station SS1. This was in agreement with Cai et al. (2008), who also showed that the vertical term could be neglected for 234Th flux estimation in the SCS basin.
The apparent diffusivity around station SS1 is estimated as cm2 s−1 (Okubo, 1971) from empirically derived oceanic-diffusion diagrams, and we simplified the horizontal diffusive term in Eq. (5) based on Benitez-Nelson et al. (2000) as follows:
The Δx and Δy are the distance between the stations to evaluate the influences of physical terms (i.e., Δx is the distance between stations H01 and H11; Δy is the distance between stations H06 and H08). Δx and Δy were equal to 18 km in this study. Thus, the 234Th flux derived from horizontal diffusion was considerably low (approximately 0.1 dpm m−2 d−1).
The in situ horizontal current velocities at station SS1 from the acoustic Doppler current profiler (ADCP) exhibited a wide range from 0.01 to 0.3 m s−1 in the upper 200 m. Since these current velocities were measured instantaneously and since their timescales did not match those of 234Th (∼ 20 d), we applied model-derived time-integrated data (3-month average) to the equation instead. The model-derived u and v ranged from 0.007 to 0.2 m s−1 in the upper 100 m. Based on those velocities, the 234Th flux from horizontal transport was about 15 % of the 234Th flux estimated using the steady-state model in the upper 100 m, which is consistent with previous studies in oligotrophic ecosystems (e.g., Cai et al., 2008; Buesseler et al., 2020b). Thus, a 1D model assumption is applicable in this study for the subsequent 234Th flux estimation.
2.7 POC export flux calculation
In this study, the 234Th-derived POC export flux was calculated using the following equations:
where , and are the 234Th flux, particulate ratio and POC flux at the Ez base, respectively;
where , and are the 234Th flux, particulate ratio and POC export flux at the NDL base, respectively.
Sediment-trap-derived POC export fluxes were calculated as follows:
where POC is the concentration of organic carbon on the particles collected by the traps, Δt is the duration of trap deployments, and ATrapTube is the area of the trap tube.
3.1 Environmental settings
The profiles of temperature and salinity reveal distinctive hydrological features between stations in the SCS basin (Fig. 3). The surface mixed-layer depth (MLD, defined as the depth where the potential density σθ increased by 0.03 kg m−3 compared to the value at the sea surface; Cornec et al., 2021) at stations SEATS, A1, A2 and C1 was shallower (20–39 m) than at other stations (MDL > 40 m; Table 2 and Fig. 3). The shallower MLD and isoclines (i.e., thermocline and halocline) might indicate upward displacement of waters at those stations. Du et al. (2021) attributed such vertical shifts in isoclines to mesoscale processes or basin-scale circulation. Indeed, most of these stations (SEATS, A1 and C1) were under the influence of eddies during the sampling periods, as revealed by the sea level anomaly (SLA) map (Fig. S2 in the Supplement); modeling results indicate stations C1 and A2 were impacted by cold water sourced from the southwestern SCS basin and derived from upwelling off the coast of Vietnam (Fig. S3 in the Supplement) (Gan et al., 2016).
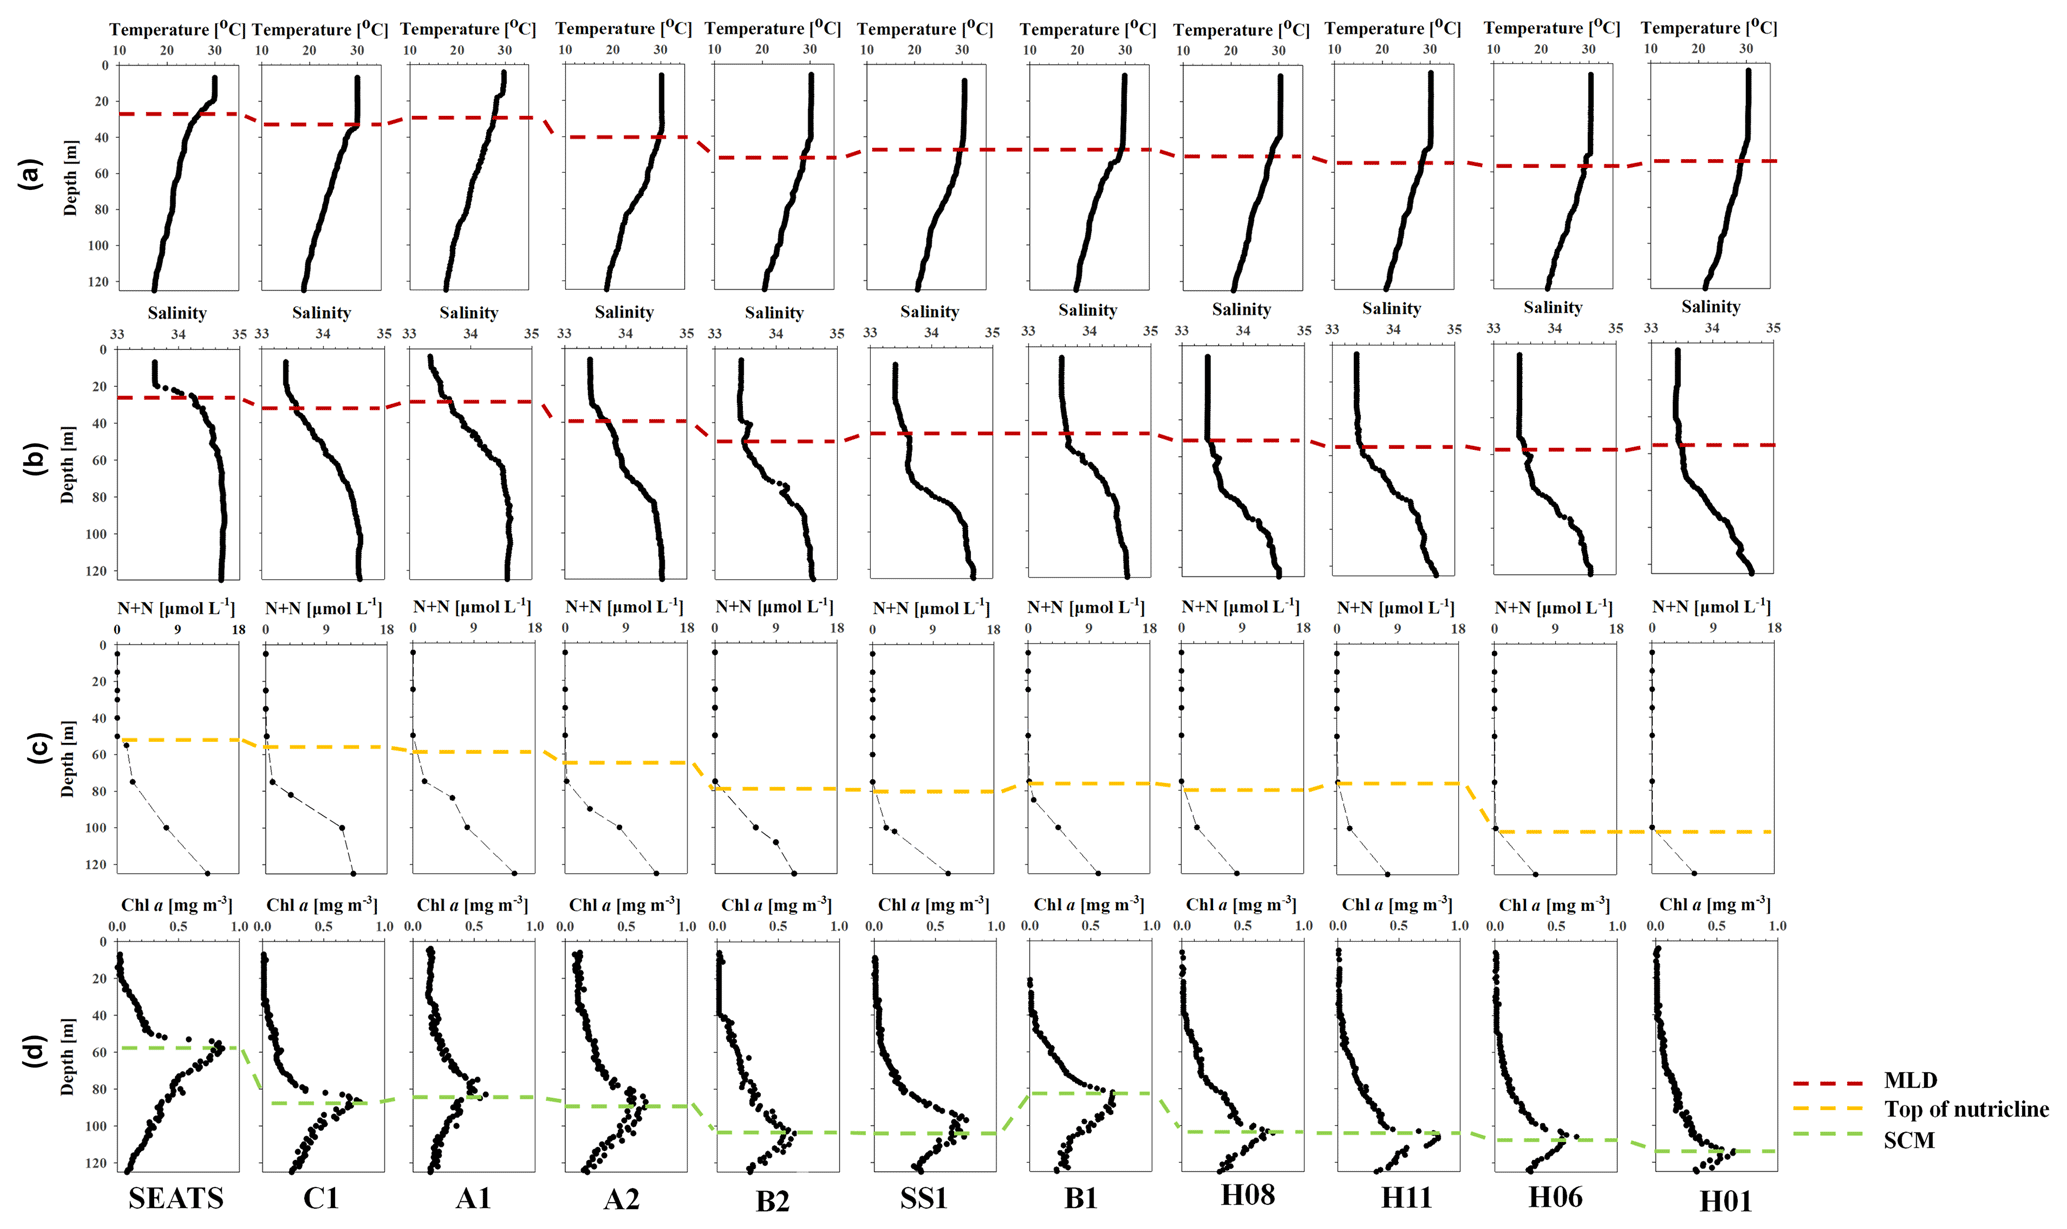
Figure 3Vertical profiles of temperature (a), salinity (b), dissolved inorganic nitrogen (nitrate + nitrite; DIN) (c) and Chl a (d). The MLD (red dash), interpolated depth of DIN = 0.1 µmol L−1 (top of nutricline, yellow dash) and subsurface Chl a maximum (SCM, green dash) are also shown.
Table 2Surface mixed-layer depths (MLDs), export horizon depths, 1D steady-state 234Th fluxes, ratios and POC fluxes at stations in the upper oligotrophic South China Sea basin during June 2017.
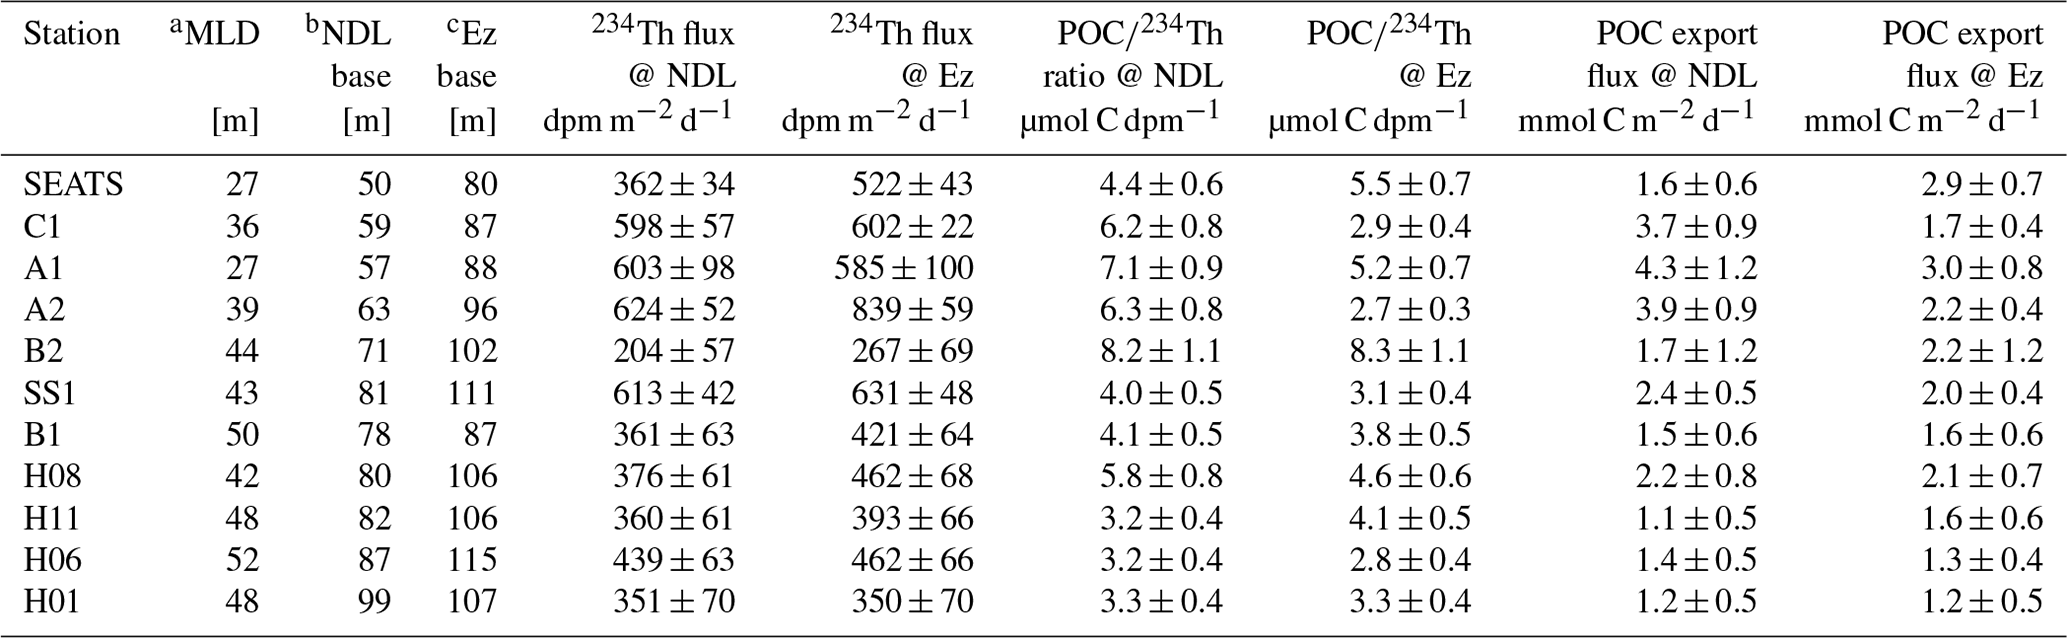
a The MLD is defined as the depth where the potential density σθ increases by 0.03 kg m−3 compared to values at the sea surface (Cornec et al., 2021). b The NDL base, or the top of the nutricline, was interpolated to the depth where DIN = 0.1 µmol L−1 based on the DIN distribution near the SCM. c The Ez base is estimated to be the depth where PAR is 0.5 % of the PAR value at the sea surface.
As shown in Fig. 3c, nutrients were depleted in surface waters until the top of the nutriclines, where concentrations started to rapidly increase. The depth profiles also show a clear relationship between nutriclines and subsurface nutrient concentrations. The four stations (i.e., stations SEATS, C1, A1 and A2) with shallower nutriclines correspond well with higher subsurface nutrient concentrations. For example, DIN concentrations at 125 m in these four sites ranged from 13.1 to 17.0 µmol N L−1, averaged at 14.0 ± 2.1 µmol N L−1; in contrast, DIN concentrations at the same depth in other sites with deeper nutriclines ranged from 6.5 to 12.1 µmol N L−1, averaged at 8.9 ± 2.4 µmol N L−1 (Fig. 3c).
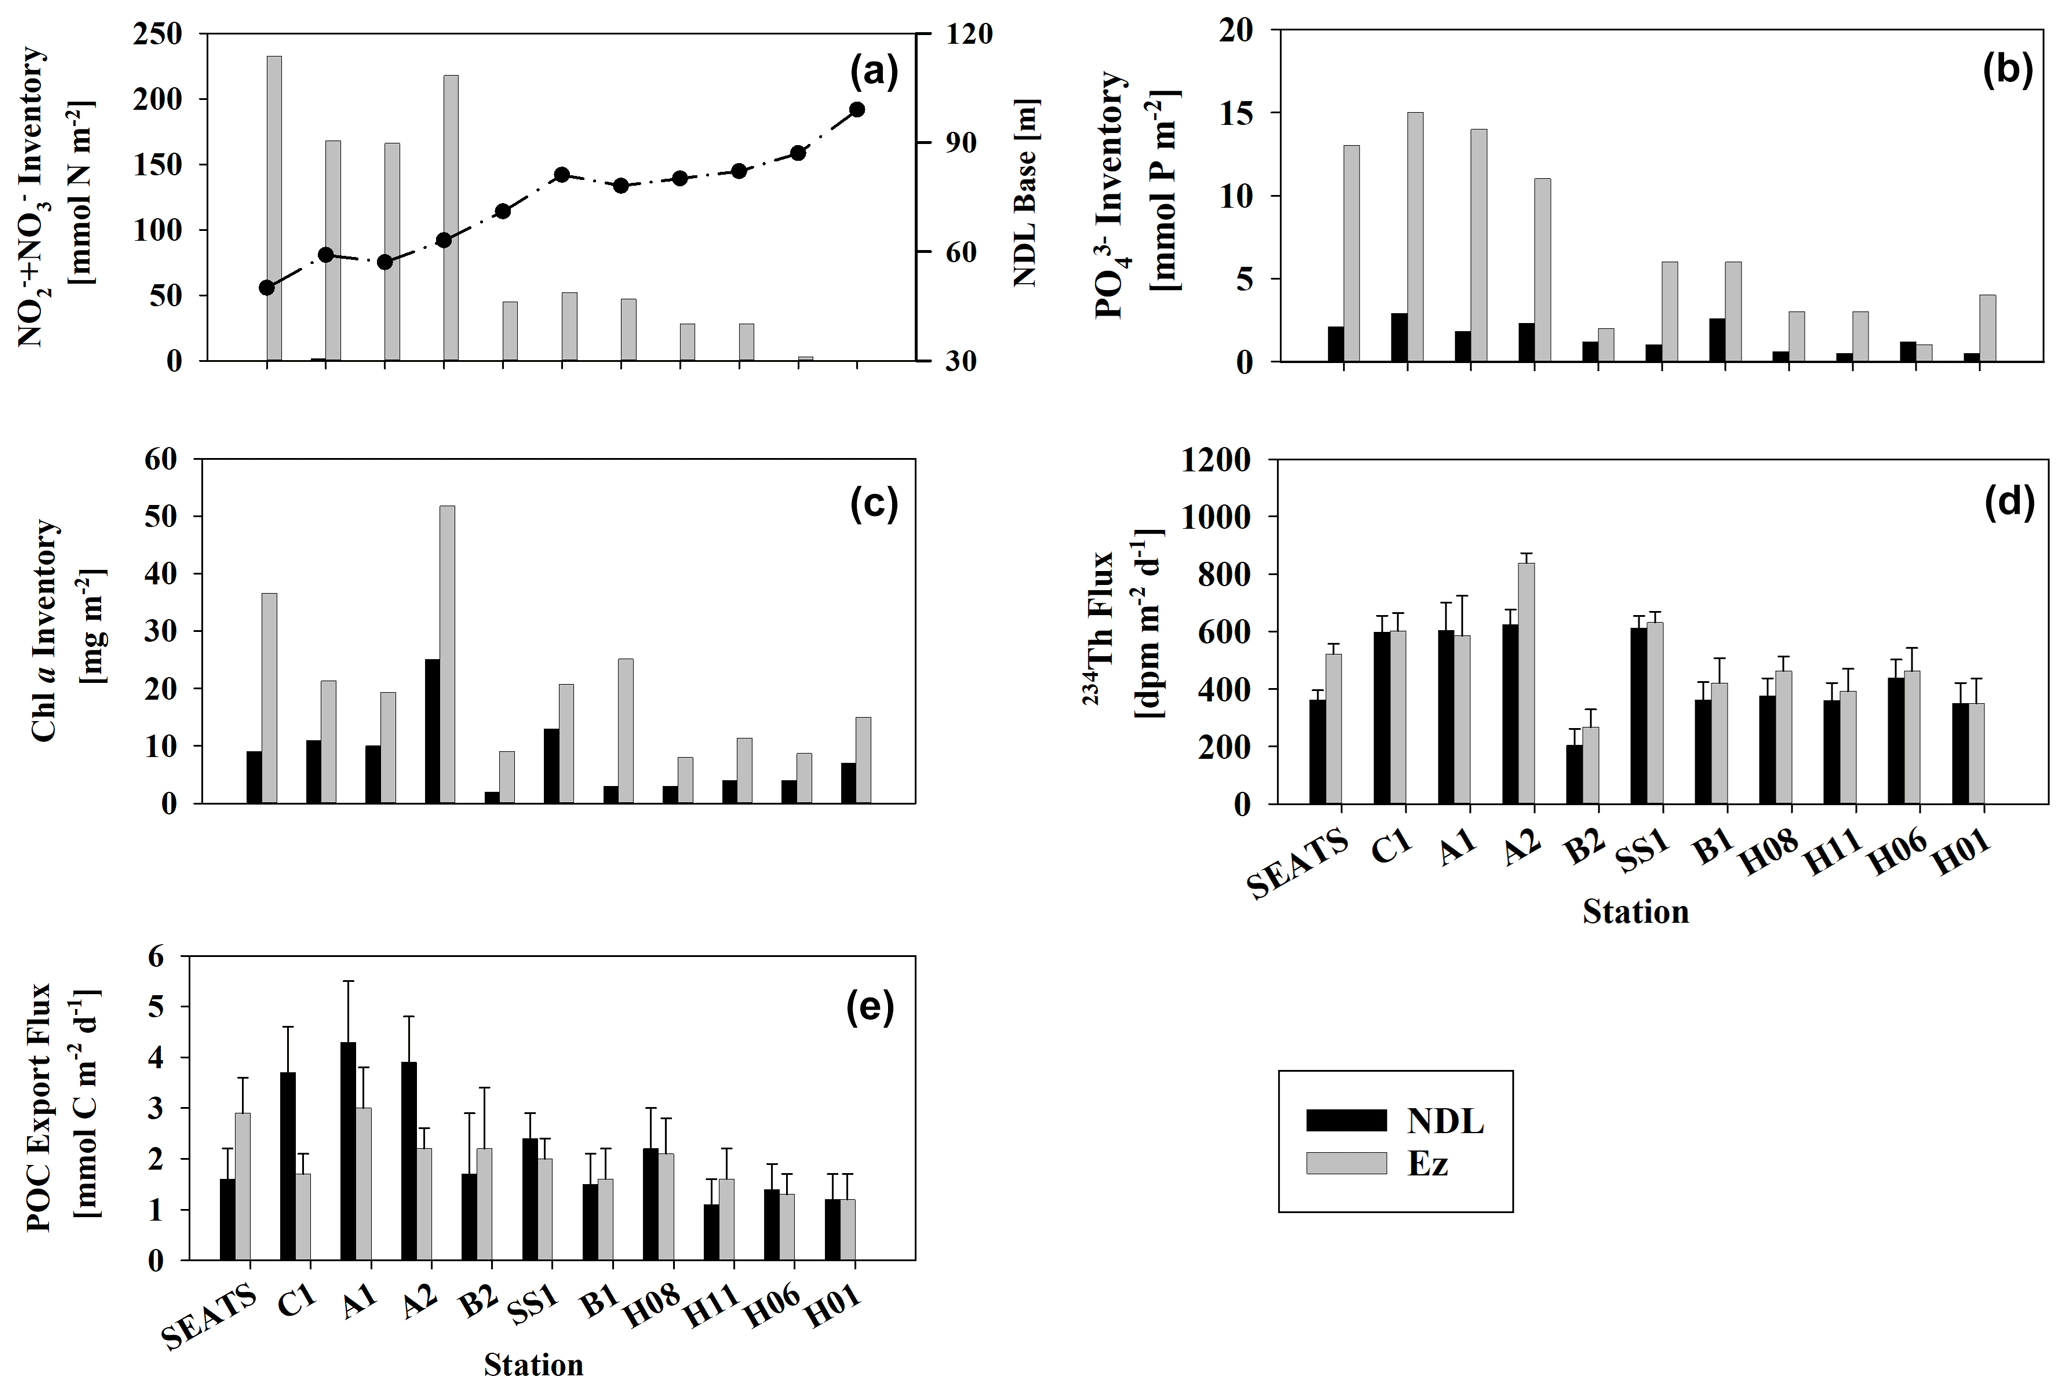
Figure 4Integrated inventories of DIN (a) and DIP (b) in both the NDL (black) and Ez (gray). Also shown are the partitioned Chl a stocks (c), integrated partitioned 234Th fluxes (d) and 234Th-derived POC export fluxes (e). The high and low nutrient inventories correspond to shallow and deep nutriclines (a) (dotted line, NDL base), respectively.
The partitioned nutrient inventories (i.e., nutrient inventories within the NDL and Ez) also showed such a trend (Fig. 4a, b). The average Ez inventory of DIN was 196 ± 30 mmol N m−2 at stations with shallow nutriclines compared to 29 ± 19 mmol N m−2 at other stations, and the average inventory of PO (DIP) in the Ez at stations with shallow nutriclines was 13 ± 1 mmol P m−2 compared to an average of 3 ± 2 mmol P m−2 at other stations. The pattern of nutrient inventories across stations possibly results from vertical water displacement induced by horizontal divergence at the mesoscale and/or basin scale (Du et al., 2021).
Chl a concentrations at the four stations with shallower nutriclines were consistently enhanced in response to elevated nutrient levels, resulting in shallower depths of subsurface Chl a maxima (SCM; Fig. 3d) relative to other stations (55–80 m vs. 85–108 m). Chl a inventories at these stations with high nutrient inventories (23.6–52.2 mg m−2, average 29.6 ± 4.8 mg m−2) were significantly higher (p<0.05) than at others stations (8.0–22.8 mg m−2, average 14.0 ± 4.6 mg m−2; Fig. 4c).
3.2 234Th and POC variability
Variations of total 234Th and Chl a versus depth are shown in Fig. 5. The activities of total 234Th ranged from 1.70 ± 0.05 to 2.73 ± 0.05 dpm L−1, with an average of 2.30 ± 0.31 dpm L−1 (n=97; Fig. 5), and all stations displayed similar patterns. Generally, 234Th was deficient relative to 238U in the upper Ez and was in equilibrium or excess at the base of and/or below the Ez. The 234Th deficit peaked within the NDL and largely diminished in the NRL, implying that a large amount of particle removal occurred in the NDL but that low export or high remineralization occurred in the NRL. The 234Th activity minimum (1.70 ± 0.17 dpm L−1) appeared at a depth of 25 m at station A1 (one of stations characterized by a shallow MLD and nutricline). 234Th activity at the stations surrounding station SS1 showed little spatial variability: the differences in 234Th activity were less than 0.1 dpm L−1 at the same depth.
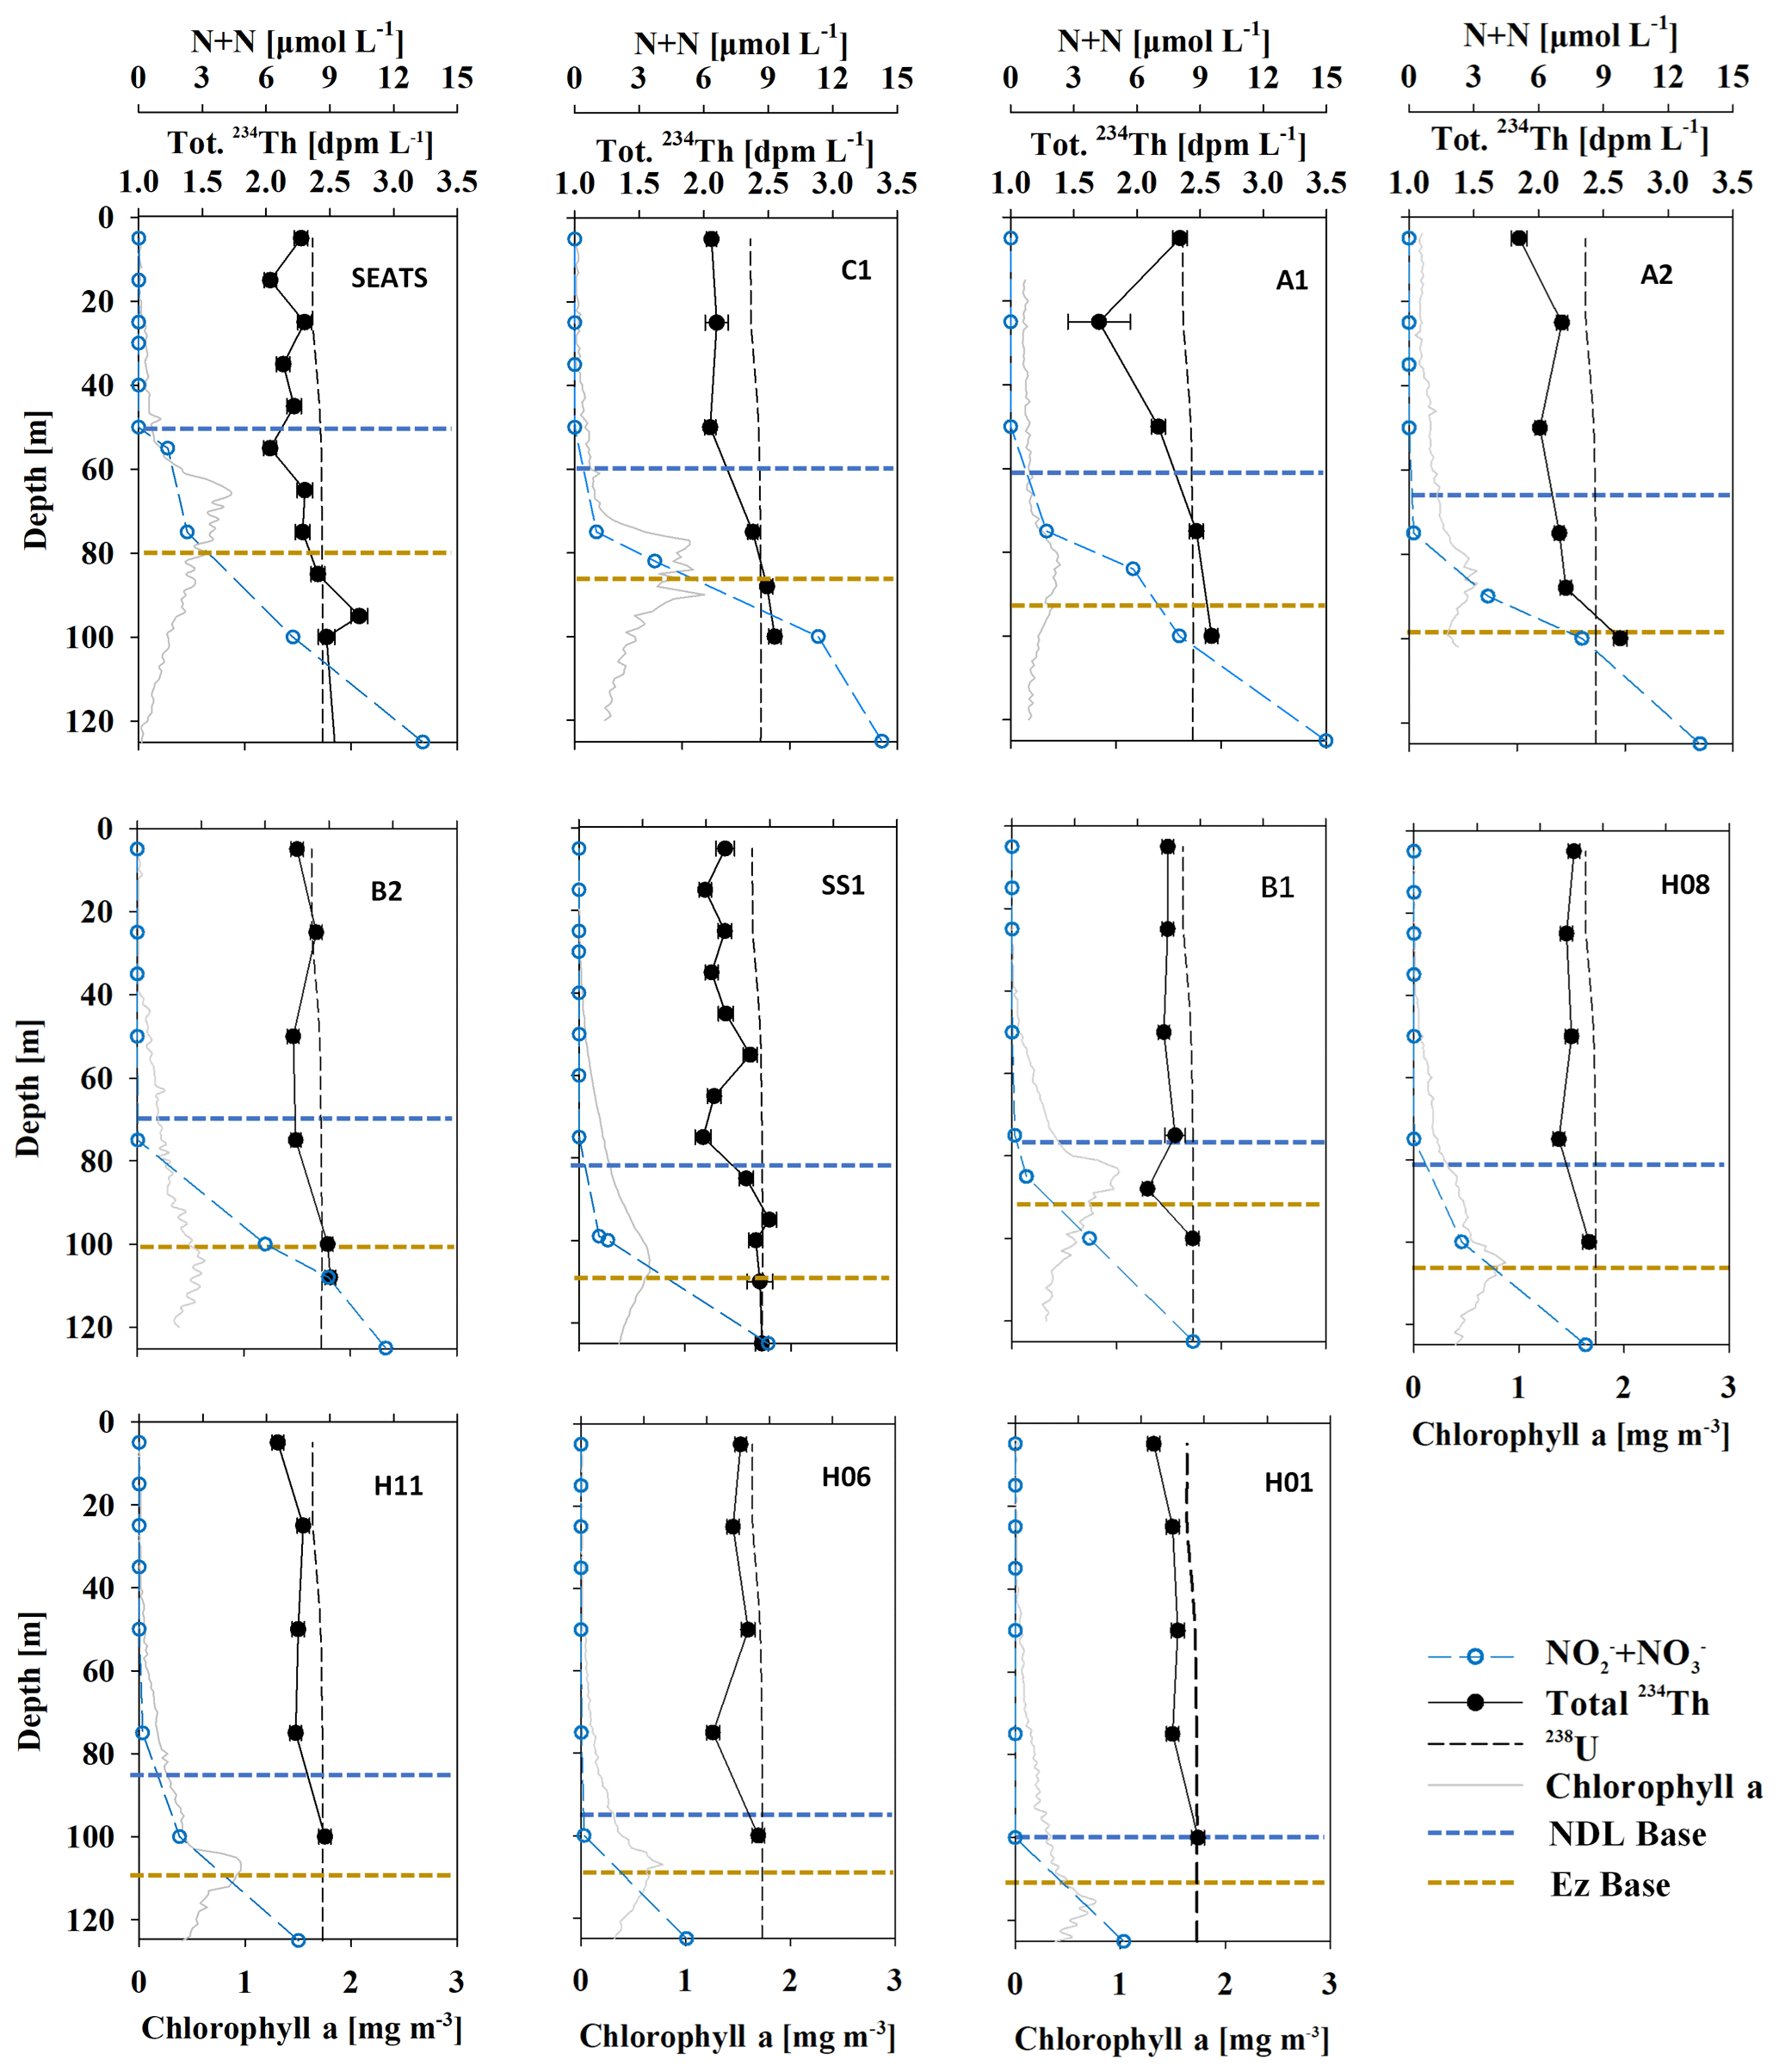
Figure 5Depth profiles of DIN (open blue circle – µmol L−1), total 234Th activity (black dot – dpm L−1), 238U activity (black dash – dpm L−1) and Chl a concentration (gray line – mg m−3) in the South China Sea basin. The defined export horizons of the NDL base (blue dash) and the Ez base (yellow dash) are also shown. The deficit of 234Th relative to 238U was the most pronounced in the province where DIN was too low to be detected.
Particulate 234Th ranged from 0.13 ± 0.01 dpm L−1 to 0.47 ± 0.01 dpm L−1 (with an average of 0.25 ± 0.11 dpm L−1, n=83; Fig. 6). At most stations, the profiles of particulate 234Th shared similar depth patterns with Chl a, with the maximum values appearing in the subsurface water, while at stations H01 and H06, particulate 234Th generally increased with depth in the upper 100 m and showed little station-to-station variability. The maximum of particulate 234Th appearing at both the surface and subsurface at station B2 suggested complicated biogeochemistry of 234Th on particles.
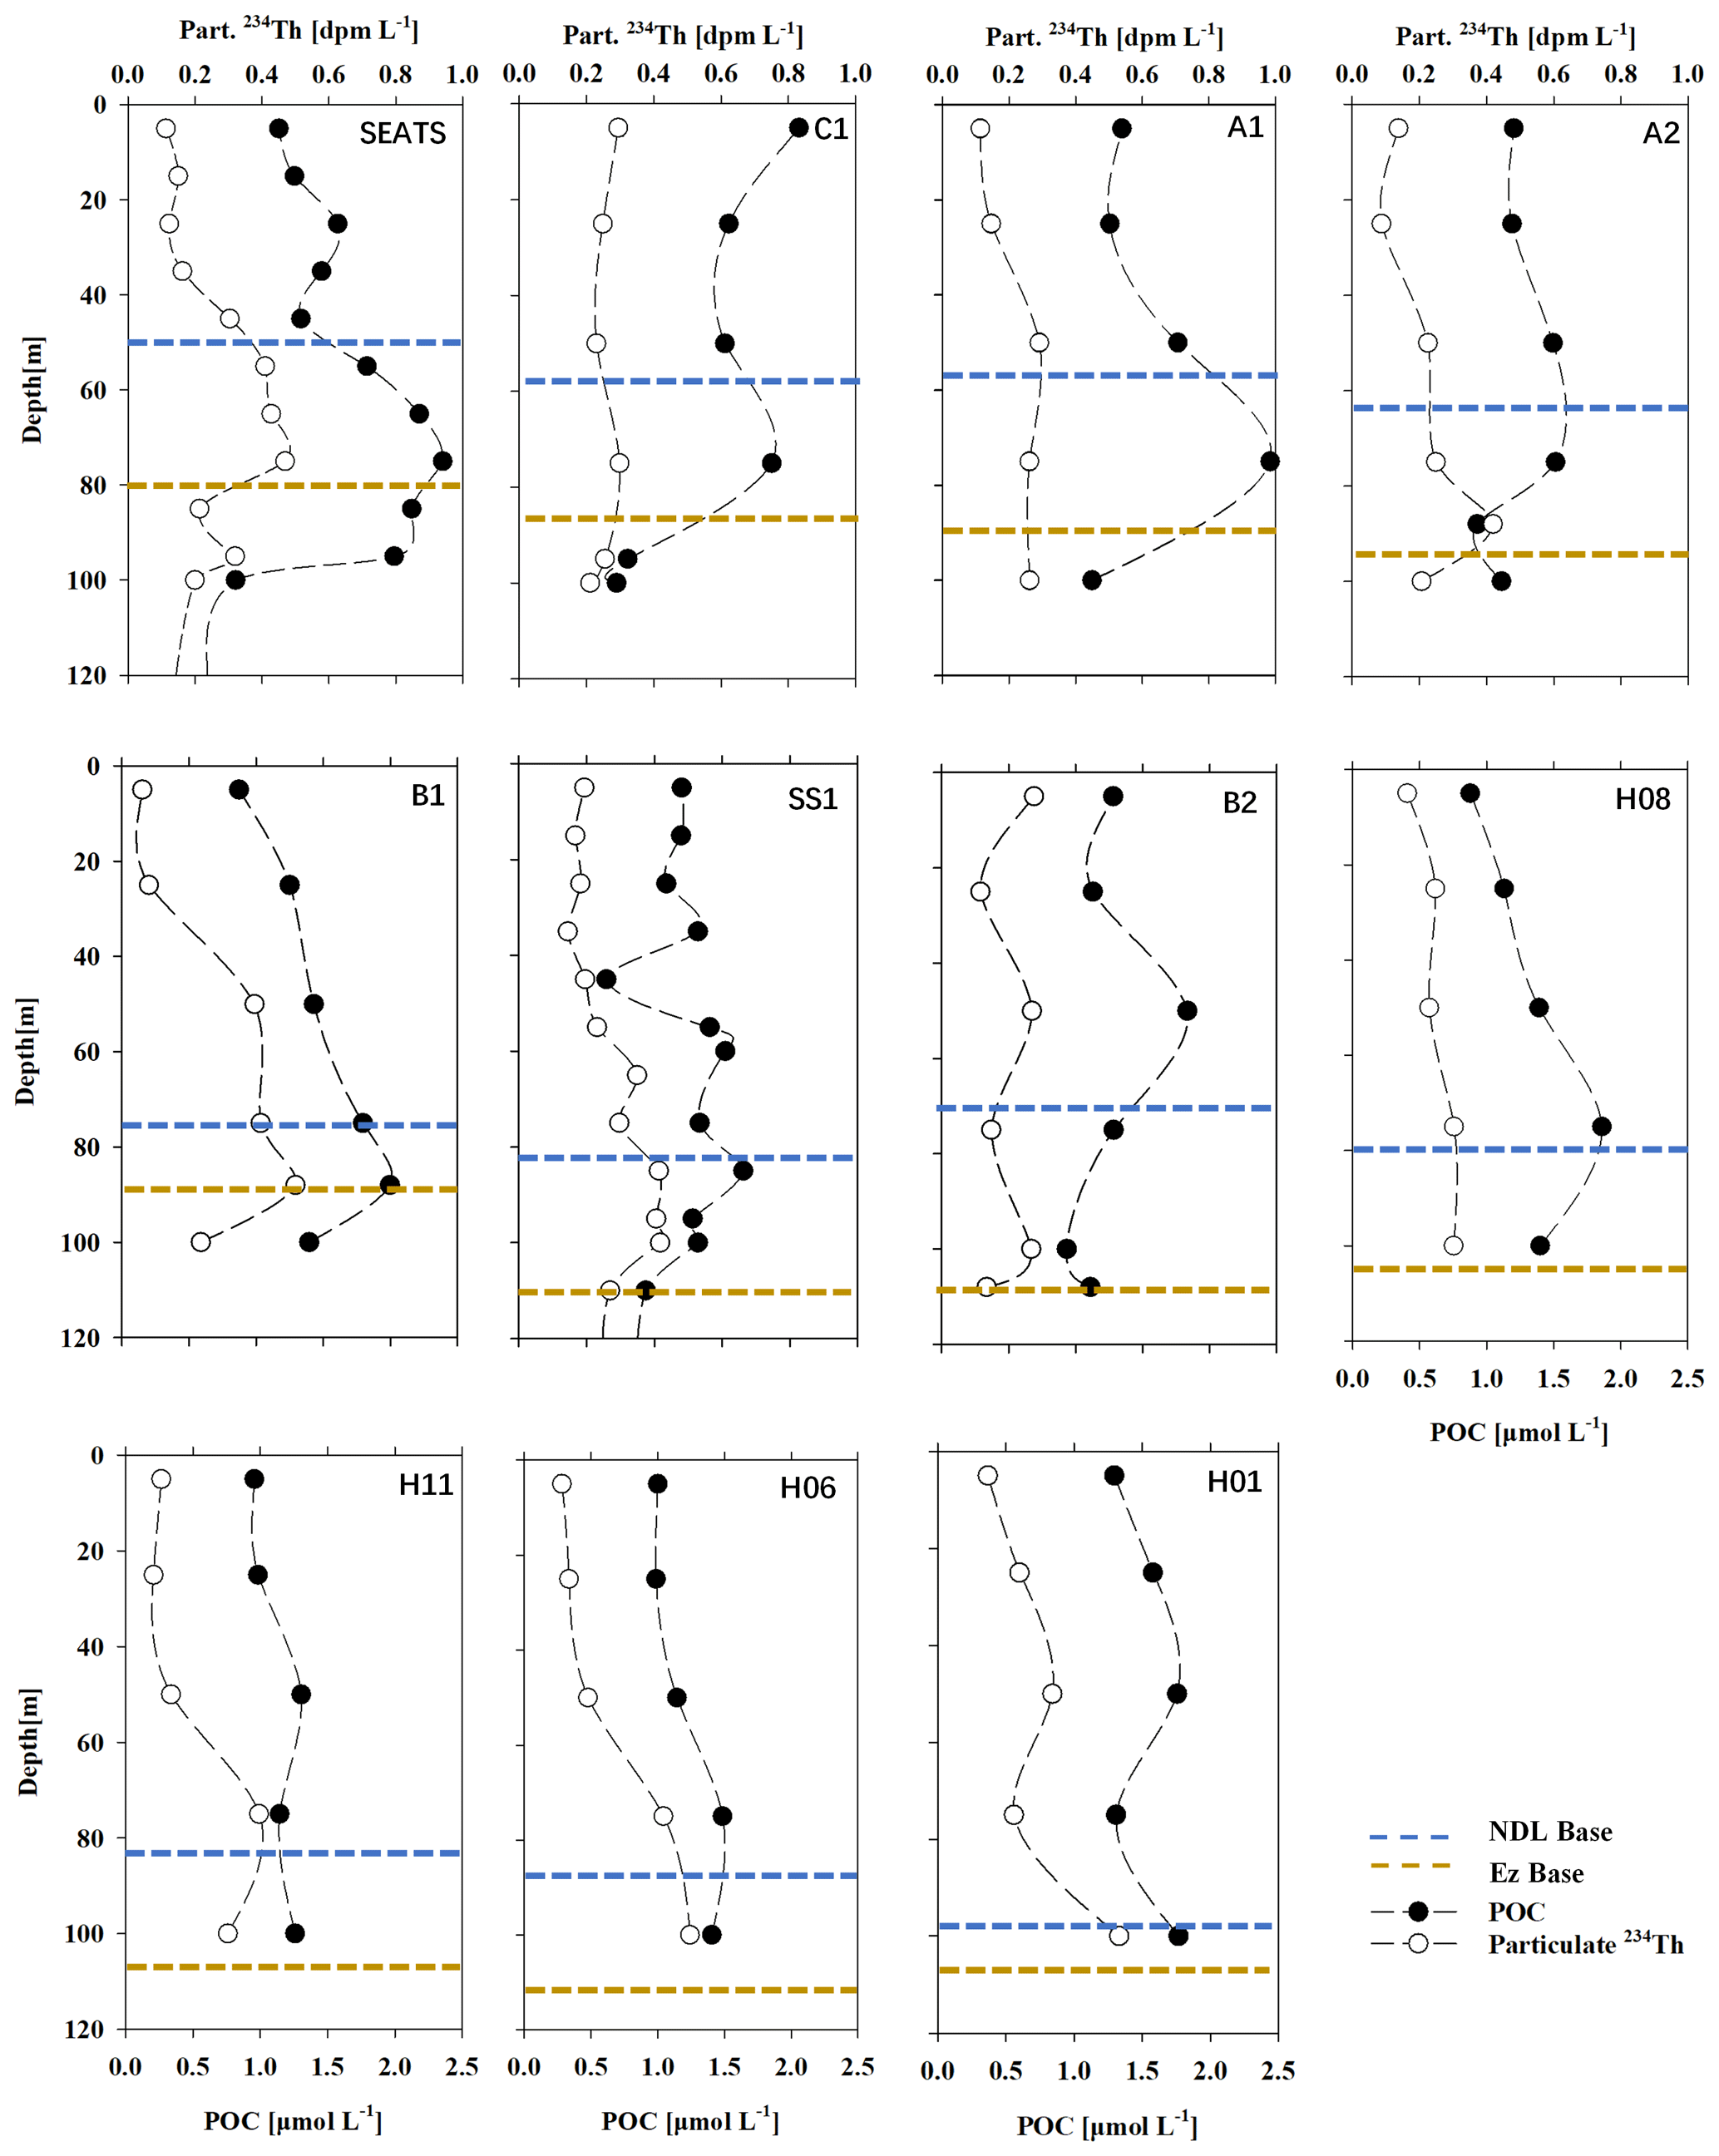
Figure 6Profiles of POC (black dots – µmol L−1) and particulate 234Th activity (PTh, open circles – dpm L−1) at all stations sampled in the South China Sea basin in June 2017. The bases of both the NDL (dashed blue line) and the Ez (dashed yellow line) are also shown.
POC concentrations ranged from 0.83 to 2.5 µmol L−1 (with an average of 1.2 ± 0.44 µmol L−1, n=83; Fig. 6). At most stations, the POC concentration was low (with an average of 1.1 ± 0.2 µmol L−1) in surface water and generally increased with depth until it reached its maximum at the SCM layer, and then it decreased again with depth. However, at some stations (i.e., C1, B2), there were POC peaks that appeared in both the surface water and the SCM layer.
3.3 Water-column-integrated and sediment-trap-derived 234Th fluxes
Calculated 234Th fluxes at different export horizons (i.e., the NDL and Ez base) are shown in both Table 2 and Fig. 4d. 234Th fluxes at the Ez base mostly ranged from 267 ± 69 to 839 ± 59 dpm m−2 d−1. 234Th fluxes at the NDL base ranged from 204 ± 57 to 624 ± 52 dpm m−2 d−1, which accounts for 69 %–100 % of 234Th fluxes at the Ez base. We found that the 234Th fluxes remained rather low, mostly <800 dpm m−2 d−1, during our study, which was close to the threshold for the validity of the steady-state assumption, as shown in many prior studies (e.g., Savoye et al., 2006; Resplandy et al., 2012). The sea surface Chl a also indicated that no bloom was observed during the survey in June 2017 (Fig. S4 in the Supplement), suggesting that the study area retained its biogeochemistry under the steady-state condition.
234Th fluxes at the Ez base were within the range of 62–1365 dpm m−2 d−1, similar to those found in prior studies in the SCS basin (e.g., Cai et al., 2008, 2015; Zhou et al., 2013, 2020a). Given that our high-vertical-resolution sampling mode was only applied to stations SEATS and SS1, we estimated 234Th fluxes at the Ez base by reducing the vertical resolution to a 25 m interval so as to be consistent with other stations. This exercise resulted in values of 490 ± 60 and 655 ± 71 dpm m−2 d−1, respectively, for stations SEATS and SS1 compared to 522 ± 43 and 631 ± 48 dpm m−2 d−1 under the high-resolution sampling mode. The low-resolution sampling thus might induce an uncertainty of less than 6 % for the 234Th flux. However, high-resolution sampling is essential in order to examine the partitioning of carbon export in the upper water column, especially for the oligotrophic ocean characteristic of low export fluxes.
Based on the high-resolution total 234Th pattern at stations SEATS and SS1, we first determined the 234Th deficit in the NDL, showing substantial particle scavenging and POC export at the NDL base at both stations, and we subsequently found similar patterns at the rest of stations where we estimated the partitioning in POC export fluxes.
Besides the 234Th–238U disequilibrium method, sediment-trap-derived 234Th fluxes at SEATS were 589 ± 2 dpm m−2 d−1 at the NDL base (50 m), representing over 50 % of the 234Th flux, and 830 ± 2 dpm m−2 d−1 near the Ez base (100 m). The trap-derived 234Th fluxes were higher, but within a factor of 2, than the fluxes derived from bottle-sampled 234Th (362 ± 34 dpm m−2 d−1 at 50 m and 471 ± 46 dpm m−2 d−1 at 100 m) at both export horizons. Although 234Th fluxes at the base of the NDL had rarely been quantified in prior studies, we estimated the particle-scavenging rate at the corresponding export horizon with the historical data of 234Th. Our recalculation using these literature data showed that 234Th fluxes at the NDL base averaged 349 ± 296 dpm m−2 d−1 (n=36) with limited spatial and temporal variations in the oligotrophic SCS. This is also consistent with the fact that these prior measurements of 234Th shared similarities in terms of activities in the NDL (Cai et al., 2015; Zhou et al., 2020a). Nevertheless, the partitioning in particle fluxes between the NDL and Ez, based on both techniques employed in this study, is similar, which further supports that our 234Th–238U-disequilibrium-based fluxes are representative.
3.4 ratios based on bottle filtration and sediment traps
Bottle-derived profiles in the Ez are shown in Fig. 7. They ranged from 2.6 to 15.7 µmol dpm−1 (with an average of 5.6 ± 3.3 µmol dpm−1, N=83), peaked in the upper 25 m and generally decreased with depth at all stations. differences between most stations gradually diminished with depth and converged near 4.2 ± 1.6 µmol dpm−1 at the base of the Ez. The decreasing pattern of was not observed at stations SEATS and H11 (as noted in Fig. 7a).
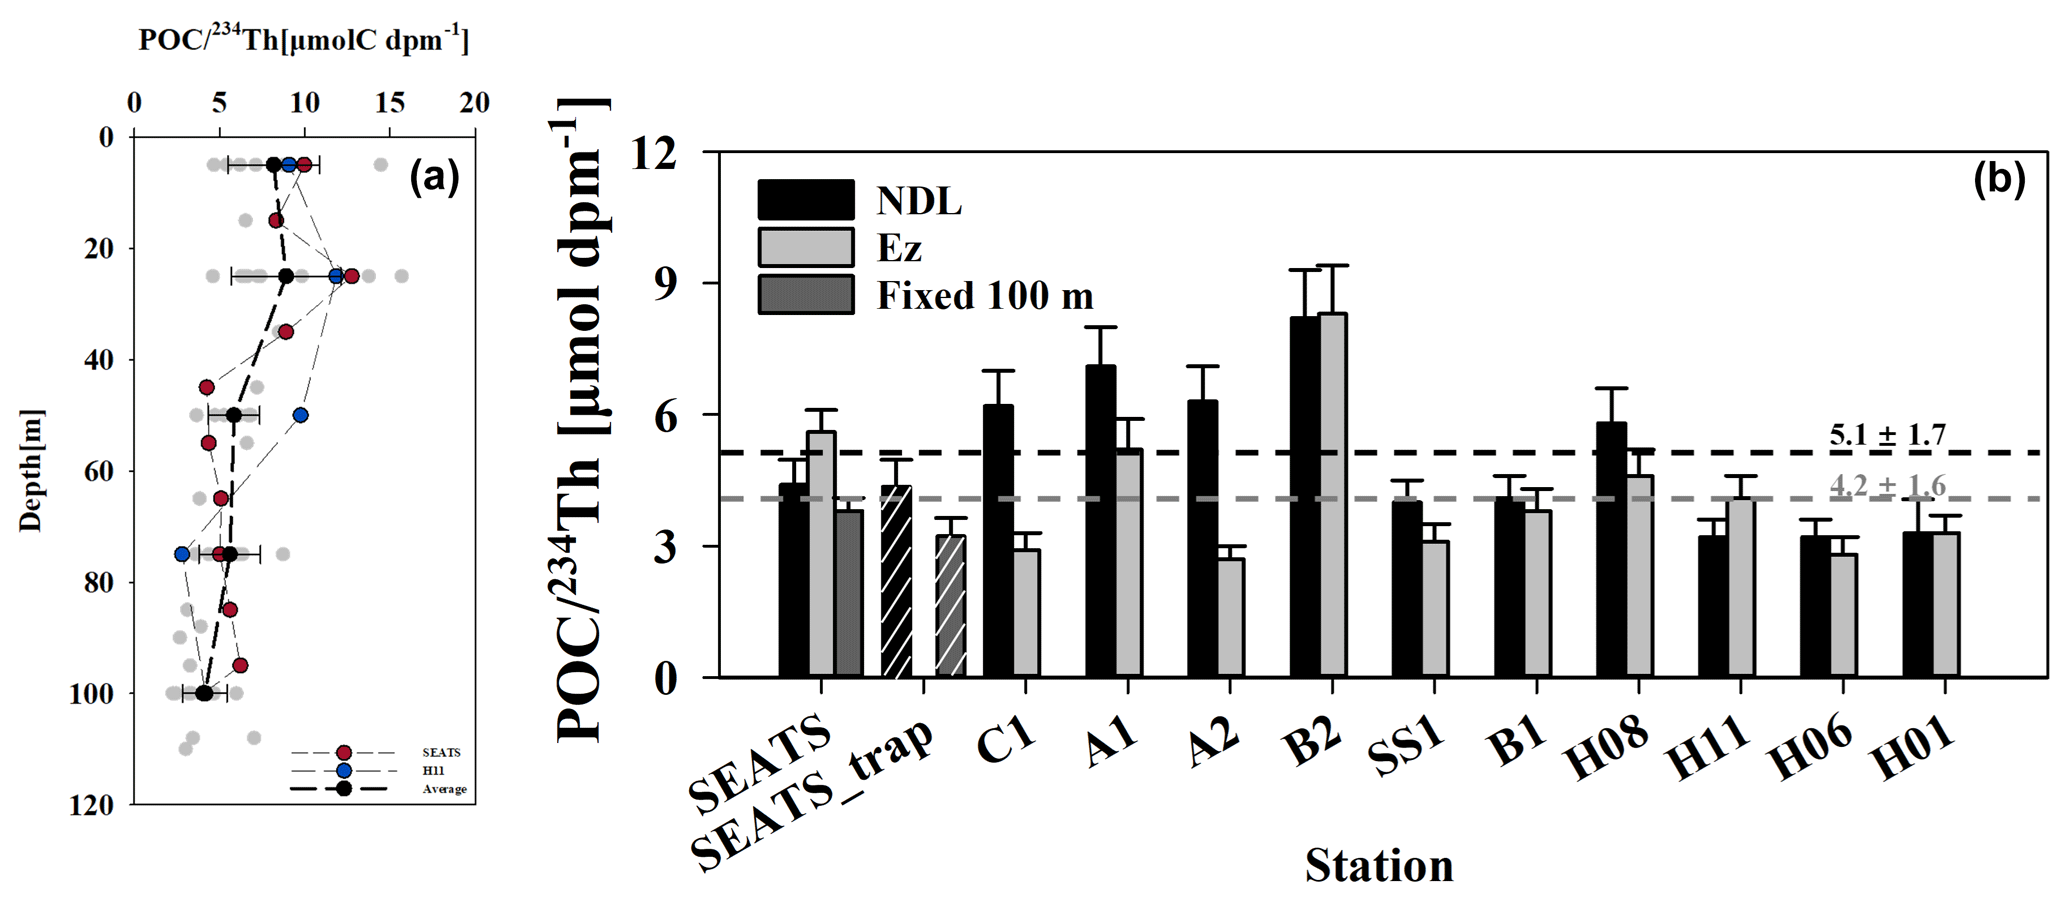
Figure 7Water column ratios from bottle filtration, with the averages (black dots with dashed line) at each sampling depth plotted against depth (a). Also shown are the bottle- and trap-derived ratios (bar with white stripes) at the bottom of the NDL (black), the base of the euphotic zone (light gray) and fixed 100 m depth (dark gray) (b). Generally, the variability of decreased as depth increased and converged around 4.2 ± 1.6 µmol dpm−1 at the Ez base. No significant variability (within a factor of 2) was found between ratios derived from bottle and trap samples accessed at the same sampling depths at station SEATS.
ratios from sediment traps were only measured at station SEATS and were 4.7 and 3.2 µmol dpm−1 at 50 and 100 m, respectively (Fig. 7b). These values are comparable with the bottle-derived ratios from the same site as that sampled during the cruise.
3.5 δ15NPN from sediment traps
The δ15NPN values for the trap samples varied between 2.6 ‰ to 6.7 ‰ in the upper 200 m at stations SEATS and SS1, showing an increasing trend with depth. Specifically, the lowest δ15NPN of 2.6 ‰ was observed at 50 m within the NDL, and the δ15NPN increased to 4.7 ‰ at the Ez base (about 100 m). Below the Ez, the δ15NPN value increased to 6.7 ‰ at 200 m at station SEATS. A similar pattern of δ15NPN was also found at station SS1, with the lowest δ15NPN of 4.1 ‰ at 50 m, an intermediate value of 5.8 ‰ at 100 m and the highest value of 6.0 ‰ at 200 m. The observed δ15NPN values at both stations were comparable to previous results (3.3 ‰–7.3 ‰) from sinking particles collected by sediment traps in the upper 500 m around station SEATS (Kao et al., 2012; Yang et al., 2017). Yang et al. (2017) found a δ15NPN value of 4.9 ‰ at 100 m at station SEATS, which was very consistent with our observation at the same depth at station SEATS. These results suggest that interannual variations in δ15NPN from the upper ocean in the SCS may be limited, and the δ15NPN value at station SS1 from the cruise in 2019 could be comparable to that in this campaign. We thus diagnose the nutrient sources of sinking particles at stations with different environmental settings without focusing on temporal variability.
4.1 234Th fluxes at the NDL and Ez bases
The particle flux at the NDL base was comparable (88 ± 11 %) to that at the Ez base. This vertical structure indicates that the NDL base should be a hotspot for particle scavenging. The trap-derived 234Th fluxes (589 ± 2 dpm m−2 d−1 at 50 m and 830 ± 2 dpm m−2 d−1 at 100 m) were slightly higher compared to bottle-derived 234Th fluxes (362 ± 34 dpm m−2 d−1 at 50 m and 471 ± 46 dpm m−2 d−1 at 100 m). The higher trap-derived 234Th fluxes might possibly be related to incomplete removal of zooplankton (Buesseler et al., 2020b). In addition, the discrepancy in between could be due to the difference in their timescales (Umhau et al., 2019). Regardless of the differences in 234Th flux estimations from the separate methods, the similar vertical partitioning from both bottle- and trap-derived 234Th fluxes indicated substantial particle scavenging at the bases of both the NDL and Ez in the oligotrophic SCS.
It is also interesting to note that, at stations with higher nutrient inventories, 234Th fluxes (362 ± 34–624 ± 52 dpm m−2 d−1, average 547 ± 107 dpm m−2 d−1 at the NDL base, and 522 ± 45–839 ± 59 dpm m−2 d−1, average 637 ± 120 dpm m−2 d−1 at the Ez base) are significantly higher (by approximately 100–200 dpm m−2 d−1) than those at other stations (210 ± 38–520 ± 31 dpm m−2 d−1, average 359 ± 90 dpm m−2 d−1 at the NDL base, and 204 ± 57–613 ± 42 dpm m−2 d−1, average 427 ± 105 dpm m−2 d−1 at the Ez base; Fig. 4d). This regional pattern of 234Th fluxes might result from differences in nutrient distributions, as 234Th has thus far been an indispensable tool to trace biogenic particle scavenging (Ceballos-Romero et al., 2022, and references therein). Whether these high and low 234Th fluxes would respectively drive similar POC export fluxes at stations with high and low nutrient inventories remains to be determined.
4.2 ratio and 234Th-derived POC fluxes in the SCS basin
4.2.1 Variability in bottle- and trap-derived ratios
Determining ratios on particles at the export horizons is essential for converting 234Th fluxes to POC export fluxes. ratios can, however, vary by 3 orders of magnitude between different regions, depths, seasons and even particle sizes (Buesseler et al., 2006; Puigcorbé et al., 2020). The variability in is possibly due to the combined effect of particle generation, aggregation, remineralization and particulate 234Th decay (Cai et al., 2006). As shown in Fig. 7a, water column ratios decreased gradually with depth and varied within 5 µmol dpm−1 below 50 m. This decreasing tendency of ratios was highly consistent with results from prior studies conducted in tropical–subtropical oligotrophic ecosystems despite differing sampling devices (Puigcorbé et al., 2020). The maximum ratio with the highest variability was observed in the upper 25 m, at a depth where primary production usually peaks in oligotrophic ecosystems (Xie et al., 2018; Buesseler et al., 2020b). Even though ratios determined from bottle filtration were variable in prior studies, they are strongly coupled to ratios from sediment traps (Gustafsson et al., 2013), which are considered to represent the ratio on sinking particles. ratios based on bottle filtration and sediment traps in this study were also compared to each other at the same depth at station SEATS. The ratios were 4.2 and 3.2 µmol dpm−1 on trap samples at 50 and 100 m, similarly to bottle-filtration-derived ratios (4.4 ± 0.6 and 3.8 ± 0.6 µmol dpm−1 at 55 and 100 m, respectively). Besides bottle- and trap-derived ratios, the ratio on large-sized particles (>53 µm and assumed to be sinking particles; Buesseler et al., 2006) retrieved from in situ pumping also decreased with depth at station SEATS (Cai et al., 2006) and converged to a narrow range from 1.8 to 4.1 µmol dpm−1 at 100 m in the SCS basin (Chen, 2008). We thus confirmed that the bottle-derived was comparable with those derived from sinking particles accessed from traps or in situ pumps. This is consistent with prior studies showing that POC export fluxes based on bottle were comparable with trap POC fluxes (e.g., Zhou et al., 2020a). Due to a lack of trap or pump deployment at all sites, and considering the similarity of ratios using different methodologies, ratios based on bottle filtration were used for POC flux estimation.
ratios at the Ez base varied from 2.8 ± 0.4 to 8.3 ± 0.7 µmol dpm−1 (averaged at 4.2 ± 1.6 µmol dpm−1; Fig. 7b), which is comparable with previously published results (e.g., 1.6 to 5.3 µmol dpm−1, averaged at 4.2 ± 1.6 µmol dpm−1) from the SCS basin (Cai et al., 2015; Zhou et al., 2013, 2020a). ratios at the NDL base were generally higher than those at the Ez base, ranging from 3.2 ± 0.4 to 8.2 ± 1.1 µmol dpm−1 (averaged at 5.1 ± 1.7 µmol dpm−1).
We found that variability in ratios was insignificant between stations with shallow and deep nutriclines. The ratio at the NDL base ranged from 4.4 ± 0.6 to 7.1 ± 0.9, averaged at 6.0 ± 1.0 µmol dpm−1 at stations with shallow nutriclines (i.e., stations SEATS, C1, A1 and A2), which was slightly higher than the values at other sites (ranging from 3.2 ± 0.4 to 8.2 ± 1.1, averaged at 4.5 ± 1.7 µmol dpm−1). On the other hand, the ratios at the Ez base ranged from 2.9 ± 0.4 to 5.5 ± 0.7, averaged at 4.0 ± 1.3 µmol dpm−1 at stations with shallow nutriclines, which was like the ratios at other sites (ranging from 2.8 ± 0.4 to 8.3 ± 1.1, averaged at 4.3 ± 1.7 µmol dpm−1). The relatively low at the NDL base at stations with deep nutriclines may be explained by higher particle remineralization rates with increasing depth. Based on similar ranges of 234Th fluxes and ratios, the estimated POC export fluxes in this study were consistent with prior studies in the SCS basin (Cai et al., 2015; Zhou et al., 2020a).
4.2.2 POC export fluxes at different export horizons
POC export fluxes were estimated after combining the partitioned 234Th fluxes and ratios. 234Th-derived POC export fluxes ranged from 1.2 ± 0.5 to 3.0 ± 0.8 mmol C m−2 d−1 at the base of the Ez and from 1.2 ± 0.6 to 4.3 ± 1.2 mmol C m−2 d−1 at the base of the NDL (Fig. 4e and Table 2). POC export fluxes estimated in this study are of the same order of magnitude as previous estimates in the SCS basin (Zhou et al., 2013, 2020a; Cai et al., 2015).
To assess the POC export flux using different methods, we compared 234Th- and trap-derived POC export fluxes at station SEATS. POC export fluxes were comparable near the Ez base (2.9 ± 0.9 and 2.7 ± 0.3 mmol C m−2 d−1 for 234Th- and trap-derived POC export fluxes, respectively). However, the 234Th-derived POC export flux of 1.6 ± 0.6 mmol C m−2 d−1 was slightly lower than the trap-derived POC export flux (2.8 ± 0.3 mmol C m−2 d−1) at 50 m at station SEATS. The lower 234Th-derived POC export flux at 50 m may indicate potential contamination by organics in the traps (e.g., swimmers) that would result in higher measured POC fluxes in the oligotrophic SCS basin. A recent study of the EXPORTS program found that swimmers could increase the measured POC export flux by a factor of 2 in the traps (Estapa et al., 2021). Although slight disagreement between different methods was often noted and difficult to assign causes (Hung and Gong, 2007; Stewart et al., 2007; Lampitt et al., 2008; Haskell et al., 2013; Buesseler et al., 2020b), we clearly found substantial POC export fluxes at the NDL base that were comparable to those at the Ez base in the SCS. A recent study based on 234Th and sediment traps in the oligotrophic Gulf of Mexico also found particle production dominates in the upper Ez (0–60 m), where nutrients are depleted (Stukel et al., 2022). The results above conflict with previous knowledge suggesting that POC export flux from the nutrient-depleted mixed layer is extremely low (Coale and Bruland, 1987). The substantial POC export flux at the NDL base was highly correlated to the Chl a inventory, an index of biomass in the corresponding layer (Fig. 8a). In this regard, the sources of new nutrients that support the relatively high biomass in the NDL and drive the POC export fluxes at the NDL base in the SCS basin need to be constrained.
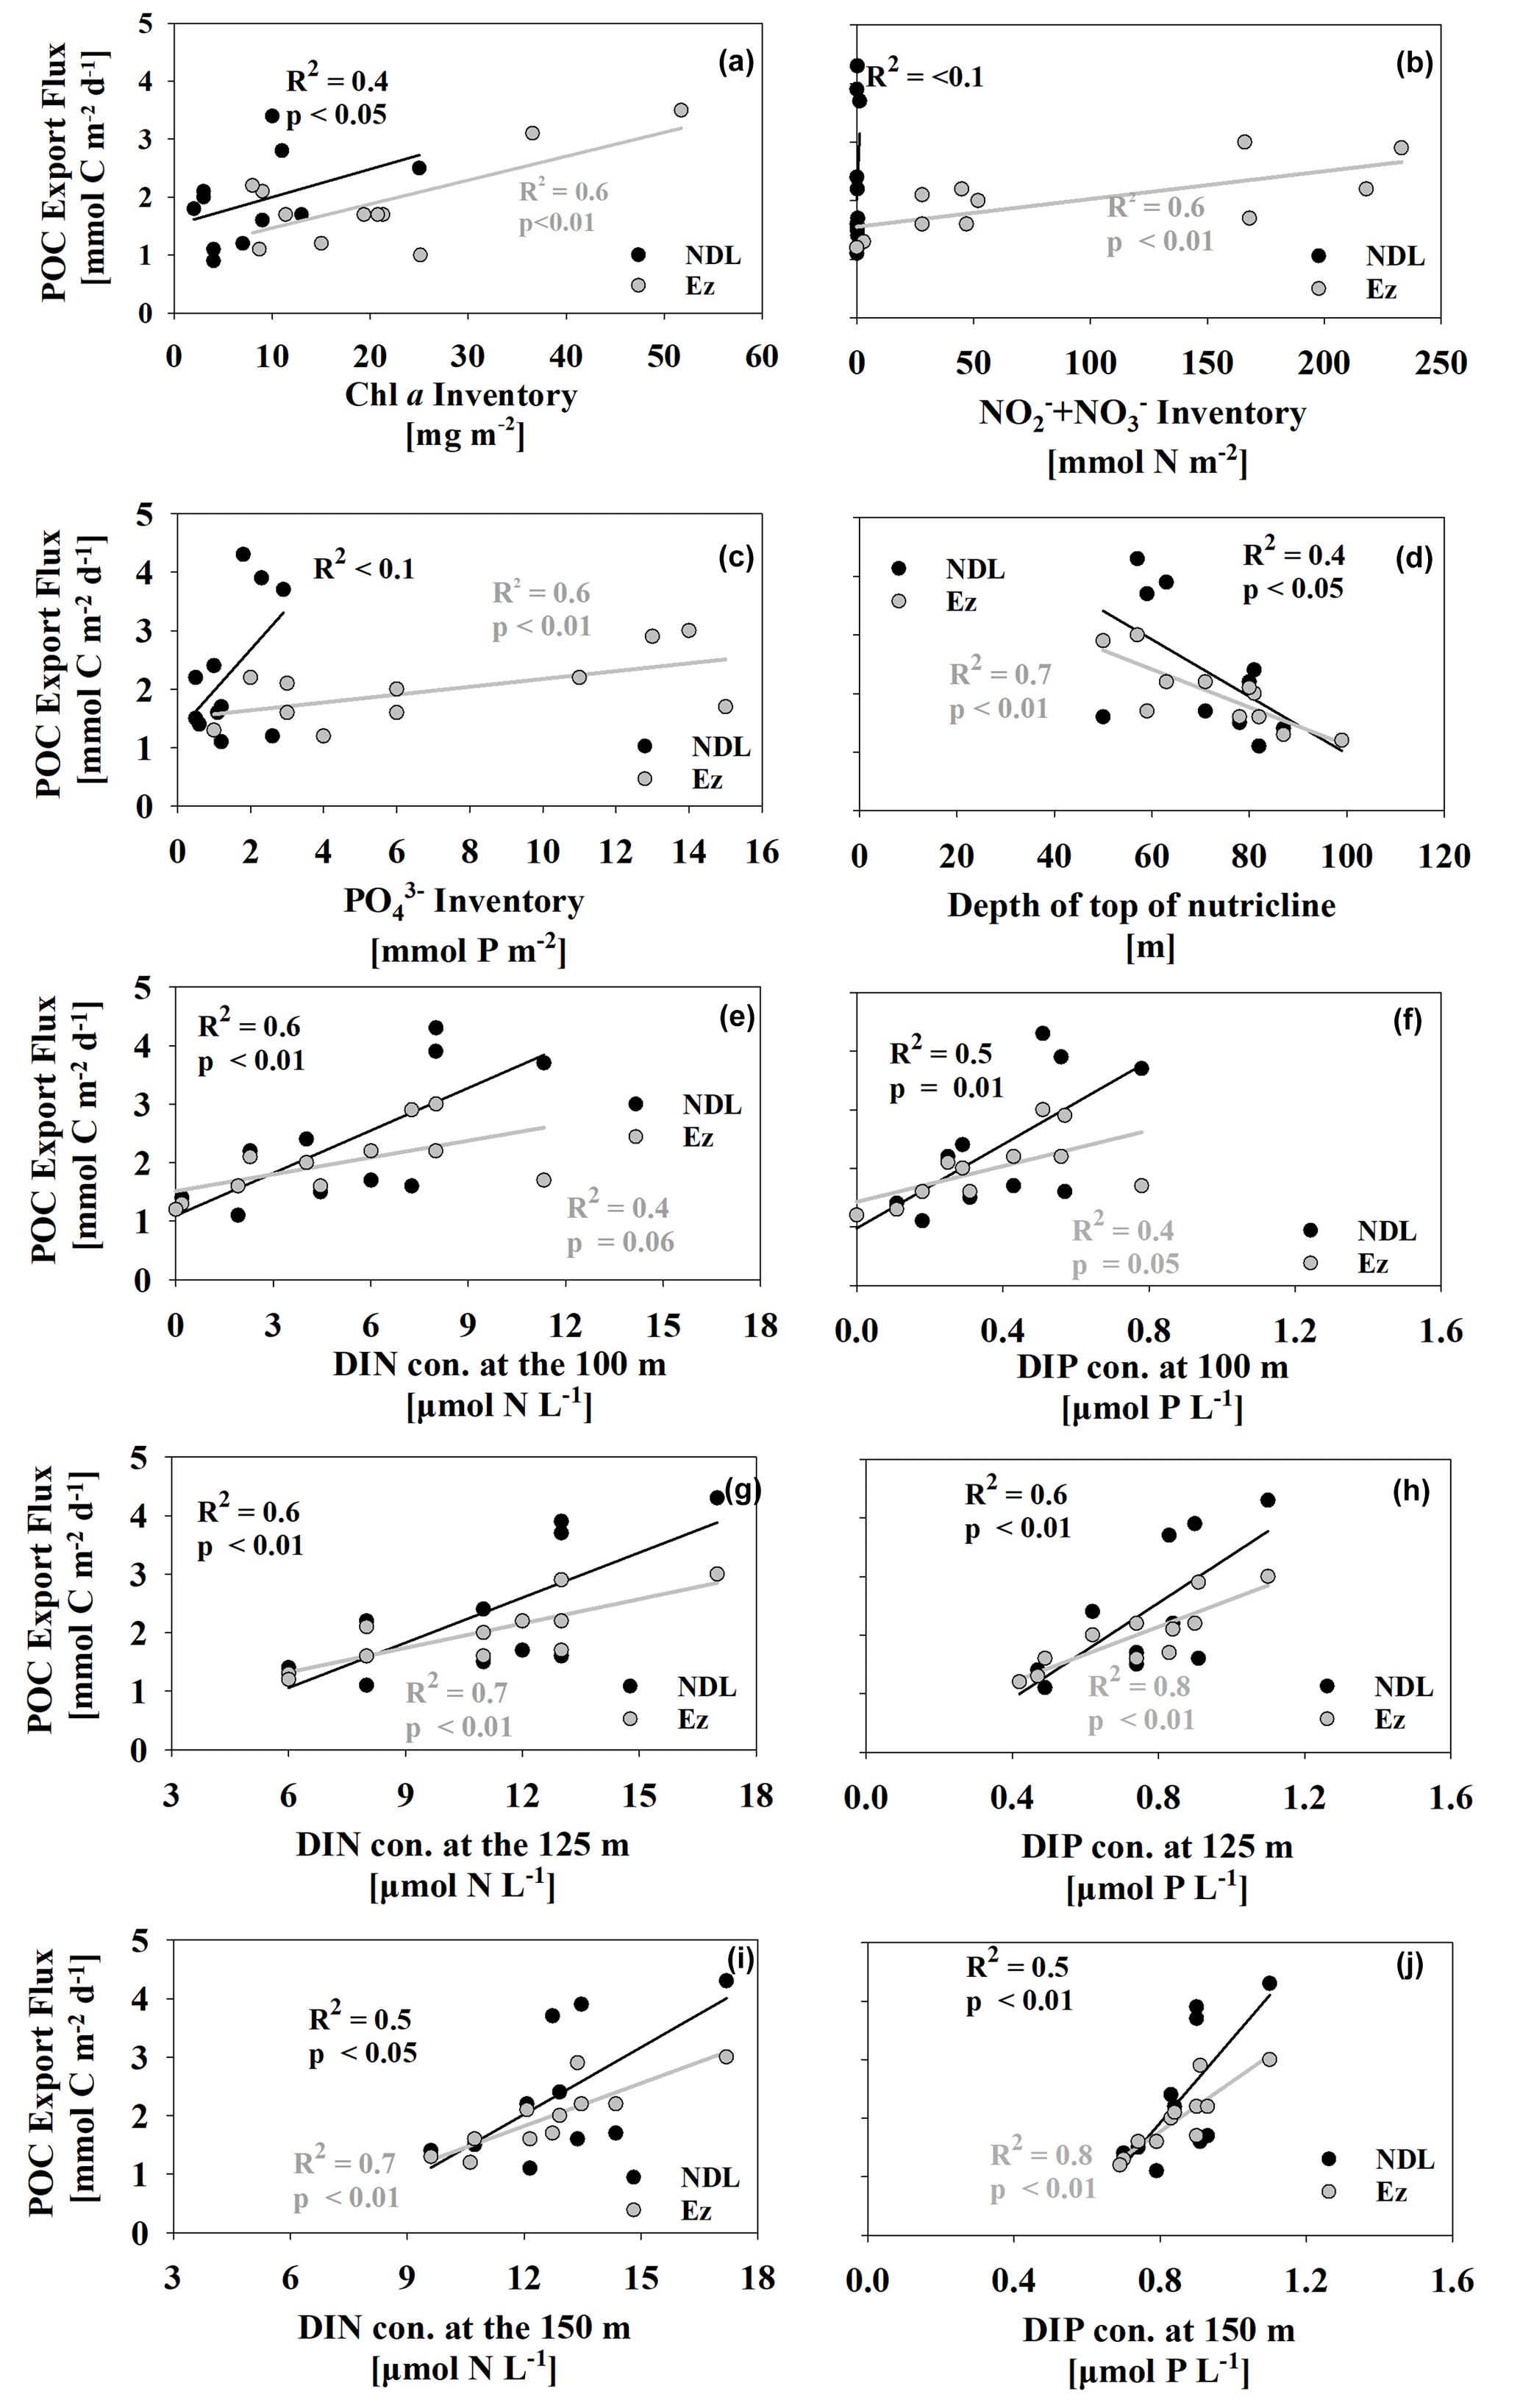
Figure 8Relationship between POC export flux at the NDL base (black dots) and Ez base (gray dots) vs. Chl a (a), DIN (b) and DIP inventories (c) in the corresponding layers. Also plotted are the relationships between the depth of the top of the nutricline (d) and DIN and DIP concentrations in subsurface water at 100, 125 and 150 m versus partitioning POC export fluxes (e–j).
4.3 Diagnosis of nutrient sources supporting particle export in the oligotrophic SCS
4.3.1 Correlation between POC export flux and subsurface nutrient concentrations
To diagnose the nutrient sources that support POC export fluxes at different export horizons, we examined the relationship between partitioned POC export fluxes and nutrient inventories in corresponding layers. Nutrient stocks might regulate POC export fluxes at the Ez base based on their positive correlation (Fig. 8b, c). However, a poor relationship between POC export fluxes at the NDL base and nutrient inventories in the NDL was found, which suggests that the in situ nutrients in the NDL interior are insufficient to support the POC export from this horizon.
Other external nutrient sources must thus influence POC export flux in the nutrient-deleted ecosystems. Episodic events (e.g., eddies and typhoons) that can transport subsurface nutrients into nutrient-deficient regimes have been confirmed in other oligotrophic ocean regions (Johnson et al., 2010; Zhou et al., 2020b). Mesoscale eddies can pump subsurface nutrient-rich waters into the upper Ez and enhance surface Chl a based on a long-term dataset of the Chl a anomaly corresponding to eddy properties (e.g., SLA, amplitude and eddy rotation speed) in the oligotrophic SCS (He et al., 2016). Besides Chl a, POC concentrations and 234Th deficits relative to 238U were also significantly enhanced in the upper 25 m by impacts from cyclonic eddies in the oligotrophic SCS, where the nutrient concentrations were observed to be quite low (Zhou et al., 2020b). This enhancement of biomass would be amplified by the interplay of typhoons and cyclonic eddies (Liu et al., 2019). 15N isotopic results also indicate that subsurface nitrate is an important external nutrient impacting export production (Yang et al., 2017). The nutrients from underlying waters may thus play an important role in supporting POC export from the NDL.
As the potential availability of subsurface nutrients was determined by the depth of the nutricline and the nutrient concentration in subsurface waters (Mouriño-Carballido et al., 2021), we examined relationships between partitioned POC export fluxes and the depth of the top of the nutricline and subsurface DIN and DIP concentrations below the Ez at 100, 125 and 150 m, where biological uptake might be negligible (Fig. 8d–j). The moderately positive correlation (R2=0.4, p<0.05) between the depth of the top of the nutricline and POC export fluxes at the NDL base (Fig. 8d) suggests that shallower nutriclines could indeed facilitate subsurface nutrient intrusion into the upper Ez and subsequently stimulate higher POC export fluxes in the upper nutrient-depleted ecosystems. Besides the nutricline, POC export fluxes at the NDL base were also correlated (R2≥0.4) with DIN and DIP concentrations in the subsurface water near or below the Ez base (Fig. 8e–j). The positive relationship thus suggests that POC export fluxes in the upper nutrient-depleted Ez are also highly associated with subsurface nutrient levels. It is also noteworthy that the timescale of ship-based nutrients data is instantaneous, which may differ from the timescale of the 234Th method (weeks to months). Consequently, the correlations between in situ nutrients and 234Th-derived POC fluxes may be misinterpreted by the difference in timescales. To further investigate the correlations between nutrients and 234Th-derived POC fluxes, 234Th-derived POC fluxes were also related to the model-derived monthly average of nutrients (i.e., DIN concentration and the depth of nutricline; Du et al., 2021) during summer (Fig. S5 in the Supplement). The correlations between the two parameters were shown to be statistically significant (P<0.05), again implying the importance of nutrient modulation to export fluxes.
4.3.2 Nutrient sources diagnosed via 15N isotopic mass balance
As the timescale of 234Th–238U disequilibrium was not instantaneous, any episodic intrusion events before sampling (∼ 20 d) could be recorded. Due to the limited Kuroshio intrusion into the SCS basin during the summer and the extremely low levels of nutrients in the surface Kuroshio current (Du et al., 2013), the lateral transport of nutrients by Kuroshio could be neglected over the study area. Thus, we assume that air-derived nitrogen (i.e., nitrogen fixation and atmospheric nitrogen deposition) and upwelled nitrate are the major sources of new N supporting PN-corresponding POC export out of the NDL and at the Ez base. Using a two-endmember mixing model based on the 15N isotopic balance (Kao et al., 2012; Böttjer et al., 2017), we can evaluate the relative contribution of these two plausible sources of new N to support the particle export at sites SEATS and SS1 using the following equations:
where and fAir represent the fraction of PN export contributed by upwelled DIN from the subsurface and by air-derived nitrogen from nitrogen fixation and atmospheric nitrogen deposition, respectively. and δ15Nair denote the endmembers of δ15N for subsurface DIN and air-derived N, respectively. δ15NAir is chosen as −1.1 ‰ by considering the influences of both nitrogen fixation and atmospheric nitrogen deposition following Yang et al. (2022). The δ15N values of subsurface DIN in the SCS basin are found to be unchanged spatially and temporally, with an average of 4.7 ± 0.4 ‰ at 100 m (Yang et al., 2017, 2022).
was estimated to be about 59 %–67 % at the NDL base and 86 %–98 % at the Ez base at station SEATS. The proportion was higher (84 %–96 %) at 50 m within the NDL and nearly 100 % at 100 m close to the Ez base at station SS1. The differences in δ15NPN in the NDL are likely related to the relative contributions of nutrient sources. Little variability in the regional nitrogen fixation rate suggests that differences in nitrogen fixation would not lead to such a discrete pattern of δ15NPN near the NDL base between sites, except when influenced by Kuroshio waters (Lu et al., 2018). However, Gao et al. (2020) clarified the spatial variation of atmospheric nitrogen deposition in the SCS basin, showing that the aerosol NO concentration at station SEATS was nearly twice that at station SS1, which is relatively far away from the continent. In addition, three anti-cyclonic eddies (Fig. S6 in the Supplement) influenced the water surrounding station SS1 before our visit in this region. In this regard, the relatively elevated contribution of subsurface DIN at station SS1 might be attributed to the decrease in atmospheric nitrogen deposition and event-driven subsurface DIN intrusion. Despite the variability of δ15NPN between stations, our results suggested a major contribution of subsurface DIN in the SCS basin based on the isotopic balance. These estimates indicate that POC export fluxes supported by subsurface DIN are sufficient and even more important than those supported by nitrogen fixation and atmospheric nitrogen deposition at the base of the NDL, where the DIN concentration is usually below detection. To validate our 15N-based estimates, we compared the reported fluxes of nitrogen fixation and atmospheric nitrogen deposition in the SCS basin to the measured PN fluxes from the sediment trap at 50 m (about 2.8 mmol C m−2 d−1 and 0.42 mmol N m−2 d−1, assuming a ratio of 6.6 in sinking particles) at station SEATS in this study. The average nitrogen fixation rate was 0.06 mmol N m−2 d−1 (Kao et al., 2012; Chen et al., 2014), and the atmospheric nitrogen deposition flux was 0.14 mmol N m−2 d−1 (Yang et al., 2014; Kim et al., 2014). The contribution of nitrogen fixation and atmospheric nitrogen deposition to the measured PN flux at 50 m is estimated to be 48 %, suggesting that 52 % of PN flux at this depth is supported by subsurface nitrate. The derived based on mass balance is slightly lower than that obtained from the isotopic balance at the NDL base (59 %–67 %). This might be due to an overestimation of the nitrogen fixation rate and the flux of atmospheric nitrogen deposition in the mass balance model. For example, the nitrogen fixation rate used is observed in the northeastern SCS, where the Kuroshio intrudes frequently (Kao et al., 2012). Higher rates of nitrogen fixation were detected in the Kuroshio-influenced waters compared to those in the northern basin (e.g., at station SEATS; Lu et al., 2019). Similarly, the observed flux of atmospheric nitrogen deposition at Dongsha Island, which is close to mainland China, is likely higher than that at station SEATS. Despite uncertainties, the two independent estimates both suggest a substantial role of subsurface nitrate in supporting particle export out of the NDL base. Furthermore, the differences in δ15NPN at both stations SEATS and SS1 gradually disappeared with increasing depth because the new nutrients were predominantly sourced from the nutrient-rich subsurface waters near the base of the Ez. This enhanced contribution of subsurface nutrients is consistent with results from prior studies (Kao et al., 2012; Yang et al., 2017) that subsurface nutrients contribute to more than 90 % of the export production at the Ez base in the SCS basin.
Taken together, we thus hypothesize that the episodic event-driven nutrient upwelling from the subsurface to the surface nutrient-depleted ecosystem stimulates the growth of planktonic organisms and elevates the particle-scavenging rate in the oligotrophic SCS, which could be reflected in the 234Th, whose activities integrate the impacts of processes occurring over several months. It is also worthwhile considering the influences of mesoscale and sub-mesoscale processes in the SCS basin. Prior studies showed the concurrence of the vertical transport of particles supported by locally uplifted nutrients and the horizontal transport of particles supported by the nutrients trapped in eddies (Wang et al., 2018; Ma et al., 2021). In this study, we found enhanced POC export fluxes at stations with high nutrient inventories and inferred that the POC export fluxes might also be supported by nutrients from the subsurface waters based on the signal of δ15NPN. However, our current study was unable to diagnose the pathways of nutrients fueling the primary and export production, which need further studies.
With the aid of high-depth-resolution 234Th sampling, 234Th and POC fluxes at both the NDL and Ez bases were estimated in the oligotrophic SCS basin during the summer of 2017. Although DIN was exhausted in the NDL, 234Th-based POC export fluxes at the NDL base were estimated to be 1.1 ± 0.5 to 4.3 ± 1.2 mmol C m−2 d−1, which is comparable to those at the Ez base (1.2 ± 0.5 to 3.0 ± 0.8 mmol C m−2 d−1). The relationship between POC export flux and nutrients was diagnosed: spatially, the POC export flux at the Ez base was elevated at stations with shallow nutriclines, corresponding to high nutrient inventories (1.7 ± 0.4 to 3.0 ± 0.8 mmol C m−2 d−1) relative to stations with low nutrient inventories (1.2 ± 0.5 to 2.2 ± 1.2 mmol C m−2 d−1). More than 50 % of the relatively high particle export occurring at the NDL base was verified by N isotopes to be supported by DIN from the subsurface. It thus indicated that other pathways (e.g., episodic events) might be important for nutrient intrusion into the Ez. The higher POC export flux resulted from shallow-nutricline-derived higher-nutrient stocks and biomass in the Ez. We thus hypothesize that subsurface nutrients might act as the primary regulator of POC export fluxes at both the Ez and NDL bases on a seasonal timescale. The reduced export flux against the background of higher surface temperature and stronger stratification further implies that sea surface warming might lower the efficiency of the BCP.
All data accessed from in situ observations (i.e., temperature, salinity, fluorescence-based Chl a, 234Th, POC and nutrients) are available at the National Science Data Bank (https://doi.org/10.57760/sciencedb.02782, Ma and Dai, 2023). The speeds of the horizontal water current from May to August 2017 and 2019 were obtained from the Copernicus Marine Environment Monitoring Service (CMEMS, https://doi.org/10.48670/moi-00148, Satellite observations, 2020). The vertical speeds of water current and diffusivity were derived from the China Sea Multi-Scale Ocean Modeling System (CMOMS, Gan et al., 2016).
The supplement related to this article is available online at: https://doi.org/10.5194/bg-20-2013-2023-supplement.
All authors were involved in the writing of the paper and approved the final submitted paper. YM and MD were major contributors to the study's conception, data analysis and drafting of the paper. KZ, WC and JC contributed significantly to cruise design, sample collections and/or data acquisition. JYTY contributed substantially to isotopic data acquisition and analysis.
The contact author has declared that none of the authors has any competing interests.
Publisher's note: Copernicus Publications remains neutral with regard to jurisdictional claims in published maps and institutional affiliations.
We thank Xianghui Guo, Peng Cheng and Yuyuan Xie, who led the cruise as chief scientists, as well as Bangqing Huang, who, with his group, assisted with the Chl a data analysis. Zhongwei Yuan, Lifang Wang and Tao Huang are thanked for the nutrient sampling and analysis. Silin Ni and Liguo Guo are thanked for helping with the collection of particulate samples. Qing Li and Li Tian are also thanked for the beta and analyses, respectively. Yangyang Zhao, Zhongwei Yuan and Chuanjun Du are thanked for their valuable comments. We are grateful to the crew of the R/V Tan Kah Kee along with its staff for their help during the cruise. Yifan Ma was supported by a PhD fellowship from the State Key Laboratory of Marine Environmental Science, Xiamen University.
This study was funded by the National Natural Science Foundation of China through grant nos. 41890800 and 42188102 and by the National Basic Research Program of China (973 Program) through grant no. 2015CB954000.
This paper was edited by Aninda Mazumdar and reviewed by two anonymous referees.
Benitez-Nelson, C. R., Buesseler, K. O., and Crossin, G.: Upper ocean carbon export, horizontal transport, and vertical eddy diffusivity in the southwestern Gulf of Maine, Cont. Shelf Res., 20, 707–736, https://doi.org/10.1016/S0278-4343(99)00093-X, 2000.
Benitez-Nelson, C. R., Buesseler, K. O., Van Der Loeff, M., Andrews, J., Ball, L., Crossin, G., and Charette, M.: Testing a new small-volume technique for determining 234Th in seawater, J. Radioanal. Nucl. Ch., 248, 795–799, https://doi.org/10.1023/a:1010621618652, 2001.
Böttjer, D., Dore, J. E., Karl, D. M., Letelier, R. M., Mahaffey, C., Wilson, S. T., Zehr, J., and Church, M. J.: Temporal variability of nitrogen fixation and particulate nitrogen export at Station ALOHA, Limnol. Oceanogr., 62, 200–216, https://doi.org/10.1002/lno.10386, 2017.
Buesseler, K. O., Bacon, M. P., Cochran, J. K., and Livingston, H. D.: Carbon and nitrogen export during the JGOFS North Atlantic Bloom experiment estimated from 234Th : 238U disequilibria, Deep-Sea Res. Pt. I, 39, 1115–1137, https://doi.org/10.1016/0198-0149(92)90060-7, 1992.
Buesseler, K. O., Benitez-Nelson, C. R., Moran, S., Burd, A., Charette, M., Cochran, J. K., Coppola, L., Fisher, N., Fowler, S., and Gardner, W.: An assessment of particulate organic carbon to thorium-234 ratios in the ocean and their impact on the application of 234Th as a POC flux proxy, Mar. Chem., 100, 213–233, https://doi.org/10.1016/j.marchem.2005.10.013, 2006.
Buesseler, K. O., Pike, S., Maiti, K., Lamborg, C. H., Siegel, D. A., and Trull, T. W.: Thorium-234 as a tracer of spatial, temporal and vertical variability in particle flux in the North Pacific, Deep-Sea Res. Pt. I, 56, 1143–1167, https://doi.org/10.1016/j.dsr.2009.04.001, 2009.
Buesseler, K. O., Boyd, P. W., Black, E. E., and Siegel, D. A.: Metrics that matter for assessing the ocean biological carbon pump, P. Natl. Acad. Sci. USA, 117, 201918114, https://doi.org/10.1073/pnas.1918114117, 2020a.
Buesseler, K. O., Benitez-Nelson, C. R., Roca-Martí, M., Wyatt, A. M., Resplandy, L., Clevenger, S. J., Drysdale, J. A., Estapa, M. L., Pike, S., and Umhau, B. P.: High-resolution spatial and temporal measurements of particulate organic carbon flux using thorium-234 in the northeast Pacific Ocean during the EXport Processes in the Ocean from RemoTe Sensing field campaign, Elementa, 8, 30, https://doi.org/10.1525/elementa.2020.030, 2020b.
Cai, P., Dai, M., Chen, W., Tang, T., and Zhou, K.: On the importance of the decay of 234Th in determining size-fractionated ratio on marine particles, Geophys. Res. Lett., 33, L23602, https://doi.org/10.1029/2006GL027792, 2006.
Cai, P., Chen, W., Dai, M., Wan, Z., Wang, D., Li, Q., Tang, T., and Lv, D.: A high-resolution study of particle export in the southern South China Sea based on 234Th : 238U disequilibrium, J. Geophys. Res.-Oceans, 113, C04019, https://doi.org/10.1029/2007JC004268, 2008.
Cai, P., Zhao, D., Wang, L., Huang, B., and Dai, M.: Role of particle stock and phytoplankton community structure in regulating particulate organic carbon export in a large marginal sea, J. Geophys. Res.-Oceans, 120, 2063–2095, https://doi.org/10.1002/2014JC010432, 2015.
Ceballos-Romero, E., Buesseler, K. O., and Villa-Alfageme, M.: Revisiting five decades of 234Th data: a comprehensive global oceanic compilation, Earth Syst. Sci. Data, 14, 2639–2679, https://doi.org/10.5194/essd-14-2639-2022, 2022.
Chen, W. F.: On the export fluxes, seasonality and controls of particulate organic carbon in the Northern South China Sea, Ph.D. thesis, Xiamen University, China, 152 pp., 2008
Chen, Y.-L. L., Chen, H.-Y., Lin, Y.-H., Yong, T.-C., Taniuchi, Y., and Tuo, S.-H.: The relative contributions of unicellular and filamentous diazotrophs to N2 fixation in the South China Sea and the upstream Kuroshio, Deep-Sea Res. Pt. I, 85, 56–71, https://doi.org/10.1016/j.dsr.2013.11.006, 2014.
Coale, K. H. and Bruland, K. W.: Oceanic stratified euphotic zone as elucidated by 234Th : 238U disequilibria, Limnol. Oceanogr., 32, 189–200, https://doi.org/10.4319/lo.1987.32.1.0189, 1987.
Cornec, M., Laxenaire, R., Speich, S., and Claustre, H.: Impact of mesoscale eddies on deep chlorophyll maxima, Geophys. Res. Lett., 48, e2021GL093470, https://doi.org/10.1029/2021GL093470, 2021.
Dore, J. E. and Karl, D. M.: Nitrite distributions and dynamics at Station ALOHA, Deep-Sea Res. Pt. II, 43, 385–402, https://doi.org/10.1016/0967-0645(95)00105-0, 1996.
Du, C., Liu, Z., Dai, M., Kao, S.-J., Cao, Z., Zhang, Y., Huang, T., Wang, L., and Li, Y.: Impact of the Kuroshio intrusion on the nutrient inventory in the upper northern South China Sea: insights from an isopycnal mixing model, Biogeosciences, 10, 6419–6432, https://doi.org/10.5194/bg-10-6419-2013, 2013.
Du, C., Liu, Z., Kao, S. J., and Dai, M.: Diapycnal Fluxes of Nutrients in an Oligotrophic Oceanic Regime: The South China Sea, Geophys. Res. Lett., 44, 11510–11518, https://doi.org/10.1002/2017GL074921, 2017.
Du, C., He, R., Liu, Z., Huang, T., Wang, L., Yuan, Z., Xu, Y., Wang, Z., and Dai, M.: Climatology of nutrient distributions in the South China Sea based on a large data set derived from a new algorithm, Prog. Oceanogr., 195, 102586, https://doi.org/10.1016/j.pocean.2021.102586, 2021.
Eppley, R. W. and Peterson, B. J.: Particulate organic matter flux and planktonic new production in the deep ocean, Nature, 282, 677–680, https://doi.org/10.1038/282677a0, 1979.
Estapa, M., Buesseler, K., Durkin, C. A., Omand, M., Benitez-Nelson, C. R., Roca-Martí, M., Breves, E., Kelly, R., and Pike, S.: Biogenic sinking particle fluxes and sediment trap collection efficiency at Ocean Station Papa, Elementa, 9, 00122, https://doi.org/10.1525/elementa.2020.00122, 2021.
Gan, J., Liu, Z., and Liang, L.: Numerical modeling of intrinsically and extrinsically forced seasonal circulation in the China Seas: A kinematic study, J. Geophys. Res.-Oceans, 121, 4697–4715, https://doi.org/10.1002/2016JC011800, 2016.
Gao, Y., Wang, L., Guo, X., Xu, Y., and Luo, L.: Atmospheric wet and dry deposition of dissolved inorganic nitrogen to the South China Sea, Sci. China Earth Sci., 63, 1339–1352, https://doi.org/10.1007/s11430-019-9612-2, 2020.
Goldman, J. C.: Oceanic Nutrient Cycles, in: Flows of Energy and Materials in Marine Ecosystems: Theory and Practice, edited by: Fasham, M. J. R., Springer US, Boston, MA, 137–170, https://doi.org/10.1007/978-1-4757-0387-0_6, 1984
Gustafsson, Ö., Gelting, J., Andersson, P., Larsson, U., and Roos, P.: An assessment of upper ocean carbon and nitrogen export fluxes on the boreal continental shelf: A 3-year study in the open Baltic Sea comparing sediment traps, 234Th proxy, nutrient, and oxygen budgets, Limnol. Oceanogr.-Meth., 11, 495–510, https://doi.org/10.4319/lom.2013.11.495, 2013.
Haskell II, W. Z., Berelson, W. M., Hammond, D. E., and Capone, D. G.: Particle sinking dynamics and POC fluxes in the Eastern Tropical South Pacific based on 234Th budgets and sediment trap deployments, Deep-Sea Res. Pt. I, 81, 1–13, https://doi.org/10.1016/j.dsr.2013.07.001, 2013.
He, Q., Zhan, H., Cai, S., and Li, Z.: Eddy effects on surface chlorophyll in the northern South China Sea: Mechanism investigation and temporal variability analysis, Deep-Sea Res. Pt. I, 112, 25–36, https://doi.org/10.1016/j.dsr.2016.03.004, 2016.
Hung, C. C. and Gong, G. C.: Export flux of POC in the main stream of the Kuroshio, Geophys. Res. Lett., 34, L18606, https://doi.org/10.1029/2007GL030236, 2007.
Johnson, K. S., Riser, S. C., and Karl, D. M.: Nitrate supply from deep to near-surface waters of the North Pacific subtropical gyre, Nature, 465, 1062–1065, https://doi.org/10.1038/nature09170, 2010.
Kao, S. J., Terence Yang, J. Y., Liu, K. K., Dai, M., Chou, W. C., Lin, H. L., and Ren, H.: Isotope constraints on particulate nitrogen source and dynamics in the upper water column of the oligotrophic South China Sea, Global Biogeochem. Cy., 26, GB2033, https://doi.org/10.1029/2011GB004091, 2012.
Kim, T. W., Lee, K., Duce, R., and Liss, P.: Impact of atmospheric nitrogen deposition on phytoplankton productivity in the South China Sea, Geophys. Res. Lett., 41, 3156–3162, https://doi.org/10.1002/2014GL059665, 2014.
Knap, A., Michaels, A., Close, A., Ducklow, H., and Dickson, A. J.: Protocols for the joint global ocean flux study (JGOFS) core measurements, Reprint of the IOC Manuals Guides No. 29, UNESCO, 19, https://doi.org/10.25607/OBP-1443, 1996.
Lampitt, R. S., Boorman, B., Lucas, M. L., Salter, I., Sanders, R., Saw, K., Seeyave, S., Thomalla, S. J., and Turnewitsch, R.: Particle export from the euphotic zone: Estimates using a novel drifting sediment trap, 234Th and new production, Deep-Sea Res. Pt. I, 55, 1484–1502, https://doi.org/10.1016/j.dsr.2008.07.002, 2008.
Liu, K.-K., Kao, S.-J., Wen, L.-S., and Chen, K.-L.: Carbon and nitrogen isotopic compositions of particulate organic matter and biogeochemical processes in the eutrophic Danshuei Estuary in northern Taiwan, Sci. Total Environ., 382, 103–120, https://doi.org/10.1016/j.scitotenv.2007.04.019, 2007.
Liu, Y., Tang, D., and Evgeny, M.: Chlorophyll concentration response to the typhoon wind-pump induced upper ocean processes considering air–sea heat exchange, Remote Sens., 11, 1825–1847, https://doi.org/10.3390/rs11151825, 2019.
Liu, Z., Zhao, Y., Colin, C., Stattegger, K., Wiesner, M. G., Huh, C.-A., Zhang, Y., Li, X., Sompongchaiyakul, P., You, C.-F., Huang, C.-Y., Liu, J. T., Siringan, F. P., Le, K. P., Sathiamurthy, E., Hantoro, W. S., Liu, J., Tuo, S., Zhao, S., Zhou, S., He, Z., Wang, Y., Bunsomboonsakul, S., and Li, Y.: Source-to-sink transport processes of fluvial sediments in the South China Sea, Earth-Sci. Rev., 153, 238–273, https://doi.org/10.1016/j.earscirev.2015.08.005, 2016.
Lu, Y., Wen, Z., Shi, D., Chen, M., Zhang, Y., Bonnet, S., Li, Y., Tian, J., and Kao, S.-J.: Effect of light on N2 fixation and net nitrogen release of Trichodesmium in a field study, Biogeosciences, 15, 1–12, https://doi.org/10.5194/bg-15-1-2018, 2018.
Lu, Y. Y., Wen, Z. Z., Shi, D. L., Lin, W. F., Bonnet, S., Dai, M. H., and Kao, S. J.: Biogeography of N2 fixation influenced by the western boundary current intrusion in the South China Sea, J. Geophys. Res.-Oceans, 124, 6983–6996, https://doi.org/10.1029/2018JC014781, 2019.
Ma, Y. F. and Dai, M. H.: Vertical distribution of total and particulate 234Th, particulate organic carbon (POC) and nutrients with their physical forcings (temperature, salinity, fluorescence-based Chl a), Science Data Bank [data set], https://doi.org/10.57760/sciencedb.02782, 2023.
Ma, W. T., Xiu, P., Chai, F., Ran, L. H., Wiesner, M. G., Xi, J. Y., Yan, Y. W., and Fredj, E.: Impact of mesoscale eddies on the source funnel of sediment trap measurements in the South China Sea, Prog. Oceanogr., 194, 102566, https://doi.org/10.1016/j.pocean.2021.102566, 2021.
Mouriño-Carballido, B., Otero Ferrer, J. L., Fernández Castro, B., Marañón, E., Blazquez Maseda, M., Aguiar-González, B., Chouciño, P., Graña, R., Moreira-Coello, V., and Villamaña, M.: Magnitude of nitrate turbulent diffusion in contrasting marine environments. Sci. Rep., 11, 1–16, https://doi.org/10.1038/s41598-021-97731-4, 2021.
Okubo, A.: Oceanic diffusion diagrams, Deep-Sea Res., 18, 789–802, https://doi.org/10.1016/0011-7471(71)90046-5, 1971.
Owens, S. A., Buesseler, K. O., and Sims, K.: Re-evaluating the 238U-salinity relationship in seawater: Implications for the 238U-234Th disequilibrium method, Mar. Chem., 127, 31–39, https://doi.org/10.1016/j.marchem.2011.07.005, 2011.
Puigcorbé, V., Masqué, P., and Le Moigne, F. A. C.: Global database of ratios of particulate organic carbon to thorium-234 in the ocean: improving estimates of the biological carbon pump, Earth Syst. Sci. Data, 12, 1267–1285, https://doi.org/10.5194/essd-12-1267-2020, 2020.
Resplandy, L., Martin, A. P., Le Moigne, F., Martin, P., Aquilina, A., Mémery, L., Lévy, M., and Sanders, R.: How does dynamical spatial variability impact 234Th-derived estimates of organic export?, Deep-Sea Res. Pt. I, 68, 24–45, https://doi.org/10.1016/j.dsr.2012.05.015, 2012.
Savoye, N., Benitez-Nelson, C., Burd, A. B., Cochran, J. K., Charette, M., Buesseler, K. O., Jackson, G. A., Roy-Barman, M., Schmidt, S., and Elskens, M.: 234Th sorption and export models in the water column: A review, Mar. Chem., 100, 234–249, https://doi.org/10.1016/j.marchem.2005.10.014, 2006.
Scharek, R., Tupas, L. M., and Karl, D. M.: Diatom fluxes to the deep sea in the oligotrophic North Pacific gyre at Station ALOHA, Mar. Ecol.-Prog. Ser., 182, 55–67, https://doi.org/10.3354/meps182055, 1999.
Siegel, D. A., Buesseler, K. O., Behrenfeld, M. J., Benitez-Nelson, C. R., Emmanuel, B., Brzezinski, M. A., Adrian, B., Carlson, C. A., D'Asaro, E. A., and Doney, S. C.: Prediction of the Export and Fate of Global Ocean Net Primary Production: The EXPORTS Science Plan, Front. Mar. Sci., 3, 22, https://doi.org/10.3389/fmars.2016.00022, 2016.
Siegel, D. A., Cetinić, I., Graff, J. R., Lee, C. M., Nelson, N., Perry, M. J., Ramos, I. S., Steinberg, D. K., Buesseler, K., and Hamme, R.: An operational overview of the EXport Processes in the Ocean from RemoTe Sensing (EXPORTS) Northeast Pacific field deployment, Elementa, 9, 00107, https://doi.org/10.3389/fmars.2016.00022, 2021.
Satellite observations: Global Ocean Gridded L 4 Sea Surface Heights And Derived Variables Reprocessed 1993 Ongoing, CMS [data set], https://doi.org/10.48670/moi-00148, 2020.
Stewart, G., Cochran, J., Miquel, J., Masqué, P., Szlosek, J., Baena, A. R., Fowler, S., Gasser, B., and Hirschberg, D.: Comparing POC export from and disequilibria with estimates from sediment traps in the northwest Mediterranean, Deep-Sea Res. Pt. I, 54, 1549–1570, https://doi.org/10.1016/j.dsr.2007.06.005, 2007.
Stukel, M. R., Kelly, T. B., Landry, M. R., Selph, K. E., and Swalethorp, R.: Sinking carbon, nitrogen, and pigment flux within and beneath the euphotic zone in the oligotrophic, open-ocean Gulf of Mexico, J. Plankton Res., 44, 711–727, https://doi.org/10.1093/plankt/fbab001, 2022.
Umhau, B. P., Benitez-Nelson, C. R., Close, H. G., Hannides, C. C., Motta, L., Popp, B. N., Blum, J. D., and Drazen, J. C.: Seasonal and spatial changes in carbon and nitrogen fluxes estimated using 234Th : 238U disequilibria in the North Pacific tropical and subtropical gyre, Mar. Chem., 217, 103705, https://doi.org/10.1016/j.marchem.2019.103705, 2019.
Wang, L., Huang, B. Q., Laws, E. A., Zhou, K. B., Liu, X., Xie, Y. Y., and Dai, M. H.: Anticyclonic Eddy Edge Effects on Phytoplankton Communities and Particle Export in the Northern South China Sea, J. Geophys. Res.-Oceans, 123, 7632–7650, https://doi.org/10.1029/2017jc013623, 2018.
Winn, C. D., Campbell, L., Christian, J. R., Letelier, R. M., Hebel, D. V., Dore, J. E., Fujieki, L., and Karl, D. M.: Seasonal variability in the phytoplankton community of the North Pacific Subtropical Gyre, Global Biogeochem. Cy., 9, 605–620, https://doi.org/10.1029/95GB02149, 1995.
Wu, J., Lee, Z., Xie, Y., Goes, J., and Huang, B.: Reconciling between optical and Biological determinants of the euphotic zone depth, J. Geophys. Res.-Oceans, 126, e2020JC016874, https://doi.org/10.1029/2020JC016874, 2021.
Xie, Y., Laws, E. A., Yang, L., and Huang, B.: Diel patterns of variable fluorescence and carbon fixation of picocyanobacteria Prochlorococcus-dominated phytoplankton in the South China Sea basin, Front. Microbiol., 9, 1589–1604, https://doi.org/10.3389/fmicb.2018.01589, 2018.
Yang, J.-Y. T., Hsu, S.-C., Dai, M. H., Hsiao, S. S.-Y., and Kao, S.-J.: Isotopic composition of water-soluble nitrate in bulk atmospheric deposition at Dongsha Island: sources and implications of external N supply to the northern South China Sea, Biogeosciences, 11, 1833–1846, https://doi.org/10.5194/bg-11-1833-2014, 2014.
Yang, J. Y. T., Kao, S. J., Dai, M., Yan, X., and Lin, H. L.: Examining N cycling in the northern South China Sea from N isotopic signals in nitrate and particulate phases, J. Geophys. Res.-Biogeo., 122, 2118–2136, https://doi.org/10.1002/2016JG003618, 2017.
Yang, J. Y. T., Tang, J. M., Kang, S., Dai, M., Kao, S. J., Yan, X., Xu, M. N., and Du, C.: Comparison of nitrate isotopes between the South China Sea and western North Pacific Ocean: Insights into biogeochemical signals and water exchange, J. Geophys. Res.-Oceans, 127, e2021JC018304, https://doi.org/10.1029/2021JC018304, 2022.
Zhou, K., Dai, M., Kao, S.-J., Wang, L., Xiu, P., Chai, F., Tian, J., and Liu, Y.: Apparent enhancement of 234Th-based particle export associated with anticyclonic eddies, Earth Planet. Sc. Lett., 381, 198–209, https://doi.org/10.1016/j.epsl.2013.07.039, 2013.
Zhou, K., Dai, M., Maiti, K., Chen, W., and Xie, Y.: Impact of physical and biogeochemical forcing on particle export in the South China Sea, Prog. Oceanogr., 187, 102403, https://doi.org/10.1016/j.pocean.2020.102403, 2020a.
Zhou, K., Dai, M., Xiu, P., Wang, L., Hu, J., and Benitez-Nelson, C. R.: Transient enhancement and decoupling of carbon and opal export in cyclonic eddies, J. Geophys. Res.-Oceans, 125, e2020JC016372, https://doi.org/10.1029/2020JC016372, 2020b.