the Creative Commons Attribution 4.0 License.
the Creative Commons Attribution 4.0 License.
 | 15 Feb 2023
Faded landscape: unravelling peat initiation and lateral expansion at one of northwest Europe's largest bog remnants
Ype van der Velde
Jasper H. J. Candel
Luc Steinbuch
Roy van Beek
Jakob Wallinga
On the mainland of northwest Europe generally only remnants of former peat landscapes subsist. Due to the poor preservation of these landscapes, alternative approaches to reconstruct peat initiation and lateral expansion are needed compared to regions with intact peat cover. Here we aim (1) to find explanatory variables within a digital soil mapping approach that allow us to reconstruct the pattern of peat initiation and lateral expansion within (and potentially beyond) peat remnants, and (2) to reconstruct peat initiation ages and lateral expansion for one of the largest bog remnants of the northwest European mainland, Fochteloërveen. Basal radiocarbon dates were obtained from the peat remnant, which formed the basis for subsequent analyses. We investigated the relationship between peat initiation age and three potential covariates: (1) total thickness of organic deposits, (2) elevation of the Pleistocene mineral surface that underlies the organic deposits, and (3) a constructed variable representing groundwater-fed wetness based on elevation of the mineral surface and current hydraulic head. Significant relationships were found with covariates (1) and (3), which were then used for subsequent modelling. Our results indicate simultaneous peat initiation at several loci in Fochteloërveen during the Early Holocene and continuous lateral expansion until 900 cal BP. Lateral expansion accelerated between 5500–3500 cal BP. Our approach is spatially explicit (i.e. results in a map of peat initiation ages), and it allows for a quantitative evaluation of the prediction using the standard deviation and comparison of predictions with validation points. The applied method based on covariate (1) is only useful where remnant peat survived, whereas covariate (3) may ultimately be applied to reconstruct peat initiation ages and lateral peatland expansion beyond the limits of peat remnants.
- Article
(7752 KB) - Full-text XML
- BibTeX
- EndNote


Peat initiation and subsequent lateral expansion of peatlands represent a significant change in the palaeoenvironment. Knowledge on the timing, process rates and spatial dynamics of peat initiation and expansion is essential to develop our understanding of peatland functioning and development, carbon dynamics, climate change, and long-term human–landscape interactions in peatland environments (e.g. Van der Velde et al., 2021; Tolonen and Turunen, 1996; Van Beek et al., 2015; Van Beek, 2015; Chapman et al., 2013).
Peat initiation may result from terrestrialisation (also called infilling), paludification or primary mire formation (Charman, 2002b; Rydin and Jeglum, 2013b). Peat deposits form if the decay rate of biomass is slower than the rate of production, i.e. where there is a positive production–decay balance. The decay rate of organic material is mainly influenced by the degree of moisture (Charman, 2002a), which is dependent on a range of factors, including climate (e.g. Weckström et al., 2010), changes in hydrological base level (resulting from sea level rise, e.g. Berendsen et al., 2007; or regional groundwater changes, e.g. Van Asselen et al., 2017), impermeable deposits or resistant layers in the soil profile (e.g. Breuning-Madsen et al., 2018; Van der Meij et al., 2018), landforms and surface topography (e.g. Almquist-Jacobson and Foster, 1995; Mäkilä, 1997; Loisel et al., 2013), and anthropogenic influence (e.g. Moore, 1975, 1993).
Peat initiation can be studied at the landscape scale or at the local scale (Fig. 1a; Quik et al., 2022). Landscape-scale peat initiation refers to the development of peat at a certain locus; that is, the oldest core of a peatland, that subsequently expands laterally and covers an increasing surface area. At local scale, peat initiation refers to the accumulation of the first organic deposits at this particular site, irrespective of its landscape position, i.e. the site could either be a development locus or become covered with peat through lateral expansion of one or more nearby loci.
Studies on the spatio-temporal dynamics of peat initiation and lateral expansion of peatlands appear to have focused mostly on boreal and circum-arctic peatlands, for example, in Scandinavia (Mäkilä and Moisanen, 2007; Edvardsson et al., 2014), Siberia (Peregon et al., 2009), Canada (Bauer et al., 2003), and Alaska (Loisel et al., 2013; Jones and Yu, 2010). During the past decades, several supra-regional to global syntheses were published that describe large-scale trends (Ruppel et al., 2013; Korhola et al., 2010; Macdonald et al., 2006; Crawford et al., 2003; Morris et al., 2018). So far, limited attention has been paid to the palaeogeographical development of the former extensive peat landscapes of the northwest European mainland (for an indication of their former extent, see, for example, Vos et al., 2020, and Casparie, 1993), with the exception of coastal and alluvial peatlands in the Rhine-Meuse delta (e.g. Berendsen and Stouthamer, 2000, 2001; Hijma, 2009; Cohen et al., 2014; Pierik et al., 2017). This is partly due to their large-scale disappearance following reclamation activities in the past few centuries (e.g. Gerding, 1995), leaving only small peat remnants behind in the current landscape. These remnants are under increasing threat of drainage (e.g. Swindles et al., 2019), pollution (e.g. Limpens, 2003) and locally continuing excavation. The exploitation of their scientific potential is therefore of poignant urgency.
In the range of studies where (boreal) peatland initiation and long-term lateral development are studied, methodologies can roughly be divided into three approaches. In the first category, lateral expansion rates are deduced using transects of basal dates and distance between dating points, but the palaeogeographical pattern of lateral development is not visualised (e.g. Almquist-Jacobson and Foster, 1995; Turunen et al., 2002; Anderson et al., 2003; Turunen and Turunen, 2003; Peregon et al., 2009; Robichaud and Bégin, 2009; Weckström et al., 2010; Loisel et al., 2013; Zhao et al., 2014). In the second category, transects of basal dates are manually converted to isochrones, i.e. lines of equal age that are deduced from the spatial distribution of obtained ages (Fig. 1b). The isochrones visualise the pattern and rate of lateral development (e.g. Bauer et al., 2003; Edvardsson et al., 2014; Foster et al., 1988; Korhola, 1994, 1996; Mäkilä, 1997; Mäkilä and Moisanen, 2007). As a third category, numerical peat growth models can be distinguished that are based on hydrological and ecohydrological feedbacks. These simulate vertical peat growth (age–depth) for a peat column (e.g. the Holocene Peat Model – Frolking et al., 2010; the DigiBog model – Baird et al., 2012, and Morris et al., 2012; and the coupled DigiBog-STREAM model – Swinnen et al., 2021). However, models that include lateral expansion are so far unavailable (see, for example, the discussion on peat models by Baird et al., 2012).
The use of transects of basal dates across a peatland is generally applied in areas where the natural extent of the peatland(s) under study is still intact. In regions where large areas of peatland have disappeared, the placing of such transects is questionable as the orientation of peat remnants within the former extensive peat landscape is unknown (Fig. 1c). Additionally, peat cutting (and ongoing excavation) may have damaged basal peat layers. Consequently, an adapted strategy is needed to collect (field) data from peat remnants. The number of studies that focus on peat remnants appears to be very low compared to studies of peatlands of which the extent is still intact (with some exceptions, e.g. the studies by Chapman et al., 2013, and Crushell et al., 2008).
Here we aim (1) to find explanatory variables within a digital soil mapping approach that allow us to reconstruct the pattern of peat initiation and lateral expansion within (and potentially beyond) peat remnants, and (2) to reconstruct peat initiation ages and lateral expansion for one of the largest bog remnants of the northwest European mainland, Fochteloërveen, in a former peat landscape of which the majority has been lost during the past centuries. The elevation of the Pleistocene surface relative to its surroundings is likely the primary control on the moment of peat initiation at Fochteloërveen: the lowest points in a region tend to grow over by peat first. However, as a secondary control, large-scale geomorphology may influence local wetness: locations that are situated relatively far from a draining river tend to have higher groundwater tables that come closer to the surface than locations adjacent to a river. Based on the hypothesis of a two-fold control of peat initiation as discussed above, we investigate the relationship between peat initiation age and three potential covariates: (1) total thickness of organic deposits, (2) elevation of the Pleistocene mineral surface that underlies the organic deposits, and (3) a constructed variable based on elevation of the mineral surface and hydraulic head. Covariate (1) is only useful where remnant peat survived, whereas covariates (2) and (3) are potentially useful for reconstructing peat initiation age beyond peat remnants. The Holocene period up to 900 cal BP (i.e. approximate start of the High Middle Ages in the study area) forms the temporal scope for our study because of increased human influence from then onwards (see Sect. 2.2).
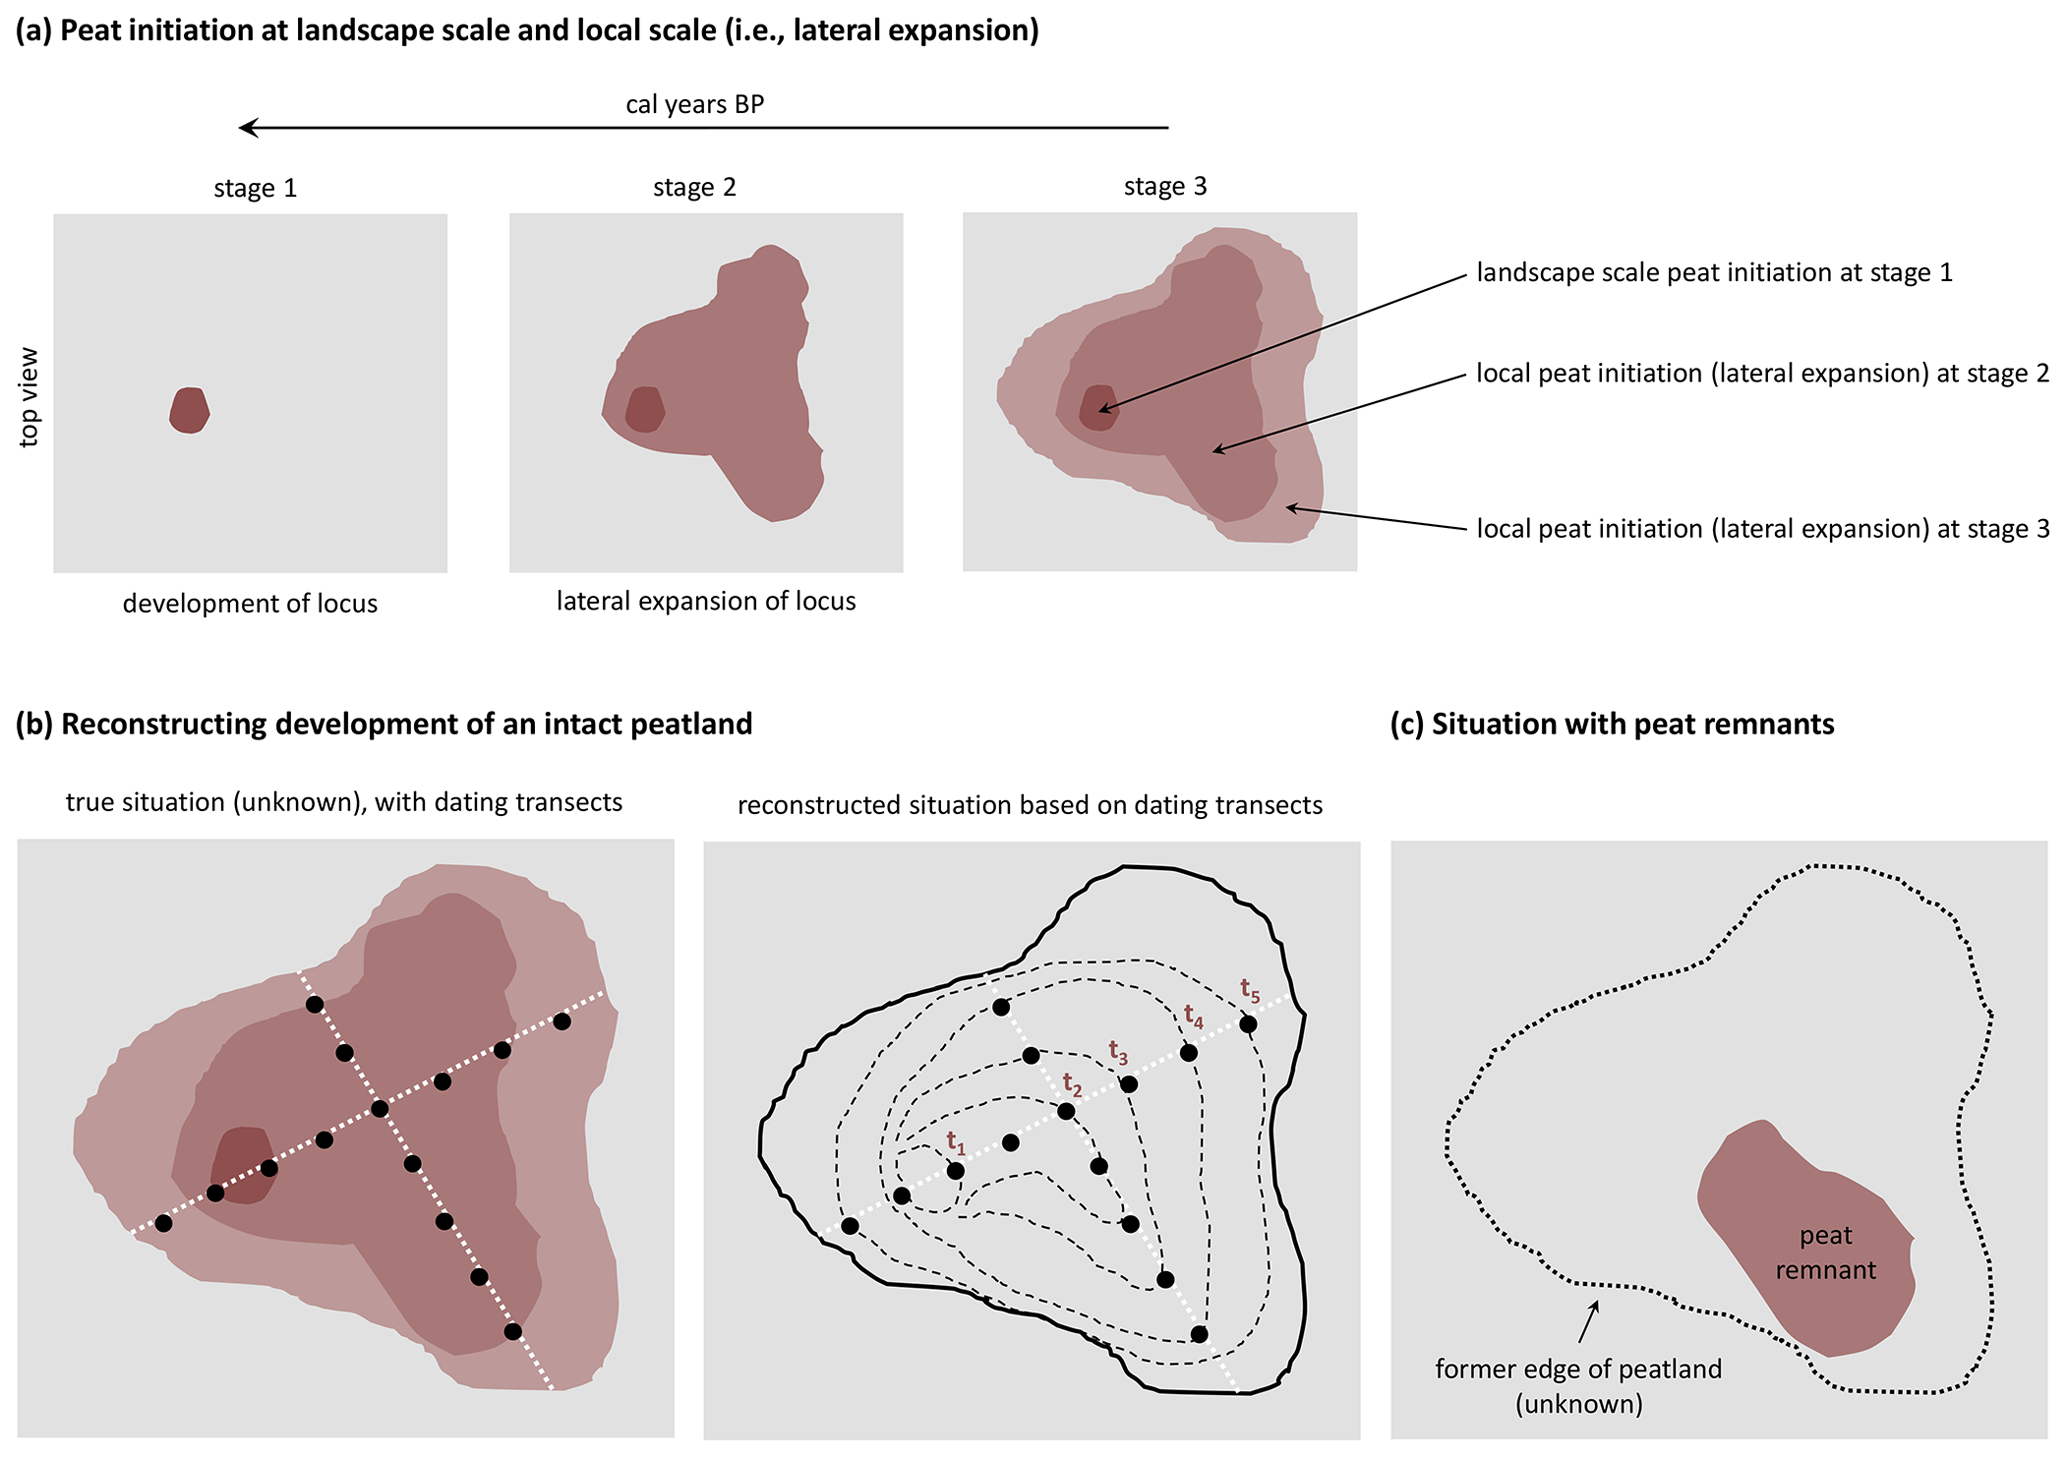
Figure 1Conceptual illustration of peat initiation and lateral expansion of peatlands. (a) Schematic top view of a landscape (peat is indicated in brown), showing the meaning of peat initiation at the landscape and local scales (redrawn from Quik et al., 2022). (b) Approach to reconstruct peat initiation and the pattern of lateral expansion using dating transects and isochrones for an intact peatland. (c) Situation when only remnants of the former peat landscape remain.
2.1 Selection and description of study area
The Fochteloërveen peatland in the Netherlands (Fig. 2) was chosen as case study area. Fochteloërveen (∼ 2500 ha) is the largest Dutch bog reserve (Joosten et al., 2017), and it is one of the largest bog remnants on the northwest European mainland. It was part of an extensive peat landscape (Fig. 2c) and is protected as a Natura 2000 area (Provincie Drenthe, 2016). The widespread occurrence of its mineral substrate and characteristic climatic conditions (see below) make this peatland area representative of larger parts of the northwest European mainland. Because of the availability of earlier obtained radiocarbon dating evidence (Quik et al., 2022) and detailed subsurface data from national databases, we consider Fochteloërveen as an ideal case study to investigate temperate peatland development. In addition, background information on peat initiation trends in the wider region is available from a recent study based on a large set of legacy radiocarbon dates (Quik et al., 2021). Various important archaeological finds have been done in the vicinity of Fochteloërveen, including a Mesolithic aurochs butchering site (Prummel and Niekus, 2011), wooden trackways from the Iron Age (Casparie, 1985), and a Roman-period settlement site that is assumed to have been deserted due to rising groundwater levels (Van Giffen, 1958).
In the north of the Netherlands, a continental ice sheet was present during the Saalian (OIS 6, oxygen isotope stage). This led to deposition of glacial till (Rappol, 1987; Rappol et al., 1989; Van den Berg and Beets, 1987; TNO-GSN, 2021a) on the Drenthe Plateau (Bosch, 1990; Ter Wee, 1972). Deposition of aeolian cover sands over northwest Europe during the Weichselian (OIS 4-2) resulted in the formation of the European Sand Belt (Koster, 1988, 2005). Cover sands occur with a thickness of approximately 0.5–2 m on the Drenthe Plateau (TNO-GSN, 2021b; Ter Wee, 1979). Fochteloërveen is located close to the western edge of the Drenthe Plateau. Below the cover sands, a discontinuous till layer with a thickness up to 3.5 m is present underneath the peat remnant (Provincie Drenthe, 2022). Fochteloërveen is part of three catchments (Fig. 2b). Currently, average temperatures are 2.8 ∘C in January and 17.5 ∘C in July, average annual rainfall amounts to 805 mm, and the potential evapotranspiration is 566 mm (KNMI, 2021). Throughout the paper, we indicate elevation in metres O.D., i.e. relative to Dutch Ordnance Datum (+NAP), which is roughly equal to mean sea level.
Fochteloërveen does not fit within a single definition or classification as it probably formed through coalescence of multiple smaller mires (see Results section of this paper) that formed on a non-coastal and non-alluvial topographic plain. However, in the hydromorphological classification (cf. Charman, 2002b), the resultant composite peatland can probably best be described as a plateau raised bog. Fochteloërveen started off as a fen (minerogenous mire) but later on transitioned to a bog (ombrotrophic mire) (more information below; Quik et al., 2022).
Biostratigraphical analyses by Quik et al. (2022) show that the vegetation was mesotrophic during peat initiation. This vegetation was dominated by sedges, with some presence of Juncus. Water tables fluctuated during the peat initiation process, and wetter and drier conditions probably alternated. Wildfires must have occurred regularly, as indicated by the frequent presence of charred plant remains. Conditions became more oligotrophic after the peat initiation process. The vegetation developed probably to an oligotrophic bog, with Calluna vulgaris, Erica tetralix and Sphagnum at two of the locations studied by Quik et al. (2022), and to a moss (Bryales) and heather vegetation at the third studied location.
The vegetation of Fochteloërveen is currently dominated by Sphagnum mosses occurring in a hummock and hollow topography (Provincie Drenthe, 2016). Species include, amongst others, S. magellanicum, S. papillosum, S. rubellum, and vascular species typical for ombrotrophic conditions such as Eriophorum vaginatum, Andromeda polifolia and Vaccinium oxycoccos. Fochteloërveen harbours several protected animal species, including the common ringlet (Coenonympha tullia), subarctic darner (Aeshna subarctica), smooth snake (Coronella austriaca), common European adder (Vipera berus) and a wide range of bird species. From 2001 onwards, crane birds (Grus grus) settled in the area (Provincie Drenthe, 2016). Since the 1980s, nature conservation is directed at peatland restoration (Altenburg et al., 2017; Provincie Drenthe, 2016). Main threats for nature conservation include atmospheric nitrogen deposition and desiccation due to intense drainage for surrounding agriculture.
2.2 Peatland development and decline in the (wider) study area
There is a hiatus between the deposition of cover sand during the Weichselian and the formation of peat in the cover sand areas in the eastern half of the Netherlands. This can be deduced from the occurrence of soil profiles in cover sand (e.g. podzols) underneath the peat and sometimes by the presence of bog wood (i.e. evidence of previous vegetation cover; Staring, 1983; Jongmans et al., 2013). Theories deviate on the timing when peat growth started in the cover sand landscape, on the period when these peatlands expanded and when they reached their maximum extent (Fig. 3). Note that in the text below, we repeat the “old” chronostratigraphic terms that were used in the cited papers. We have added calibrated Before Present (cal BP) ages to ease interpretation and comparison with the new formal subdivision of the Holocene (Walker et al., 2019).
The national palaeogeographic maps created by Zagwijn (1986) indicate that peat formation started during the Early Atlantic climatic period (∼ 7450 cal BP). By the Late Atlantic (∼ 6050 cal BP), large raised bog complexes had formed and reached their maximum extent. From then onwards, they remained laterally stable. Zagwijn (1986) placed the reaching of maximum extent in the Late Atlantic but indicates that the true timing remains uncertain due to lack of data as a result of peat cutting.
According to the recent palaeogeographic map series by Vos et al. (2020), peat initiation also started during the beginning of the Atlantic (∼ 7450 cal BP). However, the peatlands continued to expand gradually during the Atlantic and Subboreal and reached their maximum extent at the beginning of the Subatlantic (∼ 2450 cal BP). From ∼ 1500 CE (∼ 450 cal BP) onwards, the peat-covered area rapidly declines according to the map series by Vos et al. (2020) due to agricultural reclamation and peat-cutting activities. The national palaeogeographic maps are based on elaborate and detailed data on the development of river deltas and coastal areas in the Netherlands (Vos, 2015b). In contrast, the reconstructions of peatlands in the cover sand region have relatively large uncertainty as the amount of data on these areas is low (Vos, 2015a; Van Beek, 2009; Spek, 2004).
Few studies with regional palaeogeographical focus are available for Fochteloërveen and surroundings, but important exceptions include the work of Fokkens (1998) and Waterbolk (2007), who deduce patterns of peatland development based on archaeological find distributions. In doing so, Waterbolk (2007) deduces the presence of peat through the absence of archaeological finds, whereas Fokkens (1998) considers an approach using archaeological finds only as terminus-post-quem dates for peat initiation most appropriate (i.e. absence of finds is not used as an indication for presence of peat).
Waterbolk (2007) deduces that large areas were already covered by peat during the Early and Middle Neolithic (4900–2850 BCE; 6850–4800 cal BP). This situation remained stable for several thousand years. Rapid peatland expansion during the Iron Age, which Waterbolk (2007) linked to climate change as discussed by Van Geel et al. (1998), left the majority of the area uninhabited during the Roman period (19 BCE–450 CE; 1969–1500 cal BP). This is in contrast to the conclusions of Fokkens (1998), who assumed that (oligotrophic) peat on the plateau was largely absent during the Middle Neolithic (5000 cal BP), except for very local sites.
Until recently, radiocarbon dating evidence from a (near) basal peat layer was only available for a single site in Fochteloërveen (Klaver, 1981; later published by Van Geel et al., 1998), which indicated an age of 2920–2736 cal BP (at 95.4 % confidence interval). Fokkens (1998) mentions that this site represents the nucleus of the area, and consequently places peat initiation in the Fochteloërveen area between the beginning of the early Iron Age and the end of the Roman period (800 BCE–400 CE; 2750–1550 cal BP). He also assumes that the maximum extent was reached during this period. Waterbolk (2007) assumes that the peatland reached its maximum extent slightly later during the Early Middle Ages (450–1000 CE; 1500–950 cal BP), prior to the onset of systematic reclamation activities.
New dating evidence at three sites presented by Quik et al. (2022) indicates that within the boundaries of the Fochteloërveen nature reserve peat developed from ∼ 9000 cal BP onwards and that new areas became covered with peat at least until ∼ 3500 cal BP, suggesting that landscape-scale peat initiation occurred much earlier than suggested in the studies mentioned above (Vos et al., 2020; Fokkens, 1998; Waterbolk, 2007; Zagwijn, 1986). The substantial differences between the studies discussed above and the overview presented in Fig. 3 highlights the need to better constrain the timing of peat initiation and the period of lateral development in the cover sand landscape and at Fochteloërveen specifically.
Even though local peat cutting (i.e. on a household level) took place since the Middle Ages, large-scale reclamations of the Fochteloërveen area only started in the 17th century (Gerding, 1995; Douwes and Straathof, 2019). This happened mainly for turf production and lasted (in the last decades on a smaller scale) until the 1970s. In a large part of the area, superficial peat layers are affected by buckwheat cultivation, which was at its height in the late 18th and 19th centuries (Douwes and Straathof, 2019). However, this practice did not affect the basal peat layers that are of interest to our study. Data from the 18th century indicate that peat thickness at Fochteloërveen has locally declined by as much as 7 m during the past three centuries (Douwes and Straathof, 2019).
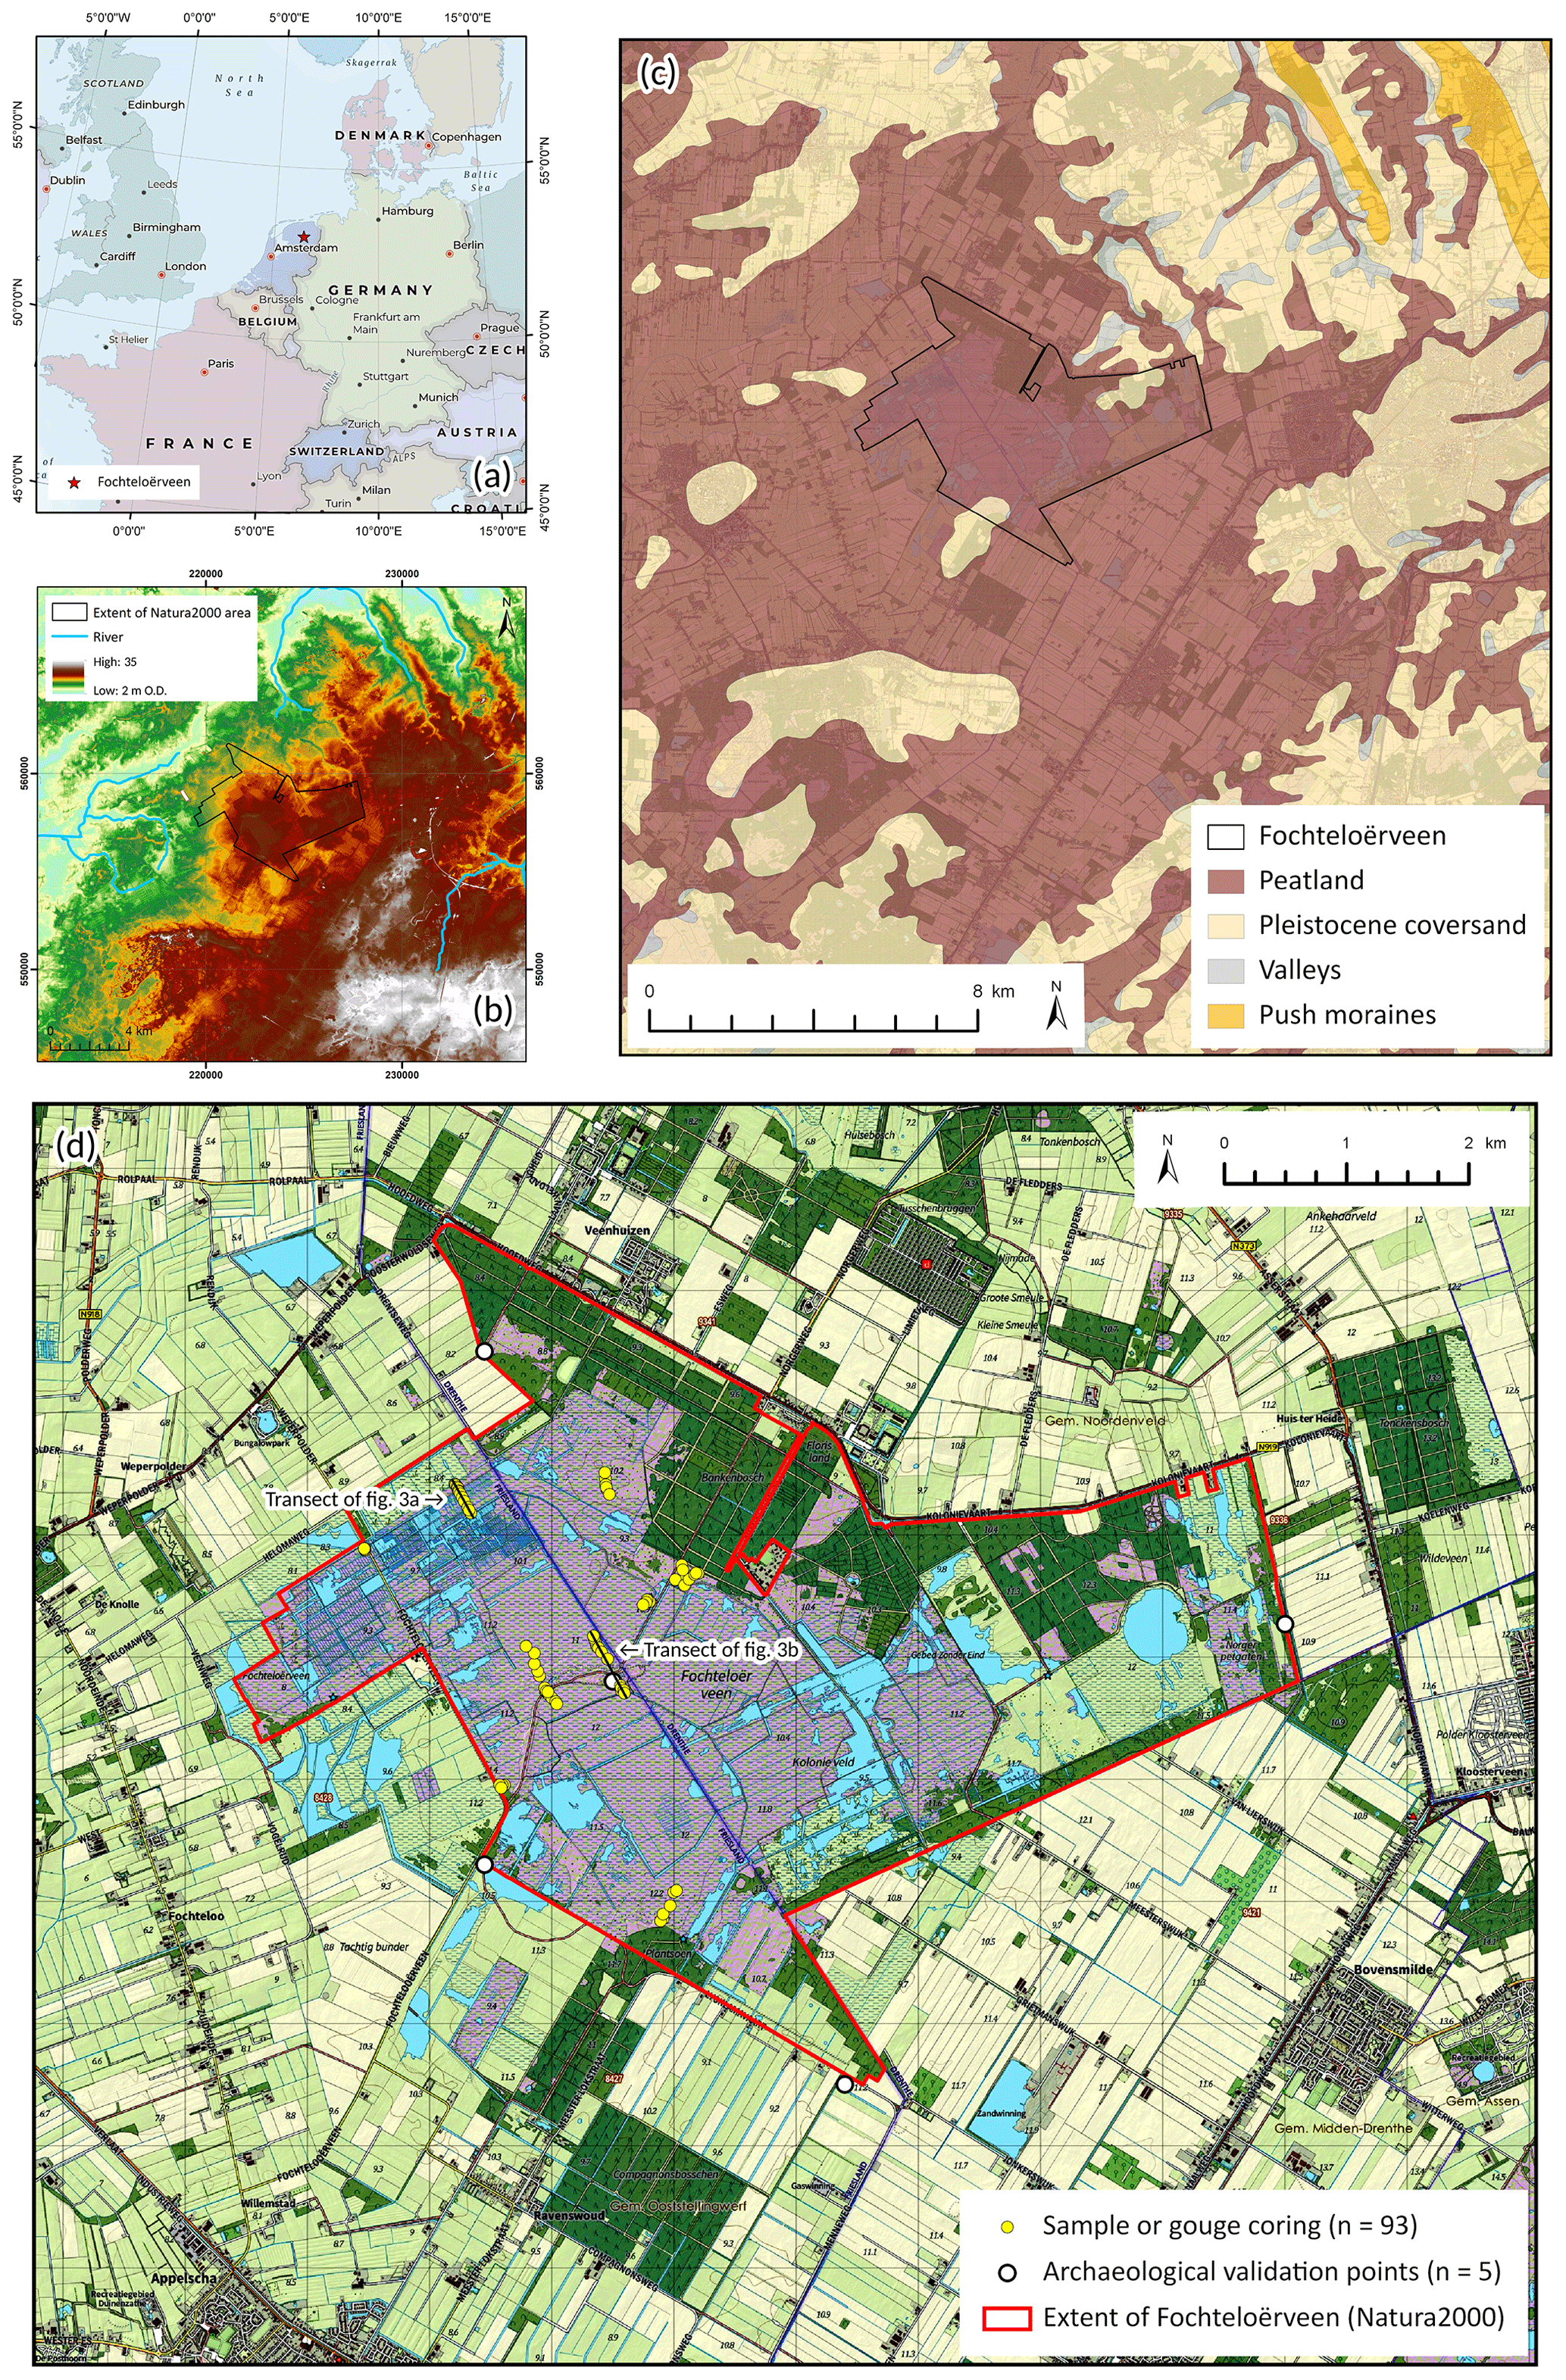
Figure 2(a) Location of the Fochteloërveen peat remnant within Europe (ESRI, 2022); (b) digital elevation model (DEM) of the wider area around Fochteloërveen (version AHN3, horizontal resolution 5 m, vertical resolution 0.1 m; AHN, 2021a, b), indicating the main drainage pattern (Ministerie van Verkeer en Waterstaat, 2007). Coordinates are in metres (Dutch RD-new (Rijksdriehoeksstelsel) projection). Extent of the Fochteloërveen Natura 2000 area is indicated (Ministerie van Economische Zaken, 2018); (c) palaeogeographical map of Fochteloërveen and surroundings, showing reconstructed situation for 500 BCE (2450 cal BP) as indicated by the Dutch national palaeogeographical map series (Vos et al., 2020; RCE, 2022); (d) topographical map of Fochteloërveen (OpenTopo; Van Aalst, 2022), showing coring locations (see Sect. 3.1.1 and 3.1.2) and position of archaeological validation points (for details see Table 2). Peatland is indicated with purple colours. The area surrounding Fochteloërveen shows the landscape structure that resulted from historical peat colonies, peat-cutting activities and agricultural reclamation.
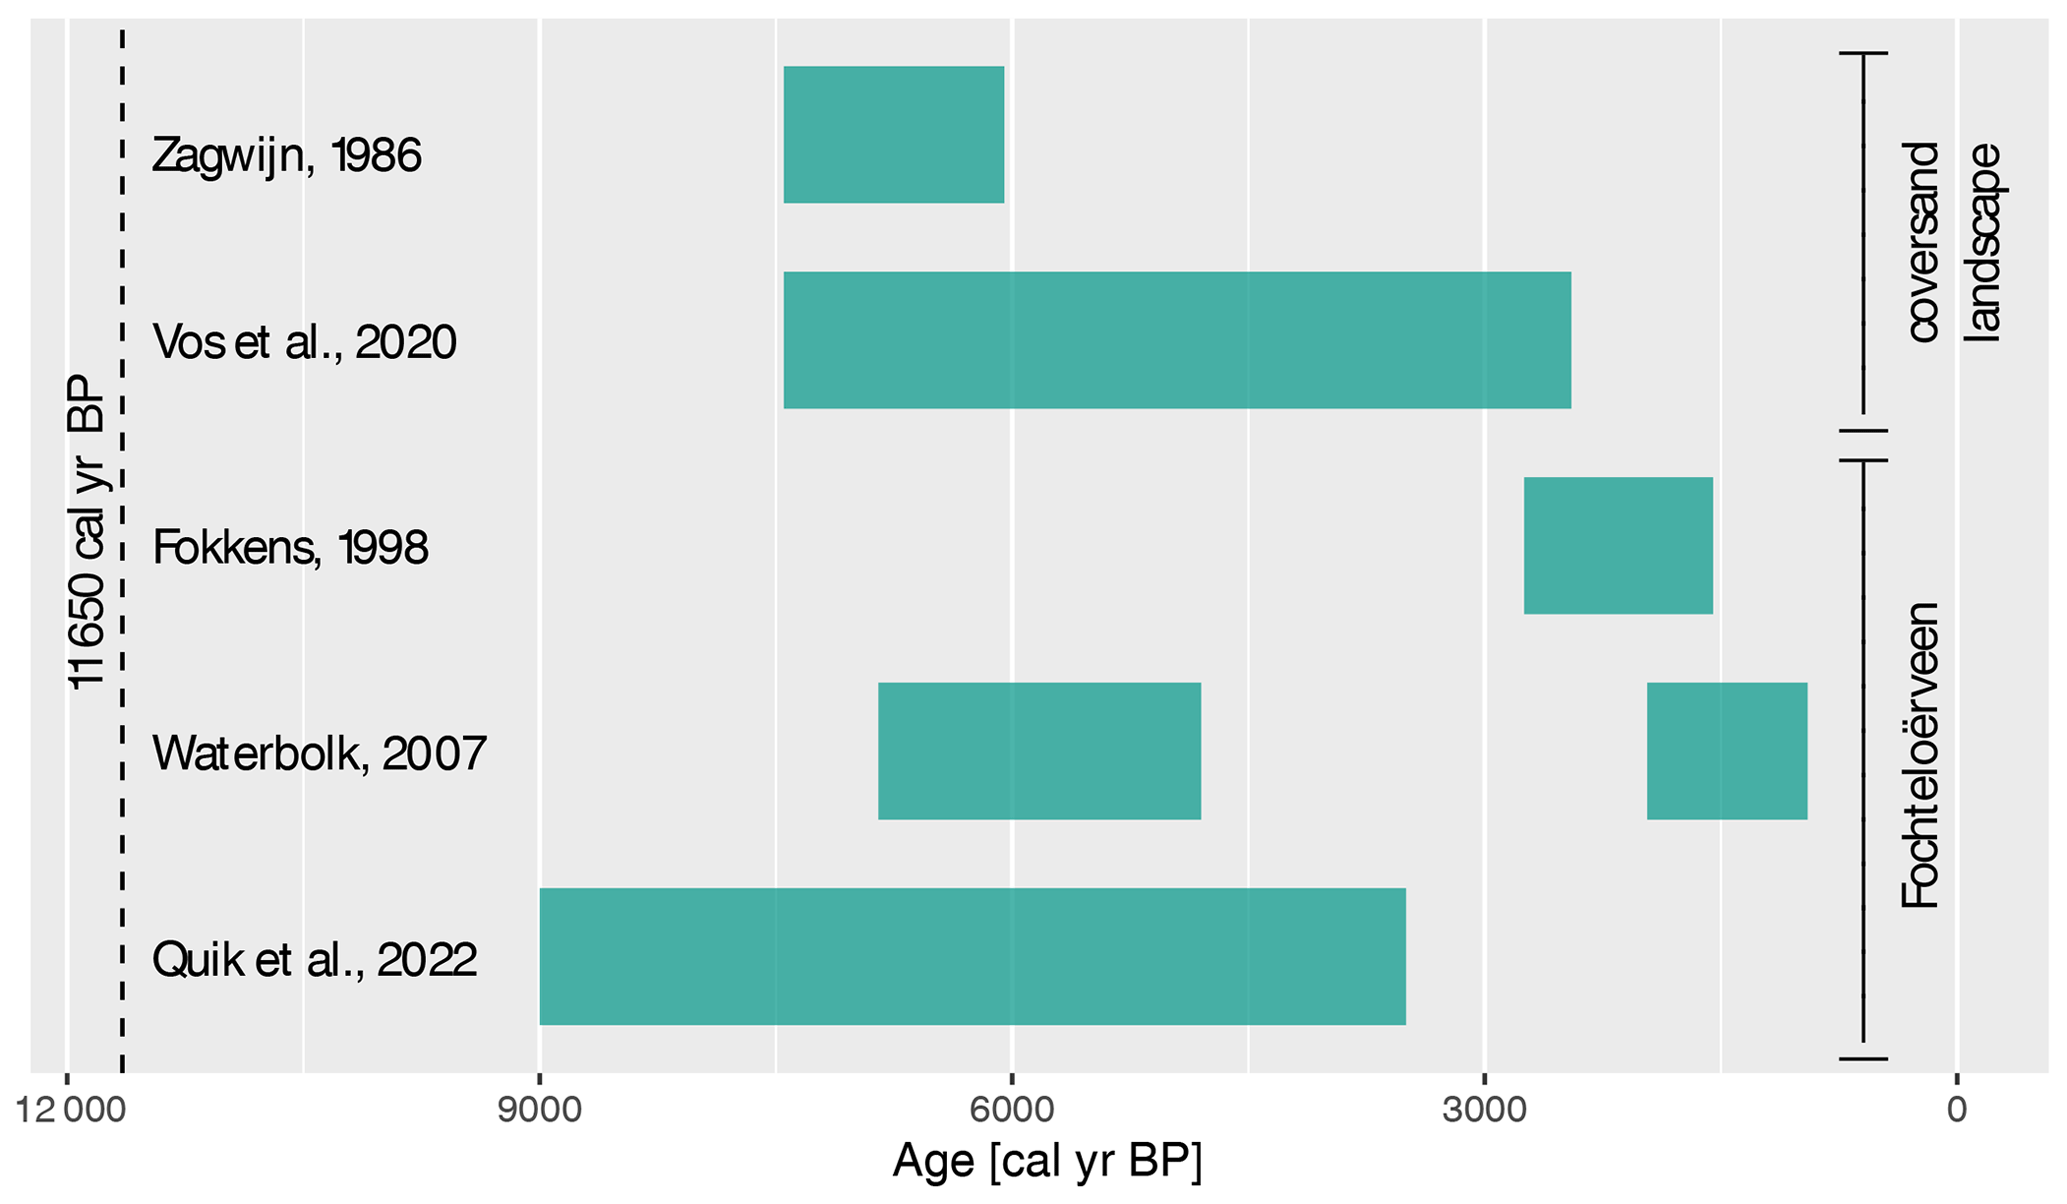
Figure 3Timing of peat initiation and period of lateral development in the Dutch cover sand landscape (upper two) and at Fochteloërveen specifically (lower three), according to different studies. The x axis is equal to Fig. 10, to ease comparison with the outcomes of the present study.
3.1 Methods part 1: collection of field data and radiocarbon dating evidence
3.1.1 Field approach and site selection
Our field approach is directed at obtaining an extensive set of basal radiocarbon dates, which forms the basis for subsequent modelling steps. Testing the influence of the elevation of the Pleistocene surface and large-scale geomorphology requires insight into both vertical and horizontal landscape dimensions within the Fochteloërveen peat remnant. Transects of basal peat dates are generally used for reconstructions of peat initiation and lateral development (Fig. 2b). In sea level research, where the focus is on the vertical dimension, it is custom to date basal peat samples that overlie compaction-free sediments where the groundwater level that steered peat growth can be related to former sea level (e.g. Törnqvist et al., 1998). To obtain the required insight into vertical and horizontal landscape dimensions at Fochteloërveen, we chose a hybrid approach that combines spatially distributed transects with elevation gradients in the (compaction-free) mineral deposits underlying the organic deposits (also see Chapman et al., 2013).
Our field exploration consisted of 93 gouge coring locations, mostly grouped in transects of 185 to 575 m long that were placed perpendicular to the elevation gradients of subsurface cover sand ridges and depressions (Figs. 2d and 4). At a few sites, a central gouge coring location was surrounded by four coring locations in a radial pattern to derive the subsurface topography. For each core, the stratigraphy was described (see Quik et al., 2022, for details). After the field exploration, 21 sites were selected for sampling, taking the distribution over the study area into account. Additionally, it was ensured that the combination of sample sites stretched the elevation range of the mineral surface underlying the organic deposits (samples cover an elevation range of 7.2–11.7 m O.D.). Collection and subsampling of cores, (bio)stratigraphical analyses, selection of dating samples, and radiocarbon dating procedures followed Quik et al. (2022) and are summarised in Sect. 3.1.2–3.1.4.
3.1.2 Collection and subsampling of cores
Cores were collected in 2019 with a hand-operated stainless-steel peat corer (Russian type) with a core volume of 0.5 dm3 (Eijkelkamp Soil & Water, 2018). Prior to sampling, the corer was cleaned with deionised water. After retrieving the core, it was carefully packaged in a PVC half-pipe and placed in a refrigerator at 3 ∘C within 12 h. Location and elevation of all sampling sites were recorded with a Topcon 250 Global Navigation Satellite System (GNSS) receiver, with a horizontal precision of ∼ 5 mm and vertical precision of ∼ 10 mm (RTK; TOPCON, 2017).
Directly after opening the cores, the stratigraphy was described (additional to field descriptions), and the approximate mineral-to-peat transition (following Quik et al., 2022) was determined through visual inspection. Around this transition, 6 to 12 contiguous 1 cm thick slices were cut from the core. Outer edges of these slices were carefully cleaned to avoid contamination. From each slice, a subsample of ∼ 2 cm3 was collected for loss-on-ignition (LOI) measurements; all remaining material (∼ 5 cm3) was reserved to select plant macrofossils for radiocarbon dating after subsample selection (see Sect. 3.1.3).
3.1.3 (Bio)stratigraphical analyses and selection of dating samples
The organic matter (OM) content was measured using loss on ignition. Sample dry weight was determined after drying for 24 h at 105 ∘C, followed by combustion at 550 ∘C. After obtaining the OM% for the range of slices cut from a particular core, the lowermost slice that contained ≥40 % OM was defined as the basal peat layer (following Quik et al., 2022). Charred and un-charred plant macrofossils (aboveground tissues) were selected at BIAX Consult in Zaandam, the Netherlands, for radiocarbon dating (Table 1). For 12 cores, radiocarbon samples were obtained from the basal peat slice. These basal dates form the calibration dataset for subsequent modelling (see Sect. 3.2). In addition, five radiocarbon samples were obtained from slices of five cores that represent terminus-ante-quem (TAQ) and terminus-post-quem (TPQ) dates for peat initiation (i.e. from slices with >40 % OM and slices with <40 % OM, respectively). The TAQ and TPQ dates are part of our validation dataset (together with archaeological validation data; see Sect. 3.2.3). A table with organic matter gradients, on which selection of dating samples is based, and a table with all encountered plant macrofossils (i.e. including material not selected for dating) are available online (see the “Data availability” section). For three additional cores, dating information of the basal peat layer is available from Quik et al. (2022).
3.1.4 Radiocarbon dating
Radiocarbon measurements were performed at the Centre for Isotope Research of the University of Groningen (the Netherlands). A full description of the methods used at this laboratory can be found in Dee et al. (2020); methods applied to our samples are only concisely explained below. Samples were either pre-treated using the acid–base–acid (n=9) method, or only with acid (n=5), or not pre-treated in the case of very small and delicate samples (n=3) (see the “Data availability” section for details per sample). Samples were measured using a MICADAS (MIni CArbon DAting System) accelerator mass spectrometer (Ionplus AG; Synal et al., 2007). Depending on sample weight after the pre-treatment, samples were measured as graphite in a regular batch (in the case of 1.0–2.5 mg C) in a batch for small-sized graphite samples (0.1–1.0 mg C) or measured directly as CO2 after combustion (<0.15 mg C). F14C and 14C ages were calculated according to the conventions (Stuiver and Polach, 1977). Results are corrected for isotopic fractionation using the δ13C value measured with AMS. Dates were calibrated using IntCal20 (Reimer et al., 2020) in the OxCal program (version 4.4; Bronk Ramsey, 1995).
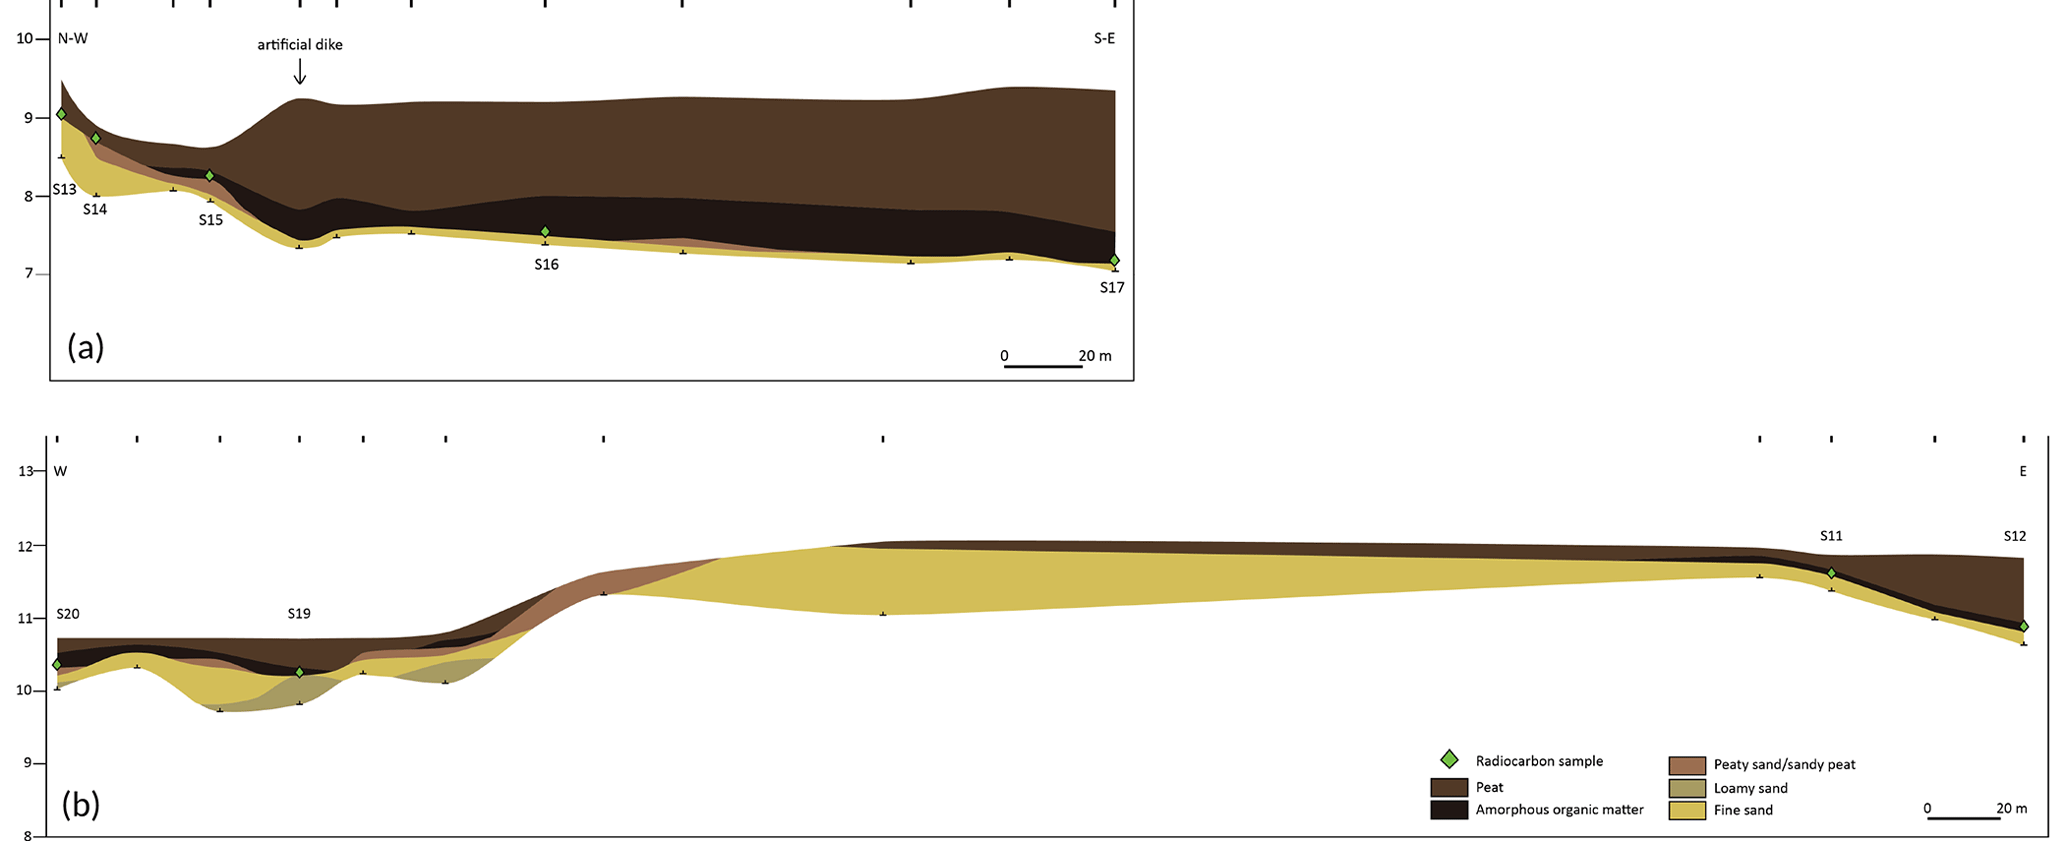
Figure 4Two cross sections showing example transects perpendicular to cover sand ridges underlying the organic deposits in the Fochteloërveen peat remnant. See Fig. 2 for location of the transects; (a) transect covering one side of a ridge; (b) transect covering both sides of a ridge. Corings are indicated with vertical bars at the top of each cross section. The numbers (of the format Sxx) refer to the sampling site codes (see Tables 1 and 3).
Table 1Overview of the aboveground plant remains that were selected for radiocarbon dating. When a number is given, this is the exact amount encountered; cf. = resembles, + = present, = frequent, and NA = not available.

3.2 Methods part 2: reconstructing peat initiation age spatially
3.2.1 Covariates and construction of covariate maps
The relationship with median peat initiation age was tested for (1) the total thickness of organic deposits [O], (2) the elevation of the Pleistocene mineral surface [zP] underlying the organic deposits, and (3) a constructed variable based on elevation of the mineral surface and hydraulic head, which captures the effect of groundwater-fed wetness that results from geomorphological position (Fig. 5). The latter covariate, denoted with zPH, is defined as the peat initiation height (i.e. the elevation of the Pleistocene mineral surface, zP) at location x minus the current hydraulic head () at location x.

Figure 5Schematic depiction of the covariates (O, zP, zPH). For explanation see Sect. 3.2.1.
Two Dutch national databases with subsurface data, managed by the Dutch Geological Survey (TNO-GDN), were consulted (see below) for the construction of the covariate maps. Geological coring data for a region surrounding Fochteloërveen (see extent of corings in Fig. 4a) were downloaded from DINOloket (DINOloket – TNO, 2022) and selected for the presence of peat or gyttja (n=485). In addition, information from gouge corings (n=71) and sample corings (n=21) from the fieldwork (see Sect. 3.1.2) was used. For each coring (total n=577), the elevation of the Pleistocene surface [zP] and total thickness of organic deposits [O] was registered (for geological corings, the sum was used of peat and gyttja if present). Using ArcGIS Pro (version 2.3.3), a palaeoDEM of the Pleistocene surface was interpolated based on the zP values through inverse distance weighing (IDW). In addition, a map of the total thickness of organic deposits was interpolated through IDW based on the O values. The resulting rasters have a resolution of 50 × 50 m and a support of ∼ 10 datapoints km−2.
For the current hydraulic head [], the map of the upper layer of the national hydrological model was downloaded from Grondwatertools (Grondwatertools – TNO, 2022), reflecting the phreatic groundwater level (the upper unconfined aquifer). This raster has a resolution of 250 × 250 m. To enable maps of peat initiation age with a 50 × 50 m resolution, the raster was resampled to 50 × 50 m and smoothed through focal statistics (using the mean with a neighbourhood of 3 × 3 cells). A zPH raster was calculated by subtracting the raster from the zP palaeoDEM. For each coring location (n=577), the value of zPH was obtained to be used in linear regression analysis (see Sect. 3.2.3). Covariate maps and a table with all used coring data are available online (see “Data availability” section).
3.2.2 Linear regressions and prediction maps of peat initiation age
Using R, the relationships between median peat initiation age and each of the three covariates [O, zP, zPH] were analysed with linear regression. Based on several checks (including the normality of the residuals, homoscedasticity, and leverage) the assumptions underlying linear regression were deemed valid for our data (results not shown but available through the R script; see “Data availability”). The three linear models were assessed based on their p value and adjusted R2; those with significant results were used for subsequent predictions of peat initiation age.
Using the linear models, covariate maps were converted to prediction maps of peat initiation age using the R “raster” package. The corresponding standard deviation maps were obtained from the limits of the prediction interval of the regressions. The resulting rasters were exported with the GeoTIFF format and opened in ArcGIS Pro (2.3.3). Values <900 cal BP were set to “No Data”. Isochrones (contour lines) with an interval of 1000 years were added to the map to show the pattern of modelled peatland expansion.
A histogram and density function of the predicted peat initiation ages were created to visualise the acceleration in lateral expansion through time. A cumulative density function was created to show the increase in peat-covered area through time within the boundaries of the Fochteloërveen peat remnant.
3.2.3 Assessment of modelling results
To evaluate the agreement between the predictions of peat initiation age, the resulting prediction rasters were subtracted from each other. In addition, predictions were evaluated using validation points consisting of radiocarbon dates of peat samples that indicate a terminus ante quem (n=3) and terminus post quem (n=2) for peat initiation and archaeological sites that indicate a terminus post quem for peat initiation (n=4; Fig. 2d and Table 2). Predicted peat initiation ages at the locations of validation points were obtained and compared with the TPQ/TAQ information of these points. To ease interpretations, the predicted ages and TPQ/TAQ validation ages were plotted in OxCal (version 4.4; Bronk Ramsey, 1995). Confidence intervals of the validation points are presented both as 1σ and 2σ intervals.
Table 2Archaeological validation points within the study area. Identification numbers can be used to obtain detailed find information from Archis III (Archis, 2019). Coordinates are in metres (Dutch RD-new (Rijksdriehoeksstelsel) projection). As the exact find location is not entirely certain, coordinates are only approximate. TPQ = terminus post quem, and TAQ = terminus ante quem. Ages in BCE are indicated with a minus sign.

4.1 Results part 1: collection of field data and radiocarbon dating evidence
A table with all collected coring data is available online (see “Data availability”). The dating results for the obtained samples from the cores are listed in Table 3. Both peat initiation dates and terminus-post-quem/terminus-ante-quem dates for validation are included. Ages range from 1650±40 BP (1690–1411 cal BP at 95.4 % confidence interval) to 8305±30 BP (9433–9142 cal BP at 95.4 %), indicating that the period of peat initiation and subsequent lateral expansion stretched over at least ∼ 7500 calendar years.
Table 3Dating results. NA = not available. All samples consist of charred or un-charred plant remains; only sample S20-M5 consists of the humic fraction. Samples are from 1 cm thick slices, apart from sample S7-M8_9 for which two slices were combined. More details of these samples are available online (see “Data availability”). Dating results for S17-M11, S18-M8 and S20-M5 are from Quik et al. (2022). IRMS = isotope ratio mass spectrometer.

4.2 Results part 2: reconstructing peat initiation age spatially
The linear regressions of median peat initiation age versus the total thickness of organic deposits [O] is highly significant (p value < ) and explains a reasonable amount of variation with an adjusted R2 of 0.57 (Fig. 6a). The linear regression of median peat initiation age versus the elevation of the Pleistocene mineral surface underlying the organic deposits [zP] has a p value of 0.09 and adjusted R2 of 0.14. Based on these values, this covariate was rejected for further analyses. For the third covariate that was tested, groundwater-fed wetness that results from geomorphological position [zPH], the linear regression has an adjusted R2 of 0.61 and is again highly significant (p value < ) (Fig. 6b).
The interpolated Pleistocene surface underlying the organic deposits ([zP], Fig. 7a) indicates that the mineral substrate covers an elevation range of 6–13 m O.D. The thickness of organic deposits ([O], Fig. 7b) varies from 0.0 to 3.5 m. Using the Pleistocene surface ([zP], Fig. 7a) and present-day hydraulic head ([], Fig. 7c), the covariate raster for groundwater-fed wetness that results from geomorphological position ([zPH], Fig. 7d) was calculated (see Sect. 3.2.1).
Using the covariate maps in Fig. 7b and d and the linear regressions in Fig. 6, the prediction maps of peat initiation age in Fig. 8 were generated. Standard deviations of the predictions are shown as insets in Fig. 8. The higher the standard deviation at a particular location, the less certain the prediction of peat initiation age is for that point. Lower certainty mainly occurs at points with a predicted peat initiation age ≥ 6000 cal BP and at points with an age of ≤1500 cal BP, as the number of datapoints above and respectively below these ages are limited (see datapoints in Fig. 7). Overall, both predictions in Fig. 8 show a similar pattern. The difference between both predictions, as shown in Fig. 9a, demonstrates that they deviate near the edge of the Fochteloërveen area and mostly in the northern part of the area. As this northern part is currently forested (see Fig. 2d), present-day groundwater levels may not reflect a natural pattern here, causing deviations in the prediction based on zPH. The validation points indicate that for the three terminus-ante-quem radiocarbon dates (Fig. 9b), which should be younger than the predicted peat initiation ages, two are indeed younger than the mean of the predictions and one is slightly older but falls within the 1σ confidence interval of the predictions. Of the terminus-post-quem radiocarbon dates (Fig. 9b), which are expected to be older than the predicted peat initiation ages, one has a comparable age as the mean of the predictions, and one is older than the mean of the predictions. Of the terminus-post-quem archaeological validation points (Fig. 9c), three are indeed older. One is younger than the mean of the predictions but still falls within the 2σ confidence interval for the prediction based on O and within the 1σ confidence interval for the prediction based on zPH. Overall, comparison with the validation points suggests validity of the predictions.
Loci of early peat initiation are distributed over the lower central, west and northwest parts of the Fochteloërveen area (Fig. 8a and b), indicating that landscape-scale peat initiation (see Fig. 1a) occurred simultaneously at multiple sites. The west and northwest loci are located on low-lying topography (≤ 7.0 m O.D.) of the Pleistocene surface (compare with Fig. 7a), but the loci in the lower central part of the area are located on somewhat higher ground (between 9.0 and 10.5 m O.D.). Even on the highest parts of the Pleistocene surface (between 12.0 and 13.0 m O.D.), both predictions indicate a peat cover from about 3000 cal BP onwards. This suggests that as the peat cover grew with time, even cover sand ridges that initially protruded above the peat landscape became covered with peat as time progressed. The distance between the isochrones in Fig. 8a and b indicates the rate of lateral expansion. Where isochrones are drawn close together, the peat cover expanded slowly. This is the case in the blueish coloured parts of the maps, pointing to initial slow expansion of peat initiation loci. Later in time the peat-covered area expanded more rapidly, with the strongest expansion between 5500–3500 cal BP (see Fig. 10c; 5500–3500 cal BP for the prediction based on O and 5500–3000 cal BP for the prediction based on zPH). Half of the Fochteloërveen area was covered with peat by ∼4000 cal BP according to the prediction based on O (Fig. 10c) and by ∼3500 cal BP according to the prediction based on zPH. Peat covered nearly the entire area by ∼ 2500 and ∼ 900 cal BP, respectively.
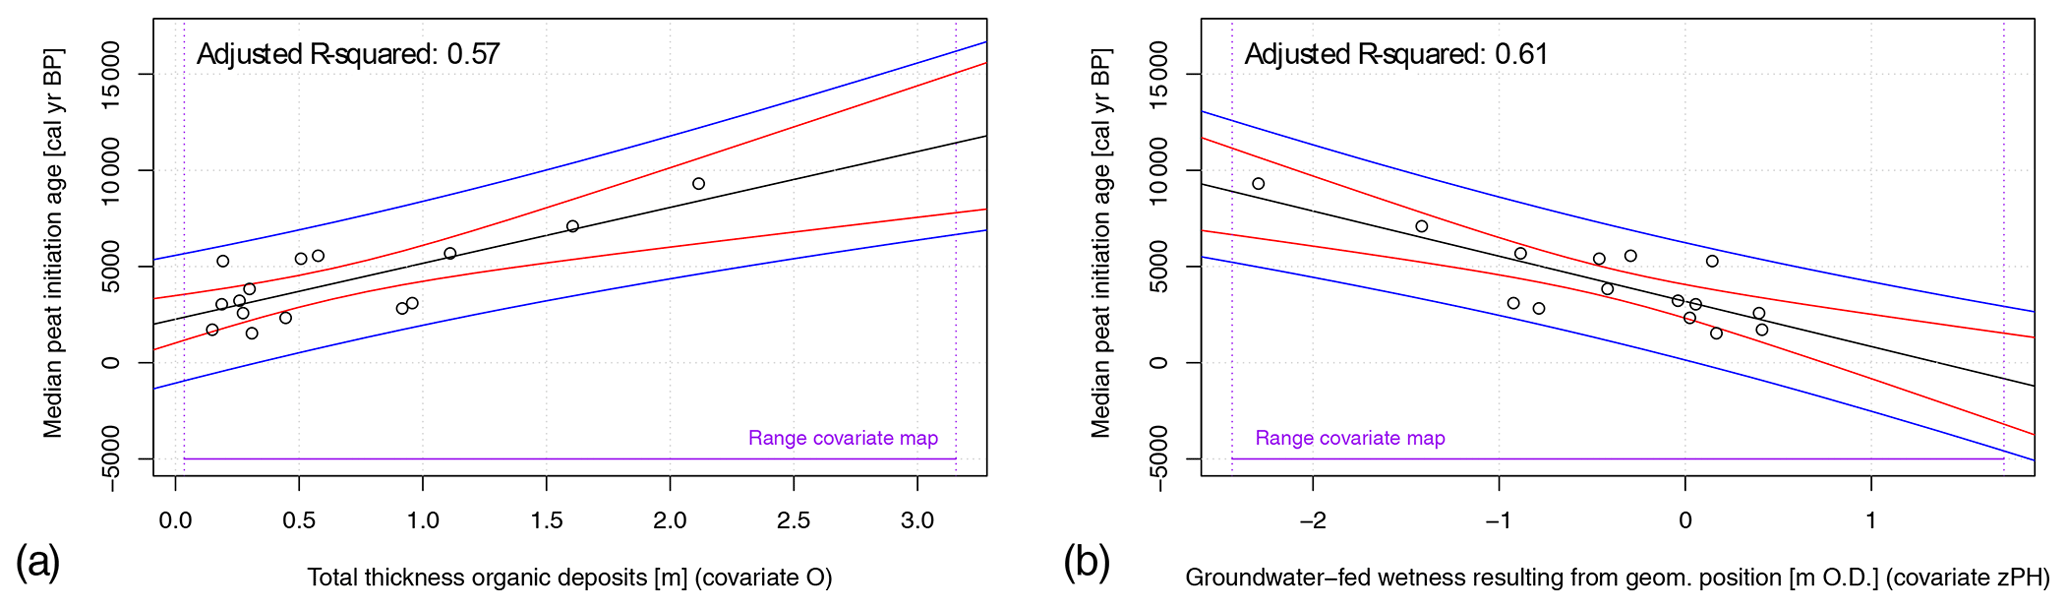
Figure 6Linear regressions, showing the relationships between median peat initiation age and (a) the total thickness of organic deposits [O] and (b) groundwater-fed wetness that results from geomorphological position [zPH]. Both regressions were significant with . Observations are indicated by the black circles. The regression line is shown in black; the 95 % confidence interval of the regression line is indicated in red, and the 95 % prediction interval is in blue. The range of the covariate maps is indicated in purple and also visible in Fig. 7b and d.
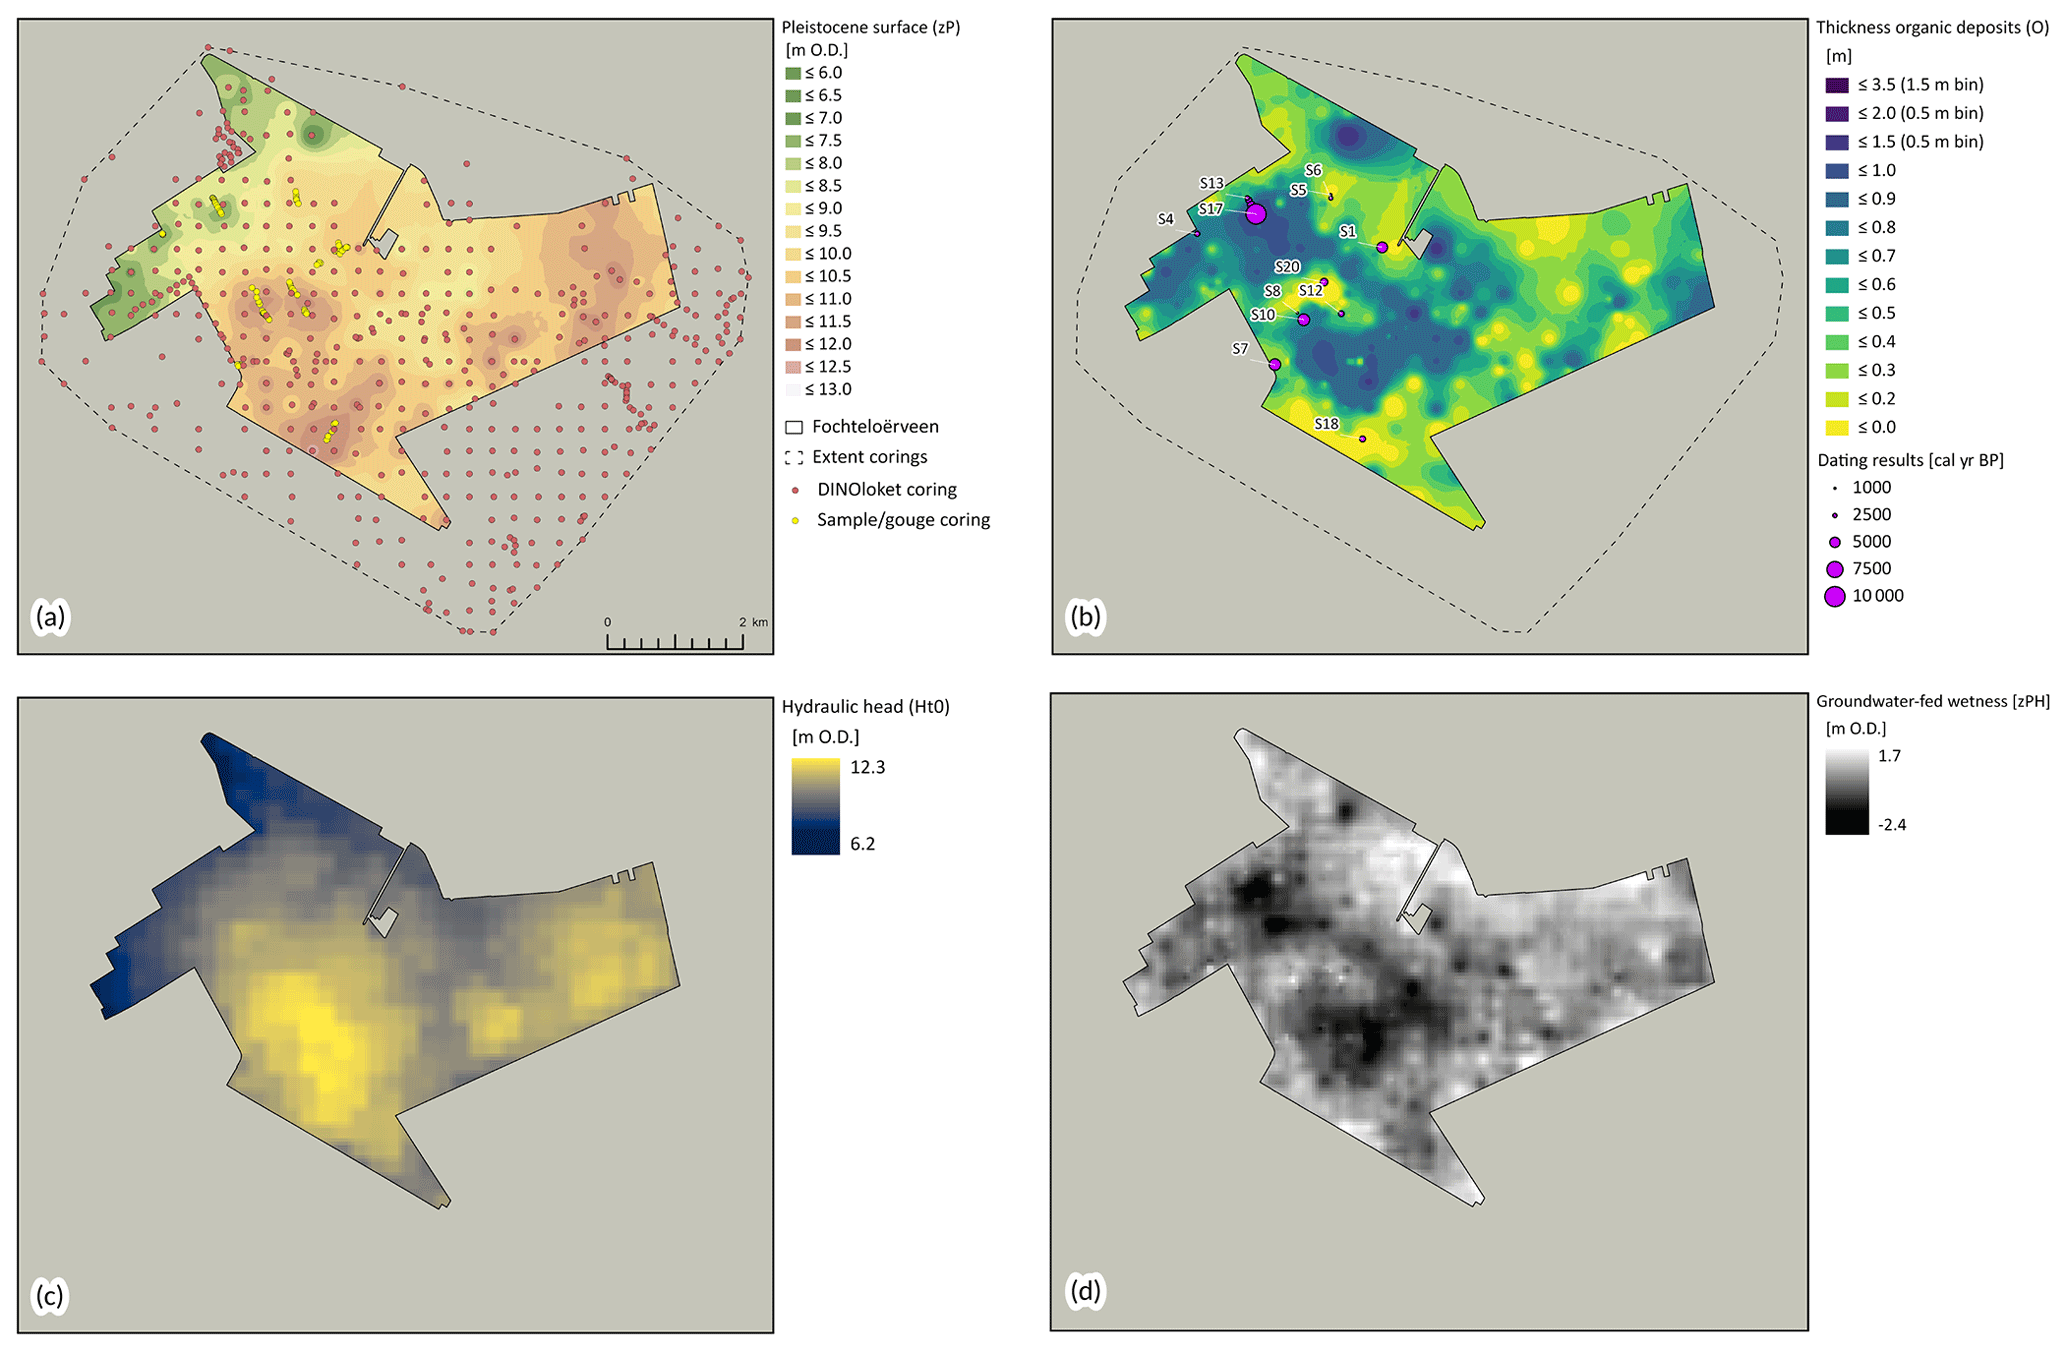
Figure 7(a) Interpolated elevation of the Pleistocene surface [zP] based on data obtained through sample/gouge corings and DINOloket corings (DINOloket – TNO, 2022). (b) Interpolated current thickness of organic deposits [O] based on data obtained through sample/gouge corings and DINOloket corings (DINOloket – TNO, 2022). Radiocarbon dates of basal peat samples show peat initiation ages (see Sect. 4.1). (c) Current hydraulic head [] based on the LHM model (Grondwatertools – TNO, 2022), resampled to 50 × 50 m and smoothed through focal statistics. (d) Groundwater-fed wetness that results from geomorphological position, calculated by subtracting the hydraulic head [] in (c) from the Pleistocene surface [zP] in (a). For further details on each map, see Sect. 3.2.1.
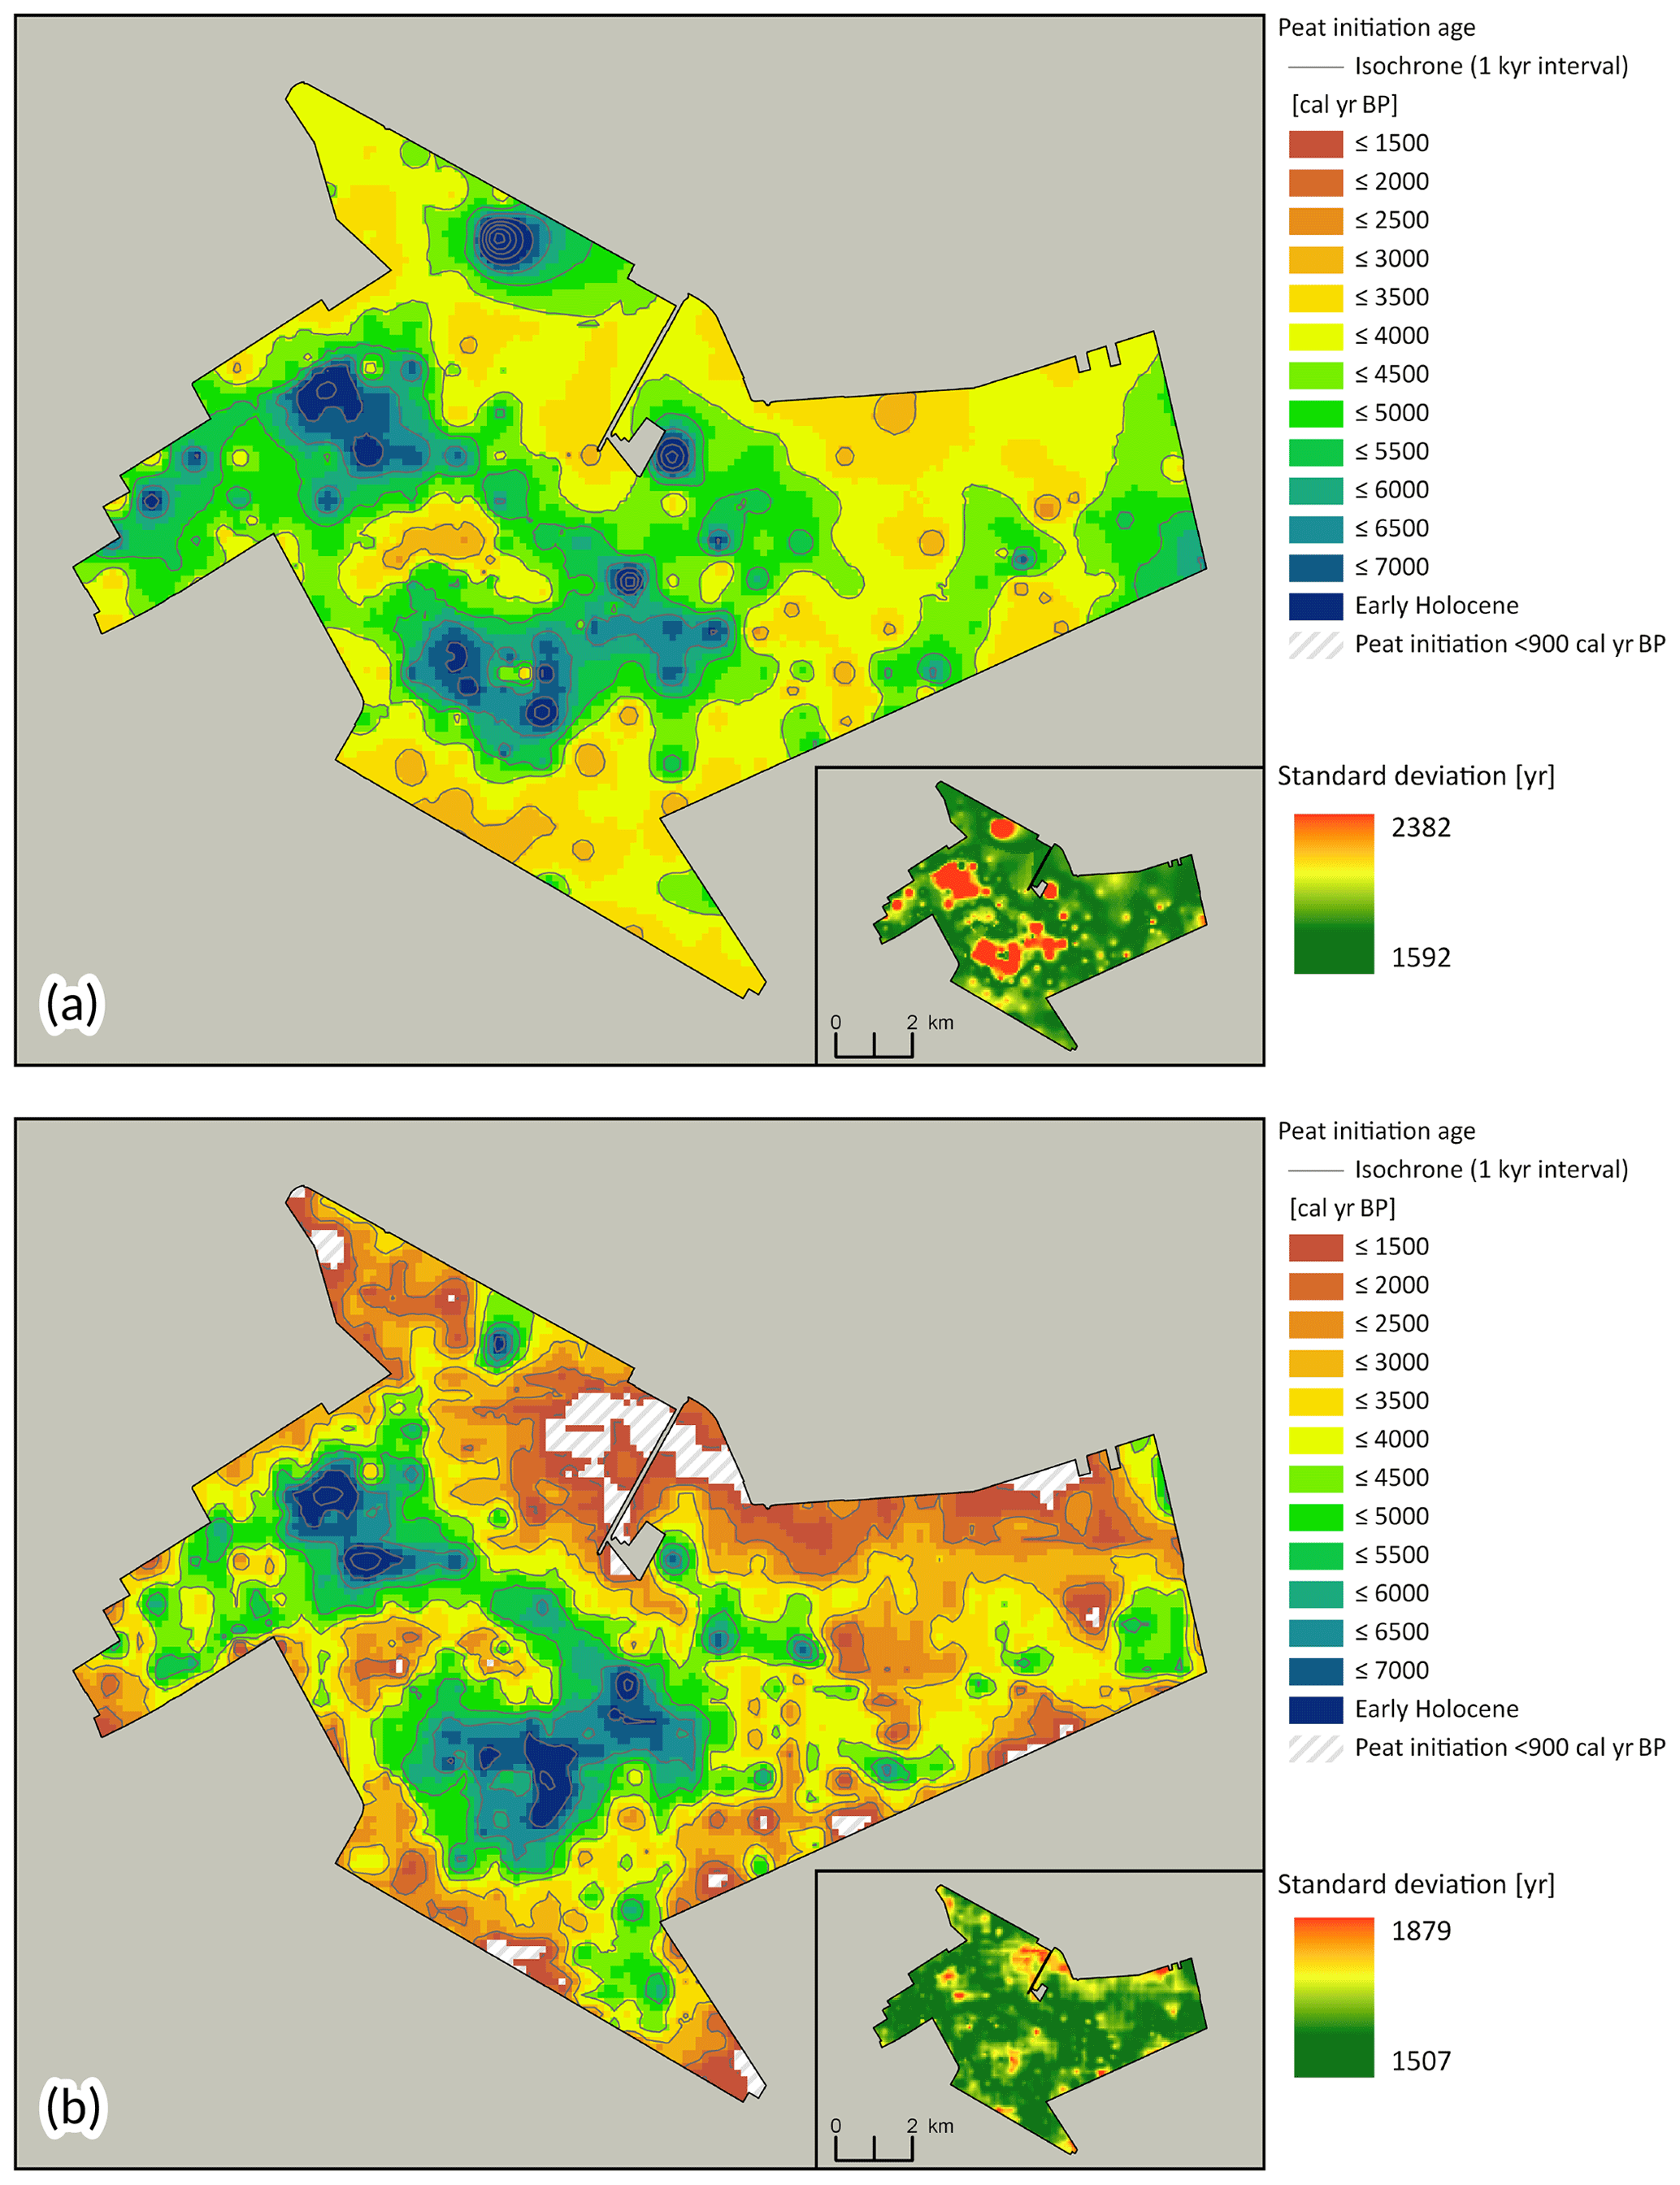
Figure 8(a, b) Reconstructed peat initiation ages for Fochteloërveen, with (a) based on thickness of organic deposits [O] (see Fig. 7b) and (b) based on groundwater-fed wetness that results from geomorphological position [zPH] (see Fig. 7d). Contours represent isochrones (lines of equal age) and have an interval of 1000 years. Note that peat initiation age legends are equal, but legends of the standard deviation of the prediction differ.
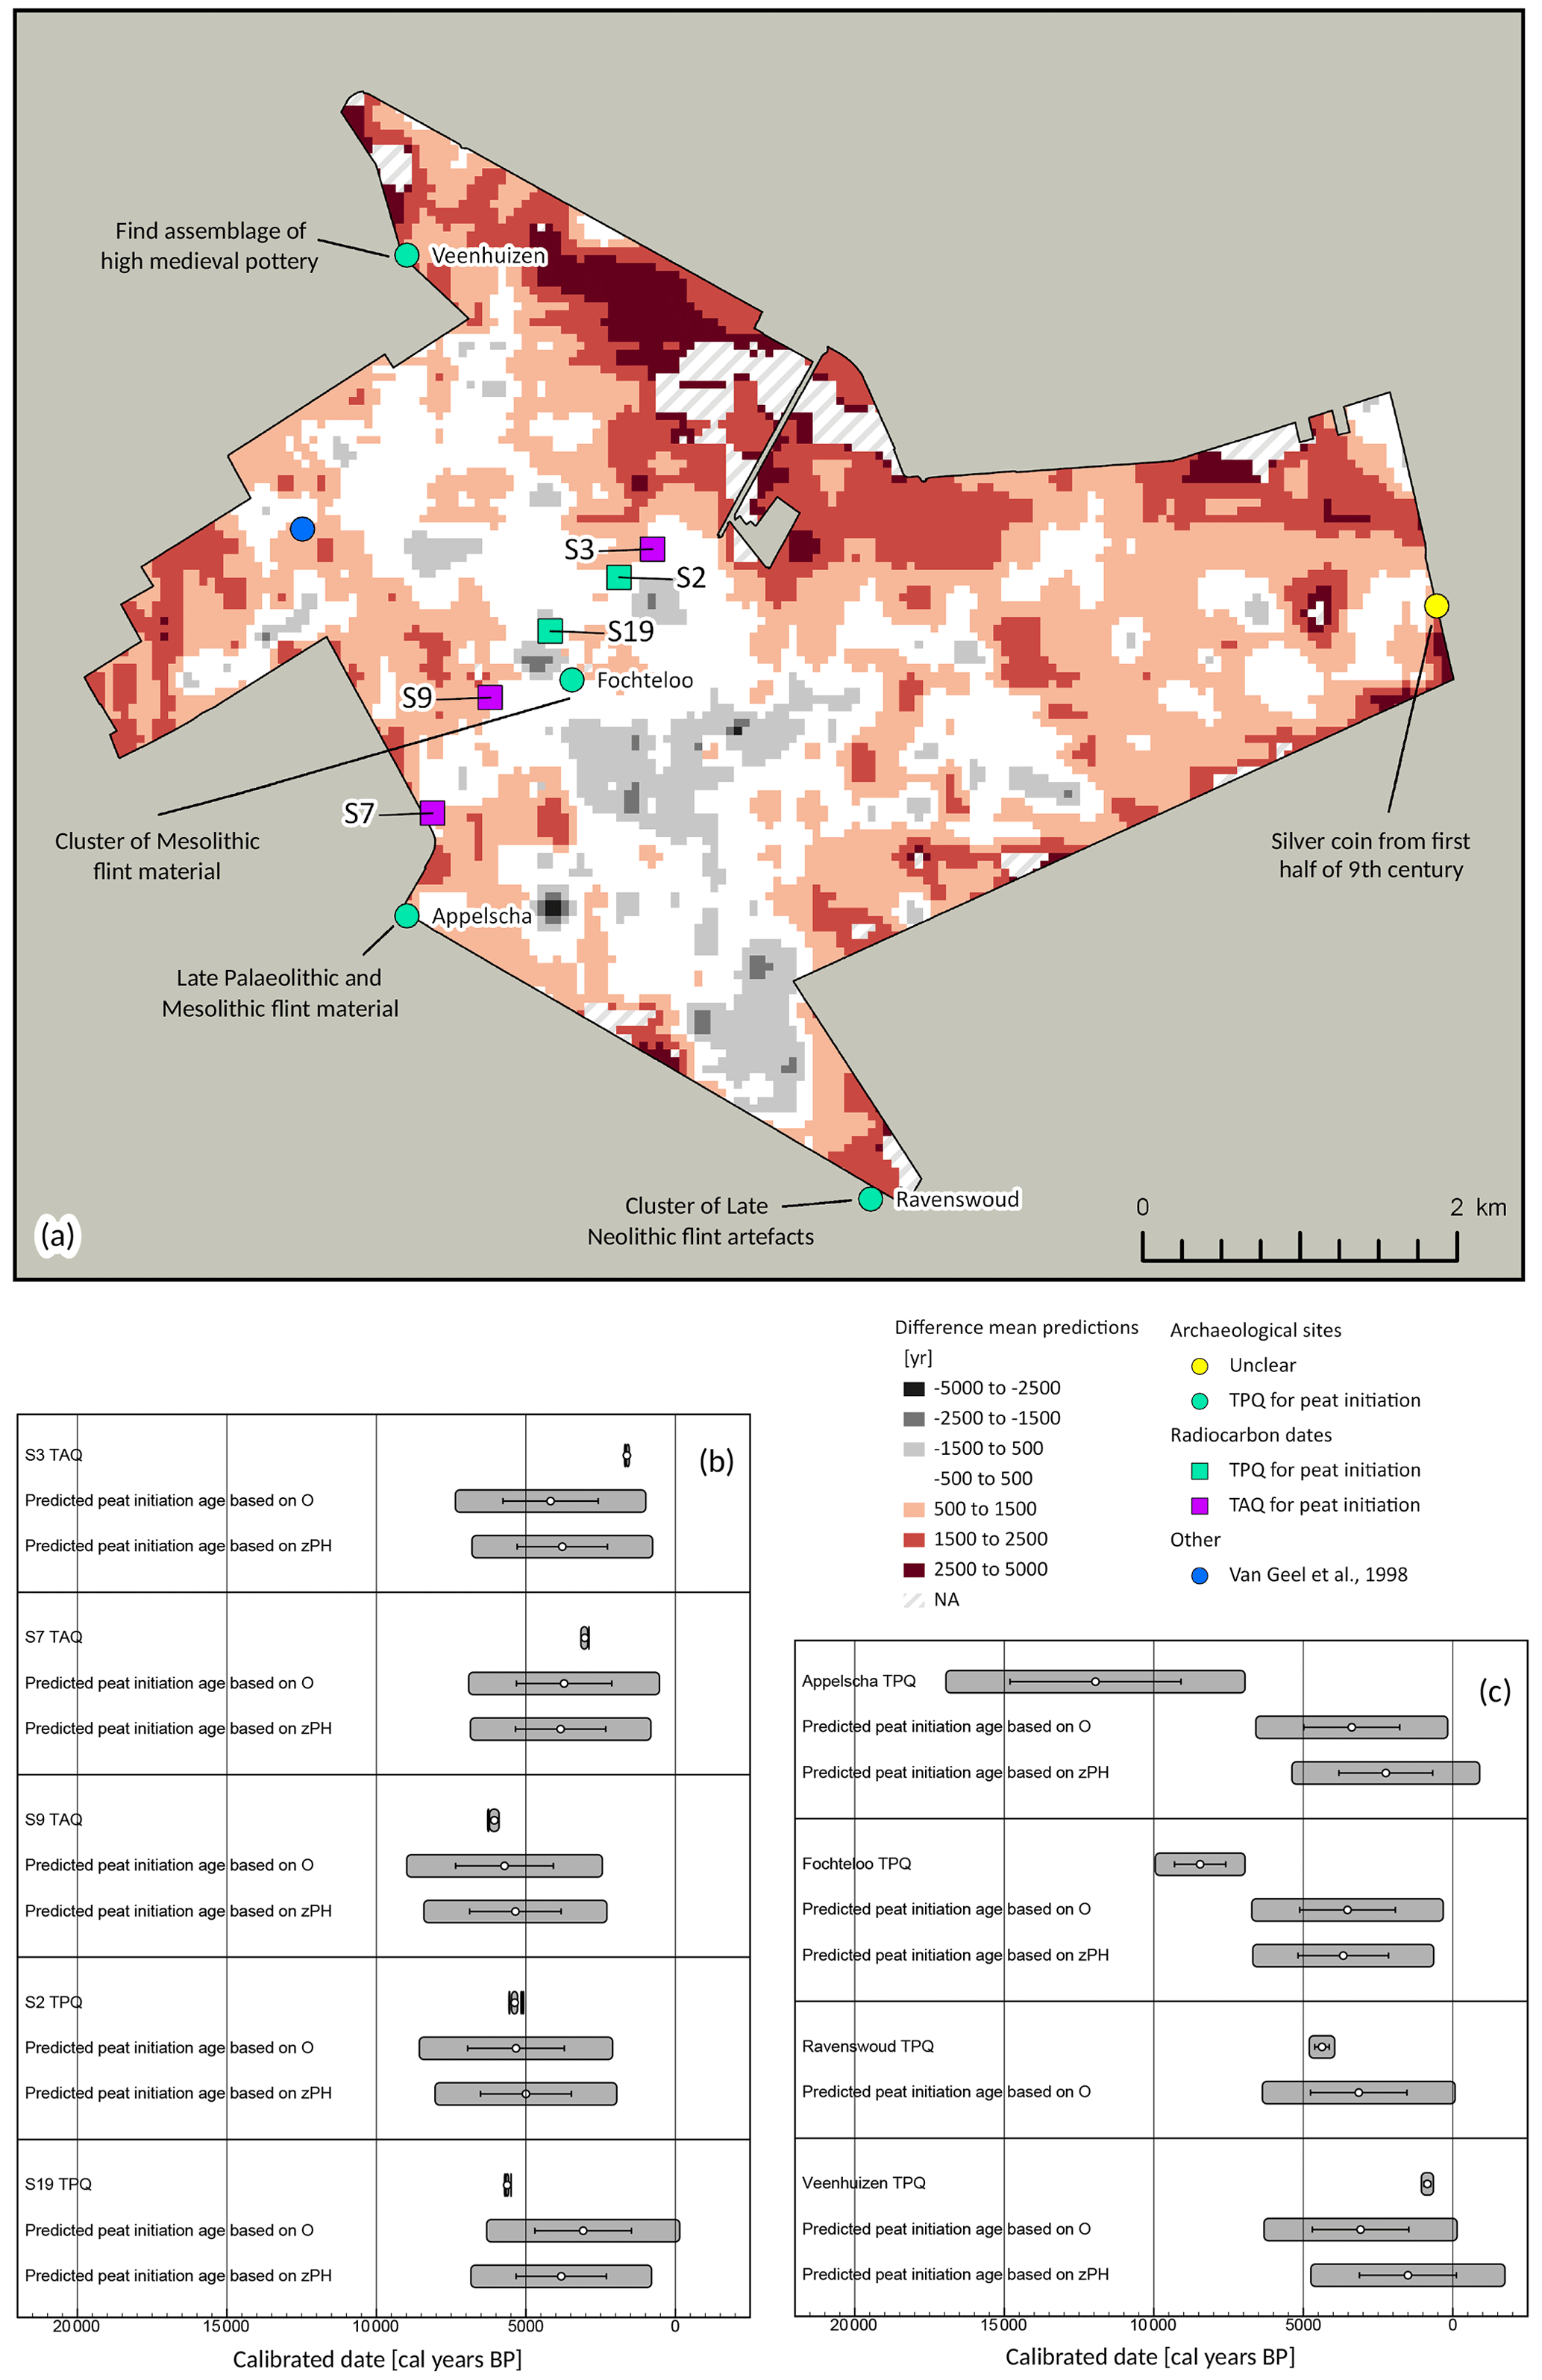
Figure 9(a) Difference between the mean predictions of peat initiation age in Fig. 8a and b (i.e. prediction of Fig. 8a minus prediction of Fig. 8b). The locations of the validation points (of which results are presented in b and c) are also indicated on this map (for further details on the archaeological sites, see Table 2). In (b) and (c) validation points are compared with the predicted peat initiation age as predicted by both covariates (i.e. each validation point is compared with the prediction of Fig. 8a and with the prediction of Fig. 8b). The central circles show the mean, bars indicate 1σ confidence interval, and grey-coloured blocks indicate the 2σ confidence interval. Note that terminus-ante-quem validation points should be older than the prediction, whereas terminus-post-quem validation points should be younger (see Sect. 4.2). (b) Validation points consisting of radiocarbon dates of peat samples that indicate a terminus ante quem (n=3) and terminus post quem (n=2) for peat initiation. (c) Validation points consisting of archaeological sites that indicate a terminus post quem for peat initiation (n=4; for one archaeological site the relationship with peat growth is unclear; therefore, this site was not included here; see Table 2 for details).

Figure 10(a) Histogram of predicted peat initiation ages for Fochteloërveen, showing results for the prediction based on thickness of organic deposits [O] (see Fig. 8a) and for the prediction based on groundwater-fed wetness that results from geomorphological position [zPH] (see Fig. 8b). Start of the Holocene follows Walker et al. (2009). Temporal scope of the predictions runs to 900 cal BP. Note that certainty of both predictions is different (see standard deviation maps in Fig. 8a and b). (b) Density plot of predicted peat initiation ages for Fochteloërveen (i.e. normalised to a graph surface area of one). (c) Plot showing cumulative fraction of peat-covered area within the Fochteloërveen area as indicated by the two predictions.
Here we discuss peat initiation and lateral expansion at Fochteloërveen as indicated by our predictions (Sect. 5.1), followed by an evaluation of our approach (Sect. 5.2).
5.1 Peat initiation and lateral expansion at Fochteloërveen
Peat initiation results from terrestrialisation, paludification and/or primary mire formation (Charman, 2002a; Rydin and Jeglum, 2013b). As the substrate in the study region has been deglaciated and exposed at the surface since the penultimate Glacial (OIS 6, see Sect. 2.1), primary mire formation is not the case here. The question then remains whether peat initiation resulted from paludification or terrestrialisation (or both). Gyttja is often found at the base of terrestrialisation sequences. We did not encounter gyttja in the gouge and sample corings of the field survey, but in part of the DINOloket coring descriptions gyttja is mentioned. However, interpretation and terminology of the amorphous peat layer (highly humified; sapric cf. IUSS Working Group WRB, 2015; see Table 2 in Quik et al., 2022) that is regularly found near the bottom of peat deposits may differ. The lithology of this layer can be described as peat with blackish-brown colouring, greasy consistency and very few recognisable plant remains. Depending on definitions used, it is plausible that in the DINOloket corings reference is made to a similar facies as the amorphous peat layer with the term gyttja. Proximity of some of the DINOloket corings with gyttja in the description to our sample corings with an amorphous peat layer suggests that both terms refer to the same layer. As this layer does not meet the requirements of true gyttja (an organic lacustrine deposit) according to Bos (2010) and Bos et al. (2012), we conclude that peat initiation in the study area was largely caused by paludification, i.e. waterlogging of previously unsaturated sediments. Note that we used an OM percentage of 40 % to define peat based on Quik et al. (2022), which is important to keep in mind for comparison of results with other studies.
Trophic status is used in many peatland classification systems. Reference can be made to the current trophic status (suffix “trophic”) and to trophic status during peatland initiation (suffix “genous”) (Charman, 2002b). Geogenous or minerogenous conditions indicate that a peat-forming vegetation receives groundwater or surface runoff, i.e. water that has been in contact with mineral soil. Ombrogenous conditions are present when a peat-forming vegetation receives water solely from precipitation (Rydin and Jeglum, 2013a; Charman, 2002b; Joosten and Clarke, 2002; International Peatland Society, 2022). The water source during formation of the organic deposits at Fochteloërveen could be deduced from the botanical data (Table 1; more information online, see “Data availability”). Of the peat initiation samples, five can be classified as geogenous, nine as transitional from geogenous to ombrogenous and only one as truly ombrogenous. This suggests that peat initiation was strongly influenced by groundwater and surface runoff and only to a limited degree by perched groundwater tables that result from precipitation and poor drainage caused by impermeable (sub)surface layers (i.e. glacial till which can be found close to the surface, see Sect. 2.1).
The weak linear relationship between elevation of the Pleistocene mineral surface and peat initiation age (p value = 0.09, adjusted R2=0.14) shows that not all basal peat layers of equal elevation are of the same age. In contrast, the relationship between peat initiation age and groundwater-fed wetness that results from geomorphological position is highly significant (p value < , adjusted R2=0.61). This demonstrates that the influence of groundwater in initiating peat growth at Fochteloërveen cannot be explained solely by elevation, but it is strongly related to groundwater-fed wetness resulting from position within the large-scale geomorphology of high topographic plains and incised valleys. Sea level was rising during the entire period of peat development at Fochteloërveen (Meijles et al., 2018). As a result, the isohypse pattern gradually rose through time.
Transects of basal peat dates are useful to distinguish development loci from lateral expansion areas (e.g. Mäkilä, 1997; Mäkilä and Moisanen, 2007; Chapman et al., 2013). At Fochteloërveen, landscape-scale peat initiation (Fig. 1) occurred simultaneously at multiple sites (Fig. 8). Some of the loci of peat initiation are located at positions that are lower compared to surrounding topography (areas of accumulated flow or sinks). Our predictions indicate that even cover sand ridges eventually became covered with peat (Fig. 8), suggesting that lateral expansion was not slope-limited in this area or below its threshold. The pattern (Fig. 8) and pace (Fig. 10b and c) of lateral expansion show that after initial slow lateral growth of peat initiation loci, lateral growth accelerated. The strongest expansion occurred between 5500–3500 cal BP.
Some of these findings are contrasting with previous palaeogeographic reconstructions by Fokkens (1998), Waterbolk (2007) and Vos et al. (2020). Fokkens (1998) placed peat initiation in the Fochteloërveen area between the beginning of the early Iron Age and the end of the Roman period (800 BCE–400 CE; 2750–1550 cal BP). This is much later than our dating results (Table 1) and predictions (Fig. 8) demonstrate. Waterbolk (2007), on the other hand, assumes that large areas were already covered by peat during the Early and Middle Neolithic (4900–2850 BCE; 6850–4800 cal BP). This is roughly in agreement with our results; according to our predictions, half of the Fochteloërveen area was covered with peat by ∼ 4000 cal BP (Fig. 10c). However, Waterbolk (2007) concludes that this situation remained stable for ∼ 3000 years followed by rapid peatland expansion, which left the area largely abandoned by the Roman period (19 BCE–450 CE; 1969–1500 cal BP). This is in strong contrast with our findings, which do not indicate a period of stability that precedes further lateral expansion. In the national-scale reconstructions by Vos et al. (2020), it was assumed that peatlands expanded gradually until they reached their former maximum extent, but the authors indicate that this is mainly due to a lack of data. Our results demonstrate that peat loci at Fochteloërveen probably expanded in a non-gradual fashion, with a phase of accelerated lateral expansion between 5500–3500 cal BP (Fig. 10b and c).
Ruppel et al. (2013) analysed an extensive dataset of basal radiocarbon dates reflecting both peat initiation and lateral expansion in northern Europe and in North America. Their data on lateral growth demonstrate that the expansion of existing peatlands accelerated between approximately 5000–3000 ka, both in northern Europe and in North America (Ruppel et al., 2013). Similarly, Korhola et al. (2010) found that high-latitude peatlands in Europe expanded most drastically after 5 ka. Our data fit within this large-scale trend as they indicate a phase of accelerated lateral expansion at Fochteloërveen between 5500–3500 cal BP (Fig. 10b and c). Ruppel et al. (2013) suggest that this trend may be related to neoglacial cooling (Wanner et al., 2008).
In a core from Fochteloërveen studied by Klaver (1981) and Van Geel et al. (1998), a radiocarbon date of a plant macrofossil sample collected near the visual mineral-to-peat transition indicated an age of 2920–2736 cal BP (95.4 % confidence interval, uncalibrated age of 2690±50 BP; core location indicated in Fig. 9a). Based on this and a comparison with several other regions, Van Geel et al. (1998) infer an influence of the 2.8 ka event where a change in climate results in peat initiation on previously unsaturated soils. However, our predictions of peat initiation age (Fig. 8) indicate that the site studied by Van Geel et al. (1998) probably became covered with peat through lateral expansion and does not reflect landscape-scale peat initiation (Fig. 1). An effect of the 2.8 ka event does not become clear from our results (Fig. 10).
5.2 Evaluation of approach
Palaeogeographical studies of former extensive peat landscapes are challenging as vast areas have lost their former peat cover, affecting the natural archive formed by the peat and thus limiting the options for collecting field data (Fig. 1b and c). Consequently, alternative approaches are needed to reconstruct peatland development on the northwest European mainland and other areas where peat is poorly preserved. Our field strategy consisted of spatially distributed transects that were placed perpendicular to elevation gradients in the mineral subsurface underlying the organic deposits. This resulted in an extensive set of basal radiocarbon dates that stretches both the lateral and vertical dimensions of the Fochteloërveen peat remnant and as such formed the basis for subsequent modelling steps. This approach was found useful when options for transects covering a whole peatland (as in Fig. 1b) are hampered by limited a priori knowledge on the position of peat remnants within the former peat landscape (Fig. 1c). The availability of coring data within national databases (see Sect. 3.2) was highly useful for constructing a palaeoDEM of the Pleistocene mineral surface underneath the organic deposits. For areas where comparable data are not available, the sampling scheme may need to be expanded as it must also provide sufficient data for interpolation to a palaeoDEM (for examples where basin morphometry is studied, see Anderson et al., 2003; Bauer et al., 2003; Chapman et al., 2013).
To reconstruct peat initiation age for non-sampled sites within the peat remnant, we applied a digital soil mapping approach. For data-intensive approaches such as geostatistics (Oliver and Webster, 2014) or random forests (Breiman, 2001), the amount of data (specifically radiocarbon dates) is generally too low. Therefore, a digital soil mapping technique was needed that is less data intensive. In our study, we found linear regression to be the best option as it involves only few assumptions, which were valid for our dataset.
Advantages of this approach are that it is spatially explicit (i.e. results in a map of predicted peat initiation ages), and it offers a quantitative alternative compared to manual deduction of isochrones from transects of basal dates (e.g. as in Bauer et al., 2003; Foster et al., 1988; Korhola, 1994, 1996; Mäkilä, 1997; Mäkilä and Moisanen, 2007). In addition, our approach allows for a quantitative evaluation of the prediction using the standard deviation and comparison of predicted ages with validation points.
To the best of our knowledge, digital soil mapping approaches have so far hardly been explored for reconstructing peat initiation and lateral expansion. An important exception is the work of Chapman et al. (2013), who made use of second-order polynomial regression to reconstruct peat initiation ages based on empirical relationships between basal peat age and DEM derivatives for two remnants of a floodplain raised mire (Thorne and Hatfield Moors, UK). They tested relationships between peat initiation age and (1) elevation, (2) proximity to river courses, and (3) flow accumulation. Similar to our results, they found a weak relationship between peat initiation age and elevation (R2 values of 0.15 and 0.20 for linear and second-order polynomial regression respectively (p value not reported) compared to an adjusted R2 of 0.14 and p value of 0.09 for the linear regression in our study). Proximity to rivers also yielded a weak relationship, whereas flow accumulation produced an R2 of 0.39 for linear regression and of 0.91 for second-order polynomial regression. Hence they apply the second-order polynomial relationship with flow accumulation as covariate to reconstruct peat initiation ages for their study area. Unfortunately, they do not provide an indication of certainty of their prediction but do compare the prediction result with five validation points. Based on the relationship with flow accumulation, they conclude that peat growth initiated in the area at locations where surface runoff accumulates and resulted in a terrestrialisation process.
In our study, we reasoned with two points in mind and used a combination of process-informed choices within a statistical approach. Firstly, we hypothesised that peat initiation at Fochteloërveen would be subjected to a two-fold control consisting of elevation and position within the large-scale geomorphology of high topographic plains and incised valleys. Secondly, we valued a covariate that is independent of peat presence or thickness, as this may have the potential to estimate peat initiation age for areas that are no longer covered by peat. Based on the assumption that the current isohypse pattern within the Fochteloërveen peat remnant reflects the isohypse pattern of the past (but in the past positioned at lower elevation due to lower sea level), we constructed the variable zPH based on elevation of the mineral surface and present-day hydraulic head. This covariate then allows us to explain peat initiation with groundwater-fed wetness that results from geomorphological position.
As stated above, in our model based on zPH, we assume that the current isohypse pattern reflects the natural situation as it was once present in the area (but with the pattern as a whole currently positioned at higher elevation). Within the boundaries of the Fochteloërveen peat remnant, this assumption is largely true, as nature conservation measures require high groundwater tables. In addition, hydraulic conductivity within the area is not subjected to change (i.e. for the deposits underneath the peat). However, as groundwater levels in the surrounding area are much lower due to artificial drainage, an edge effect is probably present near the border of the peat remnant. This is reflected in the prediction map of peat initiation ages based on zPH in Fig. 8b, which shows much younger ages near the edges (especially in the north) compared to the prediction map based on O in Fig. 8a. This is also suggested by the modelling results if we would not hold on to our temporal scope with 900 cal BP as limit. In that case, the zPH model predicts that peat near the edges of Fochteloërveen is of very recent age and locally even later than 0 cal BP (i.e. these are otherwise set to “No Data”). However, a historical map of 1664 CE indicates that peat was probably present at these locations (Pynacker, 1664). We encountered a comparable problem during an exploratory attempt to reconstruct peat initiation ages outside the peat remnant, which results in peat initiation ages that are likely too young. This shows that to obtain a reliable prediction, the method requires the isohypse pattern to reflect the natural pattern as closely as possible, and cannot predict peat initiation ages for areas that are subject to strong artificial drainage.
Our model based on total thickness of organic deposits [O] is based on the concept that the thicker the organic deposit, the longer ago peat initiated at that location. This is of course dependent on peat growth rates, decay rates and degree of compaction. However, despite these complicating factors, our regression model of peat initiation age versus total thickness of organic deposits is highly significant (p value < ) and has a decent fit (adjusted R2=0.57). We made use of newly collected and existing coring data to obtain thickness values, which reflect the thickness of the peat layer that is still present. If the natural peat thickness (from before the onset of reclamations and peat cutting) would be known, perhaps the fit would increase further.
Where remnant peat survived, covariate O is useful and may provide an estimation of the peat initiation age based on the thickness of the remaining peat layer. Covariate zPH is potentially useful for reconstructing peat initiation age beyond peat remnants, given that the data on which this covariate is constructed reflect the natural situation. A combination of both may offer new options to reconstruct peatland development within and beyond peat remnants. For the zPH model, this requires data on the natural topography of the mineral surface that used to be covered with peat (where peat is lost, the mineral surface may have been subject to levelling activities) and on the natural isohypse pattern. If this pattern could be derived for the region surrounding a peat remnant using hydrological modelling, the zPH model could provide insights into peatland initiation and lateral development for areas where this information cannot be collected from the field. It is important to keep in mind that complicating factors may have played a role during peatland development, for instance, where peat growth in valleys changes regional base level or where the formation of peat domes affects drainage divides. As peat may be largely absent outside (protected) peat remnants, options to obtain radiocarbon dates to verify model results are probably very limited. Another option would be to use TAQ and TPQ dates obtained from archaeological data. In the example of Fochteloërveen, the surrounding area contains a fairly large number of archaeological finds which could offer a regional-scale validation dataset.
Reconstructions of peat initiation and lateral expansion in areas where the former peat cover is largely lost, such as the northwest European mainland, are severely hampered by the limited options for collecting field data. In this study we aim (1) to find explanatory variables within a digital soil mapping approach that allow us to reconstruct the pattern of peat initiation and lateral expansion within (and potentially beyond) peat remnants, and (2) to reconstruct peat initiation ages and lateral expansion for one of the largest bog remnants of the northwest European mainland, Fochteloërveen in the northern Netherlands. Basal radiocarbon dates that were obtained from the peat remnant formed the basis for subsequent analyses. Significant relationships were found between peat initiation age and total thickness of organic deposits and between peat initiation age and a constructed covariate on groundwater-fed wetness based on the present-day hydraulic head relative to the mineral palaeosurface underneath the peat cover. In contrast, a weak relationship was found between peat initiation age and elevation of the mineral palaeosurface. These findings indicate a strong influence of position within large-scale geomorphology (high plains and incised valleys) on peat initiation at Fochteloërveen. The digital soil mapping approach based on thickness of organic deposits is only useful where remnant peat survived, whereas the constructed covariate on groundwater-fed wetness may ultimately be applied beyond the limits of peat remnants. Thereby, this novel approach has the potential to shed light on the pattern, timing and pace of peatland initiation and lateral expansion in areas where this information can no longer be obtained from the field. For Fochteloërveen, our results indicate simultaneous peat initiation at several loci during the Early Holocene and continuous lateral expansion until 900 cal BP. Lateral expansion accelerated between 5500–3500 cal BP.
All data from this study are available at the 4TU.ResearchData; Quik et al. (2023, https://doi.org/10.4121/20237958).
RvB secured funding for this research. CQ proposed the research outline and adjusted it based on discussions with JHJC, YvdV, JW and RvB. JHJC and CQ explored the study area, performed test corings and decided upon a coring strategy. CQ organised the fieldwork and completed the collection of data and cores in the field with help of several students (see Acknowledgements). CQ subsampled the cores and coordinated all subsequent analyses on the subsamples. CQ analysed the data with input from YvdV, JHJC, JW and RvB; LS advised and assisted with the statistical analysis. CQ wrote the main body of text. The paper was finalised based on feedback from all authors.
The contact author has declared that none of the authors has any competing interests.
Publisher’s note: Copernicus Publications remains neutral with regard to jurisdictional claims in published maps and institutional affiliations.
We are thankful for the collaboration with Natuurmonumenten Noordenveld and Staatsbosbeheer Kop van Drenthe for access to and inside knowledge of the field sites; Teun Fiers, Klais Blaauw, Tom Harkema, Marte Stoorvogel, and Gibran Leeflang for field assistance; Mieke Hannink for administrative assistance with organising the fieldwork; Marcello Novani (Laboratory for Geo-information Science, Wageningen University & Research) for providing GNSS equipment; Jim Quik for construction work for core transport; and Piet Peters for providing storage space in the cool room (Soil Hydro Physics Lab, Wageningen University & Research). The contributions of Anne Roepert and colleagues (CBLB, Wageningen) for LOI analyses; Marjolein van der Linden and Lucy Kubiak-Martens (BIAX Consult, Zaandam) for selecting plant macrofossils for radiocarbon dating; and Sanne W. L. Palstra for the radiocarbon measurements at the Centre for Isotope Research (University of Groningen) are gratefully acknowledged. We appreciate the constructive comments of two anonymous reviewers, which helped to improve an earlier version of this paper.
This research has been supported by the Nederlandse Organisatie voor Wetenschappelijk Onderzoek (grant no. 276-60-003).
This paper was edited by Petr Kuneš and reviewed by two anonymous referees.
AHN: De details van het Actueel Hoogtebestand Nederland [Details of the Digital Elevation Model of The Netherlands], https://ahn.maps.arcgis.com/apps/Cascade/index.html?appid=75245be5e0384d47856d2b912fc1b7ed, last access: 11 October 2021a (in Dutch).
AHN: Kwaliteitsbeschrijving Actueel Hoogtebestand Nederland [Quality description Digital Elevation Model of The Netherlands], https://www.ahn.nl/kwaliteitsbeschrijving, last access: 11 October 2021b (in Dutch).
Almquist-Jacobson, H. and Foster, D. R.: Toward an integrated model for raised-bog development: Theory and field evidence, Ecology, 76, 2503–2516, https://doi.org/10.2307/2265824, 1995.
Altenburg, W., Bijkerk, W., Douwes, R., and Straathof, N.: Neergang en opkomst van het Fochteloërveen: resultaten van 30 jaar hoogveenherstel, De Levende Natuur, 118, 79–84, 2017.
Anderson, R. L., Foster, D. R., and Motzkin, G.: Integrating lateral expansion into models of peatland development in temperate New England, J. Ecol., 91, 68–76, 2003.
Archis: Archeologisch Informatiesysteem, https://archis.cultureelerfgoed.nl/, last access: 8 November 2019 (in Dutch).
Baird, A., Morris, P., and Belyea, L.: The DigiBog peatland development model 1: rationale, conceptual model, and hydrological basis, Ecohydrology, 5, 242–255, https://doi.org/10.1002/eco.230, 2012.
Bauer, I. E., Gignac, L. D., and Vitt, D. H.: Development of a peatland complex in boreal western Canada: Lateral site expansion and local variability in vegetation succession and long-term peat accumulation, Can. J. Bot., 81, 833–847, https://doi.org/10.1139/b03-076, 2003.
Berendsen, H. J. A. and Stouthamer, E.: Late Weichselian and Holocene palaeogeography of the Rhine-Meuse delta, the Netherlands, Palaeogeogr. Palaeocl., 161, 311–335, https://doi.org/10.1016/S0031-0182(00)00073-0, 2000.
Berendsen, H. and Stouthamer, E.: Palaeogeographic development of the Rhine-Meuse delta, the Netherlands, Van Gorcum, Assen, 2001.
Berendsen, H. J. A., Makaske, B., Van de Plassche, O., Van Ree, M. H. M., Das, S., Van Dongen, M., Ploumen, S., and Schoenmakers, W.: New groundwater-level rise data from the Rhine-Meuse delta – Implications for the reconstruction of Holocene relative mean sea-level rise and differential land-level movements, Geol, Mijnbouw-N. J. G., 86, 333–354, https://doi.org/10.1017/s0016774600023568, 2007.
Bos, I. J.: Architecture and facies distribution of organic-clastic lake fills in the fluvio-deltaic Rhine-Meuse system, The Netherlands, J. Sediment. Res., 80, 339–356, https://doi.org/10.2110/jsr.2010.035, 2010.
Bos, I. J., Busschers, F. S., and Hoek, W. Z.: Organic-facies determination: A key for understanding facies distribution in the basal peat layer of the Holocene Rhine-Meuse delta, The Netherlands, Sedimentology, 59, 676–703, https://doi.org/10.1111/j.1365-3091.2011.01271.x, 2012.
Bosch, J. H. A.: Assen West (12W), Assen Oost (12O). Toelichtingen bij de geologische kaart van Nederland 1 : 50.000, Rijks Geologische Dienst, Haarlem, 188 pp., ISBN: 9789012063241, 1990.
Breiman, L.: Random Forests, Mach. Learn., 45, 5–32, https://doi.org/10.1023/A:1010933404324, 2001.
Breuning-Madsen, H., Bird, K. L., Balstrøm, T., Elberling, B., Kroon, A., and Lei, E. B.: Development of plateau dunes controlled by iron pan formation and changes in land use and climate, Catena, 171, 580–587, https://doi.org/10.1016/j.catena.2018.07.011, 2018.
Bronk Ramsey, C.: Radiocarbon Calibration and Analysis of Stratigraphy: The OxCal Program, Radiocarbon, 37, 425–430, https://doi.org/10.1017/s0033822200030903, 1995.
Casparie, W. A.: De twee IJzertijd houten veenwegen I(SM) en II(SM) bij de Suermondswijk te Smilde, Nieuwe Drentse Volksalm, 102, 145–169, 1985.
Casparie, W. A.: The Bourtanger Moor: endurance and vulnerability of a raised bog system, Hydrobiologia, 265, 203–215, https://doi.org/10.1007/BF00007269, 1993.
Chapman, H., Gearey, B. R., Bamforth, M., Bermingham, N., Marshall, P., Powlesland, I., Taylor, M., and Whitehoude, N.: Modelling archaeology and palaeoenvironments in wetlands: the hidden landscape archaeology of Hatfield and Thorne Moors, eastern England, edited by: Chapman, H. P. and Gearey, B. R., 205 pp., ISBN 978-1-78297-174-0, 2013.
Charman, D.: Origins and Peat Initiation, in: Peatlands and Environmental Change, edited by: Charman, D., John Wiley & Sons, Ltd, Chichester, 73–91, ISBN 9780470844106, 2002a.
Charman, D.: Peat and peatlands, in: Peatlands and Environmental Change, edited by: Charman, D., John Wiley & Sons, Ltd, Chichester, 3–23, ISBN 9780470844106, 2002b.
Cohen, K. M., Gibbard, P. L., and Weerts, H. J.: North sea palaeogeographical reconstructions for the last 1 Ma, Geologie en Mijnbouw/Netherlands Journal of Geosciences, 93, 7–29, https://doi.org/10.1017/njg.2014.12, 2014.
Crawford, R. M. M., Jeffree, C. E., and Rees, W. G.: Paludification and forest retreat in northern oceanic environments, Ann. Bot., 91, 213–226, https://doi.org/10.1093/aob/mcf185, 2003.
Crushell, P., Connolly, A., Schouten, M., and Mitchell, F. J. G.: The changing landscape of Clara Bog: The history of an Irish raised bog, Irish Geogr., 41, 89–111, https://doi.org/10.1080/00750770801915596, 2008.
Dee, M. W., Palstra, S. W. L., Aerts-Bijma, A. T., Bleeker, M. O., De Bruijn, S., Ghebru, F., Jansen, H. G., Kuitems, M., Paul, D., Richie, R. R., Spriensma, J. J., Scifo, A., Van Zonneveld, D., Verstappen-Dumoulin, B. M. A. A., Wietzes-Land, P., and Meijer, H. A. J.: Radiocarbon dating at Groningen: New and updated chemical pretreatment procedures, Radiocarbon, 62, 63–74, https://doi.org/10.1017/RDC.2019.101, 2020.
DINOloket – TNO: Ondergrondgegevens, Geologisch Booronderzoek, https://www.dinoloket.nl/, last access: 19 April 2022 (in Dutch).
Douwes, R. and Straathof, N.: 14. Het Fochteloërveen, in: Hoogvenen: Landschapsecologie, behoud, beheer, herstel, edited by: Jansen, A. and Grootjans, A., Noordboek Natuur, Gorredijk, 133–147, ISBN 9789056155520, 2019 (in Dutch).
Edvardsson, J., Poska, A., Van der Putten, N., Rundgren, M., Linderson, H., and Hammarlund, D.: Late-Holocene expansion of a south Swedish peatland and its impact on marginal ecosystems: Evidence from dendrochronology, peat stratigraphy and palaeobotanical data, Holocene, 24, 466–476, https://doi.org/10.1177/0959683613520255, 2014.
Eijkelkamp Soil & Water: Peat sampler, Eijkelkamp Soil & Water, Giesbeek, 1–7, 2018.
ESRI: Charted Territory Map, https://www.arcgis.com/home/item.html?id=d582a9e953c44c09bb998c7d9b66f8d4 (last access: 10 June 2022), 2022.
Fokkens, H.: Drowned landscape – The occupation of the western part of the Frisian-Drentian Plateau, 4400 BC–AD 500, edited by: van Regteren Altena, J. F., Van Gorcum & Comp. BV and Rijksdienst voor het Oudheidkundig Bodemonderzoek (ROB), Assen, 183 pp., ISBN 9789023233053, 1998.
Foster, D., Wright, H., Thelaus, M., and King, G.: Bog development and landform dynamics in Central Sweden and South-Eastern Labrador, Canada, J. Ecol., 76, 1164–1185, 1988.
Frolking, S., Roulet, N. T., Tuittila, E., Bubier, J. L., Quillet, A., Talbot, J., and Richard, P. J. H.: A new model of Holocene peatland net primary production, decomposition, water balance, and peat accumulation, Earth Syst. Dynam., 1, 1–21, https://doi.org/10.5194/esd-1-1-2010, 2010.
Gerding, M.: Vier eeuwen turfwinning, De verveningen in Groningen, Friesland, Drenthe en Overijssel tussen 1550 en 1950, Wageningen University, Wageningen, 533 pp., 1995 (in Dutch).
Grondwatertools – TNO: LHM laag 1, berekeningswijze: LHM, https://www.grondwatertools.nl/gwsinbeeld/ (last access: 24 January 2022), 2022 (in Dutch).
Hijma, M.: From river valley to estuary, PhD thesis, Netherlands Geographical Studies 389, Koninklijk Nederlands Aardrijkskundig Genootschap, Faculteit Geowetenschappen Universiteit Utrecht, 2009.
International Peatland Society: Types of peatlands, https://peatlands.org/peatlands/types-of-peatlands/#:~:text=Geogenous%20peatlands%2C%20i.e.%20fens%2C%20are%20nutrient-rich%20%28minerotrophic%29%20and,Vegetation%20is%20dominated%20by%20grasses%2C%20sedges%2C%20and%20rushes, last access: 16 June 2022.
IUSS Working Group WRB: World Reference Base for Soil Resources 2014, update 2015: International soil classification system for naming soils and creating legends for soil maps. World Soil Resources Reports No. 106, 192 pp., FAO, Rome, E-ISBN 978-92-5-108370-3, 2015.
Jones, M. C. and Yu, Z.: Rapid deglacial and early Holocene expansion of peatlands in Alaska, P. Natl. Acad. Sci. USA, 107, 7347–7352, https://doi.org/10.1073/pnas.0911387107, 2010.
Jongmans, A. G., Van den Berg, M. W., Sonneveld, M. P. W., Peek, G. J. W. C., and Van den Berg van Saparoea, R. M. (Eds.): Deel V: Veen, in: Landschappen van Nederland – Geologie, Bodem en Landgebruik, Wageningen Academic Publishers, Wageningen, 942 pp., ISBN 9789086862139, 2013 (in Dutch).
Joosten, H. and Clarke, D.: Wise use of mires and peatlands – Background and principles including a framework for decision-making, International Mire Conservation Group (IMCG) & International Peatland Society (IPS), 304 pp., ISBN 951-97744-8-3, 2002.
Joosten, H., Grootjans, A., Schouten, M., and Jansen, A.: Netherlands, in: Mires and peatlands in Europe: Status, distribution and conservation, edited by: Joosten, H., Tanneberger, F., and Moen, A., Schweizerbart Science Publishers, Stuttgart, 523–535, ISBN 9783510653836, 2017.
Klaver, E.: Een Holocene vegetatie successie in het Fochtelooerveen, Universiteit van Amsterdam, Amsterdam, 48 pp., 1981 (in Dutch).
KNMI: Klimaattabel Station Eelde, periode 1991–2020, 2021 (in Dutch).
Korhola, A.: Radiocarbon evidence for rates of lateral expansion in raised mires in southern Finland, Quaternary Res., 42, 299–307, 1994.
Korhola, A.: Initiation of a sloping mire complex in southwestern Finland: Autogenic versus allogenic controls, Ecoscience, 3, 216–222, 1996.
Korhola, A., Ruppel, M., Seppä, H., Väliranta, M., Virtanen, T., and Weckström, J.: The importance of northern peatland expansion to the late-Holocene rise of atmospheric methane, Quaternary Sci. Rev., 29, 611–617, https://doi.org/10.1016/j.quascirev.2009.12.010, 2010.
Koster, E.: Aeolian Environments, in: Physical Geography of Western Europe, edited by: Koster, E. A., Oxford University Press, Oxford, 139–160, 2005.
Koster, E. A.: Ancient and modern cold-climate aeolian sand deposition: a review, J. Quaternary Sci., 3, 69–83, 1988.
Limpens, J.: Prospects for Sphagnum bogs subject to high nitrogen deposition, PhD thesis, Wageningen University, Wageningen, 140 pp., 2003.
Loisel, J., Yu, Z., Parsekian, A., Nolan, J., and Slater, L.: Quantifying landscape morphology influence on peatland lateral expansion using ground-penetrating radar (GPR) and peat core analysis, J. Geophys. Res.-Biogeo., 118, 373–384, https://doi.org/10.1002/jgrg.20029, 2013.
Macdonald, G. M., Beilman, D. W., Kremenetski, K. V., Sheng, Y., Smith, L. C., and Velichko, A. A.: Rapid early development of circumarctic peatlands and atmospheric CH4 and CO2 variations, Science, 314, 285–288, https://doi.org/10.1126/science.1131722, 2006.
Mäkilä, M.: Holocene lateral expansion, peat growth and carbon accumulation on Haukkasuo, a raised bog in southeastern Finland, Boreas, 26, 1–14, https://doi.org/10.1111/j.1502-3885.1997.tb00647.x, 1997.
Mäkilä, M. and Moisanen, M.: Holocene lateral expansion and carbon accumulation of Luovuoma, a northern fen in finnish Lapland, Boreas, 36, 198–210, https://doi.org/10.1111/j.1502-3885.2007.tb01192.x, 2007.
Meijles, E. W., Kiden, P., Streurman, H. J., van der Plicht, J., Vos, P. C., Gehrels, W. R., and Kopp, R. E.: Holocene relative mean sea-level changes in the Wadden Sea area, northern Netherlands, J. Quaternary Sci., 33, 905–923, https://doi.org/10.1002/jqs.3068, 2018.
Ministerie van Economische Zaken: Natura 2000-gebieden peildatum 27 augustus 2018, Ministerie van Economische Zaken [data set], 2018 (in Dutch).
Ministerie van Verkeer en Waterstaat: Landelijke CONCEPT dataset lijnvormige waterlichamen status mrt 2007, Ministerie van Verkeer en Waterstaat [data set], 2007 (in Dutch).
Moore, P.: The origin of blanket mire, revisited, in: Climate change and human impact on the landscape, edited by: Chambers, F., Chapman and Hal, London, 217–224, ISBN 9780412462009, 1993.
Moore, P. D.: Origin of blanket mires, Nature, 256, 267–269, https://doi.org/10.1038/256267a0, 1975.
Morris, P., Baird, A., and Belyea, L.: The DigiBog peatland development model 2: ecohydrological simulations in 2D, Ecohydrology, 5, 256–268, https://doi.org/10.1002/eco.229, 2012.
Morris, P. J., Swindles, G. T., Valdes, P. J., Ivanovic, R. F., Gregoire, L. J., Smith, M. W., Tarasov, L., Haywood, A. M., and Bacon, K. L.: Global peatland initiation driven by regionally asynchronous warming, P. Natl. Acad. Sci. USA, 115, 4851–4856, https://doi.org/10.1073/pnas.1717838115, 2018.
Oliver, M. A. and Webster, R.: A tutorial guide to geostatistics: Computing and modelling variograms and kriging, Catena, 113, 56–69, https://doi.org/10.1016/j.catena.2013.09.006, 2014.
Peregon, A., Uchida, M., and Yamagata, Y.: Lateral extension in Sphagnum mires along the southern margin of the boreal region, Western Siberia, Environ. Res. Lett., 4, 045028, https://doi.org/10.1088/1748-9326/4/4/045028, 2009.
Pierik, H. J., Cohen, K. M., Vos, P. C., Van der Spek, A. J. F., and Stouthamer, E.: Late Holocene coastal-plain evolution of the Netherlands: the role of natural preconditions in human-induced sea ingressions, P. Geologists' Assoc., 128, 180–197, https://doi.org/10.1016/j.pgeola.2016.12.002, 2017.
Provincie Drenthe: Beheerplan Fochteloërveen – Op weg naar een levend hoogveen, Provincie Drenthe, Assen, 188 pp., 2016 (in Dutch).
Provincie Drenthe: Dikte van het keileempakket in Drenthe, in meters, https://kaartportaal.drenthe.nl/portal/home/item.html?id=109e34c7141147178fbd523060170c42, last access: 16 June 2022 (in Dutch).
Prummel, W. and Niekus, M. J. L. T.: Late Mesolithic hunting of a small female aurochs in the valley of the River Tjonger (the Netherlands) in the light of Mesolithic aurochs hunting in NW Europe, J. Archaeol. Sci., 38, 1456–1467, https://doi.org/10.1016/j.jas.2011.02.009, 2011.
Pynacker, C.: Drenthe – Drentia Comitatus – Transiselaniae Tabula II, https://commons.wikimedia.org/wiki/File:Drenthe_-_Drentia_Comitatus_-_ Transiselaniae_Tabula_II_(Cornelio_Pynacker,_1664).jpg (last access: 24 July 2022), 1664.
Quik, C., Velde, Y. van der, Harkema, T., Van der Plicht, H., Quik, J., Beek, R. van, and Wallinga, J.: Using legacy data to reconstruct the past? Rescue, rigor and reuse in peatland geochronology, Earth Surf. Process., 46, 2607–2631, https://doi.org/10.1002/esp.5196, 2021.
Quik, C., Palstra, S. W. L., Van Beek, R., Van der Velde, Y., Candel, J. H. J., Van der Linden, M., Kubiak-Martens, L., Swindles, G. T., Makaske, B., and Wallinga, J.: Dating basal peat: The geochronology of peat initiation revisited, Quat. Geochronol., 72, 1–22, https://doi.org/10.1016/j.quageo.2022.101278, 2022.
Quik, C., Van der Velde, Y., Candel, J., Steinbuch, L., Van Beek, R., and Wallinga, J.: Data from: Faded landscape: unravelling peatland initiation and lateral expansion at one of NW-Europe's largest bog remnants, 4TU.ResearchData [data set], https://doi.org/10.4121/20237958, 2023.
Rappol, M.: Saalian till in the Netherlands: a review, in: INQUA Symposium on the Genesis and Lithology of glacial deposits – Amsterdam, 1986, edited by: Van der Meer, J., Balkema, Rotterdam and Boston, 3–21, 1987.
Rappol, M., Haldorsen, S., Jørgensen, P., Van der Meer, J. J. M., and Stoltenberg, H. M. P.: Composition and origin of petrographically stratified thick till in the Northern Netherlands and a Saalian glaciation model for the North Sea basin, Meded. van Werkgr. voor Tert. en Kwart. Geol., 26, 31–64, 1989.
RCE: Paleogeografische kaarten, https://www.cultureelerfgoed.nl/onderwerpen/bronnen-en-kaarten/overzicht/paleografische-kaarten, last access: 5 May 2022.
Reimer, P., Austin, W., Bard, E., Bayliss, A., Blackwell, P., Bronk Ramsey, C., Butzin, M., Cheng, H., Edwards, R., Friedrich, M., Grootes, P., Guilderson, T., Hajdas, I., Heaton, T., Hogg, A., Hughen, K., Kromer, B., Manning, S., Muscheler, R., Palmer, J., Pearson, C., Van der Plicht, J., Reimer, R., Richards, D., Scott, E., Southon, J., Turney, C., Wacker, L., Adolphi, F., Büntgen, U., Capano, M., Fahrni, S., Fogtmann-Schulz, A., Friedrich, R., Köhler, P., Kudsk, S., Miyake, F., Olsen, J., Reinig, F., Sakamoto, M., Sookdeo, A., and Talamo, S.: The IntCal20 Northern Hemisphere radiocarbon age calibration curve (0–55 cal kBP), Radiocarbon, 62, 725–757, https://doi.org/10.1017/RDC.2020.41, 2020.
Robichaud, A. and Bégin, Y.: Development of a raised bog over 9000 years in Atlantic Canada, Mires Peat, 5, 1–19, 2009.
Ruppel, M., Väliranta, M., Virtanen, T., and Korhola, A.: Postglacial spatiotemporal peatland initiation and lateral expansion dynamics in North America and northern Europe, Holocene, 23, 1596–1606, https://doi.org/10.1177/0959683613499053, 2013.
Rydin, H. and Jeglum, J. K.: Peatland habitats, in: The Biology of Peatlands, edited by: Rydin, H. and Jeglum, J. K., Oxford University Press, Oxford, 1–20, ISBN 9780199602995, 2013a.
Rydin, H. and Jeglum, J. K.: Peatland succession and development, in: The Biology of Peatlands, edited by: Rydin, H. and Jeglum, J. K., Oxford University Press, Oxford, 127–147, ISBN 9780199602995, 2013b.
Spek: Het Drentse Esdorpenlandschap – Een historisch-geografische studie, Uitgeverij Matrijs, Utrecht, in collaboration with Stichting Het Drentse Landschap, 1104 pp., ISBN 978-90-5345-254-7, 2004 (in Dutch).
Staring, W.: De wording van kienhout, Dekker & Huisman, Wildervank, 115 pp., 1983.
Stuiver, M. and Polach, H.: Discussion: Reporting of 14C data, Radiocarbon, 19, 355–363, 1977.
Swindles, G. T., Morris, P. J., Mullan, D. J., Payne, R. J., Roland, T. P., Amesbury, M. J., Lamentowicz, M., Turner, T. E., Gallego-Sala, A., Sim, T., Barr, I. D., Blaauw, M., Blundell, A., Chambers, F. M., Charman, D. J., Feurdean, A., Galloway, J. M., Gałka, M., Green, S. M., Kajukało, K., Karofeld, E., Korhola, A., Lamentowicz, Ł., Langdon, P., Marcisz, K., Mauquoy, D., Mazei, Y. A., McKeown, M. M., Mitchell, E. A. D., Novenko, E., Plunkett, G., Roe, H. M., Schoning, K., Sillasoo, Ü., Tsyganov, A. N., van der Linden, M., Väliranta, M., and Warner, B.: Widespread drying of European peatlands in recent centuries, Nat. Geosci., 12, 922–928, https://doi.org/10.1038/s41561-019-0462-z, 2019.
Swinnen, W., Broothaerts, N., and Verstraeten, G.: Modelling long-term alluvial-peatland dynamics in temperate river floodplains, Biogeosciences, 18, 6181–6212, https://doi.org/10.5194/bg-18-6181-2021, 2021.
Synal, H. A., Stocker, M., and Suter, M.: MICADAS: a new compact radiocarbon AMS system, Nucl. Instrum. Meth. B, 259, 7–13, 2007.
Ter Wee, M.: Geologische opbouw van Drenthe, Rijks Geologische Dienst, Haarlem, 1–24, 1972 (in Dutch).
Ter Wee, M.: Emmen West (17W), Emmen Oost (17O). Toelichtingen bij de geologische kaart van Nederland 1 : 50.000, Rijks Geologische Dienst, Haarlem, 218 pp., 1979 (in Dutch).
TNO-GSN: Gieten Member, http://www.dinoloket.nl/en/stratigraphic-nomenclature/gieten-member, last access: 1 April 2021a (in Dutch).
TNO-GSN: Laagpakket van Wierden, in: Stratigrafische Nomenclator van Nederland, https://www.dinoloket.nl/en/stratigraphic-nomenclature/wierden-member, last access: 16 March 2021b (in Dutch).
Tolonen, K. and Turunen, J.: Accumulation rates of carbon in mires in Finland and implications for climate change, Holocene, 6, 171–178, https://doi.org/10.1177/095968369600600204, 1996.
TOPCON: Hiper V Versatile Function GNSS Receiver, TOPCON Corporation, 4 pp., 2017.
Törnqvist, T. E., Van Ree, M. H. M., Van 't Veer, R., and Van Geel, B.: Improving Methodology for High-Resolution Reconstruction of Sea-Level Rise and Neotectonics by Paleoecological Analysis and AMS 14C Dating of Basal Peats, Quaternary Res., 49, 72–85, https://doi.org/10.1006/qres.1997.1938, 1998.
Turunen, C. and Turunen, J.: Development history and carbon accumulation of a slope bog in oceanic British Columbia, Canada, Holocene, 13, 225–238, https://doi.org/10.1191/0959683603hl609rp, 2003.
Turunen, J., Räty, A., Kuznetsov, O., Maksimov, A., Shevelin, P., Grabovik, S., Tolonen, K., Pitkänen, A., Turunen, C., Miriläinen, J., and Jungner, H. (Eds.): Development history of Patvinsuo Mire, Eastern Finland, 1–72, 2002.
Van Aalst, J. W.: OpenTopo, 200 pixels per km, current release: 2021-R11, Nov. 2021, map sheet used: 09, https://www.opentopo.nl, last access: 4 April 2022.
Van Asselen, S., Cohen, K. M., and Stouthamer, E.: The impact of avulsion on groundwater level and peat formation in delta floodbasins during the middle-Holocene transgression in the Rhine-Meuse delta, The Netherlands, Holocene, 27, 1694–1706, https://doi.org/10.1177/0959683617702224, 2017.
Van Beek, R.: Reliëf in tijd en ruimte – Interdisciplinair onderzoek naar bewoning en landschap van Oost-Nederland tussen vroege prehistorie en middeleeuwen, PhD thesis, Wageningen Universiteit, Wageningen, 641 pp., ISBN 9789085854609, 2009 (in Dutch).
Van Beek, R.: An interdisciplinary approach to the long-term history of raised bogs: A case study at Vriezenveen (the Netherlands), J. Wetl. Archaeol., 15, 1–33, https://doi.org/10.1080/14732971.2015.1112591, 2015.
Van Beek, R., Maas, G. J., and Van Den Berg, E.: Home Turf: An interdisciplinary exploration of the long-term development, use and reclamation of raised bogs in the Netherlands, Landsc. Hist., 36, 5–34, https://doi.org/10.1080/01433768.2015.1108024, 2015.
Van den Berg, M. W. and Beets, D. J.: Saalian glacial deposits and morphology in The Netherlands, in: INQUA Symposium on the Genesis and Lithology of glacial deposits – Amsterdam, 1986, edited by: Van der Meer, J., Balkema, Rotterdam and Boston, 235–251, 1987.
Van der Meij, W. M., Temme, A. J. A. M., Lin, H. S., Gerke, H. H., and Sommer, M.: On the role of hydrologic processes in soil and landscape evolution modeling: concepts, complications and partial solutions, Earth-Sci. Rev., 185, 1088–1106, https://doi.org/10.1016/j.earscirev.2018.09.001, 2018.
Van der Velde, Y., Temme, A. J. A. M., Nijp, J. J., Braakhekke, M. C., Van Voorn, G. A. K., Dekker, S. C., Dolman, A. J., Wallinga, J., Devito, K. J., Kettridge, N., Mendoza, C. A., Kooistra, L., Soons, M. B., and Teuling, A. J.: Emerging forest–peatland bistability and resilience of European peatland carbon stores, P. Natl. Acad. Sci. USA, 118, 1–9, https://doi.org/10.1073/pnas.2101742118, 2021.
Van Geel, B., Van der Plicht, J., Kilian, M., Klaver, E., Kouwenberg, J., Renssen, H., Reynaud-Farrera, I., and Waterbolk, H.: The sharp rise of delta 14C ca. 800 cal BC: Possible causes, related climatic teleconnections and the impact on human environments, Radiocarbon, 40, 535–550, 1998.
Van Giffen, A. E.: Prähistorische Hausformen auf den Sandböden in den Niederlanden, Germania, 36, 35–71, 1958 (in German).
Vos, P. (Ed.): Compilation of the Holocene palaeogeographical maps of the Netherlands, in: Origin of the Dutch coastal landscape: Long-term landscape evolution of the Netherlands during the Holocene, described and visualized in national, regional and local palaeogeographical map series, Barkhuis, Groningen, 50–79, ISBN 9789491431821, 2015a.
Vos, P. (Ed.): Origin of the Dutch coastal landscape: Long-term landscape evolution of the Netherlands during the Holocene, described and visualized in national, regional and local palaeogeographical map series, Barkhuis, Groningen (also published as the author's PhD thesis, Utrecht University), 359 pp., ISBN 9789491431821, 2015b.
Vos, P., Van der Meulen, M., Weerts, H., and Bazelmans, J.: Atlas of the Holocene Netherlands, landscape and habitation since the last ice age, Amsterdam University Press, Amsterdam, 96 pp., ISBN 9463724435, 2020.
Walker, M., Johnsen, S., Rasmussen, S. O., Popp, T., Steffensen, J.-P., Gibbard, P., Hoek, W., Lowe, J., Andrews, J., Björck, S., Cwynar, L. c., Hughen, K., Kershaw, P., Kromer, B., Litt, T., Lowe, D. J., Nakagawa, T., Newnham, R., and Schwander, J.: Formal definition and dating of the GSSP (Global Stratotype Section and Point) for the base of the Holocene using the Greenland NGRIP ice core, and selected auxiliary records, J. Quaternary Sci., 24, 3–17, https://doi.org/10.1002/jqs.1227, 2009.
Walker, M., Gibbard, P., Head, M. J., Berkelhammer, M., Björck, S., Cheng, H., Cwynar, L. C., Fisher, D., Gkinis, V., Long, A., Lowe, J., Newnham, R., Rasmussen, S. O., and Weiss, H.: Formal Subdivision of the Holocene Series/Epoch: A Summary, J. Geol. Soc. India, 93, 135–141, https://doi.org/10.1007/s12594-019-1141-9, 2019.
Wanner, H., Beer, J., Bütikofer, J., Crowley, T. J., Cubasch, U., Flückiger, J., Goosse, H., Grosjean, M., Joos, F., Kaplan, J. O., Küttel, M., Müller, S. A., Prentice, I. C., Solomina, O., Stocker, T. F., Tarasov, P., Wagner, M., and Widmann, M.: Mid- to Late Holocene climate change: an overview, Quaternary Sci. Rev., 27, 1791–1828, https://doi.org/10.1016/j.quascirev.2008.06.013, 2008.
Waterbolk, H. T.: Zwervend tussen de venen. Een poging tot reconstructie van het woongebied van de hunebedbouwers op het centrale deel van het Fries-Drents plateau, in: Tussen D26 en P14: Jan Albert Bakker 65 jaar, edited by: Bloemers, J. H. F., Amsterdams Archeologisch Centrum, Universiteit van Amsterdam, Amsterdam, 181–208, ISBN 9789090219875, 2007 (in Dutch).
Weckström, J., Seppä, H., and Korhola, A.: Climatic influence on peatland formation and lateral expansion in sub-arctic Fennoscandia, Boreas, 39, 761–769, https://doi.org/10.1111/j.1502-3885.2010.00168.x, 2010.
Zagwijn, W. H.: Nederland in het Holoceen – Geologie van Nederland Deel 1, Rijks Geologische Dienst Haarlem, Staatsuitgeverij, 's Gravenhage, 46 pp., ISBN 9012052394, 1986 (in Dutch).
Zhao, Y., Tang, Y., Yu, Z., Li, H., Yang, B., Zhao, W., Li, F., and Li, Q.: Holocene peatland initiation, lateral expansion, and carbon dynamics in the Zoige Basin of the eastern Tibetan Plateau, Holocene, 24, 1137–1145, https://doi.org/10.1177/0959683614538077, 2014.