the Creative Commons Attribution 4.0 License.
the Creative Commons Attribution 4.0 License.
 | 04 Feb 2026
BrGDGT-based palaeothermometer in drylands: the necessity to constrain aridity and salinity as confounding factors to ensure the robustness of calibrations
Lucas Dugerdil
Sébastien Joannin
Odile Peyron
Shafag Bayramova
Xiaozhong Huang
Fahu Chen
Dilfuza Egamberdieva
Jakhongir Alimov
Bazartseren Boldgiv
Amy Cromartie
Juzhi Hou
Lilit Sahakyan
Khachatur Meliksetian
Salomé Ansanay-Alex
Rafig Safarov
Imran Muradi
Shabnam Isayeva
Shehla Mirzayeva
Elshan Abdullayev
Sayyara Ibadullayeva
Parvana Garakhani
Guillemette Ménot
Past temperature reconstructions offer valuable insights into the impact of climate change on the global climate-human-vegetation system. Branched glycerol dialkyl glycerol tetraethers (brGDGTs) are recognized as effective temperature proxies, particularly in lakes and peatlands, where they are well preserved. However, their reliability as palaeothermometers can be compromised by factors beyond air temperature, especially in drylands. This study investigates the recently compiled Arid Central Asian (ACA) brGDGT surface Data Base, a regional dataset consisting of 753 surface samples from the drylands of ACA. The distribution of brGDGTs in relation to climate and environmental variables was analysed to explore their potential as reliable temperature proxies, mainly focusing on brGDGTs methylation (MBT), cyclisation (CBT), and isomer (IR) indices. The brGDGT-based palaeothermometer is a promising tool for understanding past climates, but our comparison between an ACA-centred database and a worldwide continental surface sample database reveals several challenges. Drylands exhibit extreme climate and soil/lacustrine properties, amplifying the impact of confounding factors on brGDGT-based relationships with mean annual air temperature. Salinity emerges as the dominant factor influencing brGDGT variance, followed by sample type, pH, and aridity, all of which contribute significantly. These factors interact in complex ways, with the salinity effect varying between soil and lacustrine deposits. For sample physicochemical conditions, the index is best for salinity, and IR6Me is most suitable for pH reconstruction. Thus, the -temperature relationship is limited in ACA, particularly for lacustrine samples, and does not offer a better solution under hyper- to semi-arid conditions. Sub-calibrating models for specific environmental conditions such as salinity and aridity improves the accuracy of temperature reconstructions. Furthermore, the difference between and provides a promising proxy to assess aridity. Although the brGDGT signal in drylands is influenced by multiple controlling factors, it remains a valuable tool for understanding past climate and environmental conditions, especially when accounting for the complex interactions between these factors based on each study's unique physicochemical and bioclimatic context. Further research, incorporating a broader range of surface samples alongside comprehensive soil and climate data, holds the potential to enhance the accuracy of brGDGT-based climate reconstructions.
- Article
(10102 KB) - Full-text XML
-
Supplement
(2004 KB) - BibTeX
- EndNote


Given the uncertain implications of the anthropogenic climate change on the environment, hydrology and human society, palaeotemperatures reconstructions provide a comprehensive perspective on the impact of climate change on the climate-human-vegetation system (Tierney et al., 2020). Branched glycerol dialkyl glycerol tetraethers (brGDGT) are promising temperature proxies that have been used on continental archives (Weijers et al., 2007; Peterse et al., 2012; De Jonge et al., 2014; Dearing Crampton-Flood et al., 2020; Raberg et al., 2021), especially since these lipid compounds produced from bacterial membranes are ubiquitous (Raberg et al., 2022b), well preserved on past archives retrieved from lakes (Dang et al., 2016b; Wang et al., 2021; So et al., 2023) and peatlands (Naafs et al., 2017a, b; d'Oliveira et al., 2023). Analyses of worldwide calibration datasets indicate that variations of the number of methyl groups on the brGDGT aliphatic chains are primarily controlled by ambient temperature, enabling their application as proxies for past temperature (Weijers et al., 2007; De Jonge et al., 2014). The relationship between the temperature and the brGDGT degree of methylation is clear and linear, from both soil surface samples (De Jonge et al., 2014; Dearing Crampton-Flood et al., 2020) and lacustrine surface sediments (Sun et al., 2011). Similar relationship is observed from laboratory experiments and simulations (Naafs et al., 2021; Halamka et al., 2023). The applications of brGDGT-based palaeothermometers span many environments and archives, including tropical to Arctic lakes (Pérez-Angel et al., 2020; Häggi et al., 2023; Raberg et al., 2022a), acidic to alkaline lakes (Dang et al., 2016a; Yang et al., 2014), freshwater to saline lakes (Dugerdil et al., 2021b; Wang et al., 2021; Robles et al., 2022; So et al., 2023), and sediment from loess–palaeosols sequences (Lin et al., 2024). However, the change in the relative proportion of brGDGTs does not depend solely on the air temperature, which can significantly undermine the reliability of the palaeothermometer (e.g., pH, precipitation; Duan et al., 2020; Chen et al., 2021; Duan et al., 2022).
The influence of pH on brGDGT distribution was initially identified and thoroughly constrained (Weijers et al., 2007). pH primarily influences the relative number of 5- and 6-methyl isomers and the number of cyclisations along the aliphatic chain, while temperature affects the number of methylations (e.g., higher amount of tetramethylated compounds over warm environment, Sun et al., 2011; Peterse et al., 2012; Dang et al., 2016a; Raberg et al., 2022b). De Jonge et al. (2014) present the application of the index of methylation of branched tetraethers () index associated with mean annual air temperature (MAAT), the isomer ratio (IR), and the cyclisation of branched tetraethers (CBT5Me) indices related to pH. is now widely adopted to calibrate the reconstruction of MAAT in the past by linear relationships, while CBT5Me and IR are used to infer past pH variations. The sample type, including peat, soil, river, marine, loess, and lacustrine samples, influences the brGDGT-temperature relationship (Loomis et al., 2011; Martínez-Sosa et al., 2023). At the global scale, various specific calibrations between and MAAT have been suggested for soil (De Jonge et al., 2014; Chen et al., 2021), peat (Naafs et al., 2017b), and lacustrine samples (Sun et al., 2011; Zhao et al., 2021). The influence of the calibration database size and the biogeographical characteristics of brGDGT distribution have also been examined (Dugerdil et al., 2021a), and several local or regional calibrations allow for more accurate MAAT reconstructions in past archives (Chen et al., 2021). Subsequently, an increased number of confounding factors have been identified, e.g., soil moisture (Dang et al., 2016b) and sample type (e.g., soil or lacustrine; Martin et al., 2019; Martínez-Sosa et al., 2021, 2023); temperature seasonality (Deng et al., 2016; Dearing Crampton-Flood et al., 2020), or vegetation (Häggi et al., 2023). For instance, the lacustrine samples have lower abundances of pentamethylated brGDGTs than soil samples (De Jonge et al., 2014; Martin et al., 2019; Raberg et al., 2022b), while peat samples are dominated by tetramethylated brGDGTs (Naafs et al., 2017a). The relationship between brGDGTs and MAAT may exhibit a bias toward the summer temperatures, particularly in soils and lakes that experience a long frost period (Deng et al., 2016; Dearing Crampton-Flood et al., 2020). Vegetation influences the distribution of brGDGTs, likely due to the higher soil organic content found in vegetated soils compared to bare soils (Liang et al., 2019). This leads to a different temperature relationship between brGDGTs in soils and MAAT across different vegetation communities (Häggi et al., 2023).
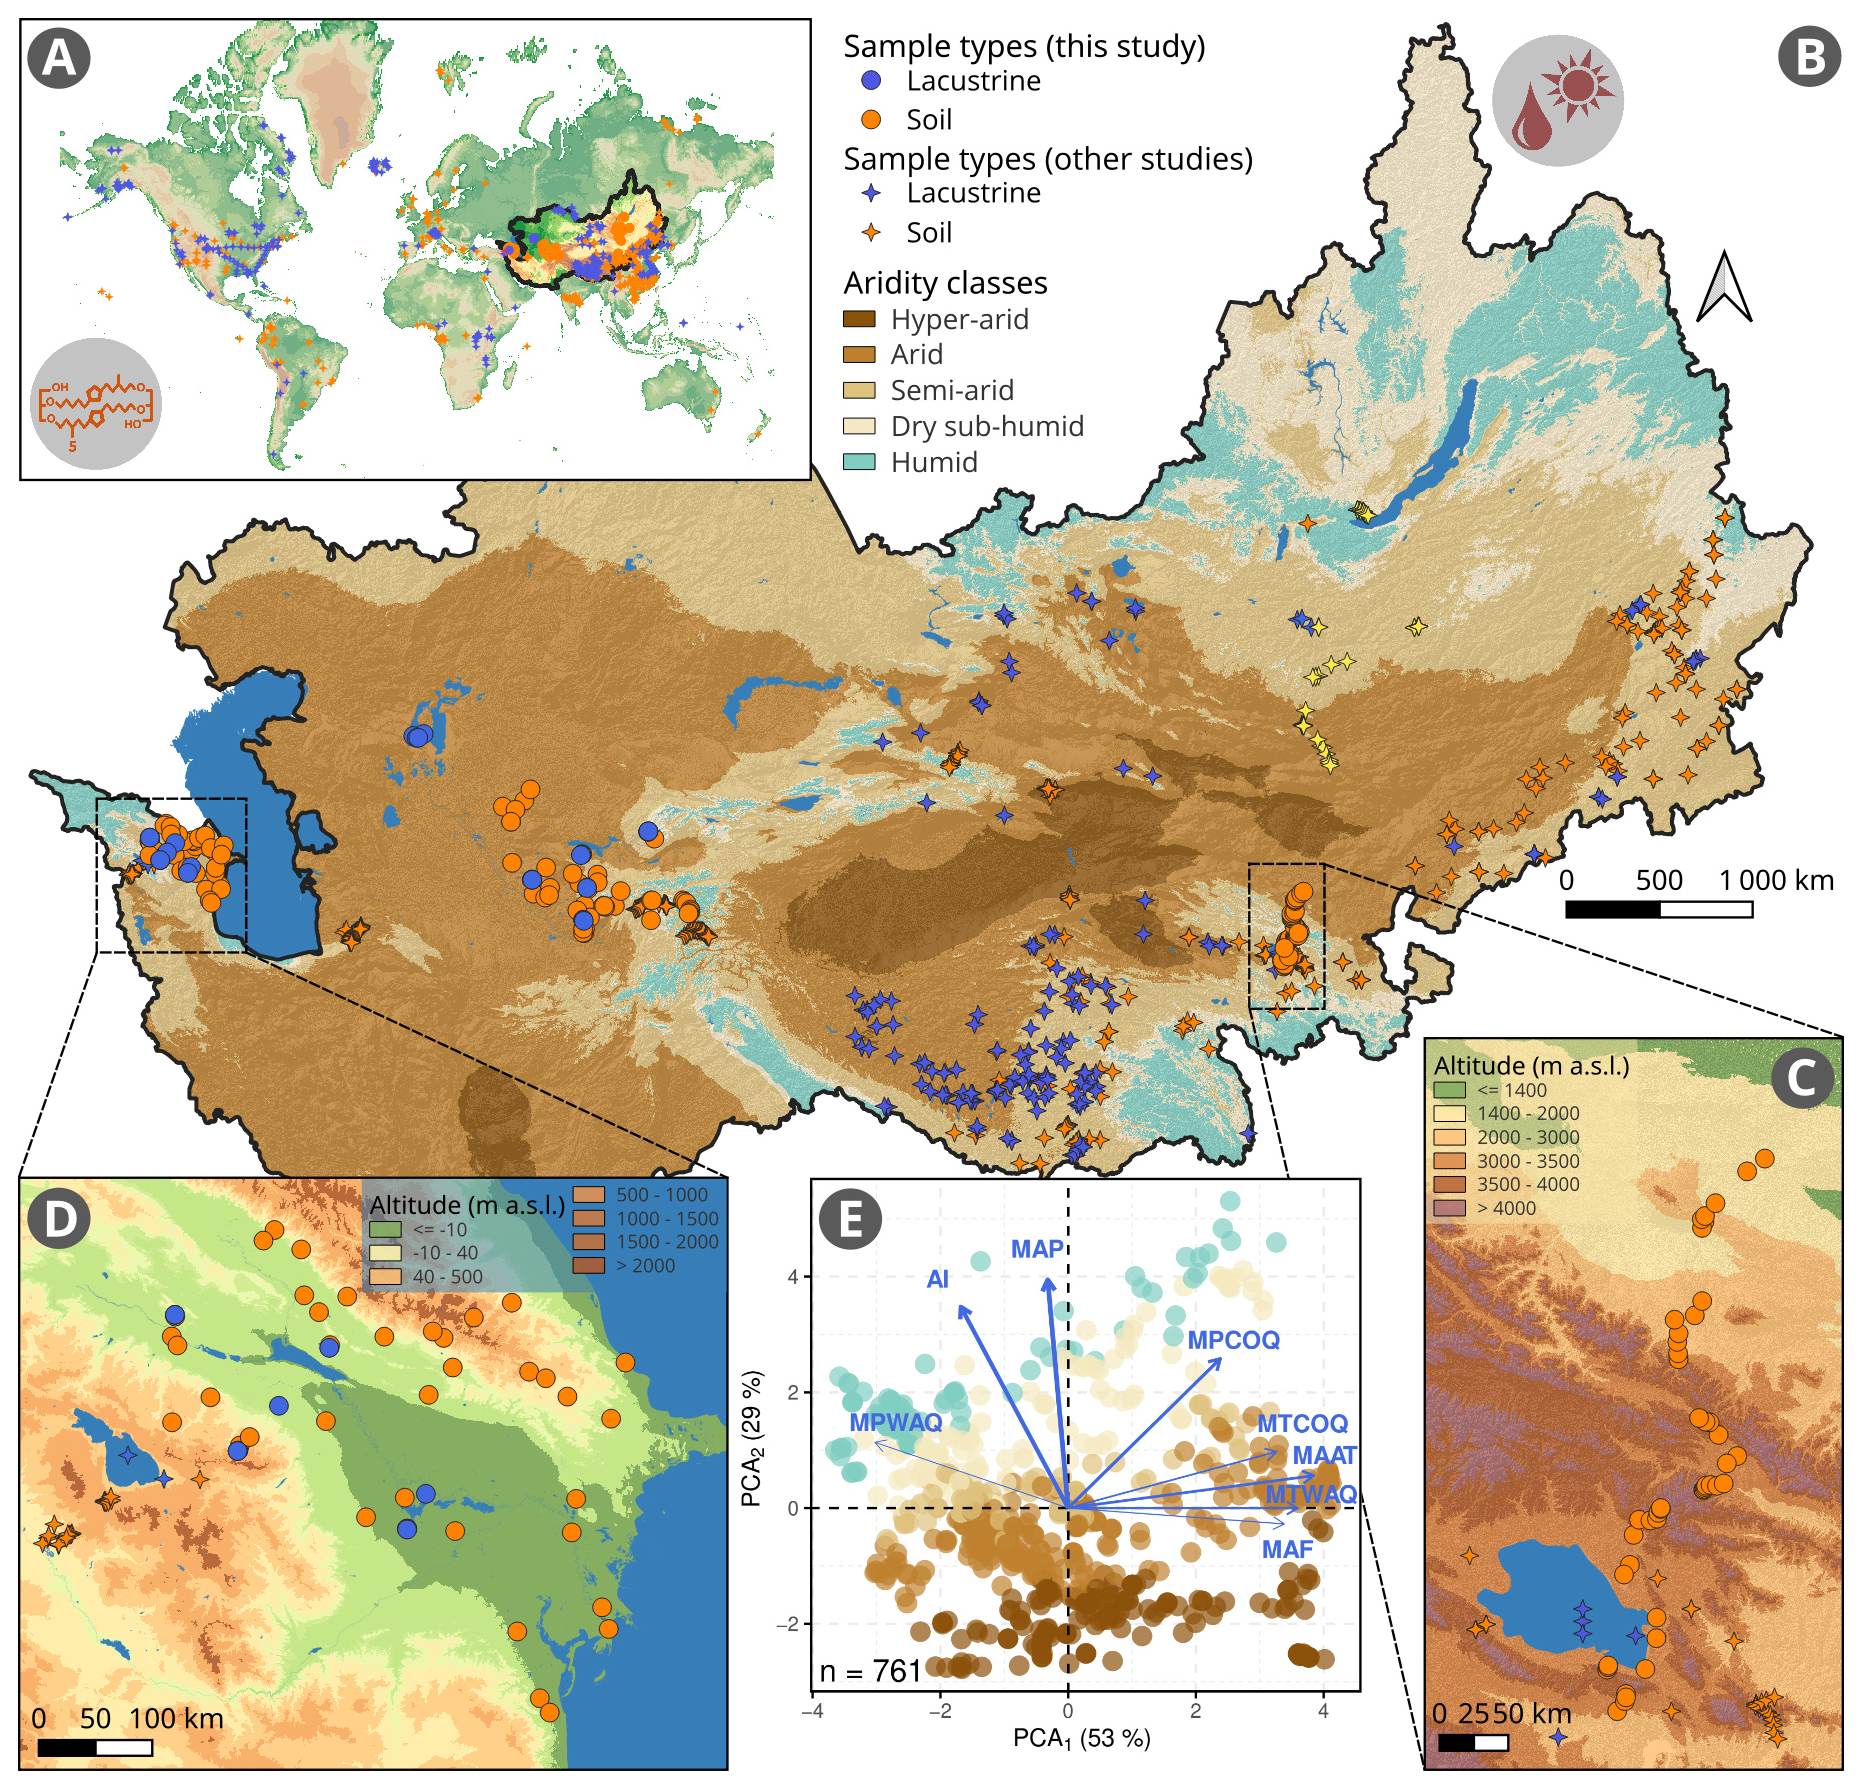
Figure 1Distribution map of the global surface samples presented in this study (WDB, A) followed by the extent of the Arid Central Asian brGDGT surface Data Base (ACADB, B) and local focus on (C) Qilian Shan and (D) Caucasus surface samples. (E) distribution of brGDGT sampling sites in the ACA bioclimate space. The elevation map comes from SRTM Digital Elevation Model version 4.1 (Jarvis et al., 2008), the Aridity Index from CGIAR (Trabucco and Zomer, 2019) and the extracted climate parameters from worldclim2.1 (Fick and Hijmans, 2017) with mean air temperature of Months Above Freezing, Mean Annual Air Temperature, Mean Annual Precipitation, Mean Temperature/Precipitation of the Cold and Warm Quarters.
The interaction across potential contributing factors introduce various biases depending on geographic and climatic contexts. While these controlling factors have been extensively studied in tropical regions and high-latitude or high-altitude environments (Pérez-Angel et al., 2020; Raberg et al., 2021; Zhao et al., 2021; Häggi et al., 2023), they remain poorly constrained in semi-arid to hyper-arid areas (Yang et al., 2014; Duan et al., 2020; Guo et al., 2021). In drylands, limited and erratic precipitation is the primary water input, critically influencing soil moisture. This persistent water deficit intensifies aridity, which is defined by the imbalance between precipitation and evapotranspiration (Trabucco and Zomer, 2019). Such bioclimatic stress affects soil chemistry, often reducing leaching and causing the accumulation of base cations (e.g., calcium, magnesium), which contributes to alkaline soils with low organic matter content (Muhammad et al., 2008). Coarse-textured, well-drained soils are also common, increasing the occurrence of gypsum or saline profiles (Plaza et al., 2018). Additionally, sparse vegetation – further stressed by intense grazing pressure – exacerbates land degradation (Maestre et al., 2022). The combined effects of aridity and overgrazing increase soil vulnerability to erosion, reinforcing a cycle of organic matter depletion, nutrient loss, and alkaline soil dominance (Moreno-Jiménez et al., 2019). As a result, brGDGT-based reconstructions in drylands are especially prone to biases driven by bare soil conditions, aridity, and soil chemistry impacts on bacterial communities.
Primarily arid soils, characterized as soils receiving less than 500 mm yr−1 (Peterse et al., 2012; Yang et al., 2014; Guo et al., 2021), present higher brGDGT variability and a particular isomer distribution (Guo et al., 2021). The comparison of soil samples from drylands indicates a dissimilarity to global brGDGT databases (Yang et al., 2014; Dearing Crampton-Flood et al., 2020; Véquaud et al., 2022). The main difference is the higher frequency of 6- compared to 5-methyl compounds (Duan et al., 2020). This distinct methylation process may explain the reduced statistical strength for brGDGT-temperature calibration under arid conditions (Peterse et al., 2012; Wang et al., 2019). Moreover, the temperature control over tetramethylated compounds may be related to 5- or 6-methyl assemblages in diverse contexts, likely due to specific bacterial communities (De Jonge et al., 2019; Ajallooeian et al., 2025), mitigating the reliability of -based temperature reconstruction (Wang et al., 2024). Additionally, Duan et al. (2022) report the influence of pH and, in particular, alkalinity on the distribution of brGDGTs in dry soils. A few recent studies have reported the impact of salinity on brGDGTs (Wang et al., 2021; Raberg et al., 2021; Kou et al., 2022; So et al., 2023). Salinity is thought to influence the relative number of 5-, 6- and 7-methyl isomers in some environmental contexts (Wang et al., 2021). Besides, substantial variation of the 5- over 6-methyl ratio (IR6Me) are also observable in freshwater environments (e.g., Novak et al., 2025). These variations of isomer abundances impact the - and -based temperature reconstructions (Kou et al., 2022; So et al., 2023). Although several palaeosalinity proxies have been proposed to address these biases, significant work remains to be undertaken, for instance, on the precise ionic composition of soil (Chen et al., 2022; De Jonge et al., 2024a). Among the possible solutions to reduce these biases, the brGDGT-temperature relationship independent of these two indexes includes Multiple linear Regressions (MR; De Jonge et al., 2014; Raberg et al., 2021), Bayesian calibrations (Dearing Crampton-Flood et al., 2020), and machine learning approaches (Véquaud et al., 2022). However, the coupled effects of aridity, pH and salinity on soil, loess, and lacustrine archives can significantly alter the interpretations of brGDGT-based climate reconstructions in the ACA region (Lin et al., 2024).
This study relies on the first regional database of surface brGDGT samples for drylands, aiming to identify the key climate and environmental parameters influencing their distribution. This dataset, referred to as the Arid Central Asian brGDGT Surface Database (ACADB), includes brGDGT assemblages from various sites across the region, totalling 753 samples. This dataset was compiled by Dugerdil et al. (2025b) to train machine learning models for climate reconstructions. The dataset combines 162 new samples collected across four ACA countries with 599 previously published records (Fig. 1). In Dugerdil et al. (2025b), machine learning calibrations outperformed traditional linear models, suggesting that confounding factors weaken linear brGDGT–temperature relationships. The present study tests this hypothesis by analysing modern brGDGT distributions against key climate parameters, including aridity, temperature (both Mean Annual Air Temperature, MAAT, and the seasonal mean temperature of Months Above Freezing, MAF), and precipitation, as well as chemical characteristics such as pH, salinity, and sample type (soil or lacustrine). The results are then compared with the global Worldwide brGDGT Surface Database (WDB; modified from Raberg et al., 2022a) to assess whether similar brGDGT patterns are observed at both regional and global scales. The methodological approach is synthesized in Fig. 2. Following this workflow, this study raises the following questions:
-
Which confounding factor – pH, aridity, salinity, or sample type – has the most significant impact on brGDGT-temperature calibrations in drylands?
-
Are the and reliable for reconstructing past temperature in this context?
-
Can we apply aridity- or salinity-related indices to soil and lacustrine samples similarly, or do we need to develop new indices or calibrations to track these controlling factors?
2.1 Study sites
This study pools samples from four different ACA countries: Azerbaijan, China (from the Qaidam Basin to the Qilian Mountains), Tajikistan, and Uzbekistan for a total of 162 samples (Fig. 2, step 1 and Dugerdil et al., 2025b). No data has previously been analysed for Azerbaijan and Uzbekistan. All site coordinates and geographic features are presented in Fig. 1 and in Table S1 in the Supplement. From the Caucasus, 48 surface sites are presented from Azerbaijan. Prior to the field campaign, sample locations were defined using a randomized selection procedure within a GIS framework to enhance the bioclimatic and ecological representativeness of the dataset (Bunting et al., 2013). Thus, the dataset covers all of Azerbaijan, from the Great Caucasus to the Hyrcanian forest in the Talish Range, through the Lesser Caucasus Range, the Mil Plain, and the Kura Valley (Fig. 1B). In China, an altitudinal/latitudinal gradient from the Qinghai Plateau to the southern part of the Gobi Desert, through the Qilian Shan Range, presents 48 new surface samples (Fig. 1C). For the Tajikistan-Uzbekistan database (TUSDB), the 66 sites come from the Aral Sea basin to the high Pamir-Alai Range. The site location and climatic presentation of the TUSDB is also available in Dugerdil et al. (2025c). The summarized information of each dataset is gathered in Table 1.
Wang et al. (2021)Cromartie et al. (2025)Dugerdil et al. (2025b)Wang et al. (2020)Wang and Liu (2021)Zang et al. (2018)Dang et al. (2018)Guo et al. (2021)Li et al. (2017)Dugerdil et al. (2025b)Duan et al. (2020)Kou et al. (2022)Dearing Crampton-Flood et al. (2020)Naafs et al. (2017a)Dugerdil et al. (2021a)Duan et al. (2022)Dugerdil et al. (2021a)Chen et al. (2021)Dugerdil et al. (2025b)Dugerdil et al. (2025b)Raberg et al. (2022b)Table 1BrGDGT dataset compiled in the Arid Central Asian Database (ACADB) and Worldwide Database (WDB) with their associated average climate parameters, data description (covered countries, dataset size, and site elevation), and original publications. Data from Dugerdil et al. (2025b) are highlighted by a * for a total sum of 162 surface samples.
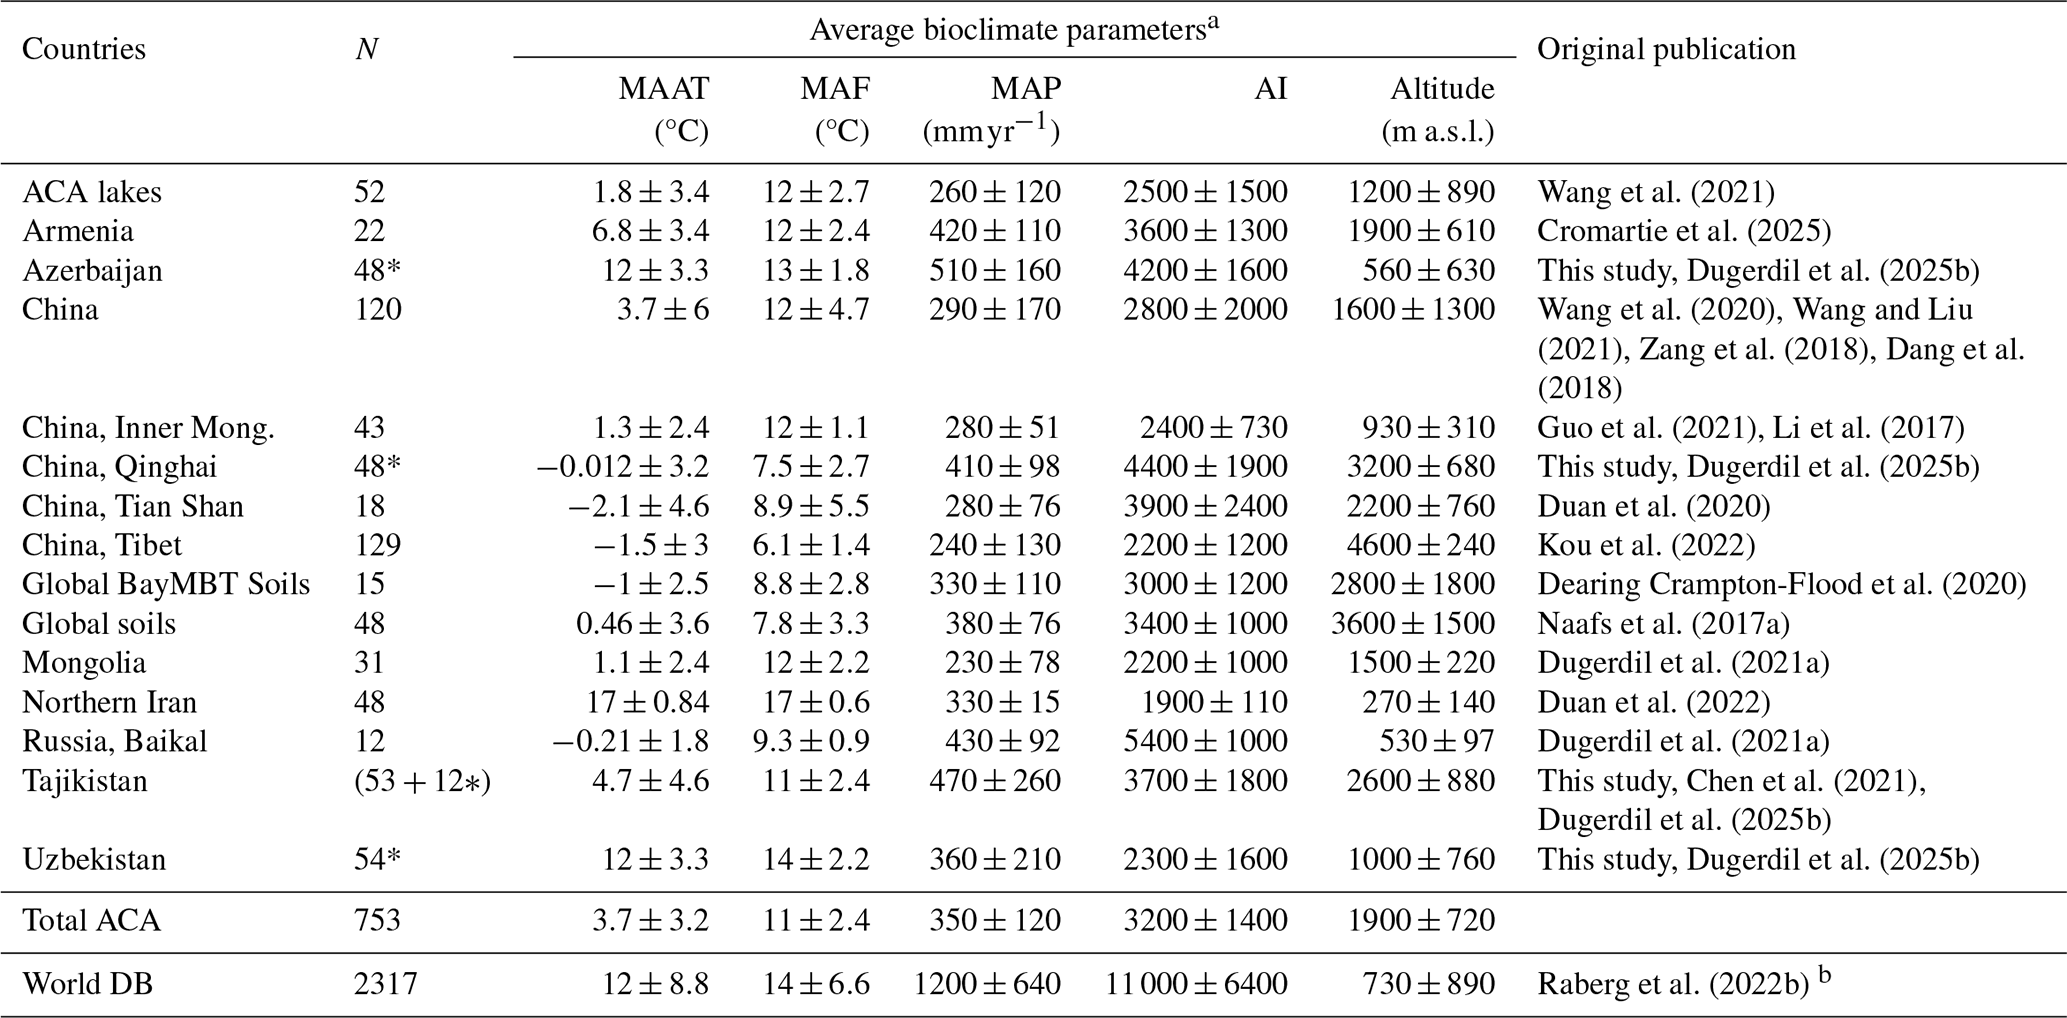
a Bioclimate parameters refer to Mean Annual Air Temperature (MAAT), mean air temperature of Months Above Freezing (MAF), Mean Annual Precipitation (MAP), and Aridity Index (AI). Data were extracted from worldclim2.1 (Fick and Hijmans, 2017) and CGIAR (Trabucco and Zomer, 2019). b for all original publications compiled in Raberg et al. (2022b), please report to Table S2 in the Supplement.
Temperature and precipitation maps for the ACA are provided in Fig. 2 from Dugerdil et al. (2025b), and additional ACA climographs are shown in Fig. S1 in the Supplement. MAAT for the ACADB has an average value of 3.7±3.2 °C and it is balanced between warm/mild environments (MAAT >10 °C), mainly on the western part of the ACA covering Caucasus (Armenia, Azerbaijan) and Middle Asia (Uzbekistan and Tajikistan), and colder continental environments (MAAT <3 °C) located in Central Asia (i.e., the southern part of Siberia, the Mongolian plateau, and the Tibetan-Qinghai plateau in China, Table 1). On the opposite, the MAF is more homogeneous with low MAF in China (MAF = 7.5±2.7 °C) and high MAF in Tajikistan and Uzbekistan (13±2.5 °C). This is due to the higher seasonality in continental Central Asia than in the Caucasus and Middle Asia (Fig. S1 in the Supplement). Similarly, Mean Annual Precipitation is spatially homogeneous, with consistent low values of 410±140 mm yr−1. However, the seasonal precipitation pattern varies greatly across ACA. In the western region – including the Caucasus, Iran, and Middle Asia – winter dominates, with up to 65 % of annual rainfall occurring during this season. In contrast, the eastern region, encompassing the Central Asian plateaus and southern Siberia, receives up to 87 % of its precipitation in summer (Chen et al., 2024). This spatial diversity within the ACA likely induces important heterogeneity in the bacterial growth season (i.e., fall and spring in western ACA, summer in eastern ACA, Fig. S1 in the Supplement). In arid environments, brGDGT production may be influenced by water availability, potentially increasing during the rainy season. This could bias reconstructed temperatures toward rainy-season conditions (De Jonge et al., 2014). The ACA altitudinal gradient reached by the database covers −28 to 4038 m a.s.l. with an average value of about 1600 m a.s.l.
2.2 Environmental parameters
The newly described samples from this study (n=162) are grouped into two main sample types: soil (n=143) and lacustrine (n=19) samples. Here, soil means a sample collected on the surface from several subsamples collected within 1 m2 area and from the upper 5 cm part of the soil layer. Lacustrine corresponds to samples from lake sediment core tops or surface sediments. The majority of these lakes are in arid environments, seasonally dried, and associated with temporary ponds. For lacustrine samples, 1 cm3 of the upper parts of several core tops were sampled using a die-cut or from the upper 5 cm of the surface sediment. For more details on the sample type description, please refer to Dugerdil et al. (2021a). For the sampling method of the already published samples, refer to the original publications (Duan et al., 2020, 2022; Wang et al., 2021; Raberg et al., 2022b; Kou et al., 2022). In total, the ACADB is composed of 560 soil and 193 lacustrine samples.
Following the field campaign, samples were stored at freezing temperature and analysed at the earliest opportunity to minimise post-sampling alterations of brGDGT distributions and chemical properties that may arise from ongoing microbial metabolic activity. The chemical characteristics of the ACA surface samples include pH and Electro-Conductivity (EC, Fig. 2, step 2), both measured ex-situ in the laboratory, even for lacustrine samples. These measurements were performed in the Montpellier laboratory using a HANNA Instruments HI991301 after a two-points calibration for pH and a single calibration for EC (mS cm−1). Salinity, in terms of Total Dissolved Solids (TDS), was extrapolated from the EC following Rusydi (2018), Eq. (1):
with TDS in mg L−1 extrapolated from the EC at ambient temperature (ECT) in mS cm−1 corrected by a conversion factor depending on the sample type (Rusydi, 2018). In Tibetan Plateau, the selected values are 0.65 or 0.8 (values from Supplementary Materials in Kou et al., 2022). Due to the wide range of salinity values among samples, it is mainly expressed in log10 (Kou et al., 2022). For new samples, a α of 0.65 was applied in this study to convert EC in TDS (i.e., in salinity). The ECT is temperature compensated with Eq. (2):
where β=1.9 % is the temperature correction coefficient, T is the temperature in degrees Celsius, and EC25 °C is the electrical conductivity standardized to 25 °C, as conventionally defined. For the salinity of samples published in Wang et al. (2021) and Kou et al. (2022), please refer to the method section of both publications. The TDS values were used to provide four salinity classes (fresh, hyposaline, saline and hypersaline). The cut-off values were derived from Rusydi (2018) and refine for the ACADB using a sensitivity analysis (Table S3 in the Supplement). In the ACADB, salinity values are available for 113 soil and 67 lacustrine samples.
Since only a few weather stations are available in ACA, extrapolated values from GIS databases were preferred to infer the climate parameter controlling the brGDGT distribution. Using GIS R packages (rgdal, version 1.6-7 and raster, version 3.6-30; Bivand et al., 2015; Hijmans, 2023), climate parameters were extracted from worldclim2.1 (Fick and Hijmans, 2017) and the extrapolated Aridity Index (AI) from the CGIAR database, (version 2; Trabucco and Zomer, 2019) for each surface sample from the ACA. The parameters used include Mean Annual Air Temperature (MAAT), Mean Annual Precipitation (MAP), and seasonal variables such as the mean air temperature of Months Above Freezing (MAF), as well as Mean Precipitation and Temperature for the Cold and Warm Quarters (MPCOQ, MPWAQ, MTCOQ, and MTWAQ).The AI is calculated using the formula Eq. (3):
where MA[ET0] represents the Mean Annual Reference Evapotranspiration (Trabucco and Zomer, 2019). It is noticeable that AI increases in humid environments and decreases in arid to hyper-arid systems. The cut-offs and colour scale for aridity classes (hyper-arid, arid, semi-arid, dry sub-humid, and humid) used in this study are detailed in Table S3 in the Supplement and follow the classification defined by Middleton and Thomas (1997).
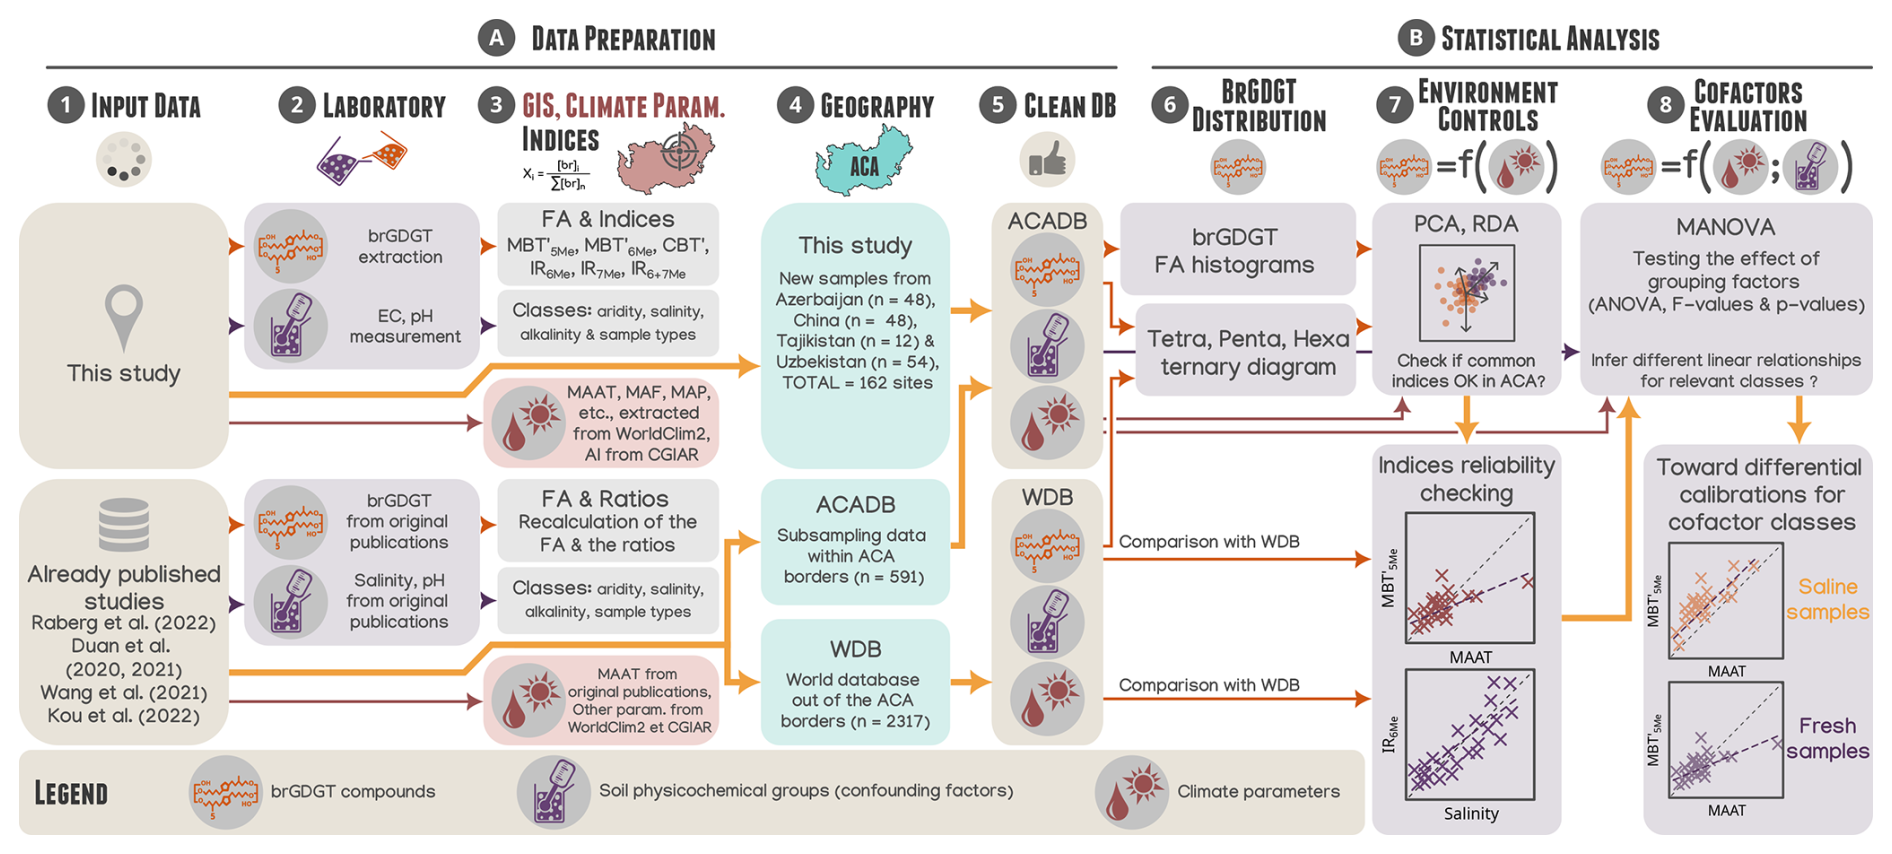
Figure 2Methodological workflow followed in this study: from the first methodological step (input data – left-hand side) to the final results and perspectives. Each column of boxes represents a methodological step carried out for the data process (A) and the statistical analysis (B).
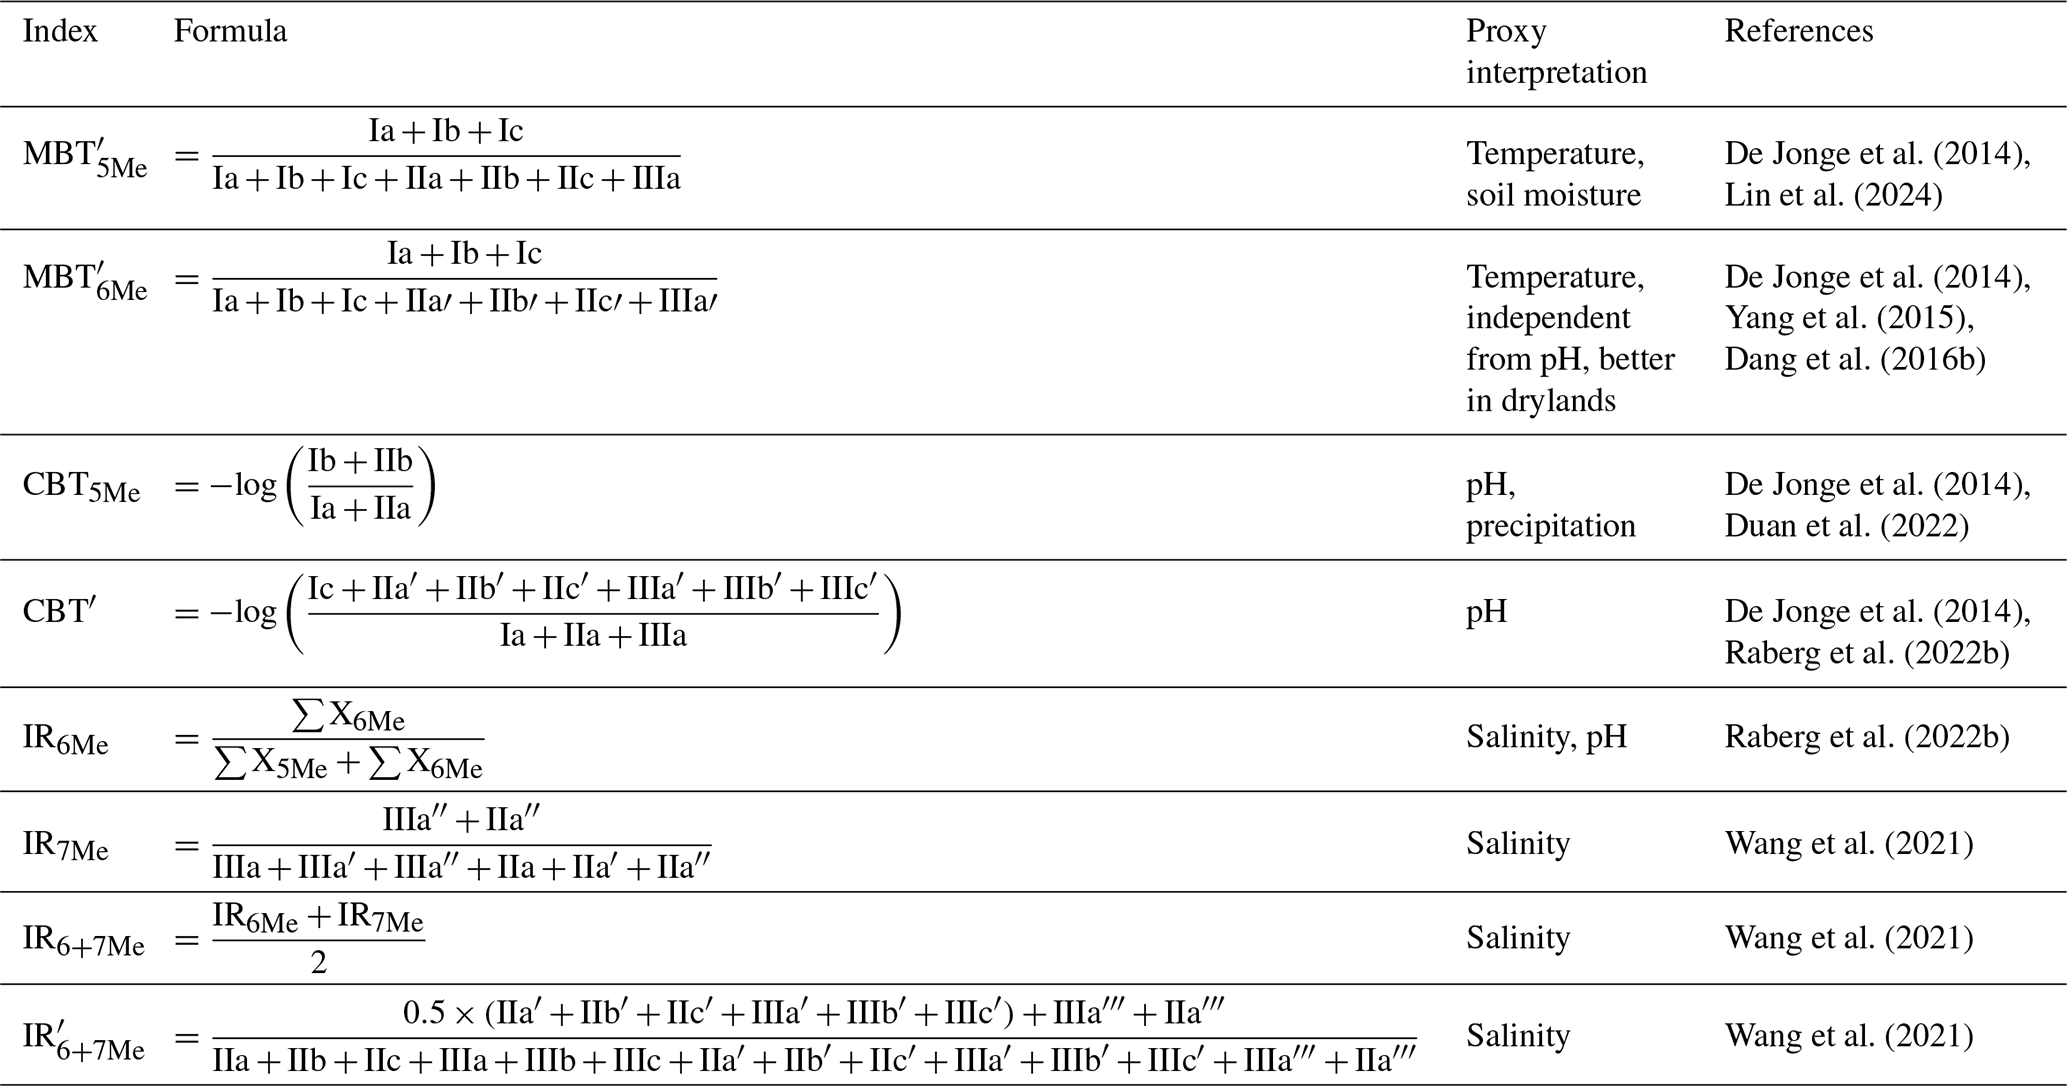
Table 2Main GDGT indices discussed in this study with their formula, their main interpretations and their references.
2.3 GDGT analytical methods
BrGDGTs were analysed (Fig. 2, step 2) following the laboratory protocol fully detailed in Dugerdil et al. (2021a) and Davtian et al. (2018). First, we ground approximately 1 cm3 of the soil or lacustrine samples in order to weigh them after a 24 h lyophilization process. Then, total lipid content (TLC) was extracted twice from the sample by microwave-assisted extraction (MAE) at a temperature of 70 °C using DCM : MeOH (3:1, ). Following Huguet et al. (2006), a known concentration of an internal standard (C46 GTGT) was added to each TLC to estimate the absolute concentration of each GDGT compound. The TLC was separated into two fractions by elution on SiO2 a column with hexane : DCM (1:1, ) and DCM : MeOH (1:1, ). The polar fraction containing br- and isoGDGTs was then dried under N2 before being re-dissolved in hexane : iso-propanol (98:2) solvent prior to injection. Analyses were performed using a high-performance liquid chromatography coupled to mass spectrometry equipped with atmospheric pressure chemical ionization (HPLC/APCI-MS, Agilent 1260 Infinity coupled to a 6120 quadrupole mass spectrometer). This method allows to distinguish 5-methyl and 6-methyl isomers for each compound (Hopmans et al., 2016). The entire analytical process was carried out in the geochemistry laboratory LGLTPE at ENS de Lyon. GDGTs were detected using Single Ion Monitoring (SIM). The protonated molecules were detected at 1302, 1300, 1298, 1296, 1292, 1050, 1048, 1046, 1036, 1034, 1032, 1022, 1020, 1018, and 744 (C46). Finally, we manually integrated each br- and isoGDGT based on the ratio and retention time in order to identify each compound of brGDGTs with their 5-, 6- (De Jonge et al., 2014), and 7-methyls isomers (Ding et al., 2016). Following De Jonge et al. (2014), the Roman numerals represent different GDGT structures. The 6-methyl brGDGTs are marked with an apostrophe after the Roman numerals to differentiate them from their 5-methyl isomers, and two apostrophes represent the 7-methyls (Ding et al., 2016). The measurement accuracy of the GDGT analysis method was assessed through the inter-calibration exercises conducted in 2023 (De Jonge et al., 2024b).
2.4 brGDGT indices calculation
Based on raw GDGT integrations, we calculated absolute concentrations expressed in ng g (Huguet et al., 2006) and fractional abundances (FA; De Jonge et al., 2014) using a R routine (Fig. 2, step 3). The classical indices of methylation for 5- and 6-methyls ( and ) and cyclisation (CBT′ and CBT5Me), as well as, the isomer ratios (IR6Me, IR7Me, IR6+7Me and ; Wang et al., 2021) are also calculated and summarized in Table 2. To avoid overloading this study with multiple indices, we do not assess the Degree of Cyclisation index (DC; Sinninghe Damsté et al., 2009), nor its updated version incorporating 5- and 6-methyl isomers (Baxter et al., 2019). Although the DC index more accurately reflects changes in the number of internal cyclopentane rings than the CBT index (which track both isomers and cyclisations), we focus solely on CBT, as it is more commonly used in brGDGT studies from drylands (Guo et al., 2021; Chen et al., 2021; Duan et al., 2022).
2.5 Database compilations
Two databases are compared in this study (Figs. 1 and 2, steps 4 and 5). The Arid Central Asian Data Base (ACADB, n=753) gathers samples from Dugerdil et al. (2025c) used to train machine learning calibrations, as well as samples collected from previously published studies, listed in Tables 1 and S2. Among them, the majority of the sites were already cleaned and homogenized by Raberg et al. (2022b). We appended the northern Iranian samples (Duan et al., 2020, 2022) and the Sibero-Mongolian samples that have already been published in Dugerdil et al. (2021a) as the New Mongolian–Siberian Database (NMSDB). This dataset gathers 44 different sites from the Baikal basin to the northern part of the Gobi Desert (Fig. 1B and geographical details on Fig. 1 from Dugerdil et al., 2021a). The NMSDB is composed by 27 moss polsters, 15 soil samples and two lacustrine core tops. As the GDGT distribution is similar for soil samples and moss polsters (Dugerdil et al., 2021a), we included the moss polsters within the soil sample type in the present study. From Cromartie et al. (2025), we appended 22 samples from Armenia, which follow an altitudinal gradient from the Ararat plain to the high plateau surrounding Lake Sevan (Fig. 1D). The salinity and 7-methyl FAs from Chinese data were also added (Wang and Liu, 2021; Kou et al., 2022). Among the ACADB (n=753), there are 560 soil and 193 lacustrine samples. In order to compare the ACADB results, we also compiled a global Worldwide brGDGT surface Data Base (WDB, n=1322) based on Raberg et al. (2022b) and Kou et al. (2022).
2.6 Statistical treatment
2.6.1 Univariate and multivariate analysis
Using R (version 4.4.2; R Core Team, 2025), we performed univariate linear relationships and multivariate analyses to understand environmental controls on brGDGT distributions (Fig. 2, step 7). The reliability of univariate relationships was inferred by Pearson's r, coefficient of determination (R2), adjusted-R2 (), p values, and Root Mean Square Error (RMSE). The multivariate analyses were conducted with the vegan package on scaled data (version 2.6-8; Dixon, 2003) and included Principal Component Analysis (PCA) on the brGDGT matrix and Redundancy Analysis (RDA) combining the brGDGT and surface climate parameters matrixes (Dixon, 2003). PCA is an unconstrained ordination that reduces data dimensionality by identifying axes (principal components) capturing the most variance. RDA is a constrained ordination that explains variation in GDGTs using environmental variables. To meet the assumptions of linearity and normality required for both analyses, environmental variables were standardized using the scale() function, while the FAs of each brGDGT compound were transformed using the Hellinger transformation (Eq. 4), which down-weights dominant compounds.
with FAi,j, the FA of compound j in the sample i. Since the 7-methyl FAs are not available for all samples in the compiled studies, they were removed from the databases for multivariate analysis. To select the most reliable environmental driving factors to apply into the RDA, a Variance Inflation Factor analysis (VIF, a method highlighting the covariance between factors) was performed on climate parameters and soil characteristics (pH and TDS) using the vif.cca() function from the same R package. To limit the covariance between them, only environmental factors below a threshold (e.g., below 10; Cao et al., 2014) were kept for the RDA analysis and the following steps of the statistical workflow. The configurations of the two PCAs (for soil and lacustrine samples) were compared using a Procrustes rotation analysis (i.e., comparing the similarity between PCA and RDA ordination patterns by rotating one configuration to best match the other) and a PROTEST significance test (i.e., quantification of the fitting degree via permutation test) between the two PCAs using the package vegan (Dixon, 2003). The same method was applied to compare the RDA brGDGT vs. climate parameters for soil and lacustrine samples. Finally, linear relationships inferred between brGDGT indices and environmental factors follow Pearson's correlation (only coefficients of determination with p value <0.001 are displayed on figures).
2.6.2 Grouping factor analysis
Samples were grouped by pH, aridity, salinity, and sample type to evaluate the most influential controlling factors. The applied cut-offs to bin classes are displayed in Table S3 in the Supplement. To identify data grouping patterns in relation to bioclimatic parameters, sensitivity analyses were conducted in R by calculating the determination coefficients (multiple R2 and R2 for groups above and below cut-off values) across a continuous range of cut-offs. For example, pH cut-offs were tested from 4 to 11 in 0.01 increments. Multivariate Analysis of Variance (MANOVA) was performed with the manova() function to detect the most important environmental factors driving the variance among the 15 brGDGT FA (only the 5- and 6-methyls were selected) and among the main GDGT indices (Fig. 2, step 8). Then, the univariate ANOVA results were obtained with summary.aov() for each brGDGT compound and index. Both functions come from the stats R base package (version 4.4.2; R Core Team, 2025). The MANOVA tests for differences in multiple dependent variables across different groups to see if group means are significantly different, while the ANOVA tests for differences in the means of a few groups to determine if at least one group mean is significantly different. The assumption of multivariate normality was tested with Mardia's Skewness and Kurtosis tests (i.e., MANOVA is possible only if the two p values are higher than 0.05; Mardia, 1970). The assumption of homogeneity of variance-covariance was tested for each variable and each grouping factor using the Levene's test (Bierens, 1983). Using the most relevant controlling factors, specific -based temperature calibrations were done for each grouping factor. To compare the linear relationship among groups, the significance of the difference was carried out with the z-statistic following Clogg et al. (1995), Eq. (5):
with βn the coefficients and SEn the standard errors of the linear regressions among the n groups. The p values for the z-statistics are inferred with a normal distribution. The same z-statistic approach (Eq. 5) was applied to determine the significance of the difference between each linear model intercept (i.e., here, the offset between each calibration). The z-statistic was preferred to the t test since the number of samples is large (e.g., more than 30 samples; Moore et al., 2009). All statistical treatments and graphical representations (except the map done with QGIS 3.34 Pritzen and the methodological workflow done with Inkscape) were performed in R. The plots were designed with the ggplot2 package (version 3.5.1; Wickham, 2016) and, more particularly, the ggtern (version 3.5.0; Hamilton and Ferry, 2018) for the ternary diagram (Fig. 2, step 6).
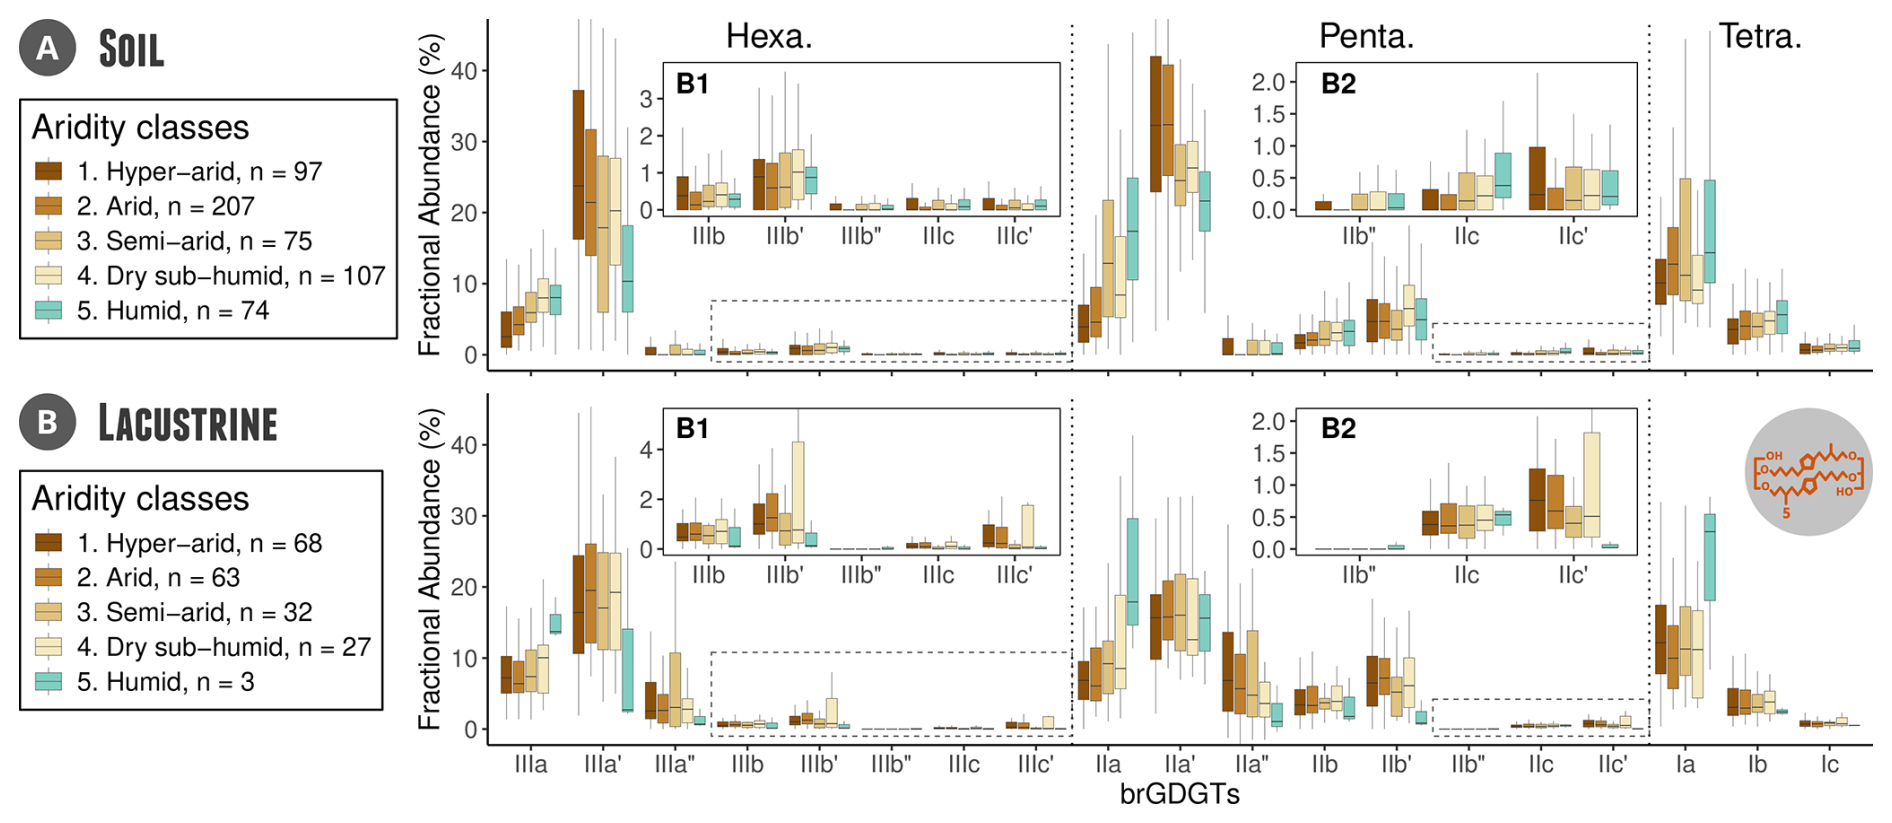
Figure 3Distribution of individual brGDGTs grouped by aridity index, following the five aridity classes (Middleton and Thomas, 1997) in the ACADB for soil (A) and lacustrine samples (B). The brGDGT fractional abundances (FA) are displayed with ′ for the 6-methyl and ′′ for the 7-methyl isomers. The hinges of the boxplots show the 25 % (Q1) and 75 % (Q3) quantiles, the middle horizontal line indicates the median, and the whiskers extend to the most extreme data points that lie within 1.5× the inter-quartile range (i.e., Q3 − Q1). Points beyond the whiskers are considered outliers and are not shown here. The compounds of lowest abundances (mean value below 5 %) are zoomed on panels (A1), (A2), (B1) and (B2).
3.1 brGDGT distribution
3.1.1 brGDGT concentrations
The brGDGT absolute concentrations are estimated from the C46 internal standard method. To avoid biases from instrument drift (Huguet et al., 2006), only the samples analysed in the geochemistry laboratory LGLTPE at ENS de Lyon are described here. The dataset gathers 234 samples from Armenia, Azerbaijan, China, Mongolia, Tajikistan, Russia and Uzbekistan, published in Dugerdil et al. (2021a), Cromartie et al. (2025) and Dugerdil et al. (2025b). The brGDGT concentration is heterogenous among the dataset, and it mainly depends on the sampling site location and sample type. It varies between 674±2825, 87±314 and 342±1822 ng g for lacustrine, soil and the whole dataset, respectively. Lacustrine samples are much richer in brGDGT than soil samples (about ten times more concentrated). Among the soil samples, the more moisture in the soils, the higher the concentrations, from 149±594 to 24±33 . From hyper-arid and arid environments, samples from sand dunes are poorer than loess, silt-rich, and solonchak samples (i.e., samples from salt marshes). They are close to the detection level (i.e., integration peaks smaller than twice the noise level), thus increasing uncertainties for indices based on 6- and 7-methyls.
3.1.2 brGDGT fractional abundances
The brGDGT distribution is described from soil (Fig. 3A) and lacustrine samples (Fig. 3B). FAs for lowest abundances (i.e., mean value below 5 %) are given in panels (A1)–(B2). With regard to FAs in soil samples, the prevalent compounds are IIa′ (mean value ≃30 %), IIIa′ (≃22 %), Ia (≃14 %), IIa (≃10 %) and IIIa (≃6 %, Fig. 3A). In lacustrine samples, the distribution is dominated by IIIa′ (≃19 %), IIa′ (≃16 %), Ia (≃12 %), IIa (≃10 %) and IIIa (≃9 %, Fig. 3B). In contrast, compounds such as IIIb, IIIb′, IIIb′′, IIIc, IIIc′, IIb′′, IIc, and IIc′ are rare in both soil and lacustrine samples, with average abundances ranging from 1 % to 2 % (Fig. 3A1–B2). It is noteworthy that, for each compound, the 6-methyl isomers are more abundant than the 5-, and the 5- are more abundant than the 7-. The higher median values for the 6- over the 5-methyl isomers is more marked for soil than lacustrine samples. The 7-methyl isomers are more abundant in lacustrine than in soil samples. For both sample types, the boxplots reveal that brGDGT distributions vary across the different aridity classes, with median FAs shifting toward higher values with drier aridity classes: median IIIa increases in the humid class, while IIIa′ and IIIa′′ are higher in the arid and hyper-arid classes. A similar median shift is observed between IIc and IIc′. Additionally, IIa increases with wetter aridity classes, while the IIa′ distribution remains largely insensitive to changes in aridity classes for lacustrine but decrease with higher humidity for soil samples. Compounds Ia, Ib and Ic exhibit discernible variations between aridity classes, although the observed shifts are not unequivocal. Finally, aridity control is less evident in other low-abundance compounds, including the IIIb, IIIc, and IIb, and all 7-methyl isomers.
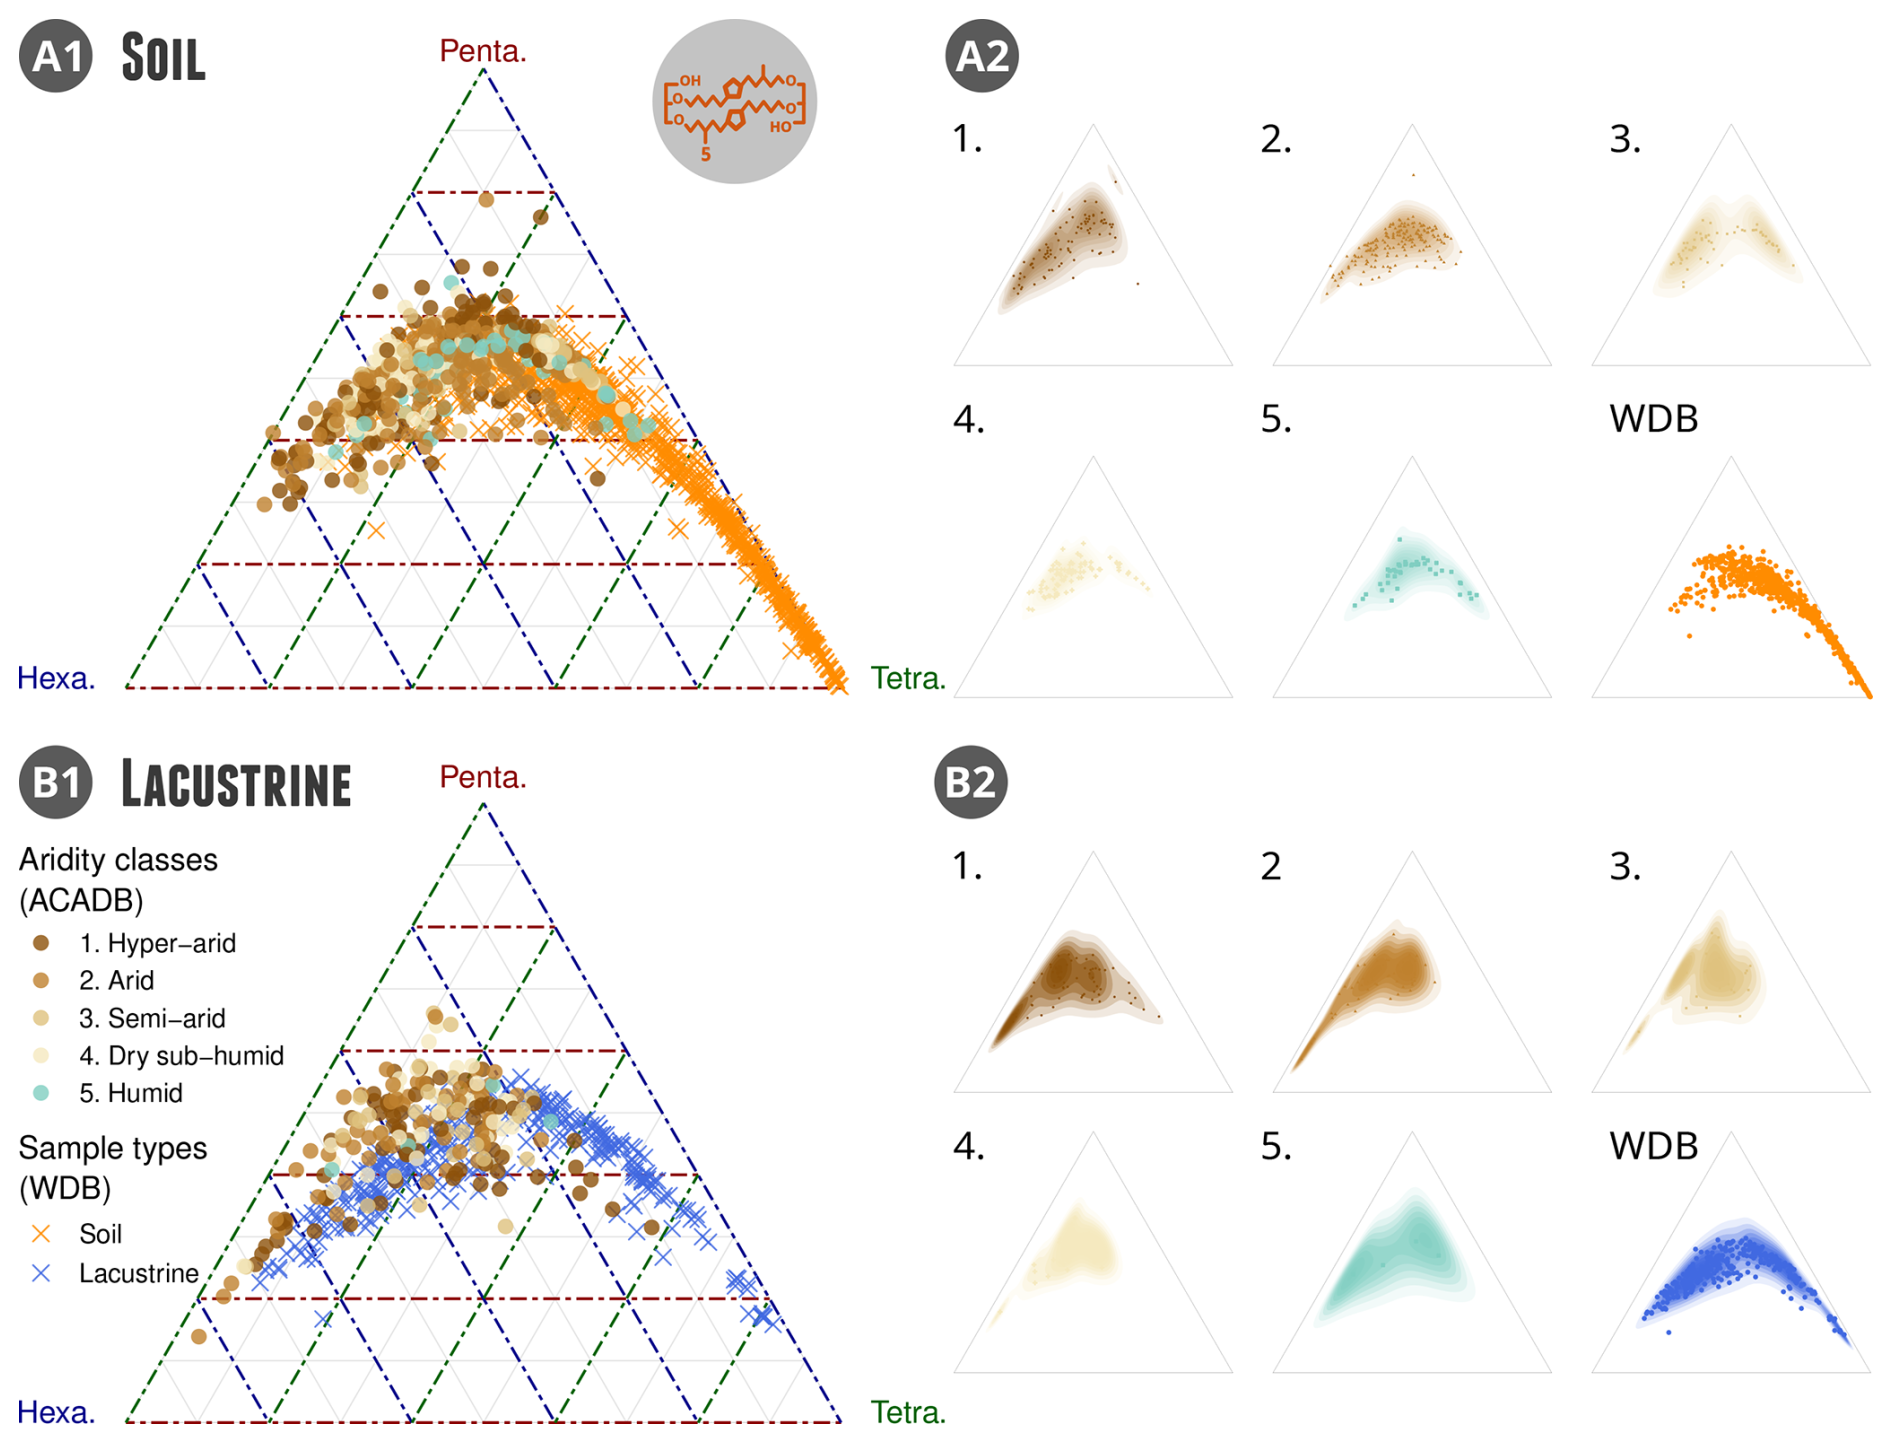
Figure 4Ternary diagram showing the relative importance of tetra-, penta-, and hexamethylated brGDGT compounds for (A) soil samples and (B) lacustrine samples. ACADB samples (dots) are compared to WDB ones (crosses). The plots are displayed by aridity classes. Panels (A1) and (B1) overlay the ACADB and WDB, while panels (A2) and (B2) distinctly present the distribution of each aridity class for soils (A) and lacustrine samples (B).
3.1.3 Methylation distribution
In soil samples from the ACADB, tetra-, penta-, and hexamethylated brGDGTs range from 0 % to 55 %, 20 % to 80 %, and 0 % to 85 %, respectively (Fig. 4A1 and A2). The distribution of hexamethylated compounds is the most variable in ACA. By contrast, in the WDB, brGDGT distributions are strongly centred around tetramethylated compounds, with only a few samples showing high hexamethylated fractions; the majority contain less than 20 % of hexamethylated compounds. About the aridity effect, ACADB samples from a humid environment fit the WBD distribution better, while arid and hyper-arid samples shift towards lower tetramethylated content.
Similarly, for lacustrine samples (Fig. 4B1 and B2), the ACADB shows tetramethylated brGDGTs ranging from 0 % to 60 %, pentamethylated from 10 % to 85 %, and hexamethylated from 10 % to 90 %. Compared to WDB, the croissant shape of the ternary distribution is retained but shifts towards less tetra- and more pentamethylated forms. For lacustrine samples, the distribution across aridity classes appears less contrasted than for soil samples. However, the samples from humid environments are spread along a bimodal distribution following the hexamethylated axis, while this is not the case for hyper-arid to dry sub-humid samples with hexamethylated above 20 %.
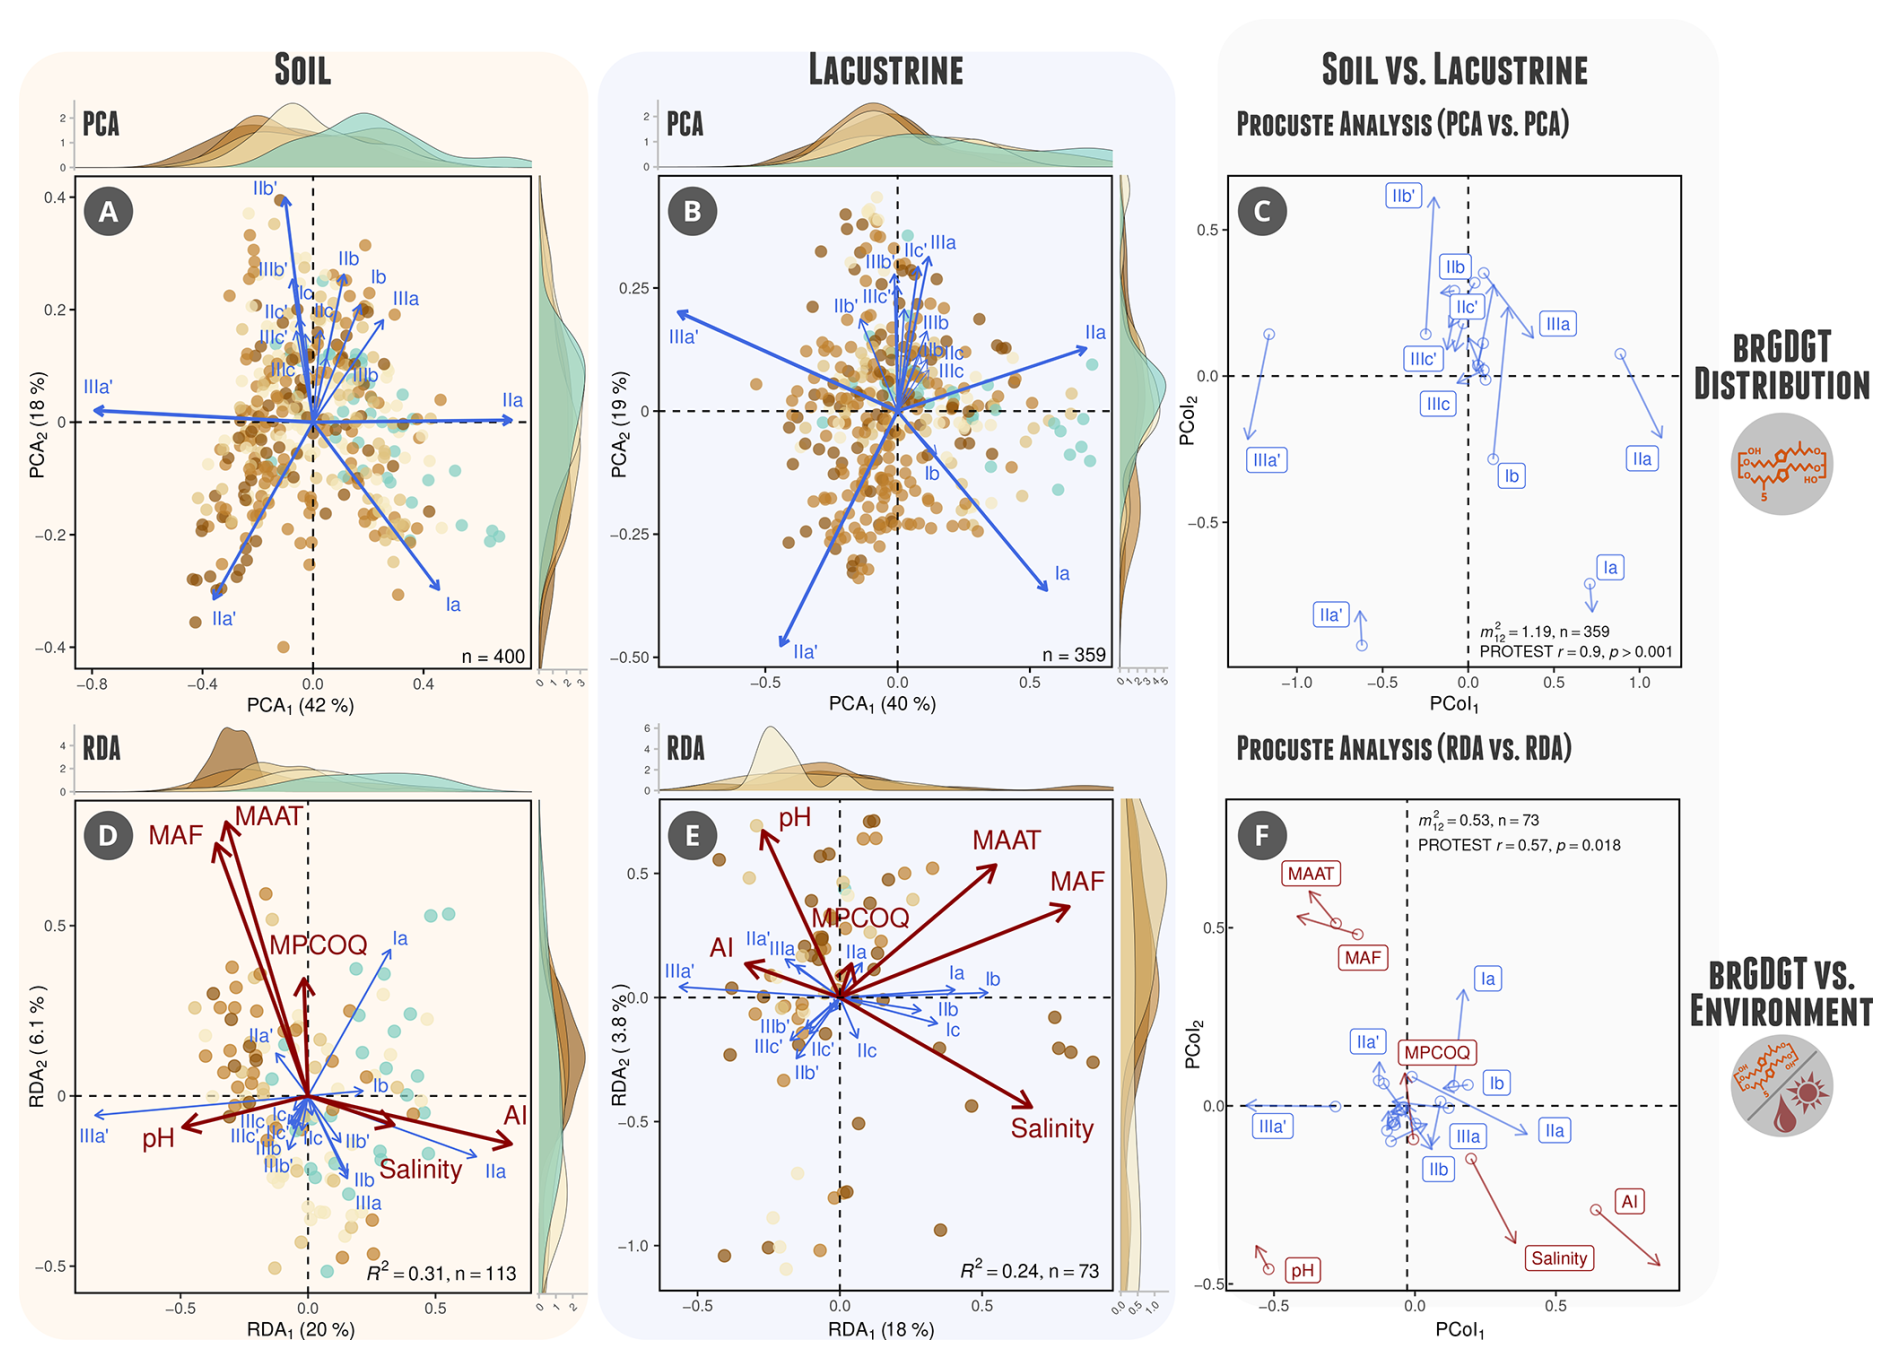
Figure 5Multivariate analyses of the ACA brGDGT surface samples highlighting the brGDGT distribution using Principal Component Analysis (PCA) for soil (A) and lacustrine (B) samples, and (C) the Procrustes rotation analysis to compare the distribution of the brGDGTs along the loadings of the two PCAs (i.e., multivariate configurations similarity assessment). Then, Redundancy Analyses (RDA) track the main environmental drivers of soil (D) and lacustrine (E) sample distribution, and the Procrustes rotation analysis compares them (F). Analyses were performed only on the 5- and 6-methyl due to the few number of 7-methyl measurements in the database. The most contributing environmental drivers (Aridity Index, salinity, mean air temperature of Months Above Freezing, Mean Annual Air Temperature, Mean Precipitation of the Cold Quarter, pH and Altitude) were selected using a Variance Inflation Factor test (i.e., VIF <10 for all). The PCA is performed on the whole ACA dataset (nsoil=400 and ), while the RDA only covers 113 soil and 67 lacustrine samples due to scarce pH and salinity measurements available. The colour code for dots corresponds to the five aridity classes.
3.1.4 brGDGT multivariate spaces
PCAs were performed on 400 soil and 361 lacustrine surface samples, using Hellinger-transformed FA values (Fig. 5A and B). The brGDGT loadings for the first and second components explain 42 % and 18 % for soil samples and 40 % and 19 % for lacustrine samples, respectively. For both, the most important contributing compounds are IIIa′, IIa, IIa′, and Ia, followed by IIb′, IIIa, IIIb′, IIc′, and IIIc′. PCA1 corresponds to a gradient between the 5- and 6-methyl isomers, with positive loadings for IIa, Ia, Ib, and IIIa and negative loadings for IIa′, IIIa′, and IIb′. PCA2 follows a gradient marked by the number of internal cyclisation: the positive loading is driven by compounds with one or two internal cyclisations (mainly IIb′, IIIb′, IIIc′, and IIc′), while the negative loading presents compounds without internal cyclisation (Ia and IIa′). About the distribution of aridity classes over this multivariate space (highlighted by the upper and lateral sample densities in Fig. 5A and B), the data distribution suggest that an aridity gradient can be superimposed on the isomer gradient (i.e., along PCA1 with humid samples on a positive loading and hyper-arid samples on a negative one). This gradient is clearer for soil than for lacustrine samples. In between, arid, semi-arid, and dry sub-humid samples show a higher internal cyclisation number (positive PCA2), giving a triangular shape to the sample distribution.
Procrustes rotation analysis, along with the PROTEST r and p values, was used to assess the similarity between the two PCAs (Fig. 5C). The statistical results reveal that the brGDGT multivariate space is very similar for soil and lacustrine samples with , r=0.90 and p value <0.001. The more variable components between soil and lacustrine multivariate spaces are IIIa′, IIa, and Ib. It is noteworthy that Ib is correlated with IIb and IIIa in soils, while it is correlated to Ia in lacustrine samples.
3.2 brGDGT responses to environmental controls
3.2.1 ACA bioclimate multivariate space
The selection of bioclimatic parameters that can be reliably reconstructed from fossil proxies is essential (Salonen et al., 2019). To evaluate this, we conducted (1) a multivariate analysis on worldclim2.1 data extracted at the ACADB sampling locations, to identify the primary and secondary bioclimatic gradients and their main parameter contributors, and (2) a Variance Inflation Factor (VIF) analysis to quantify multicollinearity within the brGDGT–bioclimate multi-variate space of the ACADB. The goal is to confirm which bioclimatic parameters are the most informative and ensure they are as statistically independent as possible, in order to minimize biased climate reconstructions.
First, when considering the bioclimate space of ACA sampled at the ACADB sampling points (Fig. 1E), the main loading (PCA1=53 %) is a temperature gradient and the secondary loading (PCA2=29 %) is a precipitation gradient. About the climate parameter contribution, AI and MAP have more influence on the ACA bioclimate variance, followed by MPCOQ and MAAT. In ACA, all temperature parameters are strongly correlated, indicating that temperature seasonality is roughly homogeneous within the ACADB. This observation is consistent with the lower variance explained by MAF than MAAT. The coefficient of variation among the ACADB is higher for MAAT than seasonal temperature parameters (170 % vs. 30 %). Contrarily, Mean Precipitation of Warm/Cold Quarters (MPWAQ and MPCOQ, respectively) are negatively correlated, showing a split in seasonal precipitation patterns among the ACADB, which is in line with the global climate observations in ACA (Chen et al., 2024).
Then, to verify that these parameters remain the primary factors to explain the brGDGT variance space, VIF analyses were performed on two models: (1) using all environmental parameters (i.e., all climate parameters, altitude, pH, and salinity) and (2) only a selection of climate parameters to verify that VIFs <10 (Cao et al., 2014). In Table S4 in the Supplement, the multicollinearity between MAAT, MTCOQ, and MTWAQ is clear (VIFs >159.1) and reduced with MAF (VIF = 26.7). Multicollinearity is lower among the precipitation parameters (VIFs <37.8). When keeping only AI, MAAT, MAF, MPCOQ, pH, and salinity, all VIFs are below 6. VIFs for pH and salinity do not change between the two models, showing their independence from climate parameters. Finally, from the total set of environmental variables, the VIF analysis removed the altitude, MAP, MPCOQ, MTCOQ, and MTWAQ. The remaining environmental parameters have VIFMAAT=6, VIFMAF=4.5, VIFMPCOQ=2.1, VIFAI=1.5, VIFpH=1.5 and VIFSalinity=1.3.
3.2.2 Controls on brGDGTs in the ACA bioclimate space
Regarding the environmental controls on brGDGT distribution, RDAs were performed based on analyses of 113 soil and 73 lacustrine samples (excluding samples without pH and salinity data), including 15 brGDGT compounds (limited to 5- and 6-methyl isomers) and six environmental variables (Fig. 5D and E). The first two RDA axes explained 20 % and 6.1 % of the variance in soil samples, and 18 % and 3.8 % in lacustrine samples. The overall correlation between the brGDGT composition and the environmental variables was 0.31 for soils and 0.24 for lakes. About the distribution of sites and brGDGT vectors, we observe the conservation of the distribution between PCA and RDA for soil (Fig. 5A and D): similar PCA1 and RDA1 loadings, and reverse loading among RDA2 and PCA2.
The distribution of soil samples in the RDA ordination reflects a gradient of aridity (Fig. 1D), with humid samples on positive loading associated with high AI and salinity and hyper-arid samples on negative one correlated with pH, MAF, and MAAT. This gradient corresponds to a predominance of GDGT compounds IIIa′, IIIb′, and IIa′ in arid samples, while more humid sites are associated with higher FAs of IIa and Ia. Thus, the aridity gradient along the RDA1 loading is clearly conserved from PCA to RDA. Surprisingly, higher salinity is associated with higher AI (i.e., humid conditions) and negatively correlated with pH (i.e., acidic conditions). Although soil salinity is expected to increase under bioclimatic aridity (Muhammad et al., 2008), our results show that in ACA, salinity is largely independent of climate parameters (Fig. 1D).
For lacustrine samples (Fig. 1B and E), the loadings are quite different between PCA and RDA, mainly due to low IIa and IIa′ correlations with environmental parameters in RDA (despite their strong importance in primary and secondary loadings in PCA). The aridity gradient is not clear (mainly due to the scarcity of hyper-arid and humid lacustrine samples). Here, salinity is negatively correlated with pH and AI. Additionally, tetramethylated compounds (Ia, Ib, and Ic) are controlled by both temperature (MAAT and MAF) and salinity.
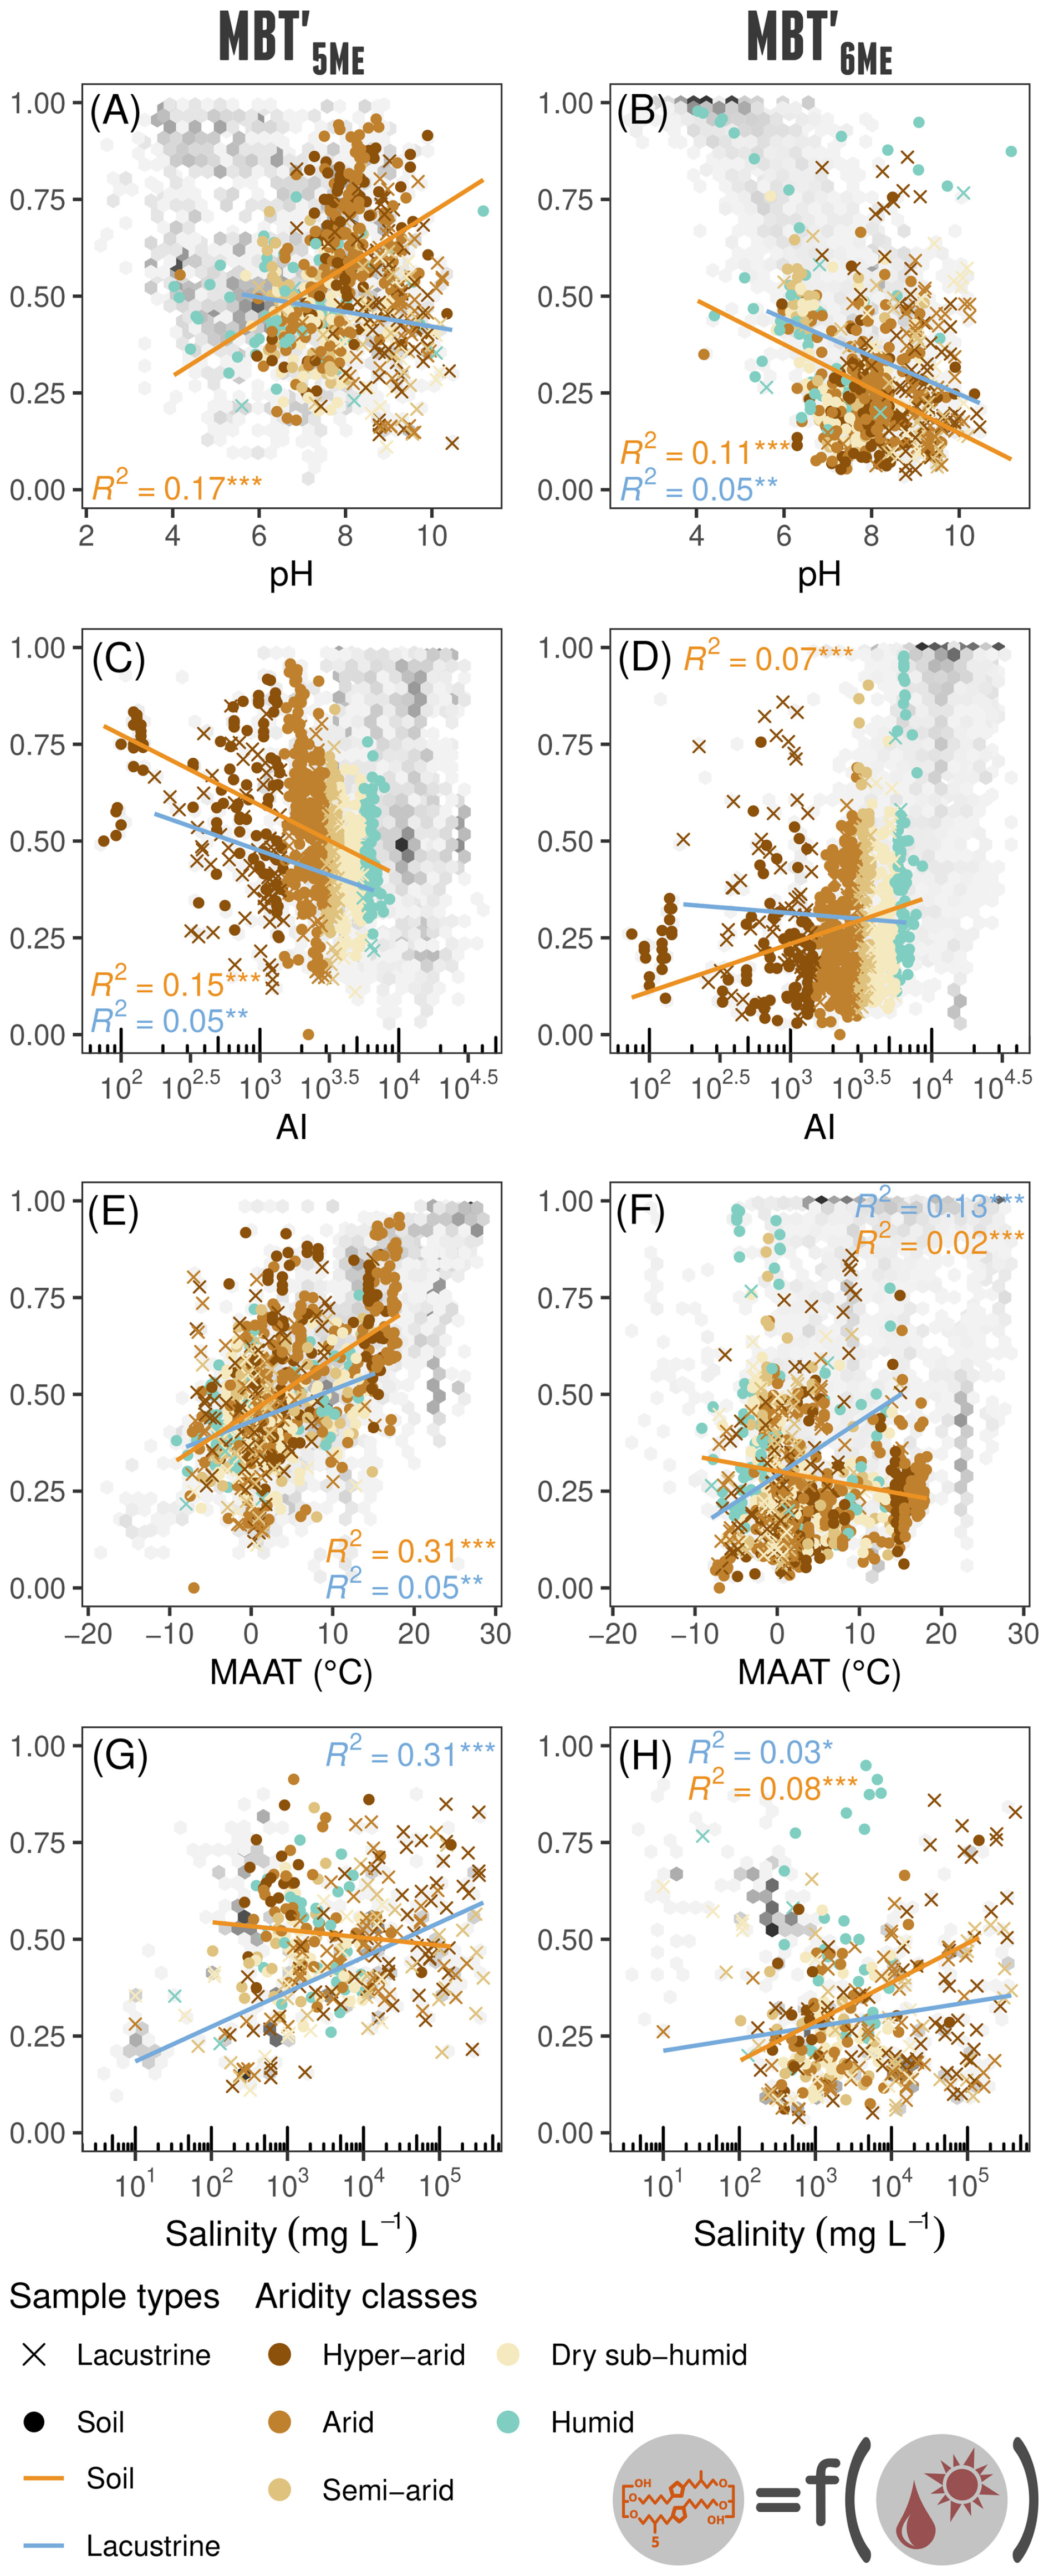
Figure 6 and relationships with pH (A, B), Aridity Index (C, D), MAAT (E, F), and salinity (G, H). The colour refers to the aridity classes for the samples. Two groups per sample type (i.e., lacustrine and soil) are used to infer linear relationships. The grey hexagonal bins show the sample density from the WDB. R2 values are shown only for statistically significant regressions (p<0.05), while p values below 0.001, 0.01, and 0.05 are indicated with ***, **, and *, respectively.
The Procrustes rotation analysis carried out on the two different RDAs (Fig. 5F) shows that the correspondence between the two RDA spaces is smaller than between the two PCA spaces (Fig. 5C) with r=0.57 and p value = 0.018 for the RDAs, against r=0.90 and p value <0.001 for the PCAs. Compounds IIIa′, IIa, Ia and IIb exhibit the most pronounced rotations (i.e., the differences in their loadings between the two PCAs as revealed by the Procrustes rotation analysis), indicating substantial differences in environmental controls between soil and lacustrine samples. For environmental parameters, salinity and AI are the two parameters with the highest degree of rotation between the soil and lacustrine RDA spaces. AI is more contributing in the soil samples RDA, while salinity is more contributing in the lacustrine samples RDA.
3.2.3 Methylation indices relationships to climate parameters
Linear relationships between the two main indices of methylation generally used in brGDGT calibration studies, the and , are tested against pH, AI, MAAT, and salinity (Fig. 6). The R2 (*** indicates p value <0.001) are given for each relationship and for both subsets of sample type (i.e., soil and lacustrine samples). For soil samples, the strongest -based linear relationship is related to MAAT (R2=0.31***), even if it is also associated with pH (R2=0.17***) and AI (R2=0.15***). The relationship with salinity is, however, not significant. Contrarily, for lacustrine samples, salinity exhibits the strongest relationships with (R2=0.31***). Correlation coefficients obtained with are generally lower than those with with pH for soils (R2=0.11***) and with MAAT for lacustrine samples (R2=0.13***). When statistically significant, all relationships follow similar trends (positive or negative) for and .
Comparing the ACADB to the WDB in Fig. 6, some relationships are similar: with MAAT and salinity, and with pH and AI, despite the tighter climatic range of ACADB compared to WDB. Contrarily, some trends are reversed: with salinity and with pH. It is also noticeable that ACADB samples from humid and dry sub-humid conditions fit better with the WBD distribution than arid and semi-arid systems.
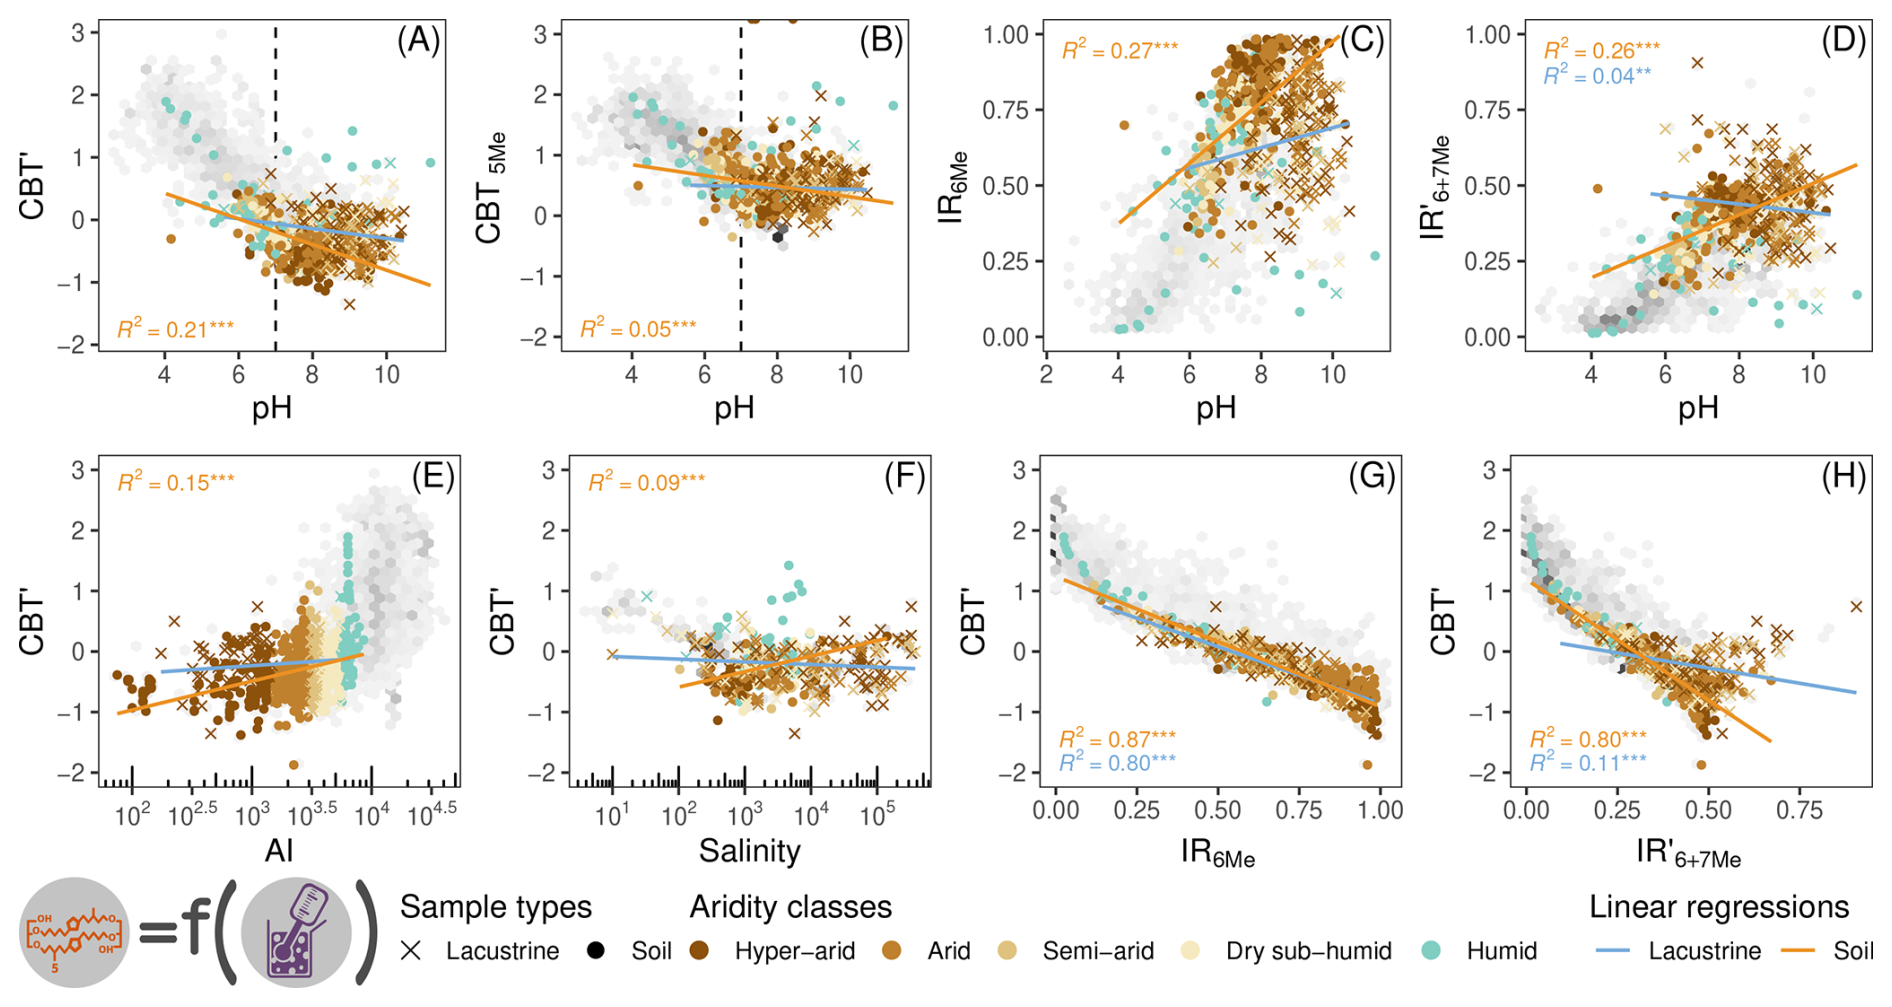
Figure 7pH-related indices, mainly cyclisation indices (CBT′ and CBT5Me) and isomer ratios (IR6Me and ) are shown. Linear regressions are tested with pH (A–D), AI (E) and salinity (F) and among them (G, D). The colours refer to the aridity classes for the samples. Two groups by sample type (i.e., lacustrine and soil) are used to infer linear relationships. The grey hexagonal bins show the sample density from the WDB. AI and salinity are displayed on log10 scale. R2 values are shown only for statistically significant regressions (p<0.05), while p values below 0.001, 0.01, and 0.05 are indicated with ***, **, and *, respectively.
3.2.4 Cyclisation, isomerisation, and pH
The cyclisation and isomer indices (here, CBT′, CBT5Me, IR6Me and ), which are commonly considered to be pH-related proxies, are tested against aridity, pH and salinity on WBD and ACADB. On the ACADB, the linear relationships between pH and these indices are not significant for lacustrine samples, excepted for with R2 of 0.04** (Fig. 7A–D). In soil samples, isomer ratios appear to correlate more strongly with pH than cyclisation indices, with IR6Me showing the highest explanatory power (R2=0.27***). This pattern is consistent in both the WDB and ACADB datasets. About the cyclisation, CBT′ is more linearly related to pH than CBT5Me. However, both indices suffer from a relation break around a pH threshold of 7.3 (highlighted by dashed lines on Fig. 7A and B). This indicates that the cyclisation degree is linearly correlated to pH only in acidic samples. To test the pH threshold value, the CBT′ vs. pH linear relationship was tested for the two groups, below and above the threshold, using a continuous implementation of cut-off pH from 4 to 11, with 0.01 steps each (Fig. S2 in the Supplement). The best R2 is for a pH of 7.3, with multiple R2 of 0.45 for overall soils, 0.54 for acidic soils, and 0.05 for alkaline soils. Similar cut-offs are also observable with aridity and salinity, although with lower regression strength (R2 of 0.15*** and 0.09***, respectively, Fig. 7E and F). Finally, the CBT′-IR6Me and CBT′- relationships are more similar in terms of slope and correlation for soil than lacustrine samples (R2 of 0.87*** and 0.80*** for soil, 0.80*** and 0.11*** for lacustrine, respectively in Fig. 7G and H).
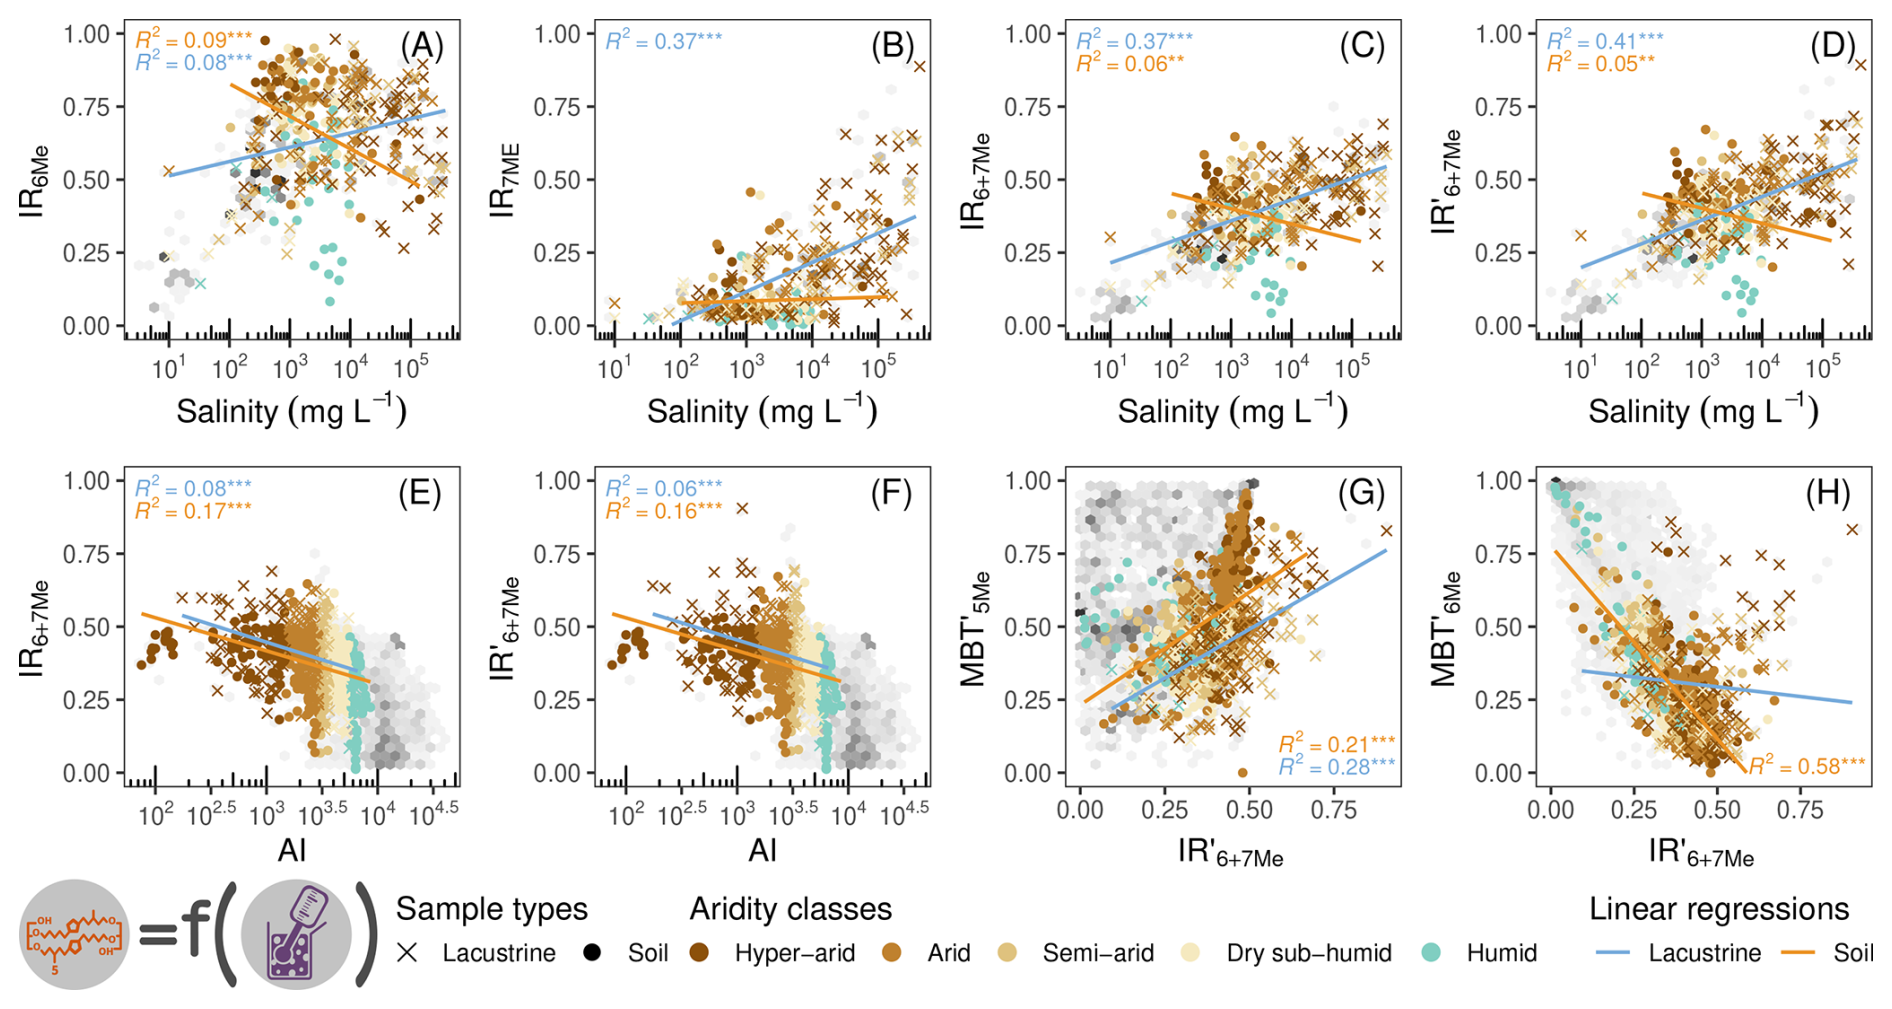
Figure 8Salinity-related indices: IR6Me, IR7Me, IR6+7Me and are the most ubiquitous brGDGT-based indexes used to infer salinity in ACA. The indices are compared to salinity (A–D), the Aridity Index (E, F), and (G, H). The colours refer to sample aridity classes. Two groups per sample type (i.e., lacustrine and soil) are used to infer linear relationships. The grey hexagonal bins show the sample density from WDB. AI and salinity are displayed on a log10 scale. R2 values are shown only for statistically significant regressions (p<0.05), while p values below 0.001, 0.01, and 0.05 are indicated with ***, **, and *, respectively.
3.2.5 Isomer ratios responses to aridity and salinity
The common isomer ratios used to infer salinity are tested with aridity and salinity (Fig. 8). The linear relationships between IRs and are also tested. For salinity, the correlations are more statistically significant with lacustrine than with soil samples, by order of strength: (R2=0.41***), IR7Me (0.37***) and IR6+7Me (0.37***). For soil, IR6Me has the strongest relationship with pH (R2=0.09***), but the relationships with aridity are also significant, especially with IR6+7Me (R2=0.17***). The relationships are comparable between ACADB and WDB, although the WDB environmental range is wider, especially for low salinity and high AI values. is slightly correlated with the index in lacustrine samples (R2=0.28***), while it is more significantly correlated to in soil samples (0.58***). These relationships are similar in WDB, although no linear relationship appears between and in WDB. Moreover, the isomer ratio relationship with salinity drastically changes depending on the relative weight given to 7-methyl isomers. The regression between IRs and salinity shows increasing explanatory power with 7-methyls weight, with R2 values rising from 0.08 for IR6Me to 0.37 for IR7Me, and for IR6+7Me, upon 0.41 for . This is mainly due to the salinity's positive correlation with 7-methyls and negative one with 6-methyls (respectively, Pearson's r of 0.64 and −0.35, Fig. S3 in the Supplement).
3.3 Robustness of the analysis of variance between groups
Since it was previously shown that the different environmental parameters have different interactions in the brGDGT distribution worldwide and in the ACA (Yang et al., 2014; Deng et al., 2016), both on soil and lacustrine samples, we evaluate the strength of each driving factor. Since the sample type group is a qualitative factor, the other quantitative factors (i.e., bioclimate and physicochemical parameters) were also binned into qualitative groups (see Table S3 in the Supplement for the cut-offs used for binning). The two MANOVA models inferred to evaluate their differential influences on (1) FAs distribution and (2) indices from the ACADB are displayed in Table 3.
Table 3Statistical results (approximate F-statistics and p values) of the two MANOVAs carried out to test the brGDGT (1) FAs and (2) indices responses to environmental classes (i.e., aridity, pH, salinity, and sample type). The MANOVA F-statistics are presented in the first row of the two models, followed by the F-statistics of the univariate ANOVA for each item (i.e., each FA and each index). The significance is given by the number of starsa. The samples without pH or salinity measurements were removed from the analysis (i.e., n=328). The p values from Levene's test, which are important for assessing the reliability of the MANOVAs, are provided in Table S5 in the Supplement.
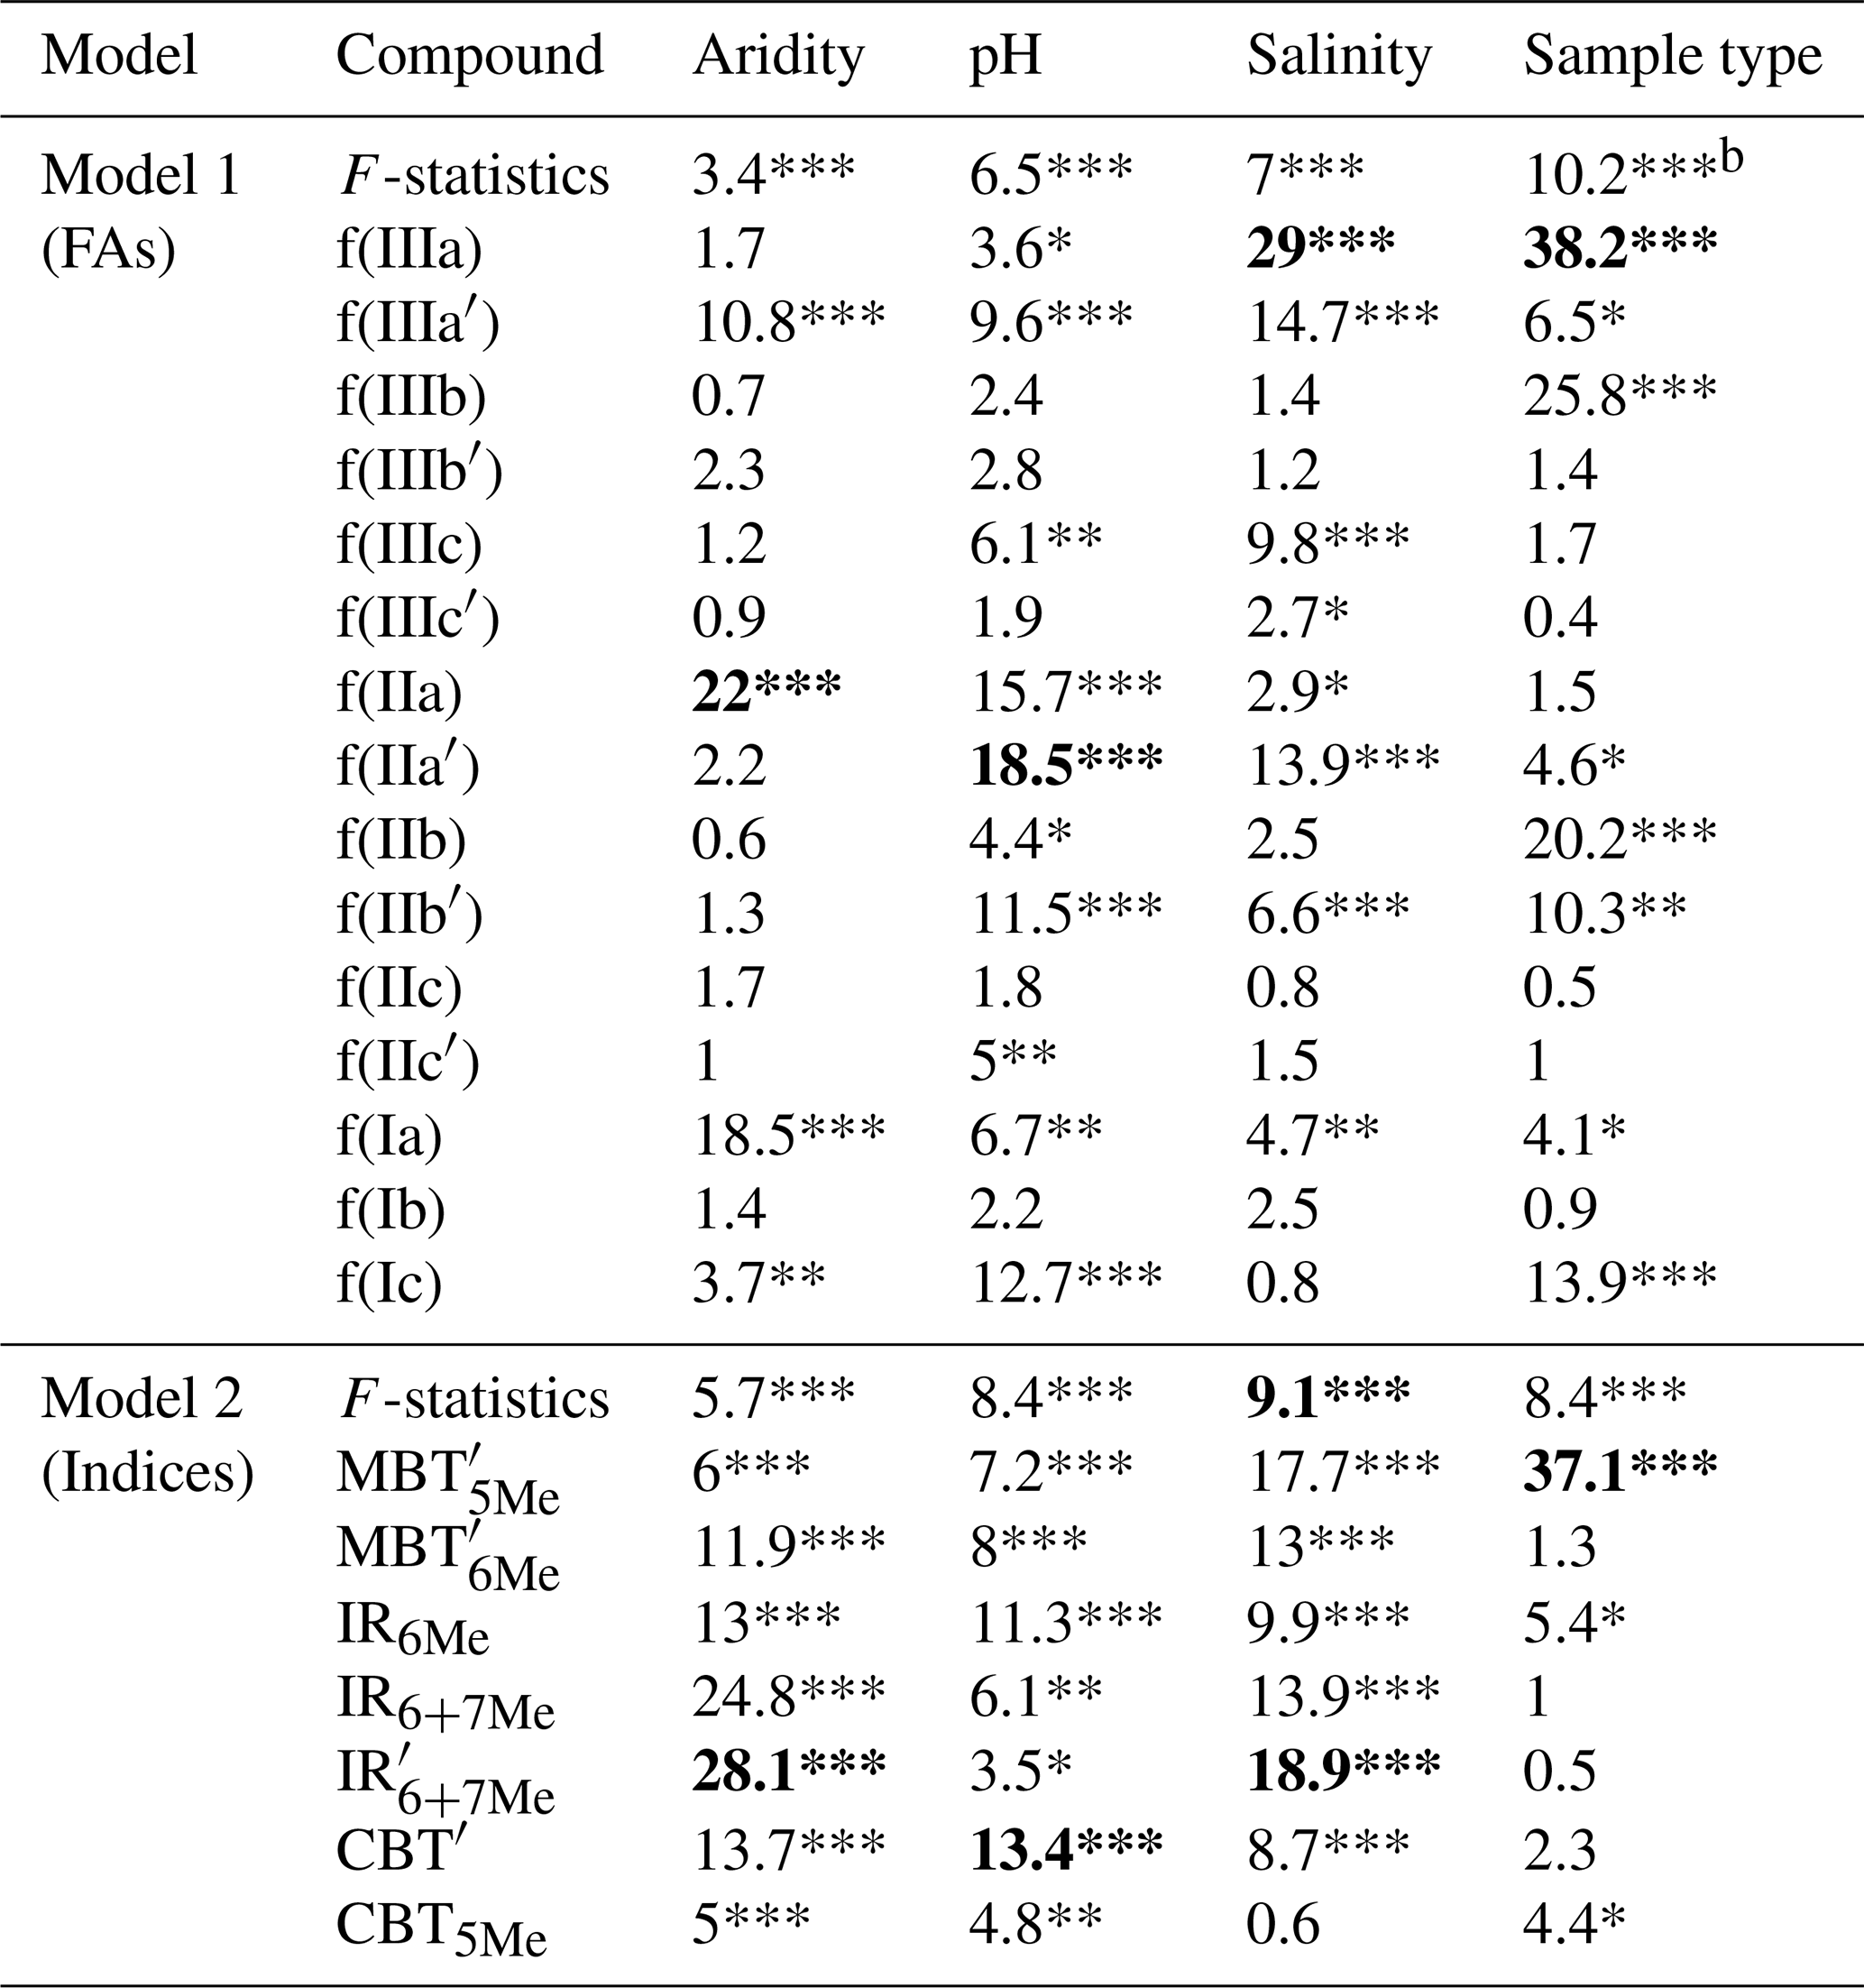
a The p values are expressed in terms of stars with *** for p≤0.001, ** p<0.01, * p<0.05 and nothing for not-significant F-statistic (i.e., p value ≥0.05). b The highest F-statistic for each MANOVA and ANOVA is displayed in bold text.
3.3.1 Analyses of variance for the FAs
This first MANOVA tests the response of the 15 brGDGT FAs to the four grouping factors: aridity, pH, salinity, and sample type. MANOVA results (in terms of F-statistics and p values) are given in the first row of Table 3 while ANOVAs for each compound is given in rows two to 16. Levene's test p values are provided in Table S5 in the Supplement. The higher MANOVA F-statistic (with a p value <0.001, symbolized by the *** symbol) represents the stronger environmental parameter to separate FA into groups. First, it appears that the sample type (F=10.2***) is the most influential grouping factor on the FA variance, followed by salinity (7***) and pH (6.5***). Moreover, the sample type is responsible for the clustering among IIIa, IIIb, IIb, and Ic, while pH mainly influences IIa′, IIa, Ic, and IIIa′, and salinity influences IIIa, IIIa′, IIIc, and IIb′. Aridity plays a role mainly on IIa, Ia, and IIIa′. Generally, the main compounds are impacted in their distribution by all controlling factors.
3.3.2 Analyses of variance for the brGDGT-based indices
Since the majority of brGDGT applications are based on traditional indices, the response of , , IR6Me, IR6+7Me and to aridity, pH, salinity, and sample type was tested in the second MANOVA (line 16 of Table 3 followed by the ANOVA statistical results for each index). For MANOVA, the most important grouping factor is salinity (F=9.1***), followed by pH and sample type (8.4***). Aridity is the weakest grouping factor (5.7***). The graphical representation of the variance for each group is available in Fig. S4 in the Supplement. More specifically, for , the variance is mainly explained by sample type (37.1***) and salinity (17.7***). For , the variance is mainly explained by salinity (13***) and aridity (11.9***). IR indices show stronger clustering based on aridity and salinity than on pH or sample type. Aridity and salinity gradients are clear among groups for IR6+7Me and while IR6Me variance is more steady. For all three indices, there is a clear distinction for hypersaline and humid group variance (low index value for humid groups and high value for hypersaline). CBT5Me have a similar variance for each group, while CBT′ is clustered by aridity and pH (13.7*** and 13.4***).
Comparing the ACADB results with other studies, the question of the relative importance of the confounding factor on brGDGT palaeothermometer applications from drylands is raised. The effects of the confounding factors on the past temperature estimation, such as pH (mainly for extrema; Duan et al., 2020), aridity, seasonality, and salinity, are currently studied in ACA (Guo et al., 2021; Chen et al., 2021; Kou et al., 2022; Duan et al., 2022). More generally, the impact of controlling factors on geochemical proxies used to reconstruct palaeoenvironmental changes has been increasingly recognized in brGDGT-based temperature calibrations (De Jonge et al., 2014; Häggi et al., 2023). Mainly, based on the ACADB results, we discuss (1) the impact of these factors on brGDGT indices (methylation, isomer and cyclisation indices); then (2), the complex interaction between controlling factors; (3) the applicability of former and new calibration depending on confounding factor classes; and (4), we provide recommendations for their applicability in the past brGDGT archives in drylands. We will first focus on the reliability of and to reconstruct past MAAT and on isomer or cyclisation indices to infer salinity and pH in drylands. The following discussion is mainly based on ACADB results from linear regressions, as well as multivariate and variance analyses. However, due to limited metadata availability, these integrative statistical approaches (RDAs and MANOVAs) were applied to a reduced dataset (113 soil and 67 lake samples), and further research is needed to confirm the conclusions drawn.
4.1 Applicability of brGDGT-based proxies
4.1.1 responses to temperature
The analysis of the ACADB climate space, based on the PCA (Fig. 1E) and RDAs (Fig. 5D and E), indicates that MAAT better captures both the climate variability and the brGDGT response across ACA compared to MAF. In both datasets, the proportion of variance explained by MAAT exceeds that explained by MAF, with the only exception being brGDGT assemblages from lacustrine samples. Based on this, we focus the discussion on MAAT, even though MAF is often preferred in brGDGT studies due to its relevance for representing the bacterial growing season (Deng et al., 2016; Dearing Crampton-Flood et al., 2020). However, the actual timing of bacterial growth may depend not only on temperature, but also on soil water availability (Lei et al., 2016). This is particularly relevant in the ACADB region, where MAF generally aligns with summer across ACA, while soil moisture availability is not spatially synchronous, with rainfall peaks in spring and autumn in eastern ACA, and in summer in the western part (Fig. S1 in the Supplement).
When considering the -MAAT relationships in the ACADB, the determination coefficients for both soil and lacustrine samples are limited (Fig. 6). The linear correlation is significantly higher in semi-arid to humid soils than hyper-arid and arid soils (Fig. S8 in the Supplement), in line with Wang et al. (2019). This weakening of the -MAAT correlation is also well observed on lacustrine samples where is more correlated to salinity than to MAAT (Fig. 6E and G) in line with Liang et al. (2024). In drylands, is also correlated with soil water content (Dang et al., 2016b). However, numerous temperature reconstructions use the index to capture the brGDGT compound's response to temperature (De Jonge et al., 2014; Chen et al., 2021), even if several studies have shown a strong bias in -temperature relationship under arid conditions (Sun et al., 2019; Dugerdil et al., 2021a). Guo et al. (2021) demonstrated that in arid environments, the relationship between temperature and brGDGT methylation differs between 5- and 6-methyl isomers. The dominance of Actinobacteria and Verrucomicrobia, each linked to distinct 5- and 6-methyl brGDGT signatures, in arid soils may help explain the limited effectiveness of the index in capturing climate signals within the ACADB. In this context, -based temperature calibration in drylands may have reduced reliability. Among solutions to improve this type of calibration, specific -based temperature calibration can be provided for specific confounding factor classes.
4.1.2 responses to climate
-MAAT trends opposite for the WDB compared to the ACADB (Fig. 6F), even if the correlations with temperature remain weak. The correlation is slightly better with AI (Fig. 6D). The index has been proposed as a reliable temperature proxy when MAP and MAAT are negatively correlated (Guo et al., 2021), a condition not met in the ACADB dataset. From the ACADB, we can estimate that is slightly more controlled by AI than MAAT. Moreover, the tetramethylated compounds (which are the major compounds involved in and , De Jonge et al., 2014) are not as important in ACADB as in WDB (Fig. 4A). Additionally, the climate response of tetramethylated compounds is not clear in ACADB (Fig. 5D), while the IIa′ is well correlated with MAAT. Initially designed by De Jonge et al. (2014) as a methylation index for tetramethylated over the sum of tetramethylated plus 6-methyl isomers, the is understudied. However, Wang et al. (2016) and Guo et al. (2021) observed in arid soils that the has a better response to temperature and aridity changes than the . Also, their studies show an opposite correlation with MAAT than in global soil datasets, in line with our results.
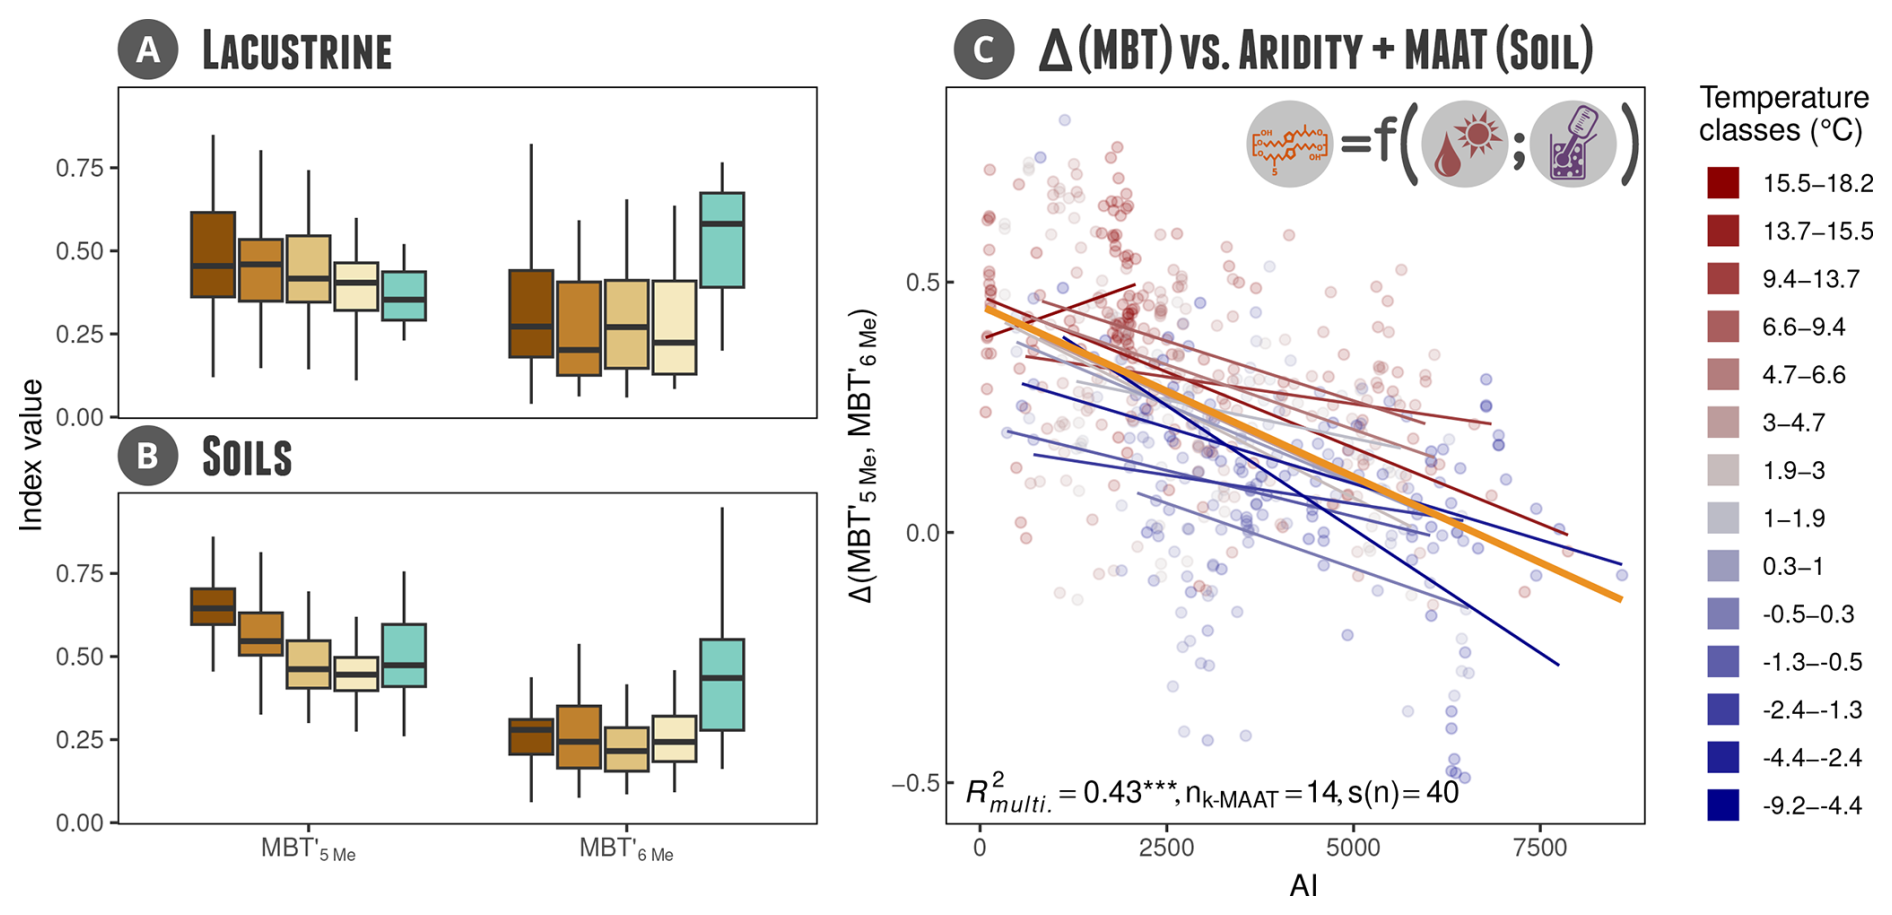
Figure 9Illustration of the approach comparing and to investigate interactions between MAAT, aridity, and sample type. Boxplots of both indices are shown by aridity classes (see Fig. 1 for colour codes), separately for soil (A) and lacustrine (B) samples. Panel C displays the relationship between and the Aridity Index for soil samples, across 14 groups of Mean Annual Air Temperature, each containing approximately 40 samples. The orange line indicates the overall regression trend. Corresponding univariate regressions with AI are shown in Fig. S5 in the Supplement.
4.1.3 Complementarity of and to infer aridity
We propose to use the difference between and to track past aridity change, since it was shown that variance is similar to that of under humid conditions, while it is smaller under hyper-arid to dry sub-humid conditions (Fig. 9A and B). This observation holds true in both soil and lacustrine samples. Therefore, following the trends of these two indices in the past could allow distinguishing between periods of constant humid conditions, whenever they are correlated with similar variance, and that of constant or shifted arid conditions (not correlated). Moreover, the current -AI correlation is negative (Fig. S5A), while the -AI correlation is positive (Fig. S5B), and similar to the soil water content effect on (Dang et al., 2016b). Then, the gives a quite reliable estimation of the AI (i.e., the difference between the two indices, Fig. S5C). This approach is more appropriate for soil than lake samples, since the distribution in lacustrine samples is correlated with MAAT rather than AI (Fig. 6D and F), making the -based calibration more accurate than the one in ACA lakes.
The statistical independence between AI and MAAT has to be verified, especially since AI is related to temperature via the Mean Annual Reference Evapotranspiration (cf. Eq. 3 and Trabucco and Zomer, 2019). Among ACADB, MAAT and AI are independent bioclimatic variables (R2 below 0.01 for lacustrine and about 0.15 for soil samples). Moreover, focusing only on soil samples, the -AI relationship has been tested for similar MAAT values (Fig. 9C). The regressions across MAAT classes are generally consistent, except at the extremes of the Aridity Index. The higher multiple R2 compared to the global model indicates that the relationship between and AI is largely independent of MAAT. When comparing this result with previous studies, we found similar and behaviour compared to MAAT (correlations positive for and negative for in Guo et al., 2021). This is also supported by the evidence that is correlated with AI and soil water content (Dang et al., 2016b; Guo et al., 2021). Although the difference between ratios is still not commonly used for brGDGTs, this approach is increasingly applied to other geochemical proxies of past climate parameters (Hällberg et al., 2024).
4.1.4 Controls of salinity on isomer ratios
Salinity is a major controlling factor in ACA, impacting both brGDGT distribution in the environmental space (Fig. 5B and E) and the variance of FA and indices (Table 3). It is also significant that the salinity could be monitored through isomer content (Fig. 8). Mainly, the appears to be the more reliable index to track salinity gradients among lacustrine ACADB samples, in line with Wang et al. (2021) and Kou et al. (2022). These studies have revealed the unusual over-representativeness of 7-methyl compounds in brackish to hypersaline lacustrine lakes, like in the ACADB. Wang et al. (2021) also reported a slight impact of salinity on IR6Me which may be due to pH-salinity covariation in their database. Since pH and salinity are not covarying in the ACADB soils, it explains why IR6Me is less correlated with salinity for ACADB soils (Fig. 8A). However, the two factors are covarying in the lacustrine dataset. This could explain why IR6Me-salinity regressions are similar between soils and lacustrine samples (R2 about 0.08) while is not. We conclude that (1) the unusual over-representativeness of 7-methyl due to salinity is important in lakes but not significant in soils, and (2), is the more reliable brGDGT index to track salinity changes in both sample types.
IR6Me is well correlated with salinity for low salinity values, particularly in lacustrine samples (i.e., mainly fresh-water lakes, Fig. 8A and Wang et al., 2021), while IR7Me is more significant for higher salinity ranges (Fig. 8B). Below TDS values of ca. 1000 mg L−1, the IR6Me–salinity relationship show lower data dispersion that above this threshold (Fig. S6A in the Supplement). For the IR7Me index, a saturation effect due to low 7-methyls isomer mitigate the IR7Me–salinity relationship, below TDS values of ca. 11 000 mg L−1 (Fig. S6B in the Supplement). The different IR response to salinity below and above these salinity thresholds (TDS ∈ [1000; 11 000] mg L−1 in Fig. 8A and B) is attenuated when both 6- and 7-methyls are included in the ratio over 5-methyls (i.e., IR6+7Me and indices, Fig. 8C and D). Mainly, lake salinity conditions may impact the in situ bacterial community responsible for the 6- and 7-methyl over-abundances (Liang et al., 2024). The ACADB validates the use of as a salinity proxy proposed by Wang et al. (2021), in complement to previous proxies such as dinoflagellate cysts (Leroy et al., 2013), diatoms (Unkelbach et al., 2020), archaeol, and caldarchaeol ecometric (Kou et al., 2022) or extended archaeol (So et al., 2023).
4.1.5 Controls of pH on isomer ratios and cyclisation degree
Historically, brGDGT-based pH reconstructions were mainly conducted through cyclisation indices (e.g., CBT′ and CBT5Me, De Jonge et al., 2014). However, more and more studies highlight that the isomer ratio is also well correlated with pH changes (Dang et al., 2016a; De Jonge et al., 2024a). From the ACADB, it appears that pH impacts the isomers more than the cyclisation content (i.e., IR6Me seems to be a more reliable proxy for pH than CBT′ in ACA, Figs. 7 and 8). This is consistent with the Inner Mongolian aridity transect study (Guo et al., 2021). At the global scale, CBT′ presents a slightly higher correlation with pH than IR6Me, but the sample type effect is stronger on CBT′ (i.e., calibration for different sample types are more different in slope and intercept for CBT′ than IR6Me, Raberg et al., 2022a). IR6Me may be more robust to infer past pH in a context of shifting sedimentary flux. Particularly, panels (A) and (B) from Fig. 7, show that the cyclisation indices exhibits a piecewise, dual-slope response across a threshold, indicating a non-linear, threshold-dependent relationship rather than a single unified pH control. The threshold appears after pH >7.3 (threshold found by sensitivity analysis, Fig. S2 in the Supplement), in line with a pH >7.5 threshold demonstrated in Guo et al. (2021). At the Chinese soils scale, including samples from arid and humid environments, CBT′ correlation is very strong with pH but not with MAP (Wang et al., 2019). It may show that the alkalinity effect on cyclisation is not enhanced by soil aridity but by other phenomena. In Guo et al. (2021) where pH and aridity are associated, the more arid conditions do not relate to increasing cyclisation number. From the ACADB, isomer ratios outperforms cyclisation indices to track pH variations, as isomer ratios follow unimodal relationships with pH, while cyclization indices follow dual-slope relationships. Our results are in line with the study of Guo et al. (2021) who supports the use of IR6Me for pH reconstruction in drylands. This consideration is important to keep in mind mainly for past brGDGT-based reconstructions carried out in shallow lake (with important soil influx) and loess-palaeosol sequences (Lin et al., 2024), since the effect on lacustrine samples is still unclear.
4.2 Assessing confounding factors combined effects
Although temperature, both MAAT and MAF, remains a major bioclimate parameter controlling the brGDGT distribution, we have shown that other environmental variables such as aridity and salinity are at least as important in explaining the brGDGT distribution from the ACADB. Particularly, these variables do not only impact their related indices used as proxies (e.g., MAAT with , salinity with , etc.) but also other indices (e.g., the ACA is also impacted by salinity). However, these factors are typically studied independently, while in soil and lacustrine systems, multiple interacting factors complicate the understanding of their combined effects.
4.2.1 Combined effect of pH with other controlling factors
Several complex interactions drive the pH effects on brGDGT assemblages. For example, pH is more related to the soil organic matter content than salinity in arid contexts (Muhammad et al., 2008), and in ACADB there is no correlation between pH and salinity for soil samples (Fig. 5). Similarly, humid environments are more likely to have organic-rich soil, influencing the pH (Liang et al., 2019). However, isomer ratios are influenced by both these physicochemical soil properties (Fig. 8). The alkalinity interaction with aridity has been already reported from Chinese brGDGT soil studies (Yang et al., 2014; Dang et al., 2016b). They show that the major brGDGT compounds are more diverse in arid than humid soils, implicating different correlations between brGDGT indices, pH, and MAAT for dry and for wet soils (Wang et al., 2019). Although the brGDGT cyclisation response to pH is globally well constrained, it is not the case in Chinese soils (Wang et al., 2019), but it is the case in northern Iran (Duan et al., 2022). Chen et al. (2021) introduced the use of soil water content as an intermediate parameter to clarify the pH-aridity interaction impact on brGDGT distribution. As a consequence, the brGDGT-based climate reconstructions of past archives in ACA need to be interpreted differently for alkaline samples.
4.2.2 Salinity effect and its relationship with aridity and sample types
The Procrustes rotation analysis performed on the ACADB reveals a different control of the environment on the brGDGT distribution from soil and from lacustrine origin. Particularly, in Fig. 5D and E, the salinity and AI were associated for lacustrine samples (i.e., the more humid the climate, the fresher the water), but surprisingly we observe the opposite association for soils. This could be due to the textural properties of soils, including the fact that salinization is more likely in clay than in sand (Muhammad et al., 2008). In this context, the numerous sandy desert samples in the ACADB from hyper-arid conditions do not have high salt content. For ACADB lacustrine samples, aridity enhances the salt water content, which is consistent with modern observations (i.e., water column salinity, Williams, 1999) as well as during the Holocene (e.g., in the Great Salt Lake located in North American drylands, So et al., 2023). The salinity effect on temperature reconstruction may result in a temperature over estimation of more than 2 °C (Liang et al., 2024). Although the salinity effect on 7-methyl compounds is more and more understood for lacustrine samples (Wang et al., 2021; Kou et al., 2022; So et al., 2023; Liang et al., 2024), it remains understudied for soil samples. We have shown that the average fractional abundance of 7-methyl brGDGTs is higher for lacustrine than soil samples. In soils, primarily the 6-methyl rather than the 5-methyl isomers seems to react to salinity, but this could be due to the combined effect of aridity, pH, and salinity. Salinity inferred by TDS is a bulk physicochemical parameter, and therefore, more details about the soil ionic composition are needed to refine the understanding of the salinity controlling factor effect (Chen et al., 2022; De Jonge et al., 2024a).
4.2.3 Combined effects of climate aridity on soil moisture, pH, and its consequences on the brGDGT distribution
In the ACADB, it appears that aridity enhances the abundance of cyclised and 6-methyl compounds over Ia, IIa, and IIIa (Figs. 7 and 8). This effect of aridity on both isomerisation (i.e., favouring 6- over 5-methyls) and cyclisation (favouring compounds with high internal cyclisation number) is a well-known effect in Arid Central Asia, showing the complex interaction between arid climate conditions, soil moisture, and pH (Dang et al., 2016b; Chen et al., 2021). Since the aridity effect on brGDGT is not directly settled by precipitation (Wang et al., 2019) but rather by the soil water content (Sun et al., 2019; Chen et al., 2021), this could explain why the AI correlation with IR6Me and CBT′ is not as strong for lakes as it is for soils (in which aridity directly impacts soil water content). Soil water content shows a clear impact on arid environments from both Chinese (Dang et al., 2016b) and African (Loomis et al., 2011) soils. Since the soil water content is not a limiting factor for the bacterial community in soil, the diminution of oxygen content in soil may be responsible (Li et al., 2018). Liang et al. (2019) suggest that this effect is particularly important in hyper- to semi-arid environments where bare soils (without vegetation cover) are dominant. In contrast, in humid environments, the important vegetation cover changes the soil organic content and, by extension, the soil pH. These physicochemical causal links could explain the aridity's combined effects on ACA brGDGT distribution.
4.2.4 Toward a ranking of controlling factors importance
We have shown that brGDGT–environment relationships are influenced by several biases linked to confounding factors (Sect. 4.1; Figs. 5, 6, 7 and 8). In addition, interactions among these factors further limit proxy applicability (Sect. 4.2). A key next step to improve the reliability of brGDGTs as past environmental proxies is to rank the relative importance of these controlling influences. Although major environmental controlling factors have been identified globally (Naafs et al., 2017a; Dearing Crampton-Flood et al., 2020; Raberg et al., 2022a), their dominance hierarchy appears to vary by study region and archive.
At the global scale, temperature is consistently the primary control, followed by pH, regardless of sample type (Raberg et al., 2022a). This general ranking (temperature as primary factor and pH as secondary one) holds across environments, but sample type still modifies regression parameters: slopes and intercepts differ between soils, peats, and lake sediments (Naafs et al., 2017a, b). Then, additional influences depend on specific sample type. For example, seasonal effects are strongest in lake-based calibrations (Dang et al., 2018; Martínez-Sosa et al., 2021; Raberg et al., 2021, 2022a). Seasonality also affects soil calibrations (Deng et al., 2016; Dearing Crampton-Flood et al., 2020), but it has been shown that the monthly temperature fluctuations reported by brGDGT indices were similar to the average temperature (Cao et al., 2018), mainly due to the slow turnover of brGDGT production and deposit in soil samples (Weijers et al., 2011). Overall, current evidence indicates that temperature and pH dominate brGDGT distributions, followed by sample type and proxy-specific modifiers such as seasonality, salinity, and aridity.
Our ACADB data suggest a different ranking of controlling factors for Arid Central Asia, and drylands more generally. Based on the MANOVA results (Table 3), salinity emerges as the dominant factor after temperature, followed by sample type, pH, and aridity, all contributing significantly to brGDGT variance. However, this ranking is derived from a limited subset of samples because salinity and pH measurements do not cover the entire dataset (Fig. 5). Moreover, the present approach is further limited by the ex-situ measurement of salinity and pH (Fig. 2). Ongoing microbial metabolic activity during sample transport and storage may have altered in-situ pH conditions prior to laboratory analysis, potentially biasing measured values. Nevertheless, the ACA ranking clearly differs from the global hierarchy. Previous regional and local studies have likewise reported differences from the global-scale rankings. In Chinese soils, pH is the primary control on brGDGT distributions, surpassing temperature (Wang et al., 2019). In hyper- to semi-arid settings, annual precipitation and aridity become more influential than either pH or temperature (Duan et al., 2022). For lacustrine archives on the Tibetan Plateau, salinity is the leading controlling factor (Liang et al., 2024). Such site-specific variability in factor importance supports the idea that community shifts, rather than physiological plasticity, primarily govern brGDGT responses to environmental parameters (Guo et al., 2021). This further underscores the need to evaluate controlling factors at local to regional scales when assessing the applicability of brGDGT-based indices.
4.3 brGDGT-based climate calibrations for drylands
4.3.1 Temperature calibration errors
As a result of the multiple controlling factors influencing the response of brGDGTs to climate, and their complex combined effects, traditional temperature calibrations exhibit substantial errors when cross-validated using the ACADB dataset (Fig. 10). This is true for both the Mean Annual Air Temperature (Fig. 10A) and the mean air temperature of Months Above Freezing (Fig. 10B). At the ACADB scale, local calibrations show a significant average bias, producing either overly warm (Yang et al., 2014; Sun et al., 2011; Thomas et al., 2017) or overly cold estimates (Wang et al., 2016). Although global calibrations reduce this offset, they still display wide dispersion (ranging from −20 to 35 °C). These large errors persist across various statistical approaches, including quadratic and multiple linear regressions, -based, and Bayesian calibrations. Altogether, these findings highlight the need for developing dedicated calibrations for drylands, particularly focusing on temperature and precipitation reconstructions tailored to specific sample types (e.g., freshwater vs. hypersaline systems).
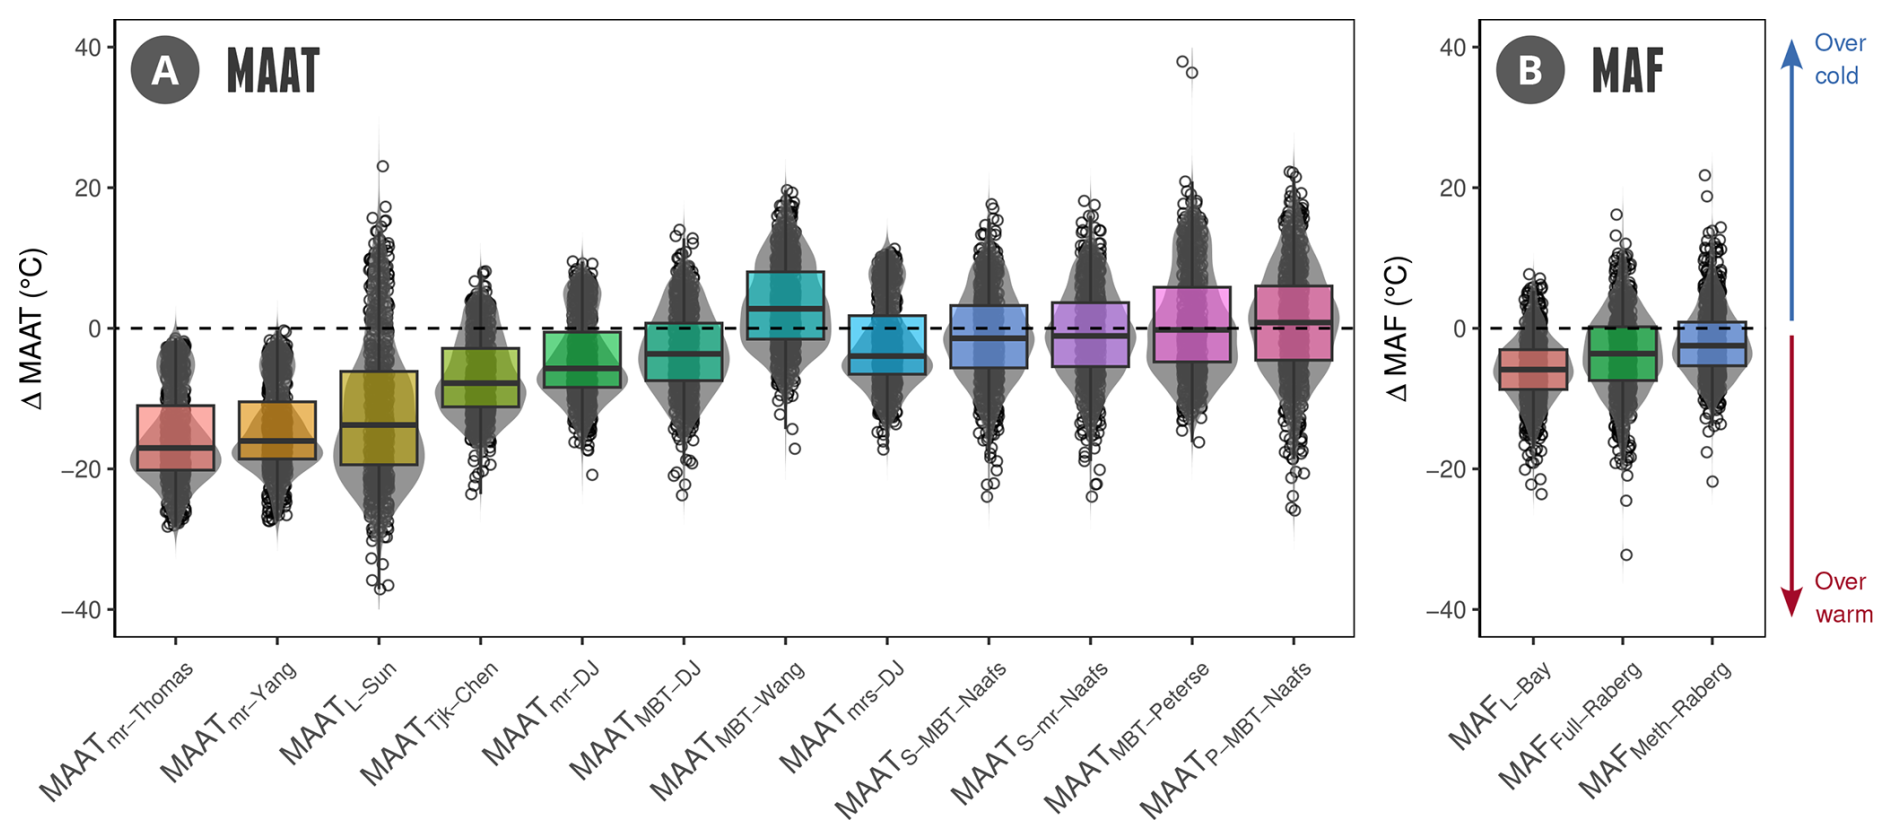
Figure 10Temperature residuals derived from 15 different brGDGT-temperature calibrations for the Mean Annual Air Temperature (A) and the mean air temperature of Months Above Freezing (B). The temperature biases are expressed with . The different calibration methods, formulas and RMSE are available in Table S6 in the Supplement. For each calibration original publication, see Sun et al. (2011), Peterse et al. (2012), De Jonge et al. (2014), Yang et al. (2014), Wang et al. (2016), Naafs et al. (2017a), Naafs et al. (2017b), Thomas et al. (2017) ant Chen et al. (2021). Annotations Over cold and Over warm illustrate cold and warm biases, respectively.
4.3.2 Aridity and precipitation calibrations
The particular arid conditions in ACA have led several studies to propose brGDGT-based precipitation reconstructions (mainly MAP) in parallel or instead of MAAT calibrations (Dugerdil et al., 2021a; Duan et al., 2022). In both cases, the statistical relationship between or matched precipitation better than temperature, and MR calibrations based on brGDGT fractional abundances were proposed. However, precipitation was inferred by MR calibration or cyclisation indices rather than by methylation indices (Dugerdil et al., 2021a; Duan et al., 2022). Moreover, even if no proper calibration is given, Lin et al. (2024) have shown a stronger linear correlation for with MAP than MAAT, especially for Chinese arid soils, giving specific interpretation for brGDGT loess-palaeosol sequences. A similar strong correlation with soil water content was also found in arid soils (Dang et al., 2016b).
4.3.3 brGDGT-temperature calibration
Our multivariate (Fig. 5) and univariate (Figs. 6 and 8) results have shown that several confounding factors can at least influence or at worst reverse the palaeothermometer calibration trends in drylands. The results of analyses of variance particularly evidence the influence of salinity and sample type on brGDGT FA. Mixing soil and lacustrine samples for such calibration raises the risk of misleading correlations. In ACA, -based palaeothermometer should be applied carefully or, even better, it should be recalibrated by confounding factor classes. Mainly, the ACADB analysis of variance carried out on several brGDGT indices reveals that the sample type effect is weaker than salinity and as strong as pH. If the sample type effect is already leading to particular calibration (i.e., soil, peat, and lacustrine ones) in global (De Jonge et al., 2014; Naafs et al., 2017a, b; Dearing Crampton-Flood et al., 2020; Martínez-Sosa et al., 2021) and regional calibrations (Sun et al., 2011; Yang et al., 2014; Chen et al., 2021), leading to specific peat, lake, and soil calibrations, caution needs to be taken with sample type calibrations in drylands. This is because, first, the sample type information for each sample is not always an indisputable observation. Lacustrine samples can be undoubtedly determined only from a deep lake (which is rare in drylands). Most ACA lakes from the lowland basin are temporary ponds, seasonally drained, while several soil samples come from solonchak (i.e., saline rangelands covered by halophytic vegetation and periodically flooded, Gintzburger et al., 2003). For high-elevation lakes, due to their low level of water, the amount of soil influx from water springs and aerial dust is important. They also commonly have a semi-peatland behaviour due to the hydrophytic vegetation colonisation from belt to lake centre in the context of shallow water level (Cromartie et al., 2020; Robles et al., 2022).
Among the difficulties encountered in reconstructing accurate temperatures with brGDGT, the temperature offset between global calibration and study site climate context appears. In most cases, MAAT or MAF inferred by brGDGT shows an important shift between modern MAAT and reconstructed MAAT for the lacustrine core tops (Martin et al., 2019; Dugerdil et al., 2021b; d'Oliveira et al., 2023). Using a local or regional calibration (Dugerdil et al., 2021a; Chen et al., 2021), generally reduces this offset. Comparing pollen-based and brGDGT-based temperatures also reveals that the brGDGT-MAAT relationship has wider temperature variation over the same time span (Robles et al., 2022; d'Oliveira et al., 2023).
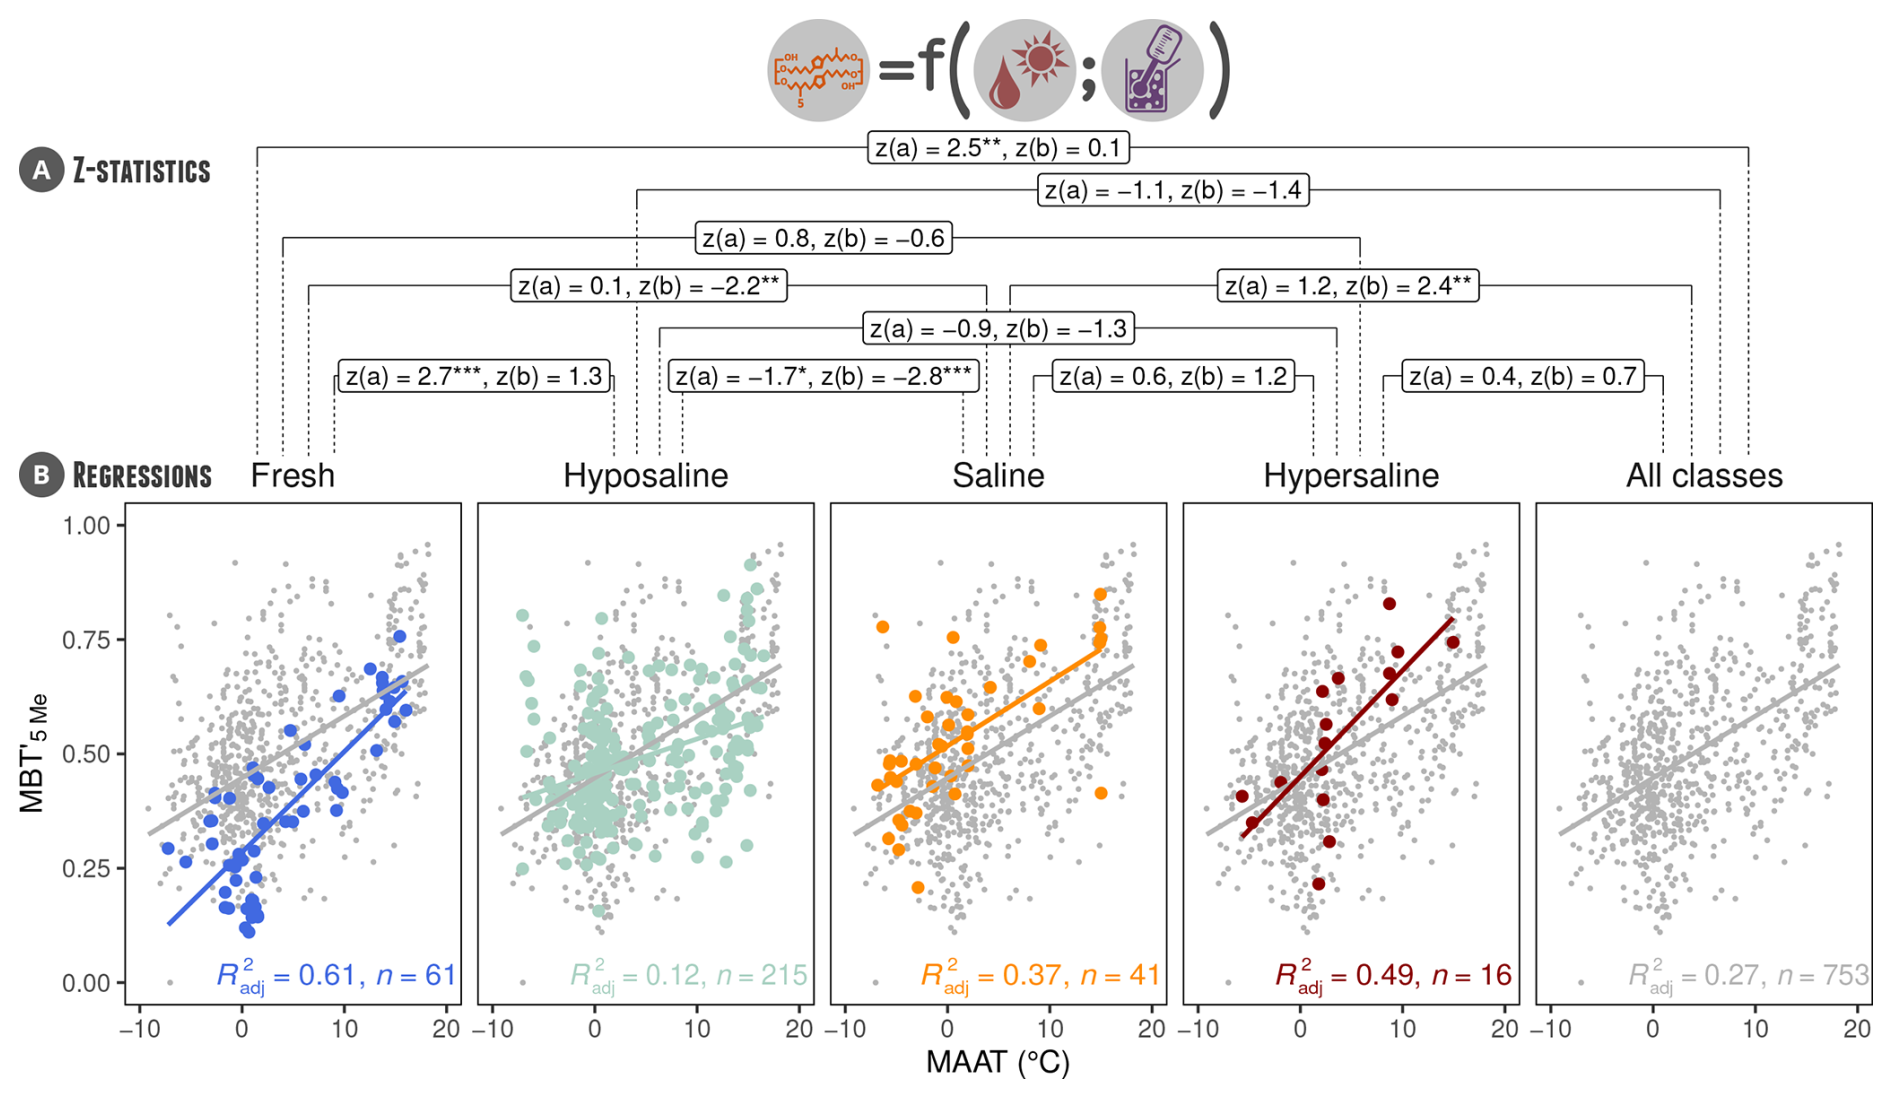
Figure 11Effect of salinity (i.e., the TDS of each surface sample) on the linear relationship between temperature (here MAAT) and the . Panel (A) shows the results of the z-statistic tests assessing significant differences in slopes and intercepts between salinity classes. Panel (B) presents linear regressions for fresh, hyposaline, saline, and hypersaline classes, based on the full ACADB. For each salinity group, temperature calibrations of the form MAAT = a + b are proposed (B). The z-statistic method (Clogg et al., 1995) evaluates the significance of slope (a) and intercept (b) differences across two classes (grey lines link the two classes with their z-statistics on panel A). The p values of the z-statistic are displayed with *** for p≤0.01, ** for p≤0.05, and * for p≤0.1.
4.3.4 Confounding factors effect on temperature calibrations
While -based temperature calibrations are commonly specified only based on the sample type (i.e., separate calibrations exist for soil, peat, and lacustrine samples), we have shown previously that the statistically most influential confounding factor in the ACADB was salinity before pH and sample type. Mainly, the Procrustes rotation analyses show similar multivariate spaces for soil and lacustrine samples (Fig. 5C and F). Based on this finding, specific calibrations based on salinity classes are tested on Fig. 11. The same tests were applied for pH (Fig. S7 in the Supplement), aridity (Fig. S8 in the Supplement) and sample type (Fig. S9 in the Supplement).
Salinity classes were based on a classification adapted from (Rusydi, 2018). The TDS cut-offs were refined using sensitivity analysis and are reported in Table S3 in the Supplement. In Fig. S7 in the Supplement, all adjusted regressions – except for hyposaline samples – perform better than the global model (i.e., the full ACADB), with the largest improvements for freshwater, hypersaline, and saline samples (R2adj of 0.61, 0.49, and 0.37, respectively). This method principally improves the statistical result for extreme classes. However, this improvement could be artificial and only produced by statistical biases such as the dataset size or the reduction of variance among groups. To ensure relevant salinity-specific calibrations, the z-statistic checks differences between regressions. Fresh calibration has a different slope than hyposaline and the whole dataset with z(a)=2.7*** and 2.5**. Saline samples share a slightly different slope with hyposaline with *. No conclusion can be made for hypersaline due to high variance resulting from the reduced dataset size (n=16). About the offset differences, saline and likely hypersaline have a significantly higher offset than hyposaline dataset (*** with hyposaline, z(b)=2.4** with the whole dataset). This analysis allows for ACA calibration based on salinity classes (Eq. 6). All the linear models in Eq. (6) have a p value <0.001 when tested using 20 000-permutation significance tests.
4.4 Recommendations for brGDGT applications to past records in drylands
4.4.1 Differential brGDGT sources effect in the past
Developing calibrations for specific sediment types can help reduce biases in brGDGT-based climate reconstructions, but some challenges remain. (1) The sediment type characterisation has to be reliable. Several studies attempt to use brGDGT themselves as a proxy of brGDGT sources based on mixing models (Martin et al., 2019) or classification machine learning approaches (Martínez-Sosa et al., 2023; Cromartie et al., 2025). Other proxies of the sample type could be a more reliable solution to evaluate the environmental condition of brGDGT deposit (Robles et al., 2022; d'Oliveira et al., 2023). (2) The brGDGT influx is not always related to the sediment deposit flux itself. In some particular conditions, a lake can record soil-produced brGDGT coming from the watershed instead of in-situ produced brGDGT (Zhao et al., 2021; Robles et al., 2022). In some other conditions, the in-situ production is dominant in the brGDGT assemblage (Wang et al., 2021; Kou et al., 2022). (3) When sediment types vary along a core, accurately characterizing them becomes challenging, making it difficult to apply a single brGDGT-based climate calibration. For instance, using a uniform lacustrine calibration may yield inconsistent results when applied to both hypersaline and freshwater lake samples, as illustrated in Fig. 11.
4.4.2 Confounding impacts and correction in the past
Then, the past sediment type characterisation appears to be insufficient to reliably apply selective brGDGT-based climate calibrations. The main confounding factor effect has to be taken into account. However, these confounding factors are study-context dependent: the saturation effect of the and the vegetation buffer in tropical areas (Pérez-Angel et al., 2020; Häggi et al., 2023), the important seasonality in the Arctic (Raberg et al., 2021), soil moisture and salinity impact in drylands (Fig. 11; Dang et al., 2016b; Kou et al., 2022), etc. A second limitation of this grouping factor selective calibration approach in the past is that the confounding factor impact is not always stationary over time. For instance, salinity (So et al., 2023) or vegetation cover (Robles et al., 2022; d'Oliveira et al., 2023) dramatically shifted in the past. It is particularly the case during the Holocene in ACA (Chen et al., 2024). In this case, inferring confounding factor covariation has to be considered. Several studies attempt to track these covariations using brGDGT-based confounding factor proxies, such as isomer ratios (Liang et al., 2024). Some others use a multi-proxy approach (e.g., pollen or chironomids) to independently infer the confounding factor variation trends (Dugerdil et al., 2021a, b; Robles et al., 2022; d'Oliveira et al., 2023).
To improve the regression between and MAAT, we apply calibrations using different grouping factors, mainly salinity (Wang et al., 2021, Fig. 11), but also pH and aridity (Figs. S7 and S8 in the Supplement). Chen et al. (2021) split the GDGT dataset by surface sample pH (threshold of pH = 7), which is reflected in the ACADB CBT′-pH relationship (Fig. 7A and B) and reported in arid soils (Guo et al., 2021). Similarly, Wang et al. (2021) improved the -based temperature calibration for Tibetan lacustrine samples by including salinity, but quantitative values for these factors are unavailable for past brGDGT sequences.
One of the solutions to fulfil this lack of information about the deposit system in the past is to make differential calibrations not on confounding factor values but on brGDGT-based proxies of these confounding factor values. Such an approach has been tested in Véquaud et al. (2022), using the Community Index (De Jonge et al., 2019) with limited regression improvement. In Véquaud et al. (2022), the two clusters based on the Community Index threshold were thought to improve the temperature reconstruction by showing specific regression for each of them. However, the two sub-groups give mitigated determination coefficient (R2 of 0.20 and 0.71). More recently, Liang et al. (2024) propose to use the isomer ratio (since this index includes both salinity and pH effects) to constrain -based MAAT calibration with more reliable results in saline lakes. All these attempts are still incomplete to totally correct the brGDGT-based temperature reconstruction bias, even if they significantly reduce the over-estimation of MAAT. In any case, a careful examination of the brGDGT distribution from past archives is essential to minimize errors resulting from the inappropriate selection of applied calibrations.
The brGDGT-based palaeothermometer is one of the most promising approaches to improve our understanding of past climate in different regions of the world. However, based on the comparison between an ACA-centred database and the world surface sample database, our study has shown that:
-
Drylands suffer from particular climate and physicochemical properties of soils and lakes, enhancing the impact of confounding factors on brGDGT-based and fractional abundances' relationship with MAAT.
-
Among the controlling factors (i.e., pH, aridity, salinity, and sample type), salinity is the most dominant, followed by sample type and pH. However, aridity plays a major role in the brGDGT variance among the dataset. Moreover, these biases cannot be studied individually since their interactions are not always similar. For instance, the salinity control on brGDGT isomerisation is different in soil and lacustrine deposit contexts.
-
In order to use brGDGT as a proxy for sediment physicochemical conditions, it appears that the is the best index of salinity, while IR6Me is the best for pH reconstruction despite its saturation effect for pH <4 and pH >10. For aridity, drawing gives a fairly reliable estimate.
-
relationship with MAAT is very limited in ACA, especially for lacustrine samples, mitigating the applicability of palaeothermometers based on methylation indices. However, the specific sub-calibrations for different environmental classes (mainly salinity and aridity classes) dramatically improve the linear regression strength. This report paves the way for a specific calibration application on past brGDGT sequences based on environmental classes inferred or by brGDGT indices or by other independent proxies (e.g., pollen or chironomids).
Mainly, even if the brGDGT signal in drylands such as ACA is mitigated and the number of controlling factors is sometimes difficult to unravel, it remains a very promising tool to improve our understanding of both past climate and future forecasting (Tierney et al., 2020). However, some work still remains in process, including the increase of arid sites in the database (both for the calibration process associated with exhaustive physicochemical and bioclimatic properties of the samples and for the past brGDGT sequences enhanced by a multi-proxy approach) and the development of a machine learning approach, which promises a more powerful unravelling process of controlling factor comprehension.
The R scripts used to clean, analysed the ACADB surface brGDGT data and plot all the figures presented in this study (except Figs. 1 and 2 realized in QGIS and Inkscape) are open and available on Zenodo at https://doi.org/10.5281/zenodo.18429660 (Dugerdil, 2026).
Sample type, location and features, brGDGT fractional abundances and concentrations, brGDGT-based indices, bioclimate, and physicochemical parameters are available on PANGAEA dataset (https://doi.org/10.1594/PANGAEA.983391; Dugerdil et al., 2025a).
The supplement related to this article is available online at https://doi.org/10.5194/bg-23-1013-2026-supplement.
Conceptualization: LD, SJ, OP, MG; Data curation: LD; Formal analysis: LD, AC, GM, SAA; Funding acquisition: SJ, XH, BB, FC, GM; Investigation: LD, SB, XH, JA, RS, IM, SI, SM, EA, SI, PG; Methodology: LD, SJ, OP, MG; Project administration: LD, SJ, OP, MG; Resources: LD, SB, XH, FC, DE, JA, BB, JH, LS, KM, RS, IM, SI, SM, EA, SI, PG; Software: LD, AC; Supervision: LD, SJ, OP, MG; Validation: LD, SJ, OP, MG, XH, FC, BB; Visualization: LD; Writing – original draft: LD; Writing – review & editing: all authors.
The contact author has declared that none of the authors has any competing interests.
Publisher's note: Copernicus Publications remains neutral with regard to jurisdictional claims made in the text, published maps, institutional affiliations, or any other geographical representation in this paper. The authors bear the ultimate responsibility for providing appropriate place names. Views expressed in the text are those of the authors and do not necessarily reflect the views of the publisher.
We would like to thank the reviewers and the editor for their thoughtful comments that improved this paper. We are grateful to La Tendresse, Sarah Millet-Amrani, and Zoé Hernandez for their valuable support in France; Nozimbek Namozovich and Sokhib Abdusamatov in Uzbekistan; and Gulmirzozoda Masnavi Gulmirzo in Tajikistan. We are grateful to Vivien Mai Yung Sen for his help in high mountain sampling in Hissar and Pamir. Thanks to Elodie Brisset (IMBE) and Johanna Lhuillier (Archéorient) for their support during the Uzbekistan field trips. This is an ISEM contribution ISEM 2026-018 SUD.
This research was funded, in whole or in part, by ANR STEPABILITY (grant no. ANR-22-CE27-0018), and ANR KUR(A)GAN (grant no. ANR-20-FRAL-0006). A CC-BY public copyright license has been applied by the authors to the present document and will be applied to all subsequent versions up to the Author Accepted Manuscript arising from this submission, in accordance with the grant's open access conditions. The ENS de Lyon financed the PhD scholarship of Lucas Dugerdil. Bazartseren Boldgiv is supported by the Taylor Family-Asia Foundation Endowed Chair in Ecology and Conservation Biology.
This paper was edited by Ny Riavo G. Voarintsoa and reviewed by Yan Bai and one anonymous referee.
Ajallooeian, F., Dubois, N., Ladd, S. N., Lever, M. A., Schubert, C. J., and De Jonge, C.: Controls on brGDGT Production in the Seasonally Anoxic Water Column and Sediments of Rotsee (Lake Rot), J. Geophys. Res.-Biogeo., 130, e2025JG009132, https://doi.org/10.1029/2025JG009132, 2025. a
Baxter, A. J., Hopmans, E. C., Russell, J. M., and Sinninghe Damsté, J. S.: Bacterial GMGTs in East African Lake Sediments: Their Potential as Palaeotemperature Indicators, Geochim. Cosmochim. Ac., 259, 155–169, https://doi.org/10.1016/j.gca.2019.05.039, 2019. a
Bierens, H. J.: Uniform Consistency of Kernel Estimators of a Regression Function under Generalized Conditions, J. Am. Stat. A., 78, 699–707, https://doi.org/10.1080/01621459.1983.10478031, 1983. a
Bivand, R., Keitt, T., Rowlingson, B., Pebesma, E., Sumner, M., Hijmans, R., Rouault, E., and Bivand, M. R.: Package 'Rgdal', Bindings for the Geospatial Data Abstraction Library, https://cran.r-project.org/web/packages/rgdal/index.html (last access: 15 October 2017), 172, 2015. a
Bunting, M., Farrell, M., Broström, A., Hjelle, K., Mazier, F., Middleton, R., Nielsen, A., Rushton, E., Shaw, H., and Twiddle, C.: Palynological Perspectives on Vegetation Survey: A Critical Step for Model-Based Reconstruction of Quaternary Land Cover, Quaternary Sci. Rev., 82, 41–55, https://doi.org/10.1016/j.quascirev.2013.10.006, 2013. a
Cao, M., Rueda, G., Rivas-Ruiz, P., Trapote, M. C., Henriksen, M., Vegas-Vilarrúbia, T., and Rosell-Melé, A.: Branched GDGT Variability in Sediments and Soils from Catchments with Marked Temperature Seasonality, Organic Geochemistry, 122, 98–114, https://doi.org/10.1016/j.orggeochem.2018.05.007, 2018. a
Cao, X.-y., Herzschuh, U., Telford, R. J., and Ni, J.: A Modern Pollen–Climate Dataset from China and Mongolia: Assessing Its Potential for Climate Reconstruction, Review of Palaeobotany and Palynology, 211, 87–96, https://doi.org/10.1016/j.revpalbo.2014.08.007, 2014. a, b
Chen, C., Bai, Y., Fang, X., Zhuang, G., Khodzhiev, A., Bai, X., and Murodov, A.: Evaluating the Potential of Soil Bacterial Tetraether Proxies in Westerlies Dominating Western Pamirs, Tajikistan and Implications for Paleoenvironmental Reconstructions, Chem. Geol., 559, 119908, https://doi.org/10.1016/j.chemgeo.2020.119908, 2021. a, b, c, d, e, f, g, h, i, j, k, l, m, n
Chen, S., Chen, J., Ding, G., Ma, S., Ji, P., Zhou, A., Wu, D., Khormali, F., Hou, J., and Chen, F.: Dipole Pattern of Holocene Hydroclimate Variations across the Asian Drylands: Critical Evidence from West Asia, J. Geophys. Res.-Atmos., 129, e2023JD039413, https://doi.org/10.1029/2023JD039413, 2024. a, b, c
Chen, Y., Zhang, X., Qi, W., Zhang, G., Pei, Y., Fang, X., Xia, Y., and Zhang, S.: Distribution of Glycerol Dialkyl Glycerol Tetraethers (GDGTs) in Carbonate-Type and Sulfate-Type Lacustrine Sediments: Insight into the Influence of Ionic Composition on GDGTs, Minerals, 12, 1233, https://doi.org/10.3390/min12101233, 2022. a, b
Clogg, C. C., Petkova, E., and Haritou, A.: Statistical Methods for Comparing Regression Coefficients between Models, Am. J. Sociol., 100, 1261–1293, https://doi.org/10.1086/230638, 1995. a, b
Cromartie, A., Blanchet, C., Barhoumi, C., Messager, E., Peyron, O., Ollivier, V., Sabatier, P., Etienne, D., Karakhanyan, A., Khatchadourian, L., Smith, A. T., Badalyan, R., Perello, B., Lindsay, I., and Joannin, S.: The Vegetation, Climate, and Fire History of a Mountain Steppe: A Holocene Reconstruction from the South Caucasus, Shenkani, Armenia, Quaternary Sci. Rev., 246, 106485, https://doi.org/10.1016/j.quascirev.2020.106485, 2020. a
Cromartie, A., De Jonge, C., Ménot, G., Robles, M., Dugerdil, L., Peyron, O., Rodrigo-Gámiz, M., Camuera, J., Ramos-Roman, M. J., Jiménez-Moreno, G., Colombié, C., Sahakyan, L., and Joannin, S.: Utilizing probability estimates from machine learning and pollen to understand the depositional influences on branched GDGT in wetlands, peatlands, and lakes, Biogeosciences, 22, 7687–7708, https://doi.org/10.5194/bg-22-7687-2025, 2025. a, b, c, d
Dang, X., Xue, J., Yang, H., and Xie, S.: Environmental Impacts on the Distribution of Microbial Tetraether Lipids in Chinese Lakes with Contrasting pH: Implications for Lacustrine Paleoenvironmental Reconstructions, Science China Earth Sciences, 59, 939–950, https://doi.org/10.1007/s11430-015-5234-z, 2016a. a, b, c
Dang, X., Yang, H., Naafs, B. D. A., Pancost, R. D., and Xie, S.: Evidence of Moisture Control on the Methylation of Branched Glycerol Dialkyl Glycerol Tetraethers in Semi-Arid and Arid Soils, Geochim. Cosmochim. Ac., 189, 24–36, https://doi.org/10.1016/j.gca.2016.06.004, 2016b. a, b, c, d, e, f, g, h, i, j, k
Dang, X., Ding, W., Yang, H., Pancost, R. D., Naafs, B. D. A., Xue, J., Lin, X., Lu, J., and Xie, S.: Different Temperature Dependence of the Bacterial brGDGT Isomers in 35 Chinese Lake Sediments Compared to That in Soils, Organic Geochemistry, 119, 72–79, https://doi.org/10/gdfs3x, 2018. a, b
Davtian, N., Bard, E., Ménot, G., and Fagault, Y.: The Importance of Mass Accuracy in Selected Ion Monitoring Analysis of Branched and Isoprenoid Tetraethers, Organic Geochemistry, 118, 58–62, https://doi.org/10/gdc8rs, 2018. a
Dearing Crampton-Flood, E., Tierney, J. E., Peterse, F., Kirkels, F. M. S. A., and Sinninghe Damsté, J. S.: BayMBT: A Bayesian Calibration Model for Branched Glycerol Dialkyl Glycerol Tetraethers in Soils and Peats, Geochim. Cosmochim. Ac., 268, 142–159, https://doi.org/10/gg9758, 2020. a, b, c, d, e, f, g, h, i, j, k
De Jonge, C., Hopmans, E. C., Zell, C. I., Kim, J.-H., Schouten, S., and Sinninghe Damsté, J. S.: Occurrence and Abundance of 6-Methyl Branched Glycerol Dialkyl Glycerol Tetraethers in Soils: Implications for Palaeoclimate Reconstruction, Geochim. Cosmochim. Ac., 141, 97–112, https://doi.org/10/f6h2xw, 2014. a, b, c, d, e, f, g, h, i, j, k, l, m, n, o, p, q, r, s, t, u, v
De Jonge, C., Radujković, D., Sigurdsson, B. D., Weedon, J. T., Janssens, I., and Peterse, F.: Lipid Biomarker Temperature Proxy Responds to Abrupt Shift in the Bacterial Community Composition in Geothermally Heated Soils, Organic Geochemistry, 137, 103897, https://doi.org/10.1016/j.orggeochem.2019.07.006, 2019. a, b
De Jonge, C., Guo, J., Hällberg, P., Griepentrog, M., Rifai, H., Richter, A., Ramirez, E., Zhang, X., Smittenberg, R. H., and Peterse, F.: The Impact of Soil Chemistry, Moisture and Temperature on Branched and Isoprenoid GDGTs in Soils: A Study Using Six Globally Distributed Elevation Transects, Organic Geochemistry, 187, 104706, https://doi.org/10.1016/j.orggeochem.2023.104706, 2024a. a, b, c
De Jonge, C., Peterse, F., Nierop, K. G. J., Blattmann, T. M., Alexandre, M., Ansanay-Alex, S., Austin, T., Babin, M., Bard, E., Bauersachs, T., Blewett, J., Boehman, B., Castañeda, I. S., Chen, J., Conti, M. L. G., Contreras, S., Cordes, J., Davtian, N., Van Dongen, B., Duncan, B., Elling, F. J., Galy, V., Gao, S., Hefter, J., Hinrichs, K.-U., Helling, M. R., Hoorweg, M., Hopmans, E., Hou, J., Huang, Y., Huguet, A., Jia, G., Karger, C., Keely, B. J., Kusch, S., Li, H., Liang, J., Lipp, J. S., Liu, W., Lu, H., Mangelsdorf, K., Manners, H., Martinez Garcia, A., Menot, G., Mollenhauer, G., Naafs, B. D. A., Naeher, S., O'Connor, L. K., Pearce, E. M., Pearson, A., Rao, Z., Rodrigo-Gámiz, M., Rosendahl, C., Rostek, F., Bao, R., Sanyal, P., Schubotz, F., Scott, W., Sen, R., Sluijs, A., Smittenberg, R., Stefanescu, I., Sun, J., Sutton, P., Tierney, J., Tejos, E., Villanueva, J., Wang, H., Werne, J., Yamamoto, M., Yang, H., and Zhou, A.: Interlaboratory Comparison of Branched GDGT Temperature and pH Proxies Using Soils and Lipid Extracts, Geochem. Geophys. Geosyst., 25, e2024GC011583, https://doi.org/10.1029/2024GC011583, 2024b. a
Deng, L., Jia, G., Jin, C., and Li, S.: Warm Season Bias of Branched GDGT Temperature Estimates Causes Underestimation of Altitudinal Lapse Rate, Organic Geochemistry, 96, 11–17, https://doi.org/10.1016/j.orggeochem.2016.03.004, 2016. a, b, c, d, e
Ding, S., Schwab, V. F., Ueberschaar, N., Roth, V.-N., Lange, M., Xu, Y., Gleixner, G., and Pohnert, G.: Identification of Novel 7-Methyl and Cyclopentanyl Branched Glycerol Dialkyl Glycerol Tetraethers in Lake Sediments, Organic Geochemistry, 102, 52–58, https://doi.org/10/f9mmqv, 2016. a, b
Dixon, P.: VEGAN, a Package of R Functions for Community Ecology, Journal of Vegetation Science, 14, 927–930, https://doi.org/10/dz9txb, 2003. a, b, c
d'Oliveira, L., Dugerdil, L., Ménot, G., Evin, A., Muller, S. D., Ansanay-Alex, S., Azuara, J., Bonnet, C., Bremond, L., Shah, M., and Peyron, O.: Reconstructing 15 000 years of southern France temperatures from coupled pollen and molecular (branched glycerol dialkyl glycerol tetraether) markers (Canroute, Massif Central), Clim. Past, 19, 2127–2156, https://doi.org/10.5194/cp-19-2127-2023, 2023. a, b, c, d, e, f
Duan, Y., Sun, Q., Werne, J. P., Yang, H., Jia, J., Wang, L., Xie, H., and Chen, F.: Soil pH Dominates the Distributions of Both 5- and 6-Methyl Branched Tetraethers in Arid Regions, J. Geophys. Res.-Biogeo., 125, e2019JG005356, https://doi.org/10.1029/2019jg005356, 2020. a, b, c, d, e, f, g
Duan, Y., Sun, Q., Werne, J. P., Hou, J., Yang, H., Wang, Q., Khormali, F., and Chen, F.: The Impact of Precipitation on the Distributions of Branched Tetraethers in Alkaline Soils, Organic Geochemistry, 169, 104410, https://doi.org/10.1016/j.orggeochem.2022.104410, 2022. a, b, c, d, e, f, g, h, i, j, k, l
Dugerdil, L.: LucasDugerdil/GDGT_ACADB: v1.0.1 (v1.0.1), Zenodo [code], https://doi.org/10.5281/zenodo.18429660, 2026. a
Dugerdil, L., Joannin, S., Peyron, O., Jouffroy-Bapicot, I., Vannière, B., Boldgiv, B., Unkelbach, J., Behling, H., and Ménot, G.: Climate reconstructions based on GDGT and pollen surface datasets from Mongolia and Baikal area: calibrations and applicability to extremely cold–dry environments over the Late Holocene, Clim. Past, 17, 1199–1226, https://doi.org/10.5194/cp-17-1199-2021, 2021a. a, b, c, d, e, f, g, h, i, j, k, l, m, n
Dugerdil, L., Ménot, G., Peyron, O., Jouffroy-Bapicot, I., Ansanay-Alex, S., Antheaume, I., Behling, H., Boldgiv, B., Develle, A.-L., Grossi, V., Magail, J., Makou, M., Robles, M., Unkelbach, J., Vannière, B., and Joannin, S.: Late Holocene Mongolian Climate and Environment Reconstructions from brGDGTs, NPPs and Pollen Transfer Functions for Lake Ayrag: Paleoclimate Implications for Arid Central Asia, Quaternary Sci. Rev., 273, 107235, https://doi.org/10.1016/j.quascirev.2021.107235, 2021b. a, b, c
Dugerdil, L., Joannin, S., Peyron, O., Bayramova, S., Huang, X., Egamberdieva, D., Alimov, J., Boldgiv, B., Sahakyan, L., and Ménot, G.: Arid Central Asian Data Base (ACADB) for surface brGDGT samples, PANGAEA, https://doi.org/10.1594/PANGAEA.983391 [data set], 2025a. a
Dugerdil, L., Joannin, S., Peyron, O., Cromartie, A., Robles, M., Duan, Y., Huang, X., Chen, F., and Ménot, G.: Boosted Regression Trees Machine Learning Method Improves the brGDGT-based Climate Reconstruction in Drylands, Paleoceanography and Paleoclimatology, 40, e2025PA005214, https://doi.org/10.1029/2025PA005214, 2025b. a, b, c, d, e, f, g, h, i, j
Dugerdil, L., Peyron, O., Ménot, G., Egamberdieva, D., Alimov, J., Leroy, S. A., Garnier, E., Nowak, A., and Joannin, S.: First Paleoenvironmental Calibrations for Modern Pollen Rain of Tajikistan and Uzbekistan: A Case Study of Pollen – Vegetation Functional Biogeography of Arid Central Asia, Global Planet. Change, 252, 104857, https://doi.org/10.1016/j.gloplacha.2025.104857, 2025c. a, b
Fick, S. E. and Hijmans, R. J.: WorldClim 2: New 1-Km Spatial Resolution Climate Surfaces for Global Land Areas, Int. J. Climatol., 37, 4302–4315, https://doi.org/10/gb2jnq, 2017. a, b, c
Gintzburger, G., Makhmudov, G., Mardonov, B. K., and Toderich, K.: Rangelands of the Arid and Semi-Arid Zones in Uzbekistan, Cirad, CIRAD 2-87614-555-3, 2003. a
Guo, J., Ma, T., Liu, N., Zhang, X., Hu, H., Ma, W., Wang, Z., Feng, X., and Peterse, F.: Soil pH and Aridity Influence Distributions of Branched Tetraether Lipids in Grassland Soils along an Aridity Transect, Organic Geochemistry, 164, 104347, https://doi.org/10.1016/j.orggeochem.2021.104347, 2021. a, b, c, d, e, f, g, h, i, j, k, l, m, n, o, p, q
Häggi, C., Naafs, B. D. A., Silvestro, D., Bertassoli, D. J., Akabane, T. K., Mendes, V. R., Sawakuchi, A. O., Chiessi, C. M., Jaramillo, C. A., and Feakins, S. J.: GDGT Distribution in Tropical Soils and Its Potential as a Terrestrial Paleothermometer Revealed by Bayesian Deep-Learning Models, Geochim. Cosmochim. Ac., 362, 41–64, https://doi.org/10.1016/j.gca.2023.09.014, 2023. a, b, c, d, e, f
Halamka, T. A., Raberg, J. H., McFarlin, J. M., Younkin, A. D., Mulligan, C., Liu, X.-L., and Kopf, S. H.: Production of Diverse brGDGTs by Acidobacterium Solibacter Usitatus in Response to Temperature, pH, and O2 Provides a Culturing Perspective on Br GDGT Proxies and Biosynthesis, Geobiology, 21, 102–118, https://doi.org/10.1111/gbi.12525, 2023. a
Hällberg, P. L., Smittenberg, R., Kylander, M. E., Villanueva, J., Davtian, N., Hapsari, A., Sjöström, J. K., Axelsson, J., Jarne-Bueno, G., Yamoah, K., Rifai, H., and Schenk, F.: Disentangling Seasonal and Annual Precipitation Signals in the Tropics over the Holocene: Insights from δD, Alkanes and GDGTs, Quaternary Sci. Rev., 344, 108948, https://doi.org/10.1016/j.quascirev.2024.108948, 2024. a
Hamilton, N. and Ferry, M.: Ggtern : Ternary Diagrams Using Ggplot2, J. Stat. Softw., 87, 1, https://doi.org/10.18637/jss.v087.c03, 2018. a
Hijmans, R. J.: Raster: Geographic Data Analysis and Modeling, CRAN, 734, 473, https://doi.org/10.32614/CRAN.package.raster, 2023. a
Hopmans, E. C., Schouten, S., and Damsté, J. S. S.: The Effect of Improved Chromatography on GDGT-based Palaeoproxies, Organic Geochemistry, 93, 1–6, https://doi.org/10.1016/j.orggeochem.2015.12.006, 2016. a
Huguet, C., Hopmans, E. C., Febo-Ayala, W., Thompson, D. H., Sinninghe Damsté, J. S., and Schouten, S.: An Improved Method to Determine the Absolute Abundance of Glycerol Dibiphytanyl Glycerol Tetraether Lipids, Organic Geochemistry, 37, 1036–1041, https://doi.org/10.1016/j.orggeochem.2006.05.008, 2006. a, b, c
Jarvis, A., Guevara, E., Reuter, H., and Nelson, A.: Hole-Filled SRTM for the Globe : Version 4 : Data Grid, International Centre for Tropical Agriculture (CIAT), https://srtm.csi.cgiar.org/ (last access: 29 January 2025), 2008. a
Kou, Q., Zhu, L., Ju, J., Wang, J., Xu, T., Li, C., and Ma, Q.: Influence of Salinity on Glycerol Dialkyl Glycerol Tetraether-Based Indicators in Tibetan Plateau Lakes: Implications for Paleotemperature and Paleosalinity Reconstructions, Palaeogeogr. Palaeocl., 601, 111127, https://doi.org/10.1016/j.palaeo.2022.111127, 2022. a, b, c, d, e, f, g, h, i, j, k, l, m, n, o
Lei, Y., Yang, H., Dang, X., Zhao, S., and Xie, S.: Absence of a Significant Bias towards Summer Temperature in Branched Tetraether-Based Paleothermometer at Two Soil Sites with Contrasting Temperature Seasonality, Organic Geochemistry, 94, 83–94, https://doi.org/10.1016/j.orggeochem.2016.02.003, 2016. a
Leroy, S. A., Kakroodi, A. A., Kroonenberg, S., Lahijani, H. K., Alimohammadian, H., and Nigarov, A.: Holocene Vegetation History and Sea Level Changes in the SE Corner of the Caspian Sea: Relevance to SW Asia Climate, Quaternary Sci. Rev., 70, 28–47, https://doi.org/10.1016/j.quascirev.2013.03.004, 2013. a
Li, J., Naafs, B. D. A., Pancost, R. D., Yang, H., Liu, D., and Xie, S.: Distribution of Branched Tetraether Lipids in Ponds from Inner Mongolia, NE China: Insight into the Source of brGDGTs, Organic Geochemistry, 112, 127–136, https://doi.org/10.1016/j.orggeochem.2017.07.005, 2017. a
Li, Y., Zhao, S., Pei, H., Qian, S., Zang, J., Dang, X., and Yang, H.: Distribution of Glycerol Dialkyl Glycerol Tetraethers in Surface Soils along an Altitudinal Transect at Cold and Humid Mountain Changbai: Implications for the Reconstruction of Paleoaltimetry and Paleoclimate, Science China Earth Sciences, 61, 925–939, https://doi.org/10.1007/s11430-017-9168-9, 2018. a
Liang, J., Russell, J. M., Xie, H., Lupien, R. L., Si, G., Wang, J., Hou, J., and Zhang, G.: Vegetation Effects on Temperature Calibrations of Branched Glycerol Dialkyl Glycerol Tetraether (brGDGTs) in Soils, Organic Geochemistry, 127, 1–11, https://doi.org/10.1016/j.orggeochem.2018.10.010, 2019. a, b, c
Liang, J., Chevalier, M., Liu, K., Perfumo, A., Wang, M., Xie, H., Hou, J., Herzschuh, U., and Chen, F.: Discrepancies in Lacustrine Bacterial Lipid Temperature Reconstructions Explained by Microbial Ecology, Commun. Earth Environ., 5, 1–14, https://doi.org/10.1038/s43247-024-01925-3, 2024. a, b, c, d, e, f, g
Lin, T., Rao, Z., Zeng, Y., Li, Y., Zhao, L., Liu, L., Xiao, X., Zhang, C., Shen, Z., Cao, J., and Jia, G.: Sedimentary brGDGTs in China: An Overview of Modern Observations and Proposed Land Holocene Paleotemperature Records, Earth-Sci. Rev., 250, 104694, https://doi.org/10.1016/j.earscirev.2024.104694, 2024. a, b, c, d, e
Loomis, S. E., Russell, J. M., and Sinninghe Damsté, J. S.: Distributions of Branched GDGTs in Soils and Lake Sediments from Western Uganda: Implications for a Lacustrine Paleothermometer, Organic Geochemistry, 42, 739–751, https://doi.org/10.1016/j.orggeochem.2011.06.004, 2011. a, b
Maestre, F. T., Le Bagousse-Pinguet, Y., Delgado-Baquerizo, M., Eldridge, D. J., Saiz, H., Berdugo, M., Gozalo, B., Ochoa, V., Guirado, E., García-Gómez, M., Valencia, E., Gaitán, J. J., Asensio, S., Mendoza, B. J., Plaza, C., Díaz-Martínez, P., Rey, A., Hu, H.-W., He, J.-Z., Wang, J.-T., Lehmann, A., Rillig, M. C., Cesarz, S., Eisenhauer, N., Martínez-Valderrama, J., Moreno-Jiménez, E., Sala, O., Abedi, M., Ahmadian, N., Alados, C. L., Aramayo, V., Amghar, F., Arredondo, T., Ahumada, R. J., Bahalkeh, K., Ben Salem, F., Blaum, N., Boldgiv, B., Bowker, M. A., Bran, D., Bu, C., Canessa, R., Castillo-Monroy, A. P., Castro, H., Castro, I., Castro-Quezada, P., Chibani, R., Conceição, A. A., Currier, C. M., Darrouzet-Nardi, A., Deák, B., Donoso, D. A., Dougill, A. J., Durán, J., Erdenetsetseg, B., Espinosa, C. I., Fajardo, A., Farzam, M., Ferrante, D., Frank, A. S. K., Fraser, L. H., Gherardi, L. A., Greenville, A. C., Guerra, C. A., Gusmán-Montalvan, E., Hernández-Hernández, R. M., Hölzel, N., Huber-Sannwald, E., Hughes, F. M., Jadán-Maza, O., Jeltsch, F., Jentsch, A., Kaseke, K. F., Köbel, M., Koopman, J. E., Leder, C. V., Linstädter, A., le Roux, P. C., Li, X., Liancourt, P., Liu, J., Louw, M. A., Maggs-Kölling, G., Makhalanyane, T. P., Issa, O. M., Manzaneda, A. J., Marais, E., Mora, J. P., Moreno, G., Munson, S. M., Nunes, A., Oliva, G., Oñatibia, G. R., Peter, G., Pivari, M. O. D., Pueyo, Y., Quiroga, R. E., Rahmanian, S., Reed, S. C., Rey, P. J., Richard, B., Rodríguez, A., Rolo, V., Rubalcaba, J. G., Ruppert, J. C., Salah, A., Schuchardt, M. A., Spann, S., Stavi, I., Stephens, C. R. A., Swemmer, A. M., Teixido, A. L., Thomas, A. D., Throop, H. L., Tielbörger, K., Travers, S., Val, J., Valkó, O., van den Brink, L., Ayuso, S. V., Velbert, F., Wamiti, W., Wang, D., Wang, L., Wardle, G. M., Yahdjian, L., Zaady, E., Zhang, Y., Zhou, X., Singh, B. K., and Gross, N.: Grazing and Ecosystem Service Delivery in Global Drylands, Science, 378, 915–920, https://doi.org/10.1126/science.abq4062, 2022. a
Mardia, K. V.: Measures of Multivariate Skewness and Kurtosis with Applications, Biometrika, 57, 519–530, https://doi.org/10.1093/biomet/57.3.519, 1970. a
Martin, C., Ménot, G., Thouveny, N., Davtian, N., Andrieu-Ponel, V., Reille, M., and Bard, E.: Impact of Human Activities and Vegetation Changes on the Tetraether Sources in Lake St Front (Massif Central, France), Organic Geochemistry, 135, 38–52, https://doi.org/10.1016/j.orggeochem.2019.06.005, 2019. a, b, c, d
Martínez-Sosa, P., Tierney, J. E., Stefanescu, I. C., Crampton-Flood, E. D., Shuman, B. N., and Routson, C.: A Global Bayesian Temperature Calibration for Lacustrine brGDGTs, Geochim. Cosmochim. Ac., 305, 87–105, https://doi.org/10.1016/j.gca.2021.04.038, 2021. a, b, c
Martínez-Sosa, P., Tierney, J. E., Pérez-Angel, L. C., Stefanescu, I. C., Guo, J., Kirkels, F., Sepúlveda, J., Peterse, F., Shuman, B. N., and Reyes, A. V.: Development and Application of the Branched and Isoprenoid GDGT Machine Learning Classification Algorithm (BIGMaC) for Paleoenvironmental Reconstruction, Paleoceanography and Paleoclimatology, 38, e2023PA004611, https://doi.org/10.1029/2023PA004611, 2023. a, b, c
Middleton, N. and Thomas, D.: World Atlas of Desertification, UNEP(017)/W927, Unep, London, 1997. a, b
Moore, D. S., McCabe, G. P., and Craig, B. A.: Introduction to the Practice of Statistics, vol. 4, WH Freeman New York, 2009. a
Moreno-Jiménez, E., Plaza, C., Saiz, H., Manzano, R., Flagmeier, M., and Maestre, F. T.: Aridity and Reduced Soil Micronutrient Availability in Global Drylands, Nature Sustainability, 2, 371–377, https://doi.org/10.1038/s41893-019-0262-x, 2019. a
Muhammad, S., Müller, T., and Joergensen, R. G.: Relationships between Soil Biological and Other Soil Properties in Saline and Alkaline Arable Soils from the Pakistani Punjab, J. Arid Environ., 72, 448–457, https://doi.org/10.1016/j.jaridenv.2007.06.016, 2008. a, b, c, d
Naafs, B., Gallego-Sala, A., Inglis, G., and Pancost, R.: Refining the Global Branched Glycerol Dialkyl Glycerol Tetraether (brGDGT) Soil Temperature Calibration, Organic Geochemistry, 106, 48–56, https://doi.org/10/gbjssd, 2017a. a, b, c, d, e, f, g
Naafs, B. D. A., Inglis, G. N., Zheng, Y., Amesbury, M. J., Biester, H., Bindler, R., Blewett, J., Burrows, M. A., Del Castillo Torres, D., and Chambers, F. M.: Introducing Global Peat-Specific Temperature and pH Calibrations Based on brGDGT Bacterial Lipids, Geochim. Cosmochim. Ac., 208, 285–301, https://doi.org/10/f99n9b, 2017b. a, b, c, d, e
Naafs, B. D. A., Oliveira, A. S. F., and Mulholland, A. J.: Molecular Dynamics Simulations Support the Hypothesis That the brGDGT Paleothermometer Is Based on Homeoviscous Adaptation, Geochim. Cosmochim. Ac., 312, 44–56, https://doi.org/10.1016/j.gca.2021.07.034, 2021. a
Novak, J. B., Russell, J. M., Lindemuth, E. R., Prokopenko, A. A., Pérez, L., Zhao, B., Swann, G. E. A., and Polissar, P. J.: The Branched GDGT Isomer Ratio Refines Lacustrine Paleotemperature Estimates, Geochem. Geophys. Geosyst., 26, e2024GC012069, https://doi.org/10.1029/2024gc012069, 2025. a
Pérez-Angel, L. C., Sepúlveda, J., Molnar, P., Montes, C., Rajagopalan, B., Snell, K., Gonzalez-Arango, C., and Dildar, N.: Soil and Air Temperature Calibrations Using Branched GDGTs for the Tropical Andes of Colombia: Toward a Pan-Tropical Calibration, Geochem. Geophys. Geosyst., 21, e2020GC008941, https://doi.org/10.1029/2020GC008941, 2020. a, b, c
Peterse, F., van der Meer, J., Schouten, S., Weijers, J. W., Fierer, N., Jackson, R. B., Kim, J.-H., and Damsté, J. S. S.: Revised Calibration of the MBT–CBT Paleotemperature Proxy Based on Branched Tetraether Membrane Lipids in Surface Soils, Geochim. Cosmochim. Ac., 96, 215–229, https://doi.org/10/f4db3v, 2012. a, b, c, d, e
Plaza, C., Zaccone, C., Sawicka, K., Méndez, A. M., Tarquis, A., Gascó, G., Heuvelink, G. B., Schuur, E. A., and Maestre, F. T.: Soil Resources and Element Stocks in Drylands to Face Global Issues, Sci. Rep., 8, 13788, https://doi.org/10.1038/s41598-018-32229-0, 2018. a
Raberg, J. H., Harning, D. J., Crump, S. E., de Wet, G., Blumm, A., Kopf, S., Geirsdóttir, Á., Miller, G. H., and Sepúlveda, J.: Revised fractional abundances and warm-season temperatures substantially improve brGDGT calibrations in lake sediments, Biogeosciences, 18, 3579–3603, https://doi.org/10.5194/bg-18-3579-2021, 2021. a, b, c, d, e, f
Raberg, J. H., Flores, E., Crump, S. E., de Wet, G., Dildar, N., Miller, G. H., Geirsdóttir, Á., and Sepúlveda, J.: Intact Polar brGDGTs in Arctic Lake Catchments: Implications for Lipid Sources and Paleoclimate Applications, J. Geophys. Res.-Biogeo., 127, e2022JG006969, https://doi.org/10.1029/2022JG006969, 2022a. a, b, c, d, e, f
Raberg, J. H., Miller, G. H., Geirsdóttir, Á., and Sepúlveda, J.: Near-Universal Trends in brGDGT Lipid Distributions in Nature, Sci. Adv., 8, eabm7625, https://doi.org/10.1126/sciadv.abm7625, 2022b. a, b, c, d, e, f, g, h, i, j
R Core Team: R: A Language and Environment for Statistical Computing, R Foundation for Statistical, Computing, Vienna, Austria, 2025. a, b
Robles, M., Peyron, O., Brugiapaglia, E., Ménot, G., Dugerdil, L., Ollivier, V., Ansanay-Alex, S., Develle, A.-L., Tozalakyan, P., and Meliksetian, K.: Impact of Climate Changes on Vegetation and Human Societies during the Holocene in the South Caucasus (Vanevan, Armenia): A Multiproxy Approach Including Pollen, NPPs and brGDGTs, Quaternary Sci. Rev., 277, 107297, https://doi.org/10.1016/j.quascirev.2021.107297, 2022. a, b, c, d, e, f, g
Rusydi, A. F.: Correlation between Conductivity and Total Dissolved Solid in Various Type of Water: A Review, IOP Conference Series: Earth and Environmental Science, 118, 012019, https://doi.org/10.1088/1755-1315/118/1/012019, 2018. a, b, c, d
Salonen, J. S., Korpela, M., Williams, J. W., and Luoto, M.: Machine-Learning Based Reconstructions of Primary and Secondary Climate Variables from North American and European Fossil Pollen Data, Sci. Rep., 9, 1–13, https://doi.org/10/gg978t, 2019. a
Sinninghe Damsté, J. S., Ossebaar, J., Abbas, B., Schouten, S., and Verschuren, D.: Fluxes and Distribution of Tetraether Lipids in an Equatorial African Lake: Constraints on the Application of the TEX86 Palaeothermometer and BIT Index in Lacustrine Settings, Geochim. Cosmochim. Ac., 73, 4232–4249, https://doi.org/10.1016/j.gca.2009.04.022, 2009. a
So, R. T., Lowenstein, T. K., Jagniecki, E., Tierney, J. E., and Feakins, S. J.: Holocene Water Balance Variations in Great Salt Lake, Utah: Application of GDGT Indices and the ACE Salinity Proxy, Paleoceanography and Paleoclimatology, 38, e2022PA004558, https://doi.org/10.1029/2022PA004558, 2023. a, b, c, d, e, f, g, h
Sun, Q., Chu, G., Liu, M., Xie, M., Li, S., Ling, Y., Wang, X., Shi, L., Jia, G., and Lü, H.: Distributions and Temperature Dependence of Branched Glycerol Dialkyl Glycerol Tetraethers in Recent Lacustrine Sediments from China and Nepal, J. Geophys. Res.-Biogeo., 116, G01008, https://doi.org/10.1029/2010JG001365, 2011. a, b, c, d, e, f
Sun, W., Zhao, S., Pei, H., and Yang, H.: The Coupled Evolution of Mid- to Late Holocene Temperature and Moisture in the Southeast Qaidam Basin, Chem. Geol., 528, 119282, https://doi.org/10.1016/j.chemgeo.2019.119282, 2019. a, b
Thomas, E. K., Clemens, S. C., Sun, Y., Huang, Y., Prell, W., Chen, G., Liu, Z., and Loomis, S.: Midlatitude Land Surface Temperature Impacts the Timing and Structure of Glacial Maxima, Geophys. Res. Lett., 44, 984–992, https://doi.org/10.1002/2016gl071882, 2017. a, b
Tierney, J. E., Poulsen, C. J., Montañez, I. P., Bhattacharya, T., Feng, R., Ford, H. L., Hönisch, B., Inglis, G. N., Petersen, S. V., Sagoo, N., Tabor, C. R., Thirumalai, K., Zhu, J., Burls, N. J., Foster, G. L., Goddéris, Y., Huber, B. T., Ivany, L. C., Kirtland Turner, S., Lunt, D. J., McElwain, J. C., Mills, B. J. W., Otto-Bliesner, B. L., Ridgwell, A., and Zhang, Y. G.: Past Climates Inform Our Future, Science, 370, eaay3701, https://doi.org/10.1126/science.aay3701, 2020. a, b
Trabucco, A. and Zomer, R.:Global Aridity Index and Potential Evapotranspiration (ET0) Climate Database V2, Figshare, https://doi.org/10.6084/M9.FIGSHARE.7504448.V3, 2019. a, b, c, d, e, f
Unkelbach, J., Kashima, K., Punsalpaamuu, G., Shumilovskikh, L., and Behling, H.: Decadal High-Resolution Multi-Proxy Analysis to Reconstruct Natural and Human-Induced Environmental Changes over the Last 1350 Cal. Yr BP in the Altai Tavan Bogd National Park, Western Mongolia, The Holocene, 30, 1016–1028, https://doi.org/10.1177/0959683620908662, 2020. a
Véquaud, P., Thibault, A., Derenne, S., Anquetil, C., Collin, S., Contreras, S., Nottingham, A. T., Sabatier, P., Werne, J. P., and Huguet, A.: FROG: A Global Machine-Learning Temperature Calibration for Branched GDGTs in Soils and Peats, Geochim. Cosmochim. Ac., 318, 468–494, https://doi.org/10.1016/j.gca.2021.12.007, 2022. a, b, c, d
Wang, H. and Liu, W.: Soil Temperature and brGDGTs along an Elevation Gradient on the Northeastern Tibetan Plateau: A Test of Soil brGDGTs as a Proxy for Paleoelevation, Chem. Geol., 566, 120079, https://doi.org/10.1016/j.chemgeo.2021.120079, 2021. a, b
Wang, H., Liu, W., and Lu, H.: Appraisal of Branched Glycerol Dialkyl Glycerol Tetraether-Based Indices for North China, Organic Geochemistry, 98, 118–130, https://doi.org/10.1016/j.orggeochem.2016.05.013, 2016. a, b, c
Wang, H., An, Z., Lu, H., Zhao, Z., and Liu, W.: Calibrating Bacterial Tetraether Distributions towards in Situ Soil Temperature and Application to a Loess-Paleosol Sequence, Quaternary Sci. Rev., 231, 106172, https://doi.org/10.1016/j.quascirev.2020.106172, 2020. a
Wang, H., Liu, W., He, Y., Zhou, A., Zhao, H., Liu, H., Cao, Y., Hu, J., Meng, B., Jiang, J., Kolpakova, M., Krivonogov, S., and Liu, Z.: Salinity-Controlled Isomerization of Lacustrine brGDGTs Impacts the Associated MBT5ME' Terrestrial Temperature Index, Geochim. Cosmochim. Ac., 305, 33–48, https://doi.org/10.1016/j.gca.2021.05.004, 2021. a, b, c, d, e, f, g, h, i, j, k, l, m, n, o, p, q, r, s
Wang, H., Liu, Z., Zhao, H., Cao, Y., Hu, J., Lu, H., Zhao, Z., Cai, Z., Liu, X., and Liu, W.: New Calibration of Terrestrial brGDGT Paleothermometer Deconvolves Distinct Temperature Responses of Two Isomer Sets, Earth Planet. Sc. Lett., 626, 118497, https://doi.org/10.1016/j.epsl.2023.118497, 2024. a
Wang, M., Zheng, Z., Zong, Y., Man, M., and Tian, L.: Distributions of Soil Branched Glycerol Dialkyl Glycerol Tetraethers from Different Climate Regions of China, Sci. Rep., 9, 1–8, https://doi.org/10.1038/s41598-019-39147-9, 2019. a, b, c, d, e, f, g
Weijers, J. W., Schouten, S., van den Donker, J. C., Hopmans, E. C., and Damsté, J. S. S.: Environmental Controls on Bacterial Tetraether Membrane Lipid Distribution in Soils, Geochim. Cosmochim. Ac., 71, 703–713, https://doi.org/10/c5w8hf, 2007. a, b, c
Weijers, J. W., Steinmann, P., Hopmans, E. C., Schouten, S., and Damsté, J. S. S.: Bacterial Tetraether Membrane Lipids in Peat and Coal: Testing the MBT–CBT Temperature Proxy for Climate Reconstruction, Organic Geochemistry, 42, 477–486, https://doi.org/10.1016/j.orggeochem.2011.03.013, 2011. a
Wickham, H.: Ggplot2: Elegant Graphics for Data Analysis, Springer, ISBN 978-3-319-24277-4, 2016. a
Williams, W. D.: Salinisation: A Major Threat to Water Resources in the Arid and Semi-arid Regions of the World, Lakes & Reservoirs: Science, Policy and Management for Sustainable Use, 4, 85–91, https://doi.org/10.1046/j.1440-1770.1999.00089.x, 1999. a
Yang, H., Pancost, R. D., Dang, X., Zhou, X., Evershed, R. P., Xiao, G., Tang, C., Gao, L., Guo, Z., and Xie, S.: Correlations between Microbial Tetraether Lipids and Environmental Variables in Chinese Soils: Optimizing the Paleo-Reconstructions in Semi-Arid and Arid Regions, Geochim. Cosmochim. Ac., 126, 49–69, https://doi.org/10/f5n3gh, 2014. a, b, c, d, e, f, g, h, i
Yang, H., Lü, X., Ding, W., Lei, Y., Dang, X., and Xie, S.: The 6-Methyl Branched Tetraethers Significantly Affect the Performance of the Methylation Index (MBT′) in Soils from an Altitudinal Transect at Mount Shennongjia, Organic Geochemistry, 82, 42–53, https://doi.org/10.1016/j.orggeochem.2015.02.003, 2015. a
Zang, J., Lei, Y., and Yang, H.: Distribution of Glycerol Ethers in Turpan Soils: Implications for Use of GDGT-based Proxies in Hot and Dry Regions, Front. Earth Sci., 12, 862–876, https://doi.org/10/gfb6xq, 2018. a
Zhao, B., Castañeda, I. S., Bradley, R. S., Salacup, J. M., de Wet, G. A., Daniels, W. C., and Schneider, T.: Development of an in Situ Branched GDGT Calibration in Lake 578, Southern Greenland, Organic Geochemistry, 152, 104168, https://doi.org/10.1016/j.orggeochem.2020.104168, 2021. a, b, c