the Creative Commons Attribution 4.0 License.
the Creative Commons Attribution 4.0 License.
 | 31 Mar 2026
Estimating particulate organic matter flux from in-situ optics: A framework for correcting for suspended particles and incorporating depth-dependent degradation
Lili Hufnagel
Simon Ramondenc
Clara M. Flintrop
Rainer Kiko
Tim Fischer
Helena Hauss
Arne Körtzinger
Gerhard Fischer
Morten H. Iversen
Accurate quantification of the particulate organic matter (POM) flux from settling particles is crucial for understanding the efficiency of oceanic CO2 sequestration. Recent advancements in in-situ camera systems (ISCs) have enabled high-resolution estimates of the size distribution of particle concentration (PSDc) in the global ocean, both vertically and horizontally. When calibrated against corresponding sediment trap flux observations, these PSDc data serve as a basis for estimating downward POM flux. However, these estimates are subject to several uncertainties. A central unresolved issue lies in differentiating settling particles from suspended particles in ISC data. Additionally, the conventional method for converting PSDc to POM flux – which estimates a particle's contribution to the total flux based on a power-law relationship with its size – does not explicitly integrate particle sinking velocities and degradation rates, two key factors regulating POM export. Overcoming these limitations requires incorporating spatiotemporally aligned supplementary data and refined methodological approaches.
Here, to address these uncertainties, we introduce a process-based, three-step framework that improves flux estimates relative to the empirically optimized conventional method. First, to correct for the contribution of non-sinking particles (suspended particles and zooplankton), we calibrate ISC data against particle flux measurements from gel traps using a measured size–velocity relationship, thereby yielding a robust estimate of the sinking particle flux. Second, leveraging the output from the first step, we build upon the conventional power-law approach by developing a mechanistic particulate organic carbon (POC) flux model that incorporates size-specific sinking velocities and a depth-dependent degradation term modulated by water temperature and oxygen concentration. Third, with the POC flux estimates from the second step as input, we extend the framework to estimate particulate organic nitrogen (PON) flux using a simple dynamic model for particulate organic C : N stoichiometry. By linking the C : N ratio to particle age, the model reproduces the increase in C : N with depth – a key biogeochemical trend driven by preferential nitrogen remineralization over carbon that is not resolved by conventional, static-ratio modeling approaches.
- Article
(8228 KB) - Full-text XML
- BibTeX
- EndNote


The oceanic biological carbon pump (BCP) plays a pivotal role in Earth's climate system by transporting large quantities of photosynthetically fixed carbon from the sunlit surface ocean to the deep sea and, thereby, maintaining the vertical gradient in dissolved inorganic carbon, which increases with depth in the water column (Volk and Hoffert, 1985; Sarmiento and Gruber, 2006; Iversen, 2023 and references therein). This BCP is driven by the downward flux of particulate organic matter (POM) via settling marine particles, which delivers particulate organic carbon (POC) to depths where it can be sequestered on long-term (Stukel et al., 2018; Boyd et al., 2019; Buesseler et al., 2020). Model estimates for annual carbon export to the mesopelagic currently range between 4 and 12 Pg (DeVries and Weber, 2017; Henson et al., 2011). Therefore, more accurate quantification of POC flux is needed to reduce uncertainties in global carbon budgets, to improve projections of climate–ocean feedbacks, and to assess the efficacy of oceanic carbon storage in a rapidly changing ocean (Siegel et al., 2023).
Direct measurement of POC flux has traditionally relied on sediment traps (STs) – moored, drifting, or neutrally buoyant – which collect settling particles over defined deployment periods. While STs provide invaluable ground-truth data, they inherently sample a limited area and depth, and the subsequent sample processing is labor-intensive and time-consuming (Buesseler et al., 2007, 2008). These limitations constrain the spatiotemporal resolution of ST-based flux datasets. Consequently, capturing the full spectrum of POC flux variability – especially in highly dynamic oceanic features such as mesoscale eddies, which can significantly influence regional carbon export (McGillicuddy et al., 2007; Siegel et al., 2011) – remains challenging with STs alone, as the biogeochemical properties within these features can evolve rapidly over timescales of days to weeks.
To enhance observational capacity, in-situ camera systems (ISCs) have emerged as valuable tools (Picheral et al., 2010; Giering et al., 2020). These instruments capture high-resolution spatiotemporal observations of marine particles and zooplankton (Jackson et al., 1997; Kiko et al., 2017). After binning particle counts into discrete, logarithmically spaced size intervals to balance statistical variance across orders of magnitude, these observations yield the depth-resolved size distribution of particle concentration (PSDc) – defined as the number of particles per unit volume of water within each size bin. Once calibrated against corresponding ST-based flux measurements, these PSDc data can serve as a credible proxy for estimating high-resolution POC flux profiles throughout the water column. The most common approach for this calibration, hereafter referred to as the conventional method, models each particle's contribution to the total POC flux as a power-law function of its size (Guidi et al., 2008). The total flux at a given depth, zℓ, is then calculated by summing the contributions of all particles:
where ni is the ISC-derived particle concentration in size bin i at depth zℓ, di is the midpoint particle diameter for that size bin, and Aconv and Bconv are free parameters optimized empirically using corresponding ST-based flux measurements over a predefined particle size range. This approach is similarly applied to estimate other biogeochemical fluxes, such as particulate organic nitrogen (PON) flux.
The straightforward implementation of this conventional method has led to its widespread use (Guidi et al., 2008; Iversen et al., 2010; Ramondenc et al., 2016); however, it has inherent limitations that may introduce uncertainty into flux estimates. The first limitation arises from the nature of ISC observations: ISCs detect all particles within their field of view, including both sinking particles that contribute to vertical flux and non-sinking particles (i.e., suspended particles and zooplankton). Because non-sinking particles do not directly contribute to downward POM flux, their inclusion in flux calculations may introduce uncertainty, particularly where the concentration of suspended particles varies vertically due to changes in the pycnocline structure or where zooplankton exhibit a nonuniform distribution driven by spatial patchiness and migration.
The second limitation stems from the assumption that a particle's contribution to the flux depends solely on its size. However, as particles settle, their organic carbon content progressively decreases due to microbial degradation (Ploug et al., 1999; Simon et al., 2002). Since the physical structure of settling aggregates is often maintained by mineral components, this degradation of organic matter can occur without a significant change in the particle's apparent size as detected by an ISC.
A third limitation arises when extending this method to multiple elements. Its formulation – applying separate power-law relationships to POC and PON – implicitly yields a C : N ratio that is effectively static with depth. This static behavior directly contradicts the well-documented principle of preferential nitrogen remineralization (Grossart and Ploug, 2001; Hach et al., 2020; Iversen, 2023 and references therein), a process known to cause the C : N ratio of sinking organic matter to increase with depth (Romankevich, 1984; Schneider et al., 2003, 2004). Consequently, the conventional method can lead to a misrepresentation of C : N stoichiometry throughout the water column. These limitations become more pronounced in regional studies when ISC particle data are often calibrated using flux measurements confined to either the upper or lower water column (e.g., drifting ST or moored ST data, respectively), potentially leading to systematic over- or underestimation of POC and PON fluxes at unmeasured depths.
Overcoming these limitations poses a dual challenge: it requires both the integration of ISC data with a suite of supplementary measurements and the development of a refined methodological framework to synthesize these diverse data into mechanistically coherent models. Here, leveraging such a spatiotemporally aligned dataset, we develop and validate an enhanced framework aimed at mitigating the uncertainties associated with the conventional method. The datasets integrated in our study include: (i) profiles of ISC-derived PSDc; (ii) sediment trap measurements of POC and PON flux and gel trap data on the flux of sinking particles; (iii) direct, size-specific measurements of particle sinking velocities; and (iv) corresponding profiles of temperature and oxygen concentration from CTD casts. The framework is implemented through three sequential methods (Fig. 1) that systematically tackle each of the outlined limitations.
Method I yields reliable profiles of the size distribution of particle flux (PSDf) from ISC data. It achieves this by implementing a calibration against gel trap flux data and size-specific sinking velocities, which corrects for the contribution of non-sinking particles. Building upon the corrected particle flux, Method II enhances POC flux estimation by incorporating a mechanistic model of depth-dependent carbon degradation. This model moves beyond a purely size-based relationship by explicitly accounting for the degradation of a particle's organic carbon as a function of ambient oxygen, temperature, and travel time during its descent. Finally, with Method III, we extend this framework to address the issue of static C : N stoichiometry. To account for this, a new model for PON flux estimation is introduced that incorporates a time-dependent relationship between the PON and POC mass of sinking particles. When combined with the outputs from the preceding methods, this refinement effectively captures the preferential nitrogen remineralization over carbon (Grossart and Ploug, 2001; Hach et al., 2020) and, consequently, the increase in the C : N ratio of organic matter flux with increasing depth (Schneider et al., 2004).
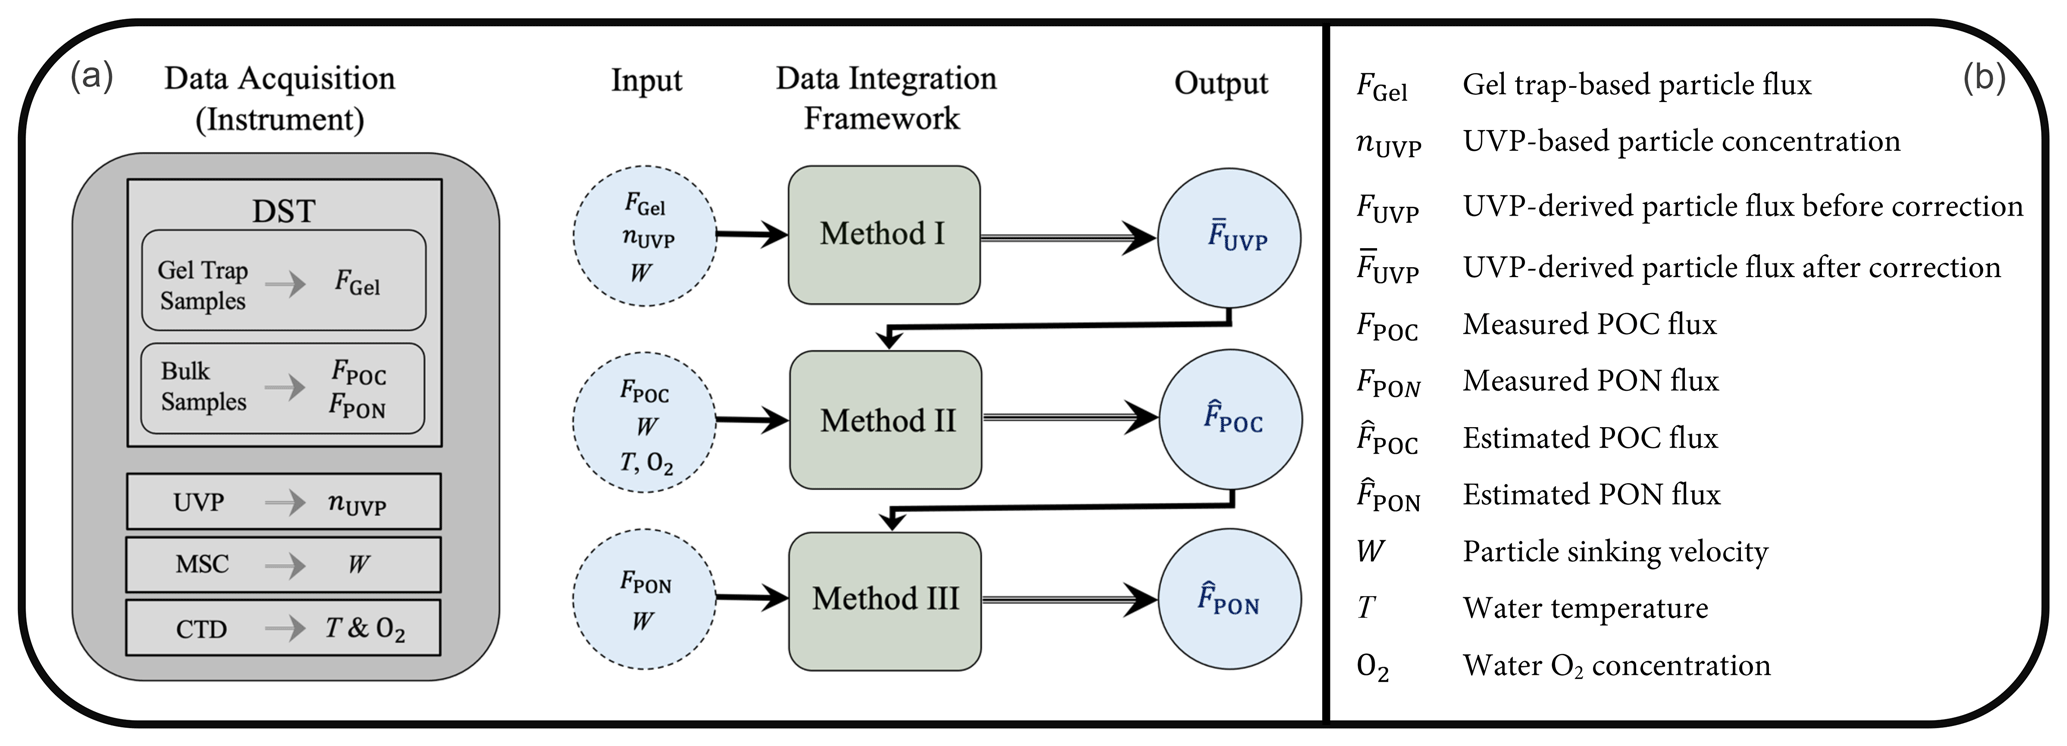
Figure 1Methodological framework and notations. (a) Schematic diagram illustrating the inputs, outputs, and interconnections within the proposed framework for integrating in-situ observations (see Sect. 2 for details). (b) Definitions of the primary notations used in the methodology. The abbreviations used are as follows: DST, Drifting Sediment Trap; UVP, Underwater Vision Profiler; MSC, Marine Snow Catcher; and CTD, Conductivity, Temperature, and Depth profiler system. Note that FGel, nUVP, W, FUVP, and are size-resolved parameters. While it is assumed that W does not change with water depth, all other parameters are depth-dependent.
2.1 In-situ observations
The data used in this study were from a high-resolution, multi-instrument survey of mesoscale eddies conducted aboard the RV Meteor cruise (M160) in November–December 2019 around the Cape Verde archipelago (Fig. A1). While the cruise had a broader biogeochemical focus, the work presented here is concerned primarily with methodological development, not with an analysis of the eddies themselves. Below, we provide a brief overview of the equipment deployed during the cruise and the shipboard measurements used to collect these data. A detailed description is provided in the Appendix. We leveraged a subset of the M160 dataset because its co-located and concurrent deployment of the Underwater Vision Profiler (UVP), Drifting Sediment Trap (DST) equipped with gel traps, and Marine Snow Catcher (MSC) provided a complementary dataset well-suited to developing our methodological framework.
DST. Six DST deployments were carried out – four southwest and two northeast of the Cape Verde Islands. The DSTs collected settling particles at depths of 100, 200, and 400 m. At each depth, one trap cylinder was equipped with a gel-filled collection cup to preserve particles for size-distribution analysis and flux calculations, while the remaining cylinders were used to measure biogeochemical fluxes, including POC and PON. Each gel sample was imaged using a high-resolution camera, and the size of the collected particles was accurately determined using Gel-PISA, an in-house software package developed for image analysis. Collected particles were subsequently sorted into logarithmically spaced size bins (as defined in Appendix A1), and particle counts per bin were determined. These counts, together with the deployment time and collection cup area, were used to derive the gel trap-based particle flux (FGel) for each size bin – yielding a representative PSDf for each cup. At each deployment station and depth, POC and PON fluxes were also quantified from samples collected in the remaining cylinders; these samples were processed and measured in the laboratory.
UVP. A UVP5 camera system was mounted on the CTD-Rosette and deployed at 71 stations, including parallel deployment at all stations where a DST was deployed and recovered, to image particles in the water column inside and outside the studied eddies. We applied the same logarithmically spaced size bins used for FGel. Particle images from each water-depth layer (see Appendix for layer definitions) were analyzed to determine the UVP-based particle concentration (nUVP) for each size bin, yielding a representative PSDc for that layer.
MSC. To measure size-specific sinking velocities of in-situ collected aggregates, eight MSC deployments were conducted. Aggregates were collected from 10 m below the chlorophyll maximum, and a total of 88 aggregates were analyzed onboard using a flow chamber to measure their size (d) and sinking velocity (W). These measurements were fitted to a power-law function:
to establish a representative size–velocity relationship for settling particles in the study area, with the free parameters Avel and Bvel determined from the data.
2.2 Data integration methods
2.2.1 Method I: Correcting UVP-derived particle flux for non-sinking particles
The UVP-derived particle flux for each size bin (FUVP,i) was calculated by multiplying the corresponding UVP-based particle concentration (nUVP,i), by the sinking velocity associated with that bin. This calculation is expressed as:
where i and di indicate the ith size bin and its midpoint, respectively, and W(di) is the sinking velocity for particles of size di, obtained from the size–velocity relationship. The resulting UVP-derived PSDf was further characterized by a pair of intercept and slope values (aUVP and bUVP), derived from the linear regression of log 10(FUVP) versus log 10(d) over the considered particle size range (Clements et al., 2023). The logarithmic transformation was applied to capture contributions across a wide range of particle sizes, from small to large.
It is important to note that the calculated FUVP values generally tend to overestimate actual particle fluxes, as the UVP camera detects both settling and non-sinking particles. Therefore, adjustments to the characteristic intercept-slope pairs were necessary to reliably use them as a proxy for downward particle flux estimates in the water column.
Correction factors α and β were introduced to adjust each original intercept-slope pair as α⋅aUVP and β⋅bUVP, respectively. We assumed that FGel provided reliable flux estimates of sinking particles, since suspended particles are unlikely to enter sediment traps and zooplankton swimmers are manually removed during image analysis. The FGel data were processed in the same manner to derive a set of intercept-slope pairs (aGel and bGel), which served as the reference for the optimization of the correction factors α and β. These correction factors were then optimized by minimizing the discrepancy between each paired gel trap and UVP-derived PSDf in log-space. For each gel trap-based PSDf, its spatiotemporally aligned UVP counterpart was identified. A trapezoidal area (S) was then calculated for each distribution, defined by its respective characteristic fitted line (see Fig. 2 for an illustration). The optimization was achieved by minimizing the sum of squared errors (ErrS) between the areas of the paired gel trap and UVP-based trapezoids across all k samples
where SGel,k is the reference area from the kth gel trap sample and SUVP,k is the area from its UVP counterpart. This procedure finds the optimal α and β that best align the corrected UVP-derived areas with the gel trap references. The areas of the resulting trapezoids were calculated as follows:
where , , and .
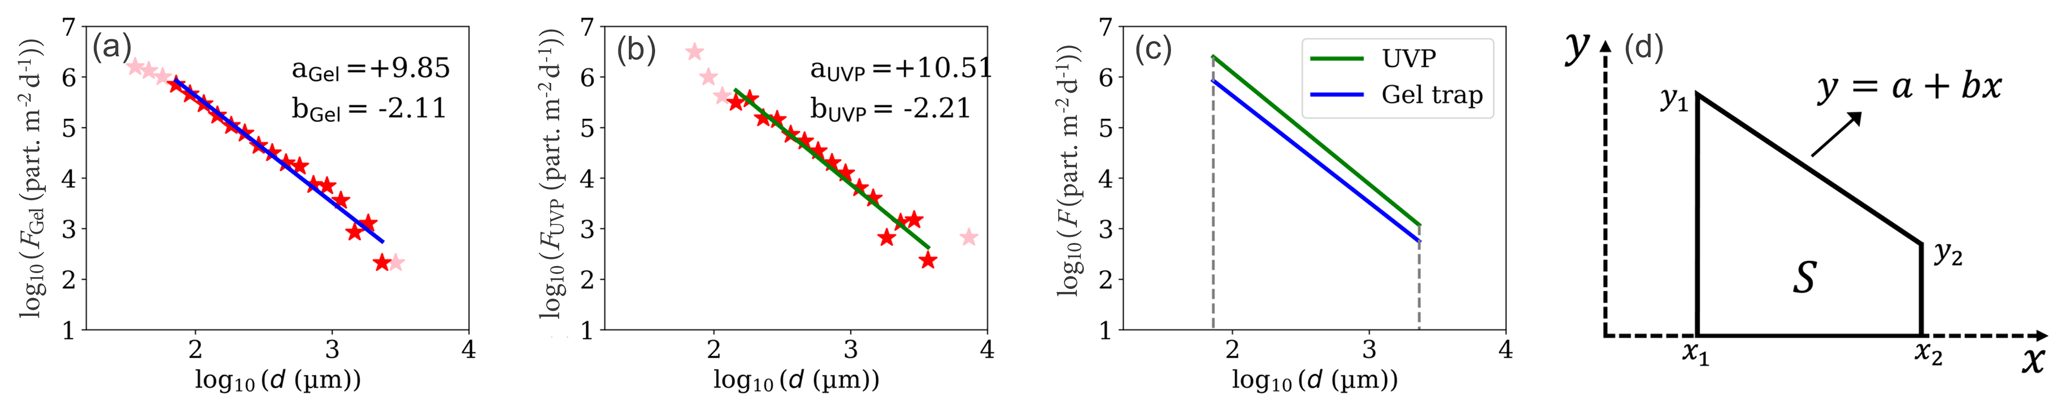
Figure 2Parameterization and comparison of gel trap-based and UVP-derived PSDf. (a) An example gel trap PSDf (red stars) with its log-log linear fit (blue line). (b) The corresponding spatiotemporally aligned UVP-derived PSDf calculated using Eq. (3) (orange stars), parameterized as in (a) (green line). (c) Comparison of the best-fit lines for the gel trap-based and UVP-derived PSDf data shown in panels (a) and (b). (d) Schematic of the trapezoidal area used for optimizing correction factors in Method I. Note: “part.” on the axis labels denotes particle counts.
Similarly,
where and .
The size range boundaries x1 and x2 were fixed to log10 (144) and log10 (2315) respectively, defining an overlapping size range where both the UVP5 and the gel trap provide reliable spectral slopes. These sizes correspond to the midpoints of the 128–161 and 2050–2580 µm size bins, respectively.
Prior to the logarithmic transformation, particle sizes (d) were normalized by 1 µm and particle fluxes (FGel and FUVP) by 1 particle m−2 d−1, making the resulting intercepts, slopes, and trapezoid areas unitless for the optimization procedure. Note that these correction factors were applied to the intercepts and slopes originally derived from log10(FUVP) data. Accordingly, the UVP-derived particle flux corrected for non-sinking particles () was calculated for each size bin i as:
with and .
If there are no particles in a size bin, is set to zero for that bin. The size bin midpoints considered in this study are shown in Fig. 3b. In Eq. (7) using particle size di in µm yields a final flux in units of particles m−2 d−1.
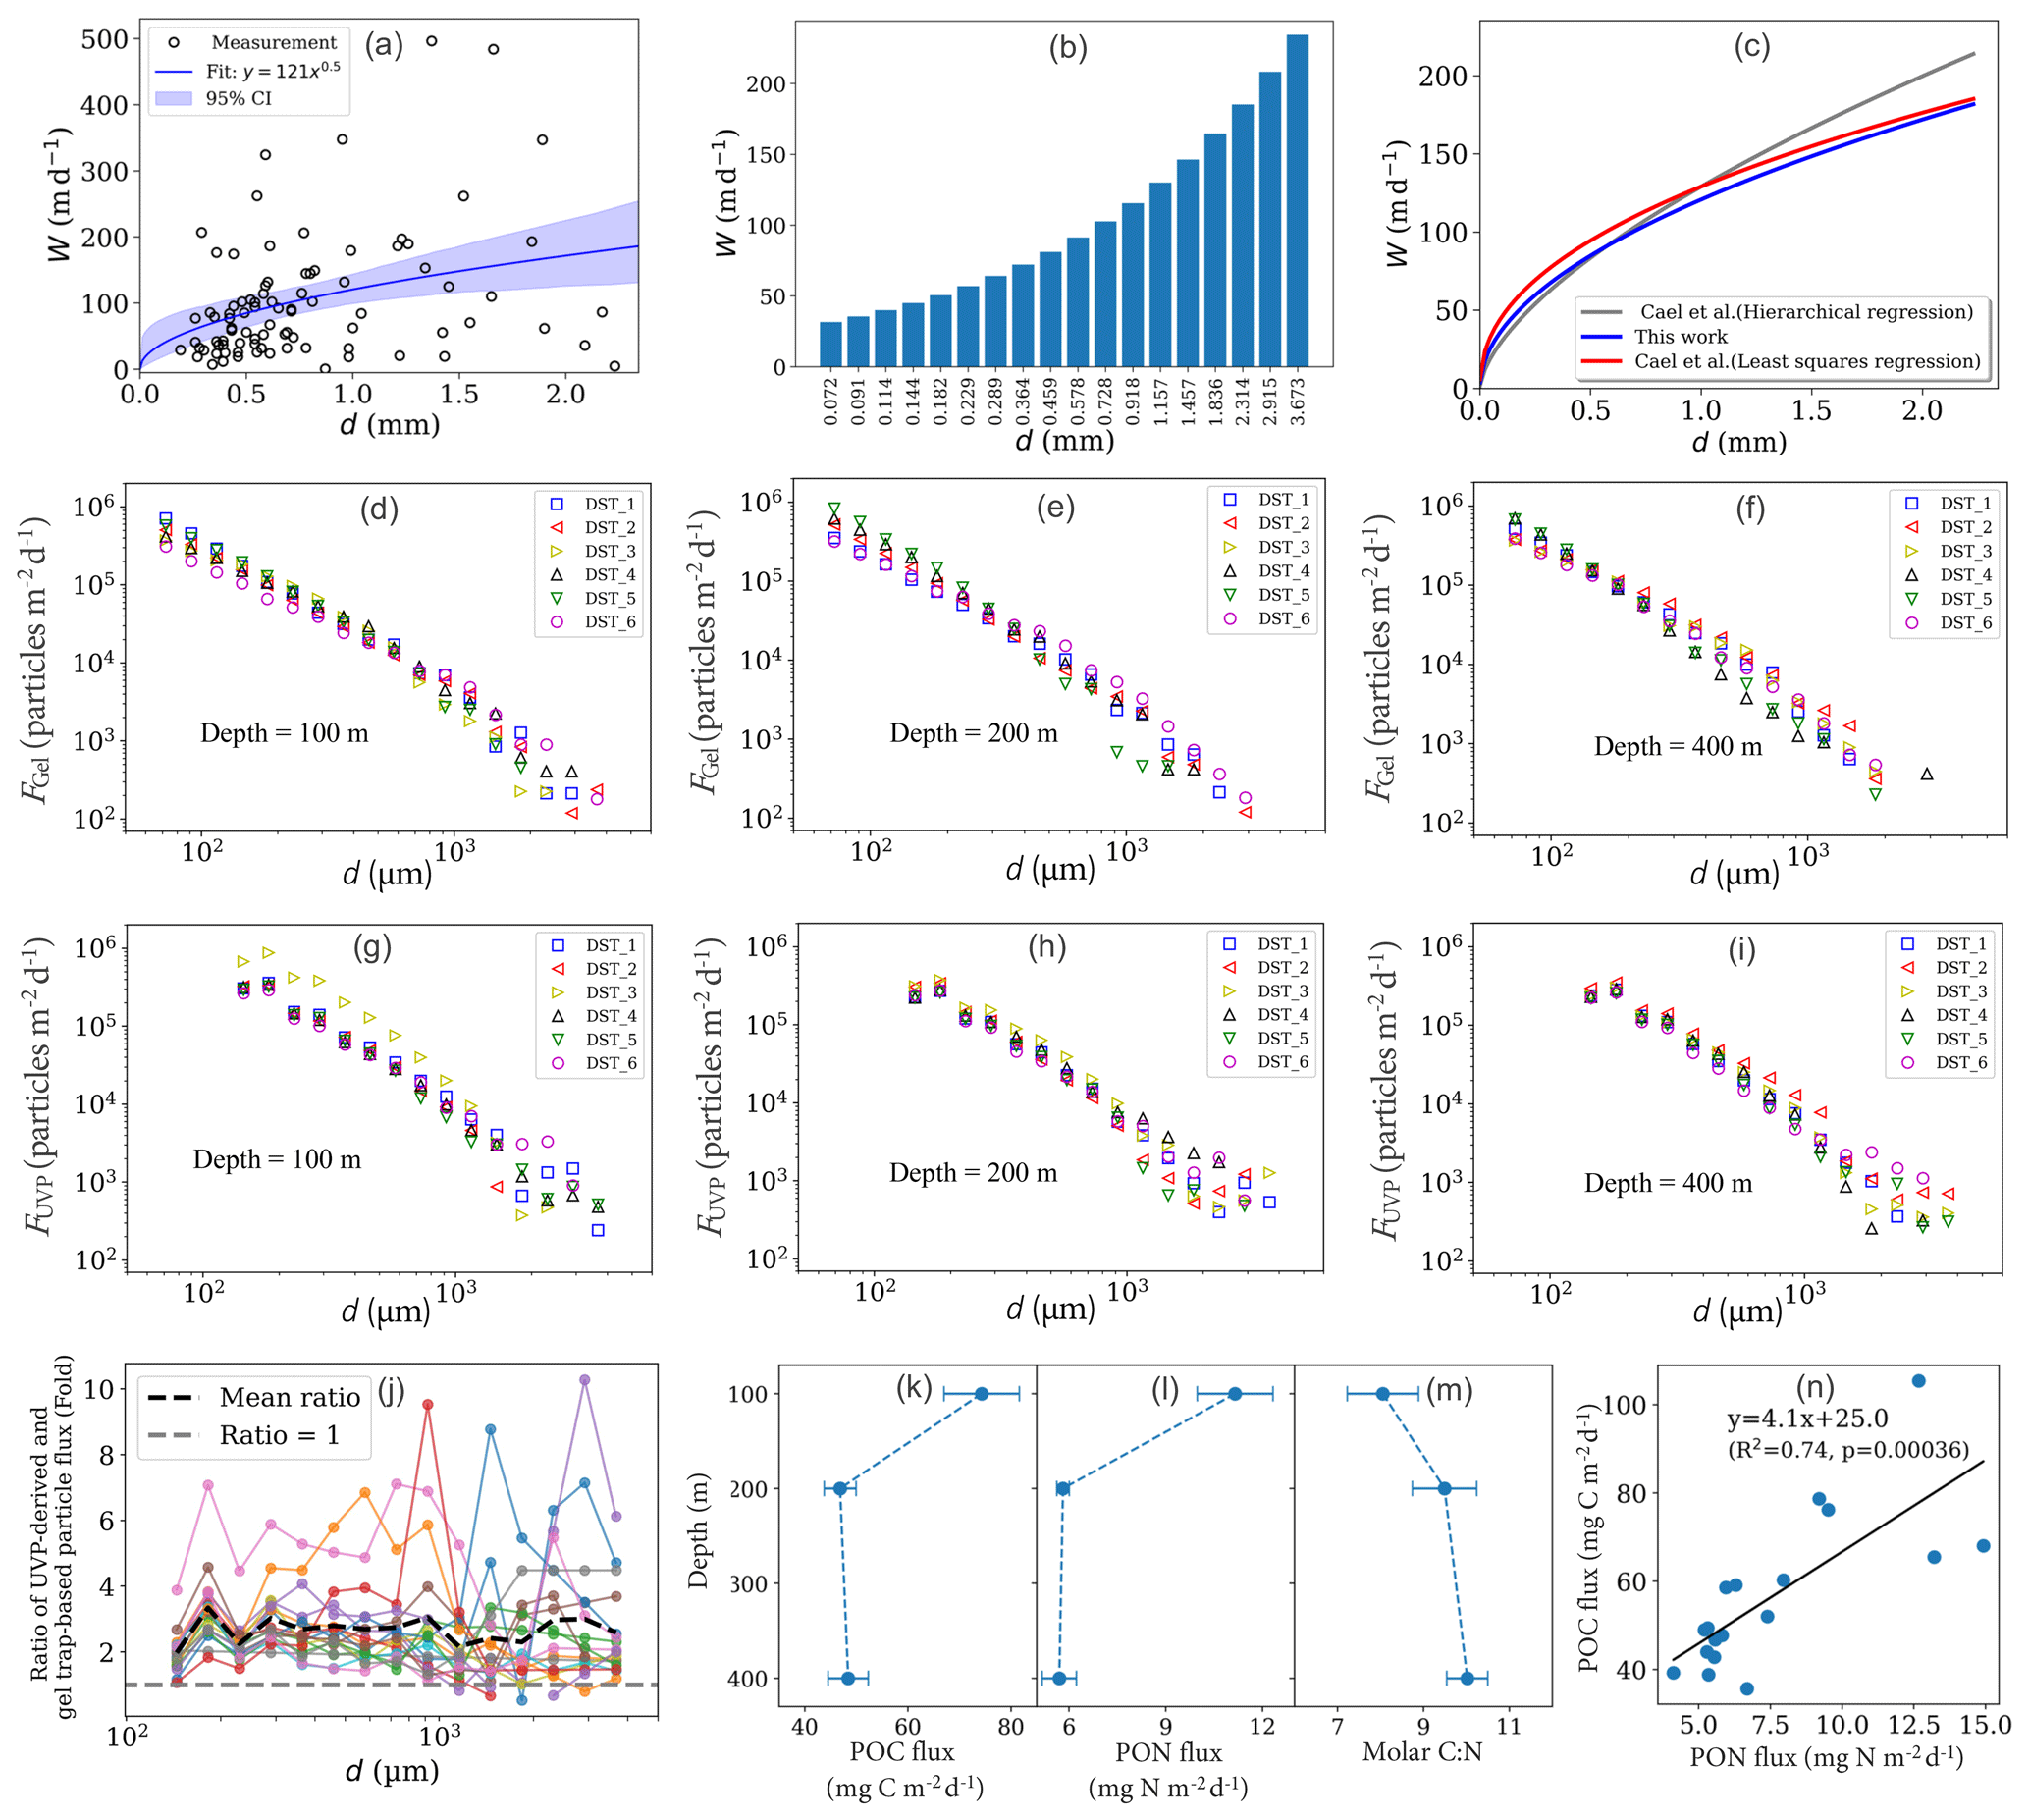
Figure 3In-situ observations. (a) Measured particle sinking velocity W versus particle size d (equivalent spherical diameter). The blue curve shows the best-fit power law , with Avel=121 (m d−1) and Bvel=0.5 (R2=0.11); the shaded area denotes the 95 % confidence interval (CI). (b) Sinking velocities for the defined size bins, derived from the fitted size–velocity relationship. (c) Comparison of size–velocity relationships for sinking marine particles from this study with those reported by Cael et al. (2021). (d–f) PSDf from individual gel traps across all six DST deployments at 100, 200, and 400 m, respectively. (g–i) Corresponding PSDf derived from UVP data for the same stations and depths, calculated using Eq. (3). (j) Ratios of uncorrected UVP-derived particle flux (which is biased high by non-sinking particles) to the corresponding gel trap particle flux across particle size bins. Each point represents the ratio for one UVP–gel trap pair within a given size bin. The dashed black line shows the mean ratio per bin, and the dashed grey line indicates the 1:1 line (ratio = 1). Mean DST-based fluxes (N=6): (k) POC flux, (l) PON flux, and (m) corresponding molar C : N calculated as (POC PON). (o) Individual POC fluxes versus their corresponding PON fluxes. The black regression line shows the correlation between measured POC and PON fluxes.
It is worth noting that this approach is a statistical optimization rather than a physics-based derivation. Here, the trapezoidal area serves as a robust geometric proxy for the alignment of the two characteristic regression lines. Geometrically, within the fixed overlapping size range (x1 and x2), we define a trapezoid bounded by fixed left and right vertical sides, a horizontal bottom side (along the x-axis), and a variable oblique upper side defined by the regression line. Thus, the area of the trapezoid is determined exclusively by the vertical position and slope of this regression line (Fig. 2d). Since the difference between the two characteristic lines in log-log space is not drastic (as illustrated by the example comparison in Fig. 2c), a slight simultaneous adjustment of the position and slope (via α and β) is sufficient to align the UVP regression line with the gel trap reference. Consequently, minimizing the difference in their associated trapezoidal areas serves as a robust metric to optimize this alignment, effectively accounting for the coupled nature of the slope and intercept. Moreover, log-transformation is the established convention for empirical abundance-based power-law distributions – particularly for marine particle data spanning several orders of magnitude in abundance and size (e.g., Jackson, 1997; Kiko et al., 2022a) – as it accounts for both highly abundant and rare observations while ensuring mathematical consistency in the distribution's shape, regardless of whether particle size is characterized by diameter or by volume.
2.2.2 Method II: Incorporating depth-dependent carbon degradation into POC flux estimates from UVP particle data
In this method, we develop a simplified mechanistic model that accounts for variations in the organic carbon content of settling particles as a function of both particle size and depth. The depth dependency stems from progressive carbon degradation during particle descent, which is modulated by the temperature and oxygen concentration of the ambient water at depth. To accurately estimate the organic carbon content of a settling particle at a given depth, the model incorporates the cumulative degradation it experiences during its descent. Each UVP-detected particle in size bin i is treated as a spherical particle with diameter di (units: mm) originating at the sea surface (i.e., at depth z=0) and sinking through the water column at a constant velocity W(di). The initial organic carbon content of the particle (MPOC,i(0), units: mg C) is assumed to follow a power-law function of particle size:
where APOC and BPOC are parameters to be optimized using flux measurements as described below.
To account for organic carbon degradation during particle descent, the water column is divided into a series of discrete vertical layers, each with thickness Δzj, where j denotes the layer index. The layer thickness increases with depth, consistent with the applied depth averaging of the UVP data: 5 m in the upper 100 m, 10 m from 100–200 m, 15 m from 200–400 m, and 25 m below 400 m. As a particle settles through each layer, it undergoes carbon loss due to microbial respiration. The carbon loss of the particle within a layer is determined by the effective carbon degradation rate in that layer, scaled by the time the particle spends transiting through it. This residence time is given by:
where W(di) is the sinking velocity of the particle calculated from the size-velocity relationship (Eq. 2).
To model POC loss in sinking particles, we employ a first-order degradation model. This model is based on the assumption that the rate of change of a substance is proportional to its current amount. Under this assumption, the POC mass of a particle as a function of time is described by:
where λ is the degradation rate constant (units: d−1). However, rather than using a constant rate throughout the water column, the effective carbon degradation rate in layer j, denoted as λeff,i(zj), is modulated by the mean temperature (T) and mean oxygen concentration (O2) (Iversen and Ploug, 2013; Ploug and Bergkvist, 2015) within that layer:
where the modulation term (θj) is modeled using a Q10 temperature response and Michaelis-Menten kinetics for oxygen limitation:
Here, Tref. is a reference temperature, set to the temperature of the mixed layer. The temperature coefficient (Q10) and the half-saturation oxygen constant (Km) are set to the optimized values of and µmol O2 kg−1 from DeVries and Weber (2017). By applying this model to our discretized vertical layer framework, the POC mass of a sinking particle at the base of layer l is calculated by multiplying its initial mass by a decay factor derived from the sum of layer-specific decay terms:
The total POC flux estimate at depth zℓ, , is then calculated by summing the carbon content of all particles passing through that depth:
where is the corrected UVP-derived particle flux for the ith size bin from Method I. The free parameters (APOC, BPOC, and λ) were optimized simultaneously by minimizing the sum of squared logarithmic errors between the available sediment trap measurements (FPOC,k) and their corresponding model estimates () (units: mg C m−2 d−1), subject to the constraint that λ>0:
2.2.3 Method III: A dynamic model for PON flux: accounting for preferential nitrogen degradation
To account for the preferential remineralization of nitrogen over carbon in sinking particles (Grossart and Ploug, 2001; Hach et al., 2020), an alternative modeling approach for estimating PON flux is presented. This approach begins by assuming a correlation between the particulate organic nitrogen mass (MPON,i) and the particulate organic carbon mass of a particle, an assumption supported by our in-situ flux observations (see Sect. 3.1.3). This relationship is initially expressed as:
where γi is a dimensionless correlation factor representing the C : N ratio for particles in the ith size bin. To incorporate the preferential degradation of nitrogen, we model γi as a function of particle age, defined as its travel time (in days), ti, from the sea surface. Since preferential nitrogen degradation causes the C : N ratio to increase with particle age, a power-law relationship can serve as a baseline model to capture this variation:
However, this straightforward formulation presents two conceptual inconsistencies in its asymptotic behavior. First, at short travel times, it yields biogeochemically implausible low C : N ratios, including a theoretically incorrect value of zero at the surface (ti=0). Second, at long travel times, its unbounded growth is inconsistent with the expectation that the C : N ratio should approach a constant, maximum value as the organic matter becomes refractory. While the first issue can be pragmatically managed by applying a minimum depth constraint, the second issue of unbounded growth is a more fundamental limitation that requires a different model formulation. To resolve this asymptotic behavior while maintaining a parsimonious two-parameter structure to avoid over-fitting, we propose a more robust model based on the Michaelis-Menten formulation:
where APON and BPON are model parameters to be optimized. In this formulation, the dimensionless parameter APON represents the asymptotic C : N mass ratio of refractory organic matter as ti→∞, corresponding to a maximum molar C : N ratio of . The parameter BPON is the half-saturation constant, representing the time required to reach half of this maximum ratio (in days). To avoid the implausibly low C : N values this model produces near the surface, a practical constraint is applied by setting a minimum depth, such as 50 m.
Using the particle's sinking velocity W(di) to determine its travel time to a given depth zℓ the nitrogen content of the particle at that depth (MPON,i(zℓ)) is then given by:
With this, the estimated PON flux at a given position and depth is calculated by summing the nitrogen content of all particles, weighted by their corrected UVP-derived particle flux:
where the index i refers to the ith size bin, and the summation is over all considered size bins. Similar to the POC flux estimation, the parameters APON and BPON were determined by minimizing the sum of squared errors between measured and estimated PON fluxes, subject to the constraint that BPON>0:
where FPON,k and (units: mg N m−2 d−1) are the kth sediment trap-based PON flux measurement and its corresponding model-estimated PON flux (Eq. 20), respectively, and the summation is over all available PON flux observations.
2.3 Uncertainty analysis
A comprehensive uncertainty analysis was performed using a sequential Monte Carlo procedure to quantify and propagate uncertainties through the entire modeling chain. This approach was essential to correctly account for the statistical dependencies between parameters estimated in successive model stages and to incorporate parametric, sampling, and measurement uncertainties. The procedure was repeated for M=1000 simulations to generate an ensemble representing the full joint probability distribution of all model parameters. This resulting ensemble allows for the robust calculation of the median and 95 % confidence intervals for any model parameter or derived quantity.
2.3.1 Step 1: Uncertainty in the particle flux estimates
A nested bootstrap procedure was implemented to determine the uncertainty in the corrected particle flux, . For each of the M=1000 iterations, the following two-part process was executed:
Velocity uncertainty. A plausible size-velocity relationship was generated via a parametric bootstrap, drawing a sample pair of Avel and Bvel from the bivariate normal distribution defined by the best-fit velocity parameters and their covariance matrix. This preserves the inherent correlation between Avel and Bvel.
Sampling uncertainty and dependent optimization. To account for sampling uncertainty and the dependent optimization, a reference particle flux dataset was created by resampling with replacement from the six DST deployments (R=6). Each deployment was treated as a single block to preserve the vertical structure of the observations at 100, 200, and 400 m. The correction factors α and β were then re-optimized using this bootstrapped dataset in conjunction with the specific velocity model (generated for this iteration).
This initial stage yielded an ensemble of M self-consistent parameter sets (Avel, Bvel, α, and β) and their corresponding corrected particle flux models, .
2.3.2 Step 2: Uncertainty in the POC flux estimates
The uncertainty from the particle flux model was propagated into the POC flux model. For each of the M=1000 iterations the following process was executed:
Input condition assembly. For each iteration, a self-consistent set of plausible input conditions was assembled. This set included: (i) the corrected particle flux model, , from the corresponding iteration of the previous step; (ii) two independent biogeochemical parameters – Q10 and Km – each drawn from its respective normal distribution defined by its mean and standard error; and (iii) a bootstrap sample of the reference POC flux measurements, created by resampling the six DST deployments (R=6) with replacement. To ensure a consistent propagation of sampling uncertainty across the modeling chain, the same random bootstrap indices used in Step 1 were re-applied to generate this sample.
Dependent optimization. The POC flux model parameters, APOC and BPOC, were then re-optimized for each of these M scenarios. The output of this stage was an expanded ensemble of M parameter sets, Avel, Bvel, α, β, APOC, BPOC, and λ now including the POC flux model parameters, fully conditioned on the results of the previous stage.
2.3.3 Step 3: Uncertainty in the PON flux estimates
The analysis was extended in a third sequential step to propagate all preceding uncertainties into the PON flux model. For each iteration the following process was executed:
Input condition assembly. All previously determined plausible models and parameters for that iteration were utilized, including the velocity model (Avel, Bvel, α, and β) and the POC flux model (APOC, BPOC, λ). A bootstrap sample of reference PON flux measurements was created by applying the same resampling indices from the prior stages to the six DST deployments (R=6).
Dependent optimization. The PON flux model parameters (APON and BPON) were then re-optimized based on this complete and self-consistent set of inputs.
This step finalized the generation of the full ensemble, resulting in M complete sets of all nine model parameters (Avel, Bvel, α, β, APOC, BPOC, λ, APON, and BPON) that capture the entire cascade of correlated uncertainties.
2.3.4 Step 4: Uncertainty in the estimated C : N ratio
The uncertainty in the final estimated ratio of POC to PON flux (C : N) was determined as a derived quantity from the full Monte Carlo simulation. For each of the M=1000 iterations, the total POC flux and the total PON flux were calculated using the complete parameter set for that iteration. The ratio of these two fluxes was then computed. This process yielded a final distribution of 1000 plausible ratio values, from which the median and 95 % CI were determined to represent the final estimate and its propagated uncertainty.
We determined the optimal model parameters by minimizing the defined error terms using the “fmin” function from Python's SciPy library. To robustly search for the global minimum and avoid local optima, this optimization was performed 300 times, each initiated with a random starting point within the specified parameter space. The parameter set yielding the lowest final error was selected as the best-fit solution.
Throughout this study, optimized parameters are reported as the median – a robust statistic for potentially skewed distributions – and the associated 95 % CI, derived from their optimized bootstrap distributions.
For all power-law relationships of the form used in this study, the particle diameter (d) is first expressed in millimeters (mm) and then normalized by a reference size of 1 mm, yielding a dimensionless size term (d [mm]/1 [mm]). This normalization results in units for the pre-factor (A) that are the same as the units of the dependent variable (Y), while the exponent (B) is always dimensionless.
3.1 Observational data
3.1.1 Settling velocity
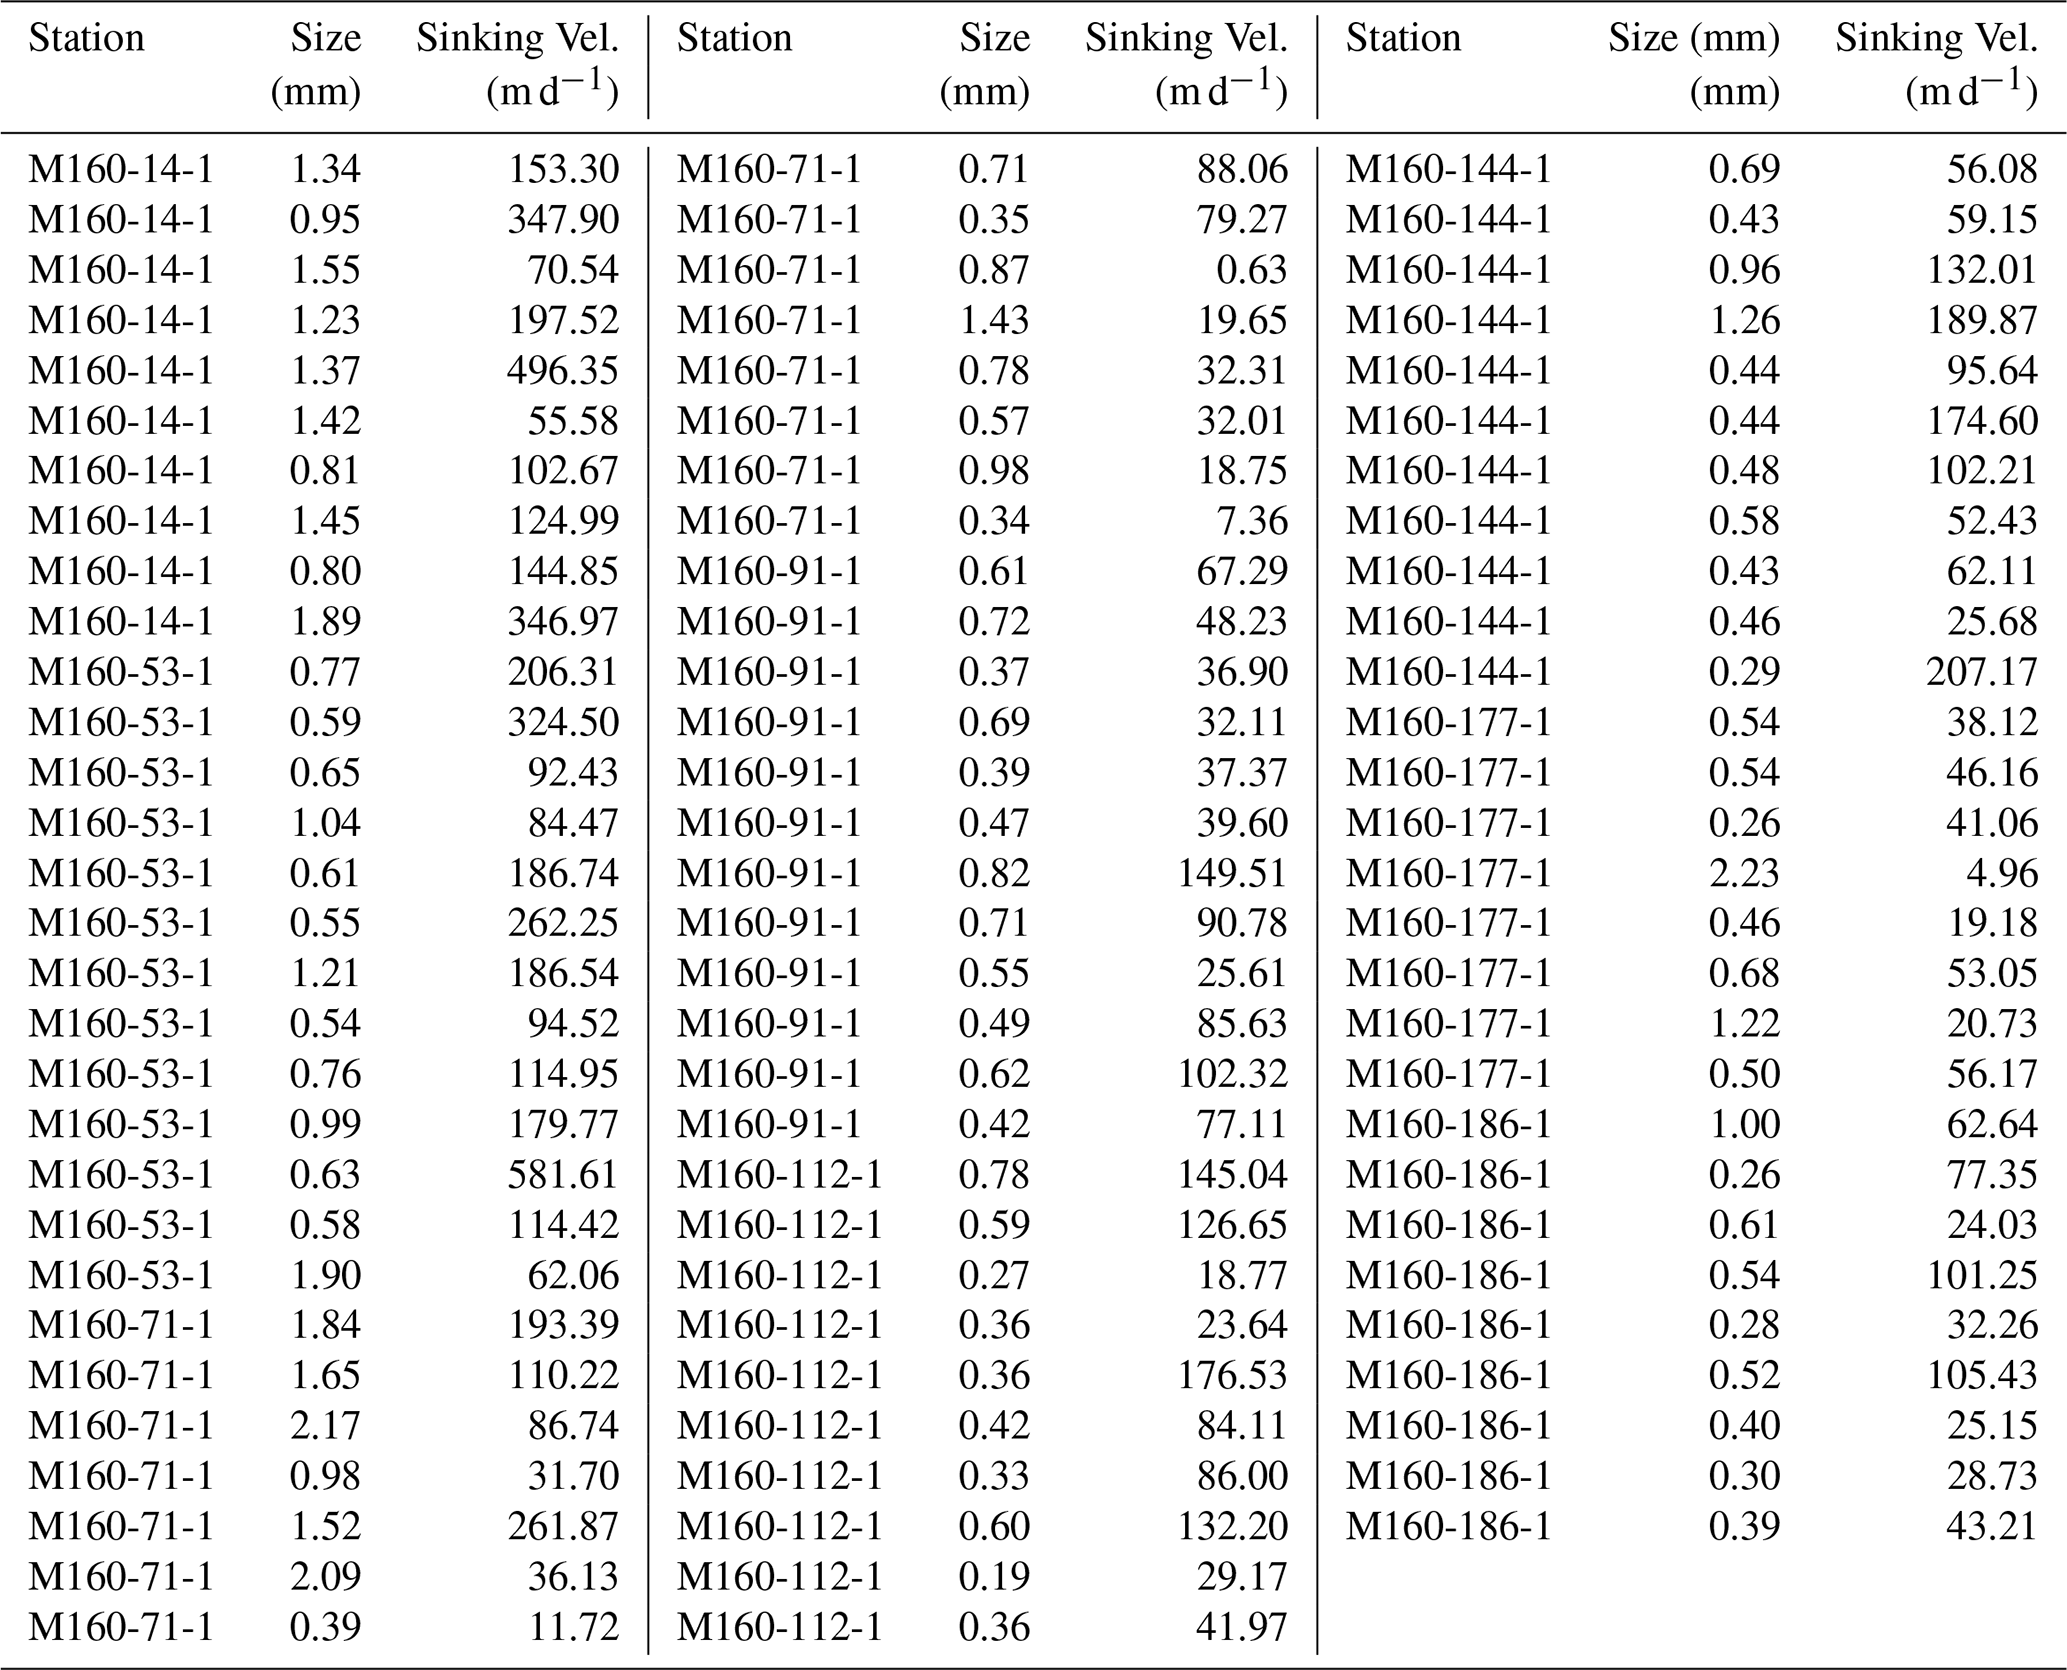
The size-specific sinking velocities of in-situ collected aggregates from the study area were parameterized as , with the best-fit parameters Avel=120.7 (CI: 99.6, 143.9) (m d−1) and Bvel=0.51 (CI: 0.20, 0.81) determined via least-squares regression (Fig. 3a). This implies that the average sinking velocity for particles sized 1 mm in the study area was approximately 121 m d−1. Applying this relationship to the midpoint diameter of each particle size bin used in this study yielded sinking velocities ranging from 33 to 232 m d−1 (Fig. 3b). This range represents the full particle size spectrum considered, from the UVP5 detection limit (64–80 µm) to the size bin encompassing the largest sinking particles observed in our gel traps (3.25–4.1 mm). Notably, the size-velocity relationship observed in the region aligns with results from a comprehensive size-velocity dataset (N=5655) compiled from 54 different studies (Fig. 3c), which presents an overall size-velocity relationship by increasing the degree of variability (Cael et al., 2021).
3.1.2 Gel trap-based and UVP-derived PSDf
The PSDf data obtained from all gel traps mounted on the DST are shown for all studied stations in Fig. 3d–f, with the corresponding spatiotemporally aligned UVP-derived PSDf, calculated using Eq. (3), shown in Fig. 3g–i. As a general trend, after log–log transformation, the PSDf data appeared approximately linear for the considered particle size ranges, which justifies applying a linear fit to characterize their shape.
The ratios of uncorrected UVP to gel trap particle flux pairs are shown in Fig. 3j. Overall, the uncorrected UVP-derived particle fluxes were systematically higher than those measured by the spatiotemporally aligned gel traps. This overestimation ratio averaged approximately 2.6 across all size bins. Considering the gel trap flux data as “ground truth” and the in-situ measured size-velocity relationship as representative of the area, this ratio suggests that approximately 30 % of particles detected by the UVP were part of the effectively gravitationally settling pool. This estimate is, however, specific to the study area and sampling period. It is worth noting that overestimations of particle flux from uncalibrated UVP data stem not only from the detection of suspended material in smaller size classes but also from zooplankton in the larger size classes.
The intercept and slope of the regression lines characterizing the obtained PSDf (Fig. 2a–b, see Appendix A1 for the procedure) were within the ranges and for the gel trap, and and for the UVP (Table A1). On average, the aUVP (mean value: 10.5 ± 0.15) were higher than aGel (mean value: 9.8 ± 0.14), and bUVP (mean value: −2.25 ± 0.05) were slightly steeper than bGel (mean value: −2.12 ± 0.06).
3.1.3 DST-based POC and PON fluxes and C : N ratios
The measured POC and PON fluxes ranged from 35.5 to 105.4 mg C m−2 d−1 and 5.1 to 14.9 mg N m−2 d−1, respectively, with corresponding molar C : N ratios ranging from 5.7 to 11.4 (Table A1). Across all stations, the highest POC and PON fluxes occurred at 100 m depth and were significantly higher than fluxes at 200 m (Wilcoxon paired rank-sum test, p = 0.0064), indicating pronounced attenuation between these depths (Fig. 3k). Below 200 m, flux attenuation was weak, and average POC fluxes at 200 and 400 m were not significantly different (Wilcoxon paired rank-sum test, p = 0.7488). A similar depth-dependent pattern was observed for PON fluxes (Fig. 3l). On average, molar C : N ratios increased with depth (Fig. 3m), and POC and PON fluxes were positively correlated across individual measurements (Fig. 3n).
3.2 UVP-derived particle flux estimates corrected using Method I
This consistent flux overestimation by the UVP (Fig. 3j) was also visually apparent when comparing the mean PSDf from both instruments at depths of 100, 200, and 400 m (Fig. 4a–c), even after accounting for uncertainties in the size-specific settling velocity relationship. These results confirm that UVP-based carbon flux estimates may be significantly biased if the PSDs are not corrected for the presence of non-sinking particles. It is of course important to note that the magnitude of such bias is dependent on the contribution of suspended particles versus settling particles, which is likely to be to both regionally and seasonally dependent.
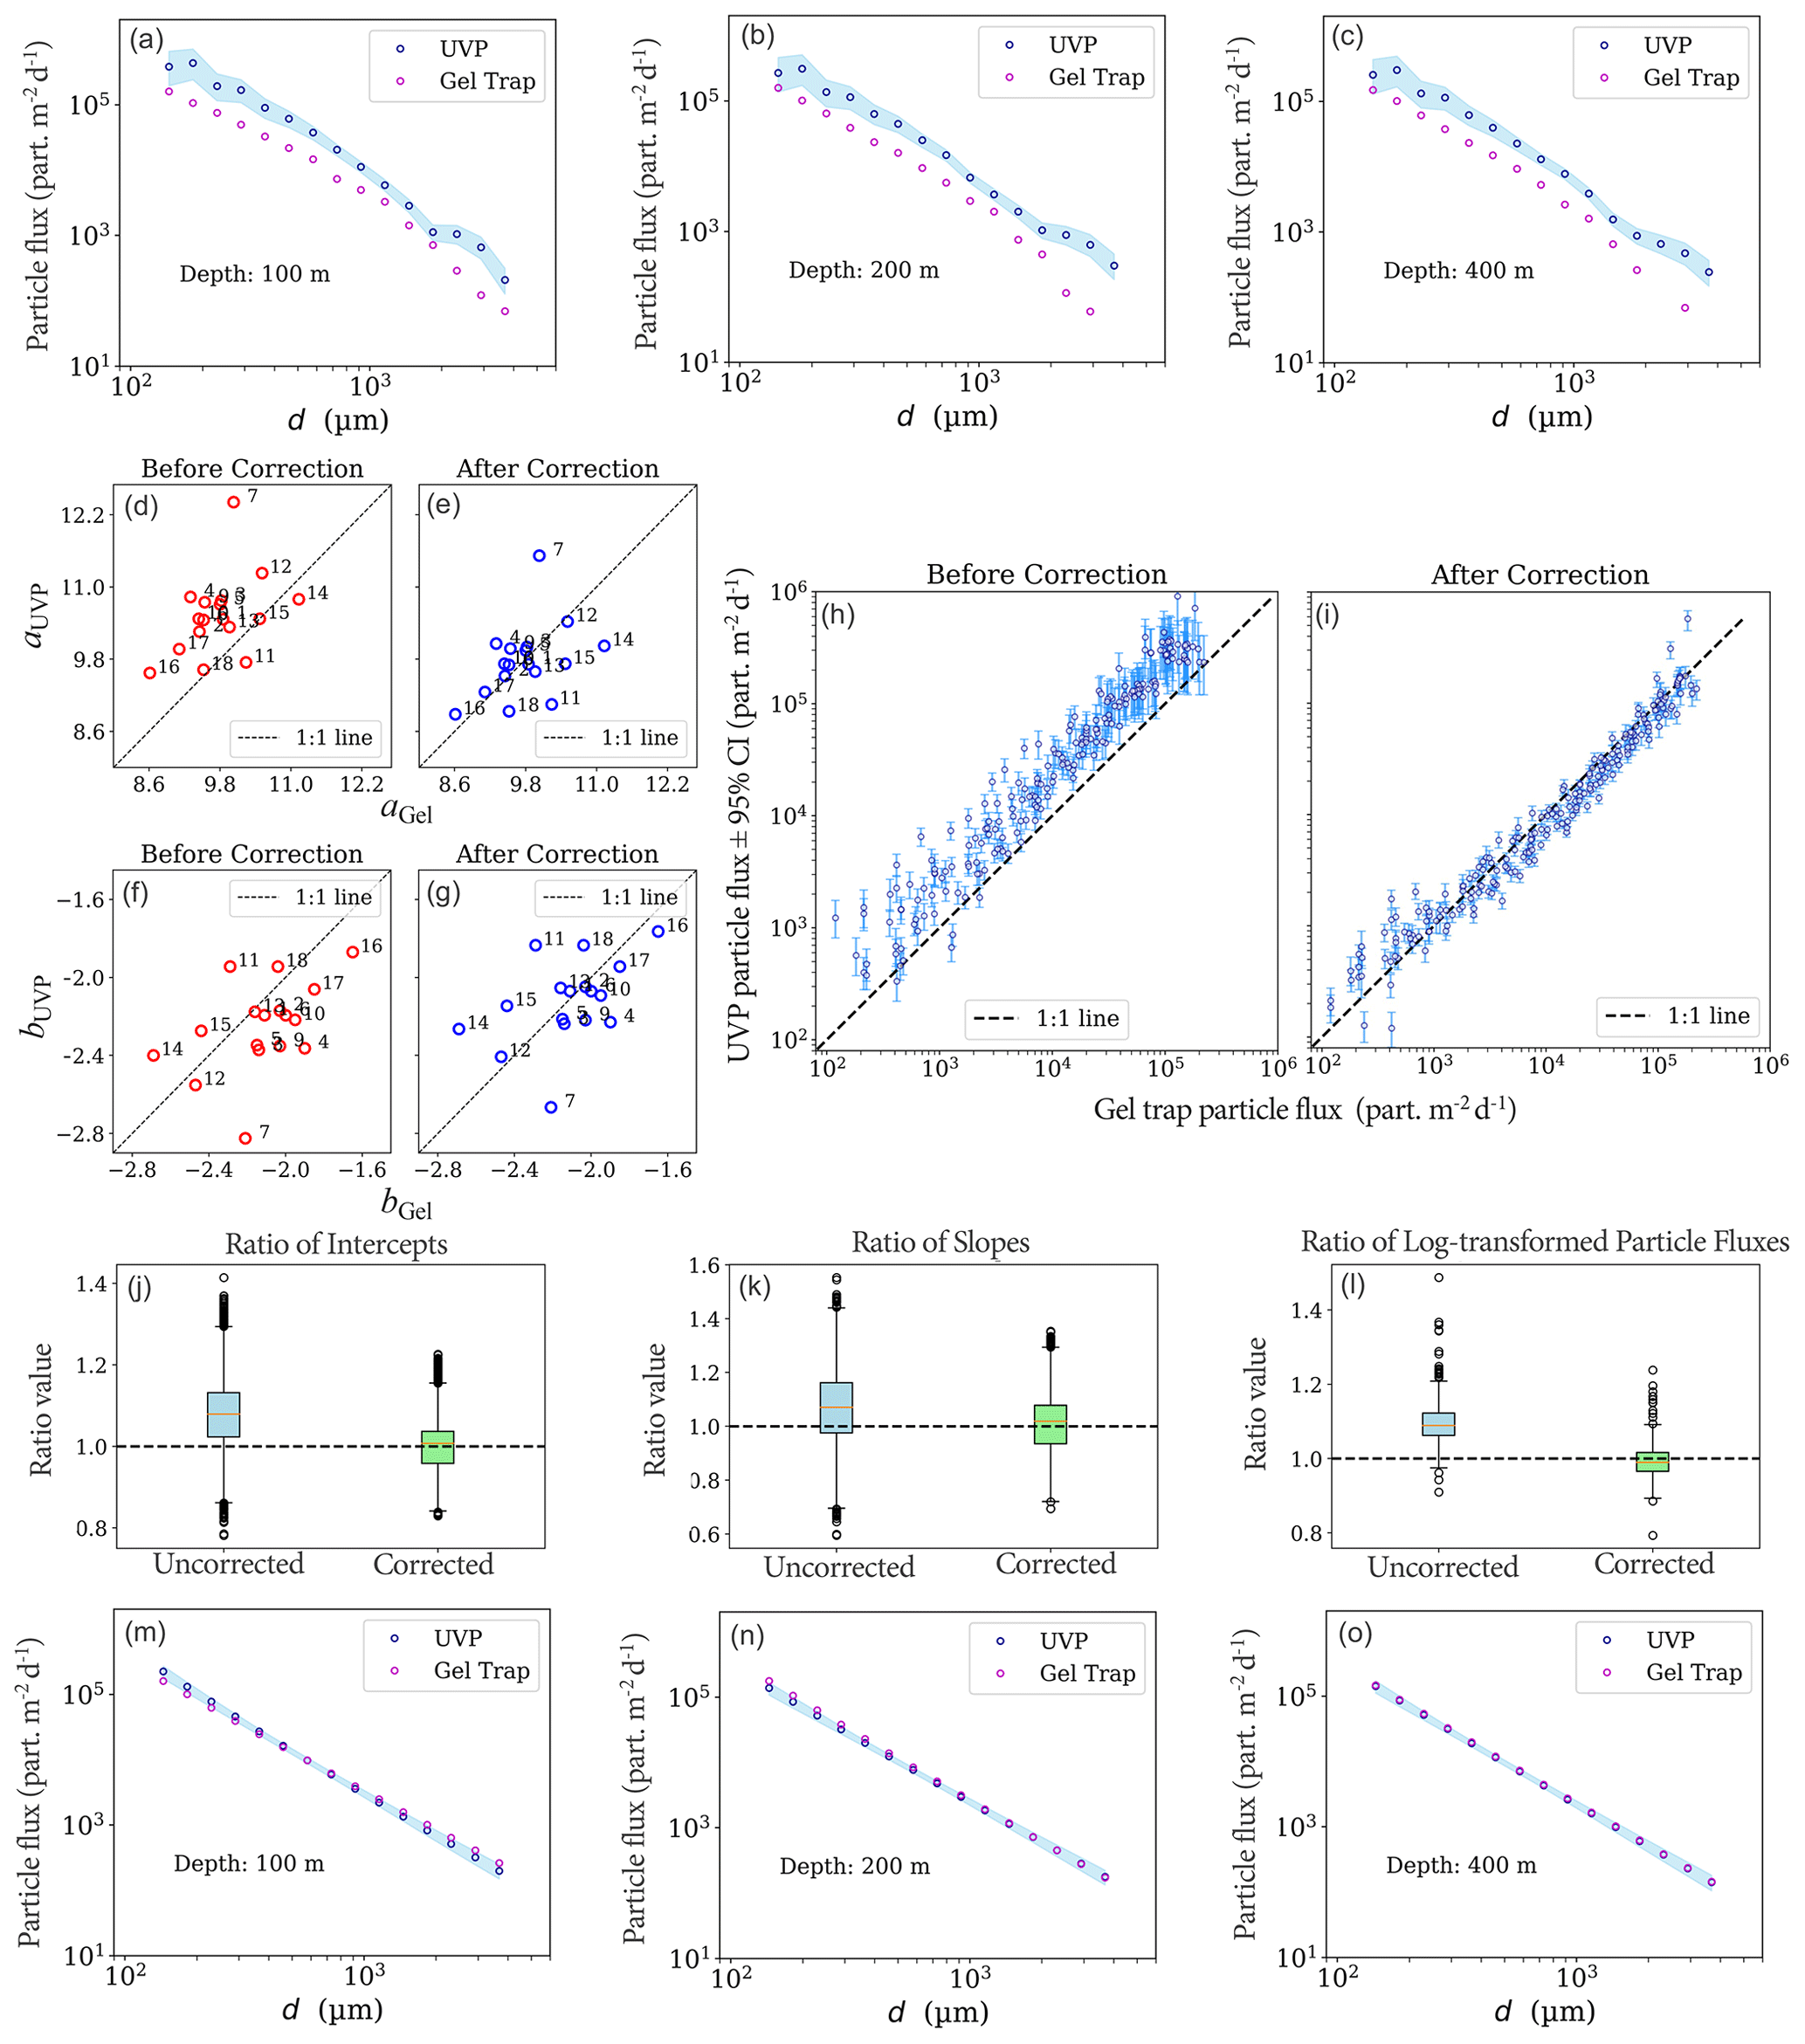
Figure 4Correcting UVP-derived particle fluxes for the influence of non-sinking particles using Method I, with gel trap flux data as a reference. (a–c) Mean PSDf from gel traps (pink circles) and corresponding uncorrected UVP flux estimates (blue circles) at (a) 100 m, (b) 200 m, and (c) 400 m. The shaded blue region denotes the 95 % confidence interval of the UVP-derived PSDf, propagated from uncertainties in the size–velocity relationship. (d–g) Ratios of log–log linear fit parameters from UVP-derived PSDf relative to the gel trap-based PSDf: intercepts (d) before and (e) after correction; slopes (f) before and (g) after correction. (h–i) Ratios of UVP- to gel trap-derived fluxes across size bins (h) before and (i) after correction. (j–l) Box-and-whisker plots showing the distribution of (j) intercept ratios and (k) slope ratios, and (l) the distribution of log-transformed flux ratios corresponding to the data shown in (h) and (i). (m–o) Corrected versions of the flux profiles shown in panels (a)–(c): Mean PSDf from gel traps calculated from their characteristic regression lines (pink circles) and corresponding corrected UVP flux estimates using Eq. (7) (blue circles) at (m) 100 m, (n) 200 m, and (o) 400 m. Uncertainty estimates for the corrections, including error bars in (h) and (i), box plots in (j)–(l), and the shaded 95 % confidence intervals in (m)–(o), were derived from the bootstrap analysis (Sect. 2.3).
To address this bias, Method I was applied to adjust the log-log linear fits of the UVP-derived PSDfs. By optimizing against the gel trap particle flux data, the correction factors for the intercept and slope were determined to be α=0.93 (CI: 0.85, 1.02) and β=0.94 (CI: 0.82, 1.10), respectively. The effectiveness of this correction is demonstrated in Fig. 4d–g, which shows the distribution of the slope and intercept ratios before and after the adjustment. The application of these factors using Eq. (7) yields corrected UVP-derived particle flux estimates that are in much closer agreement with the reference measurements (Fig. 4h–i). As summarized in Fig. 4j–l, the correction procedure successfully centers both the mean and median of the UVP-to-gel trap ratios for slope, intercept, and total flux near the ideal value of 1.0. Overall, Method I successfully corrects the UVP-derived size distributions of particle flux, ensuring they align effectively with the reference gel trap flux distributions (Fig. 4m–o).
3.3 Model Performance: POC, PON, and C : N Stoichiometry
3.3.1 Performance of the mechanistic framework (Methods II and III)
The first-order degradation model for estimating POC flux (Method II) was optimized against DST-based POC flux measurements. This procedure proved to be highly robust, converging for 99 % of the 1000 bootstrap resamples and allowing for the reliable estimation of parameter uncertainties (Fig. 5a–b). The optimization yielded a scaling exponent of BPOC=1.97 (CI: 1.33, 2.30), a scaling coefficient of (CI: , ) (mg C), and a first-order degradation rate constant of (CI: , ) (d−1). With an average relative error of 19.6 %, the optimized model provided a close fit to the measured POC fluxes across all studied stations and depths (Fig. 6a–f). This indicates that the model structure is well-suited to capture the observed vertical flux attenuation patterns. The estimated profiles exhibit a classic attenuation pattern consistent with the Martin curve, showing a sharp flux decrease in the epipelagic zone followed by a more gradual decline at greater depths (Martin et al., 1987).
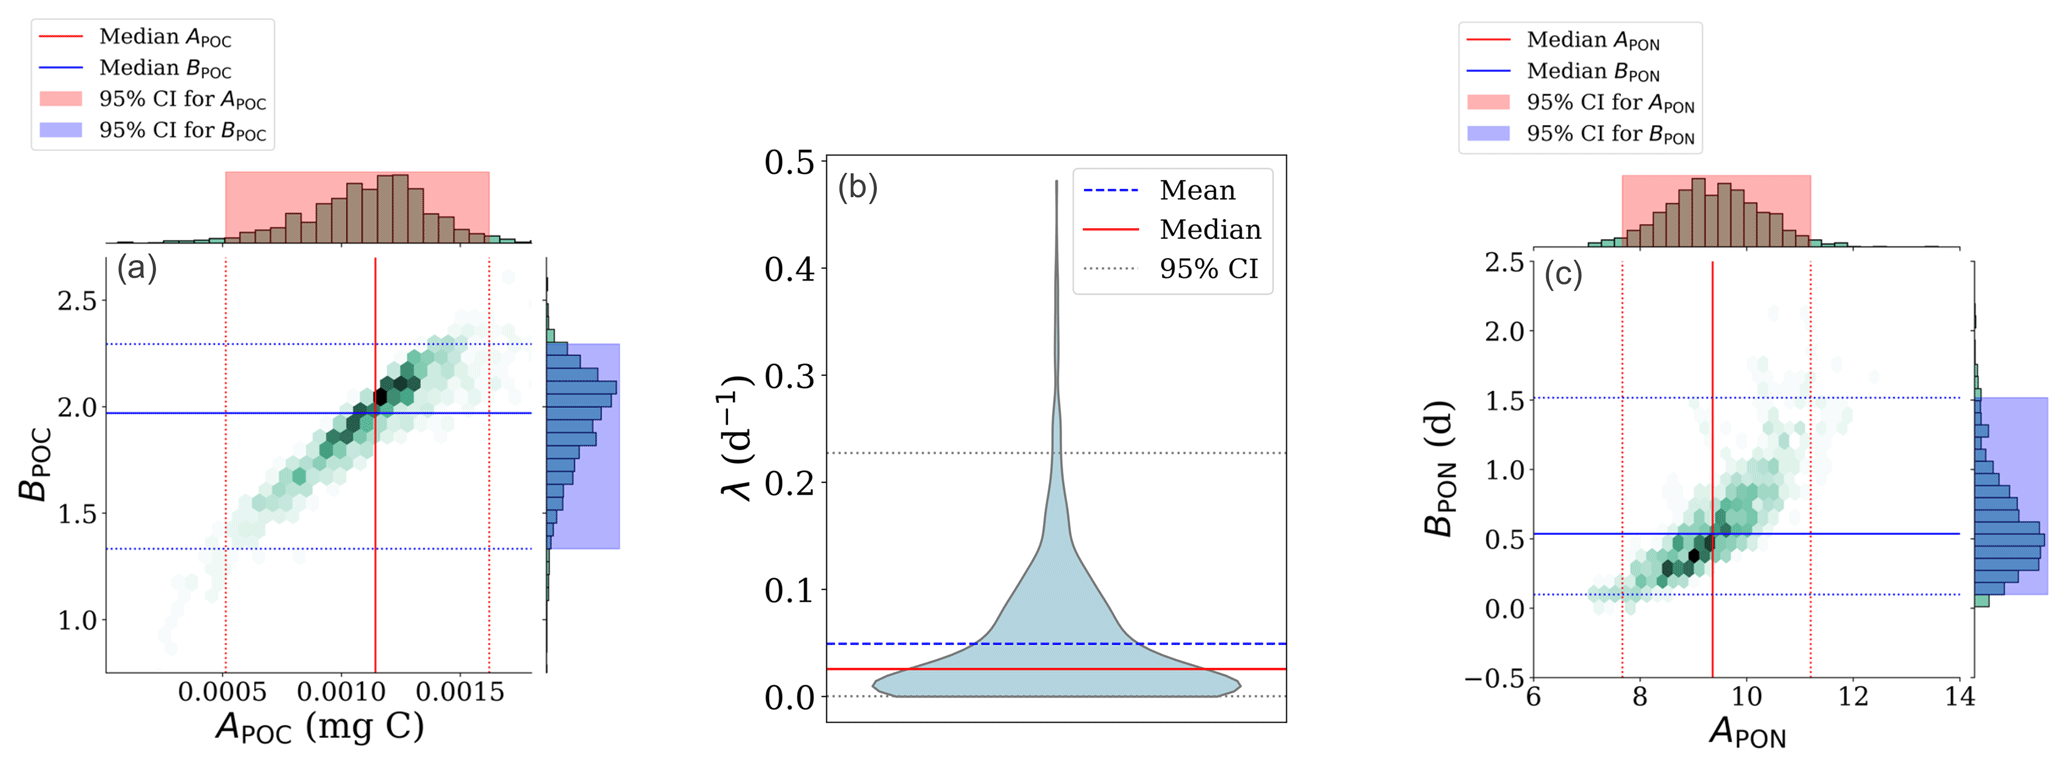
Figure 5Bootstrap analysis of optimized model parameters for the POC and PON models. Panels (a) and (b) together illustrate the parameter distributions for the proposed POC model (Method II). Panel (a) displays the joint distribution for parameters APOC and BPOC, while panel (b) shows the probability distribution for the third parameter, the first-order degradation rate constant (λ), which is constrained to the range of the parameter estimates to prevent the smoothing kernel from extending into non-physical negative regions. Panel (c) shows the joint distribution for parameters APON and BPON for the PON model with dynamic C : N stoichiometry (Method III).
Similarly, the dynamic PON flux model (Method III), which accounts for changes in C : N stoichiometry as a function of particle age, was optimized against DST-based PON flux measurements. This optimization yielded the parameters APON=9.4 (CI: 7.7, 11.2) and BPON=0.54 (CI: 0.10, 1.51) (days) (Fig. 5c). The procedure proved similarly robust, achieving the same rate of convergence as the POC model. The PON model effectively captured the vertical and spatial variability in the measured flux data (average relative error: 26.0 %) (Fig. 6g–l). As expected from its direct link to the carbon model, the resulting PON flux profiles exhibited a similar vertical attenuation pattern to their POC counterparts. The model's robustness is further supported by its emergent prediction of particulate C : N stoichiometry. Remarkably, despite not being directly optimized against C : N data, the model-derived C : N ratios matched DST measurements well (average relative error: 18.0 %). Furthermore, they robustly captured the gradual increase with depth (Schneider et al., 2004), reflecting the biogeochemical signature of preferential nitrogen remineralization (Fig. 6m–r).
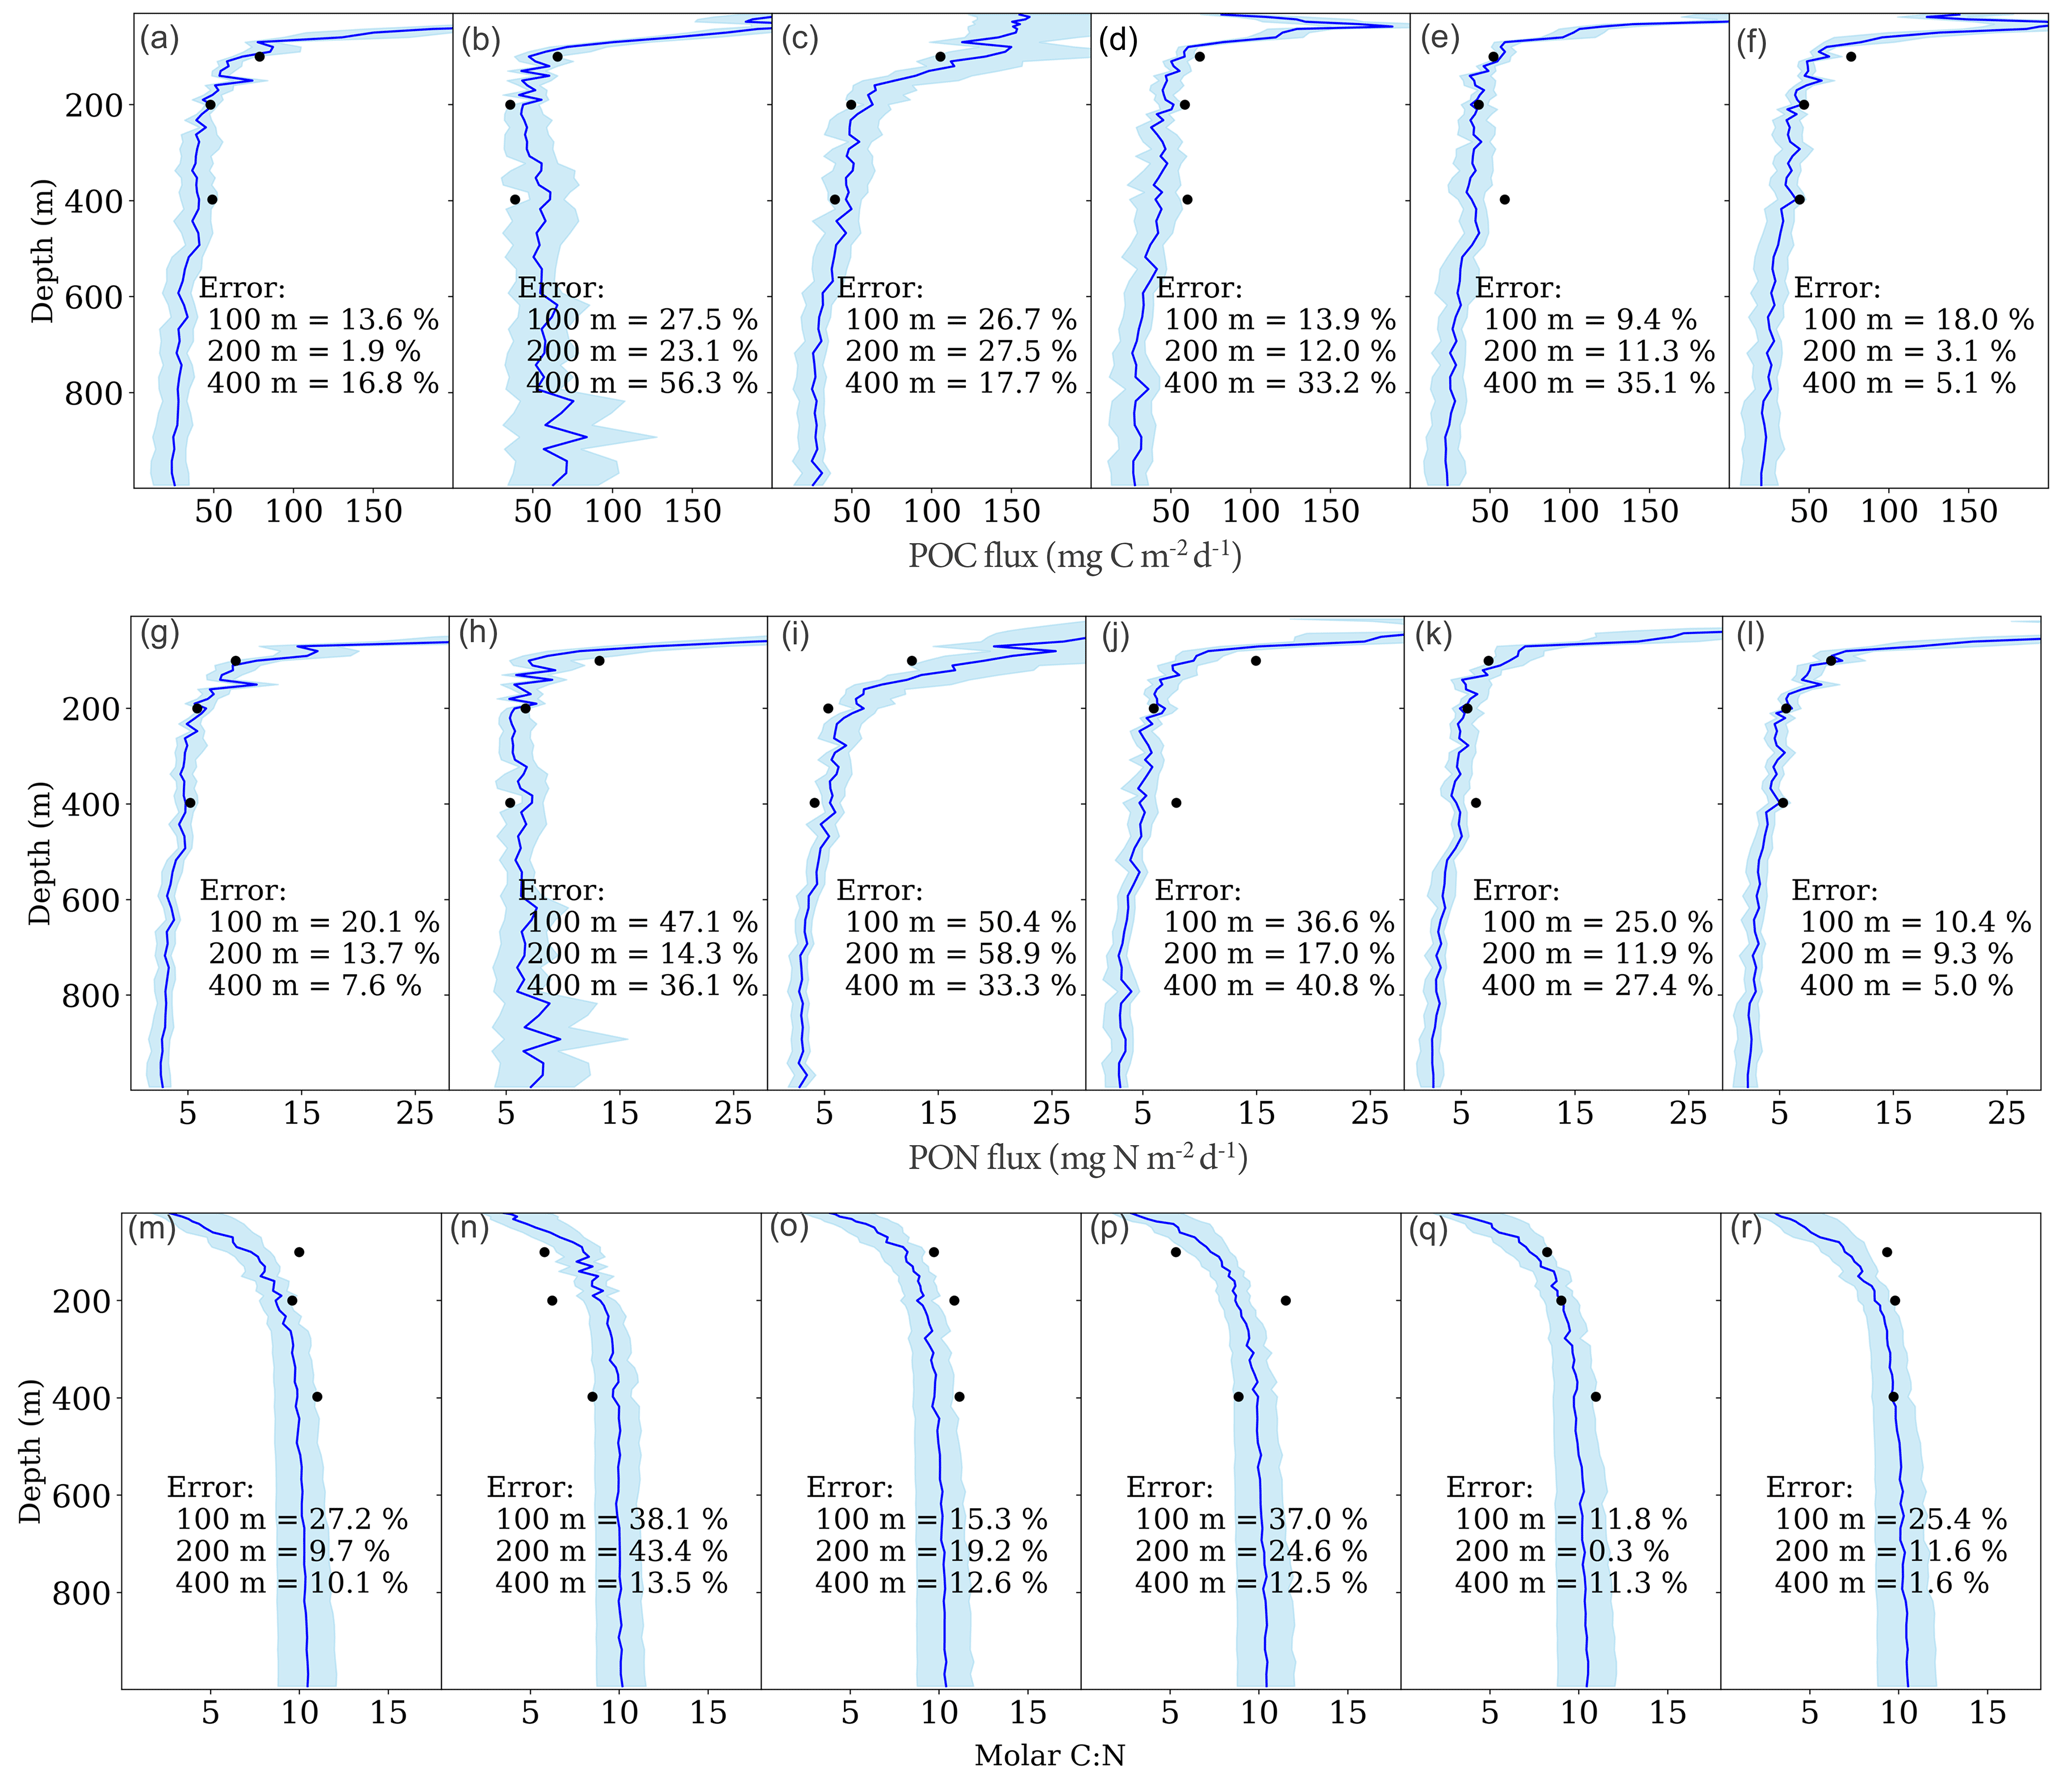
Figure 6POC and PON flux estimates, and resulting C : N ratios, from the mechanistic framework compared with DST measurements. Vertical profiles show model estimates for POC flux (a–f), PON flux (g–l), and the resulting molar C : N ratio (m–r) at the six DST stations. POC fluxes were estimated using the first-order degradation model (Method II), while PON fluxes were estimated using the dynamic C : N stoichiometry model (Method III). Solid blue lines represent the median of the model estimates from the optimized bootstrap distribution, with blue shading indicating the 95 % confidence interval. Black circles represent the discrete measurements from the DSTs. The percentage values displayed in the panels indicate the relative deviation of the model estimates (blue lines) from the DST measurements. All model estimates are based on the average of two UVP profiles acquired during the deployment and recovery of each DST.
3.3.2 Comparison with the conventional method
The conventional method was applied to our dataset to provide a performance baseline. This approach proved to be numerically unstable during optimization. Convergence was achieved for ca. 82 % of the bootstrap ensemble for POC and 48 % for PON flux. After removing the large proportion of non-converged runs, the optimization yielded the parameters (CI: , ) (mg C m d−1) and Bconv (POC)=1.48 (CI: , 2.1) for POC flux. For PON flux, the results were (CI: , ) (mg N m d−1) and (CI: , 1.3). The estimated fluxes using the conventional method are shown in Fig. A3.
The apparently lower flux uncertainties of the conventional method (Fig. A3), when compared to our mechanistic approach (Fig. 6), must be interpreted with caution for two reasons. First, the conventional method exhibited low bootstrap convergence. Consequently, its reported uncertainty does not reflect the full range of sampling variability, and is therefore artificially narrow. Second, and more importantly, the lower scaling exponent in the conventional model, inherently suppresses the contribution of larger particles to the total flux (Fig. 7a–c). Since these large particles are the most variable in abundance, this suppression also dampens their propagated uncertainty, leading to a significant underestimation of the true total flux uncertainty.
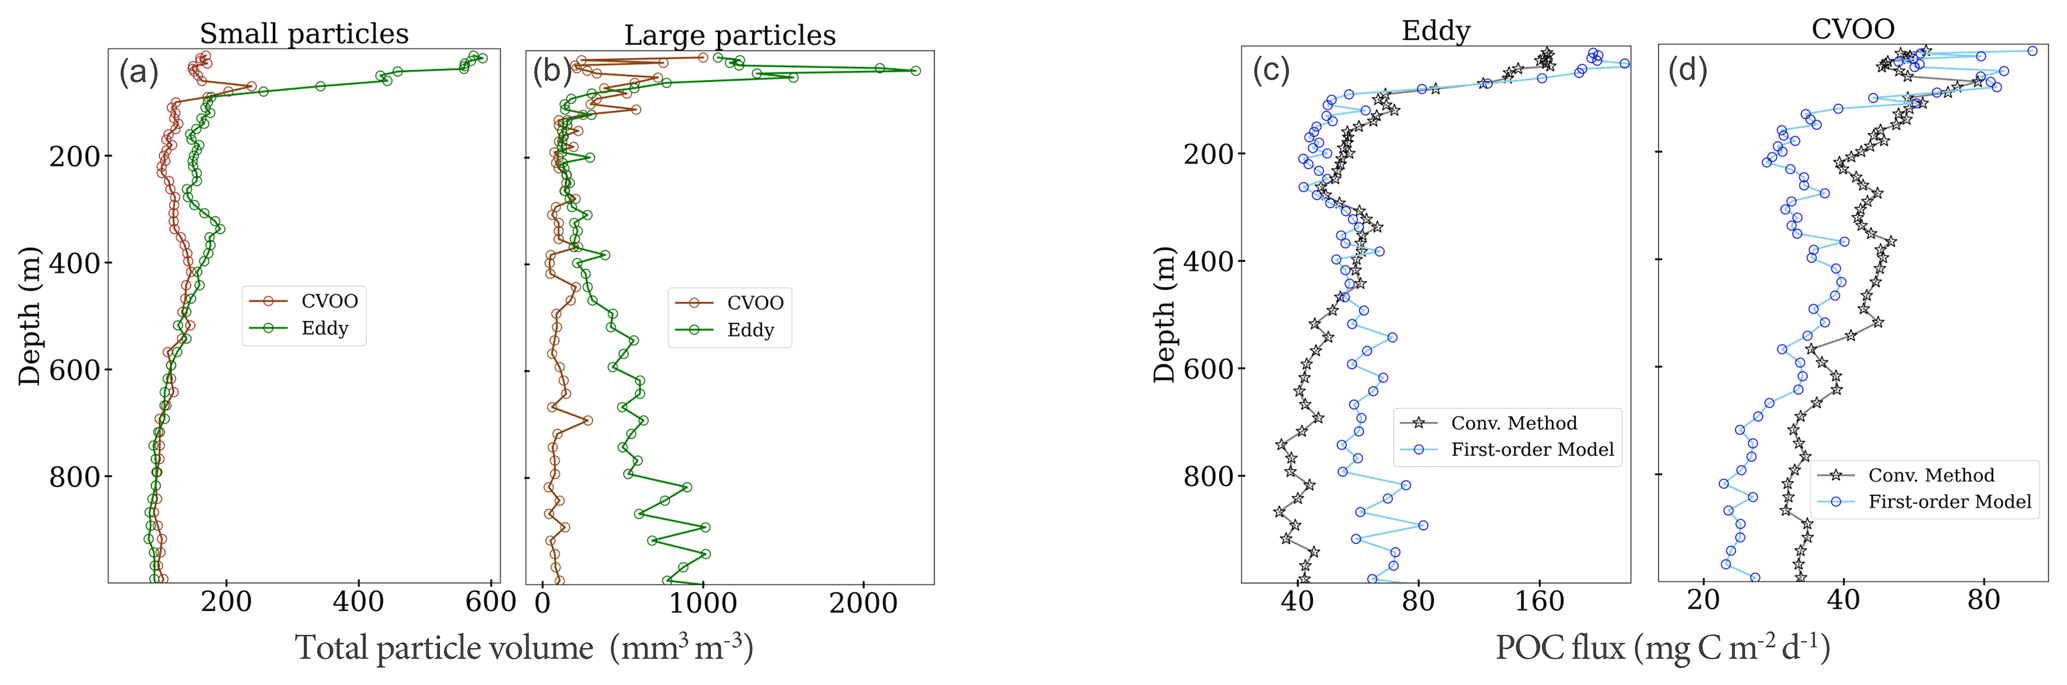
Figure 7Comparison of POC flux estimates from the mechanistic first-order degradation model and the conventional method at two contrasting stations. Vertical profiles of total particle volume, calculated over the size range considered in this study, are shown for (a) small (< 0.5 mm) and (b) large (> 0.5 mm) size classes. The data compare the core of a cyclonic eddy (M160 expedition, zone A2 in Fig. A1), characterized by a high abundance of large particles, with the Cape Verde Ocean Observatory (CVOO) station (see Fig. A1), which exhibits a lower relative abundance of large particles. Panels (c) and (d) show the corresponding POC flux estimates derived from the mechanistic model and the conventional method at the eddy core and the CVOO station, respectively.
Despite achieving reasonably low average relative errors (18.0 % for POC, 18.6 % for PON, 16.2 % for C : N), the conventional model's predictions exhibited two limitations. First, it yielded consistently lower flux estimates in areas of high abundance of large particles, such as the epipelagic zone, when compared to estimations from the mechanistic framework (cf. Fig. A3a–f vs. 6a–f, Fig. 7). Second, it failed to reproduce the biogeochemically expected trend of increasing C : N ratios with depth (Fig. A3m–r), a trend also supported by the measured DST flux data (Fig. 3m). Instead, it produced higher C : N ratios in the epipelagic zone, where POM is typically freshest and C : N ratios are expected to be lowest. This was followed by a nearly constant C : N ratio at deeper depths, where a gradual increase in the C : N ratio is expected (Schneider et al., 2004).
4.1 Method I
A fundamental challenge in estimating particle and biogeochemical fluxes from in-situ cameras (ISCs) is the inability to distinguish sinking aggregates from the background pool of suspended or neutrally buoyant particles (McDonnell and Buesseler, 2012; Cael and White, 2020). This issue can be exacerbated by mesoscale ocean features that locally concentrate suspended particles (Sweeney et al., 2003). Furthermore, while the removal of zooplankton from ISC datasets is possible, it remains a laborious task, whether performed manually on large datasets or through artificial intelligence models that require extensive training data (Giering et al., 2020). Our study introduces a novel approach (Method I) to overcome these challenges directly. By calibrating UVP-derived PSDf against those obtained from gel traps – which selectively capture sinking particles and enable the straightforward removal of swimmers during image analysis – we developed a quantitative correction to account for the contribution of non-sinking particles (suspended particles and zooplankton) when estimating particle flux from ISC data. Our results clearly show that including non-sinking particles in ISC-derived flux estimates leads to a systematic overestimation of the sinking particle flux (Fig. 4a–c, h). Specifically, the characteristic regression line of the uncorrected UVP-derived PSDf exhibited a higher intercept and a slightly steeper slope in log-log space (Fig. 4j, k), an effect primarily driven by the high concentration of small suspended particles in our study area.
A critical consideration in Method I is the inherent uncertainty of the size-velocity relationship. While the heterogeneous nature of marine aggregates makes particle size an imperfect predictor of sinking velocity (Iversen and Lampitt, 2020), it remains the most practical proxy that can be readily measured in-situ (Cael et al., 2021). Crucially, our analysis reveals a key insight: the bias introduced by non-sinking particles is a far more dominant source of error than the uncertainty in the sinking velocity itself. As shown in Fig. 4a–c, the uncorrected UVP-derived particle flux (Eq. 3) systematically overestimates the sinking particle flux, a discrepancy that persists even when the full uncertainty of the size-velocity model is propagated. This result demonstrates that, despite the inherent uncertainty in size-velocity relationships (Fig. 3a), using a locally-derived, spatiotemporally aligned size-velocity relationship to calibrate ISC-derived particle fluxes against gel trap observations is not only justified but also crucial for accurately isolating and correcting the primary bias from suspended particles.
Quantifying the standing stock of suspended particles is essential for understanding ocean particle dynamics, as it represents a vast reservoir of organic matter that fuels microbial metabolism and serves as the building blocks for larger, fast-sinking aggregates (Alldredge and Jackson, 1995; Kiørboe, 2001). It can also act as an additional carbon sequestration mechanism to the sinking flux, where carbon within suspended particles is captured at depth away from exchange with the atmosphere (Boyd et al., 2019; Rogge et al. 2023). Beyond its primary role of providing corrected particle fluxes for our mechanistic POC and PON flux models (Methods II and III), Method I may also serve as a practical tool for estimating the concentration of the background suspended particle pool. For example, assuming that the overestimation in the smaller size classes is driven primarily by suspended particles rather than zooplankton, the derived ∼ 2.6-fold discrepancy (Fig. 3j) implies that a substantial fraction (up to ∼ 70 %) of the small particle pool is suspended or sinking extremely slowly. Although this inference hinges on the assumption that the gel trap measurements reliably estimate the true sinking flux and that the in-situ measured size-specific sinking velocities are representative across all depths, it highlights the high abundance of suspended material relative to sinking particles in small size fractions (e.g., Cael and White, 2020; Baker et al., 2017; Guidi et al., 2008). Indeed, the presence of such a large suspended pool is consistent with regional observations off Cape Verde, where previous studies have documented pronounced intermediate nepheloid layers (e.g., Valiente et al., 2022).
4.2 Method II and III
The primary contribution of this study is a mechanistic framework for estimating POM fluxes from ISC data that moves beyond traditional statistical approaches. By integrating local inputs – such as size-specific sinking velocities and water temperature – the model tailors flux estimates to the region's specific biogeochemical conditions, thereby improving the accuracy of carbon export quantification. A central feature of the framework is its explicit inclusion of depth-dependent particle degradation. While the degradation rate constant (λ) was optimized in this study due to a lack of direct measurements, the model is designed for flexibility. In future applications, a locally measured λ can be incorporated as a fixed input to further improve the flux estimates.
The presented models for POC flux, based on first-order degradation, accurately reproduced the observed vertical and spatial variability in the DST flux data (Fig. 6a–f) while also yielding physically meaningful parameters. The models' scaling exponents (BPOC=1.97) provide an empirical estimate of the fractal dimension (D). Crucially, these values are highly consistent with a morphology where particle carbon content scales more with surface area (D≈2) than with volume – a fundamental characteristic of porous marine snow aggregates (Alldredge and Gotschalk, 1988; Ploug and Passow, 2007; Burd and Jackson, 2009; Cael and White, 2020). By independently converging on a fractal dimension that reflects this key scaling characteristic, our mechanistic framework demonstrates its ability to capture the underlying physics of particle structure, a significant advantage over purely statistical approaches.
It is important to note that the optimized degradation rate constant λ derived in this study is relatively low. However, a low λ does not diminish the importance of degradation; rather, it highlights its context-dependency. While the effect may be minor for fast-sinking particles due to their much shorter travel times, degradation becomes a critical flux regulator for the smaller, slow-sinking particles responsible for most deep-ocean export. The optimized λ in our study represents a bulk degradation rate for the entire natural particle assemblage, including both organic-rich aggregates and more refractory, mineral-ballasted particles. It is therefore possible that carbon-specific degradation from more refractory in-situ aggregates is lower than rates from aggregates formed from laboratory-grown phytoplankton cultures, for which reported values average ∼ 0.15 d−1 (e.g., Iversen and Ploug, 2013). Indeed, our results align with findings showing that in-situ marine particles degrade more slowly than lab-formed ones (Belcher et al., 2016), although the upper range of the confidence interval of the optimized λ still includes these higher lab-based rates (Fig. 5b). Further support for a low λ value comes from a recent study by Bressac et al. (2024), which demonstrated that microbial degradation is a secondary driver of flux attenuation (contributing only 7 %–29 %), subordinate to the more significant impact of zooplankton grazing in the upper water column (Stemmann et al., 2004; Iversen et al., 2010; van der Jagt et al., 2020) – an effect inherently captured by the ISC-detected attenuation of particle concentration with depth.
A notable feature of the proposed framework is the dynamic modeling of C : N stoichiometry (Method III). Traditional biogeochemical models often rely on static stoichiometric ratios (Moore et al., 2004; Galbraith and Martiny, 2015), a practice that fails to account for the preferential nitrogen remineralization. In contrast, our PON model links C : N stoichiometry to particle age (Eq. 19), providing a numerically robust representation that not only reproduces measured C : N ratios but also captures the trend of increasing C : N with depth (Fig. 6m–r), consistent with the trend observed across a large compilation of sediment trap data (see Fig. 1 in Schneider et al., 2004). This emergent property, achieved without explicit optimization against C : N observations, validates the mechanistic integrity of the model and its potential to represent POM transformation of sinking particles (Grossart and Ploug, 2001). Furthermore, the model's parameters, APON and BPON, could provide additional informative metrics for comparing POM transformation in sinking particles across different regions. Theoretically, APON represents the asymptotic deep-ocean C : N mass ratio of a particle's refractory POM (after labile material is fully degraded), while BPON is the time required for the particle's C : N ratio to reach half of its saturating value. The optimized value of BPON (0.54 d) implies that it takes approximately half a day for fresh particles to reach a molar C : N ratio of 5.5 (half of the asymptotic value). This suggests that the bulk molar C : N ratio of fresh particles in the study area near the sea surface was less than the Redfield ratio of 6.6, but that it increased quickly as the particles aged.
Note that the C : N ratio is not optimized directly; rather, it is a derived quantity obtained by dividing the results of the optimized POC model by those of the optimized PON model. Consequently, the derived C : N estimate incorporates the propagated uncertainties of both models. Therefore, unlike the POC and PON flux profiles, the C : N fit is not directly constrained by the observations. This results in a higher frequency of data points falling outside the 95 % confidence intervals compared to the directly optimized POC and PON profiles, where the fit error is actively minimized against the data. If the C : N ratio were the primary variable of interest, reformulating the PON model to optimize directly against measured C : N ratios would reduce this mismatch.
4.3 Limitations of the conventional method and the prospect for mechanistic models
The conventional method is often a practical compromise between sampling effort and flux prediction and benefits from a simple implementation. However, unlike our mechanistic framework, it functions mainly as an unconstrained statistical fit. This distinction reveals several limitations, particularly when applied to the smaller datasets typical of regional or local studies. The most immediate issue is numerical instability, as highlighted by our bootstrap analysis, in which a significant portion of the bootstrap ensemble failed to converge. This suggests the conventional method requires larger sample sizes and is therefore better suited for large-scale studies than for smaller regional studies where measured flux data are often limited. Indeed, the conventional method has been shown to be effective for deriving global-scale relationships from vast datasets (Guidi et al., 2008). Although adjusting the particle size range (i.e., applying a larger lower bound and/or a smaller upper bound) might improve numerical stability, as demonstrated by Guidi et al. (2008) who limited their analysis to a 250 µm to 1.5 mm size range, this approach is subjective and potentially problematic. It risks excluding key particle populations in areas where POM flux is primarily driven by small (and slow-sinking) particles (Dall'Olmo and Mork, 2014; Omand et al., 2015; Baker et al., 2017) or in cases where large particles are abundant (Alldredge et al., 1993). In contrast, this study applied a much wider particle size range (0.072–3.7 mm, corresponding to size bins 0.064–0.080 and 3.25–4.1 mm, respectively). The lower bound was determined by the smallest UVP5 size bin with particle data, while the upper bound was defined by the size bin containing the largest particles found in our gel traps, thereby accounting for the contributions of both small and large particles.
Beyond numerical instability, an inherent limitation lies in the conventional method's use of a single, lumped scaling exponent, Bconv. This parameter is forced to statistically account for the combined and implicit effects of particle POM mass, sinking velocity, and the bias introduced by non-sinking particles. This approach can produce a compromised and potentially physically implausible scaling relationship. In our dataset, this resulted in a weak scaling exponent for POC flux (Bconv(POC)=1.48), significantly lower than the scaling exponent derived from our mechanistic framework (). Such a low exponent down-weights the contribution of large, fast-sinking particles to the flux calculation, potentially failing to capture the high flux variability driven by any patchy distribution of large aggregates (Fig. 7a–c). The limitation of this lumped-parameter approach is particularly evident in the PON flux optimization for our dataset. Despite achieving a good statistical fit to the PON flux observations (mean error of 16 %), the median of scaling exponents from the converged bootstrap runs was close to zero (Bconv(PON)=0.025), implying that particle size has a negligible influence on the estimated PON flux and that only particle count is relevant. This demonstrates that the conventional method may yield a statistically convenient fit at the expense of physical meaning – a key limitation when the goal is to understand the underlying mechanisms of the biological carbon pump.
Another issue is that the conventional method tends to overestimate POC flux at greater depths when the flux is primarily driven by small particles, particularly if it is optimized with only upper water column flux data (Fig. 7a–b, d). This occurs because the small-particle pool includes a large fraction of suspended material and is also more subject to degradation due to longer residence times – two factors the conventional method overlooks. Furthermore, the method lacks a direct mechanism to model changes in POM stoichiometry. By treating POC and PON fluxes with the same functional form (Eq. 1), it cannot capture the preferential nitrogen remineralization, resulting in a C : N ratio that is effectively static with depth (Fig. A3m–r).
Hence, by incorporating mechanistic processes into the conventional method, we can not only more reliably estimate POM fluxes but also better understand the driving mechanisms of the biological carbon pump and examine processes such as settling and microbial degradation individually for specific regional and seasonal datasets.
While applying the proposed framework requires dedicated field and experimental work, the expanding availability of paired in-situ optical and biogeochemical observations makes this effort increasingly feasible. Indeed, the emerging community effort to collect such paired observations (e.g., Baker et al., 2020; Fadeev et al., 2021; Markussen et al., 2020; Durkin et al., 2021; Pauli et al., 2021; Estapa et al., 2023; Song et al., 2025) was a primary motivation for this study. This framework is designed to be transferable and adaptable, and we hope that its underlying logic and modeling approach will be adopted by the broader community across diverse observational contexts. Such adoption has the potential to improve particle flux estimations from optical devices (Giering et al., 2020) and, ultimately, advance our understanding of the mechanisms driving the biological carbon pump. The long-term vision for this work is to bridge in-situ observations and their larger-scale applications. The proposed approach provides a direct pathway for constraining and refining the parameterizations used in regional biogeochemical models. In parallel, it offers a robust methodology that could support the calibration of flux estimates derived from the growing volume of optical data collected by autonomous platforms, particularly in light of the recent integration of UVPs into BGC-Argo sensor packages (Habib et al., 2025). Collectively, these advances are essential for improving the accuracy of global carbon flux estimates.
This study presents a novel, numerically stable methodological framework that represents a significant step forward in estimating POM fluxes from in-situ camera systems. By incorporating key mechanistic processes, our approach moves beyond the limitations of conventional statistical methods to improve the accuracy and physical grounding of flux estimates. The core contributions of this framework are: (i) a robust method for correcting for the bias of non-sinking particles when estimating particle flux; (ii) a mechanistic model for POC flux that explicitly incorporates size-specific sinking velocities and depth-dependent carbon degradation; and (iii) a dynamic model for PON flux that accounts for preferential nitrogen remineralization by linking C : N stoichiometry to particle age. Together, these components enable reliable estimates of POC and PON fluxes and their spatiotemporal variability from in-situ imaging data. This capability is particularly valuable for quantifying export fluxes at local scales or within dynamic mesoscale features such as eddies – where direct flux measurements are often sparse – and for improving the representation of particle-mediated carbon and nitrogen fluxes in biogeochemical models (Turner, 2015).
With the growing number of ISC profiles being collected across the global ocean (Kiko et al., 2022a), the adoption of such mechanistic approaches has the potential to significantly improve the accuracy of regional and global carbon export estimates. This could help constrain the large uncertainties that currently exist in large-scale models of carbon sequestration (Siegel et al., 2016; Giering et al., 2017; Lombard et al., 2019; Henson et al., 2022) and ultimately enhance our understanding of the efficiency of the biological carbon pump.
A1 Shipboard-based measurements
Drifting Sediment Traps (DST). A total of six DST deployments were conducted, four (DST1, DST4-6) were southwest and two (DST2 and DST3) northeast of the Cape Verde Islands (see Fig. A1 for the position of examined stations). The DST array consisted of a top buoy equipped with an Iridium satellite sender, an array of 14 two-liter buoyancy spheres that acted as wave attenuators, two benthos spheres (glass floats) that provided 25 kg of buoyancy each, and three sediment trap arrays each equipped with four gyroscopically mounted trap cylinders (of diameter 10 cm) deployed at 100, 200, and 400 m water depth, respectively. One trap cylinder per collection depth was fitted with a gel-filled collection cup with an ethanol-based viscous cryo-gel (Tissue-Tek, O.C.T.TM COMPOUND, Sakura) to collect and preserve settling aggregates, allowing determination of the physical structure, type, and size of individual aggregates. The three remaining trap cylinders at each collection depth were used to quantify biogeochemical fluxes (Pauli et al. 2021), including POC and PON.
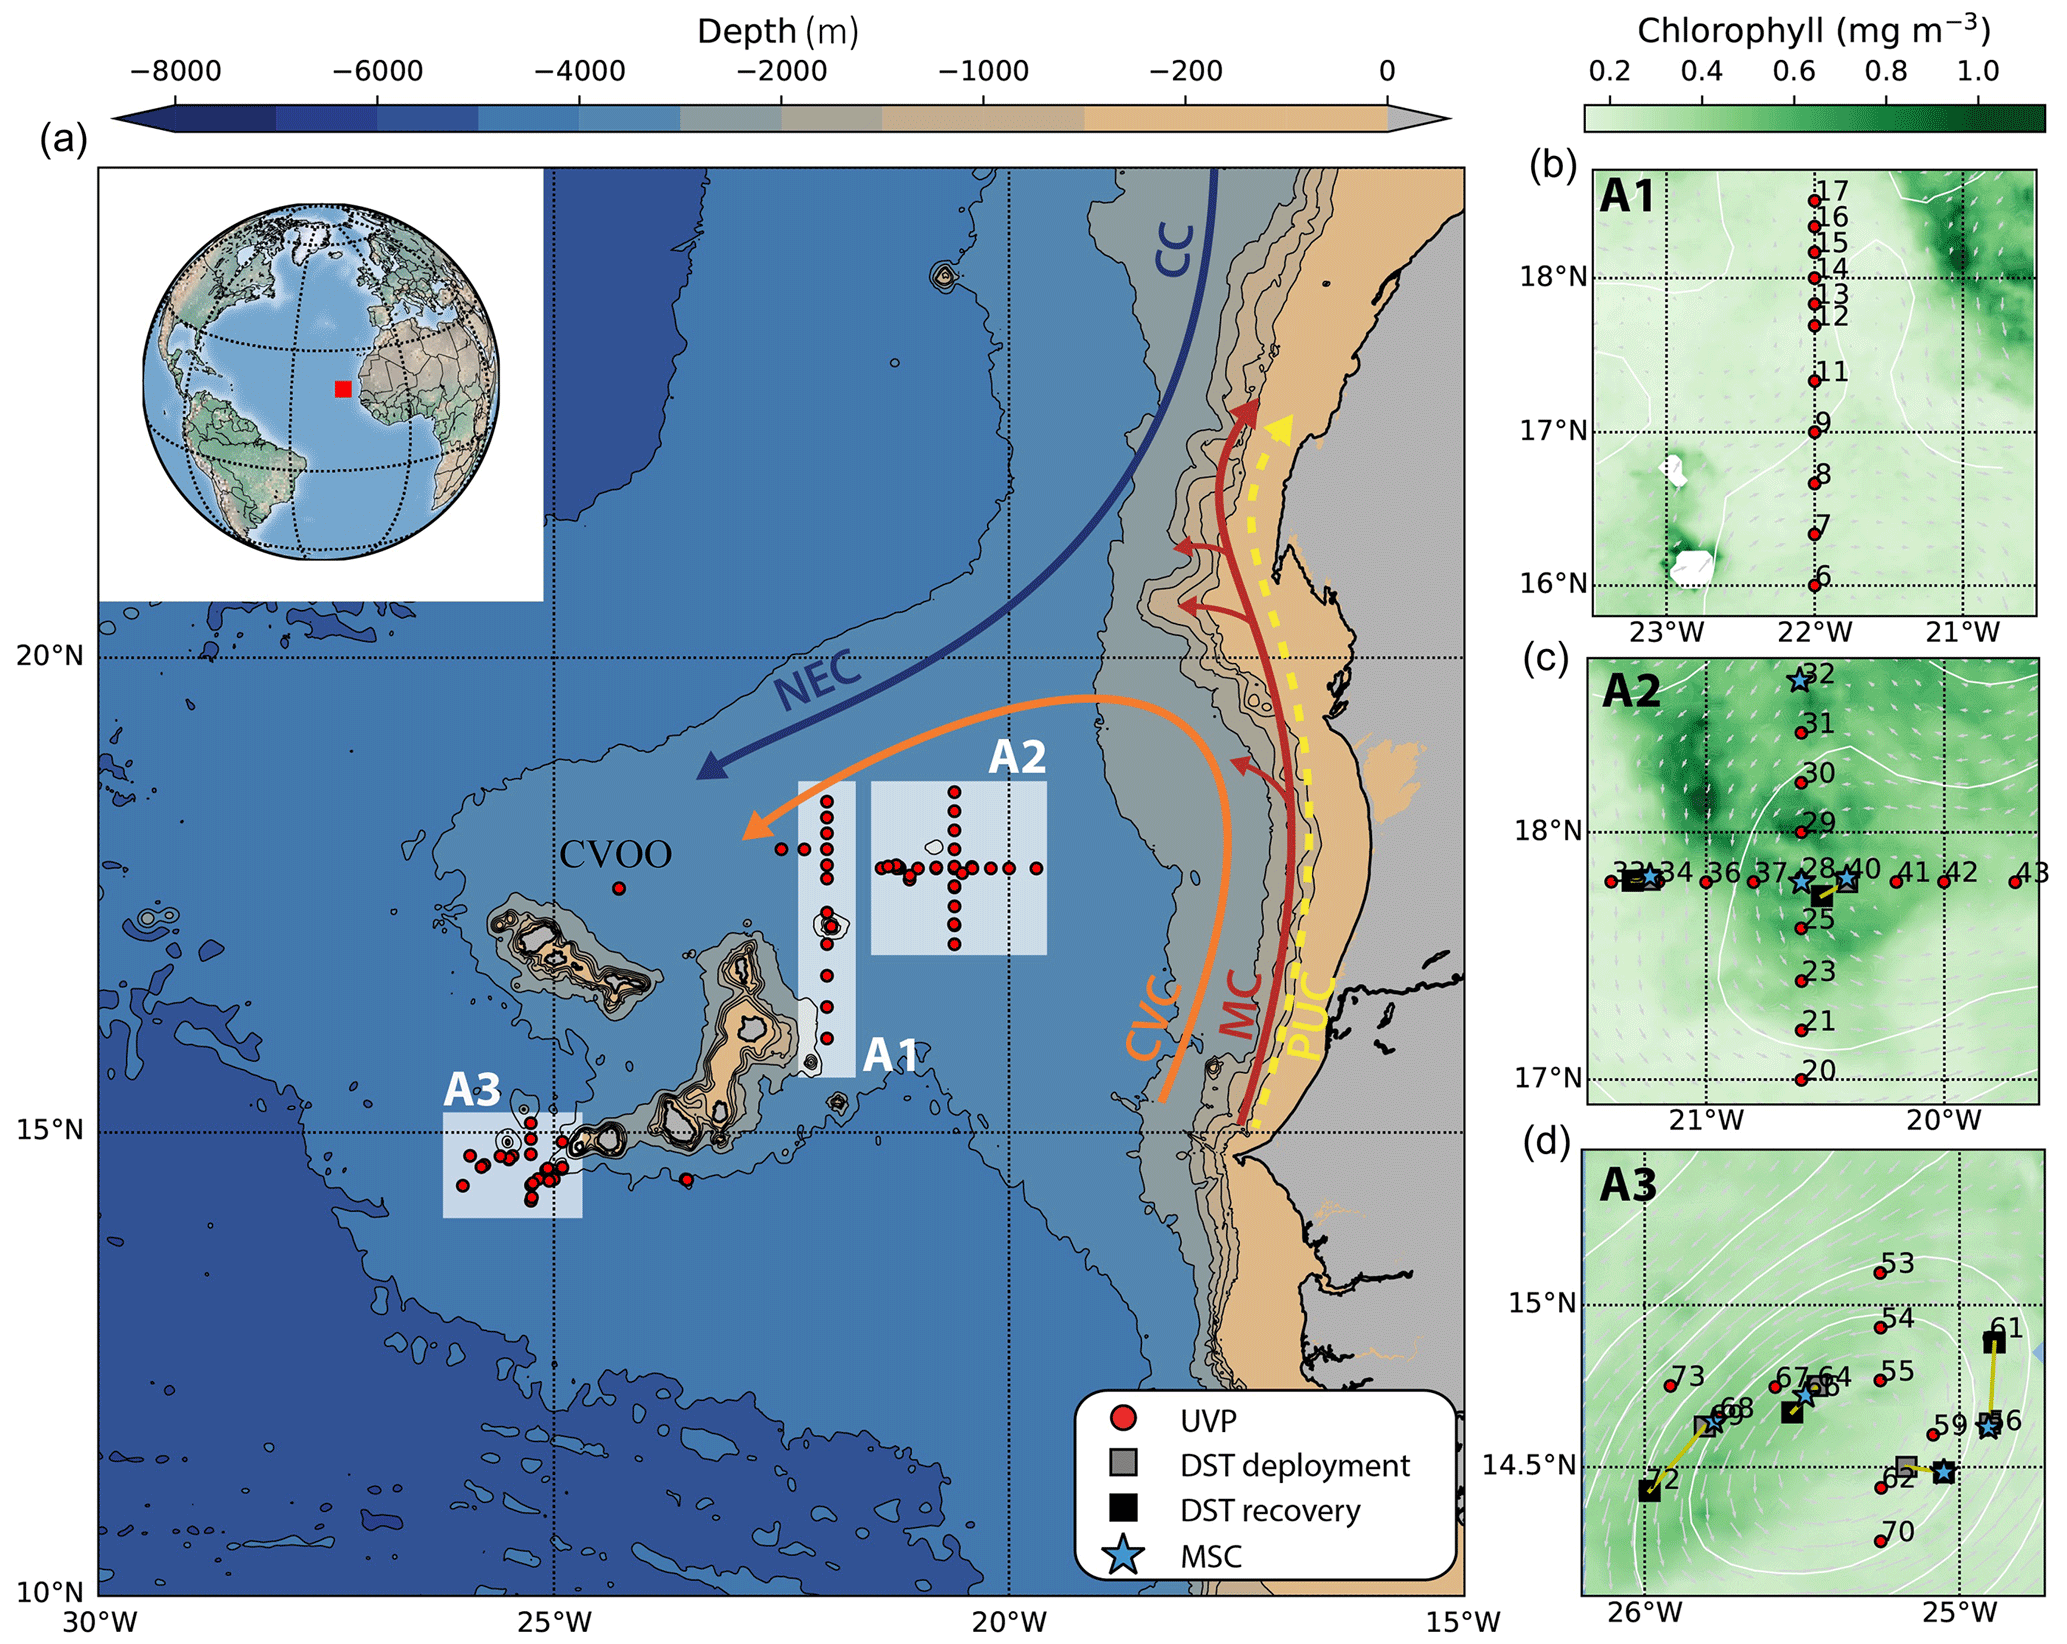
Figure A1(a) Map of station locations within the Cape Verde archipelago region, sampled during the M160 expedition (November–December 2019). Arrows indicate the dominant flow directions of major current systems in the area: Canary Current (CC), North Equatorial Current (NEC), Mauritanian Current (MC), Cape Verde Current (CVC), and Poleward Undercurrent (PUC). The depiction of primary current systems is adapted from Fig. 1 in Romero and Ramondenc (2022). CVOO marks the position of the Cape Verde Ocean Observatory station. (b–d) Enlarged views of stations within the three main sampling zones. The chlorophyll maps represent the average satellite-derived chlorophyll a concentration (cds.climate.copernicus.eu) for the sampling period within each zone: A1 (25 November–1 December 2019), A2 (25 November–3 December 2019), and A3 (10–19 December 2019). The satellite-derived surface currents are shown for the midpoint of each period.
Underwater Vision Profiler (UVP). During the expedition a UVP5 camera system (Picheral et al., 2010) was mounted on the CTD-Rosette system and deployed at 71 stations to quantify the vertical abundance and size distribution of particles and aggregates. UVP5 casts were conducted in parallel with each DST deployment and recovery, allowing for simultaneous observation by the two instruments. The UVP5 provides data on particles larger than 64 µm in equivalent spherical diameter (ESD). However, due to its pixel size of ∼ 30 µm, counts of particles from ca.120 µm upwards are generally considered to be reliable. The majority of the profiles were done down to 1000 m depth and the size-specific particle concentrations were calculated for 5 m depth bins. The UVP5 particle data and the corresponding CTD measurements of water temperature and oxygen concentration have been published in the PANGAEA data repository by Kiko et al. (2022) and Dengler et al. (2022), respectively.
Marine Snow Catcher (MSC). Eight MSC (OSIL, UK) deployments were conducted to collect in-situ formed marine aggregates (particles), which were used to measure size-specific sinking velocity of settling aggregates. The in-situ formed aggregates were collected from 10 m below the chlorophyll maximum. After deployment, aggregates were allowed to sink in the MSC for three hours before they were gently collected from the base of the MSC. A total of 95 individual particles were collected, and their size-specific sinking velocities were measured on board using a flow chamber system equipped with an oxygen microsensor (Ploug and Jørgensen, 1999). The flow chamber was filled with the filtered sea water sampled by the MSC. A heating system was used to adjust the water temperature of the flow chamber to match the in-situ temperature, as indicated by the CTD measurement of temperature profile from the collection depth for each station. The size-specific sinking velocities of 88 (out of 95) aggregates were fitted by a power law function. Seven particles were excluded: one particle (6.1 mm) was larger than the upper size-range considered in this study (0.064–4.1 mm) for calculating POC flux, and the remaining six were excluded due to a lack of replicate measurements of sinking velocity.
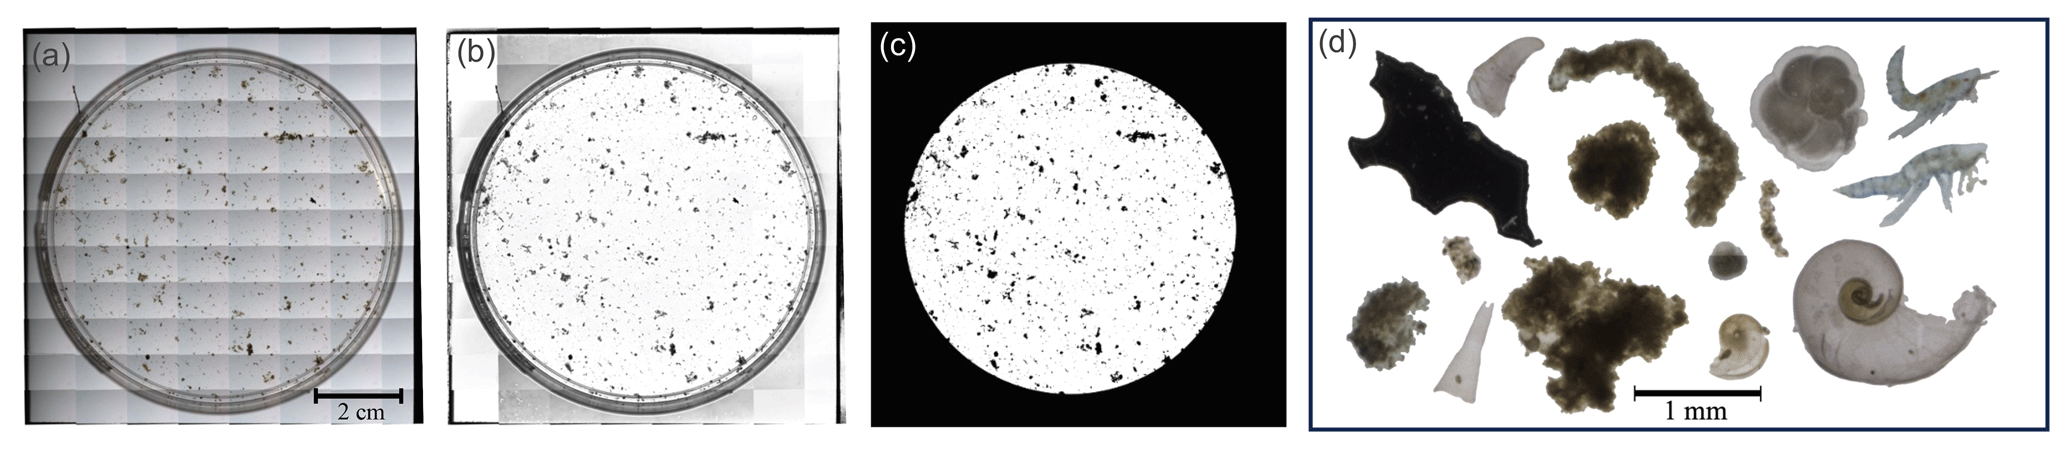
Figure A2Image analysis of gel trap sample using Gel-PISA (https://github.com/namoradi/Gel-PISA.git, last access: 15 January 2026). (a) High-resolution reconstruction of the entire gel trap cup image, achieved by stacking and stitching subsection frames. (b) Conversion of the final image to grayscale, followed by background removal. (c) Transformation of the grayscale image into a binary format for particle counting and size calculation. (d) Examples of particle images extracted from the gel trap sample image.
Gel trap image analysis. Aggregates collected in the gel cups were imaged using a high-resolution camera (2.8 µm px−1) to determine the size distribution of particle flux at depths 100, 200, and 400 m for each station. To ensure clear imaging of both small and large particles, we imaged smaller subsections of each cup area at three prespecified depths of camera's focus. This process was automated using a pre-programmed XYZ-stage equipped with the camera and a motor. A custom Python package, Gel-Trap Particle Image Size Analyzer (Gel-PISA), was developed to reconstruct a single high-resolution image of the entire gel cup area. This tool facilitates precise stacking and stitching of subsection images from each gel cup (Fig. A2) and is specifically tailored for analyzing images captured by our camera system. Gel-PISA also removes background noise from each image frame, producing clean, high-quality images of individual particles. The removal of background image was achieved by analyzing the grayscale value of each pixel at the three focus depths. For that, we leveraged the fact that the variation in grayscale values of pixels in the uncovered areas on the image (devoid of particles) across the three focus depths is different from those in the covered areas. Subsequently, the final gel trap image underwent conversion into a binary black and white format. Particle size was calculated from its image area, determined using the contour module of opencv-python software. This allowed for accurate quantification of particle sizes and counts within the gel trap samples.
Gel trap-based particle fluxes. The equivalent spherical diameter (ESD) of all particles that were collected in the gel traps was calculated using the formula , where A represents the pixel area of the particle multiplied by the pixel size of the image. The swimmers, i.e., zooplankton that actively entered the trap, were visually annotated and excluded from the calculations. Given the rarity of larger particles, particularly at greater water depths, it was necessary to group them into larger size bins. The particles were sorted into logarithmically spaced size bins (Jackson et al., 1997) such that the equivalent spherical volume corresponding to the particle sizes at the left and right edges of each bin increases by 50 % from one bin to the next. Specifically, the bins were defined so that the right edge of each bin (Di+1) is times larger than its left edge (Di), i.e., Di+1 = with D1 = 32 µm. The index i refers to the ith size bin represented by di = 0.5 × (Di+1 + Di), the midpoint of the size bin i. The size bin i contains the number of particles whose diameters are within the range Di≤ d < Di+1. Using the deployment time of the sediment trap and the area of the gel trap cup (ca. 50 cm2), the corresponding gel trap-based particle flux (FGel) was calculated in units of number of particles per square meter per day (particles m−2 d−1). The obtained size distribution of particle flux (PSDf) for each gel trap was characterized by the best linear fit of log 10(FGel) versus log 10(d), represented by an associated pair of intercept and slope as exemplified (Fig. 2a). For the fitting procedure, a particle size-range from 64 µm to 2.58 mm was considered. The midpoints of the smallest (64–80 µm) and largest (2.05–2.58 mm) size bins within this range are 72 µm and 2.315 mm, respectively. Particle counts for sizes larger than 2.58 mm were considered unreliable due to the rarity of large sinking particles, especially at greater depths, and the small sampling area by the trap. If a size bin in the considered particle size range had log10(FGel)≤0 (or simply no particles in that size bin), that size bin was excluded from fitting procedure.
UVP-based particle concentration. To determine UVP-based size distribution of particle concertation (nUVP) the same size bins used for the gel traps were applied, but the first three bins were skipped and D1 was set to 64 µm because of lower resolution of UVP camera. Due to the UVP's shorter observation time and the notable decrease in particle counts with increasing water depth, particularly for larger particles at greater water depth, a depth-specific averaging approach was implemented to statistically enhance the reliability of particle abundance and the size distribution. Averaging was conducted within specific vertical water layers: 5 m layers for depths shallower than 50 m, 10 m layers for depths between 50 and 200 m, 15 m layers for depths between 20 and 400 m, and 25 m layers for greater depths. To associate a spatiotemporally consistent nUVP counterpart to each FGel, the average of two nUVP were used. These two were extracted from the UVP profiles obtained at the times of deployment and recovery of the corresponding DST, aligning with the associated depth of respective FGel. After converting the nUVP to the UVP-derived size distributions of particle flux (FUVP) using the measured size-velocity relationship (see Eq. 3 in the main text), the calculated FUVP were characterized using the same fitting procedure applied to the FGel (Fig. 2b). To ensure reliable regression lines, a particle size range from 144 µm to 3.67 mm was considered. These limits correspond to the midpoints of the size classes 128–160 µm (as counts of particles > 120 µm are generally considered reliable) and 3.25–4.1 mm (the size bin containing the largest settling particles found in our gel traps).
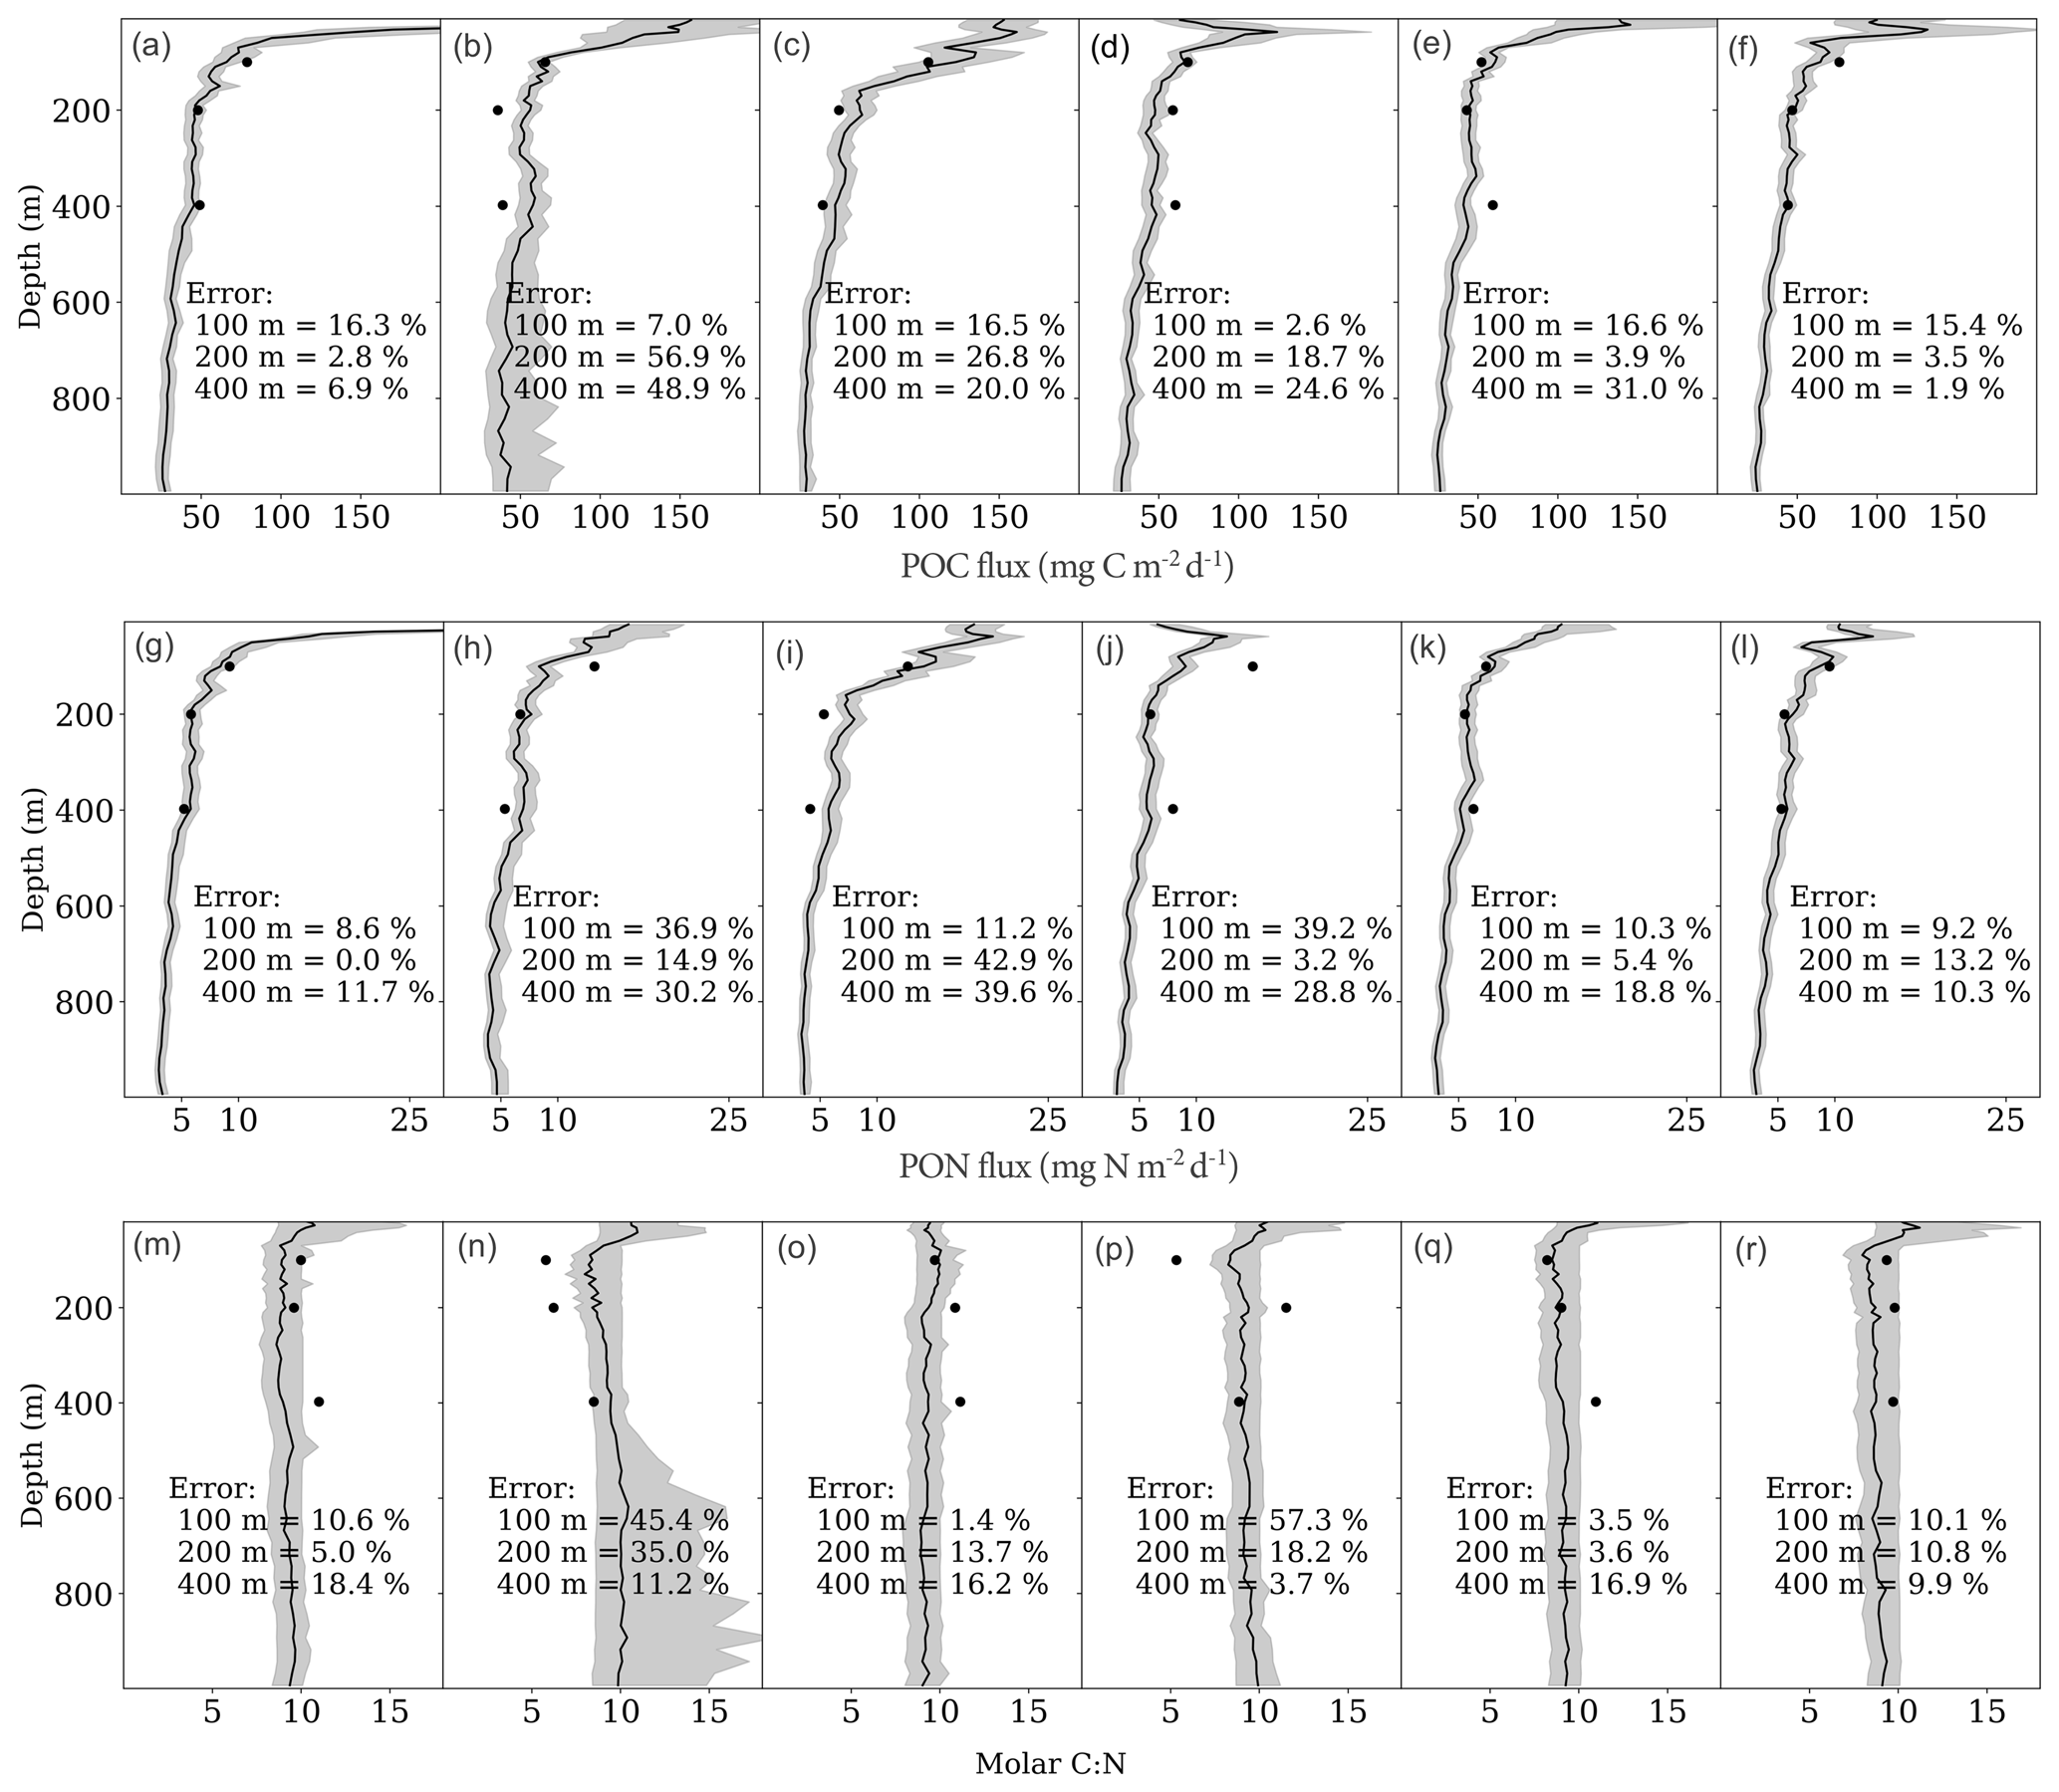
Figure A3POC and PON flux estimates, and resulting C : N ratios, from the conventional method (Eq. 1 in the main text) compared with DST measurements. Vertical profiles show model estimates for POC flux (a–f), PON flux (g–l), and the resulting molar C : N ratio (m–r) at the six DST stations. Solid black lines represent the median of the model estimates from the optimized bootstrap distribution, with grey shading indicating the 95 % confidence interval. Black circles represent the discrete measurements from the DSTs. The errors shown indicate the relative deviation of the model estimates (black lines) from the DST measurements. All model estimates are based on the average of two UVP profiles acquired during the deployment and recovery of each DST.
A2 Supplementary Figures and Tables
Table A1Measured DST-based POC and PON fluxes with corresponding molar C : N alongside the intercept and slope of the characteristic lines fitted to the log-transformed gel trap-based size distributions of particle flux and their UVP counterparts. Note that the values for aUVP and bUVP are presented without correction. Both particle flux (FGel and FUVP) as well as particle size d were initially normalized by 1 m−2 d−1 and 1 µm respectively, prior to log-transformation. Consequently, the intercepts and slopes are unitless.
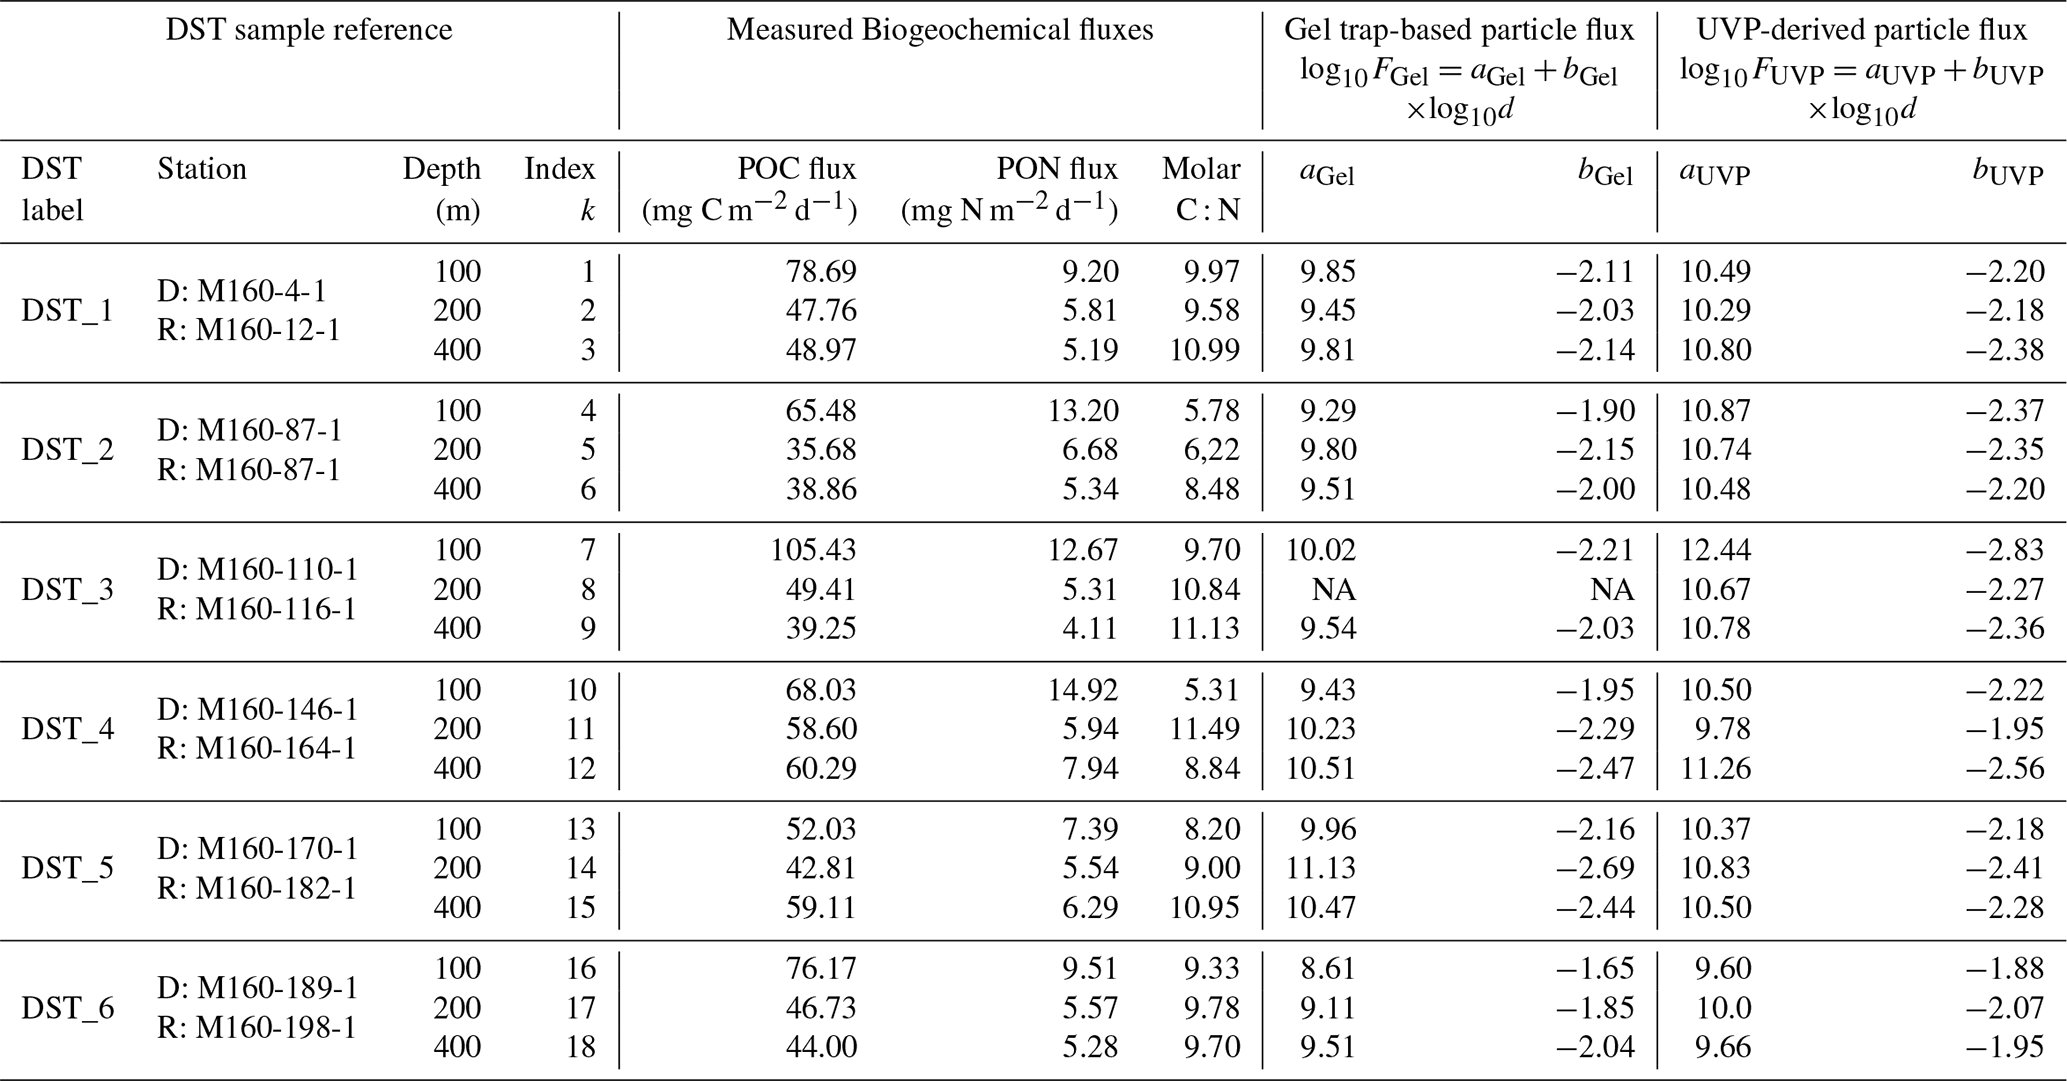
NA: not available.
Table A2Particle size and sinking velocity data. Size (equivalent spherical diameter, ESD) and sinking velocity of in-situ formed aggregates collected during the M160 expedition. Measurements were conducted using the flow chamber system on board.
All data used in this study are freely accessible. The UVP and CTD data can be respectively found at the following links: https://doi.org/10.1594/PANGAEA.924375 (Kiko et al., 2022b) and https://doi.org/10.1594/PANGAEA.943432 (Dengler et al., 2022), respectively. DST-based flux measurements and MSC-based sinking rates are provided in the Appendix (Tables A1–A2). The computer scripts used to produce the results are available from the corresponding authors upon request. The source code for our custom image analysis software, Gel-PISA is hosted on Github at https://github.com/namoradi/Gel-PISA.git, last access: 15 January 2026.
NM analyzed the data, developed and implemented the presented methods and Gel-PISA package, prepared and visualized the results, and wrote the manuscript. LH processed DST samples and measured biogeochemical fluxes. SR prepared the map of study region. CMF, LH, and NM performed in-situ sampling and measurements (MSC and DST) on board. RK contributed to processing of UVP profiles. HH prepared the UVP5 for the cruise and instructed its use on board, downloaded and pre-processed the UVP5 data and contributed to postprocessing. AK conceptualized, planned and organized the scientific program of the multidisciplinary, multi-platform eddy studies during RV Meteor Cruise M160 and led the cruise. MHI planed the sampling strategy and supervised the study. All co-authors contributed to the discussion of results, critically reviewed and approved the manuscript.
The contact author has declared that none of the authors has any competing interests.
Publisher's note: Copernicus Publications remains neutral with regard to jurisdictional claims made in the text, published maps, institutional affiliations, or any other geographical representation in this paper. The authors bear the ultimate responsibility for providing appropriate place names. Views expressed in the text are those of the authors and do not necessarily reflect the views of the publisher.
This article is part of the special issue “Concerted multidisciplinary and multi-platform eddy studies off West Africa: mesoscale and sub-mesoscale dynamics and physical-chemical-biological coupling (BG/ESSD/OS inter-journal SI)”. It is not associated with a conference.
The authors extend gratitude to the captain and crew of RV Meteor M160, as well as to Juri Knudsen for operating the UVP5 on board.
Funding from the German Federal Ministry of Education and Research (BMBF) through the following projects is greatly acknowledged: REEBUS-WP6 (grant no. 03F0815D), REEBUS-WP1 (grant no. 03F0815A), Project 03F0629A, CUSCO-WP5 (grant no. 03F0813A), and CO2MESO (grant no. 03F0876A). Additional financial support was provided by the DFG-Research Center/Cluster of Excellence “The Ocean in the Earth System” (EXC-2077-390741603), and the Alfred Wegener Institute Helmholtz Center for Polar Marine Research through the PoF IV program “Changing Earth – Sustaining our Future”, Topic 6.3 of the German Helmholtz Association. NM and MHI acknowledge additional funding from the EU HORIZON-CL6 projects OceanICU (grant no. 101083922) and SEA-Quester (grant no. 101136480). Views and opinions expressed, however, are those of the author(s) only and do not necessarily reflect those of the granting authority. Neither the European Union nor the granting authority can be held responsible for them. CMF was funded by the AWI internal strategy fund “EcoPump” and the Minerva fellowship of the Minerva Stiftung Gesellschaft fuer die Forschung mbH. RK acknowledges support from the French National Research Agency through the Make Our Planet Great Again program (ANR, #ANR-19-MPGA-0012) and funding from the German Science Foundation's Heisenberg Programme (#KI 1387/5-1).
The article processing charges for this open-access publication were covered by the University of Bremen.
This paper was edited by Peter Landschützer and reviewed by two anonymous referees.
Alldredge, A. L. and Gotschalk, C.: In situ settling behavior of marine snow, Limnol. Oceanogr., 33, 339–351, https://doi.org/10.4319/lo.1988.33.3.0339, 1988.
Alldredge, A. L. and Jackson, G. A.: Aggregation in marine systems, Deep-Sea Res. Pt. II, 42, 1–7, https://doi.org/10.1016/0967-0645(95)90003-9, 1995.
Alldredge, A. L., Passow, U., and Logan, B .E.: The abundance and significance of a class of large, transparent organic particles in the ocean, Deep-Sea Res. Pt. I, 40, 1131–1140, https://doi.org/10.1016/0967-0637(93)90129-Q, 1993.
Baker, C. A., Henson, S. A., Cavan, E. L., Giering, S. L. C., Yool, A., Gehlen, M., Belcher, A., Riley, J. S., Smith, H. E. K., and Sanders, R.: Slow-sinking particulate organic carbon in the Atlantic Ocean: magnitude, flux, and potential controls, Global Biogeochem. Cycles, 31, 1051–1065, https://doi.org/10.1002/2017gb005638, 2017.
Baker, C. A., Estapa, M. L., Iversen, M., Lampitt, R., and Buesseler. K.: Are all sediment traps created equal? An intercomparison study of carbon export methodologies at the PAP-SO site, Prog. Oceanogr., 184, 102317, https://doi.org/10.1016/j.pocean.2020.102317, 2020.
Belcher, A., Iversen, M., Manno, C., Henson, S. A., Tarling, G. A., and Sanders, R.: The role of particle associated microbes in remineralization of fecal pellets in the upper mesopelagic of the Scotia Sea, Antarctica, Limnol. Oceanogr., 61, 1049–1064, https://https://doi.org/10.1002/lno.10269, 2016.
Boyd, P. W., Claustre, H., Levy, M., Siegel D. A., and Weber, T.: Multi-faceted particle pumps drive carbon sequestration in the ocean, Nature, 568, 327–335, https://doi.org/10.1038/s41586-019-1098-2, 2019.
Bressac, M., Laurenceau-Cornec, E. C., Kennedy, F., Santoro, A. E., Paul, N. L., Briggs, N., Carvalho, F., and Boyd, P. W.: Decoding drivers of carbon flux attenuation in the oceanic biological pump, Nature, 633, 587–593, https://doi.org/10.1038/s41586-024-07850-x, 2024.
Buesseler, K. O., Antia, A. N., Chen, M., Fowler, S. W., Gardner, W. D., Gustafsson, O., Harada, K., Michaels, A. F., Rutgers van der Loeff, M., Sarin, M., Steinberg, D. K., and Trull, T.: An assessment of the use of sediment traps for estimating upper ocean particle fluxes, J. Mar. Res., 65, 345–416, https://doi.org/10.1357/002224007781567621, 2007.
Buesseler, K. O., Lamborg, C., Cai, P., Escoube, R., Johnson, R., Pike, S., Masque, P., McGillicuddy, D., and Verdeny, E.: Particle fluxes associated with mesoscale eddies in the Sargasso Sea, Deep-Sea Res. Pt. II, 55, 1426–1444, https://doi.org/10.1016/j.dsr2.2008.02.007, 2008.
Buesseler, K. O., Boyd, P. W, Black, E. E., and Siegel, D.A.: Metrics that matter for assessing the ocean biological carbon pump, Proc. Natl. Acad. Sci. U.S.A., 117, 9679–9687, https://doi.org/10.1073/pnas.1918114117, 2020.
Burd, A. B. and Jackson, G. A.: Particle Aggregation, Annual Review of Marine Science, 1, 65–90, https://doi.org/10.1146/annurev.marine.010908.163904, 2009.
Cael, B. B. and White, A. E.: Sinking versus suspended particle size distributions in the North Pacific Subtropical Gyre, Geophys. Res. Lett., 47, e2020GL087825, https://doi.org/10.1029/2020gl087825, 2020.
Cael, B. B., Cavan, E. L., and Britten, G. L.: Reconciling the size-dependence of marine particle sinking speed, Geophys. Res. Lett., 5, e2020GL091771, https://doi.org/10.1029/2020gl091771, 2021.
Clements, D. J., Yang, S., Weber, T., McDonnell, A. M. P., Kiko, R., Stemmann, L., and Bianchi, D.: New estimate of organic carbon export from optical measurements reveals the role of particle size distribution and export horizon, Global Biogeochem. Cycles, 37, e2022GB007633, https://doi.org/10.1029/2022gb007633, 2023.
Dall'Olmo, G. and Mork, K. A.: Carbon export by small particles in the Norwegian Sea, Geophys. Res. Lett., 41, 2921–2927, https://doi.org/10.1002/2014gl059244, 2014.
Dengler, M., Körtzinger, A., and Krahmann, G.: Physical oceanography (CTD) during METEOR cruise M160, PANGAEA [data set], https://doi.pangaea.de/10.1594/PANGAEA.943432, 2022.
DeVries, T. and Weber, T.: The export and fate of organic matter in the ocean: New constraints from combining satellite and oceanographic tracer observations, Global Biogeochem. Cycles, 31, 535–555, https://doi.org/10.1002/2016gb005551, 2017.
Durkin, C. A., Buesseler, K. O., Cetinic, I., Estapa, M., Kelley, R. P., and Omand. M.: A visual tour of carbon export by sinking particles, Global Biogeochem. Cycles, 35, 1–17, https://doi.org/10.1029/2021GB006985, 2021.
Estapa, M., Durkin, C., Slade, W., Huffard, C., O'Neill, S., and Omand, M.: A new, global optical sediment trap calibration, Limnol. Oceanogr. Methods, 22, 77–92, https://doi.org/10.1002/lom3.10592, 2023.
Fadeev, E., Rogge, A., Ramondenc, S., Noethig, E.-M., Wekerle, C., Bienhold, C., Salter, I., Waite, A. M., Hehemann, L., Boetius, A., and Iversen, M. H.: Sea ice presence is linked to higher carbon export and vertical microbial connectivity in the Eurasian Arctic Ocean, Commun. Biol., 4, 1255, https://doi.org/10.1038/s42003-021-02776-w, 2021.
Galbraith, E. D. and Martiny, A. C.: A simple nutrient-dependence mechanism for predicting the stoichiometry of marine ecosystems, Proc. Natl. Acad. Sci. U.S.A., 112, 8199–8204, https://doi.org/10.1073/pnas.1423917112, 2015.
Giering, S. L. C., Sanders, R., Martin, A. P., Henson, S. A., Riley, J. S., Marsay, C. M., and Johns, D. G.: Particle flux in the oceans: challenging the steady state assumption, Global Biogeochem. Cycles, 31, 159–171, https://doi.org/10.1002/2016gb005424, 2017.
Giering, S. L. C., Cavan, E. L., Basedow, S. L., Briggs, N., Burd, A. B., Darroch, L. J., Guidi, L., Irisson, J.-O., Iversen, M. H., Kiko, R., Lindsay, D., Marcolin, C. R., McDonnell, A. M. P., Möller, K. O., Passow, U., Thomalla, S., Trull, T. W., and Waite, A. M.: Sinking organic particles in the ocean–flux estimates from in-situ optical devices, Front. Mar. Sci., 6, 834, https://doi.org/10.3389/fmars.2019.00834, 2020.
Grossart, H.-P. and Ploug, H.: Microbial degradation of organic carbon and nitrogen on diatom aggregates, Limnol. Oceanogr., 46, 267–277, https://doi.org/10.4319/lo.2001.46.2.0267, 2001.
Guidi, L., Jackson, G. A., Stemmann, L., Miquel, J. C., Picheral, M., and Gorsky, G.: Relationship between particle size distribution and flux in the mesopelagic zone, Deep-Sea Res. Pt. I, 55, 1364–1374, https://doi.org/10.1016/j.dsr.2008.05.014, 2008.
Habib, J., Stemmann, L., Accardo, A., Baudena, A., Tuchen, F. P., Brandt, P., and Kiko, R.: Marine snow surface production and bathypelagic export at the Equatorial Atlantic from an imaging float, Biogeosciences, 22, 7985–8003, https://doi.org/10.5194/bg-22-7985-2025, 2025.
Hach, P. F., Marchant, H. K., Krupke, A., Riedel, T., Meier, D. V., Lavik, G., Holtappels, M., Dittmar, T., and Kuypers, M. M. M.: Rapid microbial diversification of dissolved organic matter in oceanic surface waters leads to carbon sequestration, Sci. Rep., 10, 13025, https://doi.org/10.1038/s41598-020-69930-y, 2020.
Henson, S. A., Sanders, R., Madsen, E., Morris, P. J., Le Moigne, F., and Quartly, G. D.: A reduced estimate of the strength of the ocean's biological carbon pump, Geophys. Res. Lett., 38, L04606, https://doi.org/10.1029/2011GL046735, 2011.
Henson, S. A., Laufkötter, C., Leung, S., Giering, S. L. C., Palevsky, H. I., and Cavan, E. L. C.: Uncertain response of ocean biological carbon export in a changing world, Nat. Geosci., 15, 248–254, https://doi.org/10.1038/s41561-022-00927-0, 2022.
Iversen, M. H.: Carbon export in the ocean: A biologist's perspective, Annu. Rev. Mar. Sci., 15, 357–381, https://doi.org/10.1146/annurev-marine-032122-035153, 2023.
Iversen, M. H. and Lampitt, R. S.: Size does not matter after all: No evidence for a size-sinking relationship for marine snow, Prog. Oceanogr., 189, 102445, https://doi.org/10.1016/j.pocean.2020.102445, 2020.
Iversen, M. H. and Ploug, H.: Temperature effects on carbon-specific respiration rate and sinking velocity of diatom aggregates – potential implications for deep ocean export processes, Biogeosciences, 10, 4073–4085, https://doi.org/10.5194/bg-10-4073-2013, 2013.
Iversen, M. H., Nowald, N., Ploug, H., Jackson, G. A., and Fischer, G.: High resolution profiles of vertical particulate organic matter export off Cape Blanc, Mauritania: Degradation processes and ballasting effects, Deep-Sea Res. Pt. I, 57, 771–784, https://doi.org/10.1016/j.dsr.2010.03.007, 2010.
Jackson, G. A., Maffione, R., Costello, D., K., Alldredge, A. L., Logan, B. E., and Dam, H. G.: Particle size spectra between 1 µm and 1 cm at Monterey Bay determined using multiple instruments, Deep-Sea Res. Pt. I, 44, 1739–1767, https://doi.org/10.1016/S0967-0637(97)00029-0, 1997.
Kiko, R., Biastoch, A., Brandt, P., Cravatte, S., Hauss, H., Hummels, R., Kriest, I., Marin, F., McDonnell, A. M. P., Oschlies, A., Picheral, M., Schwarzkopf, F. U., Thurnherr, A. M., and Stemmann, L.: Biological and physical influences on marine snowfall at the equator, Nat. Geosci., 10, 852, https://doi.org/10.1038/ngeo3042, 2017.
Kiko, R., Picheral, M., Antoine, D., Babin, M., Berline, L., Biard, T., Boss, E., Brandt, P., Carlotti, F., Christiansen, S., Coppola, L., de la Cruz, L., Diamond-Riquier, E., Durrieu de Madron, X., Elineau, A., Gorsky, G., Guidi, L., Hauss, H., Irisson, J.-O., Karp-Boss, L., Karstensen, J., Kim, D., Lekanoff, R. M., Lombard, F., Lopes, R. M., Marec, C., McDonnell, A. M. P., Niemeyer, D., Noyon, M., O'Daly, S. H., Ohman, M. D., Pretty, J. L., Rogge, A., Searson, S., Shibata, M., Tanaka, Y., Tanhua, T., Taucher, J., Trudnowska, E., Turner, J. S., Waite, A., and Stemmann, L.: A global marine particle size distribution dataset obtained with the Underwater Vision Profiler 5, Earth Syst. Sci. Data, 14, 4315–4337, https://doi.org/10.5194/essd-14-4315-2022, 2022a.
Kiko, R., Picheral, M., Antoine, D., Babin, M., Berline, L., Biard, T., Boss, E., Brandt, P., Carlotti, F., Christiansen, S., Coppola, L., de la Cruz, L., Diamond-Riquier, E., Durrieu de Madron, X., Elineau, A., Gorsky, G., Guidi, L., Hauss, H., Irisson, J.-O., Karp-Boss, L., Karstensen, J., Kim, D.-g., Lekanoff, R. M., Lombard, F., Lopes, R. M., Marec, C., McDonnell, A. M. P., Niemeyer, D., Noyon, M., O'Daly, S. H., Ohman, M. D., Pretty, J. L., Rogge, A., Searson, S., Shibata, M., Tanaka, Y., Tanhua, T., Taucher, J., Trudnowska, E., Turner, J. S., Waite, A., and Stemmann, L.: A global marine particle size distribution dataset obtained with the Underwater Vision Profiler 5, PANGAEA [data set], https://doi.org/10.1594/PANGAEA.924375, 2022b.
Kiørboe, T.: Formation and fate of marine snow: small-scale processes with large-scale implications, Sci. Mar., 65, 57–71, https://doi.org/10.3989/scimar.2001.65s257, 2001.
Lombard, F., Boss, E., Waite, A. M., Vogt, M., Uitz, J., Stemmann, L., Sosik, H. M., Schulz, J., Romagnan, J.-B., Picheral, M., Pearlman, J., Ohman, M. D., Niehoff, B., Möller, K. O., Miloslavich, P., Lara-López, A., Kudela, R., Lopes, R. M., Kiko, R., Karp-Boss, L., Jaffe, J. S., Iversen, M. H., Irisson, J.-O., Fennel, K., Hauss, H., Guidi, L., Gorsky, G., Giering, S. L. C., Gaube, P., Gallager, S., Dubelaar, G., Cowen, R. K., Carlotti, F., Briseño-Avena, C., Berline, L., Benoit-Bird, K., Bax, N., Batten, S., Ayata, S. D., Artigas, L. F., and Appeltans, W.: Globally consistent quantitative observations of planktonic ecosystems, Front. Mar. Sci., 6, 196, https://doi.org/10.3389/fmars.2019.00196, 2019.
Markussen, T. N., Konrad, C., Waldmann, C., Becker, M., Fischer, G., and Iversen, M. H.: Tracks in the Snow – Advantage of Combining Optical Methods to Characterize Marine Particles and Aggregates, Front. Mar. Sci., 7, 476, https://doi.org/10.3389/fmars.2020.00476, 2020.
Martin, J. H., Knauer, G. A., Karl, D. M., and Broenkow, W. W.: VERTEX: carbon cycling in the northeast Pacific, Deep-Sea Res. Pt. A, 34, 267–285, https://doi.org/10.1016/0198-0149(87)90086-0, 1987.
McDonnell, A. M. P. and Buesseler, K. O.: A new method for the estimation of sinking particle fluxes from measurements of the particle size distribution, average sinking velocity, and carbon content, Limnol. Oceanogr. Methods, 10, 329–346, https://doi.org/10.4319/lom.2012.10.329, 2012.
McGillicuddy Jr., D. J., Anderson, L. A., Bates, N. R., Bibby, T., Buesseler, K. O., Carlson, C. A., Davis, C. S., Ewart, C., Falkowski, P. G., Goldthwait, S. A., Hansell, D. A., Jenkins, W. J., Johnson, R., Kosnyrev, V. K., Ledwell, J. R., Li, Q. P., Siegel, D. A., and Steinberg, D. K.: Eddy/wind interactions stimulate extraordinary mid-ocean plankton blooms, Science, 316, 1021–1026, https://doi.org/10.1126/science.1136256, 2007.
Moore, J. K., Doney, S. C., and Lindsay, K.: Upper ocean ecosystem dynamics and iron cycling in a global three-dimensional model, Global Biogeochem. Cycles, 18, GB4028, https://doi.org/10.1029/2004GB002220, 2004.
Omand, M. M., D'Asaro, E. A., Lee, C. M., Perry, M. J., Briggs, N., Cetinić, I., and Mahadevan, A.: Eddy-driven subduction exports particulate organic carbon from the spring bloom, Science, 348, 222–225, https://doi.org/10.1126/science.1260062, 2015.
Pauli, N.-C., Flintrop, C. M., Konrad, C., Pakhomov, E. A., Swoboda, S., Koch, F., Wang, X.-L., Zhang, J.-C., Brierley, A. S., Bernasconi, M., Meyer, B., and Iversen, M. H.: Krill and salp faecal pellets contribute equally to the carbon flux at the Antarctic Peninsula, Nature Communications, 12, 7168, https://doi.org/10.1038/s41467-021-27436-9, 2021.
Picheral, M., Guidi, L., Stemmann, L., Karl, D. M., Iddaoud, G., and Gorsky, G.: The underwater vision profiler 5: An advanced instrument for high spatial resolution studies of particle size spectra and zooplankton, Limnol. Oceanogr., 8, 462–473, https://doi.org/10.4319/lom.2010.8.462, 2010.
Ploug, H. and Bergkvist, J.: Oxygen diffusion limitation and ammonium production within sinking diatom aggregates under hypoxic and anoxic conditions, Mar. Chem., 176, 142–149, https://doi.org/10.1016/j.marchem.2015.08.012, 2015.
Ploug, H. and Jørgensen, B. B.: A net-jet flow system for mass transfer and microsensor studies of sinking aggregates, Mar. Ecol. Prog. Ser., 176, 279–290, https://doi.org/10.3354/meps176279, 1999.
Ploug, H. and Passow, U.: Direct measurement of diffusivity within diatom aggregates containing transparent exopolymer particles, Limnol. Oceanogr., 52, 1–6, https://doi.org/10.4319/lo.2007.52.1.0001, 2007.
Ramondenc, S., Madeleine, G., Lombard, F., Santinelli, C., Stemmann, L., Gorsky, G., and Guidi, L.: An initial carbon export assessment in the Mediterranean Sea based on drifting sediment traps and the Underwater Vision Profiler data sets, Deep-Sea Res. Pt. I, 117, 107–119, https://doi.org/10.1016/j.dsr.2016.08.015, 2016.
Rogge, A., Janout, M, Loginova, N., Trudnowska, E., Hörstmann, C., Wekerle, C., Oziel, L., Schourup-Kristensen, V., Ruiz-Castillo, E., Schulz, K., Povazhnyy, V. V., Iversen, M. H., and Waite, A. M.: Carbon dioxide sink in the Arctic Ocean from cross-shelf transport of dense Barents Sea water, Nature Geoscience, 16, 82–88, https://doi.org/10.1038/s41561-022-01069-z, 2023.
Romankevich, E. A.: Organic carbon in late Quaternary sediments of seas and oceans, in: Geochemistry of Organic Matter in the Ocean, edited by: Romankevich, E. A., Springer, Berlin, pp. 105–160, https://doi.org/10.1007/978-3-642-49964-7_6, 1984.
Romero, O. E. and Ramondenc, S.: A 17-year time-series of diatom populations' flux and composition in the Mauritanian coastal upwelling, Front. Mar. Sci., 9, 1006345, https://doi.org/10.3389/fmars.2022.1006345, 2022.
Sarmiento, J. L. and Gruber, N.: Ocean Biogeochemical Dynamics, Princeton University Press, Princeton, NJ, ISBN: 9780691017075, 2006.
Schneider, B., Schlitzer, R., Fischer, G., and Nöthig, E.-M.: Depth-dependent elemental compositions of particulate organic matter (POM) in the ocean, Global Biogeochem. Cycles, 17, 1032, https://doi.org/10.1029/2002gb001871, 2003.
Schneider, B., Engel, A., and Schlitzer, R.: Effects of depth- and CO2-dependent C : N ratios of particulate organic matter (POM) on the marine carbon cycle, Global Biogeochem. Cycles, 18, 1, https://doi.org/10.1029/2003GB002184, 2004.
Siegel, D. A., Peterson, P., McGillicuddy Jr., D. J., Maritorena, S., and Nelson, N. B.: Bio-optical footprints created by mesoscale eddies in the Sargasso Sea, Geophysical Research Letters, 38, L13608, https://doi.org/10.1029/2011GL047660, 2011.
Siegel, D. A., Buesseler, K. O., Behrenfeld, M. J., Benitez-Nelson, C. R., Boss, E., Brzezinski, M. A., Burd, A., Carlson, C. A., D'Asaro, E. A., Doney, S. C., Perry, M. J., Stanley, R. H. R., and Steinberg, D. K.: Prediction of the export and fate of global ocean net primary production: The EXPORTS science plan, Front. Mar. Sci., 3, 22, https://doi.org/10.3389/fmars.2016.00022, 2016.
Siegel, D. A, DeVries, T., Cetinić, I., and Bisson, K. M.: Quantifying the ocean's biological pump and its carbon cycle impacts on global scales, Annu. Rev. Mar. Sci., 15, 18.1–18.28, https://doi.org/10.1146/annurev-marine-040722-115226, 2023.
Simon, M., Grossart, H.-P., Schweitzer, B., and Ploug, H.: Microbial ecology of organic aggregates in aquatic ecosystems, Aquat. Microb. Ecol., 28, 175–211, https://doi.org/10.3354/ame028175, 2002.
Stemmann, L., Jackson, G. A., and Gorsky, G.: A vertical model of particle size distributions and fluxes in the midwater column that includes biological and physical processes – Part II: application to a three year survey in the NW Mediterranean Sea, Deep-Sea Res. Pt. I, 51, 885–908, https://doi.org/10.1016/j.dsr.2004.03.002, 2004.
Stukel, M. R., Song, H., Goericke, R., and Miller, A. J.: The role of subduction and gravitational sinking in particle export, carbon sequestration, and the remineralization length scale in the California Current Ecosystem, Limnol. Oceanogr., 63, 363–383, https://doi.org/10.1002/lno.10636, 2018.
Sweeney, E. N., McGillicuddy, D. J., and Buesseler, K. O.: Biogeochemical impacts due to mesoscale eddy activity in the Sargasso Sea as measured at the Bermuda Atlantic Time Series (BATS) site, Deep-Sea Res. Pt. II, 50, 3017–3039, https://doi.org/10.1016/j.dsr2.2003.07.008, 2003.
Turner, J. T.: Zooplankton fecal pellets, marine snow, phytodetritus and the ocean's biological pump, Prog. Oceanogr., 130, 205–248, https://doi.org/10.1016/j.pocean.2014.08.005, 2015.
Valiente, S., Fernández-Castro, B., Campanero, R., Marrero-Díaz, A., Rodríguez-Santana, A., Gelado-Cabellero, M. D., Nieto-Cid, M., Delgado-Huertas, A., Arístegui, J., and Álvarez-Salgado, X. A.: Dissolved and suspended organic matter dynamics in the Cape Verde Frontal Zone (NW Africa), Progress in Oceanography, 201, 102727, https://doi.org/10.1016/j.pocean.2021.102727, 2022.
van der Jagt, H., Wiedmann, I., Hildebrandt, N., Barbara, N., and Iversen M. H.: Aggregate feeding by the copepods Calanus and Pseudocalanus controls carbon flux attenuation in the arctic shelf sea during the productive period, Front. Mar. Sci., 7, 543124, https://https://doi.org/10.3389/fmars.2020.543124, 2020.
Volk, T. and Hoffert, M. I.: Ocean carbon pumps: Analysis of relative strengths and efficiencies in ocean-driven atmospheric CO2 changes, in: The Carbon Cycle and Atmospheric CO2: Natural Variations Archean to Present, edited by: Sundquist, E. T. and Broecker, W. S., American Geophysical Union, Washington, DC, pp. 99–110, https://doi.org/10.1029/GM032p0099, 1985.