the Creative Commons Attribution 4.0 License.
the Creative Commons Attribution 4.0 License.
 | 12 Jun 2026
Denitrification as the dominant process in nitrous oxide production in the water column of two eutrophic reservoirs
Elizabeth Leon-Palmero
Claudia Frey
Bess B. Ward
Rafael Morales-Baquero
Isabel Reche
Reservoirs are important sites for nitrogen cycling and a significant global source of the potent greenhouse gas nitrous oxide (N2O). They receive nitrogen inputs from agriculture and urban sources, fueling N2O production via nitrification, denitrification, and photochemodenitrification. However, existing estimates of N2O production in reservoirs remain uncertain because most studies have focused on N2O in rivers or lake sediments, often overlooking the water column of lentic systems. Here, we present the first integrated assessment of N2O production pathways in reservoir water columns using stable isotope tracer incubations alongside analyses of in situ natural abundance of nitrogen pools and functional genes involved in nitrification (amoA) and denitrification (nirS), across two eutrophic reservoirs with contrasting morphometries. We used 15N- and 15N- tracers to quantify rates of N2O production, nitrification, and nitrate reduction at the beginning and the end of the stratification period. Notably, nitrate concentration decreased by up to 49 % over the two months. N2O production from ammonium ranged from 0.02 to 48.6 nmol N L−1 d−1, while N2O production from nitrate varied from 0.2 to 61.0 . High rates of nitrification, nitrate reduction to nitrite, and rapid nitrite turnover were observed, with total N2O production significantly correlated with nirS gene abundance. A strong positive correlation was found between δ15N- and both N2O concentration and nirS abundance. These findings reveal that denitrification and nitrite dynamics play a central role in N2O formation within reservoir water columns, advancing understanding of nitrogen loss and greenhouse gas emissions from lentic systems.
- Article
(3895 KB) - Full-text XML
-
Supplement
(769 KB) - BibTeX
- EndNote


Reservoirs created by damming rivers are an important global source of the greenhouse gas nitrous oxide (N2O) to the atmosphere (Li et al., 2024; Wang et al., 2023). N2O is about 273 times as potent as carbon dioxide for atmospheric warming on a 100-year time horizon (IPCC, 2021), and is the main driver of stratospheric ozone depletion (Ravishankara et al., 2009). Reservoirs receive substantial nitrogen (N) loading from agriculture and urban areas in their watersheds, processing it throughout different microbial and abiotic pathways, and then emitting back a fraction to the atmosphere as dinitrogen gas (N2) and, significantly, as N2O (Leon-Palmero et al., 2025; León-Palmero, 2023). Reservoirs accounted for 50 % (i.e., 0.44 Tg N yr−1) of the total increase in N2O emissions from inland waters between 1900 and 2010 (i.e., 0.89 Tg N yr−1) (Wang et al., 2023). This rapid rise in N2O emissions from reservoirs is linked to the growing number of reservoirs worldwide (Lehner et al., 2011), as well as an increase in N2O production within these systems (Wang et al., 2023). Nevertheless, current estimates of N2O emissions remain highly uncertain because they rely on limited datasets, and direct measurements of N2O production rates in these reservoirs are scarce. Compared to other inland waters such as lakes and rivers, reservoirs have received far less attention, despite processing a disproportionately large fraction of N (Harrison et al., 2009), leading to elevated N2O production rates and substantial emissions (Beaulieu et al., 2015; León-Palmero et al., 2020b, 2023; Rodríguez-Velasco et al., 2024). In fact, in Mediterranean reservoirs, N2O emissions can occasionally surpass the combined climatic forcing of CO2 and CH4 (e.g., Iznájar reservoir, León-Palmero et al., 2020b). A recent study even estimated that N2O accounted for more than 80 % of the total GHG emissions from hydroelectric reservoirs in China in 2020 (Chen et al., 2025). Therefore, it is crucial to quantify these production rates and understand the factors controlling N2O production in reservoirs, especially considering the global increase in reservoir construction (Zarfl et al., 2015).
Microbial transformations that lead to the production and consumption of N2O include ammonia oxidation, nitrifier denitrification, and denitrification, and they are affected by the availability of N-substrates, dissolved oxygen (DO), and phosphorus availability (Beaulieu et al., 2015; Codispoti, 2010; Ji et al., 2018; León-Palmero et al., 2023). N2O is a byproduct of ammonia oxidation to nitrite (i.e., first step of nitrification), which is performed by ammonia-oxidizing bacteria (AOB) and ammonia-oxidizing archaea (AOA) in oxygenated waters (Könneke et al., 2005; Kowalchuk and Stephen, 2001), with the latter dominating in Mediterranean reservoirs (León-Palmero et al., 2023). At low oxygen concentrations, nitrifiers increase the yield of N2O production, relative to the ammonium () oxidized, by nitrifier denitrification (via AOB), hybrid formation (AOA), or hydroxylamine oxidation (AOA), although some details of the reactions remain unresolved (Stein, 2019; Wan et al., 2023; Ward, 2013). Lastly, denitrification is the reduction of nitrate () to nitrite (), nitric oxide (NO), N2O, and N2, coupled to organic matter oxidation. Hence, denitrification can act as a source or sink of N2O depending on the rate of N2O reduction to N2, which is catalyzed by the enzyme N2O reductase. Denitrification is an anaerobic pathway, and oxygen regulates the activity of the denitrifying enzymes, especially the N2O reductase (Bonin et al., 1989; Zumft, 1997). Therefore, at low but non-zero oxygen concentrations, N2O reductase might be inhibited, promoting partial denitrification and resulting in net N2O production. Moreover, many bacteria can denitrify in both oxic and anoxic conditions (Hochstein et al., 1984; Lloyd et al., 1987), and the presence of denitrifying bacteria has been demonstrated in the oxic and anoxic water column of lakes (Junier et al., 2008; Kim et al., 2011; Pajares et al., 2017) and reservoirs (León-Palmero et al., 2023).
Moreover, other specific factors may influence the production, accumulation, and emission of N2O in reservoirs, such as morphometry (i.e., depth and shape) and water residence time (Hayes et al., 2017; Liang et al., 2019). The morphometry of a reservoir and water residence time affect thermal and oxygen stratification, as well as N2O storage in the water column. Deep reservoirs can produce and accumulate large concentrations of N2O in the hypolimnion during thermal stratification, particularly under anoxic conditions and high N concentrations. In contrast, denitrification can be a sink of N2O in the anoxic hypolimnion when N concentration is low (Beaulieu et al., 2015; León-Palmero et al., 2023). Shallow systems tend to emit N2O continuously due to weak thermal stratification and less capacity to accumulate N2O. Further studies on N2O production in the water column of reservoirs with different morphometries are required to improve our knowledge of N2O emissions. To address this gap, we present the first integrated assessment of N2O production pathways in reservoir water columns, combining stable isotope tracer incubations with analyses of in situ natural abundances of the N pools and functional genes involved in N2O cycling to quantify N2O production rates and trace the origin of the N2O in the water column of two reservoirs. We used 15N- to quantify the rates of N2O production from , and ammonia oxidation to nitrite and nitrate; and 15N-NO to trace the formation of N2O and from NO reduction. Incubations were performed at three depths at the beginning and end of summer stratification. We selected a shallow and a deep reservoir (Cubillas and Iznájar, respectively) located in watersheds with high N inputs, both of them monomictic with significant emissions and concentrations of N2O (León-Palmero et al. 2020b, 2023), providing an ideal setting to explore N2O cycling.
2.1 Study reservoirs, morphometry, and watersheds
This study was conducted in southeastern Spain (Fig. S1) in two monomictic reservoirs with contrasting morphometries. Cubillas (37.27° N, 3.68° W) is a small and shallow reservoir with a surface area of 1.94 km2 and a total capacity of 19 hm3 (mean depth = 9.66 m). Iznájar (37.26° N, 4.33° W) is a big and deep reservoir with a surface area of 26 km2 and a total capacity of 981 hm3 (mean depth = 37.55 m) (open database IDEAndalucia; https://www.ideandalucia.es/portal/, last access: 13 March 2024). Both reservoirs are impacted by large agricultural and urban areas in their watersheds, which results in large inputs of N and phosphorus (León-Palmero et al., 2020b, 2023). More information about the watersheds, morphometry, and water column characterization is provided in previous studies (e.g., León-Palmero et al., 2020a, b).
We sampled the water column of these reservoirs at the beginning (4 and 9 July) and the end (5 and 7 September) of the summer stratification in 2018. During the study period, intense human usage caused a decline in the volume and water level in both reservoirs, although this decline was more evident in the smaller reservoir (i.e., Cubillas). Cubillas reservoir decreased in volume from 17 hm3 in July to 11 hm3 in September and experienced a 3.4 m reduction in the water level. The hydraulic residence time during the study period was 83 d. Iznájar reservoir decreased in volume from 575 hm3 in July to 480 hm3 in September, with a 5.4 m reduction in the water level. The hydraulic residence time was 255 d during this period. The reservoir volumes and water levels on specific dates were obtained from the Confederación Hidrográfica del Guadalquivir open database (CHG; https://www.chguadalquivir.es/saih/, last access: 13 March 2024).
2.2 Vertical profiles and biogeochemical characterization
We sampled the water column near the dam, in the open water of the reservoir, at the same location during both the July and September campaigns. First, we conducted a vertical profile of the water column using a Sea-Bird 19plus CTD profiler, obtaining continuous measurements of temperature (°C), dissolved oxygen (DO, µmol L−1), and conductivity (µS cm−1) in the reservoirs. Based on the temperature and DO profiles, we sampled three depths representing the epilimnion, oxycline, and hypolimnion or bottom waters. Water was collected at these three depths using a 5 L UWITEC bottle for further analyses and incubation experiments.
Samples for dissolved N2O analysis were taken in 250 mL air-tight Winkler bottles in duplicate, preserved with a solution of HgCl2 (final concentration 1 mmol L−1) to inhibit biological activity, and sealed with Apiezon® grease to prevent gas exchange. Samples were stored in the dark at a controlled temperature (25 °C) for less than six months until analysis at the University of Cádiz. Dissolved N2O concentration was measured using headspace equilibration in a 50 mL air-tight glass syringe in triplicate in each bottle from each sample. N2O concentration was quantified using a daily calibrated gas chromatograph (Bruker® GC-450) as detailed in a previous study (León-Palmero et al., 2023).
Water samples for chemical and biological analysis were maintained at 4 °C until arrival at the laboratory. Particulate material from 500 to 1000 mL of water was filtered through pre-combusted (450 °C for 3 h) Whatman GF/F glass-fiber filters with a nominal pore size of 0.7 µm. Chlorophyll a (Chl a) was extracted from the filtered material and measured following the standard method (APHA, 1992). To obtain the cumulative Chl a (a proxy for fresh organic matter exported to the water column) in the whole water column (mg Chl a m−2) from the discrete depths, we summed the concentration of Chl a of each stratum using the trapezoidal rule (León-Palmero et al., 2020a). Dissolved organic carbon (DOC), , , and were assayed in the filtered water. Samples for DOC determination were acidified with phosphoric acid (final pH <2) and measured by high–temperature catalytic oxidation using a Shimadzu total organic carbon analyzer (Model TOC-V CSH) (Álvarez-Salgado and Miller, 1998). concentration was assayed using the UV spectrophotometric method at the wavelength of 220 nm and correcting for DOC absorbance at 275 nm (APHA, 1992). and concentrations were measured by Inductively Coupled Plasma Optical Emission Spectrometry at the Centro de Instrumentración Científica of the Universidad de Granada.
2.3 Natural abundance of stable isotopes (δ15N and δ18O)
Two 60 mL glass serum bottles per depth were collected after overflow without headspace and poisoned with HgCl2 to analyze the natural isotopic composition (δ15N) of the ambient pools of N2O, , and . Samples were maintained in darkness at room temperature for under six months before shipment to Princeton University for analysis. A 3 mL headspace was created with He before measuring the N2O, including standards with a known amount of N2O gas and internal standards for 15N-N2O. The total N2O in each bottle was extracted by purging with helium for 35 min at 38 mL min−1. Then, N2O was trapped by liquid nitrogen and isolated from interference by gas chromatography (Frey et al., 2020; Ji et al., 2015). We detected the nitrogen masses 44 (i.e., 44N2O representing 14N14N16O), 45 (i.e., 45N2O representing 14N15N16O or 15N14N16O), and 46 (i.e., 46N2O representing 15N15N16O), and the isotope ratios , with a GC-IRMS system (Delta V Plus, Thermo). Standards in 20 mL glass vials with a known amount of N2O gas were measured every two to three samples to calibrate for the N2O concentration. The total N2O concentration and and ratios were converted to moles of 44N2O, 45N2O and 46N2O. Both δ15N-N2O (‰) vs. Air-N2 and δ18O-N2O (‰) vs. Vienna Standard Mean Ocean Water (VSMOW) were determined. Isotope measurements were linearity and offset corrected using an internal N2O reference gas with known isotopic composition. The N2O reference had the following isotopic composition: δ15N = ‰ and δ18O = 37.37±0.27 ‰ present in 45N2O and 46N2O. Ideally, two known N2O reference gases would have been used for correction; however, due to this limitation, natural abundance isotope data were used to analyze trends in the sample dataset, rather than making comparison with previous studies.
The natural isotopic composition of the , and pools (i.e., δ15N- and δ15N-) were determined by converting these compounds to N2O and analyzing the isotopic composition of the resulting N2O. was converted to N2O by using the azide method (McIlvin and Altabet, 2005). Sample size was adjusted to contain 10 nmol of , transferred into 20 mL glass vials, and purged with He for 10 min. The was then converted to N2O using sodium azide in acetic acid. During this reaction, one N from azide is transferred into the N2O molecule; hence the resulting values were corrected by multiplying by 0.5. The 15N-N2O generated was measured on a Delta V Plus (Thermo) as described above.
We used the denitrifier method to convert to N2O (Granger and Sigman, 2009; Sigman et al., 2001; Weigand et al., 2016). The method is based on the isotopic analysis of the N2O generated from the by denitrifying bacteria that lack N2O-reductase activity (i.e., Pseudomonas chlororaphis). Sample size was adjusted to 20 nmol nitrate . The 15N-N2O generated was measured on a Delta V Plus (Thermo) as described above. We included known isotope international standards (USGS34 and IAEA N3) and converted them to N2O using the denitrifier method to correct δ15N-N2O values.
2.4 Functional genes
The abundance of unique functional genes involved in N2O cycling was quantified using quantitative PCR (qPCR), similarly to a previous study (León-Palmero et al., 2023). We pre-filtered water samples through 3 µm pore size filters, and concentrated the samples by centrifugation, then extracted DNA following Boström et al. (2004), and applied PCR and qPCR to assess presence, and abundance of target genes. We used standard reaction mix recipes, thermocycling conditions, and primer requirements specified by the manufacturer. Specific primers were selected from studies performed in natural freshwater samples when available. DNA from pure cultures was used as positive controls and for qPCR standard preparation. We targeted ammonia oxidizers using the archaeal amoA gene, as AOA dominated over AOB in these reservoirs (León-Palmero et al., 2023). Comammox amoA genes were targeted in PCR assays using degenerate PCR primers for clades A and B (Pjevac et al., 2017), but no positive control was available in this case. The nirS gene abundance was used as a proxy for denitrifiers, while nosZ gene (Clade I) abundance was assessed only at the deepest layer, assayed only bacteria reducing N2O to N2. More details on the DNA extraction method, qPCR quantification, primers, specific conditions, standards, and positive controls are provided in the Supplement (Sect. S1).
2.5 Experimental setup of 15N tracer incubations
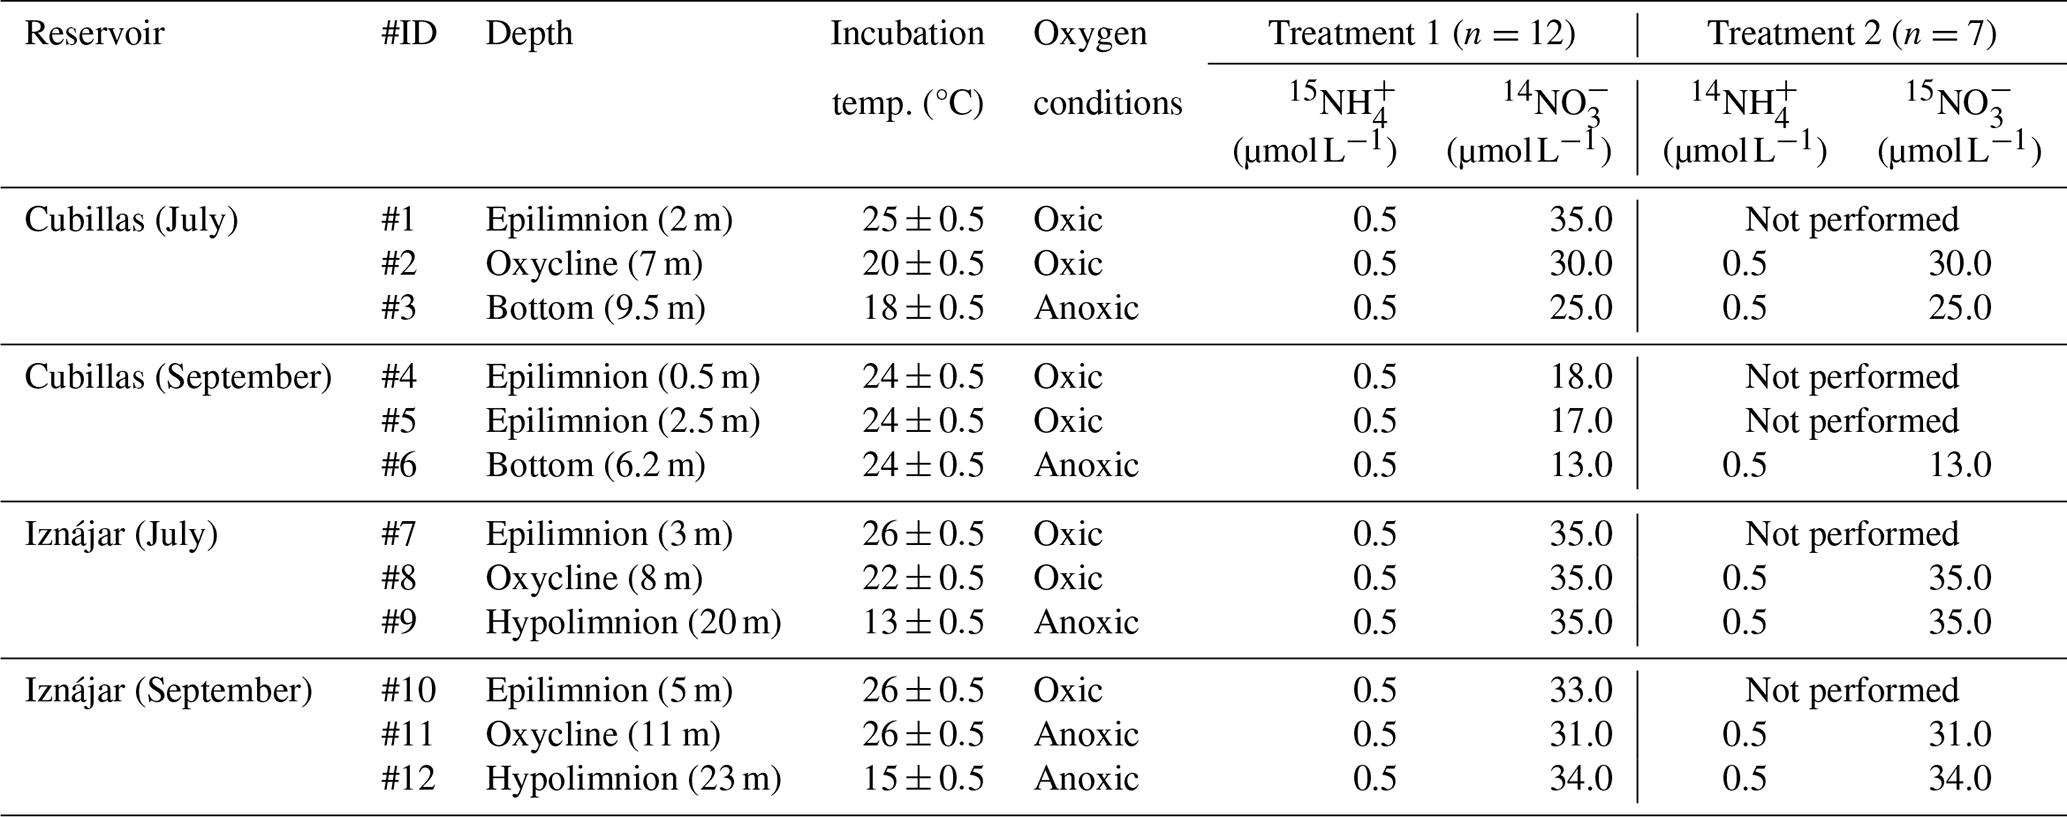
Reservoir water from the three depths was drawn from the sampling bottle into 60 mL glass serum bottles after overflow. Once in the lab, samples from oxic water depths (refer to Table 1) were purged uncapped for 2 min to remove excess N2O, and a 3 mL headspace with ambient air was maintained after being exposed to ambient air for 30 min. Samples from anoxic waters were sealed with butyl rubber septa and crimped with aluminum seals immediately after filling. In these samples, a 3 mL helium headspace was retained after purging for 4 min. The serum bottles were weighed before and after filling them to account for the exact water volume in each sample. Table 1 compiles the incubation setup, conditions, and concentration of inorganic nitrogen added in each treatment. In the first treatment, we injected nine bottles from the same depth with 15N- tracer (15NH4Cl ≥ 98 atom % 15N, Sigma Aldrich) to a final concentration of 0.5 µmol L−1, obtaining a fraction labeled of the substrate pools between 0.1 and 1.0. In this treatment, we also added 14N-, equivalent to 0.10 of the pool. In the second treatment, 15N- tracer (K15NO3, 98 atom % 15N, Sigma Aldrich) was injected to obtain a fraction labeled of the pool about 0.10. We also added 14N- to a final concentration of 0.5 µmol L−1. Samples were incubated in the dark at the in situ temperatures from 13 to 26 °C (Table 1).
The first treatment () was performed at all the depths (n=12), but the second treatment (15N-NO + 14N-) was performed only at the oxycline and hypolimnion (n=7, Table 1). Incubations were terminated by adding 0.1 mL saturated mercuric chloride (HgCl2) to two bottles at t0 (≈0.25 h), two at t1 (≈1–3 h), two at t2 (≈12 h), and three at t3 (≈24 h). All samples were stored at room temperature in the dark for less than six months and shipped to the laboratory at Princeton University for further analysis.
Table 1Incubation conditions and concentration of inorganic nitrogen compounds added in each treatment. Concentrations are measured in µmol N L−1. More details are provided in the main text.
2.6 15N-N2O production rates from 15NH and 15NO
The total N2O in each incubation bottle was extracted by purging with helium and measured with a GC-IRMS system (Delta V Plus, Thermo) as explained above. We included standards in 20 mL glass vials with a known amount of N2O gas every two to three samples to calibrate for the N2O concentration. The total N2O concentration and and ratios were converted to moles of 44N2O, 45N2O and 46N2O. N2O production rates for each treatment were calculated from the slope of the increase in mass 45 and 46 during the linear phase over the four timepoints. The N2O production (, ) was calculated according to the following Eq. (1) (Santoro et al., 2020):
where Δ45N2O and Δ46N2O represent the variation in the concentration of 45N2O and 46N2O over the incubation time (Δt), and the FN represents the fraction of 15N in the initial substrate pool ( or ), which is assumed to be constant over the incubation time. The equation includes an extra factor of (FN)−1 to account for the probability of 46N2O production, which is proportional to (FN)−2. Natural abundance 1000 ppm N2O carrier gas (50 µL in He) was injected before measurement to trap the produced labeled N2O and to ensure a sufficient mass for isotope analysis.
2.7 15N- production
After N2O analysis, we analyzed the samples incubated with 15NH and 15NO for 15NO production to determine the rates of oxidation to NO (ammonia oxidation), and NO reduction to (first step of denitrification). The was converted to N2O by using the azide method (McIlvin and Altabet, 2005), and the 15N-N2O generated was measured on a Delta V Plus (Thermo) following the procedure and corrections described earlier. The rates of oxidation to NO (, ) and first step in denitrification (, ) were calculated following Eqs. (2), (3):
where Δ[15NO] represents the variation in the concentration of 15NO, represents the fraction of 15NH in the initial substrate pool, represents the fraction of 15NO in the initial substrate pool, and Δt is the incubation time. Each rate was calculated from the first two time points, and two or three replicates per time point. Additionally, we also calculated the turnover time of (, days), which represents the average time required to replace the nitrite pool given the measured production rate following Eq. (4):
where [] represents the concentration of NO (nmol N L−1), and represents the production rates of from (nmol N L−1 d−1).
2.8 15N- production
15NO production rate was measured by the increase in 15NO in the samples incubated with 15NH. We converted to N2O using the denitrifier method (Granger and Sigman, 2009; Sigman et al., 2001; Weigand et al., 2016), and analyzed the resulting 15N-N2O following the previously outlined procedure and corrections. Net production of 15NO (, ) is referred to here as nitrification (i.e., it includes the two-step process of oxidizing ammonium to nitrite to nitrate) and was calculated following Eq. (5):
where Δ[15NO] represents the variation in the concentration of 15NO, represents the fraction of 15NH in the initial substrate pool, and Δt is the incubation time. Each rate was calculated from the first two time points, and two or three replicates per time point.
2.9 Determination of N2O yields
The N2O yield during oxidation to (N2O−yieldAmox, %) was defined as the percent of the total N transformed to N2O during the incubation with 15N- (Eq. 6):
The N2O yield during nitrification (i.e., oxidation to ) (N2O−yieldNit, %) was defined as the percent of the total transformed to N2O during the incubation with 15N- (Eq. 7):
The N2O yield during denitrification (N2O−yieldDenit, %) was calculated as follows (Eq. 8):
2.10 Data analysis
Statistical analyses were conducted in R (R Core Team, 2014) version 4.4.0. Data visualization was also performed in R, with final figure adjustments made using Inkscape (Inkscape Project, 2017). We assessed normality using the Shapiro-Wilk test of normality analysis and homogeneity of variances across groups using Levene's test. For normally distributed data with equal variances, we applied one-way ANOVA (F). When normality was met but variances were unequal, we used Welch's t test. For data that violated normality assumptions, we employed the Kruskal–Wallis rank-sum test (K–W) or the Wilcoxon test (W). Outliers were identified using the Grubbs test (G). Statistical significance was set at p<0.05. Linear regressions were used throughout the study to evaluate the rates and drivers of N2O concentration and production. Model assumptions were assessed, and the model performance evaluated using adjusted R2 values and predictor significance was determined using p values (α=0.05). Each sample was assigned a unique identifier (#1–12), which is shown in Table 1 and in the figures to facilitate data interpretation and highlight observed trends.
3.1 Dissolved N2O and other biogeochemical variables in the vertical profiles
The water column of Cubillas reservoir was thermally stratified in July (16.5–25.9 °C), such that DO varied dramatically with depth, with a DO peak at the top of the thermocline (400 µmol L−1, 5.6 m) and decreasing concentrations until anoxia at 8 m (Fig. 1a). Dissolved N2O concentration increased from 0.11 in the epilimnion to 6.38 µmol N L−1 at the bottom of the reservoir. The decrease in the water level during the summer months due to human management presumably caused the mixing of the water column at the end of the summer, as evidenced in the homogenization of the temperature and DO profiles (Fig. 1a). Dissolved N2O distribution remained mostly homogeneous in September, ranging from 0.22 to 0.42 µmol N L−1 (Fig. 1a, Table S1 in the Supplement). The water column was always supersaturated in N2O. concentration decreased significantly from July to September (Fig. 1a, Table S1). The average concentration was reduced by half, from 321.2 µmol N L−1 in July to 162.4 µmol N L−1 in September. concentration varied from 13.8 to 33.0 µmol N L−1 (mean = 22.0 µmol N L−1). concentration was below detection level at some depths, peaking at 4.3 and 6.9 µmol N L−1 in bottom waters. DOC concentrations varied from 217.6 to 247.7 µmol C L−1 (Table S1), and Chl a concentrations ranged from 5.4 to 18.1 µg L−1 (Fig. 1, Table S1).
Iznájar reservoir's water level decreased by over 5 m in summer, but thermal and oxygen stratification persisted due to its greater depth relative to Cubillas (Fig. 1b). The water column was always supersaturated in N2O (Table S1). Dissolved N2O increased with depth and over time, ranging from 0.05 to 0.26 µmol N L−1 in July, up to 3.60 µmol N L−1 in September, with the larger increase in the hypolimnion (Fig. 1b, Table S1). concentration also decreased from July to September, from 373.7 to 329.3 µmol N L−1 (average values, Fig. 1b), with the lowest values at the oxycline, where peaked. was only detected in the oxycline in July and in the hypolimnion in September, with values of 5.7 and 8.7 µmol N L−1, respectively. The DOC concentrations varied from 186.0 to 228.0 µmol C L−1, and the Chl a concentrations from 3.8 to 12.4 µg L−1 (Fig. 1, Table S1).
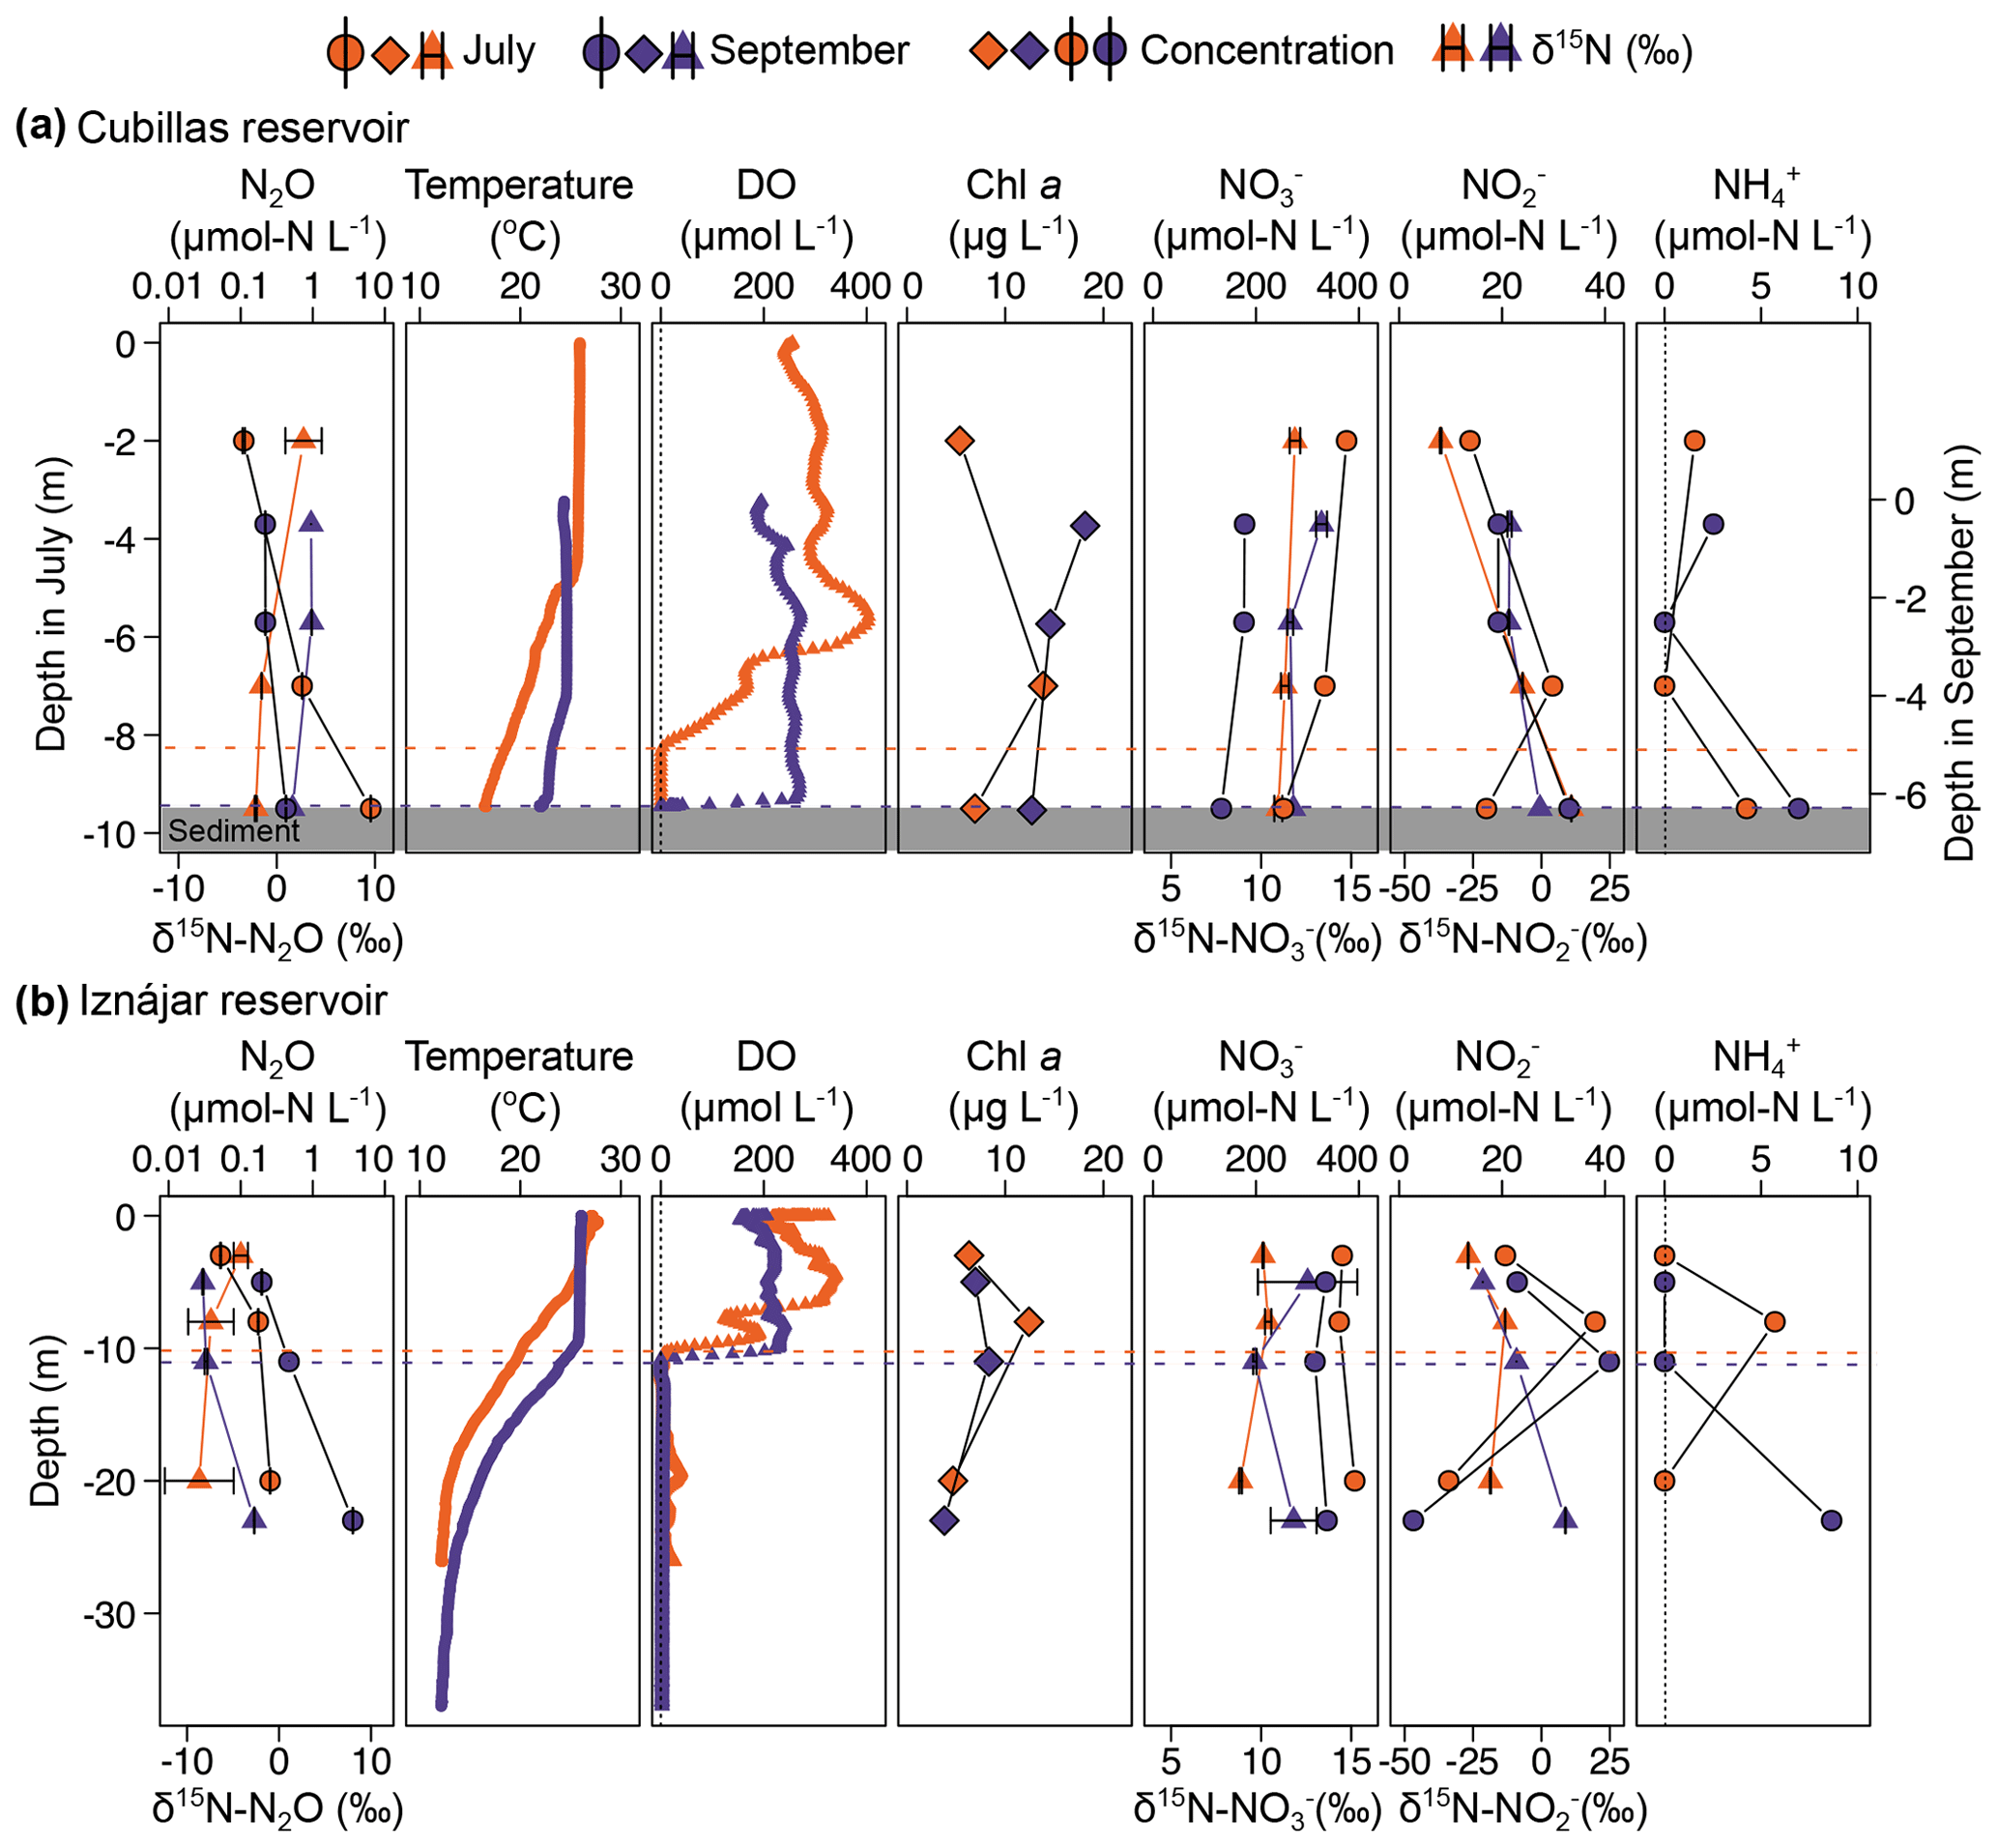
Figure 1Physico-chemical profiles of Cubillas (a) and Iznájar (b) reservoirs. The color scheme for all data is the same for both reservoirs: July (orange) and September (purple). N2O concentration (µmol N L−1, mean ± standard error) and natural abundance (δ15N-N2O, ‰), water temperature (°C), DO concentration (µmol L−1), Chl a concentration (µg L−1), and the concentrations (µmol N L−1) and natural abundances (δ15N, ‰) of , and . The dashed lines represent the suboxic zone (DO <10 µmol L−1).
3.2 Changes in concentration and isotopic composition of N2O and inorganic nitrogen
Figure 1 and Table S2 illustrate depth distributions of DIN concentrations and isotopic compositions. Relationships between DIN concentrations and isotopic compositions are shown in Fig. 2. The natural abundance δ15N-N2O in the Cubillas reservoir ranged from −2.1 ‰ in the bottom waters in July to 3.6 ‰ in the epilimnion in September, while the δ15N-N2O in the Iznájar reservoir ranged from −8.7 ‰ in the hypolimnion in July to −2.3 ‰ in the hypolimnion in September (Figs. 1 and 2). The δ18O-N2O ranged from 41.6 ‰ in the bottom waters of the Cubillas reservoir in July to 64.4 ‰ in the bottom waters of the Cubillas reservoir in September (Fig. 2b, c). δ15N- was consistently positive (i.e., 15N enriched pool) in all the samples analyzed, and it varied from 8.9 ‰ to 13.4 ‰ (Fig. 2e). In the Iznájar reservoir, concentration also decreased from July to September, along with an increase in δ15N- (e.g., Fig. 2e, #7–9). In the study reservoirs, δ15N- varied more than δ15N-. In general, δ15N- increased with depth, showing changes in a few meters, from 15N-depleted to 15N-enriched values, except for the Iznájar reservoir in the July sampling (Fig. 1b).
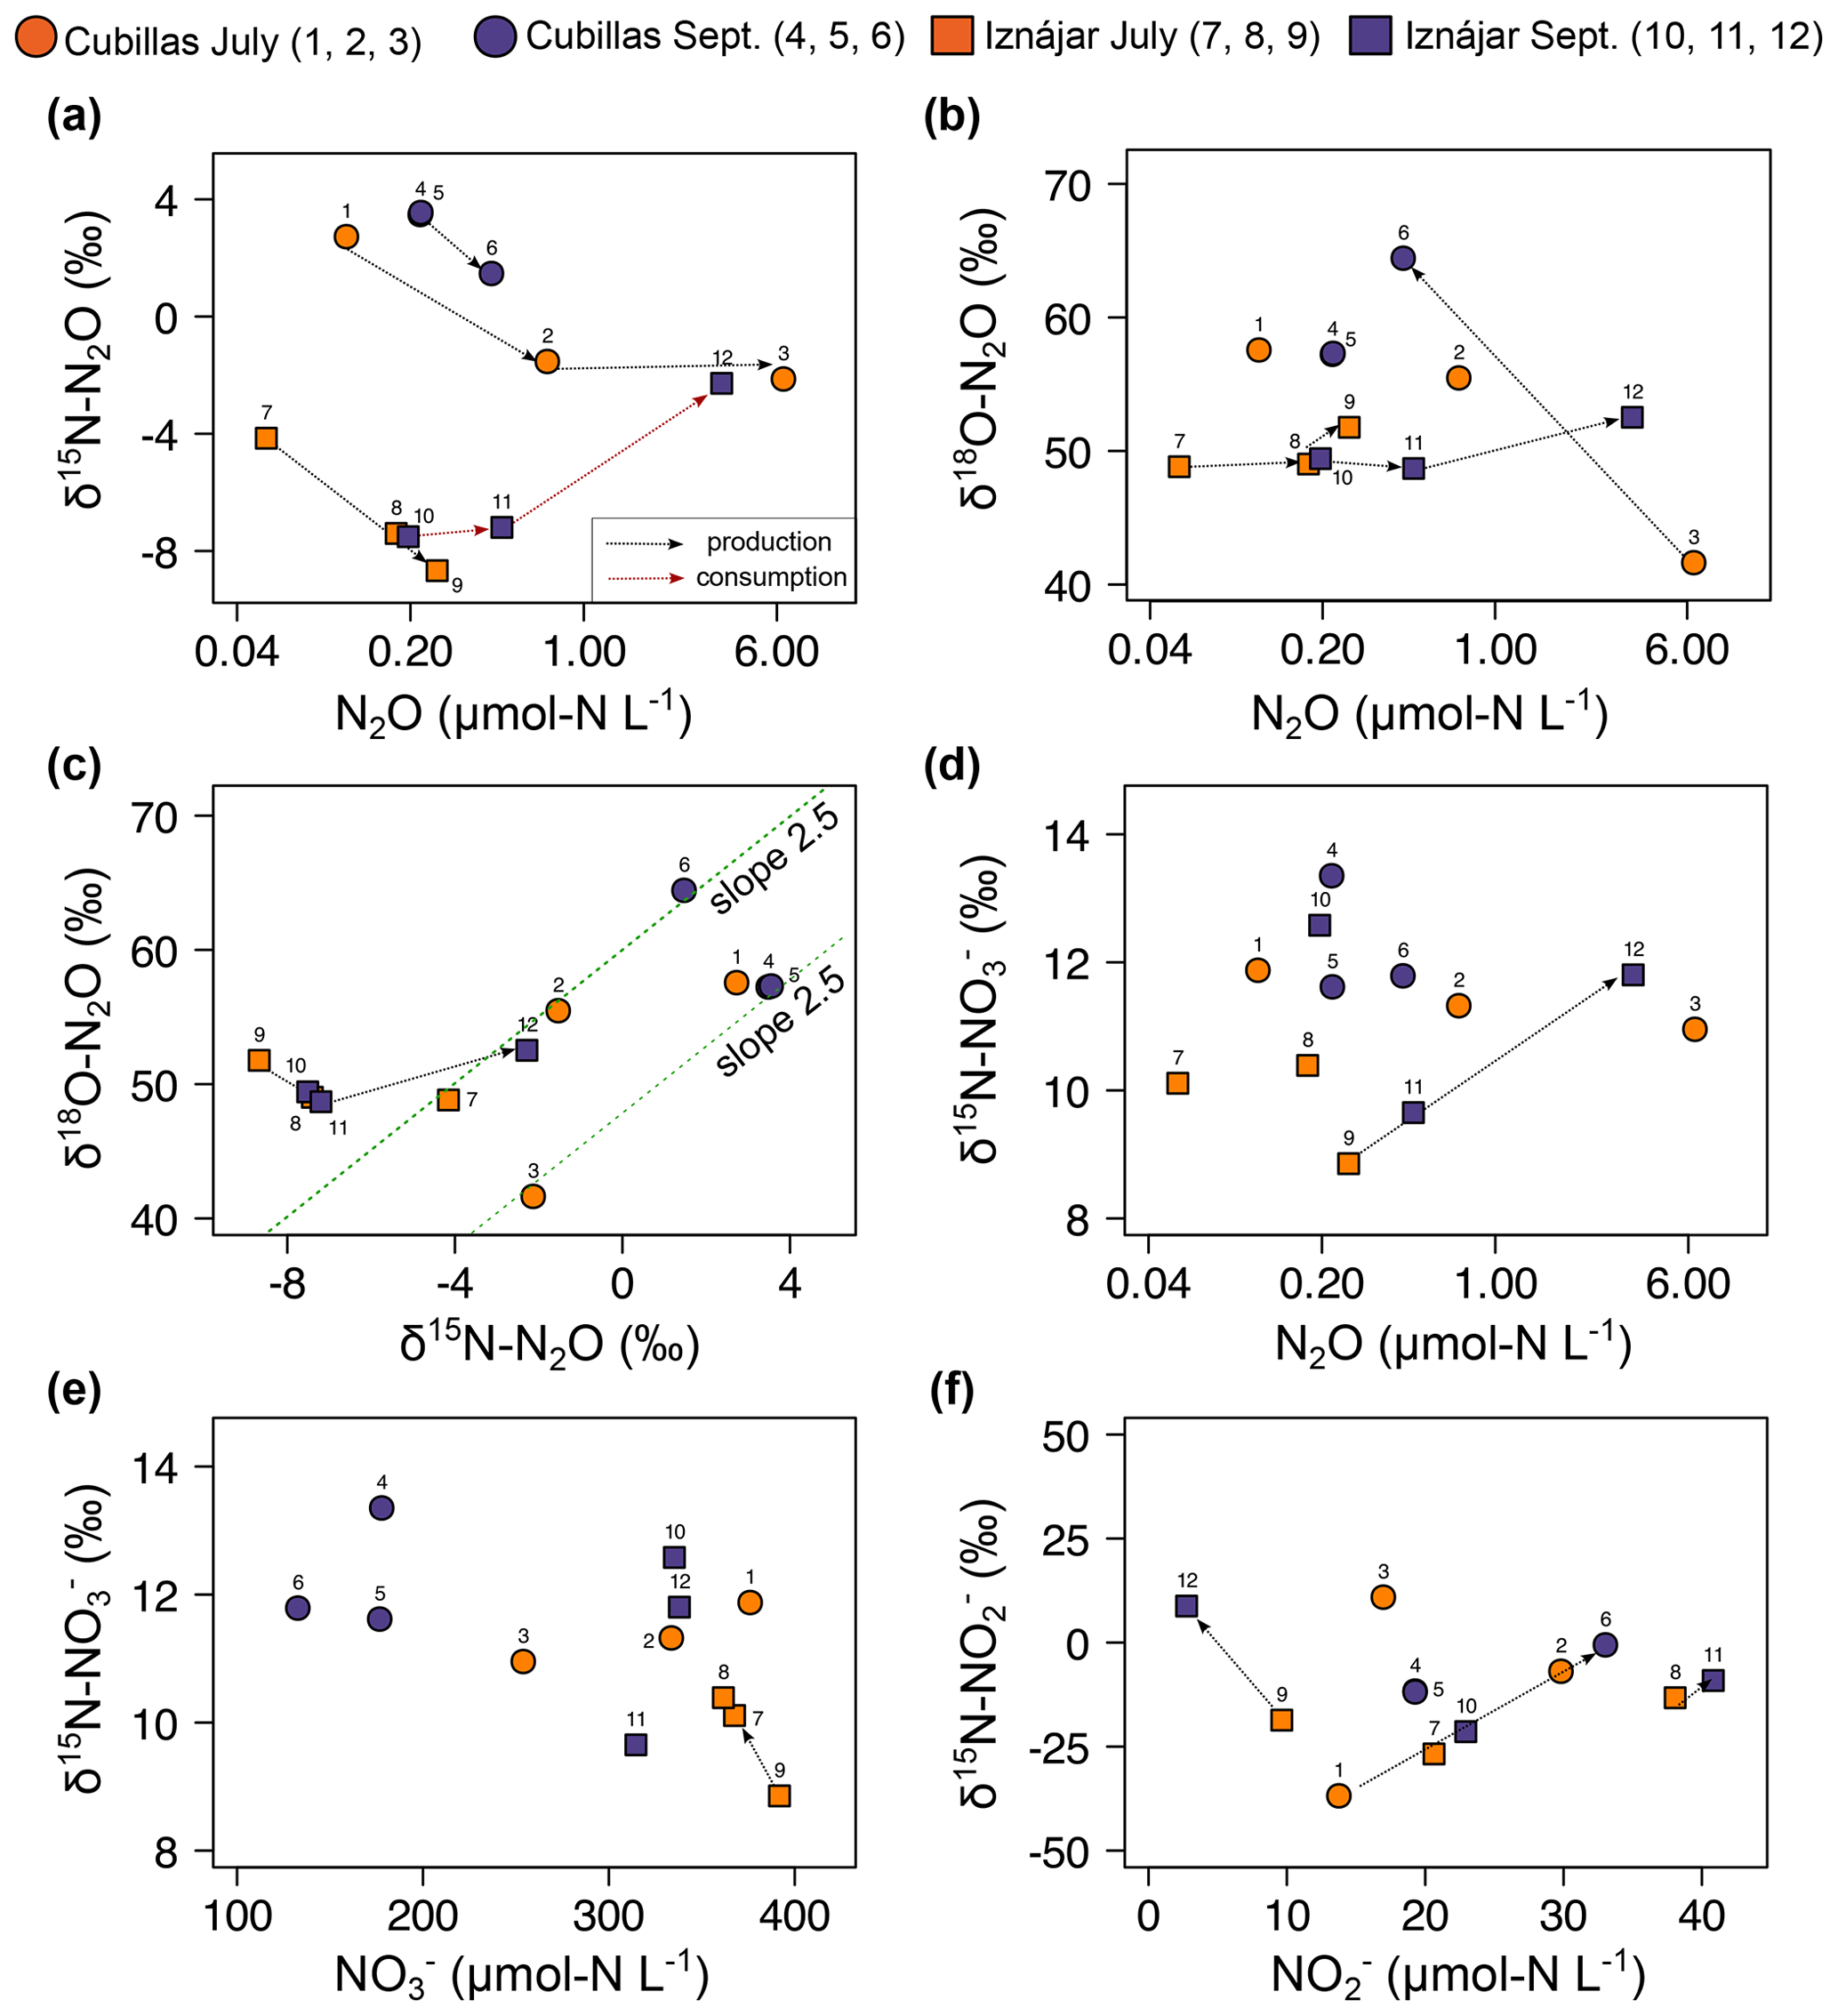
Figure 2Relationships between the concentrations of the dissolved N2O, , and (µmol N L−1), and their natural isotopic compositions. Note the logarithmic scales in the N2O concentration axis. The lines represent the trends over depth or time mentioned in the Discussion. The slope in (c) is indicative of active N2O reduction (Ostrom et al., 2007). Correspondence between numbers and samples is shown in Table 1 and Figs. 3 and 4. In panel (a), the red line represents the trend associated with N2O consumption, whereas the black lines represent trends associated with N2O production.
3.3 Distribution of N2O production and nitrification rates from 15N-
N2O production from ranged from 0.06 to 48.57 in the Cubillas reservoir (Fig. 3), and from 0.02 to 3.72 in the Iznájar reservoir (Fig. 4) (n=12, Table S3). Ammonia oxidation rates (i.e., production from NH, ) were only significant in Iznájar's hypolimnion in September, reaching 215.8±38.0 ( %) (Table S3). In contrast, significant nitrification rates (i.e., production from , ) were detected at all study depths except in the hypolimnion of Iznájar in September (Figs. 3 and 4, Table S3). Nitrification rates varied from 6.1 to 56.1 in Cubillas, and from 0.0 to 36.7 in the Iznájar reservoir. The nitrification rates were significantly higher in July (mean ± SD = 24.6±19.4 ) than in September (7.3±6.7 ), and in Cubillas (mean ± SD = 22.2±17.9 ), than in the Iznájar reservoir (9.6±13.6 ) (p<0.05, in both cases). The N2O yields during nitrification (N2O−yieldNit) varied from 0.000 % to 0.086 %, with the maximum yield observed in the bottom waters of Cubillas in July (Table S3). The production of N2O from was significantly correlated with the in situ concentration except in the hypolimnion of both reservoirs in September (n=10, adj R2=0.44, p<0.05) (Fig. 5a). These two samples, which were excluded from this analysis, contained the highest concentrations (>6 µmol L−1). The N2O production from was an exponential function of the nitrification rates (Fig. 5b, adj R2=0.60, p<0.01).
3.4 Distribution of N2O production and reduction rates from 15N-
N2O production from varied from 0.2 to 18.1 in the Cubillas reservoir, and from 0.4 to 61.0 in the Iznájar reservoir (Figs. 3 and 4, Table S3). The highest rates were detected in the oxyclines. reduction to (i.e., first step of denitrification, ) varied from 13.7 to 33.2 in Cubillas, and from 10.1 to 28.6 in the Iznájar reservoir. reduction rates were significantly higher in July (27.5±7.0 ) than in September (12.2±1.9 ) (p<0.05). This decrease in the reduction rates was accompanied by a decrease in the concentration from July to September in both reservoirs. Among all the samples, turnover varied from 0.2 d in the hypolimnion to 4.1 d in the oxycline of Iznájar in September (Table S3). The N2O yield of reduction (N2O−yieldDenit) varied from 0.001 % to 0.132 % in the Cubillas reservoir, and from 0.003 % to 0.603 % in the Iznájar reservoir. The maximum yields occurred in the oxycline of Iznájar reservoir in September and the oxycline-bottom waters of Cubillas in September. N2O production from was not significantly correlated to the in situ concentration (p>0.05).
3.5 In situ abundance of functional genes
The in situ abundance of the functional genes (archaeal amoA, nirS and nosZ) varied with depth, time, reservoirs, and with the N transformation rates (Figs. 3 and 4, Table S4). Archaeal amoA abundance ranged from 0 to 2.7×10³ copies mL−1 (n=12). In the Cubillas reservoir in July, the archaeal amoA gene was detected only in the oxycline, where concentration was maximal and minimal. We detected the archaeal amoA gene at all three depths in September, and its abundance decreased with depth. In the Iznájar reservoir, the archaeal amoA gene was detected at all depths, with the minimum abundance in the oxycline in July. Archaeal amoA abundance wasn't correlated with the N2O concentration (p>0.05), the N2O production rates from (p>0.05), or the nitrification rates (p>0.05).
The nirS abundance ranged from 4.5×10⁴ to 5.3×10⁵ copies mL−1 in Cubillas, and from 8.1×10⁴ to 4.7×10⁶ copies mL−1 in Iznájar (n=12). nirS was present in all the samples, and its abundance increased with depth and over time in Iznájar. The nosZ gene was only quantified in the deepest layers (n=4), where it ranged from 800 to 2.1×10³ copies mL−1 and was higher in September than in July in both reservoirs. N2O production from was not significantly correlated with the in situ nirS gene abundance (p>0.05).
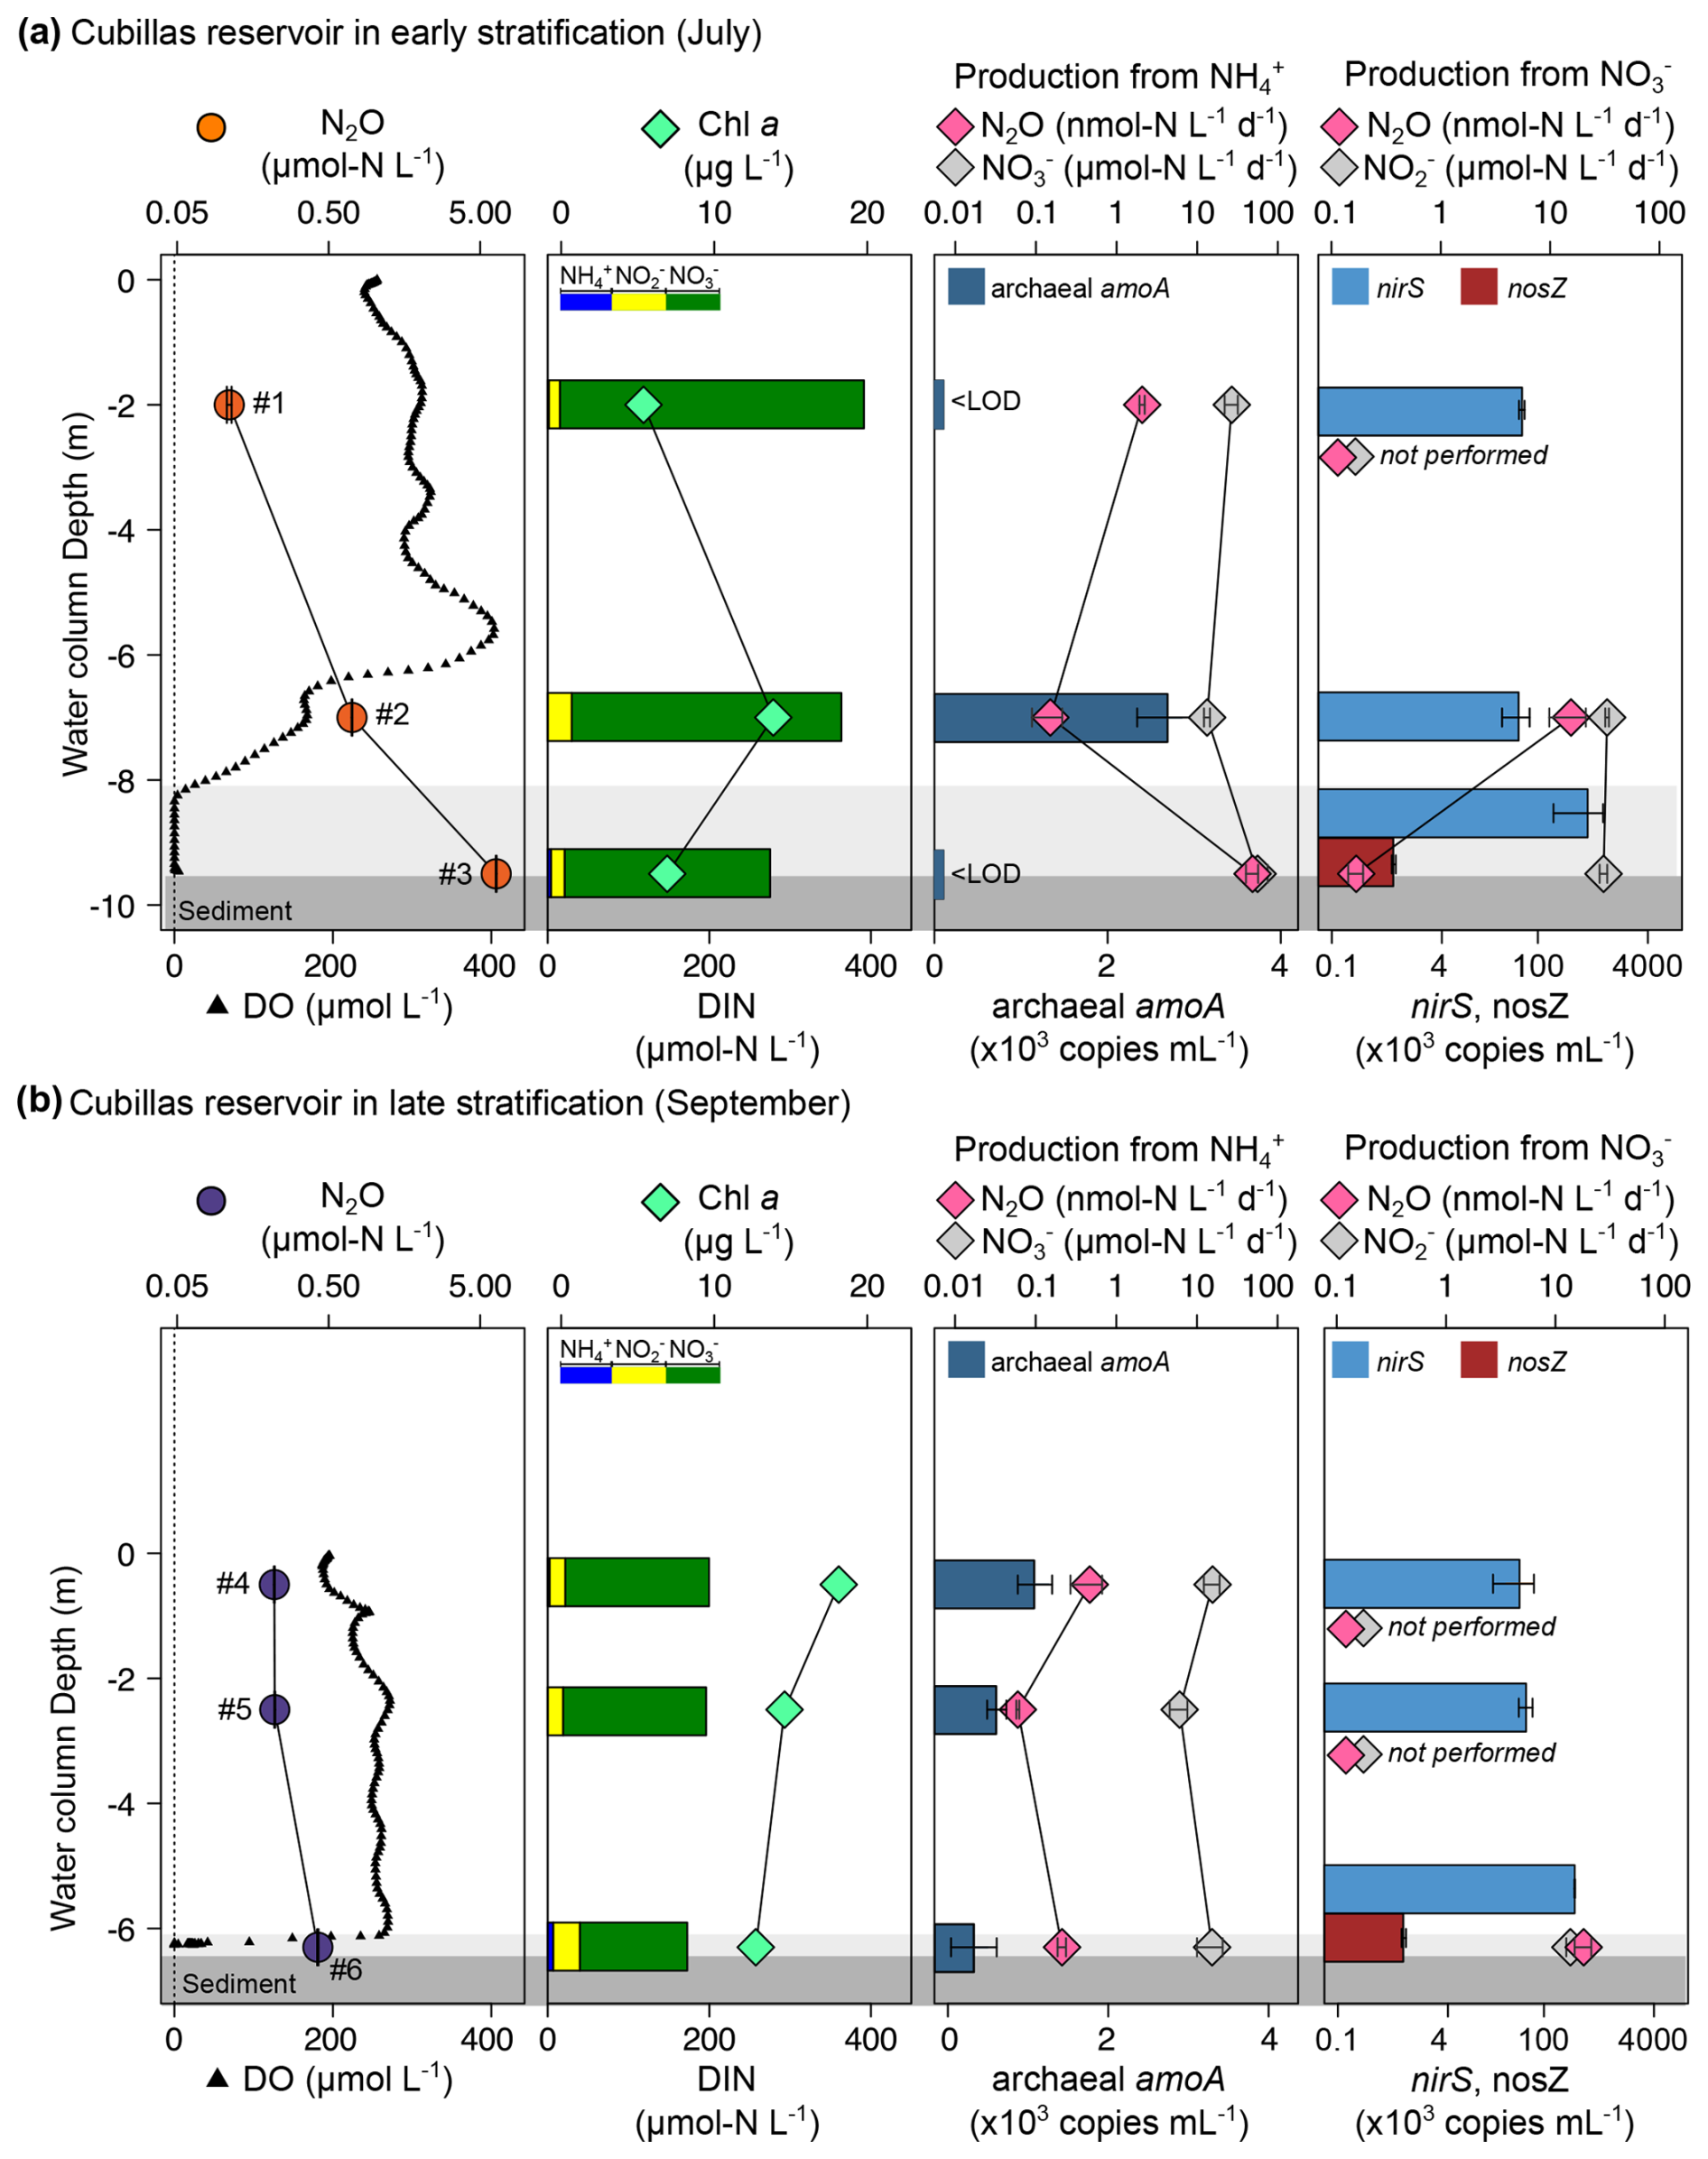
Figure 3Vertical profiles of the N2O concentration, production rates, marker genes (colored bars), and other relevant biogeochemical variables in the Cubillas reservoir in July (a) and September (b). Dissolved N2O (µmol N L−1, mean ± standard error), and DO concentration (µmol L−1); Chl a concentration (µg L−1), and DIN concentration (µmol N L−1); N2O production (nmol N L−1 d−1) and nitrification ( production, ) from ; N2O production (nmol N L−1 d−1) and production () from , and the abundance of the target genes (×103 copies mL−1, mean ± standard deviation). Numbers next to N2O concentrations refer to the sample ID in Table 1. The light gray area represents the suboxic zone (DO <10 µmol L−1) and the dark grey the sediment. < LOD means below level of detection. Note the logarithmic scales for some panels. nosZ gene abundance was only determined in the deepest layers. N2O and production were only determined in the oxycline and hypolimnion.
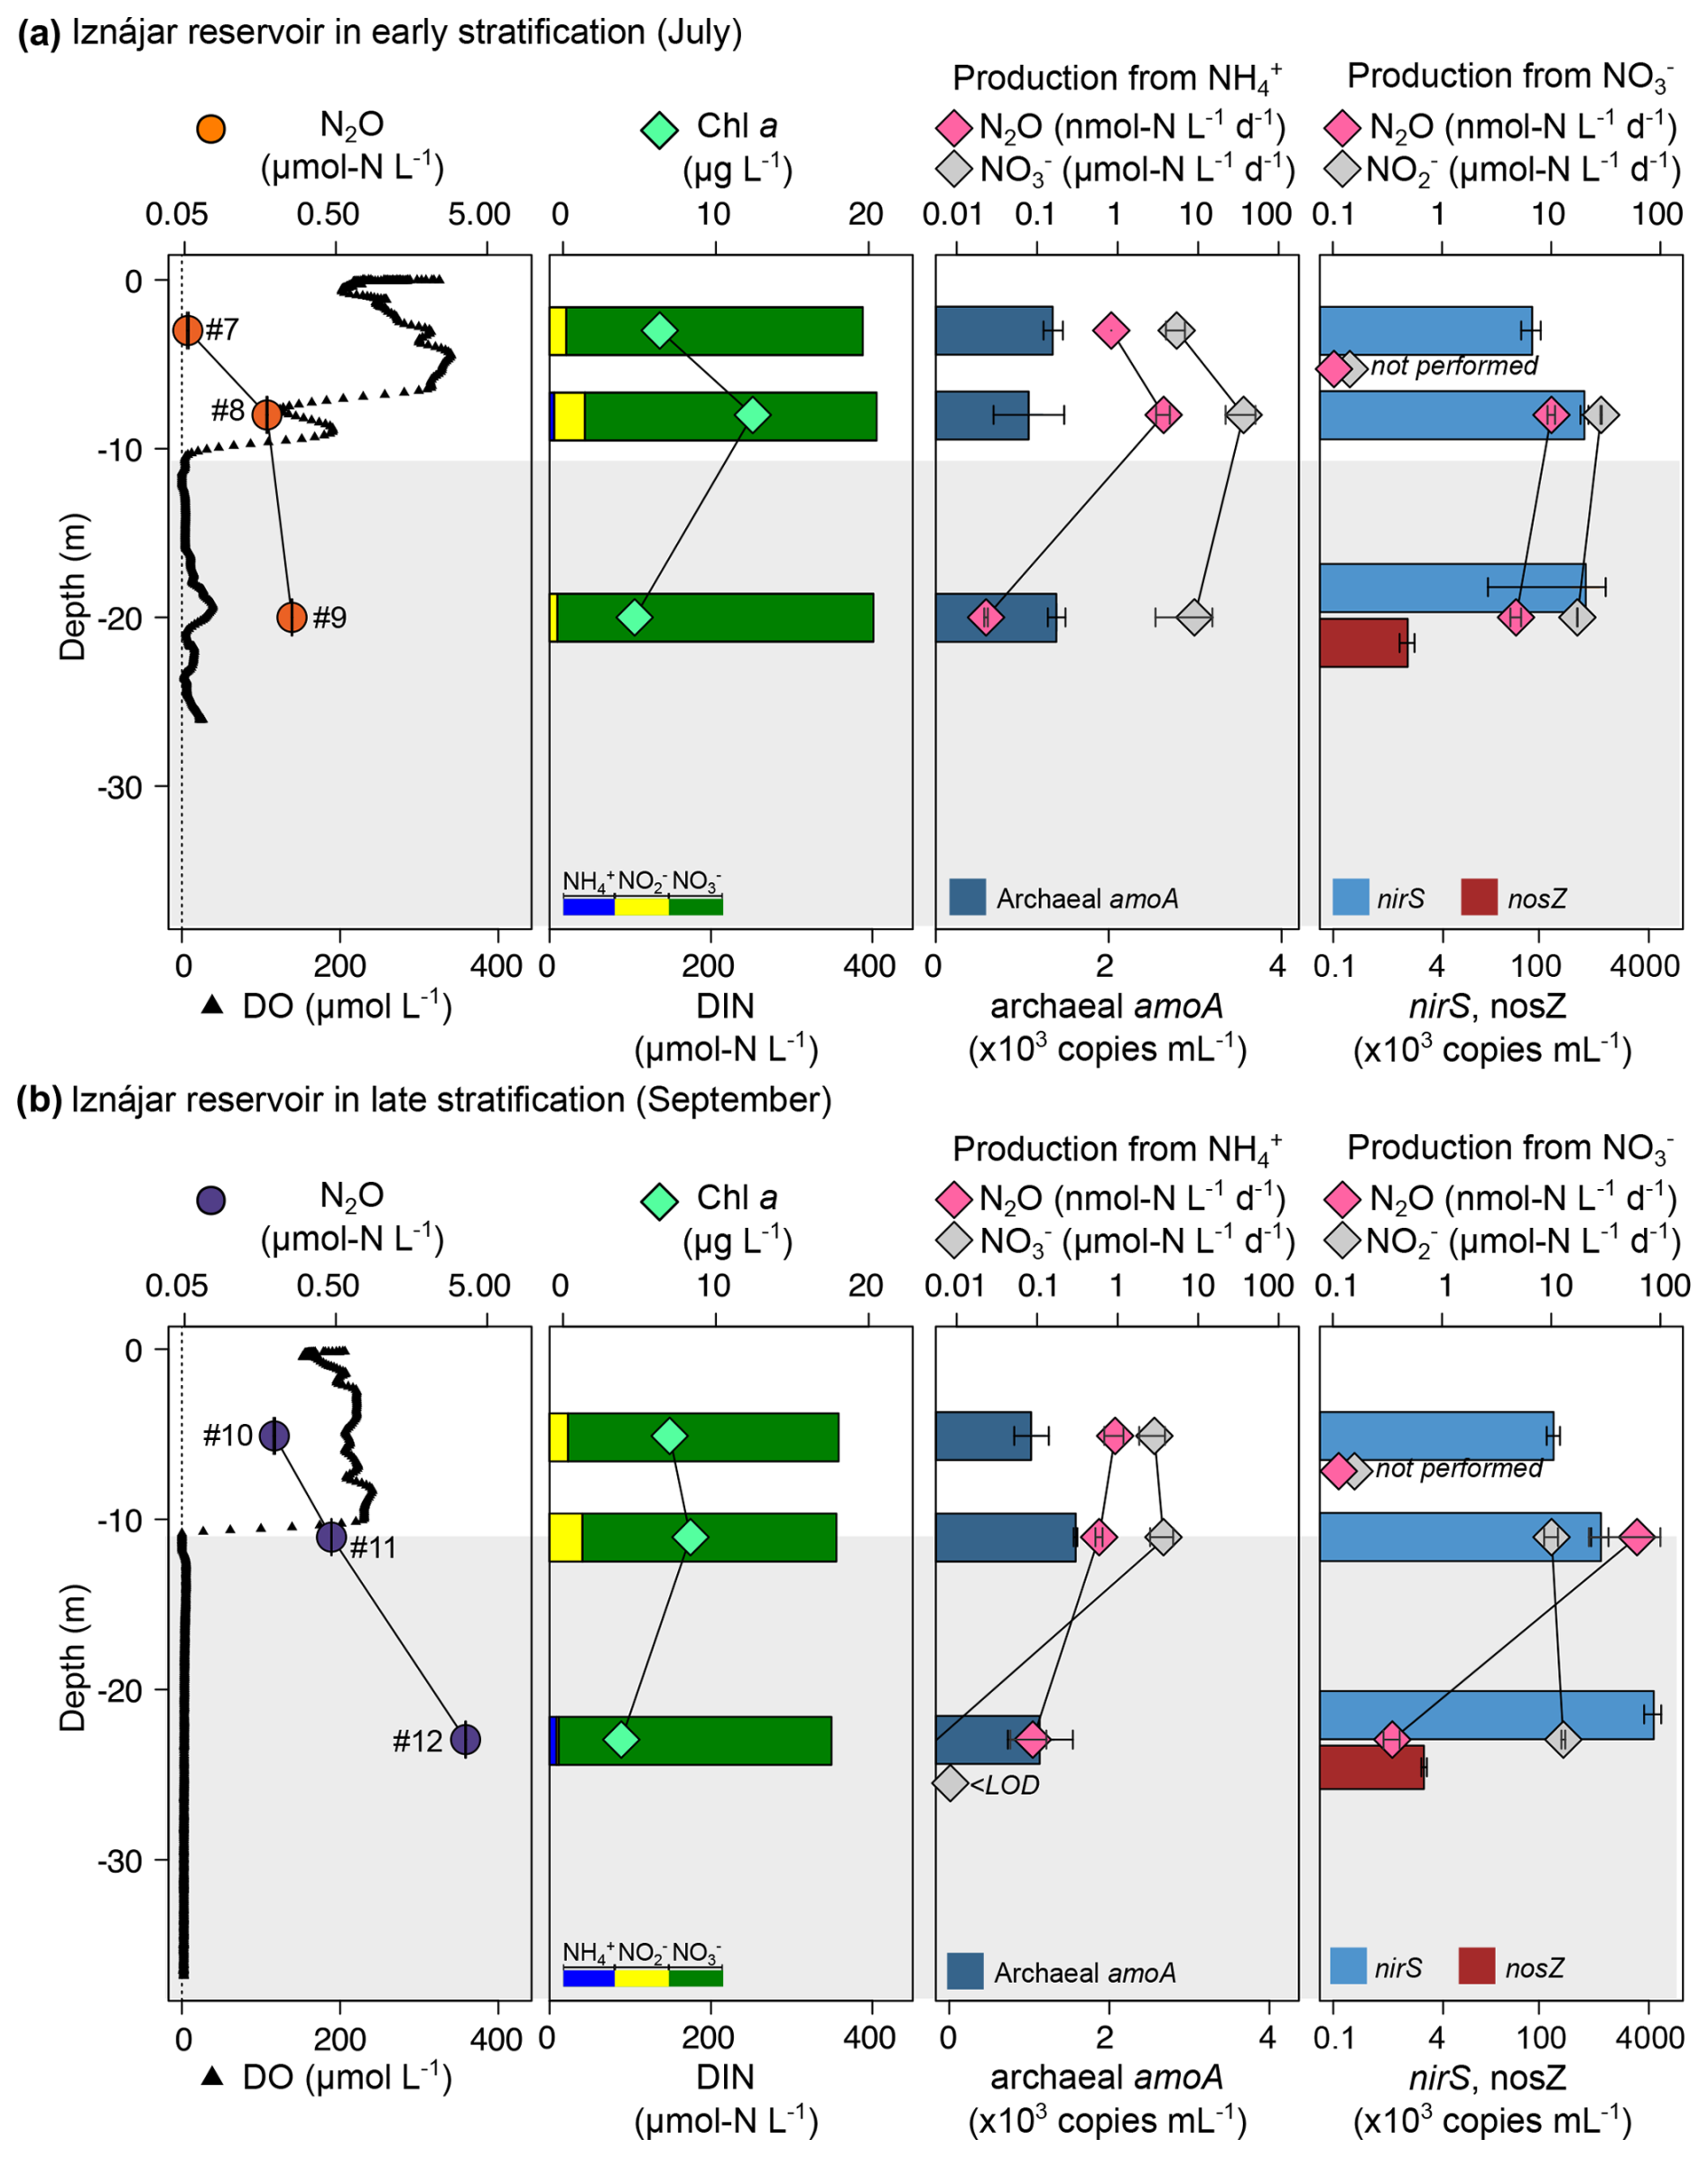
Figure 4Vertical profiles of the N2O concentration, production rates, marker genes (colored bars), and other relevant biogeochemical variables in the Iznájar reservoir in July (a) and September (b). Dissolved N2O (µmol N L−1, mean ± standard error), and DO concentration (µmol L−1); Chl a concentration (µg L−1), and DIN concentration (µmol N L−1); N2O production (nmol N L−1 d−1) and nitrification ( production, ) from ; N2O production (nmol N L−1 d−1) and production () from , and the abundance of the target genes (×103 copies mL−1, mean ± standard deviation). Numbers next to N2O concentrations refer to the sample ID in Table 1. The light gray area represents the suboxic zone (DO <10 µmol L−1). Note the logarithmic scales for some panels. nosZ gene abundance was only determined in the deepest layers. N2O and production were only determined in the oxycline and hypolimnion.
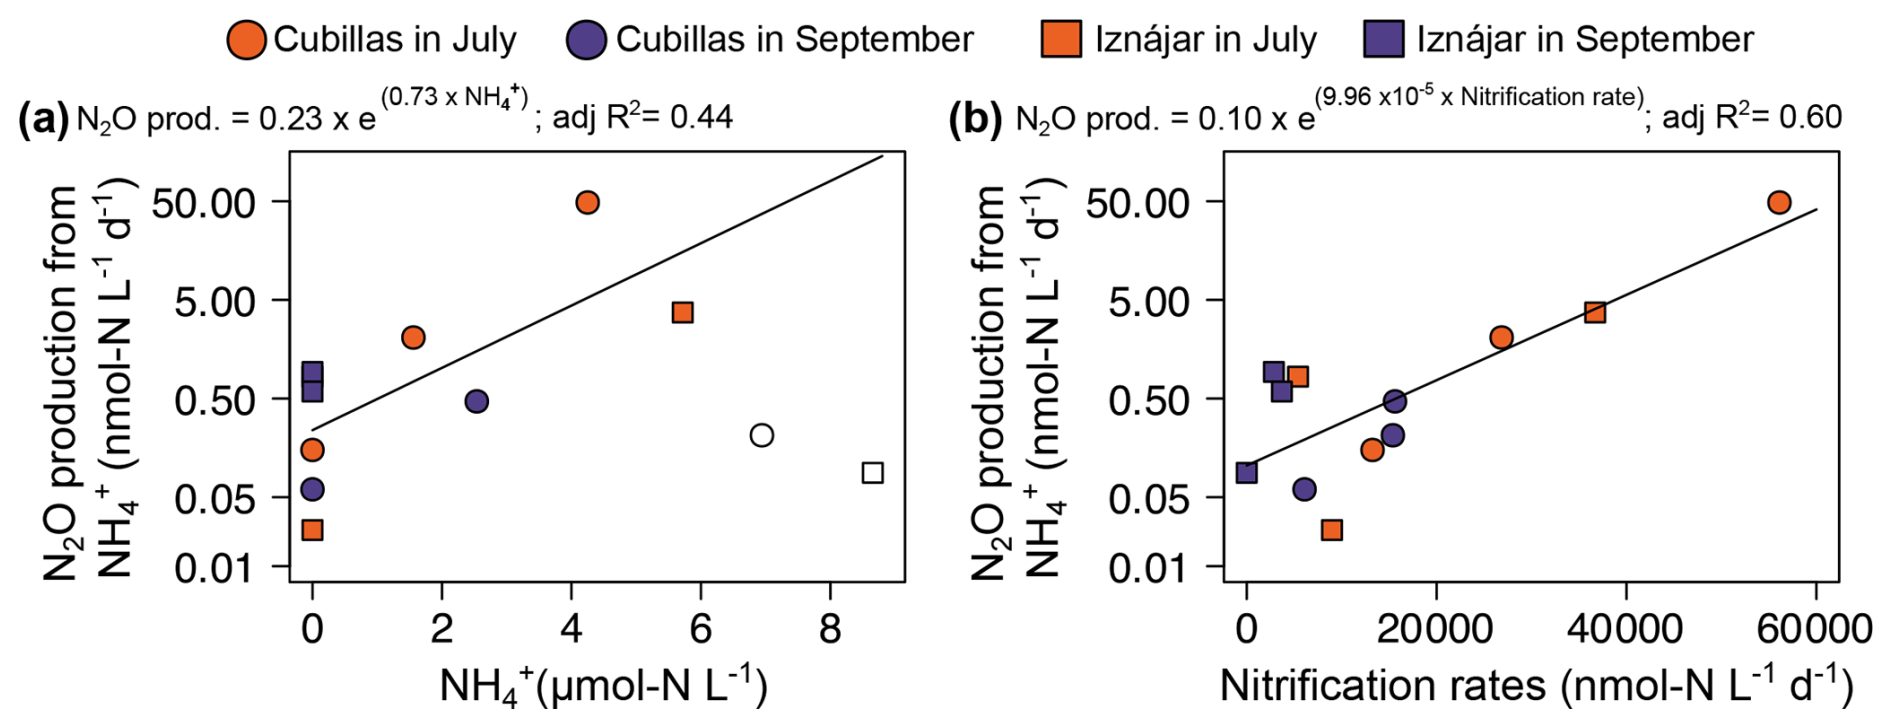
Figure 5Drivers of N2O production from . (a) Exponential relationship between in situ concentration (µmol N L−1) and N2O production rates (nmol N L−1 d−1), (b) relationship between nitrification rates (nmol N L−1 d−1) and N2O production. concentrations >6 µmol N L−1 are shown in open symbols but excluded from the analysis in (a).
3.6 Relationships between N2O concentration, production, and biogeochemical markers
In both reservoirs, the higher N2O concentrations were found in the deepest layers under suboxic conditions (i.e., DO <10 µmol L−1) (León-Palmero et al., 2023; Pinti, 2014), and coincided with the highest cumulative Chl a concentration (mg Chl a m−2), and the highest abundances of nirS gene (Figs. 1, 3 and 4). N2O concentration decreased exponentially as DO concentration increased (Fig. 6a), but it increased in a power function correlated with cumulative Chl a concentration (Fig. 6b). N2O concentration was also a power function of the nirS abundance (Fig. 6c). It is thus consistent that nirS abundance showed a negative correlation with DO concentration (Fig. 6d) and a positive correlation with cumulative Chl a concentration (Fig. 6e). Total production of N2O, calculated as the sum of the production from and from , was significantly positively correlated with the nirS gene abundance (Fig. 6f, n=11). Sample #12 was excluded of this analysis.
Additionally, there was a positive correlation between δ15N- and the δ15N-N2O (Fig. 6g). We also detected a strong correlation between δ15N- and N2O concentration (Fig. 6h). The abundance of the archaeal amoA gene was not correlated to δ15N-NO (p>0.05). In contrast, δ15N-NO was significantly correlated with the nirS abundance (Fig. 6i, n=12, adj R2=0.28, p<0.05). Particularly, the nirS gene abundance explained up to 94 % of the variance in δ15N- in the Iznájar reservoir (Fig. 6i, n=6, adj R2=0.94, p<0.001).
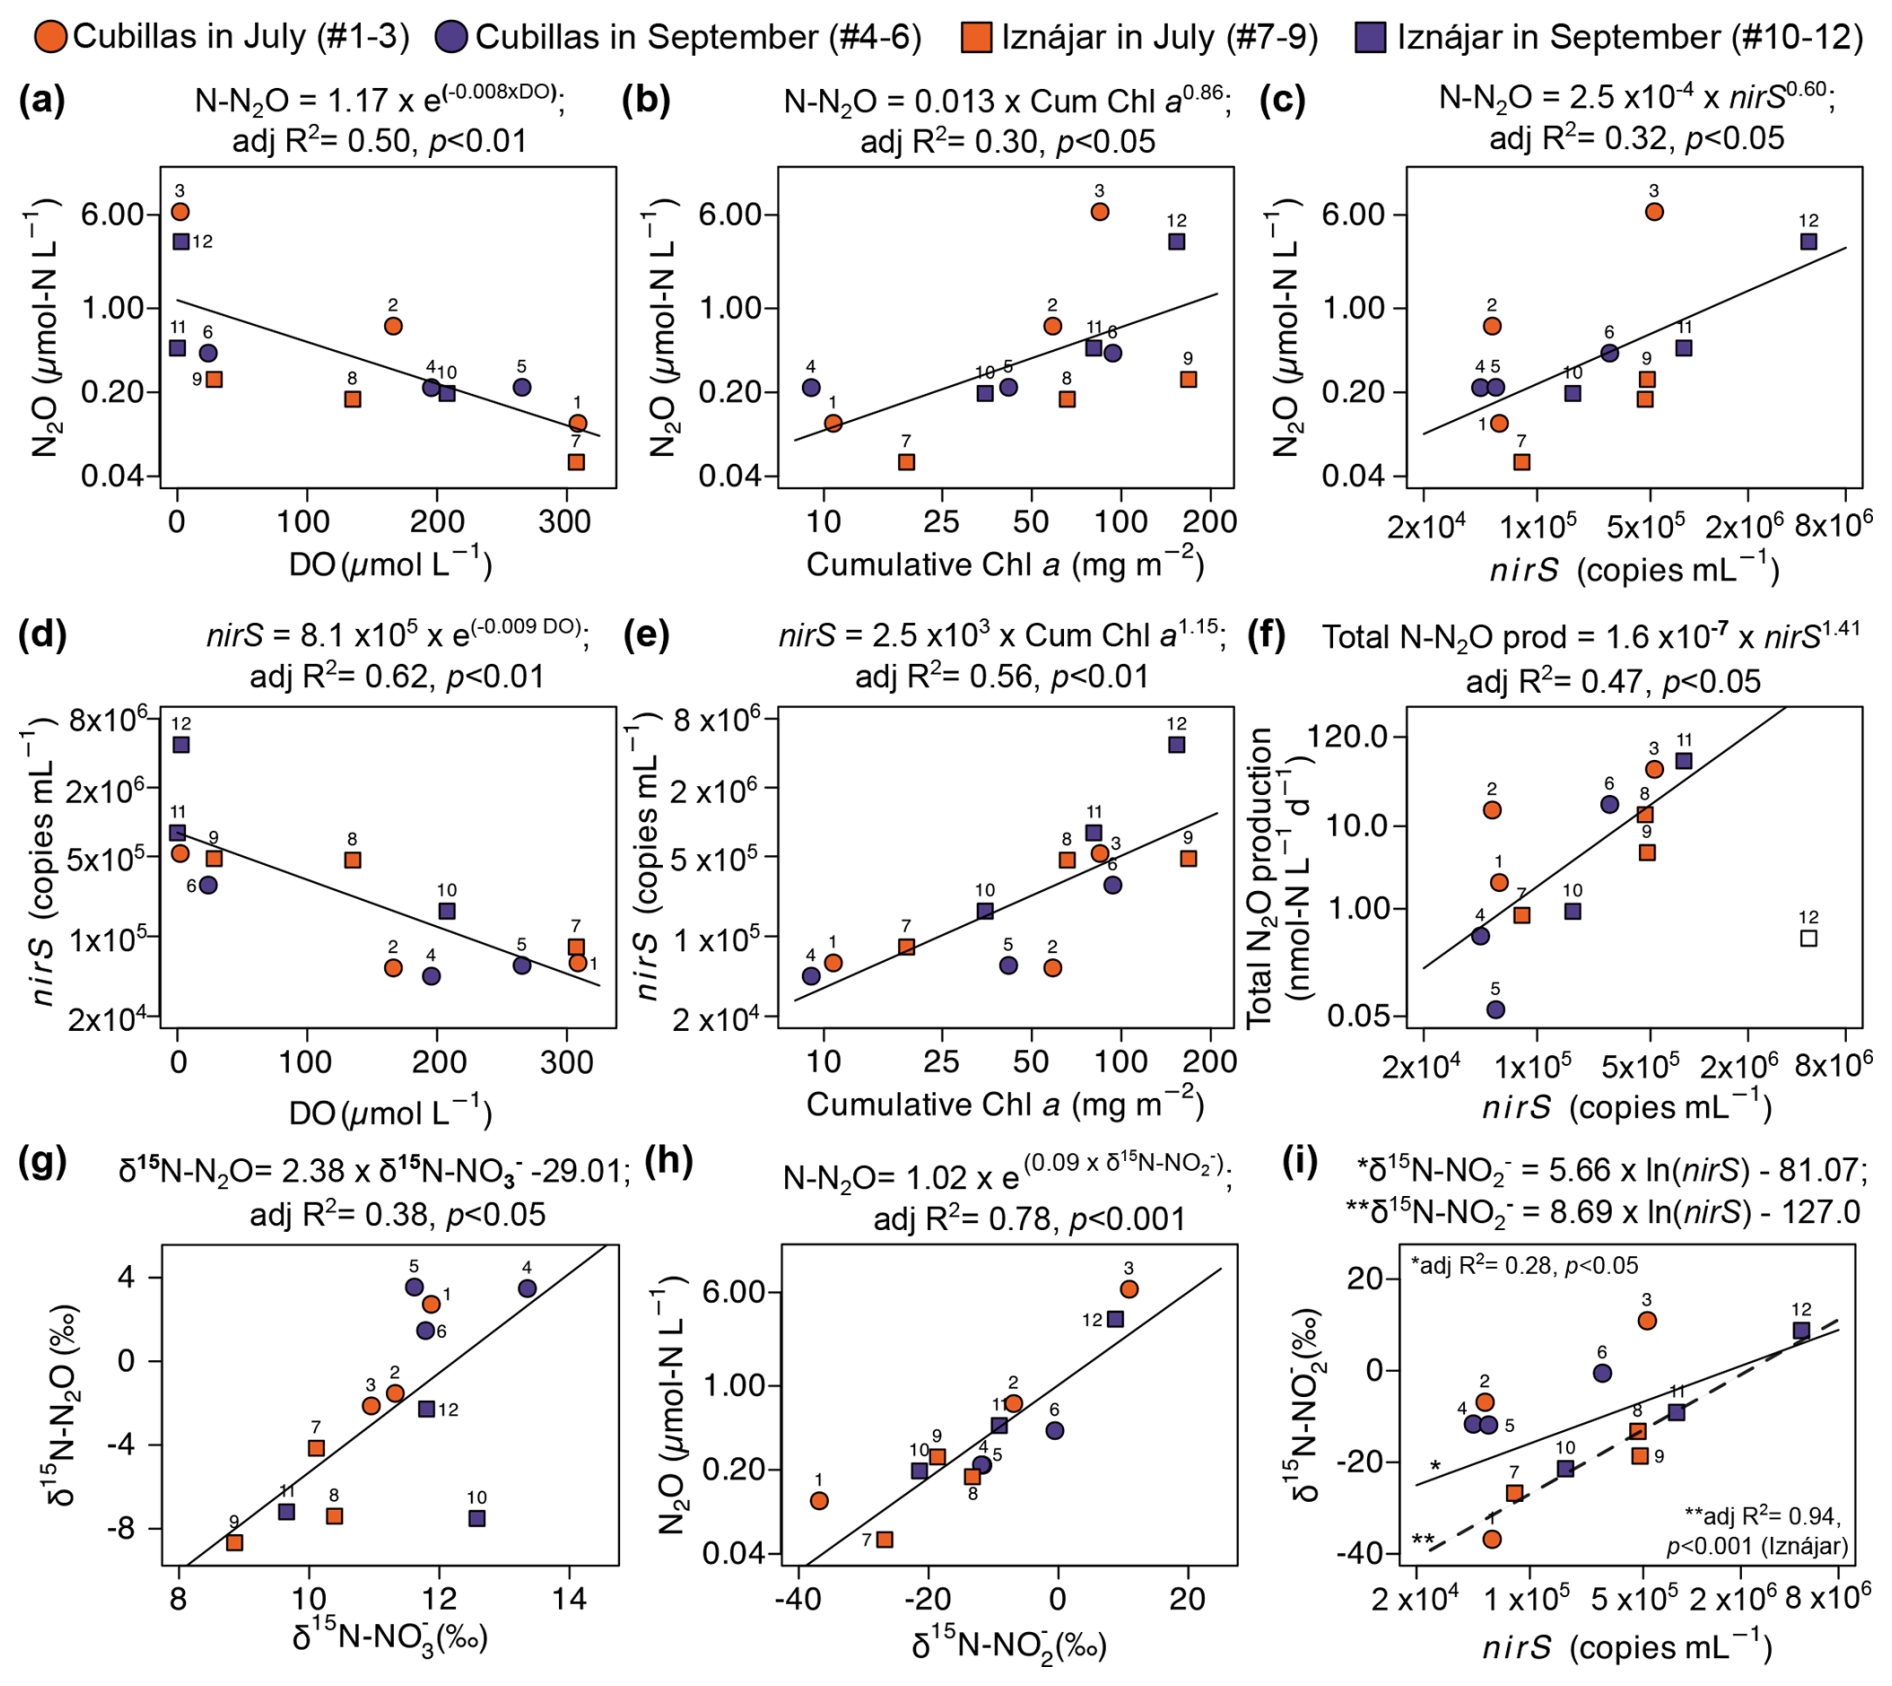
Figure 6Drivers of dissolved N2O concentration and production. Dissolved N2O concentration (µmol N L−1) as a function of (a) DO (µmol L−1); (b) cumulative Chl a concentration (mg Chl a m−2), and (c) nirS gene abundance (copies mL−1). nirS abundance as function of the (d) DO, and (e) cumulative Chl a concentration. (f) Total production of N2O (nmol N L−1 d−1) is a function of the nirS abundance. Note that sample #12 (Hypolimnion of Iznájar in September) in (f) is an outlier, and it was not included in the analysis. (g) δ15N-N2O as function of the δ15N- (‰), (h) dissolved N2O as function of the δ15N- (‰), and (i) δ15N- as function of nirS gene abundance. A second dashed trend line and equation have been drawn in (i) only for the Iznájar samples (n=6). Note the logarithmic scales in the x and y axes. Correspondence between numbers and samples is shown in Table 1 and Figs. 3 and 4.
N loading from the surrounding watershed significantly impacts the studied reservoirs, resulting in concentrations exceeding 300 µmol N L−1. The water columns of reservoirs have the capacity to process and remove significant amounts of N, as shown here through changes in DIN and N2O concentrations (Fig. 1), detection of N removal processes in 15N isotope tracer experiments, presence of functional genes encoding the loss pathways (Figs. 3 and 4), and interpretation of patterns in natural abundance of N and O isotopes in the DIN and N2O pools (Figs. 2, 6). concentration decreased by 49 % and 12 % in Cubillas and Iznájar, respectively, in just two months, which represents a substantial net N loss. This net loss in the water column likely reflects a combination of processes, including denitrification, algal assimilation followed by sedimentation of organic matter, and other biogeochemical transformations. N removal processes also drive the production of the potent greenhouse gas N2O. The studied reservoirs had large accumulations of N2O in their deep waters, up to 6.38 µmol N L−1 in Cubillas reservoir in July, and up to 3.60 µmol N L−1 in Iznájar reservoir in September. During the study period, this accumulation of N2O in the water column of Cubillas and Iznájar reservoirs was affected by the water column depth and thermal stratification. Many reservoirs in the Mediterranean region are subject to significant evaporation during the summer, as well as intense human management, resulting in substantial fluctuations in water level. Although both reservoirs experienced a decrease in water depth, this change affected the water column biogeochemistry only in the Cubillas reservoir, likely due to its smaller size. Use of the Cubillas reservoir caused a water-level drawdown from July to September, which reduced the hydrostatic pressure and altered the water column stratification. Unstratified conditions exposed the high N2O deep waters to the reservoir surface, which likely led to a massive release of N2O both directly from the reservoir and, particularly, by degassing at the dam outflow or further downstream. The dam outflow is typically located at the oxycline-hypolimnion level, where the highest concentrations of greenhouse gases are found. Unfortunately, we were unable to quantify these N2O fluxes, but the concentration detected in bottom waters in July (6.38 µmol N L−1, depth = 9.5 m) versus September (0.42 µmol N L−1, depth = 6.2 m) suggests a massive release of N2O to the atmosphere during the summer. In contrast, the Iznájar reservoir did not lose thermal stratification from July to September and developed a steep oxygen gradient and an anoxic hypolimnion throughout the summer. N2O concentration increased throughout the water column during the summer, with the most significant increase occurring in the hypolimnion (1400 % in the hypolimnion vs. ∼300 % increase in the epilimnion and oxycline), which implies that N2O likely remains stored in that layer, and may be emitted during the fall mixing. These hydrological patterns imply dynamic N biogeochemistry during the summer stratification, which were detected explicitly by our suite of biogeochemical measurements.
4.1 Active N2O production indicated by 15N tracer incubations and functional genes
We detected significant production of N2O from both and . The rates of N2O production from reported in this study are larger than those found in Lake Lugano (Frame et al., 2017) and closer to those detected in the Chesapeake Bay (Tang et al., 2022). These rates are also larger than the rates found in the eastern tropical South Pacific oxygen minimum zone (Frey et al., 2020; Ji et al., 2015). N2O production rates were significantly correlated with the availability of and with nitrification rates, but not with archaeal amoA gene abundance. Despite the hypolimnion of Iznájar in September (#12) being apparently anoxic, we detected a significant production of N2O from , ammonia oxidation, and the presence of archaeal amoA genes. This combination of processes and gene detection suggests that trace amounts of oxygen may have been present at levels below the detection limit of our oxygen sensor. Similarly, the presence of trace levels of oxygen may explain the production of N2O from , and the nitrification rates in the anoxic waters of Cubillas, although in that case we did not detect the presence of archaeal amoA genes. The highest amoA abundance was measured in the oxycline of Cubillas in July (i.e., 2.7×10³ copies mL−1), but amoA was not detected in the surface and bottom waters within the same profile, precisely where the highest N2O production from occurred. The absence of detectable archaeal amoA genes in samples with high N2O production may reflect primer bias rather than true absence of ammonia-oxidizing archaea. Previous work in San Francisco Bay revealed that dominant AOA clades were not amplified by commonly used primers, including those employed in this study (Rasmussen and Francis, 2022). It is therefore possible that important AOA lineages present in these reservoirs were missed, leading to an underestimation of amoA abundance. We did not measure the bacterial amoA gene abundance, because AOA had previously been identified as the dominant ammonia-oxidizers in the study reservoirs (León-Palmero et al., 2023). Therefore, we cannot assess the potential contribution of AOB. We tested for Comammox using specific primers and did not detect them in any sample. Additionally, sample water was pre-filtered before DNA extraction (pore size = 3 µm), which may have excluded microbes attached to particles or suspended sediment, potentially including AOA or Comammox groups.
Significant nitrification rates were detected in 11 out of 12 samples, with values similar to those found in another eutrophic freshwater system, Lake Mendota (Hall, 1986), and several orders of magnitude higher than reported open ocean nitrification rates (e.g., 0.4–10 ) (Small et al., 2013, and references therein). The detection of high nitrification rates, but no significant ammonia oxidation, might suggest that comammox is occurring at these depths. However, our PCR analysis showed no evidence of the presence of comammox bacteria (Fig. S2), although, because no positive control was available, we cannot completely exclude their presence. Therefore, we consider the possibility that complete ammonia oxidation could contribute to the observed nitrification rates. Alternatively, we hypothesize that the production by ammonia oxidation was tightly coupled to consumption by oxidizers, such that it could not be detected in the pool. production from ammonia oxidation was only detected in one sample in which we did not detect a significant nitrification rate (i.e., hypolimnion of Iznájar reservoir in September, #12), suggesting that could accumulate due to a decoupling of ammonia oxidation and nitrite oxidation in this sample. Ammonia oxidation is the rate-limiting step for nitrification in most systems, which is why rarely accumulates in the environment and could explain our observed mismatch between ammonia oxidation rates and total nitrification rates (Kowalchuk and Stephen, 2001). The rates of production detected here were often sufficient to account for a complete turnover of the pool during the incubation, consistent with the idea that did not accumulate, even though the in situ concentrations were substantial.
The production of N2O from was generally higher than from ammonium, suggesting that is the main substrate for N2O production. The highest rates occurred in oxycline samples, where concentration was often lowest, and the concentration peaked. However, the N2O production from was not significantly correlated with the in situ concentration of , probably because N2O production rates are not limited by availability. These rates were higher than the rates found in ocean waters (Ji et al., 2015), and in the Chesapeake Bay (Tang et al., 2022), but similar to those found in the eastern tropical South Pacific oxygen minimum zone (Frey et al., 2020). Similarly, these previous studies in oxygen minimum zones found the highest rates of N2O production close to the oxic-anoxic interface (Frey et al., 2020; Ji et al., 2015).
Denitrification is the main microbial process leading to removal in aquatic systems. Denitrifying bacteria (as represented by the nirS gene) were consistently found throughout the reservoir water columns and reached their highest abundances in the suboxic waters. Their abundance was not significantly correlated with the N2O production from , likely because of the small sample size (n=7). Frey et al. (2020) found that the nirS gene was not significantly correlated with N2O production from , but was correlated with . The total N2O production, calculated as the sum of the production from and from (Table S3), was significantly correlated with nirS gene abundance (Fig. 6f), highlighting the importance of denitrification in the overall production of N2O. This is consistent with the higher production obtained from than from , and with the evidence from natural abundance isotopes, discussed below. The rates of reduction to in this study were up to 1000 times higher than those in the ocean (Füssel et al., 2012; Ji et al., 2015) and in the Chesapeake Bay (Tang et al., 2022). These eutrophic reservoirs exhibit high productivity, with elevated concentrations of NO and organic matter fueling intense denitrification and N2O production. This rapid processing activity may reflect a system-level response to external nutrient loading, whereby a portion of the nitrogen input is redirected toward atmospheric release (León-Palmero, 2023).
4.2 Natural abundance stable isotopes support the role of denitrification
In general, N2O production by denitrification, nitrifier denitrification and bacterial nitrification produces a significant isotopic fractionation of 15N, meaning that the lighter 14N is preferentially used in N2O production, resulting in a N2O pool depleted in 15N relative to the respective substrate and a higher δ15N value in the substrate left behind (Wenk et al., 2013 and references therein). In contrast, AOA produce N2O that is enriched in 15N relative to the substrate, increasing δ15N-N2O, with an isotopic fractionation value of ‰ (Santoro et al., 2011; Stieglmeier et al., 2014). At the same time, the consumption of N2O by denitrifiers increases the proportion of 15N and 18O in the remaining N2O pool, increasing δ15N-N2O and δ18O-N2O values (Wenk et al., 2016).
To identify trends over depth or time, and interpret them in relation to the processes that leave their signatures in the isotopes, each sample is identified on the cross plots with a unique number (Table 1 and Figs. 2, 3, 4, 6). The trends that we observed in the natural isotopic composition of the N species suggested that denitrification was a significant process in the water column, in agreement with the rate data. In general, the increase in the N2O concentration with depth was coupled to the δ15N-N2O decrease (e.g., #1–3, #5–6 or #7–9 in Fig. 1 and black trend lines in Fig. 2a), which indicates net production of N2O by water column denitrification, nitrifier denitrification and/or bacterial nitrification. In contrast, the opposite trend occurred in Iznájar in September (#10–12, Fig. 1b and red trend line in Fig. 2a), which suggests that N2O may be a mix of consumption by denitrifiers and production by AOA in the hypolimnion at the end of the summer. There was also an increase in the δ18O-N2O with depth in each profile, accompanied by an increase in N2O concentration, which suggests a parallel production and consumption of N2O at the deeper layers. That trend was not observed in Cubillas reservoir in July, but rather a noticeable increase in the δ18O-N2O in bottom waters from July to September along with N2O concentration decrease (Fig. 2b, #3 and #6), indicating active N2O reduction. Besides, many samples are located along the slope in Fig. 2c, which is indicative of active N2O reduction (Ostrom et al., 2007). We detected the nosZ gene, which encodes the reduction of N2O during denitrification, in hypolimnetic waters with higher abundances in September. N2O consumption can occur in the anoxic hypolimnion of Mediterranean reservoirs and result in undersaturations up to 27 % in those with low N availability (León-Palmero et al., 2023). However, in the investigated reservoirs, the N2O reduction by nosZ-carrying denitrifiers did not cause an undersaturation of N2O in the investigated time frame, which is consistent with previous findings in eutrophic reservoirs with high N availability (León-Palmero et al., 2023).
In the Iznájar reservoir, the decrease in concentration coincided with the increase in δ15N-, suggesting that denitrification is consuming the lighter during these months (Fig. 2e, #7–9). We detected that δ15N- was correlated with δ15N-N2O (Fig. 6g), which is indicative of denitrification. Over time, as more N2O is produced from , the NO pool may get substantially enriched in 15N, and δ15N-N2O values may also increase, creating a trend line where higher δ15N- corresponds to higher δ15N-N2O values. In general, reduction enriches 15N in the remaining pool, while the production of may decrease its δ15N-. In the study reservoirs, the production of N2O by denitrification may have enriched 15N in the remaining pool, as evidenced by the tight coupling between N2O concentration and δ15N- (Fig. 6h) and the increase in the δ15N- was correlated with the abundance of denitrifying bacteria in the reservoirs (Fig. 6i). The gene used as a marker for denitrifying bacteria (i.e., nirS) encodes the reductase that catalyses the reduction of during denitrification. Thus, it acts directly on the pool. Furthermore, the abundance of the nirS gene in the water column was correlated with the dissolved N2O, as we also detected in a survey of twelve Mediterranean reservoirs (León-Palmero et al., 2023). These results suggest that denitrification was the main pathway of N2O production, and it resulted in a characteristic isotopic imprint in the remaining pool.
In addition, the cumulative Chl a concentration, which is a proxy for the vertical export of the autochthonous organic matter produced by primary producers in the whole water column, was significantly correlated with the abundance of the nirS gene and the dissolved N2O concentration (Fig. 6b, e). This is also consistent with our previous study in twelve reservoirs (León-Palmero et al., 2023), and may indicate that denitrification is enhanced by particulate material derived from the phytoplankton community in the water column. Several studies in marine waters have described that denitrification was affected by the quantity and quality of organic matter (Babbin et al., 2014; Ward et al., 2008). Dalsgaard et al. (2012) found that the higher denitrification rates were all found at marine stations with high Chl a levels in the overlying water, suggesting a subducted and potentially decaying algal bloom. In general, this organic matter export represents a high-quality carbon source, but also sinking particles with a surface for microbial colonization, an environment where both oxic and anoxic/low oxygen microenvironments coexist, and they even increase the probability of contact between bacteria and nitrogen (Liu et al., 2013; Xia et al., 2017).
4.3 Implications for N2O concentration and fluxes
The highest total N2O production in Cubillas coincided with the highest N2O concentration at the deepest depth in both months (Fig. 3). In the deeper reservoir, Iznájar, the highest production was measured at the oxycline, where there is a strong potential for N2O fluxes, while the highest N2O concentrations were detected in the hypolimnion (Fig. 4). In both reservoirs, the N2O turnover time at the oxycline was the lowest in the profile. In Iznájar, the N2O turnover time at the oxycline was as low as 13 d in July and 8 d in September (Table S3), suggesting that the N2O produced at this location does not accumulate there. Instead, an important fraction of the N2O produced at the top of the oxycline may be consumed or diffuse to the top layer. This diffusive flux, together with the N2O produced in situ in the epilimnion by microbial activity and photochemidenitrification (Leon-Palmero et al., 2025), determines the large N2O fluxes found previously in this reservoir, reaching up to 3.6 mg N N2O m−2 d−1, and even exceeding the CO2 equivalent warming potential from CO2 and CH4 emissions combined (León-Palmero et al., 2020b).
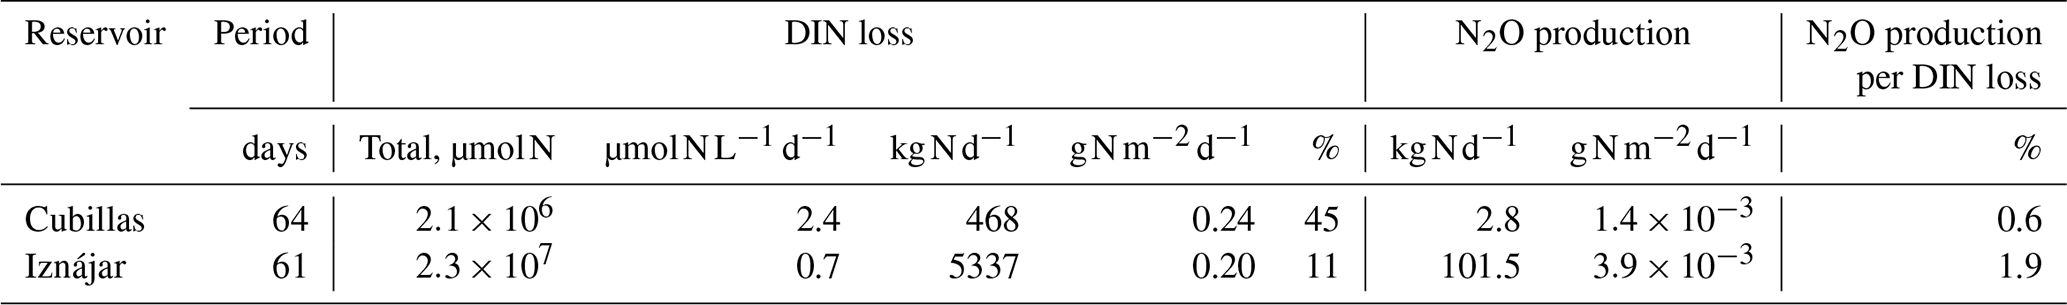
Table 2Total DIN loss, and N2O produced from July to September in Cubillas and Iznájar reservoirs. Details on the calculations and assumptions are provided in the Supplement.
4.4 Scaling up to the reservoir level: how much nitrogen did the reservoirs lose?
An important feature observed in the water column of these reservoirs over the summer was the substantial decrease in the concentration, suggesting an active N filter for the high N loadings. Microbial activity in the water column and the sediments of reservoirs can reduce the excess of N through emissions of N2, primarily produced during denitrification and anammox. In this study, N2O emissions also constitute an important loss of fixed N. Total DIN loss calculations from July to September showed that Cubillas lost 468 kg N d−1, while Iznájar lost 5337 kg N d−1, representing a 45 % and 11 % decrease, respectively (Table 2). The DIN loss rates (2.4 and 0.7 ) were similar or even higher than those calculated in other lakes or in the Baltic Sea (Seitzinger, 1988). Normalized to reservoir surface area, the N loss was slightly higher in Cubillas. N2O production was two orders of magnitude higher in Iznájar than in Cubillas in terms of kg N per day, but production rates were more similar when normalized to area. In the water column of Iznájar, the percentage of the N2O production per DIN loss was higher than in Cubillas, at 1.9 % and 0.6 %, respectively. These percentages only refer to the biologically produced N2O in the water column and may increase if the N2O produced in the sediments, or the N2O produced abiotically by photochemodenitrification, which was initially described in the surface waters of these reservoirs (Leon-Palmero et al., 2025), are also incorporated in the calculation. These estimates represent a major seasonal N loss event rather than annual rates. They are based on DIN concentration differences between July and September, without considering whether the reservoirs received N inputs from their watersheds during that period. Since summer is the dry period, and drawdown of the reservoirs exceeded any input via rain or runoff, N inputs from the watersheds were likely minimal during the study period. Further details on the calculations and assumptions are provided in the Supplement (Sect. S2).
Zhou et al. (2019) described a decrease of 97 % in the concentration in the water column of Zhoucun reservoir during spring (2 months), and they related the N losses to aerobic denitrification occurring in the water column. Brezonik and Lee (1968) estimated that the hypolimnion of Lake Mendota lost 312 kg N d−1. Beaulieu et al. (2011) found that <1 % of denitrified N was converted to N2O in streams. Thus, these reservoirs act as important sinks for fixed N during the summer at the landscape scale, particularly within agricultural and urban watersheds, and sources of N2O to the atmosphere. Denitrification significantly contributed to dissolved N loss and N2O production in the water column. Although N2O production per unit of DIN loss was less than 2 %, the absolute amount of N2O produced in the water column and likely emitted into the atmosphere is substantial.
Our study shows that reservoir water columns actively process and remove fixed N while producing N2O, with denitrification as the dominant pathway. This is supported by changes in DIN and N2O concentrations, 15N isotope tracer experiments, presence of functional genes, and patterns in natural abundance of N and O isotopes in the DIN and N2O pools. N2O was produced from both NH and , with higher rates from the latter, especially in oxycline layers. Total N2O production, and concentration were significantly correlated with nirS gene abundance. In addition, nirS abundance and N2O concentration were correlated with the cumulative Chl a concentration, suggesting that organic matter fuels intense denitrification and N2O production. The patterns in natural abundance isotopes further support the predominance of denitrification. δ15N- was positively correlated with δ15N-N2O, and δ15N-NO increased with N2O concentration and nirS abundance. Elevated δ18O-N2O and δ18O:δ15N slope near 2.5, along with the detection of nosZ genes suggest active N2O consumption in several layers, such as the hypolimnion of Iznájar reservoir. Cubillas showed the highest N2O production and concentration at depth, likely followed by surface release during summer drawdown. In Iznájar, N2O accumulated substantially in the hypolimnion over the summer, with peak production at the oxycline, where there is a strong potential for N2O fluxes. Both reservoirs acted as substantial N sinks for fixed N in the water column during the summer, losing 468 and 5337 kg N d−1 (Table 2). Therefore, the role of reservoirs as N2O emitters should be characterized in more detail in future studies, especially considering their the global expansion and growing importance in N2O budgets over the past century (Li et al., 2024; Wang et al., 2023).
Data supporting the findings of this study are available within the article and in the Supplement, which includes additional figures (Figs. S1 and S2), tables (Tables S1–S4), and detailed methodological descriptions (Sects. S1 and S2).
The supplement related to this article is available online at https://doi.org/10.5194/bg-23-3887-2026-supplement.
ELP, CF and BBW designed the study, with inputs from RMB, and IR. ELP, RMB, and IR contributed to data acquisition during the reservoir samplings. ELP performed the experiments and processed the samples. All authors analyzed the data and discussed the results. ELP wrote the first draft manuscript, which was complemented by significant contributions of all the authors.
The contact author has declared that none of the authors has any competing interests.
Publisher's note: Copernicus Publications remains neutral with regard to jurisdictional claims made in the text, published maps, institutional affiliations, or any other geographical representation in this paper. The authors bear the ultimate responsibility for providing appropriate place names. Views expressed in the text are those of the authors and do not necessarily reflect the views of the publisher.
We are especially grateful to Eulogio Corral for his assistance in the field and to Alba Contreras-Ruiz for her support in the laboratory. We also thank Ana Sierra, Jesús Forja and Teodora Ortega for helping with gas chromatography analysis at the University of Cádiz. We also thank Sergey Oleynik for his technical assistance with the mass spectrometer at Princeton University. We acknowledge the Hydrological Confederations of Guadalquivir (CHG) and the Andalusian Environmental and Water Agency (AMAYA) for facilitating the reservoir sampling and databases.
This work was supported by Grant QUAL21-011 funded by the Consejería de Universidad, Investigación e Innovación (Junta de Andalucía), by Grant PID2022.1378650B.100 funded by MICIU/AEI/10.13039/501100011033, and by ERDF, EU. ELP was supported by a PhD fellowship from the Spanish Ministry of Education, Culture and Sport (grant no. FPU014/02917), and later by a Marie Skłodowska-Curie postdoctoral fellowship (HORIZON-MSCA-2021-PF-01, project number: 101066750) by the European Commission at Princeton University. Additional financial support for ELP's visit to Princeton University in 2018 was provided by the grant for Short-Term Mobility Support (EST17/00087) from the Ministry of Education, Culture and Sports.
This paper was edited by Wei Wen Wong and reviewed by two anonymous referees.
Álvarez-Salgado, X. A. and Miller, A. E. J.: Simultaneous determination of dissolved organic carbon and total dissolved nitrogen in seawater by high temperature catalytic oxidation: conditions for precise shipboard measurements, Mar. Chem., 62, 325–333, https://doi.org/10.1016/S0304-4203(98)00037-1, 1998.
American Public Health Association (APHA): Standard methods for the examination of water and wastewater, 18th edn., edited by: Greenberg, A. E., Clesceri, L. S., and Eaton, A. D., American Public Health Association, Washington, DC, USA, 1100 pp., ISBN 978-0-87553-207-3, 1992.
Babbin, A. R., Keil, R. G., Devol, A. H., and Ward, B. B.: Organic matter stoichiometry, flux, and oxygen control nitrogen loss in the ocean, Science, 344, 406–408, https://doi.org/10.1126/science.1248364, 2014.
Beaulieu, J. J., Tank, J. L., Hamilton, S. K., Wollheim, W. M., Hall, R. O., Mulholland, P. J., Peterson, B. J., Ashkenas, L. R., Cooper, L. W., Dahm, C. N., Dodds, W. K., Grimm, N. B., Johnson, S. L., McDowell, W. H., Poole, G. C., Valett, H. M., Arango, C. P., Bernot, M. J., Burgin, A. J., Crenshaw, C. L., Helton, A. M., Johnson, L. T., O'Brien, J. M., Potter, J. D., Sheibley, R. W., Sobota, D. J., and Thomas, S. M.: Nitrous oxide emission from denitrification in stream and river networks, P. Natl. Acad. Sci. USA, 108, 214–219, https://doi.org/10.1073/pnas.1011464108, 2011.
Beaulieu, J. J., Nietch, C. T., and Young, J. L.: Controls on nitrous oxide production and consumption in reservoirs of the Ohio River Basin, J. Geophys. Res.-Biogeosci., 120, 1995–2010, https://doi.org/10.1002/2015JG002941, 2015.
Bonin, P., Gilewicz, M., and Bertrand, J. C.: Effects of oxygen on each step of denitrification on Pseudomonas nautica, Can. J. Microbiol., 35, 1061–1064, https://doi.org/10.1139/m89-177, 1989.
Boström, K. H., Simu, K., Hagström, Å., and Riemann, L.: Optimization of DNA extraction for quantitative marine bacterioplankton community analysis, Limnol. Oceanogr. Methods, 2, 365–373, https://doi.org/10.4319/lom.2004.2.365, 2004.
Brezonik, P. L. and Lee, G. F.: Denitrification as a nitrogen sink in Lake Mendota, Wisconsin, Environ. Sci. Technol., 2, 120–125, 1968.
Chen, H., Pan, H., Xiao, S., and Deng, S.: Nitrous oxide dominates greenhouse gas emissions from hydropower's reservoirs in China from 2020 to 2060, Water Res., 279, 123420, https://doi.org/10.1016/j.watres.2025.123420, 2025.
Codispoti, L. A.: Interesting times for marine N2O, Science, 327, 1339–1340, https://doi.org/10.1126/science.1184945, 2010.
Dalsgaard, T., Thamdrup, B., Farías, L., and Revsbech, N. P.: Anammox and denitrification in the oxygen minimum zone of the eastern South Pacific, Limnol. Oceanogr., 57, 1331–1346, https://doi.org/10.4319/lo.2012.57.5.1331, 2012.
Frame, C. H., Lau, E., Nolan, E. J., Goepfert, T. J., and Lehmann, M. F.: Acidification enhances hybrid N2O production associated with aquatic ammonia-oxidizing microorganisms, Front. Microbiol., 7, 2104, https://doi.org/10.3389/fmicb.2016.02104, 2017.
Frey, C., Bange, H. W., Achterberg, E. P., Jayakumar, A., Löscher, C. R., Arévalo-Martínez, D. L., León-Palmero, E., Sun, M., Sun, X., Xie, R. C., Oleynik, S., and Ward, B. B.: Regulation of nitrous oxide production in low-oxygen waters off the coast of Peru, Biogeosciences, 17, 2263–2287, https://doi.org/10.5194/bg-17-2263-2020, 2020.
Füssel, J., Lam, P., Lavik, G., Jensen, M. M., Holtappels, M., Günter, M., and Kuypers, M. M.: Nitrite oxidation in the Namibian oxygen minimum zone, The ISME Journal, 6, 1200–1209, https://doi.org/10.1038/ismej.2011.178, 2012.
Granger, J. and Sigman, D. M.: Removal of nitrite with sulfamic acid for nitrate N and O isotope analysis with the denitrifier method, Rapid Commun. Mass Spectrom., 23, 3753–3762, https://doi.org/10.1002/rcm.4307, 2009.
Hall, G. H.: Nitrification in lakes, in: Nitrification, edited by: Prosser, J. I., IRL Press, Oxford, United Kingdom, 127–156, ISBN 978-1-85221-001-4, 1986.
Harrison, J. A., Maranger, R. J., Alexander, R. B., Giblin, A. E., Jacinthe, P.-A., Mayorga, E., Seitzinger, S. P., Sobota, D. J., and Wollheim, W. M.: The regional and global significance of nitrogen removal in lakes and reservoirs, Biogeochemistry, 93, 143–157, https://doi.org/10.1007/s10533-008-9272-x, 2009.
Hayes, N. M., Deemer, B. R., Corman, J. R., Razavi, N. R., and Strock, K. E.: Key differences between lakes and reservoirs modify climate signals: A case for a new conceptual model, Limnol. Oceanogr., 2, 47–62, https://doi.org/10.1002/lol2.10036, 2017.
Hochstein, L. I., Betlach, M., and Kritikos, G.: The effect of oxygen on denitrification during steady-state growth of Paracoccus halodenitrificans, Arch. Microbiol., 137, 74–78, https://doi.org/10.1007/BF00425811, 1984.
Inkscape Project: Inkscape: Open Source Scalable Vector Graphics Editor, Inkscape Project (Software Freedom Conservancy), RRID:SCR_014479, https://inkscape.org (last access: 15 May 2026), 2017.
IPCC: Climate Change 2021: The Physical Science Basis. Contribution of Working Group I to the Sixth Assessment Report of the Intergovernmental Panel on Climate Change, edited by: Masson-Delmotte, V., Zhai, P., Pirani, A., Connors, S. L., Péan, C., Berger, S., Caud, N., Chen, Y., Goldfarb, L., Gomis, M. I., Huang, M., Leitzell, K., Lonnoy, E., Matthews, J. B. R., Maycock, T. K., Waterfield, T., Yelekçi, O., Yu, R., and Zhou, B., Cambridge University Press, Cambridge, UK & New York, USA, https://doi.org/10.1017/9781009157896, 2021.
Ji, Q., Babbin, A. R., Jayakumar, A., Oleynik, S., and Ward, B. B.: Nitrous oxide production by nitrification and denitrification in the Eastern Tropical South Pacific oxygen minimum zone, Geophys. Res. Lett., 42, 10755–10764, https://doi.org/10.1002/2015GL066853, 2015.
Ji, Q., Frey, C., Sun, X., Jackson, M., Lee, Y.-S., Jayakumar, A., Cornwell, J. C., and Ward, B. B.: Nitrogen and oxygen availabilities control water column nitrous oxide production during seasonal anoxia in the Chesapeake Bay, Biogeosciences, 15, 6127–6138, https://doi.org/10.5194/bg-15-6127-2018, 2018.
Junier, P., Kim, O.-S., Witzel, K.-P., Imhoff, J. F., and Hadas, O.: Habitat partitioning of denitrifying bacterial communities carrying nirS or nirK genes in the stratified water column of Lake Kinneret, Israel, Aquat. Microb. Ecol., 51, 129–140, https://doi.org/10.3354/ame01186, 2008.
Kim, O.-S., Imhoff, J. F., Witzel, K.-P., and Junier, P.: Distribution of denitrifying bacterial communities in the stratified water column and sediment–water interface in two freshwater lakes and the Baltic Sea, Aquat. Ecol., 45, 99–112, https://doi.org/10.1007/s10452-010-9335-7, 2011.
Könneke, M., Bernhard, A. E., de la Torre, J. R., Walker, C. B., Waterbury, J. B., and Stahl, D. A.: Isolation of an autotrophic ammonia-oxidizing marine archaeon, Nature, 437, 543–546, https://doi.org/10.1038/nature03911, 2005.
Kowalchuk, G. A. and Stephen, J. R.: Ammonia-oxidizing bacteria: A model for molecular microbial ecology, Annu. Rev. Microbiol., 55, 485–529, https://doi.org/10.1146/annurev.micro.55.1.485, 2001.
Lehner, B., Liermann, C. R., Revenga, C., Vörösmarty, C., Fekete, B., Crouzet, P., Döll, P., Endejan, M., Frenken, K., Magome, J., Nilsson, C., Robertson, J. C., Rödel, R., Sindorf, N., and Wisser, D.: High-resolution mapping of the world's reservoirs and dams for sustainable river-flow management, Front. Ecol. Environ., 9, 494–502, https://doi.org/10.1890/100125, 2011.
León-Palmero, E.: Understanding the fluxes of greenhouse gases in reservoirs under the inspiration of Margalef, Limnetica, 42, 1, https://doi.org/10.23818/limn.42.22, 2023.
León-Palmero, E., Contreras-Ruiz, A., Sierra, A., Morales-Baquero, R., and Reche, I.: Dissolved CH4 coupled to photosynthetic picoeukaryotes in oxic waters and to cumulative chlorophyll a in anoxic waters of reservoirs, Biogeosciences, 17, 3223–3245, https://doi.org/10.5194/bg-17-3223-2020, 2020a.
León-Palmero, E., Morales-Baquero, R., and Reche, I.: Greenhouse gas fluxes from reservoirs determined by watershed lithology, morphometry, and anthropogenic pressure, Environ. Res. Lett., 15, 044012, https://doi.org/10.1088/1748-9326/ab7467, 2020b.
León-Palmero, E., Morales-Baquero, R., and Reche, I.: P inputs determine denitrifier abundance explaining dissolved nitrous oxide in reservoirs, Limnol. Oceanogr., 68, 1734–1749, https://doi.org/10.1002/lno.12381, 2023.
Leon-Palmero, E., Morales-Baquero, R., Thamdrup, B., Löscher, C., and Reche, I.: Sunlight drives the abiotic formation of nitrous oxide in fresh and marine waters, Science, 387, 1198–1203, https://doi.org/10.1126/science.adq0302, 2025.
Li, Y., Tian, H., Yao, Y., Shi, H., Bian, Z., Shi, Y., Wang, S., Maavara, T., Lauerwald, R., and Pan, S.: Increased nitrous oxide emissions from global lakes and reservoirs since the pre-industrial era, Nat. Commun., 15, 942, https://doi.org/10.1038/s41467-024-45061-0, 2024.
Liang, X., Xing, T., Li, J., Wang, B., Wang, F., He, C., Hou, L., and Li, S.: Control of the hydraulic load on nitrous oxide emissions from cascade reservoirs, Environ. Sci. Technol., 53, 11745–11754, https://doi.org/10.1021/acs.est.9b03438, 2019.
Liu, T., Xia, X., Liu, S., Mou, X., and Qiu, Y.: Acceleration of denitrification in turbid rivers due to denitrification occurring on suspended sediment in oxic waters, Environ. Sci. Technol., 47, 4053–4061, https://doi.org/10.1021/es304504m, 2013.
Lloyd, D., Boddy, L., and Davies, K. J. P.: Persistence of bacterial denitrification capacity under aerobic conditions: The rule rather than the exception, FEMS Microbiol. Ecol., 3, 185–190, https://doi.org/10.1111/j.1574-6968.1987.tb02354.x, 1987.
McIlvin, M. R. and Altabet, M. A.: Chemical conversion of nitrate and nitrite to nitrous oxide for nitrogen and oxygen isotopic analysis in freshwater and seawater, Anal. Chem., 77, 5589–5595, https://doi.org/10.1021/ac050528s, 2005.
Ostrom, N. E., Pitt, A., Sutka, R., Ostrom, P. H., Grandy, A. S., Huizinga, K. M., and Robertson, G. P.: Isotopologue effects during N2O reduction in soils and in pure cultures of denitrifiers, J. Geophys. Res.-Biogeo., 112, https://doi.org/10.1029/2006JG000287, 2007.
Pajares, S., Merino-Ibarra, M., Macek, M., and Alcocer, J.: Vertical and seasonal distribution of picoplankton and functional nitrogen genes in a high-altitude warm-monomictic tropical lake, Freshwater Biol., 62, 1180–1193, https://doi.org/10.1111/fwb.12935, 2017.
Pinti, D. L.: Suboxic, in: Encyclopedia of Astrobiology, edited by: Gargaud, M., Amils, R., Quintanilla, J. C., Cleaves, H. J., Irvine, W. M., Pinti, D. L., and Viso, J. V., Springer, Berlin, Heidelberg, https://doi.org/10.1007/978-3-642-27833-4_5236-2, 2014.
Pjevac, P., Schauberger, C., Poghosyan, L., Herbold, C. W., van Kessel, M. A. H. J., Daebeler, A., Steinberger, M., Jetten, M. S. M., Lücker, S., Wagner, M., and Daims, H.: amoA-targeted polymerase chain reaction primers for the specific detection and quantification of comammox Nitrospira in the Environment, Front. Microbiol., 8, https://doi.org/10.3389/fmicb.2017.01508, 2017.
Rasmussen, A. N. and Francis, C. A.: Genome-Resolved Metagenomic Insights into Massive Seasonal Ammonia-Oxidizing Archaea Blooms in San Francisco Bay, mSystems, 7, e01270-21, https://doi.org/10.1128/msystems.01270-21, 2022.
Ravishankara, A. R., Daniel, J. S., and Portmann, R. W.: Nitrous oxide (N2O): The dominant ozone-depleting substance emitted in the 21st century, Science, 326, 123–125, https://doi.org/10.1126/science.1176985, 2009.
R Core Team: R: A Language and Environment for Statistical Computing, R Foundation for Statistical Computing, Vienna, Austria, http://www.R-project.org/ (last access: 28 March 2026), 2014.
Rodríguez-Velasco, E., Peralta-Maraver, I., Martínez-García, A., García-Alguacil, M., Picazo, F., Gonçalves, R. J., Ramón, C. L., Morales-Baquero, R., Rueda, F. J., and Reche, I.: Idiosyncratic phenology of greenhouse gas emissions in a Mediterranean reservoir, Limnol. Oceanogr. Lett., 9, 364–375, https://doi.org/10.1002/lol2.10409, 2024.
Santoro, A. E., Buchwald, C., McIlvin, M. R., and Casciotti, K. L.: Isotopic signature of N2O produced by marine ammonia-oxidizing archaea, Science, 333, 1282–1285, https://doi.org/10.1126/science.1208239, 2011.
Santoro, A. E., Buchwald, C., Knapp, A. N., Berelson, W. M., Capone, D. G., and Casciotti, K. L.: Nitrification and Nitrous Oxide Production in the Offshore Waters of the Eastern Tropical South Pacific, Glob. Biogeochem. Cycles, 35, e2020GB006716, https://doi.org/10.1029/2020GB006716, 2020.
Seitzinger, S. P.: Denitrification in freshwater and coastal marine ecosystems: Ecological and geochemical significance, Limnol. Oceanogr., 33, 702–724, https://doi.org/10.4319/lo.1988.33.4part2.0702, 1988.
Sigman, D. M., Casciotti, K. L., Andreani, M., Barford, C., Galanter, M., and Böhlke, J. K.: A bacterial method for the nitrogen isotopic analysis of nitrate in seawater and freshwater, Anal. Chem., 73, 4145–4153, https://doi.org/10.1021/ac010088e, 2001.
Small, G. E., Bullerjahn, G. S., Sterner, R. W., Beall, B. F. N., Brovold, S., Finlay, J. C., McKay, R. M. L., and Mukherjee, M.: Rates and controls of nitrification in a large oligotrophic lake, Limnol. Oceanogr., 58, 276–286, https://doi.org/10.4319/lo.2013.58.1.0276, 2013.
Stein, L. Y.: Insights into the physiology of ammonia-oxidizing microorganisms, Current Opinion in Chemical Biology, 49, 9–15, https://doi.org/10.1016/j.cbpa.2018.09.003, 2019.
Stieglmeier, M., Mooshammer, M., Kitzler, B., Wanek, W., Zechmeister-Boltenstern, S., Richter, A., and Schleper, C.: Aerobic nitrous oxide production through N-nitrosating hybrid formation in ammonia-oxidizing archaea, ISME J., 8, 1135–1146, https://doi.org/10.1038/ismej.2013.220, 2014.
Tang, W., Tracey, J. C., Carroll, J., Wallace, E., Lee, J. A., Nathan, L., Sun, X., Jayakumar, A., and Ward, B. B.: Nitrous oxide production in the Chesapeake Bay, Limnol. Oceanogr., 67, 2101–2116, https://doi.org/10.1002/lno.12191, 2022.
Wan, X. S., Hou, L., Kao, S.-J., Zhang, Y., Sheng, H.-X., Shen, H., Tong, S., Qin, W., and Ward, B. B.: Pathways of N2O production by marine ammonia-oxidizing archaea determined from dual-isotope labeling, P. Natl. Acad. Sci. USA, 120, e2220697120, https://doi.org/10.1073/pnas.2220697120, 2023.
Wang, J., Vilmin, L., Mogollón, J. M., Beusen, A. H. W., van Hoek, W. J., Liu, X., Pika, P. A., Middelburg, J. J., and Bouwman, A. F.: Inland Waters Increasingly Produce and Emit Nitrous Oxide, Environ. Sci. Technol., 57, 13506–13519, https://doi.org/10.1021/acs.est.3c04230, 2023.
Ward, B. B.: Nitrification, in: Encyclopedia of Ecology (Second Edition), vol. 2, edited by: Fath, B., Elsevier, Oxford, 351–358, https://doi.org/10.1016/B978-0-12-409548-9.00697-7, 2013.
Ward, B. B., Tuit, C. B., Jayakumar, A., Rich, J. J., Moffett, J., and Naqvi, S. W. A.: Organic carbon, and not copper, controls denitrification in oxygen minimum zones of the ocean, Deep-Sea Res. Pt. I, 55, 1672–1683, https://doi.org/10.1016/j.dsr.2008.07.005, 2008.
Weigand, M. A., Foriel, J., Barnett, B., Oleynik, S., and Sigman, D. M.: Updates to instrumentation and protocols for isotopic analysis of nitrate by the denitrifier method, Rapid Commun. Mass Spectrom., 30, 1365–1383, https://doi.org/10.1002/rcm.7570, 2016.
Wenk, C. B., Blees, J., Zopfi, J., Veronesi, M., Bourbonnais, A., Schubert, C. J., Niemann, H., and Lehmann, M. F.: Anaerobic ammonium oxidation (anammox) bacteria and sulfide-dependent denitrifiers coexist in the water column of a meromictic south-alpine lake, Limnol. Oceanogr., 58, 1–12, https://doi.org/10.4319/lo.2013.58.1.0001, 2013.
Wenk, C. B., Frame, C. H., Koba, K., Casciotti, K. L., Veronesi, M., Niemann, H., Schubert, C. J., Yoshida, N., Toyoda, S., Makabe, A., Zopfi, J., and Lehmann, M. F.: Differential N2O dynamics in two oxygen-deficient lake basins revealed by stable isotope and isotopomer distributions, Limnol. Oceanogr., 61, 1735–1749, https://doi.org/10.1002/lno.10329, 2016.
Xia, X., Jia, Z., Liu, T., Zhang, S., and Zhang, L.: Coupled nitrification-denitrification caused by suspended sediment (SPS) in rivers: Importance of SPS size and composition, Environ. Sci. Technol., 51, 212–221, https://doi.org/10.1021/acs.est.6b03886, 2017.
Zarfl, C., Lumsdon, A. E., Berlekamp, J., Tydecks, L., and Tockner, K.: A global boom in hydropower dam construction, Aquat. Sci., 77, 161–170, https://doi.org/10.1007/s00027-014-0377-0, 2015.
Zhou, S., Zhang, Y., Huang, T., Liu, Y., Fang, K., and Zhang, C.: Microbial aerobic denitrification dominates nitrogen losses from reservoir ecosystem in the spring of Zhoucun reservoir, Sci. Total Environ., 651, 998–1010, https://doi.org/10.1016/j.scitotenv.2018.09.160, 2019.
Zumft, W. G.: Cell biology and molecular basis of denitrification, Microbiol. Mol. Biol. R., 61, 533–616, 1997.