the Creative Commons Attribution 4.0 License.
the Creative Commons Attribution 4.0 License.
 | 01 Jul 2026
Quantification, spatial distribution and persistence of root-derived carbon for 12 crop species
Baptiste Hulin
Florent Massol
Simon Chollet
Francis Dohou
Stéphane Paolillo
Samuel Abiven
Organic carbon derived from roots is a major input fuelling soil organic carbon stocks, especially in agricultural systems, where aboveground biomass might be harvested. However, root sampling for carbon monitoring excludes net rhizodeposition, i.e., the organic compounds released by the roots that have not been rapidly mineralised, and some of the finest root debris, because this fraction of root-derived carbon cannot be directly quantified in the field. To compensate for this shortfall, we set up a two-month experiment with multi-pulse 13C-CO2 labelling of 12 crops to quantify these carbon pools at harvest, operationally grouped under the term SOCnew. We also investigated the spatial distribution of belowground carbon inputs within the soil profile. Lastly, in order to follow the fate of this carbon after the plant death, we performed a 524 d litterbag incubation in the field using the labelled material. We found that SOCnew accounted for 27 % of belowground carbon inputs at harvest. It was not correlated to carbon amounts of the shoots, but was positively correlated to root carbon (R2=0.14). The vertical distribution of SOCnew tended to follow the one of roots. The majority of SOCnew was recovered in the bulk soil, rather than solely adhering to the roots, which suggests that its release may influence SOC cycling across a large proportion of the soil volume above the rooting depth. We showed that SOCnew had a greater persistence time in the soils than roots throughout the 524 d observation period. However, these findings were marked by high variability because the small quantities of carbon involved make it difficult to assess persistence by isotopic difference. These results suggest that net rhizodeposition and fine root debris should be taken into account in organic carbon management of soils as it refines our estimation of belowground inputs. However, their low predictability, due to the diversity of products and processes, is still a barrier.
- Article
(618 KB) - Full-text XML
-
Supplement
(721 KB) - BibTeX
- EndNote


Organic Matter (OM) that originates from roots is a major Carbon (C) pool that fuels Soil Organic Carbon (SOC) stocks (Rasse et al., 2005). In many agricultural systems, this statement is even more valid as a large share of aboveground biomass is exported and therefore does not return to the soil. As a consequence, it is of major importance to quantify accurately root-derived C input for monitoring, modelling, or even crop selection for additional SOC sequestration purposes. To do so in the field or in mesocosm studies, there is a wide range of methodologies to sample the roots, from using augers to excavating the whole root system or disassembling the mesocosm (Freschet et al., 2021). However, in any case, it is necessary to separate roots from the surrounding soil, generally by hand. This process excludes a large amount of C that also contributes to fuelling the SOC stock. Notably, rhizodeposition, which encompasses the organic compounds released by roots into their surroundings during plant growth (Nguyen, 2003), is not covered, whereas this is a pool that can represent up to 20 % of the photosynthetically fixed C (Hütsch et al., 2002). Besides, fine root debris, such as root hairs or very fine roots, might not be taken into account in the definition of rhizodeposition, although they can also be excluded from root sampling, leaving a gap in the C balance of belowground inputs. These C compounds remaining at harvest form a heterogeneous pool whose operational definition may vary across studies. In recent works, it has been designated as SOCnew (Henneron et al., 2020a; Huang et al., 2021), although standardised terminology has, to our knowledge, not yet been adopted. We chose in this study to focus on SOCnew, which is a pool that comprises more C than the compounds strictly coming from rhizodeposition, as defined by Nguyen (2003).
In the last decades, a wide panel of methodologies has emerged to quantify rhizodeposition. Among them, labelling of plant material via an isotopic enrichment of the ambient CO2 (13C and 14C) has been widely used, as it allows to trace C down into the soil profile. These methodologies have allowed important advances for C rhizodeposition quantification and have demonstrated the relevance of considering it in C storage strategies. Nevertheless, this task remains challenging as rhizodeposition is composed of a broad variety of C compounds: exudation products like soluble low-molecular-weight organic C compounds; mucilage and border cells; various cell lysates or photosynthates allocated to symbionts (Jones et al., 2009). Their release into the soil is governed by a large range of processes: among the most well-documented, we can mention passive diffusion and active transport through the root cell membrane for exudates; secretion through exocytosis for mucilage or enzymes; detachment or lysis of root cells related to root growth or senescence (Jones et al., 2009). Besides, these processes predominate at different times in the plant's life cycle: C allocation to gross rhizodeposition as a whole declines with plant age, as does allocation to roots (Nguyen, 2003). Indeed, C allocation to these two pools is maximal during the first two months of growth for annual crops (Pausch and Kuzyakov, 2018). On the other hand, the senescence-related release of C shows an opposite trend by increasing with plant age (Hirte et al., 2018). To date, literature reviews have established differences in rhizodeposition quantification between large plant functional groups such as crops, pasture, or forest across studies (Li et al., 2024; Pausch and Kuzyakov, 2018). Differentiation between taxa such as families, species, or even genotypes has also been achieved (Semchenko et al., 2021; Ndour et al., 2022), but the limited data still prevents generalisation across different studies. For instance, Henneron et al. (2020a) showed for grassland species that legumes yielded more SOCnew than other forbs or grasses, which was contradicted by another study by Huang et al. (2021), who did not find significant differences between families, and who found high SOCnew production for Artemisia frigida and Cleistogenes squarrosa, a forb and a grass, respectively, against a low production for Medicago ruthenica, a legume. It is therefore necessary to conduct more comparative studies between different plants under the same conditions. Besides, they are valuable as they allow identifying predictors of rhizodeposition across taxa. Whereas C allocation to crop roots can be estimated from a large database on root biomass corrected with information on the environmental conditions and farming systems (Hu et al., 2018; Mattila and Häkkinen, 2025), or from dynamic allocation parameters supported by balanced-growth ecological hypotheses (Kleemola et al., 1996; Shipley and Meziane, 2002), C allocation to SOCnew is still poorly understood and requires further data. Promising recent works (Henneron et al., 2020a; Huang et al., 2021; Williams et al., 2022) comparing several species have led to significant advances that linked plant traits and rhizodeposition. They demonstrated that the latter is embedded in a roots economic spectrum and that aboveground photosynthetic traits are good predictors of rhizodeposition: acquisitive species, that have high growth rates, tend to allocate more C to rhizodeposition than conservative species. However, these studies were based on grassland species, and it is likely that extrapolation to crops is not straightforward.
In addition to the amount of C inputs, their persistence in the soil is also a major factor driving SOC storage (Minasny et al., 2017). The SOCnew pool and roots are the main contributor to SOC at least in the first year after incorporation, even when shoots are not harvested (Austin et al., 2017), such as in the case of cover crops, which is a practice that fosters additional SOC sequestration (Poeplau and Don, 2015; Pellerin et al., 2020). While it is well documented that roots tend to be more stabilised than aboveground parts due to their chemical and structural composition and their direct release in the soil (Rasse et al., 2005; Bertrand et al., 2006; Freschet et al., 2013; Villarino et al., 2021), there is little literature for rhizodeposition or fine root debris. Reviews suggest that more than half of the rhizodeposition C is lost to respiration within days of his release: around 55 % according to Jones et al. (2009) and around 57 % for crops according to Pausch and Kuzyakov (2018). Nevertheless, the fraction that remains after rapid microbial utilisation, i.e., net rhizodeposition, has been little studied. Some studies assessed the stability of rhizodeposits through size fractionation of OM but the results vary greatly from one to another: Islam et al. (2025) and Teixeira et al. (2024) found that more than 70 % of the remaining net rhizodeposition was incorporated into fine fractions, which correlated with its incorporation in microbial biomass. On the other hand, Bicharanloo et al. (2024) and Huang et al. (2021) retrieved more than 70 % in particulate OM. Weng et al. (2018) showed more nuanced results with 44 % of the rhizodeposits recovered in particulate OM. Fractionation methods are useful to approximate the stability of the remaining litters, but they do not provide information about the amount of rhizodeposits that has been lost since its release in the soil, as would incubations do.
Rhizodeposition is a fresh C input that can alter the cycling of native SOC, already present in the soil, by accelerating or decelerating its mineralisation (Robinson et al., 1989). This phenomenon is often named rhizosphere priming effect (Dormaar, 1990). Across one soil profile, the sensibility of native SOC to this priming might vary vertically: acceleration of native SOC cycling tends to be more pronounced in deeper soils, where mineralisation is slower (Henneron et al., 2022; Schiedung et al., 2023). In addition to quantifying rhizodeposition inputs, assessing its vertical distribution is also relevant to apprehend its repercussion on SOC. This is also valuable to predict the fate of root-derived OM itself, as its persistence might likewise depend directly on the horizon into which it is released (Berenstecher et al., 2021; Schiedung et al., 2023). Although rhizosphere priming effect generally enhances SOC mineralisation (Huo et al., 2017), it has been shown that an accumulation of rhizodeposits in the close vicinity of the roots may have the opposite effect by protecting SOC through aggregation (Baumert et al., 2018). This aggregation occurs in the rhizosheath (Teixeira et al., 2023), which is a root-adhering soil layer (Watt et al., 1994). As the rhizosheath mass varies across species or genotypes (Ndour et al., 2022; Teixeira et al., 2023), taking it into account and finding out whether SOCnew is mostly retrieved there might also help us to apprehend the trend of rhizosphere priming effect.
Here, we propose to establish a thorough C balance of belowground C inputs across 12 crop species. We set up a mesocosm experiment in a climate chamber under a 13C-CO2-enriched atmosphere to be able to trace root-derived products. We had three main objectives: (1) quantifying SOCnew and linking its release to root and shoot C; (2) disentangle the spatial distribution of SOCnew by assessing its vertical distribution and its vicinity to the roots; (3) assessing SOCnew persistence in the soil after harvest of the aboveground biomass through a following field incubation experiment.
2.1 Climate and labelling
12 plant species were grown in mesocosms for two months in three closed climate simulators in an ecolab simulation system (Verdier et al., 2014). Ecolab systems allow a realistic simulation of climate and ecosystem conditions within a large range of parameters. Here, we simulated a continental temperate summer climate by averaging six years of meteorological data from 15 August to 10 October, recorded on the CEREEP Ecotron IdF site (48°16′56.5′′ N, 2°40′15.9′′ E) (Fig. S1). Temperature and relative humidity were programmed to vary within a 10 min resolution. Photosynthetic Photon Flux Density (PPFD) was also simulated on a 10 min resolution step and discretised into 10 steps over a day, from 0 % to 100 % of the measured intensity. The maximum (100 %) average PPFD was equal to 1181 µmol of photons s−1 m−2 at the top of the mesocosms (soil surface). When light intensity meteorological data were higher than this maximum value, light intensity was set to 100 %. CO2 was set at 415 ppm during daytime and at 487 ppm during nighttime, corresponding to on-site measurements. Mesocosms were irrigated with deionized water by drippers and received in total 83 mm of water, which corresponds to the cumulative precipitation data over 56 d. Soil moisture was measured every 15 min in 12 separate mesocosms that were not used for C analysis and each contained one of the 12 plant species. We used two sensors (METER Teros 12) per mesocosm, one at the surface and one at 30 cm depth. As mesocosms soils generally dried faster than soils in the field, the irrigation frequency was smoothed over time to avoid the soil surface water content decreasing below 0.05 cm3 cm−3 to ensure plant survival. If the soil moisture level dropped below this value for any mesocosm, regardless of the species, irrigation was launched for all mesocosms. At day 16, the plants were fertilised with an ammonium nitrate solution, at a dose equivalent to 40 kg of Nitrogen (N) per hectare to ensure growth and to simulate mineral residual soil N following a crop harvest.
To label plant material, we performed multiple injections of 13C-CO2 (99 %). Whereas to assess the dynamic transfer of recent photoassimilates, a single pulse of enriched CO2 is well suited, continuous labelling is preferred to ensure that all root-derived products are labelled and the rhizodeposition can be quantified (Studer et al., 2014). Nonetheless, multi-pulse is a robust alternative if pulses are injected very regularly within a short period of time (Warembourg and Estelrich, 2000). To do so, the δ13C isotopic signature of the air in the chambers was measured on line with a cavity ring-down spectroscopy CO2 analyser (PICARRO G2201-i) coupled to a multiplexer switching between the different chambers during the whole experiment, in order to control the duration and number of injections (Fig. S2). 13C-CO2 signature and atmospheric CO2 concentration were controlled separately.
2.2 Plant and soil material
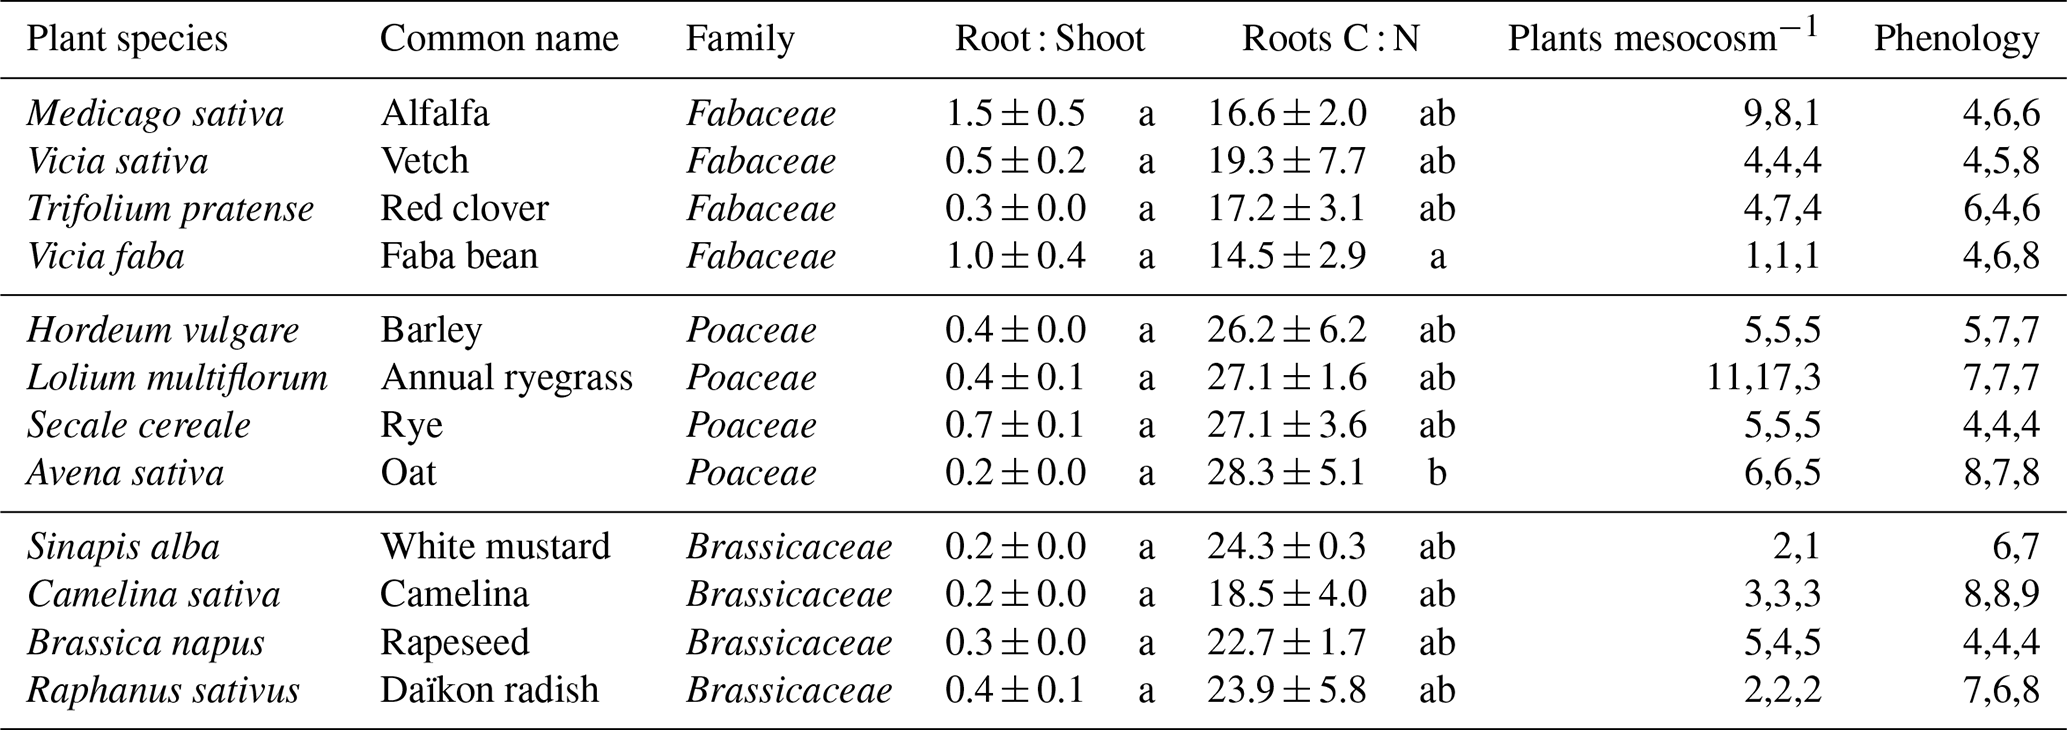
The 12 plant species, listed in Table 1, are crops from three families (Fabaceae; Poaceae and Brassicaceae). They were selected to cover a wide range of plant traits and for their ability to be grown in the targeted period. Except for Medicago sativa, which is perennial, each species could potentially be selected for an intermediate cropping in temperate regions. The growth period of 56 days was chosen, as it is the minimum period permitted before the crop can be destroyed, according to French regulations in areas vulnerable to nitrate pollution. They were sown in the mesocosms at a different time to target a simultaneous plant emergence. We sowed twice the amount of seeds recommended by French technical institutes for a pure intermediate crop (Table S2) (ARVALIS, 2022). In the first two weeks, some seedlings have been removed if the seed germination rate exceeded 50 %. The number of seeds ranged from two for faba bean to 64 for alfalfa. The number of plants that have been maintained is available in Table 1.
Polyvinyl chloride mesocosms of 20 cm diameter were filled with 13 L of sandy soil (6.9 % clay, 19.0 % silt, 74.1 % sand for the upper horizon) (Agapit et al., 2018). This soil was excavated from a semi-open habitat (grassland, shrubs and individual trees) of the research station by distinguishing two operational horizons and was sieved at 1 cm. Soil was then packed in the mesocosms to recreate the two horizons after homogenisation. The upper horizon was 20 cm deep, and the lower one 25 cm deep. Both were packed at a density of 1.2, corresponding to realistic values found on site. C concentrations and δ13C isotopic signatures are 7.2 gC kg−1 and −27.4 ‰ for the upper horizon and 4.3 gC kg−1 and −26.2 ‰ for the lower horizon, respectively. This design of 12 mesocosms was replicated three times across three climate chambers simulating the same atmospheric conditions.
2.3 Sample collection, preparation and analysis
After 56 d, mesocosms were unpacked with a minimal destruction of the structure, by extracting the entire soil core from the pot. Standing aboveground biomass and dead leaves, if any, were collected after cutting the stems at the soil surface. The phenological stage was recorded according to the BBCH scale (Meier, 2003). Roots were at first extracted manually. The soil was then sieved at 2 mm with a minimal shaking, so that remaining fine roots could be sampled with tweezers. All roots were then washed with tap water. We distinguished roots from the upper and lower horizon. Soil was collected in both horizons in several places to obtain a composite sample of 500 g. Out of each planted mesocosm, the root system of one plant was carefully isolated, and the rhizosheath, which is the soil adhering to the roots after root extraction and shaking (Brown et al., 2017), was collected in both horizons when possible with a paintbrush for this specific plant, after a gentle shaking of the root system. The rhizosheath and its corresponding roots were weighted. It allowed us to obtain a Rhizosheath:Root ratio and therefore to estimate the whole rhizosheath soil mass for each mesocosm with Eq. (1).
mroots is the whole mesocosm root mass and isolated.mrhizosheath and isolated.mroots are the masses of rhizosheath and roots subsamples respectively. More rhizosheath soil was collected on the roots from the other plants of the mesocosm, but without associating it with a root mass. Soil samples of both horizons and of both locations (bulk vs. rhizosheath) were dried at 40 °C, sieved at 2 mm, milled and analyzed for total C and isotopic signature δ13C with cavity ring-down spectroscopy (PICARRO G2201-i/COSTECH). For every soil compartment, a humidity correction was applied after heating a soil subsample at 105 °C, to obtain a soil mass. Rhizosheath soil was analysed only when more than 13 g of sample was collected in one horizon. Plant material was dried at 40°C, weighted, milled and was analyzed for C and δ13C, as well as for total N (Thermo Fisher Scientific FlashHT).
2.4 Root-derived carbon (SOCnew) calculation
We grouped net rhizodeposition and non-collected fine root debris under the term SOCnew, which is in our case the labelled SOC remaining after roots extraction and sieving at 2 mm. We calculated this amount (kg) of root-derived C with Eq. (2) in four compartments (2 horizons × 2 localisations: bulk soil vs. rhizosheath soil). We obtained the total SOCnew of one mesocosm by summing all the compartments.
With δ13Csoil and δ13Croot being the δ13C isotopic signature (‰) of the soil sample and of the corresponding labelled roots, respectively. δ13Creference is the mean δ13C of the soil before the plants were sown, at the corresponding horizon (n=20). OCsample is the mass of OC contained in the soil compartment (kg), obtained with the OC concentration of the sample. This equation assumes that SOCnew has an isotopic signature similar to that of roots. As this is a strong assumption, we also provide a quantification of SOCnew calculated with the δ13C of the shoots instead of δ13Croot for comparison (Fig. S4). We calculated specific SOCnew (kg kg−1) by dividing SOCnew by root C. We expressed C quantities per hectare (kg ha−1) in Fig. 1 and S4 by doing a cross product with the surface of the mesocosms.
2.5 Incubation experiment
Following the first experiment, we used the labelled material to perform a litterbag incubation in the field. Out of the 12 species, six species (2 per family) were chosen to be incubated: Vicia sativa; Vicia faba; Secale cereale; Avena sativa; Brassica napus and Raphanus sativus var. longipinnatus. Plant and soil material was placed in 100 mm × 100 mm nylon bags with a mesh size of 50 µm. This mesh size only enables microfauna to access the fresh material, but limits the diffusion of SOCnew particles out of the bags.
The design comprises two general treatments, applied to each of the six plants and their corresponding soil: (1) To assess SOCnew decomposition, 50 g of labelled soil was directly placed in the bags. (2) To assess root decomposition, 50 mg of dry labelled roots were mixed with around 50 g of sieved unlabelled soil, corresponding to the soil used in the first labelling experiment. This represented from 0.9 % to 10.3 % of the C in the bags Broots at the start of the incubation. The roots were fine roots (≤ 2 mm), except for Raphanus sativus, where some of the taproot was mixed with fine roots due to a lack of material. In the following, we will use BSOCnew and Broots to refer to the bags of these two treatments. Each combination of treatment and plants was replicated three times, using plants and soils coming from different mesocosms. Besides, three bags were filled with control soil. This whole design was replicated four times, to allow four sampling dates.
Incubation started on 20 December 2023. The bags were buried at a 10 cm depth in the soil of a Poaceae-dominated grassland of the research station CEREEP-Ecotron IDF and recovered by means of a wire emerging from the soil. For year 2024, the mean annual temperature was 13.1 °C and cumulative rainfall was 844.7 mm. The incubation site was in the direct vicinity from the excavation site of the soil inside the litterbags. We consider that they are similar. Four sets of bags were recovered after 124, 195, 330 and 524 d. The whole content of each bag was dried at 40 °C, milled and analyzed for total C and δ13C. When retrieving the bags, attention was paid to preserve clods of soil and thus vegetation above the bags. After 124 d, plant cover (Vicia sativa; Sinapis alba; Secale cereale) was sown to maximise vegetation recovery.
2.6 Carbon loss calculation during the litter bag incubation
We first calculated the proportion of C originating from the plant for each bag, Fplant, be it SOCnew or roots, with Eq. (3). This was done for all collected bags and for the initial labelled soil of BSOCnew, before the incubation (t0).
δ13Cbag, δ13Ccontrol, and δ13Croot are the C isotopic signatures of the labelled and control soil in the bag and the corresponding roots respectively. For bags Broots, δ13Croot was measured independently of the first experiment to account more precisely for the roots subsample specifically used for the incubation. We used the mean of all controls for δ13Ccontrol, irrespective of the collection time, for bags Broots, whereas for bags BSOCnew, we used −27.4 ‰, in accordance with the previous labelling experiment.
We then calculated the concentration of plant-derived products, [SOCplant] (gC kg−1), with Eq. (4).
[OCsample] is the OC concentration of the sample (gC kg−1).
To assess SOCnew loss, we calculated its remaining proportion, SOCnewremaining (%), by dividing [SOCplant] of the bags BSOCnew at day ti by the initial [SOCplant] at harvest (t0) with Eq. (5).
If SOCnewremaining was above 100 % or below 0 %, we chose to assign it 100 % or 0 % respectively, instead of removing the data point.
To estimate the C loss of roots Rootsremainingti (%), we devided the root C remaining at the sampling date ti, estimated with Fplant, by the original amount of root C added in the bag, according to Eq. (6).
masssoilt0 and massrootst0 are the initial masses (kg) of the control soil and the roots mixed in the bags and [OCroot] the respective root C concentrations (gC kg−1).
2.7 Statistical analysis
We used mesocosms as the statistical unit for our analyses. Consequently, we had 35 data points, corresponding to 12 species replicated three times each, except for mustard, where plant growth failed in one mesocosm. One mesocosm may contain one single plant or several plants, according to the sowing density (Table 1). For the latter case, quantitative values, C amounts or Root : Shoot (R : S) ratios for instance, stand for the entire mesocosm. In the text, the error associated with means is ± the standard deviation. For the figures, it is specified in the caption. All statistical analysis were performed with R language (R Core Team, 2021). For p-values of models or models parameters, we set the significance threshold at 0.05. However, in certain cases that are specified in the text, we report a trend when p-values <0.1.
Comparisons between species (n=3) were performed using one-way analysis of variance. Posthoc comparisons were performed with Tukey HSD tests. To compare families (n=12), we adopted a linear mixed-effects model with the species as a random effect to account for the hierarchical structure, with the package lme4 (Bates et al., 2015). Only the intercept was allowed to vary. We then performed an anova on the model with the package car (Fox and Weisberg, 2019) and a multiple comparison with the package emmeans that uses the marginal means (Searle et al., 1980).
To test for linear correlations between quantitative variables, we also selected linear mixed-effects model with the species as a random effect to let the intercept vary. For these models, we report the marginal R2, that accounts for the variability explained by the fixed effects, calculated according to the recommendations of Nakagawa and Schielzeth (2013) with the package Performance (Lüdecke et al., 2021).
For the incubation experiment, we did not fit any decomposition models given the low number of sampling dates. To compare decomposition status of SOCnew and roots, we performed paired Student's t-tests for each sampling date. To compare species, we performed one-way analysis of variance followed by Tukey HSD tests. The list and results of statistical analysis are available in Hulin et al. (2025).
3.1 Quantification of the inputs
3.1.1 Shoot and root C quantification
After 56 d of growth, the spectrum of phenological stages was spanning from the development of harvestable vegetative plant to senescence in certain cases (Table 1). We observed the highest net C production in shoots and roots for Poaceae (Fig. 1). The latter exhibited the highest shoot C values with a mean of 2513 ± 613 kgC ha−1, but also high root C values with a mean of 1065 ± 408 kgC ha−1 except for oat (636 ± 80 kg or root C ha−1). R : S ratios varied from 0.2 to 1.5 across all species with no significant differences between species (Table 1). As expected, the only perennial crop, alfalfa, exhibited the highest R : S ratio (1.5 ± 0.5).
Table 1List of plant species, plant traits, plant density and phenological stage. R : S ratio is a ratio calculated with C quantities in roots and shoots. For R : S and Carbon : Nitrogen (C : N) ratios, values are averages for species ± their standard deviation (n=3 mesocosms). The letters indicate the results of tukey HSD tests. For the number of plants per mesocosm, each value of each mesocosm is directly reported. Phenological stages were recorded at harvest according to the BBCH scale (Meier, 2003). 4: Development of harvestable vegetative plant parts or vegetatively propagated organs/booting (main shoot); 5: Inflorescence emergence (main shoot)/heading; 6: Flowering (main shoot); 7: Development of fruit; 8: Ripening or maturity of fruit and seed; 9: Senescence, beginning of dormancy.
3.1.2 SOCnew quantification
At crop harvest, the bulk soil was significantly enriched in 13C compared to the beginning of the experiment () with a mean δ13C difference of 2.6 ‰, both horizons together, which allowed us to calculate SOCnew in every soil compartment. We found that total SOCnew represented between 169 (average for clover) and 441 (average for barley) kgC ha−1, with an average of 284 ± 113 kgC ha−1 all species considered (Fig. 1). However, the labelling procedure led to temporal heterogeneity in the atmospheric δ13C, particularly during the second week of growth, during which the labelling was less pronounced (Fig. S2). This resulted in discrepancies between the δ13C of roots and shoots, especially for Poaceae and Brassicaceae that exhibited a higher root labelling (Fig. S3). As a result, using the δ13C of roots as the plant end-member in Eq. (2) is a strong assumption. Therefore, we also calculated SOCnew with δ13C of shoots as the plant end-member and found amounts of C that are lower by 18 % across all species and by 26.8; 27.0 % and 7.4 % for Brassicaceae, Poaceae and Fabaceae respectively (Fig. S4). As belowground allocation of recently fixed C is a fast process (Pausch and Kuzyakov, 2018), some rhizodeposition products depend on shoot growth and therefore, our SOCnew estimations based on root isotopic signature, that we use throughout this manuscript, might be slightly overestimated.
In terms of relative allocation, SOCnew accounted for 9.9 ± 3.5 % of all three C pools and 27.8 ± 10.3 % of belowground C pools (roots + SOCnew), all species comprised (Fig. 1). Brassicaceae, with a mean at 38 ± 10.6 %, had the highest relative belowground C allocation to SOCnew (). For instance, mustard and camelina showed high specific SOCnew, along with a low R : S ratio. Indeed, we observed that specific SOCnew was negatively correlated to root C amounts (R2=0.20) (Fig. 2). Regarding the correlation between the other C pools, we found a positive correlation between SOCnew and root C amounts (R2=0.14) (Fig. 2) and no correlation between SOCnew and shoot C amounts.
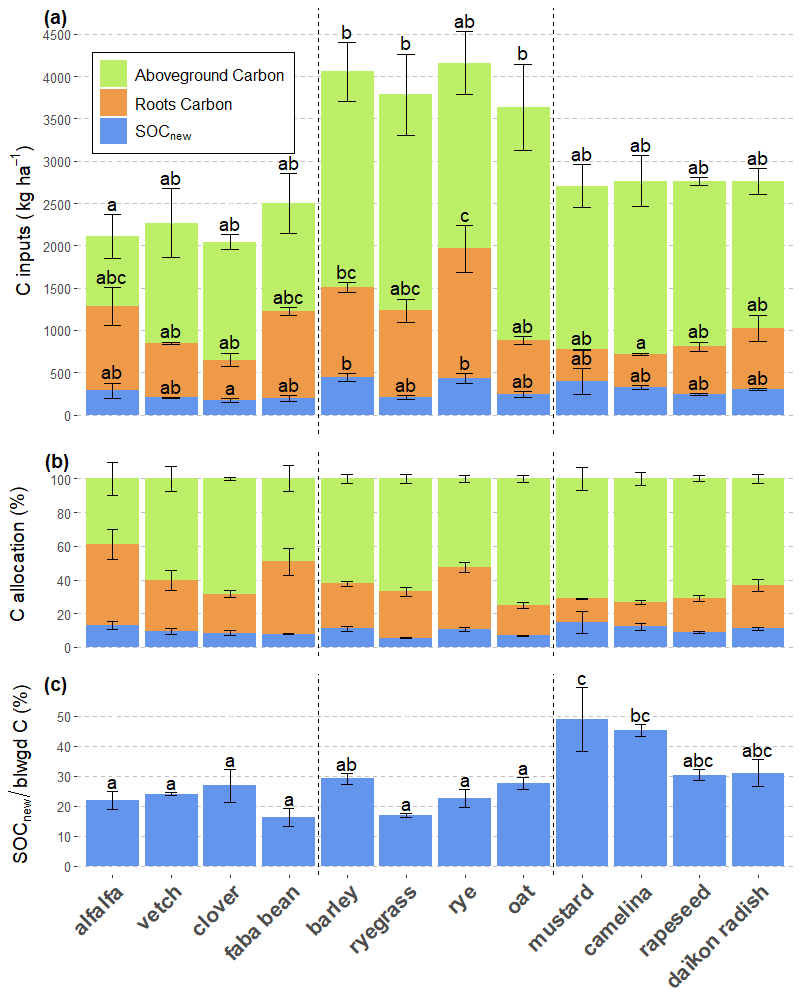
Figure 1C allocation to different pools for 12 plant species: (a) net primary production, scaled to the hectare with the mesocosm's surfaces; (b) relative C allocation to SOCnew, roots and shoots; (c) share of belowground C (blwgd C) inputs allocated to SOCnew. Values are average values for species and error bars equal two standard errors (n=3 mesocosms). Lowercase letters represent significant differences (p<0.05) between species for the total net primary production (upper panel) and for the SOCnew : Belowground C inputs ratio (lower panel). Vertical dashed lines separate plant families displayed in the following order from left to right: Fabaceae; Poaceae; Brassicaceae.
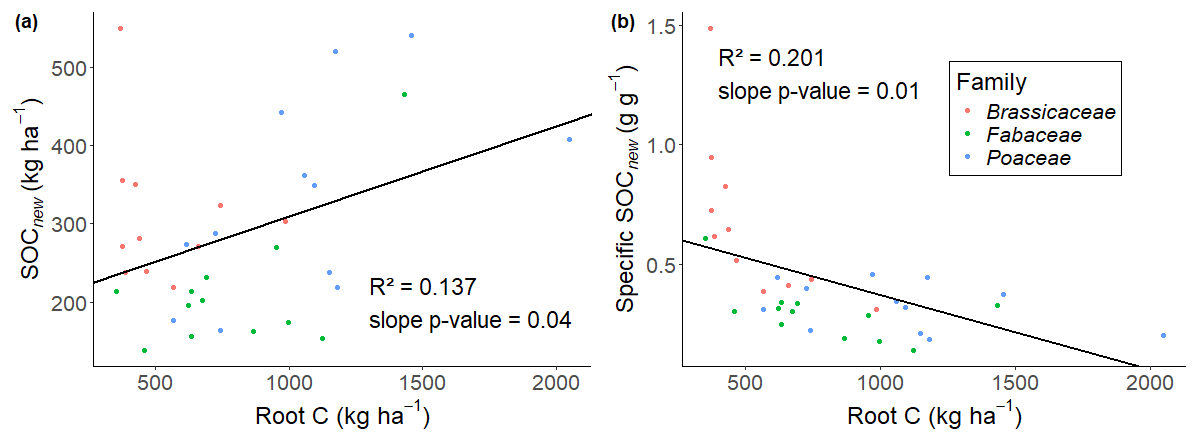
Figure 2Linear correlations between (a) SOCnew and Root C amounts, (b) specific SOCnew and Root C amounts. The slope was obtained with a mixed-effects model with species as a random effect, to let the intercept vary. The R2 are marginal R2.
3.2 Spatial distribution of belowground inputs
3.2.1 Vertical distribution
We retrieved 38 ± 13 % of SOCnew in the lower horizon in average for all species (Fig. 3). Differences were observed between species. For instance, alfalfa and barley allocated up to 50 and 55 % of SOCnew below 20 cm respectively, whereas this value dropped to 19 % for daikon radish, whose root biomass was concentrated in the topsoil which contained most of the thick taproot. The distribution of root C follows the same pattern as SOCnew with 36 ± 10 % of the C retrieved in the lower horizon (Fig. 3). We observed a weak linear correlation between the distribution of root C and SOCnew ().
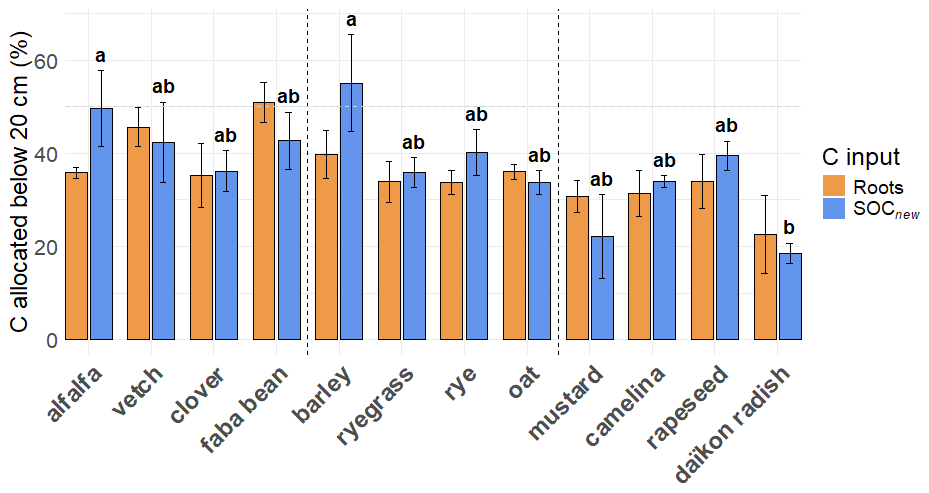
Figure 3Root C and SOCnew retrieved in the soil horizon below 20 cm (20–45 cm). The bar heights represent the mean values for each species and error bars equal two standard errors. The significant letters are only reported for SOCnew as no significant differences were observed for roots.
3.2.2 Bulk soil vs. rhizosheath
We also investigated whether SOCnew was retrieved in the close vicinity of roots or further away from the rhizosheath. We found that only 14 ± 14 % of SOCnew was retrieved in the rhizosheath, i.e., in the soil adhering to the roots when sampling was possible (Fig. 4). In the upper horizon, this accounted for 14 ± 14 % of SOCnew, and 18 ± 20 % in the lower horizon, without any significant difference between horizons (paired t-test). We observed high variations between plants, from 40 % (raygrass) to 2 % (daïkon radish) or even no value as too little rhizosheath soil was available for the analysis (mustard), although the differences were not significant with the limited number of data points. This fraction of SOCnew was correlated to the mass of rhizosheath (R2=0.82), which differed significantly between plants (Fig. 4) (). Rhizosheath mass represented in average 2.0 ± 2.3 % of the soil mass in our experiment, all species comprised (when sampling was possible). The highest rhizosheath values were retrieved for Poaceae, which retained the most soil with their arbuscular root system: 4.3 ± 2.9 % of the soil mass. Whereas the amount of SOCnew in the rhizosheath is closely linked to the rhizosheath mass, the latter is not correlated to the total amount of SOCnew retrieved in the mesocosm (Fig. 4).
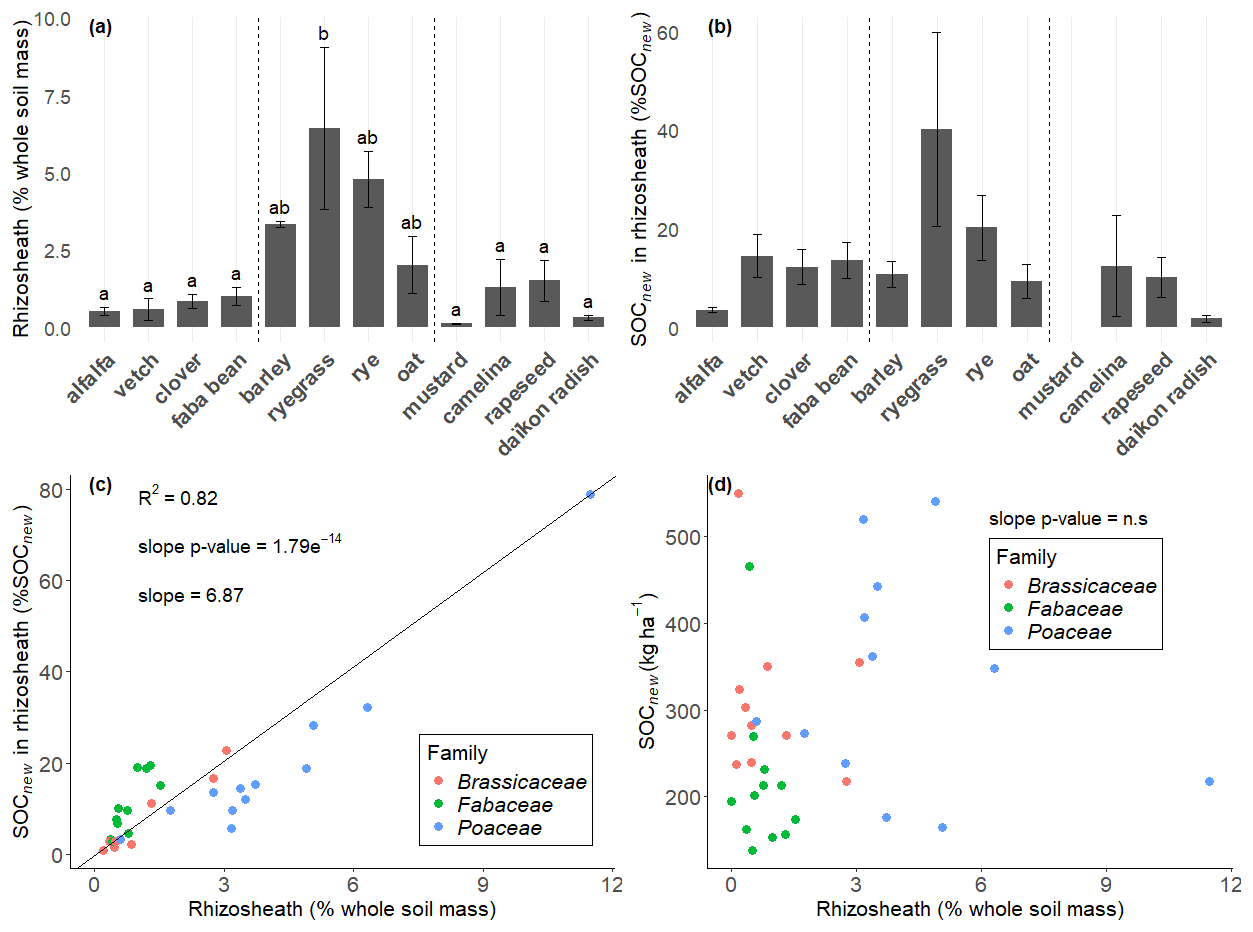
Figure 4(a) Mass fraction of the soil comprised in the rhizosheath, calculated with Eq. (1). (b) Mass fraction of SOCnew comprised in the rhizosheath. The bar heights of the two bar plots represent the mean values for each species, and the error bars represent two standard errors. The significant letters are only reported for the rhizosheath mass fraction as no significant differences were observed for SOCnew mass fraction. (c) Relationship between both mass fractions (SOCnew mass fraction and rhizosheath mass fraction). (d) Relationship between total SOCnew in the mesocosm and rhizosheath mass fraction. Each point stands for one mecosom. The slope was obtained with a mixed-effects model with species as a random effect, to let the intercept vary. The R2 is the marginal R2.
3.3 Persistence of belowground inputs
The root incubation revealed a fast C loss, with 32.7 ± 23.2 % of the root C remaining after 124 d, all plants combined (Fig. 5, Table 2). This tended to reach a plateau as we observed similar values for the other dates of harvest, with 23.7 ± 13.8 % remaining after 524 d. We observed significant differences in mineralisation status between plant species at days 124 and 524 only ( and respectively). These differences were mainly driven by faba bean, which exhibited slower decomposition than non-legume species, and, to a lesser extent, by vetch at day 524. However, no significant pattern was detected for other species and sampling dates.
A first important result for SOCnew decomposition is that we did not see any significant difference between species. However, a high uncertainty is associated with the results, and the decomposition curves do not show a clear decreasing exponential pattern, as often seen in such experiments (Fig. 5). Indeed, its calculation yielded nine incoherent values (≤ 0 % or ≥ 100 %) out of 65 bags recovered, due to a δ13C lower than the control or to an increase of the δ13C compared to t0. We attributed this to the fact that fresh SOCnew is a very small fraction of SOC (between 0.34 % and 1.71 % at the start of the incubation), resulting in a small δ13C difference with the control, exacerbating errors due to analysis and handling. Indeed, initial δ13C of the bags containing SOCnew varied from −21.929 ‰ to −25.9 ‰, whereas the mean value of native SOC is −27.4 ‰.
Table 2Proportion of the fraction of OC remaining at the four sampling times ± standard deviation (n=18). The p-value indicates the results of the bilateral paired t-tests comparing SOCnew and roots.
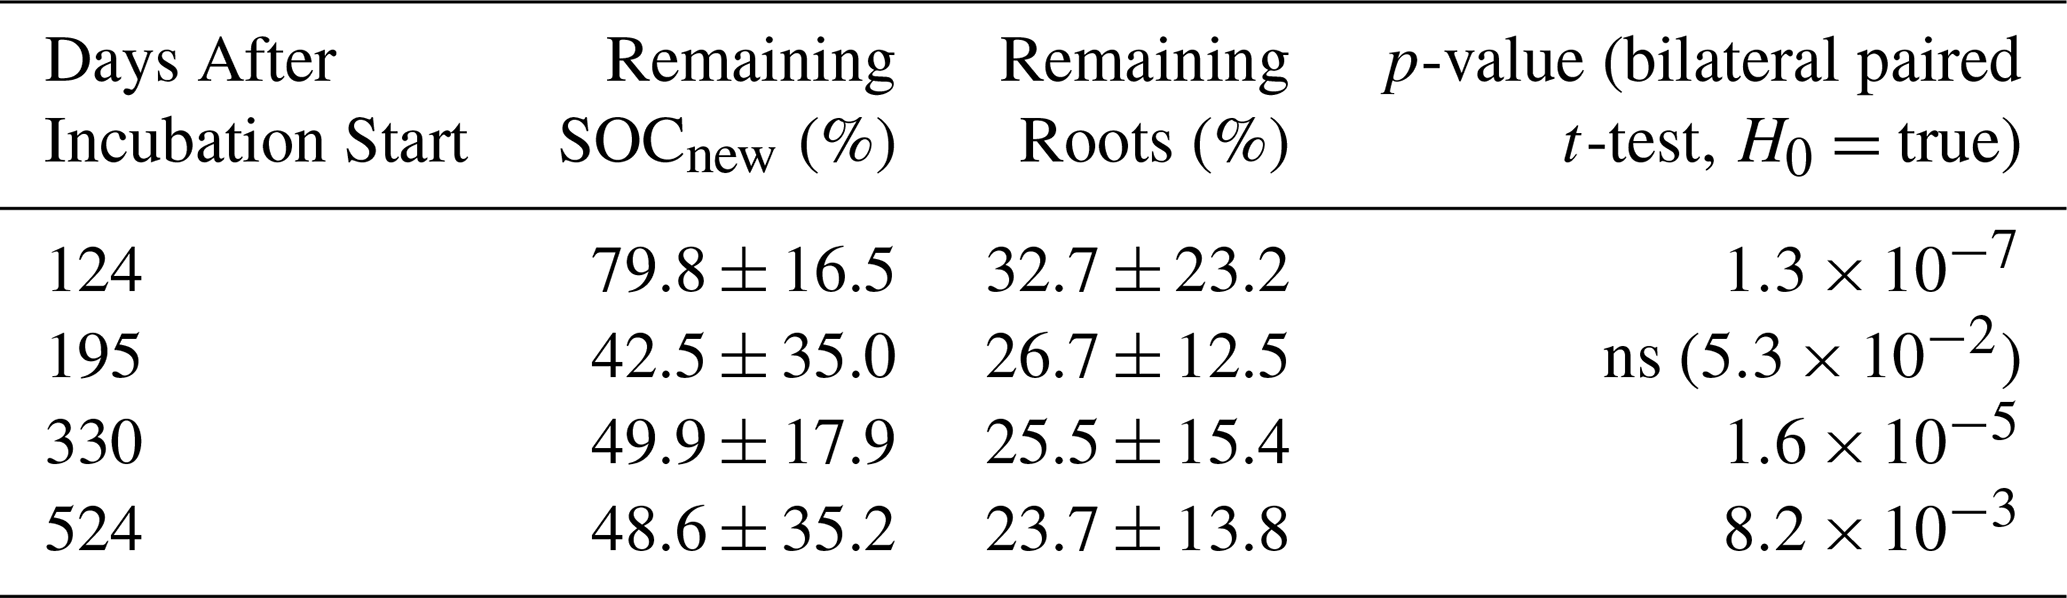
Nevertheless, we were able to observe that SOCnew tended to have a significantly slower decomposition than roots, at least for three sampling dates (Fig. 5, Table 2). After 524 d, 48.6 ± 35.2 % of SOCnew was remaining.
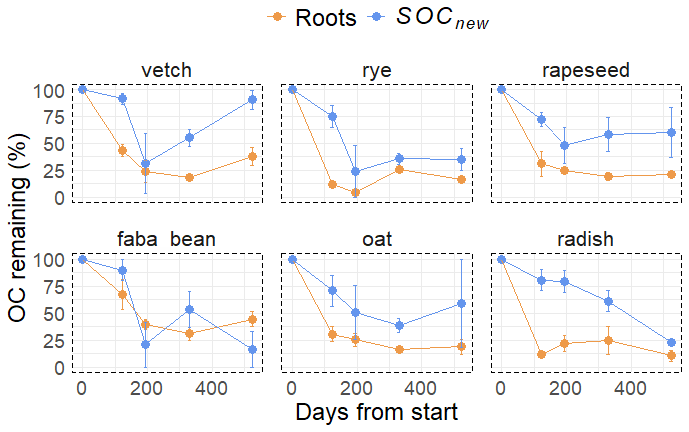
Figure 5Proportion of OC remaining at the four sampling times, for the six species that were incubated. Day 0 is the incubation start. Values are means per plant species, and error bars represent two standard errors (n=3).
4.1 Contribution of shoots and roots to SOCnew formation
4.1.1 C allocation to shoots and roots
Comparing our results with studies that report root and shoot C inputs is challenging as the varieties, the duration time, the methods and the pedoclimatic context may greatly influence biomass production. Besides, roots were limited to a depth of 45 cm, unlike in the field. We can nevertheless compare to relative data, such as comparisons between plants or R : S ratios. A field study that shared three of our species also found that rye had a higher aboveground and belowground biomass than Fabaceae (Sainju et al., 1998). A greenhouse experiment (1 m3 mesocosms) showed similar results: a higher aboveground and belowground biomass for Poaceae than for Fabaceae. However, they also observed the highest aboveground and belowground biomass for Brassicaceae, unlike our study (Hudek et al., 2022). Brassicaceae are commonly sown at lower densities than Fabaceae and Poaceae: we had only one plant per mesocosm in our experiment. We believe that the surface area of our mesocosms (285 cm2) was a limiting factor for crops sown at low density, and thus the biomass of Brassicaeae could be underestimated in our study. For many species, we observed a relatively good seedling emergence rate, ≥ 50 % in 20 of the 35 mesocosms. Considering that we doubled the number of seeds compared to recommendations from technical institutes, and considering that emergence rates in the field are generally lower than 50 % in August (ARVALIS, 2025), we may obtain a plant density in our mesocosms that is higher than in the field. As a result, this could lead us to overestimate total plant biomass (roots and shoots) of the whole mesocosm as the latter generally increases with the density. Besides, Root : Shoot ratio may also be influenced as the root mass fraction generally decreases with density (Postma et al., 2021). Regarding the R : S ratio, we noted deviations from the literature: Bolinder et al. (1997) found a ratio of 0.4 for oat, against 0.2 in our case, and Bolinder et al. (2002) found a ratio of 0.7 for alfalfa, against 1.5 in our case. The other crops exhibited values that were in line with the literature. For instance, Bolinder et al. (1997) compiled several field data in western Canada: they reported R : S ratios from 0.4 to 0.6 for barley, against 0.4 in our case. A review from Ahmadi et al. (2025) reported values from 0.08 to 1 for rapeseed, against 0.3 in our case. We suggest that our root and shoot biomass data, obtained in mesocosms under controlled conditions, are of the same order of magnitude as field data, even though extrapolation is limited in certain cases, such as for Brassicaceae for instance.
4.1.2 Relationship between shoot and root C inputs and SOCnew formation
Our quantification of SOCnew is in line with single-pulse labelling studies on crops, as reviewed in Pausch and Kuzyakov (2018), which found that SOCnew represented on average 23 % of belowground C inputs, compared to 27.8 ± 10.3 % in our study. On the other hand, larger-scale studies using full growing-season labelling have reported that SOCnew can equal or even exceed root C inputs (Davenport and Thomas, 1988; Hirte et al., 2018). One reason for that could be that root senescence and turnover had more time to occur, thus fuelling the SOCnew pool.
We did not observe a statistical relationship between SOCnew and shoot C production. This latter result contradicts other studies stating that aboveground photosynthetic traits are good predictors of SOCnew (Baptist et al., 2015; Henneron et al., 2020a; Huang et al., 2021). It was indeed proposed by Henneron et al. (2020a) that net rhizodeposition is embedded within a root economics space, with fast-growing species producing high amounts of SOCnew. Our contradictory results could be partly explained by the fact that phenological stages differed amongst our plants at harvest: after 56 d of growth, phenological stages ranged from the development of harvestable vegetative plant to senescence in some cases (Table 1). C allocation does depend on phenology: for annual plants, relative allocation to roots decreases in favour of supporting tissues and reproductive organs with plant age (Hegazy et al., 2005). Here, we observed a non-significant trend (Fig. S5). Therefore, our results on relative C allocation could have evolved with a longer growth period. Our experimental design was designed to simulate an agronomic practice, namely the destruction of cover crops after two months of growth, but it is not optimal for identifying predictors of SOCnew. Moreover, it is questionable whether plant trait-based theories are applicable to crop species, which have likely undergone substantial trait shifts due to varietal selection (Veeken et al., 2022). Lastly, we also have to highlight that SOCnew is likely to represent the least reactive portion of gross rhizodeposition. Indeed, soluble compounds have a mean residence time of the order of the hour (Ryan et al., 2001; Jones et al., 2009) whereas mucilage, border cells, root hairs or even fine roots comprise complex molecules which take longer to decompose. Whereas root economics space theory is well suited to study exudation (Wen et al., 2022; Williams et al., 2022), coarser rhizodeposition leading to SOCnew might be more related to root growth dynamics, as observed by Atere et al. (2017) for rice.
On the other hand, root C was a better predictor although the linear relationship with SOCnew is relatively weak (R2=0.14). Indeed, specific SOCnew was negatively correlated to root C amounts (R2=0.20) (Fig. 2), as observed by Baptist et al. (2015). This result is inconsistent with the previous relationship and indicates that SOCnew cannot be reliably estimated using a fixed allocation coefficient. Indeed, when less root biomass is harvested, SOCnew represents a larger relative fraction, leading to bias in such an approach. This is likely due to the fact that rhizodeposition mostly occurs at the root tip (Nguyen, 2003) and less in the differentiated zone, that might account for a large share of root biomass. This may also be partly explained by the sampling strategy, as a portion of the finest roots may have been incorporated to the SOCnew compartment, thus being at the expense of root biomass for species with fragile roots.
4.2 Spatial distribution of SOCnew
4.2.1 Vertical distribution of SOCnew and implications for stabilisation processes
When we consider C sequestration in soils, studying the vertical distribution of C inputs is of major importance for at least two main reasons: (1) the stabilisation processes of the recent inputs might vary according to the depth, with a preferential accumulation of root C often observed below 20 cm (Gill et al., 1999; Dietzel et al., 2017), possibly explained by a higher physico-chemical protection (Rasse et al., 2005) and (2) the magnitude of the priming effect induced by the inputs also differs between soil horizons. This is notably due to differences in OM content and stability: the deep horizons, that receive less fresh C inputs, are more prone to positive priming effect (Bastida et al., 2019; Schiedung et al., 2023). At the beginning of the experiment, the δ13C of the subsoil (20–45 cm) (−26.2 ± 1.0 ‰) was significantly higher than for the topsoil (0–20 cm) (−27.4 ± 0.5 ‰) (). This 13C enrichment with depth is a common observation reflecting an enrichment in microbial-derived products at the expense of fresh OM and an increased stability of OM (Schweizer et al., 1999; Boström et al., 2007; Schaub and Alewell, 2009). This observation shows that the difference in SOM stability is true in our case and that considering the vertical distribution of C inputs is relevant even on a profile which is only 45 cm deep. Our results suggest that deep-rooted crops will also lead to a deep release of SOCnew as expected (Farrar et al., 2003). This implies that both C inputs might be subject to the stabilisation mechanisms that are inherent to the horizon. While SOCnew might be preferentially stabilised in deep horizons, its release may also alleviate the bioenergetics constraint that protects deep native SOC, resulting in accelerated mineralisation (Henneron et al., 2022). Both mechanisms should be considered when accounting for rooting depth in efforts to enhance C sequestration.
4.2.2 SOCnew distribution in bulk soil and rhizosheath
Our results highlight that most of SOCnew is retrieved in the bulk soil, regardless of the soil horizon. This suggests that SOCnew may extend beyond the immediate root vicinity and that its release may influence SOC cycling across a larger soil volume than the rhizosheath alone. For instance, an enhancement of native SOC cycling that would be associated to rhizodeposition release (Huo et al., 2017) may affect most of the soil volume above the maximal rooting depth. On the other hand, the deceleration through SOC protection in aggregates (Andrade et al., 1998; Baumert et al., 2018; Li et al., 2020), which is restricted to C accumulation zones near the roots, concerns a lower amount of native SOC and might differ between species as they retain different amounts of soil around their roots.
We consider it important to state here that the rhizosheath mass is not a suitable proxy to estimate the quantity of rhizodeposition, or at least net rhizodeposition (Fig. 4). The rhizosphere represents the soil under influence of the roots (Hinsinger et al., 2006; York et al., 2016), thus comprising all rhizodeposition compounds, and as the rhizosphere soil is often sampled in an operational way that in fact solely accounts for the soil rhizosheath (Freschet et al., 2021), focusing only on the soil layer attached to the roots could lead to the omission of an important component of the C inputs that will influence the biogeochemical cycles of the soil.
4.3 Persistence of belowground inputs
We compared our results on root decomposition with data from literature reviews from which we recalculated a percentage of dry mass presumed to be remaining at day 524 (Table S1). Our decomposition rates for graminoids are in line with literature values reporting 12 % to 17 % of the C remaining at day 524 (Silver and Miya, 2001; Zhang and Wang, 2015; See et al., 2019) against 17 % in our case (Rye and Oat). However, for forbs, we observed a slower decomposition rate compared to See et al. (2019) who reported a mean of 1 %, against 27 % in our case (faba bean, vetch, rapeseed and radish). The only differences between species that we observed were for legumes whose roots exhibited lower decomposition at two sampling dates. This was unexpected as legumes have the lowest C : N ratios (Table 1). Even though C : N is explaining less than 5 % of the variance of decomposition for fine roots at a global scale, the expected trend is in the opposite direction (Zhang and Wang, 2015). However, no pattern was detected for other species and sampling dates, which assigns a limited role to litter quality as a driver of SOC storage, compared to the quantity of the inputs, in accordance with findings from Pellerin et al. (2020).
The fact that SOCnew tends to have a significantly slower decomposition than roots may seem counterintuitive as rhizodeposition is often considered a labile pool, notably because it is composed of small molecules. Two hypotheses could explain this result. First, the fraction of SOCnew that remains at harvest may have already been depleted of labile compounds. As a result, we compared the decomposition of roots, that have not undergone any transformation and therefore contain easily decomposable products, and of SOCnew which has undergone a first decomposition during the growth of the plants. Secondly, another hypothesis is proposed by the Microbial Efficiency-Matrix Stabilisation framework (Cotrufo et al., 2013): SOCnew would have decomposed more slowly precisely because gross rhizodeposition may contain in proportion more labile compounds than roots. These compounds would have been preferentially incorporated in the microbial loop and would thus have had a greater likelihood of forming associations with minerals. At the start of the incubation, SOCnew would then already contain a portion of relatively stable OM. Results of studies tracing labelled C in stable OM fractions support this assumption (Villarino et al., 2021). These two hypotheses rely on two different concepts: recalcitrance versus C use efficiency associated to stabilisation mechanisms. Nevertheless, they are not contradictory but complementary. There is little incubation data available in the literature for comparison. Van der Krift et al. (2001) found that after 69 d of incubation, 80 % to 57 % of net rhizodeposition from perennial grasses was remaining (against 74 % to 89 % for the roots). For rice, Lu et al. (2003) found that 54 % was remaining after 240 d (against 58.1 % for the roots). These two studies, together with our results, show that net rhizodeposition is a sub-compartment of gross rhizodeposition which stands out for its longer decomposition time. Whereas more than the half of gross rhizodeposition is respired within 15 d (Jones et al., 2009; Pausch and Kuzyakov, 2018; Weng et al., 2018), about half of the fraction remaining at harvest, here embedded in SOCnew, is not mineralised after 524 d (Table 2). Nevertheless, the high variability in our SOCnew results tempers the strength of our conclusions and calls for further research to confirm them.
4.4 Implications for SOC storage strategies
We propose that SOCnew, as defined in our study and in other continuous labelling studies (Henneron et al., 2020a; Huang et al., 2021), is not a C pool that derives from a physiological process. Indeed, it encompasses a broad variety of compounds (Jones et al., 2009) and depends on root sampling, which is itself soil- and operator-dependent (Freschet et al., 2021). Rather, it is an operational parameter that helps refine estimates of C inputs in annual crops by accounting for all inputs that are not mineralised at crop harvest. Our results showed that it is a significant C input with greater persistence in soils than roots during the first 524 d of decomposition, although previous incubation studies temper this conclusion (Van der Krift et al., 2001; Lu et al., 2003). This makes it a relevant and a necessary pool to consider when reasoning SOC sequestration. For instance, our observation of inter-species differences in specific SOCnew reveals that a fixed allocation coefficient is not suitable for SOCnew quantification from root C. In our case, the belowground C inputs of Brassicaceae, that exhibited high specific SOCnew, would be relatively underestimated with such an approach.
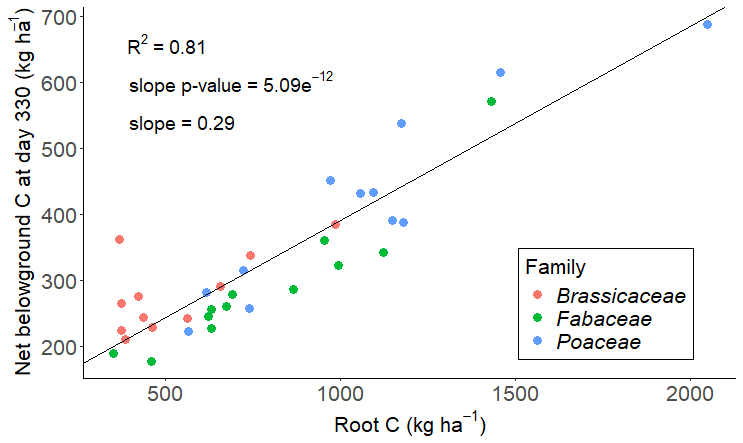
Figure 6Relationship between belowground C inputs (SOCnew and root C) remaining after 330 d of incubation and root C inputs. The remaining C at day 330 was obtained by multiplying the belowground inputs and their respective average fraction remaining at day 330: 0.499 for SOCnew and 0.255 for root C (Table 2). The slope was obtained with a mixed-effects model with species as a random effect, to let the intercept vary. The R2 is the marginal R2.
However, including SOCnew in C assessments requires estimating it from crop traits or other C pools, as its direct quantification is costly. We highlighted here that the task remains challenging for annual crops, and it is likely to be exacerbated if we try to extrapolate our results to a complex cultivation system. Nevertheless, the positive correlation with root C provides initial guidance. Crop selection favouring high root inputs to the soil seems to be a promising practice to sequester additional C in certain pedoclimatic contexts without being at the expense of the yield (Heinemann et al., 2023). Considering that there is more knowledge on root selection than on SOCnew and considering that there is a coupling between the two pools in terms of quantity and vertical distribution, adjusting the reasoning of additional SOC sequestration on root inputs is likely not to be contradictory with a reasoning based on SOCnew. Moreover, we highlighted that root inputs are the main contributors of the fresh root-derived C pool which persists in the soil in the year following the harvest (Fig. 6): even though SOCnew tends to remain longer in the soil based on our results, its low net production compared to that of roots (27.8 % of net belowground C production) restrains its relevance as a lever to sequester additional SOC.
A missing link of our analysis is the priming effect. This process can greatly restrict C sequestration (Guenet et al., 2018) and should therefore be taken into account. We can nonetheless note that priming effect is mostly driven by aboveground biomass or by rhizodeposition and less by roots (Huo et al., 2017; Henneron et al., 2020a). This further reinforces the previous statement that belowground inputs, roots like SOCnew, are decisive to increase SOC stocks. Moreover, the rhizosphere priming effect is closely linked to nutrient acquisition (Henneron et al., 2020b) and may, therefore, be more of a return on investment associated with biomass production rather than a net C loss.
In this study, we attempted to establish a thorough C balance of belowground C inputs by quantifying net rhizodeposition and root debris that are not taken into account in traditional root sampling. We found that this C pool represents 27 % of belowground C inputs, making it an essential input to consider. Although the rhizosheath is a hotspot of root-derived C accumulation, most of it was retrieved in the bulk soil, which suggests that its release may influence SOC cycling across a large proportion of the soil volume. We also showed through an incubation experiment that the residence time of SOCnew can be greater than that of roots. Nevertheless, results were highly variable as SOCnew represents less than 1.5 % of the SOC, which exacerbated the errors. Although differences in terms of quantity emerge between species, the complexity of this group of compounds makes it difficult to predict for annual crops. Nonetheless, the positive correlation with root C indicates that additional SOC sequestration through high root C inputs is compatible with high SOCnew inputs.
Raw data, metadata, calculations and their results have been made open access (Hulin et al., 2025). A list of the statistical tests is also provided. Any additional data or metadata is available upon reasonable request.
The supplement related to this article is available online at https://doi.org/10.5194/bg-23-4343-2026-supplement.
BH conducted the experiment and the data analysis, and wrote the original draft. SA leaded the project and the fundraising, and supervised the writing. FM, SC, FD and SP participated in conducting the experiments and helped finalise the draft.
The contact author has declared that none of the authors has any competing interests.
Publisher's note: Copernicus Publications remains neutral with regard to jurisdictional claims made in the text, published maps, institutional affiliations, or any other geographical representation in this paper. The authors bear the ultimate responsibility for providing appropriate place names. Views expressed in the text are those of the authors and do not necessarily reflect the views of the publisher.
We would like to thank the whole team at CEREEP-Ecotron IDF who provided technical assistance for the experiments. We also thank Audrey Niboyet, Johanne Lebrun-Thauront and Pierre Barré for their feedback on our work.
This research has been supported by the CNRS, notably via the MITI mission and the Analyses et Expérimentations pour les Ecosystèmes (“France 2030” programme (grant no. ANR-24-INBS-0001 AnaEE-France)).
This paper was edited by Lucia Fuchslueger and reviewed by Martina Gonzalez Mateu and two anonymous referees.
Agapit, C., Gigon, A., and Blouin, M.: Earthworm Effect on Root Morphology in a Split Root System, Plant Biosyst., 152, 780–786, https://doi.org/10.1080/11263504.2017.1338627, 2018. a
Ahmadi, S. H., Seidel, S. J., Lopez, G., Kamali, B., Gaiser, T., Hadir, S., Demie, D. T., Andersen, M. N., Ewert, F., and Ochoa, I. H.: Root:Shoot Ratio of Field Crops under Conventional and Conservation Tillage: A Meta Analysis, Soil Use Manage., 41, e70026, https://doi.org/10.1111/sum.70026, 2025. a
Andrade, G., Mihara, K., Linderman, R., and Bethlenfalvay, G.: Soil Aggregation Status and Rhizobacteria in the Mycorrhizosphere, Plant Soil, 202, 89–96, https://doi.org/10.1023/A:1004301423150, 1998. a
ARVALIS: Les fiches Couverts, https://www.arvalis.fr/outils-et-services/outils-et-fiches/les-fiches-couverts (last access: 24 June 2026), 2022. a
ARVALIS: Cultures intermédiaires : bien adapter sa technique de semis, https://www.arvalis.fr/infos-techniques/quelles-techniques-de-semis (last access: 24 June 2026), 2025. a
Atere, C. T., Ge, T., Zhu, Z., Tong, C., Jones, D. L., Shibistova, O., Guggenberger, G., and Wu, J.: Rice Rhizodeposition and Carbon Stabilisation in Paddy Soil Are Regulated via Drying-Rewetting Cycles and Nitrogen Fertilisation, Biol. Fertil. Soils, 53, 407–417, https://doi.org/10.1007/s00374-017-1190-4, 2017. a
Austin, E. E., Wickings, K., McDaniel, M. D., Robertson, G. P., and Grandy, A. S.: Cover Crop Root Contributions to Soil Carbon in a No-till Corn Bioenergy Cropping System, GCB Bioenergy, 9, 1252–1263, https://doi.org/10.1111/gcbb.12428, 2017. a
Baptist, F., Aranjuelo, I., Legay, N., Lopez-Sangil, L., Molero, G., Rovira, P., and Nogués, S.: Rhizodeposition of Organic Carbon by Plants with Contrasting Traits for Resource Acquisition: Responses to Different Fertility Regimes, Plant Soil, 394, 391–406, https://doi.org/10.1007/s11104-015-2531-4, 2015. a, b
Bastida, F., García, C., Fierer, N., Eldridge, D. J., Bowker, M. A., Abades, S., Alfaro, F. D., Asefaw Berhe, A., Cutler, N. A., Gallardo, A., García-Velázquez, L., Hart, S. C., Hayes, P. E., Hernández, T., Hseu, Z.-Y., Jehmlich, N., Kirchmair, M., Lambers, H., Neuhauser, S., Peña-Ramírez, V. M., Pérez, C. A., Reed, S. C., Santos, F., Siebe, C., Sullivan, B. W., Trivedi, P., Vera, A., Williams, M. A., Luis Moreno, J., and Delgado-Baquerizo, M.: Global Ecological Predictors of the Soil Priming Effect, Nat. Commun., 10, 3481, https://doi.org/10.1038/s41467-019-11472-7, 2019. a
Bates, D., Mächler, M., Bolker, B., and Walker, S.: Fitting Linear Mixed-Effects Models Using Lme4, J. Stat. Softw., 67, 1–48, https://doi.org/10.18637/jss.v067.i01, 2015. a
Baumert, V. L., Vasilyeva, N. A., Vladimirov, A. A., Meier, I. C., Kögel-Knabner, I., and Mueller, C. W.: Root Exudates Induce Soil Macroaggregation Facilitated by Fungi in Subsoil, Front. Environ. Sci., 6, 140, https://doi.org/10.3389/fenvs.2018.00140, 2018. a, b
Berenstecher, P., Araujo, P. I., and Austin, A. T.: Worlds Apart: Location above- or below-Ground Determines Plant Litter Decomposition in a Semi-Arid Patagonian Steppe, J. Ecol., 109, 2885–2896, https://doi.org/10.1111/1365-2745.13688, 2021. a
Bertrand, I., Chabbert, B., Kurek, B., and Recous, S.: Can the Biochemical Features and Histology of Wheat Residues Explain Their Decomposition in Soil?, Plant Soil, 281, 291–307, https://doi.org/10.1007/s11104-005-4628-7, 2006. a
Bicharanloo, B., Bagheri Shirvan, M., Cavagnaro, T. R., Keitel, C., and Dijkstra, F. A.: Nitrogen Fertilisation Reduces the Contribution of Root-Derived Carbon to Mineral-Associated Organic Matter Formation at Low and High Defoliation Frequencies in a Grassland Soil, Plant Soil, 508, 925–938, https://doi.org/10.1007/s11104-024-06835-z, 2024. a
Bolinder, M., Angers, D., and Dubuc, J.: Estimating Shoot to Root Ratios and Annual Carbon Inputs in Soils for Cereal Crops, Agr. Ecosyst. Environ., 63, 61–66, https://doi.org/10.1016/S0167-8809(96)01121-8, 1997. a, b
Bolinder, M., Angers, D. A., Bélanger, G., Michaud, R., and Laverdière, M. R.: Root Biomass and Shoot to Root Ratios of Perennial Forage Crops in Eastern Canada, Can. J. Plant Sci., 82, 731–737, https://doi.org/10.4141/P01-139, 2002. a
Boström, B., Comstedt, D., and Ekblad, A.: Isotope Fractionation and 13C Enrichment in Soil Profiles during the Decomposition of Soil Organic Matter, Oecologia, 153, 89–98, https://doi.org/10.1007/s00442-007-0700-8, 2007. a
Brown, L. K., George, T. S., Neugebauer, K., and White, P. J.: The Rhizosheath – a Potential Trait for Future Agricultural Sustainability Occurs in Orders throughout the Angiosperms, Plant Soil, 418, 115–128, https://doi.org/10.1007/s11104-017-3220-2, 2017. a
Cotrufo, M. F., Wallenstein, M. D., Boot, C. M., Denef, K., and Paul, E.: The Microbial Efficiency-Matrix Stabilization (MEMS) Framework Integrates Plant Litter Decomposition with Soil Organic Matter Stabilization: Do Labile Plant Inputs Form Stable Soil Organic Matter?, Glob. Change Biol., 19, 988–995, https://doi.org/10.1111/gcb.12113, 2013. a
Davenport, J. R. and Thomas, R. L.: Carbon Partitioning and Rhizodeposition in Corn and Bromegrass, Can. J. Soil Sci., 68, 693–701, https://doi.org/10.4141/cjss88-067, 1988. a
Dietzel, R., Liebman, M., and Archontoulis, S.: A Deeper Look at the Relationship between Root Carbon Pools and the Vertical Distribution of the Soil Carbon Pool, SOIL, 3, 139–152, https://doi.org/10.5194/soil-3-139-2017, 2017. a
Dormaar, J. F.: Effect of Active Roots on the Decomposition of Soil Organic Materials, Biol. Fert. Soils, 10, 121–126, https://doi.org/10.1007/BF00336247, 1990. a
Farrar, J., Hawes, M., Jones, D., and Lindow, S.: How Roots Control the Flux of Carbon to the Rhizosphere, Ecology, 84, 827–837, https://doi.org/10.1890/0012-9658(2003)084[0827:HRCTFO]2.0.CO;2, 2003. a
Fox, J. and Weisberg, S.: An R Companion to Applied Regression, Sage, Thousand Oaks CA, 3rd Edn., https://www.john-fox.ca/Companion/ (last access: 24 June 2026), 2019. a
Freschet, G. T., Cornwell, W. K., Wardle, D. A., Elumeeva, T. G., Liu, W., Jackson, B. G., Onipchenko, V. G., Soudzilovskaia, N. A., Tao, J., and Cornelissen, J. H.: Linking Litter Decomposition of Above- and below-Ground Organs to Plant–Soil Feedbacks Worldwide, J. Ecol., 101, 943–952, https://doi.org/10.1111/1365-2745.12092, 2013. a
Freschet, G. T., Pagès, L., Iversen, C. M., Comas, L. H., Rewald, B., Roumet, C., Klimešová, J., Zadworny, M., Poorter, H., Postma, J. A., Adams, T. S., Bagniewska-Zadworna, A., Bengough, A. G., Blancaflor, E. B., Brunner, I., Cornelissen, J. H. C., Garnier, E., Gessler, A., Hobbie, S. E., Meier, I. C., Mommer, L., Picon-Cochard, C., Rose, L., Ryser, P., Scherer-Lorenzen, M., Soudzilovskaia, N. A., Stokes, A., Sun, T., Valverde-Barrantes, O. J., Weemstra, M., Weigelt, A., Wurzburger, N., York, L. M., Batterman, S. A., Gomes De Moraes, M., Janeček, Š., Lambers, H., Salmon, V., Tharayil, N., and McCormack, M. L.: A Starting Guide to Root Ecology: Strengthening Ecological Concepts and Standardising Root Classification, Sampling, Processing and Trait Measurements, New Phytol., 232, 973–1122, https://doi.org/10.1111/nph.17572, 2021. a, b, c
Gill, R., Burke, I. C., Milchunas, D. G., and Lauenroth, W. K.: Relationship Between Root Biomass and Soil Organic Matter Pools in the Shortgrass Steppe of Eastern Colorado, Ecosystems, 2, 226–236, https://doi.org/10.1007/s100219900070, 1999. a
Guenet, B., Camino-Serrano, M., Ciais, P., Tifafi, M., Maignan, F., Soong, J. L., and Janssens, I. A.: Impact of Priming on Global Soil Carbon Stocks, Glob. Change Biol., 24, 1873–1883, https://doi.org/10.1111/gcb.14069, 2018. a
Hegazy, A. K., Fahmy, G. M., Ali, M. I., and Gomaa, N. H.: Growth and Phenology of Eight Common Weed Species, J. Arid Environ., 61, 171–183, https://doi.org/10.1016/j.jaridenv.2004.07.005, 2005. a
Heinemann, H., Hirte, J., Seidel, F., and Don, A.: Increasing Root Biomass Derived Carbon Input to Agricultural Soils by Genotype Selection – a Review, Plant Soil, 490, 19–30, https://doi.org/10.1007/s11104-023-06068-6, 2023. a
Henneron, L., Cros, C., Picon-Cochard, C., Rahimian, V., and Fontaine, S.: Plant Economic Strategies of Grassland Species Control Soil Carbon Dynamics through Rhizodeposition, J. Ecol., 108, 528–545, https://doi.org/10.1111/1365-2745.13276, 2020a. a, b, c, d, e, f, g
Henneron, L., Kardol, P., Wardle, D. A., Cros, C., and Fontaine, S.: Rhizosphere Control of Soil Nitrogen Cycling: A Key Component of Plant Economic Strategies, New Phytol., 228, 1269–1282, https://doi.org/10.1111/nph.16760, 2020b. a
Henneron, L., Balesdent, J., Alvarez, G., Barré, P., Baudin, F., Basile-Doelsch, I., Cécillon, L., Fernandez-Martinez, A., Hatté, C., and Fontaine, S.: Bioenergetic Control of Soil Carbon Dynamics across Depth, Nat. Commun., 13, 7676, https://doi.org/10.1038/s41467-022-34951-w, 2022. a, b
Hinsinger, P., Plassard, C., and Jaillard, B.: Rhizosphere: A New Frontier for Soil Biogeochemistry, J. Geochem. Explor., 88, 210–213, https://doi.org/10.1016/j.gexplo.2005.08.041, 2006. a
Hirte, J., Leifeld, J., Abiven, S., Oberholzer, H.-R., and Mayer, J.: Below Ground Carbon Inputs to Soil via Root Biomass and Rhizodeposition of Field-Grown Maize and Wheat at Harvest Are Independent of Net Primary Productivity, Agr. Ecosyst. Environ., 265, 556–566, https://doi.org/10.1016/j.agee.2018.07.010, 2018. a, b
Hu, T., Sørensen, P., Wahlström, E. M., Chirinda, N., Sharif, B., Li, X., and Olesen, J. E.: Root Biomass in Cereals, Catch Crops and Weeds Can Be Reliably Estimated without Considering Aboveground Biomass, Agr. Ecosyst. Environ., 251, 141–148, https://doi.org/10.1016/j.agee.2017.09.024, 2018. a
Huang, J., Liu, W., Pan, S., Wang, Z., Yang, S., Jia, Z., Wang, Z., Deng, M., Yang, L., Liu, C., Chang, P., and Liu, L.: Divergent Contributions of Living Roots to Turnover of Different Soil Organic Carbon Pools and Their Links to Plant Traits, Funct. Ecol., 35, 2821–2830, https://doi.org/10.1111/1365-2435.13934, 2021. a, b, c, d, e, f
Hudek, C., Putinica, C., Otten, W., and De Baets, S.: Functional Root Trait-Based Classification of Cover Crops to Improve Soil Physical Properties, Eur. J. Soil Sci., 73, e13147, https://doi.org/10.1111/ejss.13147, 2022. a
Hulin, B., Chollet, S., Massol, F., and Abiven, S.: Dataset of a Multi-Pulse Labelling Experiment with 13C CO2 to Trace Root-Derived Carbon in the Soil, Zenodo [data set], https://doi.org/10.5281/zenodo.17482237, 2025. a, b
Huo, C., Luo, Y., and Cheng, W.: Rhizosphere Priming Effect: A Meta-Analysis, Soil Biol. Biochem., 111, 78–84, https://doi.org/10.1016/j.soilbio.2017.04.003, 2017. a, b, c
Hütsch, B. W., Augustin, J., and Merbach, W.: Plant Rhizodeposition — an Important Source for Carbon Turnover in Soils, J. Plant Nutr. Soil Sci., 165, 397, https://doi.org/10.1002/1522-2624(200208)165:4<397::AID-JPLN397>3.0.CO;2-C, 2002. a
Islam, M. R., Bicharanloo, B., Yu, X., Singh, B., and Dijkstra, F. A.: Rhizodeposition Stimulates Soil Carbon Decomposition and Promotes Formation of Mineral-Associated Carbon with Increased Clay Content, Geoderma, 454, 117180, https://doi.org/10.1016/j.geoderma.2025.117180, 2025. a
Jones, D. L., Nguyen, C., and Finlay, R. D.: Carbon Flow in the Rhizosphere: Carbon Trading at the Soil–Root Interface, Plant Soil, 321, 5–33, https://doi.org/10.1007/s11104-009-9925-0, 2009. a, b, c, d, e, f
Kleemola, J., Teittinen, M., and Karvonen, T.: Modelling Crop Growth and Biomass Partitioning to Shoots and Roots in Relation to Nitrogen and Water Availability, Using a Maximization Principle, Plant Soil, 185, 99–111, https://doi.org/10.1007/BF02257567, 1996. a
Li, H., Chang, L., Liu, H., and Li, Y.: Diverse Factors Influence the Amounts of Carbon Input to Soils via Rhizodeposition in Plants: A Review, Sci. Total Environ., 948, 174858, https://doi.org/10.1016/j.scitotenv.2024.174858, 2024. a
Li, J., Yuan, X., Ge, L., Li, Q., Li, Z., Wang, L., and Liu, Y.: Rhizosphere Effects Promote Soil Aggregate Stability and Associated Organic Carbon Sequestration in Rocky Areas of Desertification, Agr. Ecosyst. Environ., 304, 107126, https://doi.org/10.1016/j.agee.2020.107126, 2020. a
Lu, Y., Watanabe, A., and Kimura, M.: Carbon Dynamics of Rhizodeposits, Root- and Shoot-Residues in a Rice Soil, Soil Biol. Biochem., 35, 1223–1230, https://doi.org/10.1016/S0038-0717(03)00184-6, 2003. a, b
Lüdecke, D., Ben-Shachar, M., Patil, I., Waggoner, P., and Makowski, D.: Performance: An R Package for Assessment, Comparison and Testing of Statistical Models, Journal of Open Source Software, 6, 3139, https://doi.org/10.21105/joss.03139, 2021. a
Mattila, T. J. and Häkkinen, L.: Exploring the Effects of Soil Structure, Nutrients, and Farm Management on Crop Root Biomass and Depth Distribution, Field Crops Res., 327, 109909, https://doi.org/10.1016/j.fcr.2025.109909, 2025. a
Meier, U.: Phenological Growth Stages, in: Phenology: An Integrative Environmental Science, edited by Kratochwil, A., Lieth, H., and Schwartz, M. D., Vol. 39, 269–283, Springer Netherlands, Dordrecht, ISBN 978-1-4020-1580-9 978-94-007-0632-3, https://doi.org/10.1007/978-94-007-0632-3_17, 2003. a, b
Minasny, B., Malone, B. P., McBratney, A. B., Angers, D. A., Arrouays, D., Chambers, A., Chaplot, V., Chen, Z.-S., Cheng, K., Das, B. S., Field, D. J., Gimona, A., Hedley, C. B., Hong, S. Y., Mandal, B., Marchant, B. P., Martin, M., McConkey, B. G., Mulder, V. L., O'Rourke, S., Richer-de-Forges, A. C., Odeh, I., Padarian, J., Paustian, K., Pan, G., Poggio, L., Savin, I., Stolbovoy, V., Stockmann, U., Sulaeman, Y., Tsui, C.-C., Vågen, T.-G., van Wesemael, B., and Winowiecki, L.: Soil Carbon 4 per Mille, Geoderma, 292, 59–86, https://doi.org/10.1016/j.geoderma.2017.01.002, 2017. a
Nakagawa, S. and Schielzeth, H.: A General and Simple Method for Obtaining R2 from Generalized Linear Mixed-Effects Models, Method. Ecol. Evol., 4, 133–142, https://doi.org/10.1111/j.2041-210x.2012.00261.x, 2013. a
Ndour, P. M. S., Hatté, C., Achouak, W., Heulin, T., and Cournac, L.: Rhizodeposition Efficiency of Pearl Millet Genotypes Assessed on a Short Growing Period by Carbon Isotopes (Δ13C and F14C), SOIL, 8, 49–57, https://doi.org/10.5194/soil-8-49-2022, 2022. a, b
Nguyen, C.: Rhizodeposition of Organic C by Plants: Mechanisms and Controls, Agronomie, 23, 375–396, https://doi.org/10.1051/agro:2003011, 2003. a, b, c, d
Pausch, J. and Kuzyakov, Y.: Carbon Input by Roots into the Soil: Quantification of Rhizodeposition from Root to Ecosystem Scale, Glob. Change Biol., 24, 1–12, https://doi.org/10.1111/gcb.13850, 2018. a, b, c, d, e, f
Pellerin, S., Bamière, L., Launay, C., Martin, R., Schiavo, M., Angers, D., Augusto, L., Balesdent, J., Basile-Doelsch, I., Bellassen, V., Cardinael, R., Cécillon, L., Ceschia, E., Chenu, C., Constantin, J., Daroussin, J., Delacote, P., Delame, N., Gastal, F., Gilbert, D., Graux, A.-I., Guenet, B., Houot, S., Klumpp, K., Letort, E., Litrico, I., Martin, M., Menasseri-Aubry, S., Meziere, D., Morvan, T., Mosnier, C., Roger-Estrade, J., Saint-André, L., Sierra, J., Therond, O., Viaud, V., Grateau, R., Le Perchec, S., Savini, I., and Rechauchère, O.: Stocker Du Carbone Dans Les Sols Français. Quel Potentiel Au Regard de l'objectif 4 Pour 1000 et à Quel Coût ?, Other, INRA, https://doi.org/10.15454/nhxt-gn38, 2020. a, b
Poeplau, C. and Don, A.: Carbon Sequestration in Agricultural Soils via Cultivation of Cover Crops – A Meta-Analysis, Agr. Ecosyst. Environ., 200, 33–41, https://doi.org/10.1016/j.agee.2014.10.024, 2015. a
Postma, J. A., Hecht, V. L., Hikosaka, K., Nord, E. A., Pons, T. L., and Poorter, H.: Dividing the Pie: A Quantitative Review on Plant Density Responses, Plant Cell Environ., 44, 1072–1094, https://doi.org/10.1111/pce.13968, 2021. a
R Core Team: R: A Language and Environment for Statistical Computing, R Foundation for Statistical Computing, Vienna, Austria, https://www.R-project.org/ (last access: 24 June 2026), 2021. a
Rasse, D. P., Rumpel, C., and Dignac, M.-F.: Is Soil Carbon Mostly Root Carbon? Mechanisms for a Specific Stabilisation, Plant Soil, 269, 341–356, https://doi.org/10.1007/s11104-004-0907-y, 2005. a, b, c
Robinson, D., Griffiths, B., Ritz, K., and Wheatley, R.: Root-Induced Nitrogen Mineralisation: A Theoretical Analysis, Plant Soil, 117, 185–193, https://doi.org/10.1007/BF02220711, 1989. a
Ryan, P., Delhaize, E., and Jones, D.: Function and Mechanism of Organic Anion Exudation from Plant Roots, Ann. Rev. Plant Phys., 52, 527–560, https://doi.org/10.1146/annurev.arplant.52.1.527, 2001. a
Sainju, U. M., Singh, B. P., and Whitehead, W. F.: Cover Crop Root Distribution and Its Effects on Soil Nitrogen Cycling, Agron. J., 90, 511–518, https://doi.org/10.2134/agronj1998.00021962009000040012x, 1998. a
Schaub, M. and Alewell, C.: Stable Carbon Isotopes as an Indicator for Soil Degradation in an Alpine Environment (Urseren Valley, Switzerland), Rapid Commun. Mass Sp., 23, 1499–1507, https://doi.org/10.1002/rcm.4030, 2009. a
Schiedung, M., Don, A., Beare, M. H., and Abiven, S.: Soil Carbon Losses Due to Priming Moderated by Adaptation and Legacy Effects, Nat. Geosci., 16, 909–914, https://doi.org/10.1038/s41561-023-01275-3, 2023. a, b, c
Schweizer, M., Fear, J., and Cadisch, G.: Isotopic (13C) Fractionation during Plant Residue Decomposition and Its Implications for Soil Organic Matter Studies, Rapid Commun. Mass Sp., 13, 1284–1290, https://doi.org/10.1002/(SICI)1097-0231(19990715)13:13<1284::AID-RCM578>3.0.CO;2-0, 1999. a
Searle, S. R., Speed, F. M., and Milliken, G. A.: Population Marginal Means in the Linear Model: An Alternative to Least Squares Means, Am. Stat., 34, 216–221, https://doi.org/10.1080/00031305.1980.10483031, 1980. a
See, C. R., Luke McCormack, M., Hobbie, S. E., Flores-Moreno, H., Silver, W. L., and Kennedy, P. G.: Global Patterns in Fine Root Decomposition: Climate, Chemistry, Mycorrhizal Association and Woodiness, Ecol. Lett., 22, 946–953, https://doi.org/10.1111/ele.13248, 2019. a, b
Semchenko, M., Xue, P., and Leigh, T.: Functional Diversity and Identity of Plant Genotypes Regulate Rhizodeposition and Soil Microbial Activity, New Phytol., 232, 776–787, https://doi.org/10.1111/nph.17604, 2021. a
Shipley, B. and Meziane, D.: The Balanced-Growth Hypothesis and the Allometry of Leaf and Root Biomass Allocation, Funct. Ecol., 16, 326–331, https://doi.org/10.1046/j.1365-2435.2002.00626.x, 2002. a
Silver, W. L. and Miya, R. K.: Global Patterns in Root Decomposition: Comparisons of Climate and Litter Quality Effects, Oecologia, 129, 407–419, https://doi.org/10.1007/s004420100740, 2001. a
Studer, M. S., Siegwolf, R. T. W., and Abiven, S.: Carbon Transfer, Partitioning and Residence Time in the Plant-Soil System: A Comparison of Two 13CO2; Labelling Techniques, Biogeosciences, 11, 1637–1648, https://doi.org/10.5194/bg-11-1637-2014, 2014. a
Teixeira, P. P., Vidal, A., Teixeira, A. P., Souza, I. F., Hurtarte, L. C., Silva, D. H., Almeida, L. F., Buegger, F., Hammer, E. C., Jansa, J., Mueller, C. W., and Silva, I. R.: Decoding the Rhizodeposit-Derived Carbon's Journey into Soil Organic Matter, Geoderma, 443, 116811, https://doi.org/10.1016/j.geoderma.2024.116811, 2024. a
Teixeira, P. P. C., Trautmann, S., Buegger, F., Felde, V. J. M. N. L., Pausch, J., Müller, C. W., and Kögel-Knabner, I.: Role of Root Hair Elongation in Rhizosheath Aggregation and in the Carbon Flow into the Soil, Biol. Fertil. Soil., 59, 351–361, https://doi.org/10.1007/s00374-023-01708-6, 2023. a, b
Van der Krift, T. A., Kuikman, P. J., Möller, F., and Berendse, F.: Plant Species and Nutritional-Mediated Control over Rhizodeposition and Root Decomposition, Plant Soil, 228, 191–200, https://doi.org/10.1023/A:1004834128220, 2001. a, b
Veeken, A., Santos, M. J., McGowan, S., Davies, A. L., and Schrodt, F.: Pollen-Based Reconstruction Reveals the Impact of the Onset of Agriculture on Plant Functional Trait Composition, Ecol. Lett., 25, 1937–1951, https://doi.org/10.1111/ele.14063, 2022. a
Verdier, B., Jouanneau, I., Simonnet, B., Rabin, C., Van Dooren, T. J. M., Delpierre, N., Clobert, J., Abbadie, L., Ferrière, R., and Le Galliard, J.-F.: Climate and Atmosphere Simulator for Experiments on Ecological Systems in Changing Environments, Environ. Sci. Technol., 48, 8744–8753, https://doi.org/10.1021/es405467s, 2014. a
Villarino, S. H., Pinto, P., Jackson, R. B., and Piñeiro, G.: Plant Rhizodeposition: A Key Factor for Soil Organic Matter Formation in Stable Fractions, Sci. Adv., 7, eabd3176, https://doi.org/10.1126/sciadv.abd3176, 2021. a, b
Warembourg, F. R. and Estelrich, H. D.: Towards a Better Understanding of Carbon Flow in the Rhizosphere: A Time-Dependent Approach Using Carbon-14, Biol. Fertil. Soil., 30, 528–534, https://doi.org/10.1007/s003740050032, 2000. a
Watt, M., McCully, M. E., and Canny, M. J.: Formation and Stabilization of Rhizosheaths of Zea Mays L. (Effect of Soil Water Content), Plant Physiol., 106, 179–186, https://doi.org/10.1104/pp.106.1.179, 1994. a
Wen, Z., White, P. J., Shen, J., and Lambers, H.: Linking Root Exudation to Belowground Economic Traits for Resource Acquisition, New Phytol., 233, 1620–1635, https://doi.org/10.1111/nph.17854, 2022. a
Weng, Z. H., Van Zwieten, L., Singh, B. P., Tavakkoli, E., Kimber, S., Morris, S., Macdonald, L. M., and Cowie, A.: The Accumulation of Rhizodeposits in Organo-Mineral Fractions Promoted Biochar-Induced Negative Priming of Native Soil Organic Carbon in Ferralsol, Soil Biol. Biochem., 118, 91–96, https://doi.org/10.1016/j.soilbio.2017.12.008, 2018. a, b
Williams, A., Langridge, H., Straathof, A. L., Muhamadali, H., Hollywood, K. A., Goodacre, R., and De Vries, F. T.: Root Functional Traits Explain Root Exudation Rate and Composition across a Range of Grassland Species, J. Ecol., 110, 21–33, https://doi.org/10.1111/1365-2745.13630, 2022. a, b
York, L. M., Carminati, A., Mooney, S. J., Ritz, K., and Bennett, M. J.: The Holistic Rhizosphere: Integrating Zones, Processes, and Semantics in the Soil Influenced by Roots, J. Exp. Bot., 67, 3629–3643, https://doi.org/10.1093/jxb/erw108, 2016. a
Zhang, X. and Wang, W.: The Decomposition of Fine and Coarse Roots: Their Global Patterns and Controlling Factors, Sci. Rep., 5, 9940, https://doi.org/10.1038/srep09940, 2015. a, b