
the Creative Commons Attribution 4.0 License.
the Creative Commons Attribution 4.0 License.
 | 14 Jul 2026
Root turnover and soil indicators capture belowground recovery following saltmarsh restoration
Sabrina K. B. Olsson
Anirban Akhand
Peter I. Macreadie
Joeri Kaal
Siegmund Nuyts
Paul E. Carnell
Stacey M. Trevathan-Tackett
Coastal wetlands, including saltmarsh, are highly productive ecosystems, with carbon- and nutrient-rich soils supporting biodiversity. Beyond carbon stocks and sequestration, the responses to restoration of these nutrient-rich and structurally complex soils remain poorly defined for coastal wetlands, especially in saltmarsh ecosystems restored by exclusion fencing. This study used a space-for-time approach to evaluate belowground responses in Salicornia quinqueflora-dominated saltmarshes 25 years after livestock exclusion in Swan Bay, Victoria, Australia. We monitored surficial soil physicochemical characteristics, root and standardised litter decomposition, and root molecular composition across Grazed, Restored, and Natural Reference sites. Restored and Reference sites had ≥ 20 % higher vegetation cover and 2–3-fold higher percent soil carbon and nitrogen content, with 2.5-fold lower shear vane soil strength compared to Grazed sites. However, carbon and nitrogen stocks in the top 10 cm were not significantly different across sites (means ranging 30–36 Mg C ha−1) due to elevated bulk density at Grazed sites caused by compaction from ungulates. Salicornia quinqueflora root litter decomposition was slowest in Natural Reference sites, with molecular composition showing preservation of recalcitrant lignin in the Reference and Restored sites, indicating greater soil carbon preservation capacity. In contrast, roots decomposing in Grazed sites showed increased nitrogen and phenolic compounds, indicating greater microbial-driven turnover. This study demonstrates that exclusion fencing can restore saltmarsh soil function and promote long-term resilience, particularly through improved preservation of recalcitrant organic matter, decades after intervention. By highlighting shifts in surface soil structure and organic matter preservation, this study shows why soil quality metrics beyond carbon stocks are essential for accurately evaluating restoration outcomes.
- Article
(6029 KB) - Full-text XML
-
Supplement
(1016 KB) - BibTeX
- EndNote


Coastal wetlands comprise supratidal forests, saltmarshes, mangrove forests and seagrass meadows. These ecosystems protect our coastlines and provide habitat for a large range of plants and animals, making these ecosystems biodiversity hotspots (He et al., 2025). However, since the early 1900s, nearly half of coastal wetlands have been lost globally due to climate change and human activity (Davidson, 2016). Coastal wetland loss can occur through complete vegetation removal or more gradually through habitat fragmentation (Laegdsgaard, 2006). Such coastal wetland degradation can compromise key ecosystem functions, including food chain supply, biodiversity conservation, resilience to sea level rise, water filtration, and carbon accumulation and storage (Prahalad, 2014). Therefore, there is an increasing demand for large-scale wetland restoration and protection (Macreadie et al., 2021). Restoration of coastal wetlands can reestablish a range of essential ecosystem functions, including vegetation production and carbon and nutrient cycling, which in turn supports food web complexity, biodiversity and carbon sequestration (Meli et al., 2014; Macreadie et al., 2021). The exclusion of ungulates by fencing is one such restoration approach that is attractive for the restoration of marginal saltmarsh ecosystems due to its relatively low costs and minimal intervention (Rowland and Lovelock, 2024). Exclusion fencing as a coastal wetland restoration method is especially relevant in an Australian context, as there is a disproportionate impact of introduced livestock and wild ungulates on marginal lands (Rowland and Lovelock, 2024). Over the last few decades, studies have quantified a range of benefits of ungulate exclusion or abandonment to aboveground vegetation (e.g. survival, growth, diversity, successional shifts, and litter production; Laegdsgaard, 2006; Rupprecht et al., 2015; Wasson et al., 2021) and soil structure (e.g. increased elevation, moisture, and aeration; Chang et al., 2016; Veenklaas et al., 2015).
Recovery of aboveground vegetation biomass and diversity is the most commonly quantified metric for ecosystem recovery after ungulate exclusion (Rowland and Lovelock, 2024), and such responses are used to suggest or estimate belowground indicators of soil recovery and function (e.g. carbon accumulation and stocks) (Legesse et al., 2024; Xiao et al., 2025). For example, the Australian Blue Carbon Accounting Model estimates the soil carbon benefits of coastal wetland restoration through tidal reinstatement using aboveground vegetation metrics (Lovelock et al., 2022). However, such correlative approaches do not account for the complex belowground processes influencing wetland recovery and health, and remain poorly understood in the coastal wetland restoration context (Bayraktarov et al., 2020). As such, there is a need to improve the breadth and depth of data on indicators of belowground ecological functions under current and emerging restoration methods to enhance accounting model accuracy (Lovelock et al., 2022), as well as improving the reliability of restoration assessments that inform model predictions and policy.
For saltmarsh ecosystems, static belowground ecological functions like soil carbon stocks are most often reported for restoration monitoring (Bayraktarov et al., 2020; Cadier et al., 2020; Rowland and Lovelock, 2024). In contrast, process-based functions like the decomposition of root or soil organic matter (OM) are less commonly quantified despite being essential for nutrient regeneration, soil formation and responses to changes in inundation (i.e. subsidence vs. accumulation) (Kirwan et al., 2013; Meier and Bowman, 2008). Understanding the influence of root litter quality on decomposition, and vice versa, is required to comprehend the impact of management on belowground OM cycling. Analytical pyrolysis techniques such as pyrolysis-GC-MS (Py-GC-MS) and thermally assisted hydrolysis and methylation (THM-GC-MS) can be used to characterise a wide range of plant biomolecular constituents that indicate the quality of OM, as well as their response to management practices, by showing changes like microbial necromass accumulation, loss of labile constituents, and the selective preservation of relatively recalcitrant plant constituents like root-specific suberin (Ferreira et al., 2009; Kolattukudy, 2001; Pineiro-Juncal et al., 2021). In addition, belowground OM availability and cycling can be influenced by localised, site-specific characteristics like soil compaction, as measured by bulk density and soil strength, which can change in response to restoration interventions (Brooks et al., 2022). Therefore, standardised OM, like rooibos and green tea that have uniform chemical properties, can be used in decomposition studies to help distinguish the effects of site-specific environmental factors from indicators of soil processes and land management practices (Keuskamp et al., 2013).
While it can take years or decades after restoration to detect belowground functional responses comparable to levels of natural reference ecosystems, space-for-time experimental designs allow us to compare sites that represent different restoration ages to natural reference sites and degraded baseline sites and therefore provide a practical approach to assess restoration success over time (Carnell et al., 2022; Gulliver et al., 2020). Accordingly, we used a space-for-time approach to evaluate the belowground responses across actively grazed saltmarshes, sites excluded from grazing for approximately 25 years, and natural reference saltmarshes. We hypothesise that belowground decomposition and OM quality will be sensitive and detectable indicators of soil responses to exclusion fencing restoration. We focused on the changes in soil properties within surficial soils (top 10 cm), where active root inputs are more likely to affect soil carbon turnover and formation. We measured indicators, including root and standardised OM decomposition and molecular shifts for short-term OM turnover and preservation, soil strength and dry bulk density for soil structure, and soil carbon and nitrogen content for longer-term OM preservation. By taking a multi-indicator approach, this study will advance our understanding and application of robust soil indicators for saltmarsh restoration.
2.1 Site description and experimental design
All sites are located within Swan Bay, a tidally influenced embayment in Port Phillip Bay, Victoria, Australia (Fig. 1a). The coastline, which featured saltmarsh ecosystems, was heavily modified during European settlement for livestock grazing until Swan Bay became a marine reserve in 1979. In 1996, marginal land within Crown Boundaries on the western shore was fenced by Parks Victoria to restrict access and allow saltmarsh to return (i.e. > 25-year Restored sites; Fig. 1b). Private lands adjacent to Crown Land are still being grazed by livestock, but are at elevations suitable for saltmarsh to re-establish, indicated by access to tidal flow encroachment of pioneer saltmarsh species such as Salicornia quinqueflora (S. quinqueflora) (i.e. Grazed sites; Fig. 1b). In contrast, some areas of Swan Bay on the northern and southern ends have had little to no modification in the last 50–60 years (landholder and Parks Victoria, personal communication, 2021), and for the purposes of this study will act as a Natural Reference site (i.e. Natural Reference sites; Fig. 1c). No other sites in the area could be used as Natural Reference sites due to previous or current disturbances.
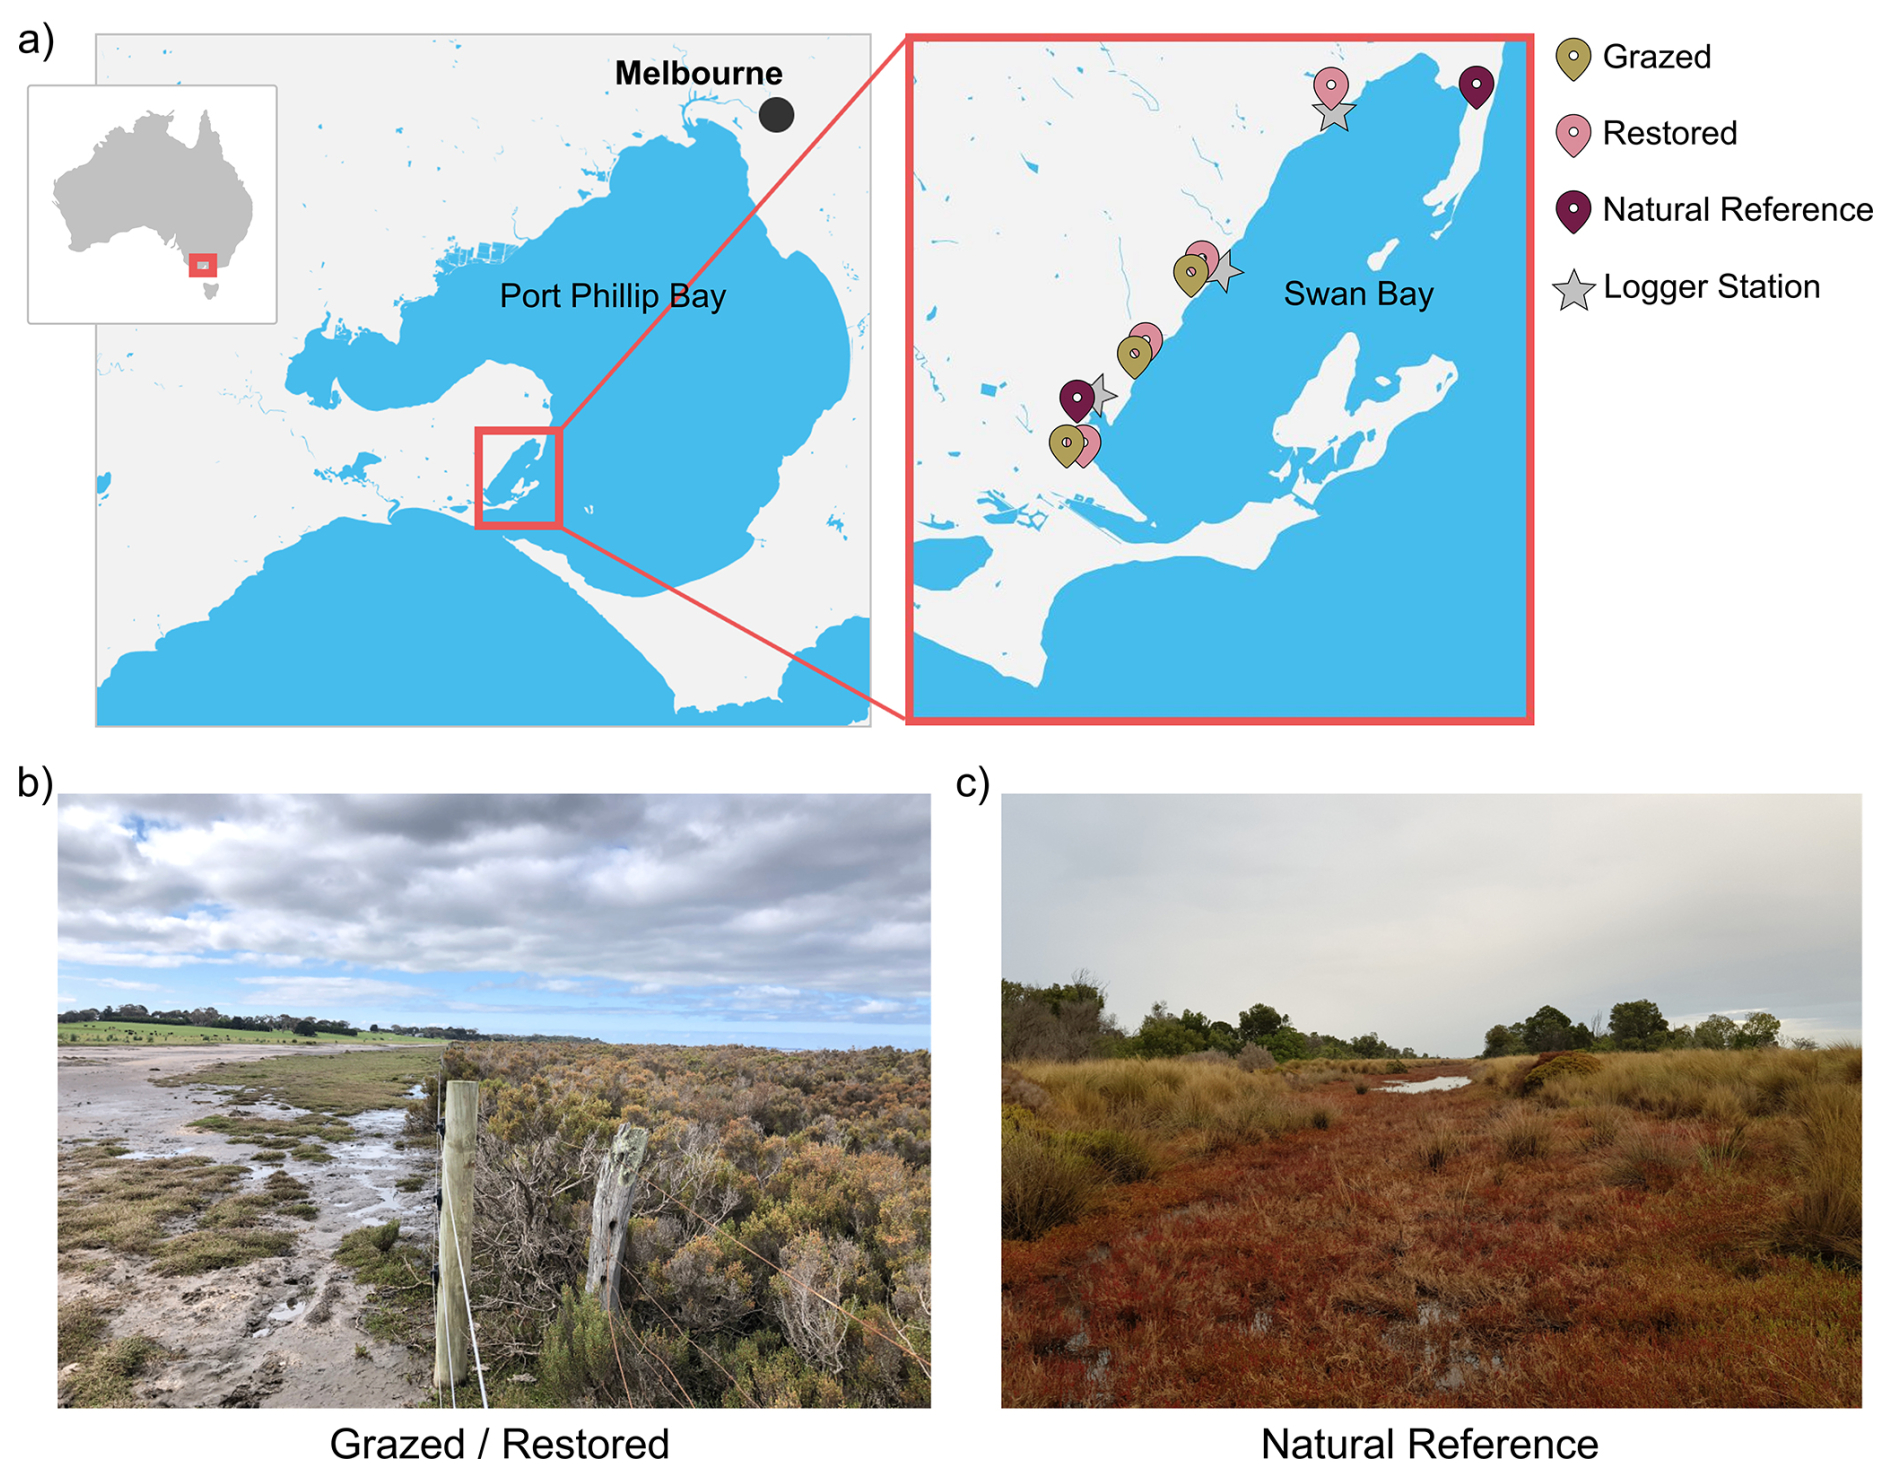
Figure 1Site map. (a) Swan Bay is an embayment in Port Phillip Bay, Victoria, Australia. Points represent the site rehabilitation category and location of logger stations. (b) A site in Swan Bay, showing a currently grazed area on the left, and a > 25-year restored area on the right, following the installation of a fence by Parks Victoria in 1996 to restrict access and allow saltmarsh to return. (c) A natural reference site has had little to no modification in the last 50–60 years.
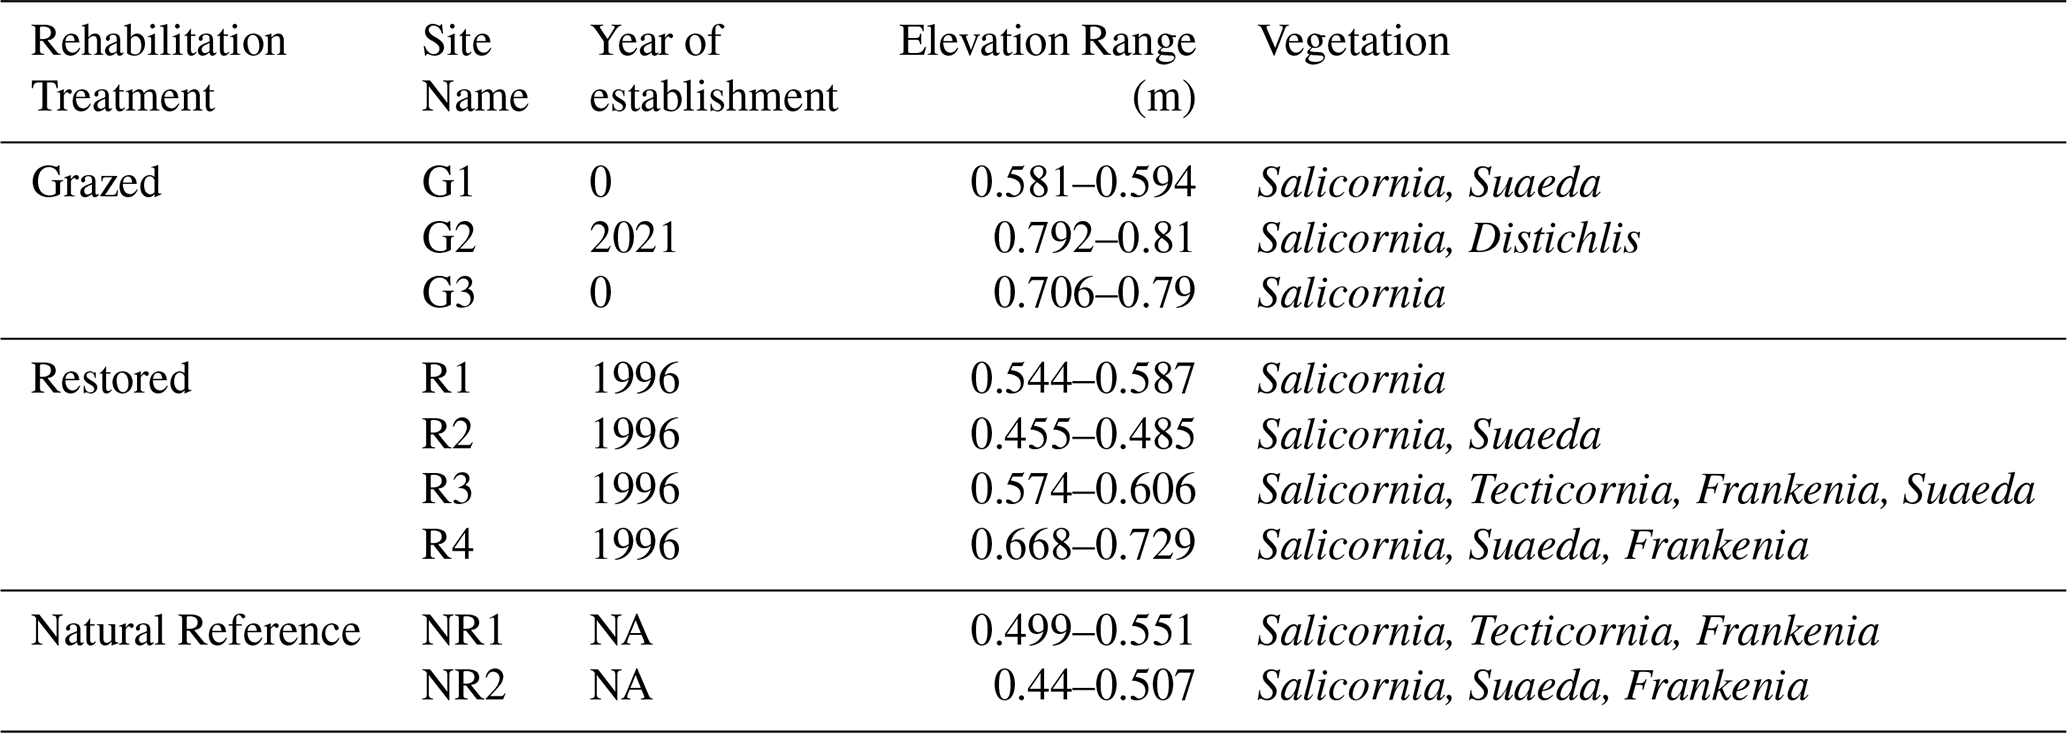
We chose at least two sites from each rehabilitation condition category to assess belowground responses to grazing and exclusion fencing activities: Grazed (G), Restored (> 25 years; R), and Natural Reference (NR). All Grazed sites had encroaching saltmarsh growth at least ≥ 0.5 m into the property from nearby marsh. One of the historically Grazed sites (G2) was fenced 3 months prior to the start of the experiment, so we also monitored this site as a historically grazed area that may provide information on early responses to exclusion fencing restoration. Restored and Reference sites are classified at Environmental Vegetation Class 9 (Coastal Saltmarsh Community) and comprised of Salicornia and Tecticornia (Table 1). While we tried to reduce variability in elevation across sites and treatments, the Grazed sites are landward of the Restored and Natural Reference sites, and typically of higher elevation. To reduce variability in belowground responses due to tidal inundation, we chose areas within the site that were seaward and showed evidence of saltmarsh encroachment by pioneer species S. quinqueflora.
In February 2022, we installed five 40 cm × 40 cm experimental plots at each site, approximately 1 m apart, in a transect running parallel to the shoreline. We sampled soil at each plot to characterise surficial carbon and nitrogen stocks, soil strength and dry bulk density. While site-level vegetation varied across the rehabilitation categories (Table 1), to help standardise the conditions and be relevant to in situ saltmarsh root decomposition, we chose transects where S. quinqueflora were the dominant taxa. Within each plot at 3, 6 and 12 months after deployment, we monitored aboveground vegetation cover and diversity, as well as decomposition and litter chemistry of root and standardised green and rooibos tea litters over the course of 1 year.
Table 1Site descriptions. Elevation was measured at each plot. Grazed sites have cattle on the land with some saltmarsh encroachment from the neighbouring Restored sites. The exception is G2, which was < 1 year fenced at the time of the study. Grazers had been excluded from the Restored sites for approximately 25 years, while Natural Reference sites were approximately ≥ 60 years old. NA: not available.
2.2 Site characteristics
2.2.1 Elevation, water level and physicochemical measurements
The elevation at each plot was measured using an EMLID Reach RS+ RTK-GNSS unit. Elevation ranges of the plots were 0.58–0.81 m for Grazed, 0.46–0.73 m for Restored and 0.44–0.55 m for Natural Reference sites (Table 1). Soil temperature loggers (HOBO Pendant – Temperature/Light data logger UA-002-64, Onset) were buried at a 5 cm depth at each site. Temperature was recorded every 10 min for the duration of the experiment.
Logger stations were set up along the length of Swan Bay at NR1, R1 and R2 to understand the water level and soil redox (ORP) along the coastline of Swan Bay (Fig. 1a). The data were logged every 10 min for at least a full tidal cycle during the initial, 6- and 12-month samplings. First, REED data loggers coupled with Paleoterra redox and reference probes were deployed at 10 cm. HOBO U20L water level data loggers were placed in perforated PVC casings, and the sensor location was 15 cm below the surface. The elevation of the water present at the deployment site was measured using an EMLID Reach RS+ RTK-GNSS unit. One dedicated water level logger was installed 50 cm above the surface to record barometric pressure variability of Swan Bay. The elevation of the water body and barometric pressure data were used in post-processing to correct and calculate water level measurements.
The water level loggers and water elevation data were used to calculate the cross-shore elevation profile at the nine different sites: Mean Higher High Water (MHHW), High Water (HW), Mean Sea Level (MSL), Low Water (LW), Mean Lower Low Water (MLLW) (Fig. S1, Table S1 in the Supplement). Plots located above MHHW, ranging from +0.0079 to +0.0621 m (G1, R1, R2, R3, NR1, and NR2), experience less frequent and shorter periods of tidal flooding compared to those below MHHW, ranging from −0.112 to −0.262 m (G2, G3, and R4) (Table S1). The profiles also reveal variations in elevation along the cross-shore transects. G1, G2, and G3 profiles show relatively flat topography, with elevations close to or slightly above MHHW level. R1, R2, and R3 profiles exhibit more pronounced changes in elevation, with the landward portions of the transects rising above the MHHW level and the seaward portions below MSL and MLLW. R4 profile is similar to R1–R3 profiles but with a more gradual slope. NR1 and NR2 profiles display the most significant changes in elevation along the cross-shore transects. Both profiles start at elevation near the MHHW level on the landward side and then steeply drop below the MLLW level towards the seaward end of the transects. The NR2 profile, in particular, shows a more pronounced drop in elevation compared to NR1.
2.2.2 Soil cores and strength
Soils at each site were analysed for elemental organic carbon (%C) and total nitrogen (%N) as well as soil strength. Soil strength, measured with a shear vane tester (19 mm vane; CMT equipment, Australia), provides information on the mechanical strength in kPA needed to move the vane. Soil strength was measured at 10 and 20 cm depths (8–10 and 18–20 cm, respectively, accounting for vane height).
Surficial soil cores were taken directly adjacent to each plot using a 10 cm length syringe core, to capture the depth range of root production and decomposition (Benjamin et al., 2026). Cores were sliced at 0–2, 2–5 and 5–10 cm intervals and dried at 60 °C to calculate dry bulk density (DBD, g cm−3). Samples were ground to a fine powder (Retch RM200) and tested for carbonates using diluted hydrochloric acid. Effervescence after contact with acid indicated that inorganic carbon, as carbonates, was present. Percent organic carbon and total nitrogen analyses were performed on a LECO elemental analyser at the CSIRO Land and Water Facilities (Adelaide). Briefly, total carbon and nitrogen were determined by high temperature combustion in an atmosphere of oxygen using a Leco TruMAC. For samples that did not indicate the presence of inorganic carbon, total carbon was assumed to be organic carbon. For carbonate-positive samples, inorganic carbon as carbonates was determined by reacting the sample with acid in a sealed container and measuring the pressure increase (Rayment and Lyons, 2011; Sherrod et al., 2002). The organic carbon is calculated as (Total carbon – Carbonate ⋅ 0.12) (CSIRO, personal communication, 2025). Organic carbon and nitrogen density were calculated using DBD (g C or N cm−3) and converted to mean stock in the top 10 cm at each site (e.g. Mg C ha−1) (Howard et al., 2014).
2.3 Vegetation monitoring
2.3.1 Aboveground vegetation
Vegetation diversity and cover at each site were determined visually using a 100×100 cm quadrat thrown at random 10 times per site during site assessment. A quadrat (40×40 cm), matching the plot size, was used to take plot photos of each plot at the 3, 6, and 12-months sampling times. The photos were then used to determine changes in vegetation diversity and cover within each plot over time.
2.3.2 Root and tea litter decomposition
Salicornia quinqueflora roots and standardised green and rooibos tea litters were incubated in the soils to investigate organic matter turnover via decomposition. The standardised tea litter approach has been used extensively to investigate cross-ecosystem and regional/global within-ecosystem drivers of coastal wetland decomposition (Mueller et al., 2018; Trevathan-Tackett et al., 2024). Lipton green and rooibos teas from the original Tea Bag Index product numbers (∼0.25 mm mesh, 0.6 mm2; Keuskamp et al., 2013) had changed from a nylon mesh to a biodegradable mesh material and was repackaged in nylon mesh tea bags (∼ 0.17×0.24 mm mesh, 0.4 mm2) to persist in a longer-term incubation. S. quinqueflora roots were collected, cleaned of attached soil and dried before adding ∼ 1.7 g dry weight to nylon mesh tea bags.
Litter bags were buried in the soil at ∼ 5 cm depth. Each of the five plots per site contained one root litter, green tea and rooibos tea bag per sampling time. Bags were collected at 3, 6 and 12 months, cleaned of attached soil and dried at 60 °C. Litter samples were further cleaned of living root contamination before obtaining dry mass. The proportion mass remaining at each time point was used to calculate single exponential decay rates, using , whereby W0 was the initial mass, Wt was the mass at time t and k is the decay rate in proportion per day (d−1), with the model inclusive of 100 % mass at day 0 (Trevathan-Tackett et al., 2021). k was calculated separately for each litter type for each site and rehabilitation category. Root litter carbon and nitrogen were quantified using the elemental analysis described above for soils. Molar C : N ratios were calculated. Percent carbon and nitrogen data were normalised to sample mass, and the proportion carbon and nitrogen remaining was used to calculate single exponential decay rates.
2.3.3 Py-GC-MS and THM-GC-MS of S. quinqueflora roots
In order to understand the impact of management on the decomposition processes in the incubated root tissues, a subset of S. quinqueflora root samples (2 sites from each rehabilitation category and from 3 and 12-month samplings) were analysed for molecular composition via pyrolysis-GC-MS (Py-GC-MS) and thermally-assisted hydrolysis and methylation (THM-GC-MS). Briefly, 1 mg of sample was introduced into quartz wool-containing fire-polished quartz tubes, placed into a Pyroprobe 5000 (CDS Analytical) interface (at 325 °C), and pyrolysed at 650 °C set-point temperature for 20 s. The pyrolysis products were swept into an Agilent 5977 GC-MS instrument by 1 mL min−1 helium flow. The pyrolysis and THM products were separated on a HP-5MS GC column and identified using EI at 70 eV, scanning in the m/z 50–500 range. For THM-GC-MS, the analysis was preceded by the addition of an aliquot of aqueous tetramethyl ammonium hydroxide (TMAH, 25 % from Sigma-Aldrich).
The 109 pyrolysis (Table S2) and 105 THM (Table S3) GC-MS products were semi-quantified based on the peak areas of their dominant fragments. Relative proportions were calculated as the % of total quantified peak area for Py- and THM-GC-MS separately. These datasets are “closed datasets” that allow the study of organic matter composition and variation therein. The products were grouped into several main classes (Tables S2 and S3).
Using (conventional) Py-GC-MS, the macromolecules in a sample are fragmented thermally in the absence of reagents (Voorhees, 2013; Wampler, 2006), whereas in THM-GC-MS, the presence of the strongly alkaline TMAH causes hydrolysis and derivatisation (methylation) of hydrolysable functional groups, such as hydroxyl to ether and carboxyl to ester (Challinor, 2001; He et al., 2020) The set of compounds generated, and their chromatographic behaviour, are very different for the two techniques, which therefore have different sensitivities to different OM types (Kaal et al., 2020).
2.4 Data analysis
Statistical analyses and PCA were performed in R (v. 4.4.2) using car, lme4, glmmTMB, emmeans and FactoMineR packages. Generalised linear mixed effect models were used to test for the main and interaction effects of rehabilitation category (Grazed, Restored, and Natural Reference) and variable-specific main effects for soil parameters (depth and rehabilitation category), final litter mass remaining and k-rate (litter type and rehabilitation category), and elemental carbon and nitrogen for S. quinqueflora roots (sampling time excluding initial data and rehabilitation category). Site was a random factor in all models. For the molecular analyses of S. quinqueflora root material that had reduced replication, one-way linear models were used separately for time and rehabilitation category condition test. A Tukey adjustment was made for all pairwise analyses.
We performed principal component analysis (PCA) to examine the important variables contributing to the variability in belowground soil characteristics and the relationships between those variables with rehabilitation categories, simultaneously. The eleven variables included ten belowground variables (organic carbon stock (g OC cm−3), nitrogen stock (g N cm−3), percent organic carbon, percent total nitrogen, soil C:N ratio, soil strength (kPA), DBD (g cm−3), soil elevation (m), soil temperature (°C), and the proportion of mass remaining of S. quinqueflora root) and one aboveground variable (vegetation cover percent). The organic carbon stock, nitrogen stock, percent organic carbon, percent total nitrogen, soil C:N ratio, and DBD were averaged across the 10 cm core sections for the PCA. Vegetation cover percent was averaged across the three time points, 3, 6 and 12 months.
3.1 Site characteristics
3.1.1 Soil redox and temperature (abiotic indicators)
There was minimal fluctuation in redox potential across the tidal cycles measured at the three logger stations. Redox potential measurements were positive at all sites and time points. At 6 months in winter August 2022, the redox potential measurements were lowest for the Natural Reference (NR1; 103 ± 0.71 mV mean and SEM) and Grazed (G2; 121 ± 1.4 mV) sites, while the Restored site (R1) had approximately 2-fold higher redox potentials (234 ± 4.9 mV), suggesting more oxidised soil conditions. In summer (February 2023), the redox potential measurements were highest for the Grazed site (267 ± 3.9 mV), in contrast to the relatively more reduced Restored (106 ± 0.5 mV) and Natural Reference sites (54 ± 0.9 mV).
Soil temperature across all sites and rehabilitation categories followed a consistent seasonal trend. Summer temperatures maximums were around 25–30 °C, with peak monthly mean temperatures in January 2023 (∼ 21–24 °C; Fig. S2). Extreme winter temperature lows were approximately 0–5 °C, with minimum monthly mean temperatures in July 2022 (∼ 10–12 °C; Fig. S2). The Grazed plots (G1, G2, and G3) exhibited slightly higher monthly mean temperatures, particularly for sites G1 and G2. The Restored plots (R1, R2, R3, and R4) also display similar seasonal patterns, with R2 and R3 having slightly higher summer temperatures than R1 and R4. The similarity in soil temperature patterns among the different rehabilitation categories (Grazed, Restored and Natural Reference) suggests that factors such as climate and seasonal weather variations have a dominant influence on soil temperature, regardless of the plot's specific characteristics (e.g. elevation) or management status.
3.1.2 Soil carbon, nitrogen, bulk density and strength (physiochemical indicators)
In the top 10 cm, percent soil OC (%OC) and N (%N), as well as DBD, were significantly different across rehabilitation categories and depths (main effects p≤0.002; Fig. 2). %OC and %N significantly decreased with depth, while DBD increased (Fig. 2a, b, e). Grazed sites had significantly lower %OC and %N but higher DBD compared to both Restored and Natural Reference sites (Fig. 2a, b, e), with Natural Reference soil visibly appearing peatier and rich in root material (Fig. S3). There were no significant differences between Restored and Natural Reference sites for these soil parameters. When normalised with DBD, carbon and nitrogen densities (g cm−3) were not significantly different across rehabilitation categories, but significantly decreased with depth (Chisq = 58.7, p= 1.8 e−13 and Chisq = 71.8, p= 2.6 e−16, respectively; Fig. 2c, d). Total carbon stocks in the top 10 cm were not statistically different among Grazed (36.1 ± 3.5 Mg C ha−1), Restored (30.4 ± 1.4 Mg C ha−1) and Natural Reference (31.1±1.2 Mg C ha−1) categories (Chisq = 1.28, p= 0.52).
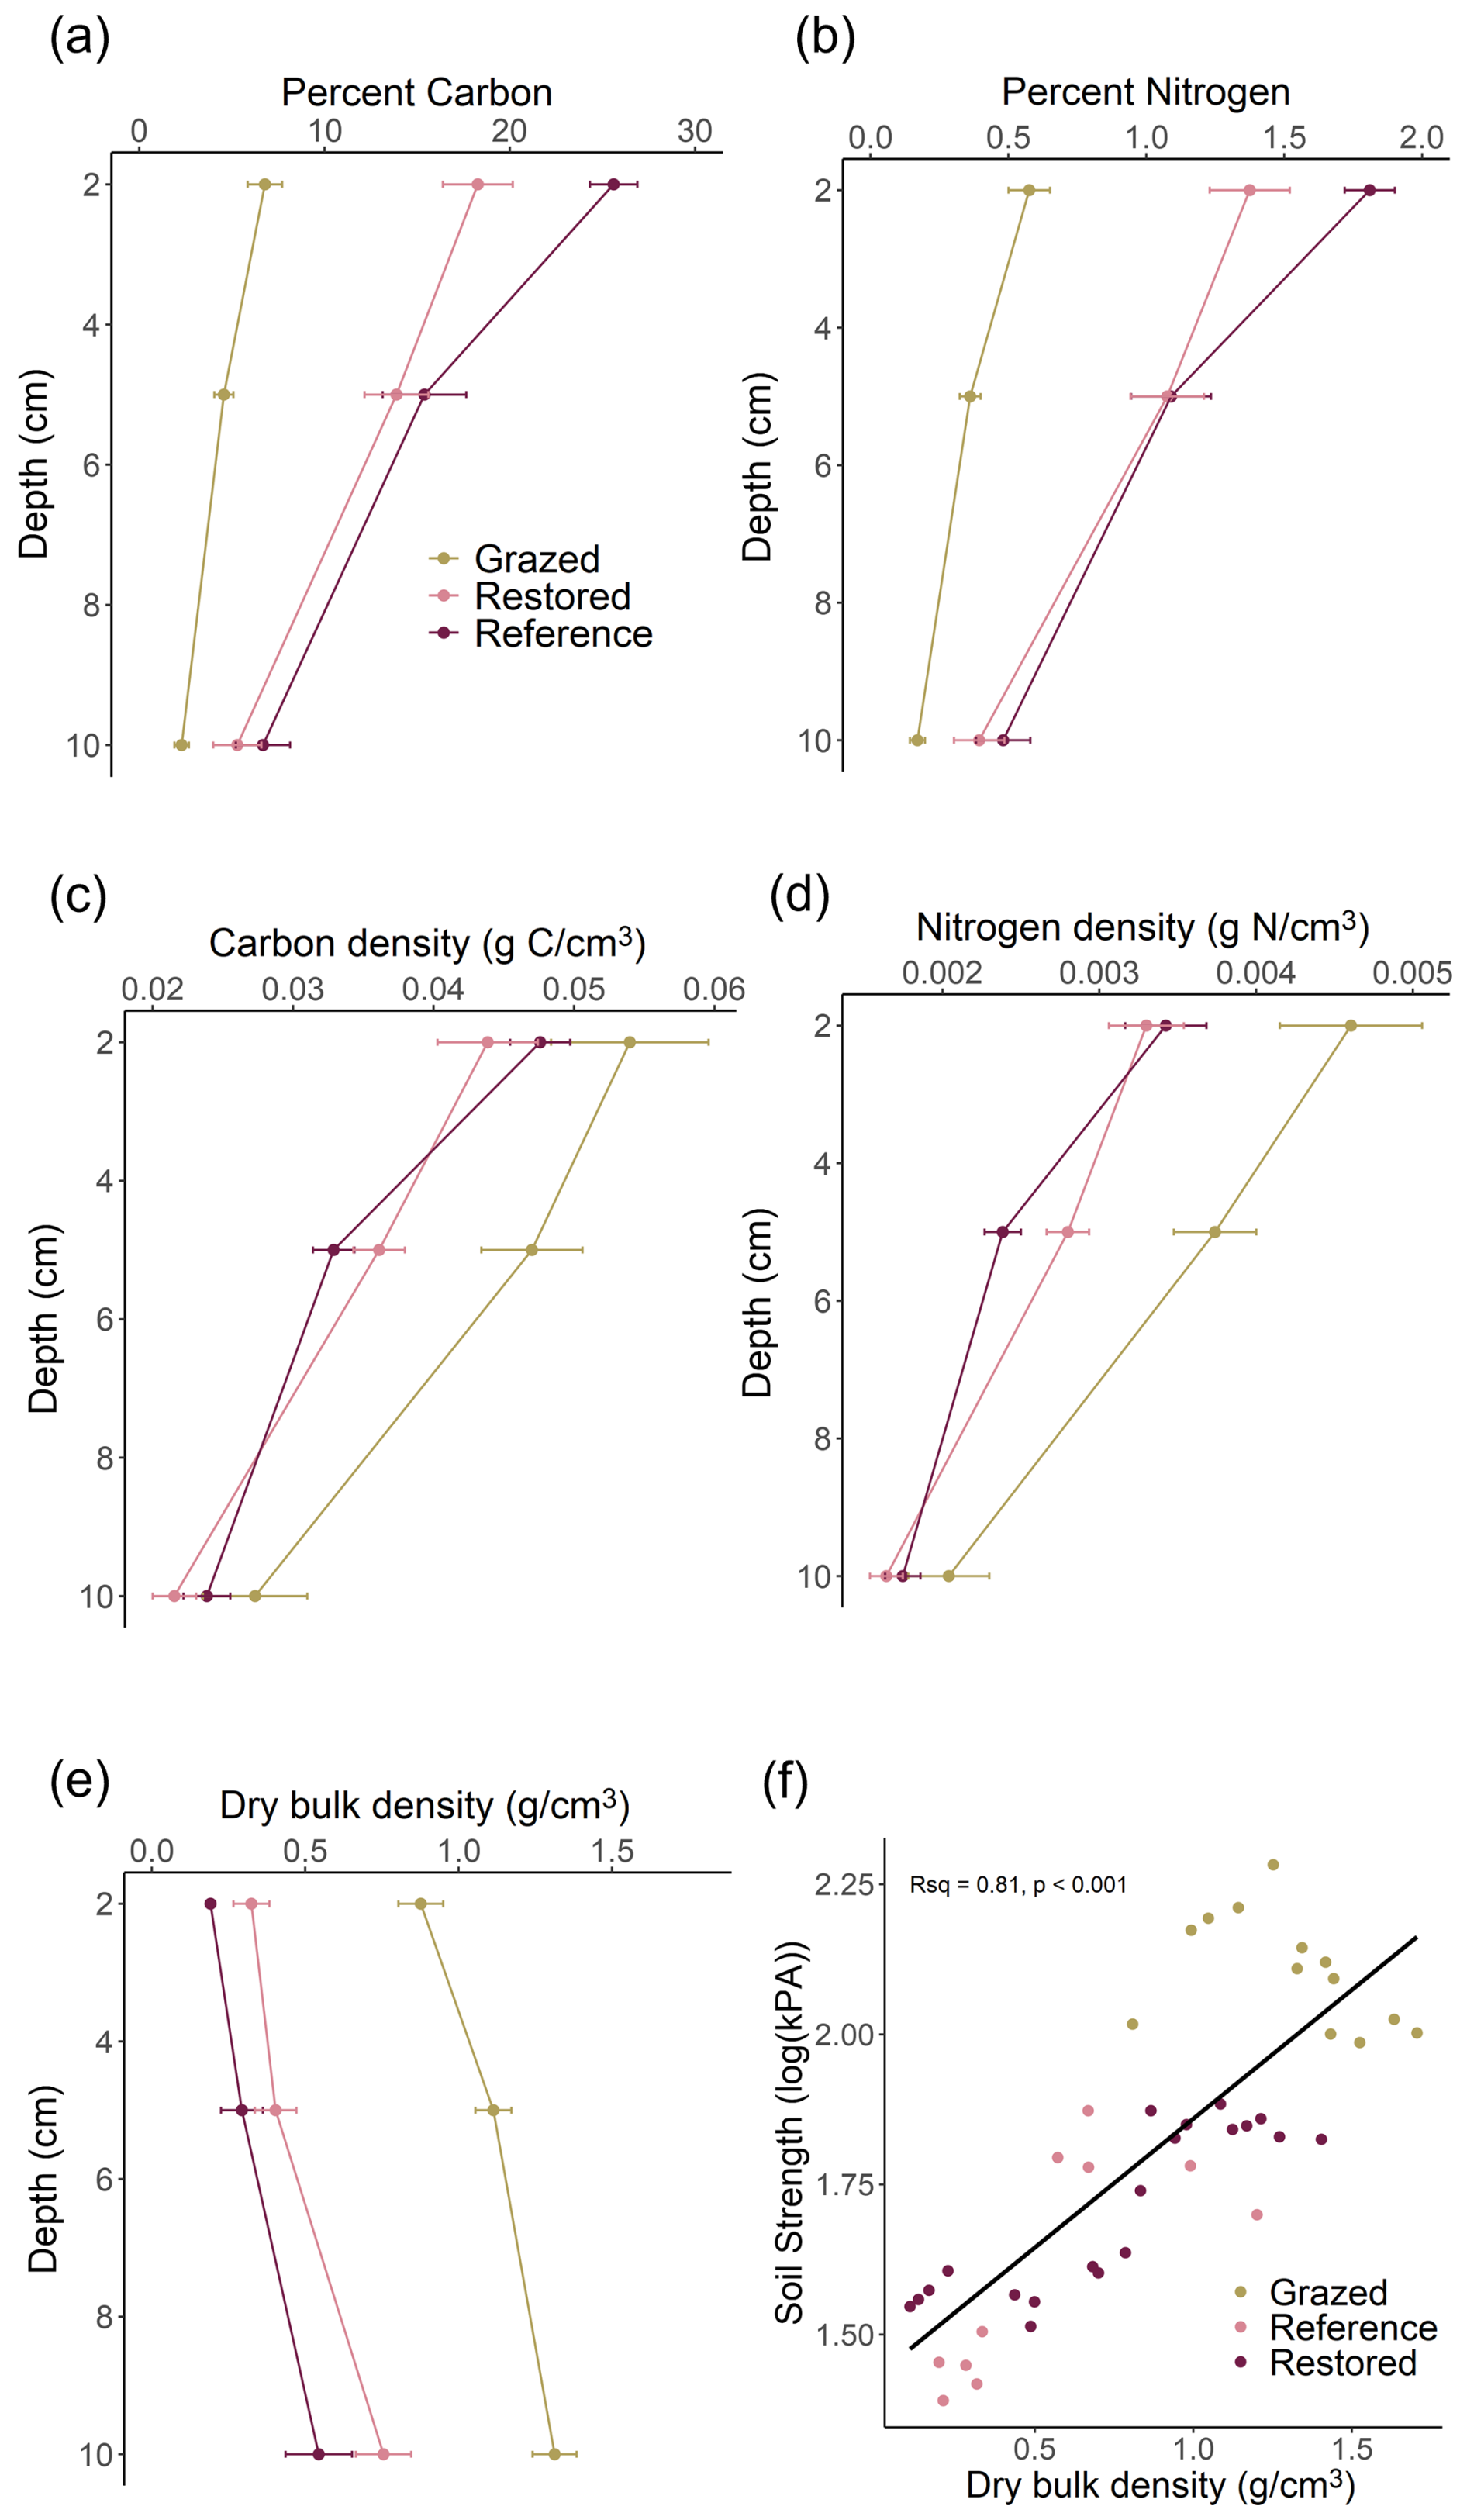
Figure 2Top 10 cm saltmarsh soil characteristics at Grazed, Restored and Natural Reference sites. (a) Elemental percent organic carbon. (b) Elemental percent nitrogen. (c) Organic carbon density. (d) Nitrogen density. (e) Dry bulk density. Data represent means and standard error. (f) Relationship between dry bulk density and soil strength at ∼ 10 cm depth. Note the log scale of soil strength. The line represents Pearson's correlation.
Soil strength was significantly different across rehabilitation categories for both 10 and 20 cm depths (Chisq = 18.0, p = 0.00012 and Chisq = 17.5, p = 0.00016, respectively; Table S4). Grazed sites had the highest soil strength at 10 and 20 cm depths (124 ± 8.0 and 157 ± 8.4 kPA, respectively), while soil strength means at Restored and Natural Reference sites were 1.7–3.6-fold lower (Table S4). We found a significant and strong positive correlation between DBD and soil strength at 10 cm (Pearson's t = 8.7, p = 7.2 e−11, R2= 0.806; Fig. 2f).
3.2 Aboveground vegetation (biodiversity indicator)
Salicornia quinqueflora dominated our experimental plots with 50 % or more of cover throughout the year (Fig. 3). The Natural Reference sites had the highest S. quinqueflora cover (≥ 90 %), leading to the lowest alpha diversity (i.e. species richness and abundance) of the three rehabilitation categories (Figs. 3, S4). Restored sites had the highest alpha diversity that changed slightly in composition over the course of a year (e.g. Frankenia pauciflora and Suaeda spp). Grazed sites had the highest cover of bare, unvegetated areas of the plots (means ranged from 30 %–42 %) with ephemeral Suaeda cover in addition to Salicornia patches in our plots (Fig. 3).
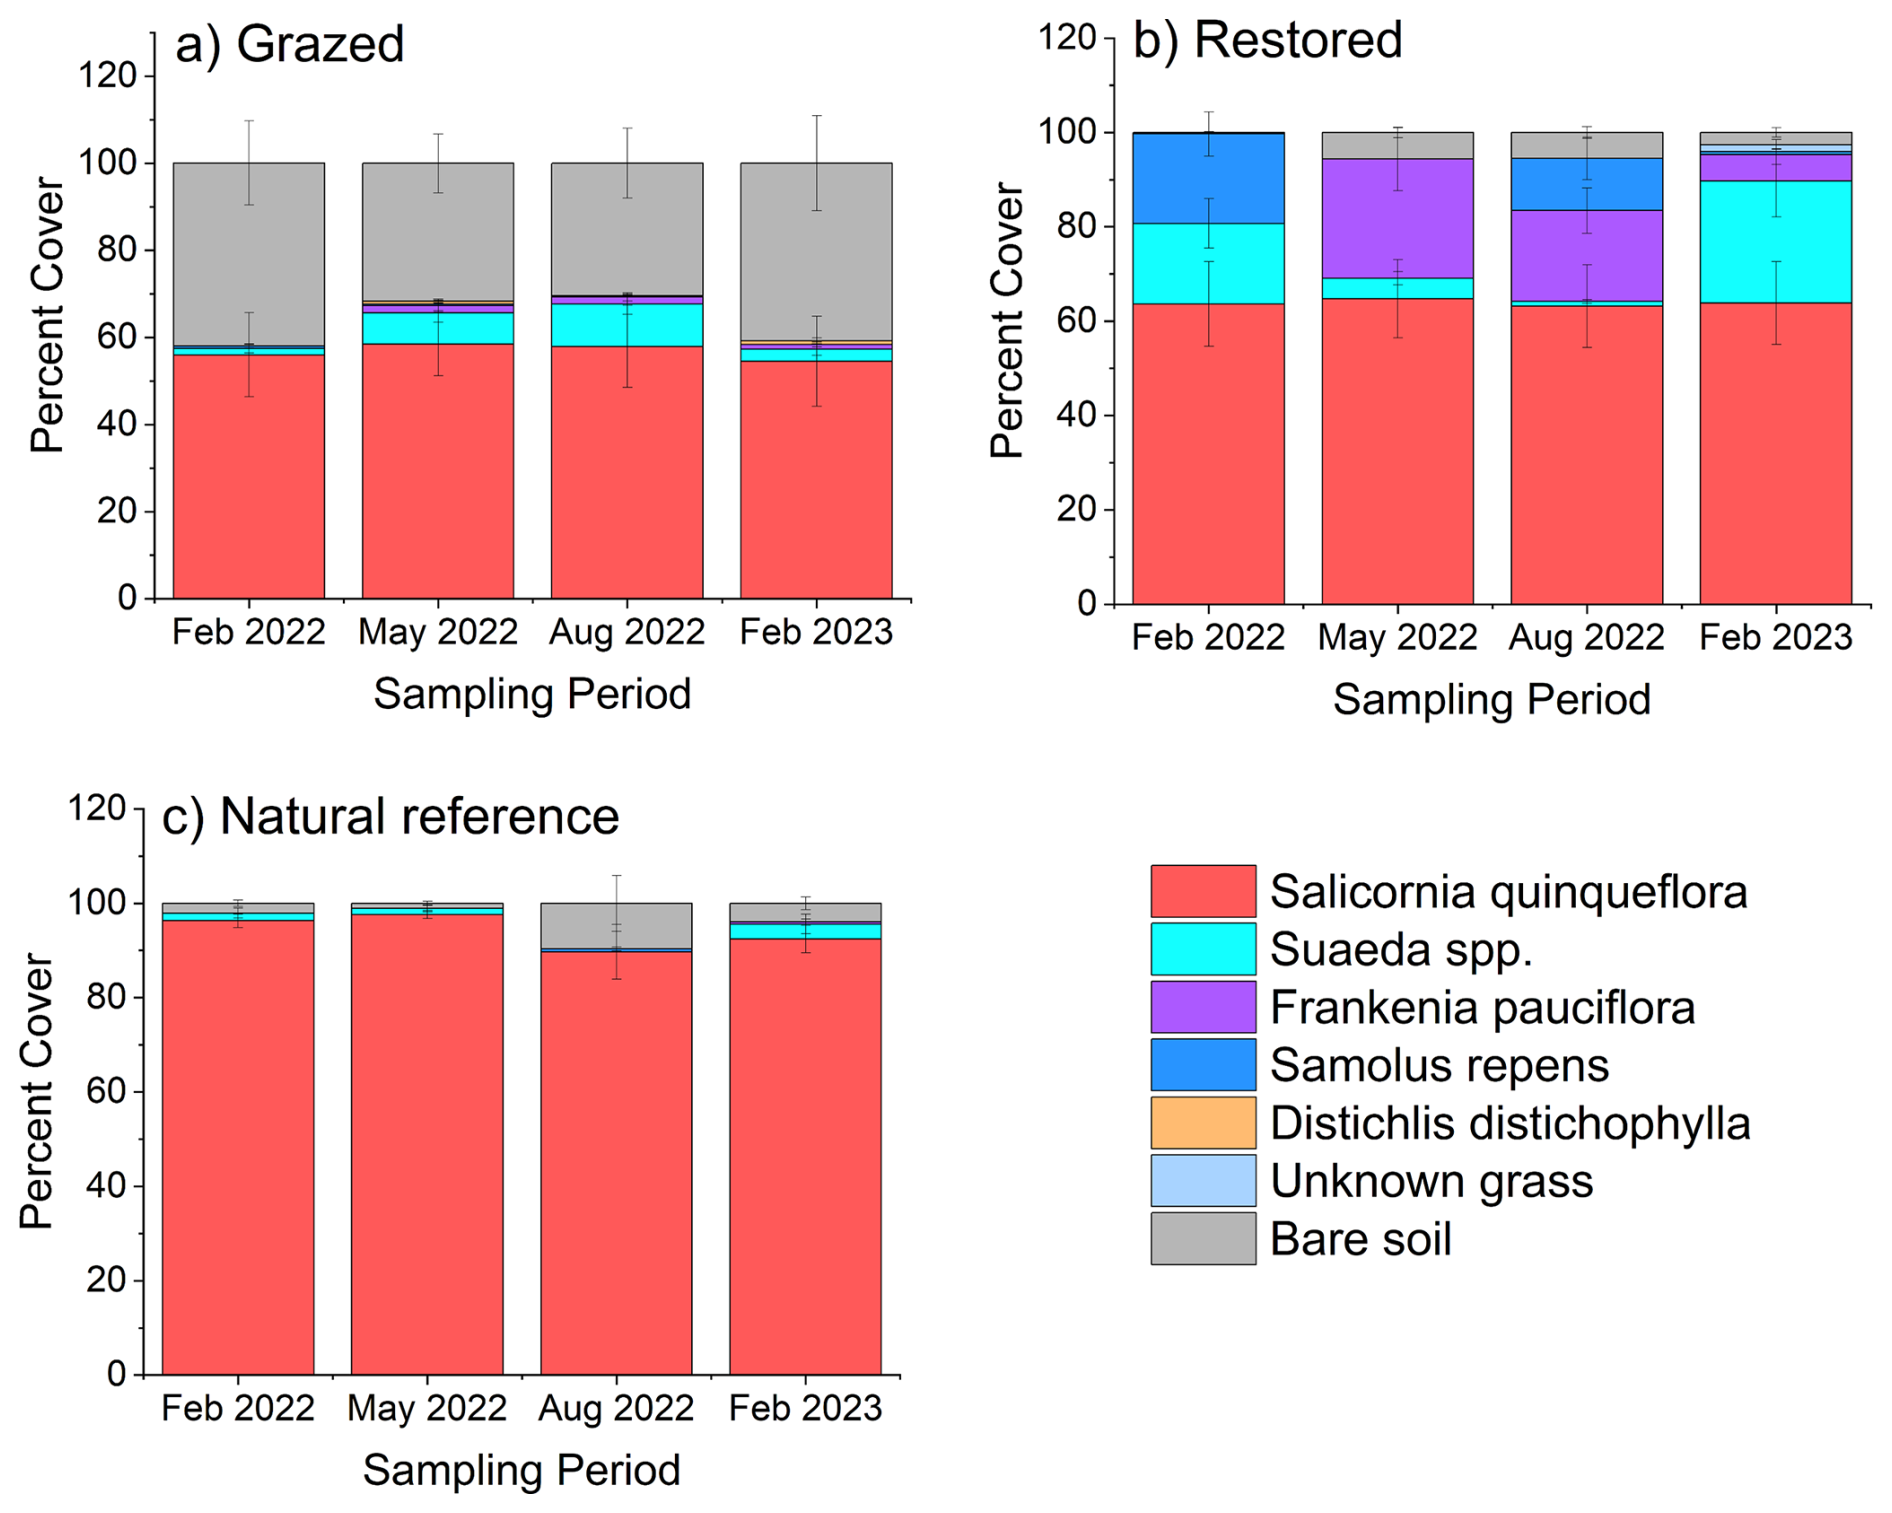
Figure 3Saltmarsh vegetation cover over one year at (a) Grazed, (b) Restored and (c) Natural Reference sites. Vegetation surveys were taken of the experimental plots at initial, 3-, 6- and 12-month sampling periods. Data represent mean and standard error.
3.3 Litter decomposition
3.3.1 Salicornia quinqueflora root and tea litter decomposition (biological turnover)
The proportion of mass remaining at the end of the study was significantly different among litter types (p<0.001; Fig. 4a), with rooibos tea the highest (0.611±0.012), followed by S. quinqueflora roots (0.310±0.008) and green tea (0.108±0.012). An interaction effect for litter type and rehabilitation category (Chisq = 27.923, p<0.001) was driven by a significantly higher mass remaining for green tea litter at the Grazed sites compared to Restored sites (z-ratio = 4.636, p<0.0001) and Natural Reference sites (z-ratio = 3.791, p = 0.0004). There was no significant effect of rehabilitation category on decay rates, but a highly significant effect of litter type (Chisq = 303.9692, p<2e−16), with the decay rates of green tea nearly 8- and 2-fold higher than rooibos and S. quinqueflora roots, respectively (Fig. 4b, Table S5).
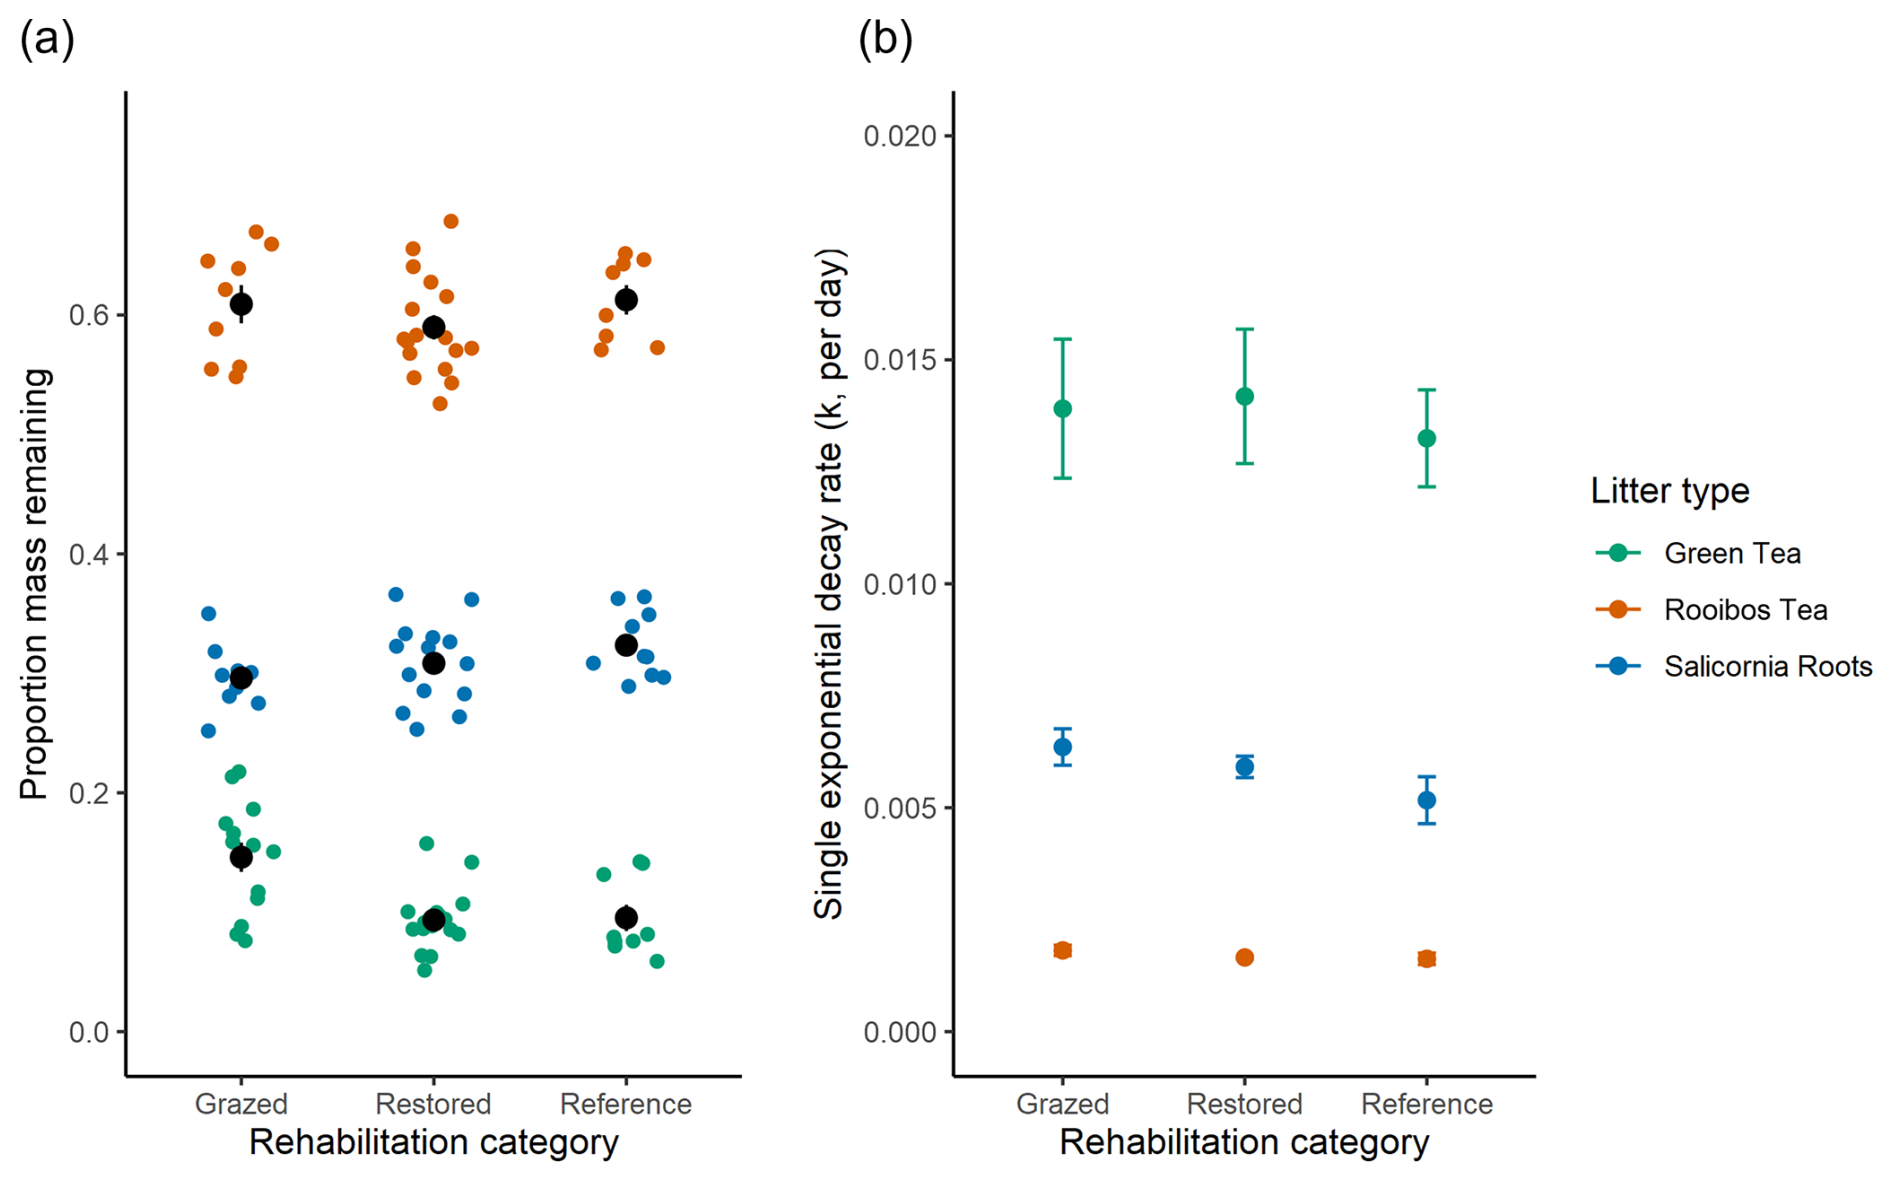
Figure 4Decomposition parameters over 1 year of green tea, rooibos tea and S. quinqueflora root litters. (a) Proportion of mass remaining of litters after 12 months of decay. Coloured circles are raw values with central black circles representing mean and standard error for the litters at each rehabilitation category. (b) Decay rate constant (k, proportion mass lost per day) from single exponential decay fit. Reference refers to Natural Reference sites. Data represent means and standard error.
Organic carbon, nitrogen and C : N ratios of S. quinqueflora roots had a significant time ⋅ rehabilitation category interaction (Fig. 5). For the rehabilitation category, Grazed sites were significantly higher for nitrogen than Restored sites at the final 12-month sampling (p = 0.0222), while significantly lower than Restored sites for C : N ratios (p = 0.0239; Figure 5b,c). Over time, root carbon significantly increased as decomposition progressed for each rehabilitation category (Fig. 5a), but nitrogen changed differently according to rehabilitation category (Fig. 5b, c). Specifically, the Natural Reference sites did not significantly change over time, while nitrogen increased in Grazed sites but decreased at Restored sites (Fig. 5b). These relative changes in root elemental content led to a significant increase in C : N ratios at the Restored sites but not Grazed or Natural Reference sites (Fig. 5c). While both carbon and nitrogen decay rates were lowest for the Natural Reference sites, they were not significantly different to the decay rates at the Grazed and Restored sites (Table S5).
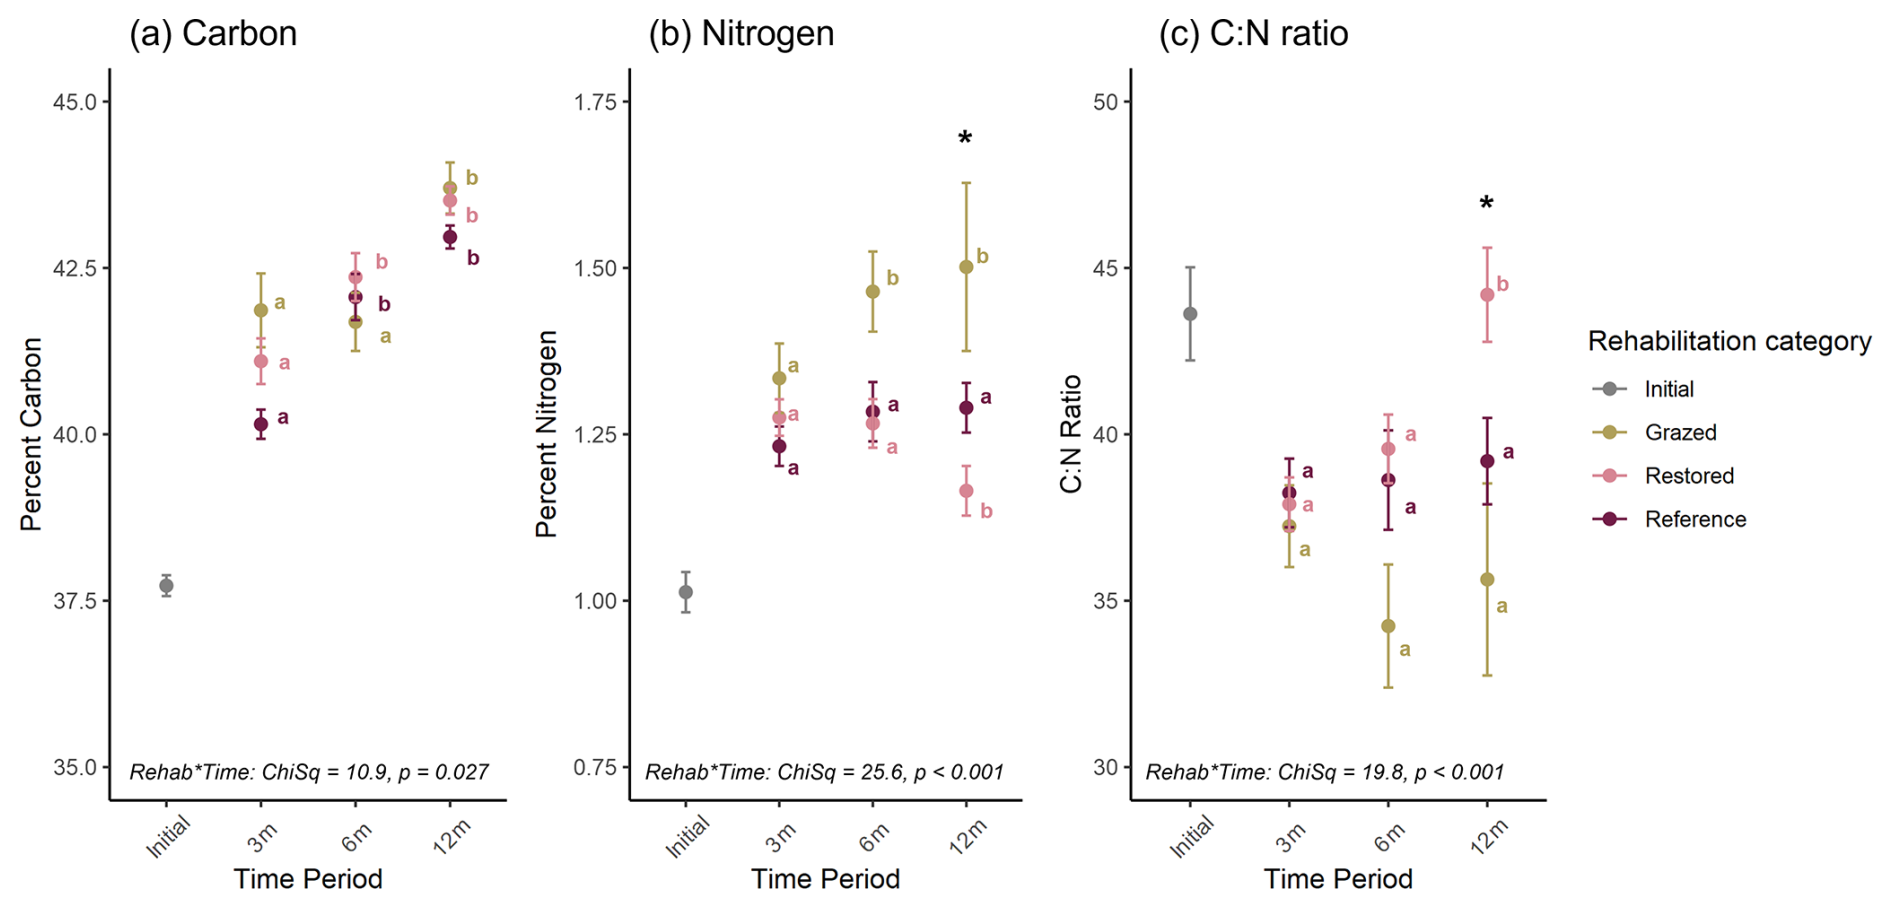
Figure 5Elemental content of S. quinqueflora roots throughout 1-year of decomposition. (a) Percent organic carbon. (b) Percent nitrogen. (c) Molar Carbon : Nitrogen ratios. Letters indicate post-hoc differences over time for each rehabilitation category individually, not across categories for each time point. Asterisks indicate a significant difference at 12 months between Grazed sites and both Restored and Natural Reference sites. Data represent mean and standard error.
3.3.2 Salicornia quinqueflora root molecular shifts during decomposition (molecular preservation indicator)
The molecular analysis of the decaying S. quinqueflora roots indicated significant shifts over time, and limited changes related to rehabilitation category (Figs. 6, 7 and S5). The multivariate analyses on the Py-GC-MS data showed that 31 % of the variance (PC1) was driven by changes in time, while PC3 (11 % of variance) was indicative of nitrogen-rich microbial compounds and phenol accumulation at the Grazed sites, in contrast to the enriched syringyl lignin in Restored/Natural Reference sites (Fig. 7, see Fig. S5i, j for principal component loadings). PC2 (19 %) did not depend statistically on incubation time or treatment and had high positive loadings for lignin products. Specifically, we found that only nitrogen compounds (i.e. pyrroles, pyridines, acetamide, indoles) and phenols formed upon Py-GC-MS were significantly different among rehabilitation categories, both of which became enriched at the Grazed sites (Figs. 7, S5d, e). We noted marginally insignificant effects for N-compounds between Grazed and Restored (p = 0.051) and Natural Reference (p = 0.72) treatments in pairwise analysis (Fig. S5d).
Throughout the decomposition incubation of the root litter across all rehabilitation categories, relative concentration of carbohydrate products from Py-GC-MS (including acetic acid, furans, pyrans, anhydrosugars; Fig. S5a) and THM-GC-MS (methylated metasaccharinic acids; Figure S5k) significantly decreased, indicating loss of polysaccharides at the 3- and 12-month decay periods. Alkyl-polycyclic aromatic hydrocarbons (PAHs) and unsaturated fatty acids were preferentially eliminated (Fig. S5f, o), with the former probably indicating leaching and/or decomposition of resin or resin-like organic matter. Other methylene chain compounds (MCCs; alkanes, alkenes, fatty acids, methylketones) from Py-GC-MS significantly increased throughout the year of decomposition (Fig. S5c). These results aligned with relative increases in THM-GC-MS-detected MCCs specific to the relatively recalcitrant root-derived macromolecule suberin (Figure S5m), in particular, long-chain (C16, C18, C18:1, C20, C22) fatty diacids (Kolattukudy, 2001) (Fig. S5n). In contrast, lignin and the Py-GC-MS ratios of lignin oxidation (4-acetylguaiacol/guaiacols and 4-acetylsyringol/syringols significantly increased only in the first 3-months (Fig. S5b, g, h), as corroborated by the analogous methoxybenzenes detected by THM-GC-MS (Fig. S5l); both indicating an increase in guaiacyl- and syringyl-type lignin products.
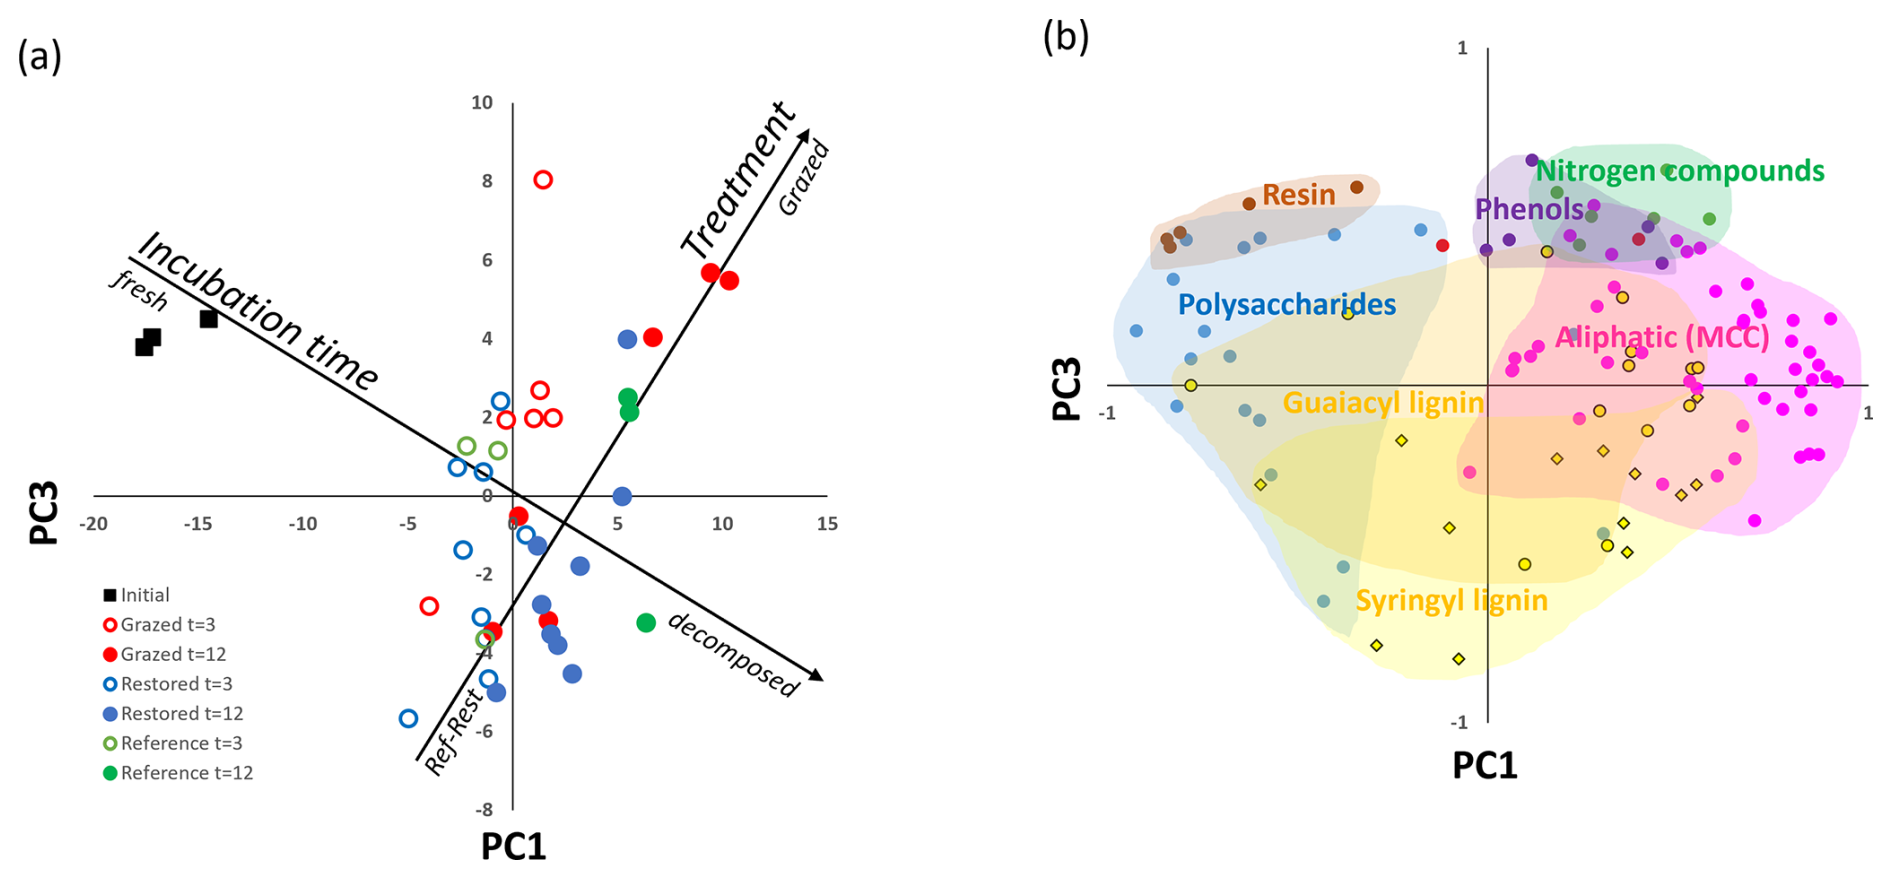
Figure 6PC1–PC3 plots from principal components analysis of the molecular composition using pyrolysis-GC-MS of S. quinqueflora roots during one year of decomposition. (a) PC scores of the samples; (b) PC loadings of the pyrolysis products. MCC refers to methylene chain compounds (aliphatic organic matter).
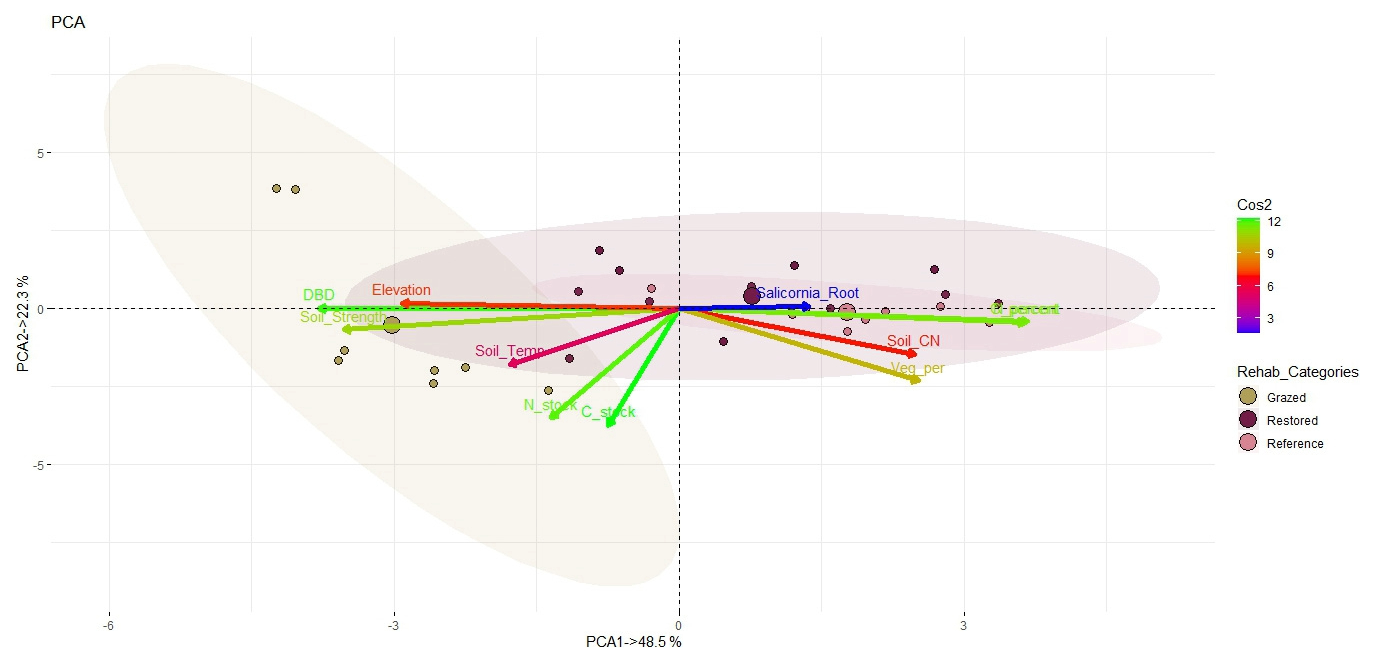
Figure 7Biplots of principal component analysis (PCA) of eleven belowground characteristic variables. Scores of the first two principal components for eleven variables in different saltmarsh rehabilitation categories (Grazed, Restored and Natural Reference) are shown. Cos2 analysis results of all the eleven variables are shown with the gradient colour bar. Variables include C_stock: carbon stock; N_stock: nitrogen stock; C_percent: percent organic carbon; N_percent: percent total nitrogen; Soil_CN: soil C : N ratio; Soil_Strength: soil strength; DBD: dry bulk density; Elevation: soil elevation; Soil_Temp: soil temperature; Veg_per: vegetation cover percent; Salicornia_Root: proportion of mass remaining of S. quinqueflora root.
3.4 Belowground responses to land-use and restoration (indicator integration)
A total of 70.8 % of the belowground variability was explained by the first two principal components. PC1 explained 48.5 % of the variation and was driven by positive correlations for percent organic carbon and percent nitrogen and by negative correlations with DBD, soil strength and soil elevation (Fig. 7). PC2 (22.3 %) was dominated by carbon stock and nitrogen stock which were correlated along the positive axis, as well as vegetation cover percent with a negative correlation (Fig. 7). The squared cosine (Cos2) shows the importance of a component for a given observation in PCA, and hence, the value of Cos2 can help to find the components that are important in driving differences in rehabilitation categories. Cos2 analyses suggest carbon stock, followed by DBD and nitrogen stock, are the most significant in contributing to the variability of the soil characteristics (Fig. 7). The Restored and Natural Reference sites overlapped with each other, whereas the Grazed sites plotted with the least overlap with the other two. Carbon stock, nitrogen stock, soil strength and DBD are the significant variables that make the Grazed sites different from the Restored and Natural Reference sites. Conversely, percent organic carbon, percent total nitrogen, and vegetation cover percent are the significant variables mostly influenced by Restored and Natural Reference sites.
4.1 Site characteristics after exclusion fencing
Restored and Natural Reference saltmarsh had lower soil strength and DBD, likely due to the relief of pugging-related compaction and the development of extensive root biomass and peat-rich soils with increased vegetation cover and diversity, respectively (Fig. 3). Grazing restrictions have similarly shown to lower DBD and increase %OC and %N over time in both coastal and terrestrial ecosystems (Sloane et al., 2021; Xiao et al., 2025). Low-laying, herbaceous or succulent saltmarsh plant diversity was higher at Restored compared to Natural Reference sites, likely in part due to our experimental focus on S. quinqueflora-dominant areas, which could indicate a high diversity of ground-dwelling species and be linked to successional and trophic shifts at the newly Restored sites (Nordström et al., 2015). Vegetation cover was similar between Restored and Natural Reference sites, and the well-developed root layers in the soil reflect the similar %OC and %N content of the Restored and Natural Reference soils in the top 5 cm depths (Burger et al., 2024). Despite higher %OC and %N, Restored and Natural Reference sites had similar carbon and nitrogen densities at the Grazed sites due to the high DBD (Gifford and Roderick, 2003), highlighting how surficial carbon stocks can misrepresent ecological condition without structural and biological metrics. Together, vegetation cover, diversity, and surface %OC and %N similarities between the Restored and Natural Reference suggest decadal timescales of vegetation and soil recovery, similar to those found for other saltmarsh (Ledford et al., 2021; Santini et al., 2019) and mangrove (Adame et al., 2018), and seagrass ecosystems (Greiner et al., 2013).
A strong positive correlation between DBD and soil strength showed significant reductions after livestock exclusion, likely improving erosion resilience and root development (Cahoon et al., 2021; Daniel et al., 2002). Although moderate compaction has been shown to reduce erosion and indirectly promote vegetation growth (Pages et al., 2019), the soil strength at the Grazed sites (mean 120 kPA) greatly exceeded that of vegetated saltmarsh areas (9–47 kPA) (Chirol et al., 2021; Pages et al., 2019; Pennings et al., 2021; Turner, 2011), which, along with the lack of vegetation cover and visibly low presence of roots, indicates the degraded condition of the sites. Our findings support the literature in showing how restoration by exclusion fencing is a simple restoration method that not only reduces compaction but also helps re-establish soil conditions that support vegetation recovery and ecosystem functions. These findings suggest that soil strength as a metric could be a good, simple indicator for future monitoring of a range of belowground recovery responses.
4.2 Belowground decomposition dynamics after exclusion fencing
The significant differences in S. quinqueflora root chemistry among the rehabilitation categories after 1 year of decomposition point to different processes influencing belowground OM turnover. In the Restored and Natural Reference sites, the higher root C : N ratios and relatively higher lignin compounds indicate selective preservation of recalcitrant plant-derived carbon (Arnaud et al., 2024). In contrast, the roots decomposing in the Grazed soils had higher nitrogenous compounds and phenolic content and lower C:N ratios, pointing to increased microbial metabolism and N-rich biomass accumulation (Meier and Bowman, 2008; Olsen et al., 2011). Given that the Grazed soils also have low %CN content, together these findings point to the mechanisms that underpin enhanced microbial turnover in nutrient-limited, disturbed soils, while in Restored and Natural Reference saltmarsh soils, recalcitrant root carbon is able to contribute to surficial carbon stocks. These differences in the molecular composition of the decomposed root litter indicate some recovery of belowground ecosystem functions at Restored sites through the putative re-establishment of microbial processes and preservation of recalcitrant carbon (Meier and Bowman, 2008).
In contrast to shifts in S. quinqueflora root chemistry during decay, we only found that mass loss of the saltmarsh roots indicated a trend towards slower decomposition at the Natural Reference sites. The root decay rate constant (k) did not differ significantly across rehabilitation categories and was overall higher (mean range 0.0052–0.0064 d−1) than a congener (S. fruiticosa ∼ 0.0008 d−1) and the global saltmarsh root average (0.0012 d−1) (Curcó et al., 2002; Ouyang et al., 2017; Scarton et al., 2002). We hypothesise that the differences in our study are due to the relatively higher carbohydrate content in our mixed root materials (∼ 0.5 lignin:carbohydrate ratio), compared to the more lignin-rich content of specific root types (1.1–1.6 lignin:polysaccharide ratio) (Arnaud et al., 2024).
Interestingly, the standardised tea litter decay rates were less sensitive to rehabilitation category than the native roots. Additionally, the mass remaining of the green tea litter was higher in the Grazed soils, the opposite trend to root litter. These results emphasise how the standardised litters, particularly green tea in short-term incubations, are highly influenced by soil moisture and temperature, which enhances leaching (Petraglia et al., 2019; Trevathan-Tackett et al., 2020). As such, short-term studies (≤ 1 years) using standardised litters are likely more influenced by abiotic drivers than biotic (Trevathan-Tackett et al., 2021), and thus not sensitive to geographically constrained space-for-time restoration studies (Ibanez-Alvarez et al., 2022).
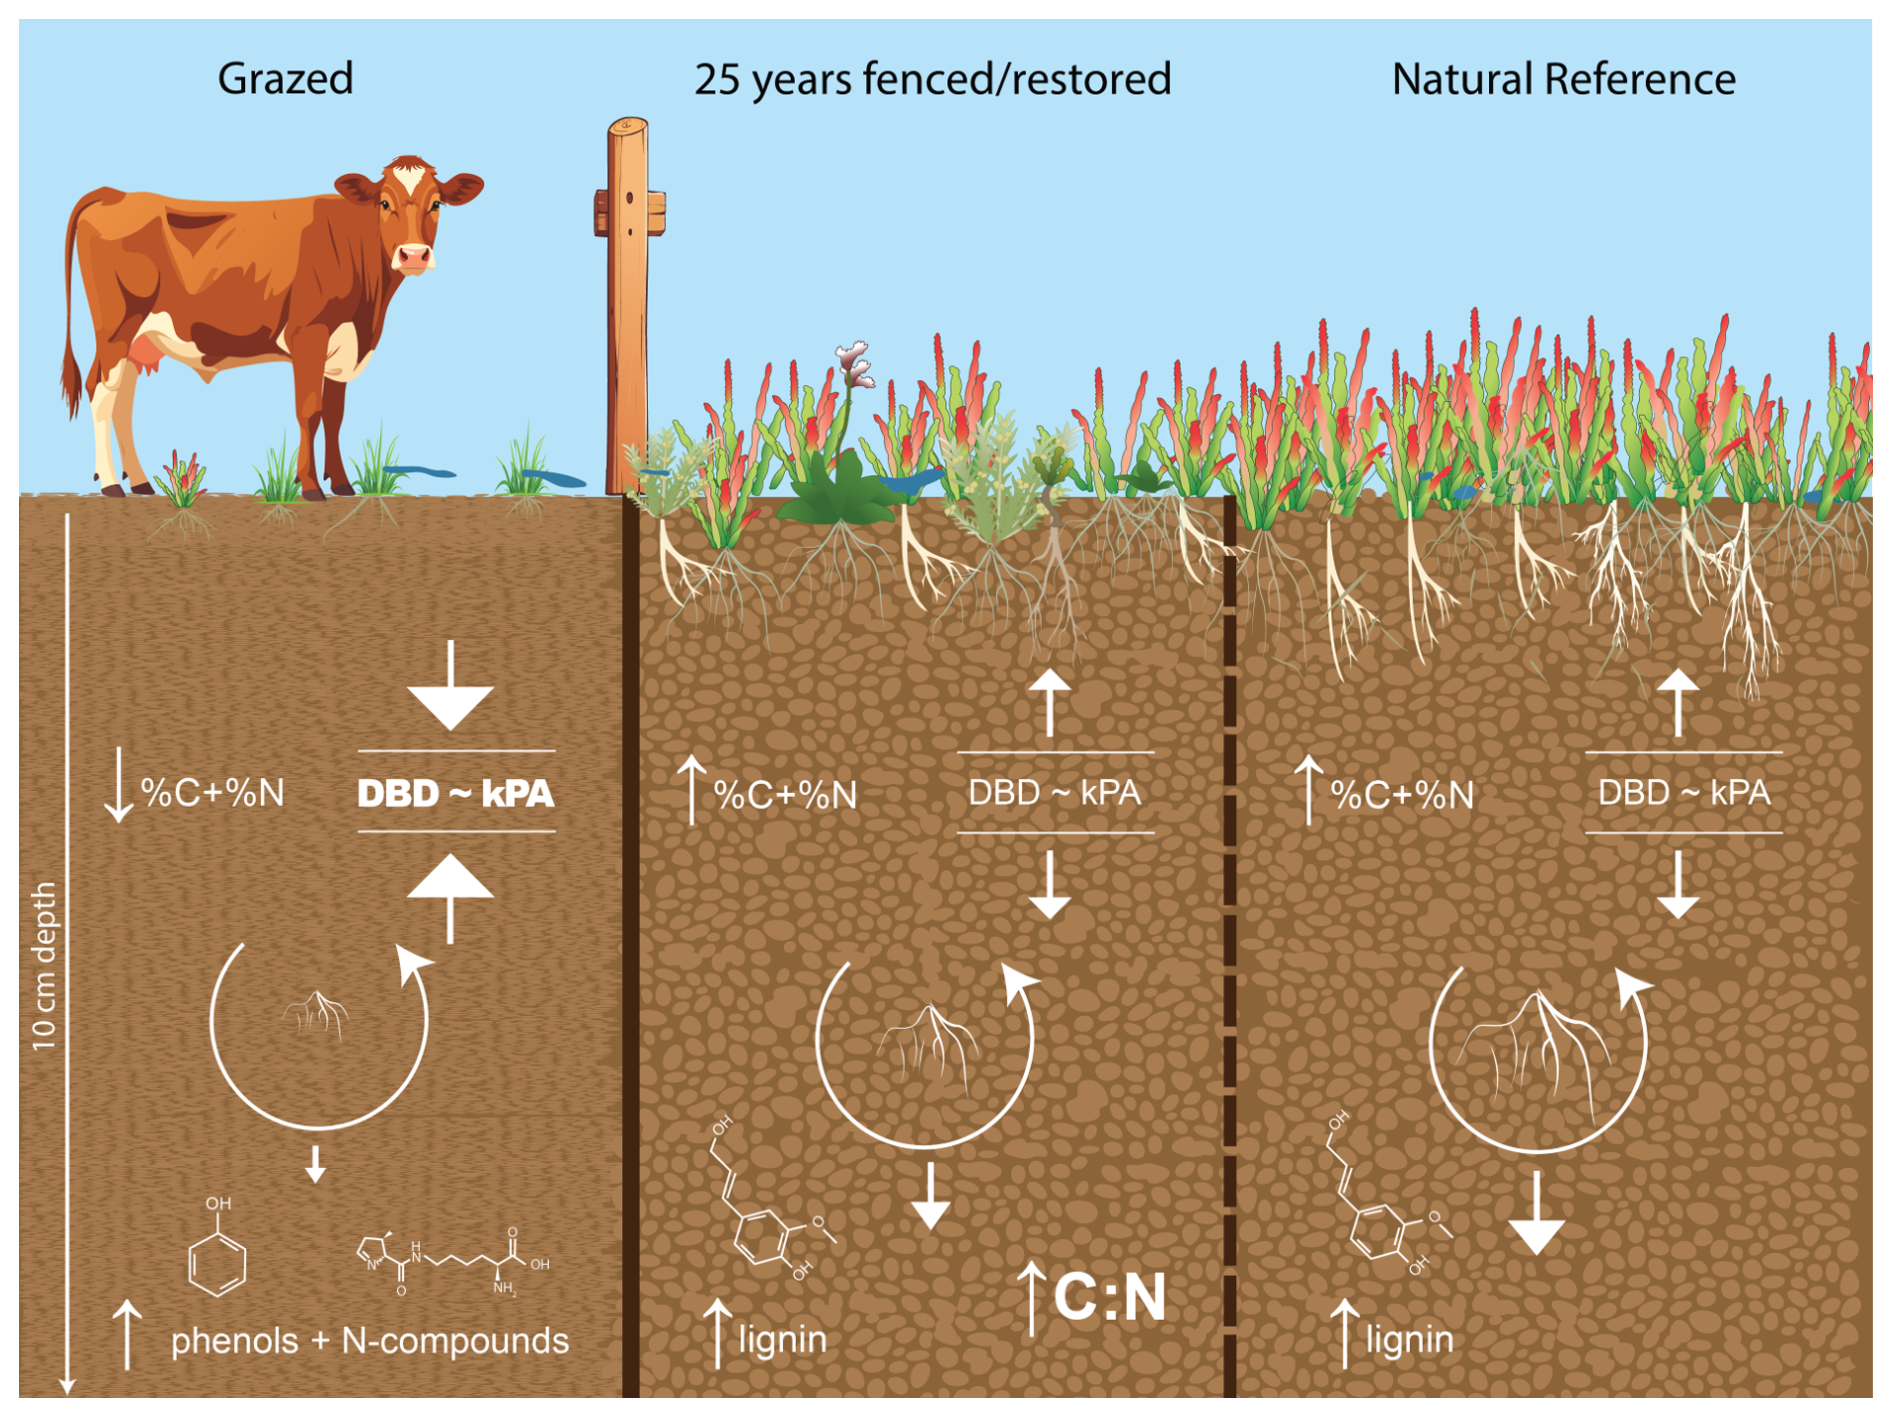
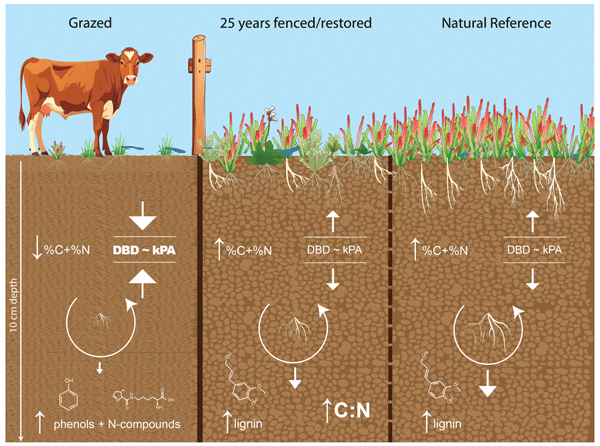
Figure 8Conceptual design of the physical, chemical and biological surficial belowground responses to saltmarsh exclusion fencing. Ungulate removal leads to reduced soil compaction, evidenced through reduced dry bulk density (DBD) and soil strength (kPA), concomitant with enhanced vegetation, root biomass and soil carbon (%C) and nitrogen (%N). Restored and natural saltmarsh conditions were also characterised by improved carbon stability through reduced root decomposition and selective preservation of recalcitrant lignin. Root decomposition in Grazed soils was characterised by increased microbial nitrogen and phenolic compounds.
4.3 Multi-indicator approach to assess saltmarsh soil recovery after restoration
By combining multi-indicator and space-for-time approaches, we showed that exclusion fencing improves physical, chemical and biological soil properties over 25 years, with the restored temperate saltmarshes closely resembling natural saltmarsh ecosystems (Fig. 8). Removal of ungulates enhances surficial soil quality through preservation of recalcitrant carbon, which is likely correlated to both enhanced vegetation cover that promotes root production and allochthonous OM capture (Fig. 8) (Mueller et al., 2019). In contrast, the highly compacted, historically grazed soils in this study have higher saltmarsh root turnover, potentially due to a combination of low availability of organic matter, less frequent inundation and higher temperatures (Fig. 8). Disturbing coastal soils releases reactive organic matter. This changes the microbial community and causes microbes to start breaking down complex organic compounds that normally stay stable, which in turn increases CO2 emissions (Macreadie et al., 2025; Ward et al., 2019). These conditions promoted microbial decomposition of the fresh root material and indicate that the elevated carbon and nitrogen stocks at the Grazed sites are reflective of changes in soil physical structure rather than improvements in soil quality or ecosystem function. Any form of disturbance, including changes in temperature, nutrient levels or oxygen availability, can alter microbial community composition, structure and metabolism, potentially triggering the mineralisation of otherwise stable carbon. Thus, the present study attests to the capacity of restoration practices, such as exclusion fencing of livestock, for the stabilisation of organic carbon.
Some surficial soil metrics, such as soil strength, soil/root percent carbon and nitrogen content and chemical shifts during root decay, are more sensitive soil indicators of exclusion fencing restoration than others, particularly standardised litter decay and surficial carbon stocks. For the latter, carbon stocks integrate bulk density and carbon content, and each varies in its response to grazing and restoration. In our study, Grazed soils had higher bulk density but lower carbon content, whereas Restored and Natural Reference soils showed the opposite pattern (Fig. 8). The combined effect on calculated carbon stocks may then show no difference (as in Harvey et al., 2019), despite clear differences in each component. While it is worth noting that the depths we investigated (0–10 cm) were shallower than standard for blue carbon stock assessments (30–100 cm), the surficial soils were expected to be the most responsive to changes to land management, including vegetation establishment and growth resulting in root turnover and soil capture (Arnaud et al., 2024; Burden et al., 2013; Gulliver et al., 2020), as well as compaction impacts of ungulates. Analyses of saltmarsh and mudflat sediments indicate that organic matter degradation is largely confined to the upper 5–10 cm, showing minimal change below this depth (Benjamin et al. 2026). Therefore, we focused on the top 10 cm in this study to quantify the organic matter cycling, which we expect to proportionally influence carbon stocks and molecular composition in the deeper soil layers. By taking a targeted and multi-parameter approach to measuring surficial soil condition, our study reveals novel, quantifiable changes in microbial processes and carbon preservation 25 years after restoration intervention that underpin soil function and carbon sequestration (Fig. 8).
Importantly, this study provides a snapshot of recovery 25 years after restoration intervention, showing Restored sites approaching Natural Reference conditions. While encouraging, it does not clarify if recovery occurs gradually or follows a nonlinear trajectory. By linking low-cost monitoring methods (e.g. soil strength) with more advanced metrics of recovery (e.g. decay metrics and molecular indicators of OM composition) and understanding the interaction between these, more accessible approaches are realised for continuous monitoring of responses to restoration beyond that of carbon stocks and vegetation assessments. This integrated approach better captures recovery dynamics, informing restoration benefits and the condition of ecosystem functions, focusing on carbon quality over quantity (Strobl et al., 2019). As such, our study provides novel molecular indicators, linked to more commonly used soil and decomposition metrics, to produce insight into the mechanisms that contribute to soil formation and function in restored saltmarsh ecosystems.
Data will be made available upon request to the corresponding author(s).
The supplement related to this article is available online at https://doi.org/10.5194/bg-23-4843-2026-supplement.
S.K.B.O., P.I.M., P.E.C. & S.T-T. conceptualised and designed the study. S.K.B.O. and S.T-T. collected the data. S.T-T., A.A., J.K. & S.N. analysed the data. S.K.B.O., A.A. & S.T-T. wrote the first draft of the manuscript. All authors contributed to the drafting and revising of the manuscript.
The contact author has declared that none of the authors has any competing interests.
Publisher's note: Copernicus Publications remains neutral with regard to jurisdictional claims made in the text, published maps, institutional affiliations, or any other geographical representation in this paper. The authors bear the ultimate responsibility for providing appropriate place names. Views expressed in the text are those of the authors and do not necessarily reflect the views of the publisher.
We thank the private landholders for access to their properties and for their continued support of restoration science over the years. We thank Dr Anne Yusuf for her insightful suggestions during the revision and Randy Tackett for the conceptual design development. We thank Katie Allen, Dr Noyan Yilmaz, Rory Crofts and the volunteers for their assistance. Thank you Dr Anthony Rendall for statistical analysis advice. We acknowledge the Wadawurrung and Wurundjeri people as the traditional owners, caretakers and scientists of land and sea where this work took place. Abode Illustrator AI features were used to help create the conceptual design.
This research has been supported by the Australian Research Council (grant no. DE210101029).
This paper was edited by Paul Stoy and reviewed by two anonymous referees.
Adame, M., Zakaria, R., Fry, B., Chong, V., Then, Y., Brown, C., and Lee, S.: Loss and recovery of carbon and nitrogen after mangrove clearing, Ocean Coast. Manage., 161, 117–126, https://doi.org/10.1016/j.ocecoaman.2018.04.019, 2018.
Arnaud, M., Bakhos, M., Rumpel, C., Dignac, M.-F., Bottinelli, N., Norby, R. J., Geairon, P., Deborde, J., Kostyrka, P., and Gernigon, J.: Salt marsh litter decomposition varies more by litter type than by extent of sea-level inundation, Commun. Earth Environ., 5, 686, https://doi.org/10.1038/s43247-024-01855-0, 2024.
Bayraktarov, E., Brisbane, S., Hagger, V., Smith, C. S., Wilson, K. A., Lovelock, C. E., Gillies, C., Steven, A. D., and Saunders, M. I.: Priorities and motivations of marine coastal restoration research, Front. Mar. Sci., 7, 484, https://doi.org/10.3389/fmars.2020.00484, 2020.
Benjamin, A., Benedicte, D., Chaumillon, E., Rumpel, C., Dignac, M. F., Felbacq, A., Schmidt, S., Destampes, M., Arnaud, M., Metzger, E., Lacoue-Labarthe, T., and Dupuy, C.: Organic carbon composition and preservation in macrotidal coastal wetland sediment: insights from biomarkers and isotopic signatures, Sci. Total Environ., 1020, 181542, https://doi.org/10.1016/j.scitotenv.2026.181542, 2026.
Brooks, H., Moeller, I., Spencer, T., Royse, K., Price, S., and Kirkham, M.: How strong are salt marshes? Geotechnical properties of coastal wetland soils, Earth Surf. Proc. Land., 47, 1390–1408, https://doi.org/10.1002/esp.5322, 2022.
Burden, A., Garbutt, R., Evans, C., Jones, D., and Cooper, D.: Carbon sequestration and biogeochemical cycling in a saltmarsh subject to coastal managed realignment, Estuar. Coast. Shelf S., 120, 12–20, https://doi.org/10.1016/j.ecss.2013.01.014, 2013.
Burger, D., Bauke, S., Schneider, F., Kappenberg, A., and Gocke, M.: Root-derived carbon stocks in formerly deep-ploughed soils – a biomarker-based approach, Org. Geochem., 190, 104756, https://doi.org/10.1016/j.orggeochem.2024.104756, 2024.
Cadier, C., Bayraktarov, E., Piccolo, R., and Adame, M. F.: Indicators of coastal wetlands restoration success: a systematic review, Front. Mar. Sci., 7, 600220, https://doi.org/10.3389/fmars.2020.600220, 2020.
Cahoon, D. R., McKee, K. L., and Morris, J. T.: How plants influence resilience of salt marsh and mangrove wetlands to sea-level rise, Estuaries Coasts, 44, 883–898, https://doi.org/10.1007/s12237-020-00834-w, 2021.
Carnell, P. E., Palacios, M. M., Waryszak, P., Trevathan-Tackett, S. M., Masqué, P., and Macreadie, P. I.: Blue carbon drawdown by restored mangrove forests improves with age, J. Environ. Manage., 306, 114301, https://doi.org/10.1016/j.jenvman.2021.114301, 2022.
Challinor, J. M.: The development and applications of thermally assisted hydrolysis and methylation reactions, J. Anal. Appl. Pyrol., 61, 3–34, https://doi.org/10.1016/S0165-2370(01)00146-2, 2001.
Chang, E. R., Veeneklaas, R. M., Bakker, J. P., Daniels, P., and Esselink, P.: What factors determined restoration success of a salt marsh ten years after de-embankment?, Appl. Veg. Sci., 19, 66–77, https://doi.org/10.1111/avsc.12195, 2016.
Chirol, C., Spencer, K. L., Carr, S. J., Möller, I., Evans, B., Lynch, J., Brooks, H., and Royse, K. R.: Effect of vegetation cover and sediment type on 3D subsurface structure and shear strength in saltmarshes, Earth Surf. Proc. Land., 46, 2279–2297, https://doi.org/10.1002/esp.5174, 2021.
Curcó, A., Ibàñez, C., Day, J. W., and Prat, N.: Net primary production and decomposition of salt marshes of the Ebre Delta (Catalonia, Spain), Estuaries, 25, 309–324, https://doi.org/10.1007/BF02695976, 2002.
Daniel, J., Potter, K., Altom, W., Aljoe, H., and Stevens, R.: Long-term grazing density impacts on soil compaction, T. ASAE, 45, 1911–1915, https://doi.org/10.13031/2013.11442, 2002.
Davidson, N. C.: Wetland losses and the status of wetland-dependent species, in: The wetland book, edited by: Finlayson, C., Milton, G., Prentice, R., and Davidson, N. C., Springer, 1–14, https://doi.org/10.1007/978-94-007-6173-5_197-1, 2016.
Ferreira, F. P., Vidal-Torrado, P., Buurman, P., Macias, F., Otero, X. L., and Boluda, R.: Pyrolysis-gas chromatography/mass spectrometry of soil organic matter extracted from a Brazilian mangrove and Spanish salt marshes, Soil Sci. Soc. Am. J., 73, 841–851, https://doi.org/10.2136/sssaj2008.0028, 2009.
Gifford, R. M. and Roderick, M. L.: Soil carbon stocks and bulk density: spatial or cumulative mass coordinates as a basis of expression?, Glob. Change Biol., 9, 1507–1514, https://doi.org/10.1046/j.1365-2486.2003.00677.x, 2003.
Greiner, J. T., McGlathery, K. J., Gunnell, J., and McKee, B. A.: Seagrass restoration enhances “blue carbon” sequestration in coastal waters, PLoS One, 8, e72469, https://doi.org/10.1371/journal.pone.0072469, 2013.
Gulliver, A., Carnell, P. E., Trevathan-Tackett, S. M., Duarte de Paula Costa, M., Masqué, P., and Macreadie, P. I.: Estimating the potential blue carbon gains from tidal marsh rehabilitation: a case study from south eastern Australia, Front. Mar. Sci., 7, 403, https://doi.org/10.3389/fmars.2020.00403, 2020.
Harvey, R. J., Garbutt, A., Hawkins, S. J., and Skov, M. W.: No detectable broad-scale effect of livestock grazing on soil blue-carbon stock in salt marshes, Front. Ecol. Evol., 7, 151, https://doi.org/10.3389/fevo.2019.00151, 2019.
He, Q., Li, Z. A., Daleo, P., Lefcheck, J. S., Thomsen, M. S., Adams, J. B., and Bouma, T. J.: Coastal wetland resilience through local, regional and global conservation, Nat. Rev. Biodivers., 1, 50–67, https://doi.org/10.1038/s44358-024-00004-x, 2025.
He, Y., Buch, A., Szopa, C., Williams, A. J., Millan, M., Guzman, M., Freissinet, C., Malespin, C., Glavin, D. P., Eigenbrode, J. L., Coscia, D., Teinturier, S., Cabane, M., and Mahaffy, P.: The search for organic compounds with TMAH thermochemolysis: from Earth analyses to space exploration experiments, Trends Anal. Chem., 127, 115896, https://doi.org/10.1016/j.trac.2020.115896, 2020.
Howard, J., Hoyt, S., Isensee, K., Pidgeon, E., and Telszewski, M.: Coastal Blue Carbon: Methods for assessing carbon stocks and emissions factors in mangroves, tidal salt marshes, and seagrass meadows, UNESCO, https://unesdoc.unesco.org/ark:/48223/pf0000372868 (last access: 12 June 2026), 2014.
Ibanez-Alvarez, M., Baraza, E., Serrano, E., Romero-Munar, A., Cardona, C., Bartolome, J., and Krumins, J. A.: Ungulates alter plant cover without consistent effect on soil ecosystem functioning, Agr. Ecosyst. Environ., 326, 107796, https://doi.org/10.1016/j.agee.2021.107796, 2022.
Kaal, J., Martinez Cortizas, A., Mateo, M.-A., and Serrano, O.: Deciphering organic matter sources and ecological shifts in blue carbon ecosystems based on molecular fingerprinting, Sci. Total Environ., 742, 140554, https://doi.org/10.1016/j.scitotenv.2020.140554, 2020.
Keuskamp, J. A., Dingemans, B. J., Lehtinen, T., Sarneel, J. M., and Hefting, M. M.: Tea Bag Index: a novel approach to collect uniform decomposition data across ecosystems, Methods Ecol. Evol., 4, 1070–1075, https://doi.org/10.1111/2041-210X.12097, 2013.
Kirwan, M. L., Langley, J. A., Guntenspergen, G. R., and Megonigal, J. P.: The impact of sea-level rise on organic matter decay rates in Chesapeake Bay brackish tidal marshes, Biogeosciences, 10, 1869–1876, https://doi.org/10.5194/bg-10-1869-2013, 2013.
Kolattukudy, P. E.: Polyesters in higher plants, in: Biopolyesters, edited by: Babel, W. and Steinbüchel, A., Springer, 1–49, https://doi.org/10.1007/3-540-40021-4_1, 2001.
Laegdsgaard, P.: Ecology, disturbance and restoration of coastal saltmarsh in Australia: a review, Wetl. Ecol. Manag., 14, 379–399, https://doi.org/10.1007/s11273-005-8827-z, 2006.
Ledford, T. C., Mortazavi, B., Tatariw, C., Starr, S. F., Smyth, E., Wood, A. G., Simpson, L. T., and Cherry, J. A.: Ecosystem carbon exchange and nitrogen removal rates in two 33-year-old constructed salt marshes are similar to those in a nearby natural marsh, Restor. Ecol., 29, e13439, https://doi.org/10.1111/rec.13439, 2021.
Legesse, F., Degefa, S., and Soromessa, T.: Estimating carbon stock using vegetation indices and empirical data in the upper Awash River Basin, Discov. Environ., 2, 137, https://doi.org/10.1007/s44274-024-00165-8, 2024.
Lovelock, C. E., Adame, M. F., Bradley, J., Dittmann, S., Hagger, V., Hickey, S. M., Hutley, L. B., Jones, A., Kelleway, J. J., and Lavery, P. S.: An Australian blue carbon method to estimate climate change mitigation benefits of coastal wetland restoration, Restor. Ecol., 31, e13739, https://doi.org/10.1111/rec.13739, 2022.
Macreadie, P. I., Akhand, A., Trevathan-Tackett, S. M., Duarte, C. M., Baldock, J., Bowen, J. L., and Connolly, R. M.: Stabilisation and destabilisation of coastal blue carbon: the key factors, Earth-Sci. Rev., 265, 105133, https://doi.org/10.1016/j.earscirev.2025.105133, 2025.
Macreadie, P. I., Costa, M. D., Atwood, T. B., Friess, D. A., Kelleway, J. J., Kennedy, H., Lovelock, C. E., Serrano, O., and Duarte, C. M.: Blue carbon as a natural climate solution, Nat. Rev. Earth Environ., 2, 826–839, https://doi.org/10.1038/s43017-021-00224-1, 2021.
Meier, C. L. and Bowman, W. D.: Links between plant litter chemistry, species diversity, and below-ground ecosystem function, P. Natl. Acad. Sci. USA, 105, 19780–19785, https://doi.org/10.1073/pnas.0805600105, 2008.
Meli, P., Rey Benayas, J. M., Balvanera, P., and Martínez Ramos, M.: Restoration enhances wetland biodiversity and ecosystem service supply, but results are context-dependent: a meta-analysis, PLoS One, 9, e93507, https://doi.org/10.1371/journal.pone.0093507, 2014.
Mueller, P., Hai Thi, D., Jensen, K., and Nolte, S.: Origin of organic carbon in the topsoil of Wadden Sea salt marshes, Mar. Ecol. Prog. Ser., 624, 39–50, https://doi.org/10.3354/meps13009, 2019.
Mueller, P., Schile-Beers, L. M., Mozdzer, T. J., Chmura, G. L., Dinter, T., Kuzyakov, Y., de Groot, A. V., Esselink, P., Smit, C., D'Alpaos, A., Ibáñez, C., Lazarus, M., Neumeier, U., Johnson, B. J., Baldwin, A. H., Yarwood, S. A., Montemayor, D. I., Yang, Z., Wu, J., Jensen, K., and Nolte, S.: Global-change effects on early-stage decomposition processes in tidal wetlands – implications from a global survey using standardized litter, Biogeosciences, 15, 3189–3202, https://doi.org/10.5194/bg-15-3189-2018, 2018.
Nordström, M. C., Demopoulos, A. W., Whitcraft, C. R., Rismondo, A., McMillan, P., Gonzalez, J. P., and Levin, L. A.: Food web heterogeneity and succession in created saltmarshes, J. Appl. Ecol., 52, 1343–1354, https://doi.org/10.1111/1365-2664.12473, 2015.
Olsen, Y. S., Dausse, A., Garbutt, A., Ford, H., Thomas, D. N., and Jones, D. L.: Cattle grazing drives nitrogen and carbon cycling in a temperate salt marsh, Soil Biol. Biochem., 43, 531–541, https://doi.org/10.1016/j.soilbio.2010.11.018, 2011.
Ouyang, X., Lee, S. Y., and Connolly, R. M.: The role of root decomposition in global mangrove and saltmarsh carbon budgets, Earth-Sci. Rev., 166, 53–63, https://doi.org/10.1016/j.earscirev.2017.01.004, 2017.
Pages, J. F., Jenkins, S. R., Bouma, T. J., Sharps, E., and Skov, M. W.: Opposing indirect effects of domestic herbivores on saltmarsh erosion, Ecosystems, 22, 1055–1068, https://doi.org/10.1007/s10021-018-0322-5, 2019.
Pennings, S. C., Glazner, R. M., Hughes, Z. J., Kominoski, J. S., and Armitage, A. R.: Effects of mangrove cover on coastal erosion during a hurricane in Texas, USA, Ecology, 102, e03309, https://doi.org/10.1002/ecy.3309, 2021.
Petraglia, A., Cacciatori, C., Chelli, S., Fenu, G., Calderisi, G., Gargano, D., Abeli, T., Orsenigo, S., and Carbognani, M.: Litter decomposition: effects of temperature driven by soil moisture and vegetation type, Plant Soil, 435, 187–200, https://www.jstor.org/stable/48703674 (last access: 12 June 2026), 2019.
Pineiro-Juncal, N., Diaz-Almela, E., Leiva-Duenas, C., Deulofeu, O., Frigola, J., Soler, M., Martinez-Cortizas, A., Giralt, S., Garcia-Orellana, J., and Mateo, M. Á.: Processes driving seagrass soils composition along the western Mediterranean: the case of the southeast Iberian Peninsula, Sci. Total Environ., 768, 144352, https://doi.org/10.1016/j.scitotenv.2020.144352, 2021.
Prahalad, V. N.: Human impacts and saltmarsh loss in the Circular Head coast, north-west Tasmania, 1952–2006: implications for management, Pac. Conserv. Biol., 20, 272–285, https://doi.org/10.1071/PC140272, 2014.
Rayment, G. and Lyons, D.: Carbonates by pressure change-transducer (Method 19B2), in: Australian Laboratory Handbook of Soil and Water Chemical Methods, edited by: Rayment, G. and Lyons, D., Inkata Press, Melbourne, Australia, 420–422, 2011.
Rowland, P. I. and Lovelock, C. E.: Global impacts of introduced ungulates on wetland carbon and biodiversity: a review, Biol. Conserv., 290, 110432, https://doi.org/10.1016/j.biocon.2023.110432, 2024.
Rupprecht, F., Wanner, A., Stock, M., and Jensen, K.: Succession in salt marshes – large-scale and long-term patterns after abandonment of grazing and drainage, Appl. Veg. Sci., 18, 86–98, https://doi.org/10.1111/avsc.12126, 2015.
Santini, N. S., Lovelock, C. E., Hua, Q., Zawadzki, A., Mazumder, D., Mercer, T. R., Muñoz-Rojas, M., Hardwick, S. A., Madala, B. S., Cornwell, W., Thomas, T., Marzinelli, E. M., Adam, P., Paul, S., and Vergés, A.: Natural and regenerated saltmarshes exhibit similar soil and belowground organic carbon stocks, root production and soil respiration, Ecosystems, 22, 1803–1822, https://doi.org/10.1007/s10021-019-00373-x, 2019.
Scarton, F., Day, J. W., and Rismondo, A.: Primary production and decomposition of Sarcocornia fruticosa (L.) Scott and Phragmites australis Trin. ex Steudel in the Po Delta, Italy, Estuaries, 25, 325–336, https://www.jstor.org/stable/1352958 (last access: 12 June 2026), 2002.
Sherrod, L., Dunn, G., Peterson, G., and Kolberg, R.: Inorganic carbon analysis by modified pressure-calcimeter method, Soil Sci. Soc. Am. J., 66, 299–305, https://doi.org/10.2136/sssaj2002.2990, 2002.
Sloane, D. R., Ens, E., Wunungmurra, Y., Gumana, Y., Wunungmurra, B., Wirrpanda, M., Towler, G., Preece, D., and Rangers, Y.: Lessons from old fenced plots: eco-cultural impacts of feral ungulates and potential decline in sea-level rise resilience of coastal floodplains in northern Australia, Ecol. Manag. Restor., 22, 191–203, https://doi.org/10.1111/emr.12464, 2021.
Strobl, K., Kollmann, J., and Teixeira, L. H.: Integrated assessment of ecosystem recovery using a multifunctionality approach, Ecosphere, 10, e02930, https://doi.org/10.1002/ecs2.2930, 2019.
Trevathan-Tackett, S. M., Brodersen, K. E., and Macreadie, P. I.: Effects of elevated temperature on microbial breakdown of seagrass leaf and tea litter biomass, Biogeochemistry, 151, 171–185, https://doi.org/10.1007/s10533-020-00715-1, 2020.
Trevathan-Tackett, S. M., Kepfer-Rojas, S., Engelen, A. H., York, P. H., Ola, A., Li, J., Kelleway, J. J., Jinks, K. I., Jackson, E. L., Adame, M. F., Pendall, E., Lovelock, C. E., Connolly, R. M., Watson, A., Visby, I., Trethowan, A., Taylor, B., Roberts, T. N. B., Petch, J., and Macreadie, P. I.: Ecosystem type drives tea litter decomposition and associated prokaryotic microbiome communities in freshwater and coastal wetlands at a continental scale, Sci. Total Environ., 782, 146819, https://doi.org/10.1016/j.scitotenv.2021.146819, 2021.
Trevathan-Tackett, S. M., Kepfer-Rojas, S., Malerba, M., Macreadie, P. I., Djukic, I., Zhao, J., Young, E. B., York, P. H., Yeh, S.-C., and Xiong, Y.: Climate effects on belowground tea litter decomposition depend on ecosystem and organic matter types in global wetlands, Environ. Sci. Technol., 58, 21589–21603, https://doi.org/10.1021/acs.est.4c02116, 2024.
Turner, R. E.: Beneath the salt marsh canopy: loss of soil strength with increasing nutrient loads, Estuaries Coasts, 34, 1084–1093, https://doi.org/10.1007/s12237-010-9341-y, 2011.
Veenklaas, R. M., Koppenaal, E. C., Bakker, J. P., and Esselink, P.: Salinization during salt-marsh restoration after managed realignment, J. Coast. Conserv., 19, 405–415, https://doi.org/10.1007/s11852-015-0390-z, 2015.
Voorhees, K. J.: Analytical pyrolysis: techniques and applications, Elsevier, Amsterdam, ISBN 9781483192284, 2013.
Wampler, T. P.: Applied pyrolysis handbook, 2nd edn., CRC Press, Boca Raton, https://rexresearch1.com/CoalLibrary/AppliedPyrolysisHandbook.pdf (last access: 12 June 2026), 2006.
Ward, N. D., Morrison, E. S., Liu, Y., Rivas-Ubach, A., Osborne, T. Z., Ogram, A. V., and Bianchi, T. S.: Marine microbial community responses related to wetland carbon mobilization in the coastal zone, Limnol. Oceanogr. Lett., 4, 25–33, https://doi.org/10.1002/lol2.10101, 2019.
Wasson, K., Tanner, K. E., Woofolk, A., McCain, S., and Suraci, J. P.: Top-down and sideways: herbivory and cross-ecosystem connectivity shape restoration success at the salt marsh–upland ecotone, PLoS One, 16, e0247374, https://doi.org/10.1371/journal.pone.0247374, 2021.
Xiao, Y., Wang, J., Wang, B., Fan, B., and Zhou, G.: Soil microbial network complexity predicts soil multifunctionality better than soil microbial diversity during grassland–farmland–shrubland conversion on the Qinghai–Tibetan Plateau, Agr . Ecosyst. Environ., 379, 109356, https://doi.org/10.1016/j.agee.2024.109356, 2025.