
the Creative Commons Attribution 4.0 License.
the Creative Commons Attribution 4.0 License.
 | 21 Jul 2026
Vegetation patterns and competitive dynamics along elevation gradients: interactions between environmental factors and vegetation in the Central Himalayas
Prashant Paudel
Stefan Olin
Mark Tjoelker
Mikael Pontarp
Daniel Metcalfe
Elevation gradients are generally characterized by a steady reduction in temperature with altitude, potentially leading to zonation of vegetation structure. A south-north transect across the central Himalayas spans from a tropical to alpine climates, offering an opportunity to investigate the relative roles of abiotic stress and competitive interactions in shaping plant community assembly. We hypothesise that vegetation composition and productivity shift from competition-driven realised niches at lower elevations, to stress-driven physiological niches at higher elevations. To investigate how these niche transitions influence community assembly and ecosystem processes, we used a dynamic vegetation model with regional plant functional types (PFTs) parameterised with trait data, including allometric relationships. The model captured spatial patterns in vegetation structure and productivity along the gradient. PFTs' establishment and performance depended on their climatic niche and the local competitive interactions, with persistence shaped by specific functional traits and adaptive strategies. At low elevations, where competitive interactions dominate, tropical shade-intolerant raingreen and tropical shade-tolerant evergreen PFTs dominated above-ground biomass production and vegetation cover. In contrast, shorter stature, evergreen, and cold-tolerant PFTs were favoured at high elevations, reflecting reduced competition and increasing temperature limitation. PFT functional diversity declined with elevation, while compositional evenness increased, with evidence of a mid-elevation diversity peak after accounting for stochasticity. Despite higher functional diversity at low elevations, vegetation structure and function – reflected in leaf-area index (LAI), foliar projective cover (FPC) and above-ground biomass – were dominated by a few competitively superior PFTs. Overall, these results indicate that vegetation dynamics along the elevation gradient are governed by a trade-off between competitive ability and stress tolerance. This trade-off drives shifts in structure, composition and productivity along the gradient, reflecting a transition from realised to physiological niche dominance mediated by environmental conditions and trait responses.
- Article
(7450 KB) - Full-text XML
-
Supplement
(1702 KB) - BibTeX
- EndNote


Elevation gradients are characterized by rapid changes in climatic conditions, particularly a decline in temperature with altitude (Zhu et al., 2022). With rising elevation, temperature changes predictably in accordance with the “lapse rate”, creating differences in growth conditions, which may be further accentuated by small-scale variations in precipitation, topography, aspect, exposure, geology, soil properties, and biogeochemical processes governing nutrient availability. These environmental gradients act as filters (stress factors) (Asner et al., 2014; De Frenne et al., 2013; Zhu et al., 2022) that structure ecological processes and species interactions, resulting in emergent eco-evolutionary patterns such as niche differentiation, functional trait distribution, plant strategies, and competitive exclusion (Asner et al., 2014; Muñoz Mazón et al., 2020).
Temperature gradients are among the most influential environmental axes shaping vegetation patterns globally. The Himalayas provide a striking example of this, with distinct zonation observed from the tropical lowlands in the south to the alpine conditions in the north. The strong climatic contrast, i.e. cooler and wetter conditions at higher elevations, and hot, seasonally dry conditions at low elevations, influences vegetation fitness and community compositions, and distribution of functional traits (Måren et al., 2015). Vegetation at higher elevations often exhibits thicker leaves and frost tolerance adaptations such as reduced leaf area, increased epidermal thickness, and increased antifreeze proteins (Satyakam et al., 2022). In contrast, lower elevation species have larger leaves with higher specific leaf area (SLA), larger and wider branching patterns, and fast growth rates to take advantage of abundant resources and warm temperatures (Shah et al., 2019; Sigdel et al., 2022). In addition, biotic interactions, particularly competition for light, space, and soil resources also drives vegetation function, diversity (species richness and evenness), and species composition along the elevation gradient (Maharjan et al., 2021; Thakur and Chawla, 2019). However, the relative strength of biotic interactions and abiotic constraints varies along environmental gradients and remains difficult to quantify in complex mountain systems.
Research on community assembly and vegetation zonation in the Himalayas has largely been descriptive, based on empirical field observations (Acharya et al., 2011; Dhakal, 2018; Shah et al., 2019; Sigdel et al., 2022; Thakur and Chawla, 2019; Thorne et al., 2022) and descriptive interpretation of elevational patterns (Ayer et al., 2025; Drollinger et al., 2017; Dyola et al., 2022; Liang et al., 2020; Maharjan et al., 2021; Maletha et al., 2022; Sigdel et al., 2020). Studies have focused on species distribution, occurrence, morphological trait distributions and their relationships with environment. However, a synthetic framework that explains community assembly and ecosystem dynamics across the Himalayan bioclimatic range, considering both abiotic and biotic influences on species distribution patterns, remains lacking, limiting our understanding of how competition and abiotic stress interact along the elevation gradient, particularly in driving the transition from realised to physiological niches and how species traits mediate these shifts.
The complex interaction between growth conditions and vegetation functional traits, and their role in structural dynamics and competitive interactions along this gradient, can be effectively captured by incorporating characteristic plant traits into dynamic vegetation models (DVMs) (De Paula et al., 2021; Sitch et al., 2003; Smith et al., 2014). By encoding the traits and response mechanisms of vegetation for different plant functional types (PFTs), we can disentangle the interaction between environmental conditions and vegetation community dynamics. DVMs represent vegetation as groups of functionally similar species (PFTs), defined by shared morphological, and ecophysiological straits, life history strategies and climatic niches (bioclimatic limits for establishment or survival). The trait-based parameterisation enables representation of functional trade-offs in the carbon allocation and ecological strategies (Díaz et al., 2016; Pierce et al., 2013), providing a mechanistic link between plant-level adaptations and regional vegetation patterns.
We employed an individual-based dynamic vegetation model, LPJ-GUESS (Smith et al., 2001, 2014), to simulate structural, compositional, and functional variability along a south-north transect of the central Himalayas spanning from a tropical to alpine conditions. Using empirical data on vegetation traits and life history strategies of regional PFTs, we evaluated how abiotic stress and competitive interactions jointly shape plant community assembly, vegetation structure, and productivity. Here, we teste the hypothesis that community assembly shifts from a competition-driven regime at lower elevations (realised niche dominance) to a stress-driven regime at higher elevations (physiological niche dominance). By comparing simulated outcomes with field observations, we assess how well these niche transitions explain spatial patterns in vegetation structure, composition and productivity across one of the world's most complex mountain ecosystems. We further evaluate species richness and evenness as emergent properties of functional composition, providing insight into how changing growth conditions influence biodiversity patterns along the Himalayan elevation gradient.
2.1 Study site
The study focuses on a species-rich elevation gradient of the central Himalayas (Fig. 1). Along the gradient, temperature decreases by approximately 6.5 °C per vertical kilometer, reflecting the standard lapse rate, where the average annual temperature in the tropical zone is 28 and around 10 °C in the alpine region (MoFSC, 2016; Poudel et al., 2020). Nearly 80 % of the total annual rainfall occurs during the monsoon (June to September) (Maharjan et al., 2021), where average annual rainfall ranges from 165 mm (northern end of the gradient, i.e., Trans-Himalayan region) to 5244 mm (1550–2000 m altitude) in the lower and middle part of the gradient (Luitel et al., 2020; Poudel et al., 2020). Generally, precipitation reaches a maximum at mid-elevations (approximately 1000–2000 m) and declines rapidly at higher elevation (Luitel et al., 2020; Maharjan et al., 2021; Poudel et al., 2020). Vegetation follows the temperature patterns ranging from tropical (24 °C) to temperate forests and to colder sub-alpine vegetation (6.9 °C) (Shrestha et al., 2015), where growth condition varies significantly due to variations in temperature and precipitation patterns. Within a horizontal span of 100 km along the gradient, 160 different tree species were recorded in a plot-level survey conducted in forest areas, where vegetation composition and dominance changes with elevation (DFRS, 2015; Pokhrel and Sherpa, 2020).
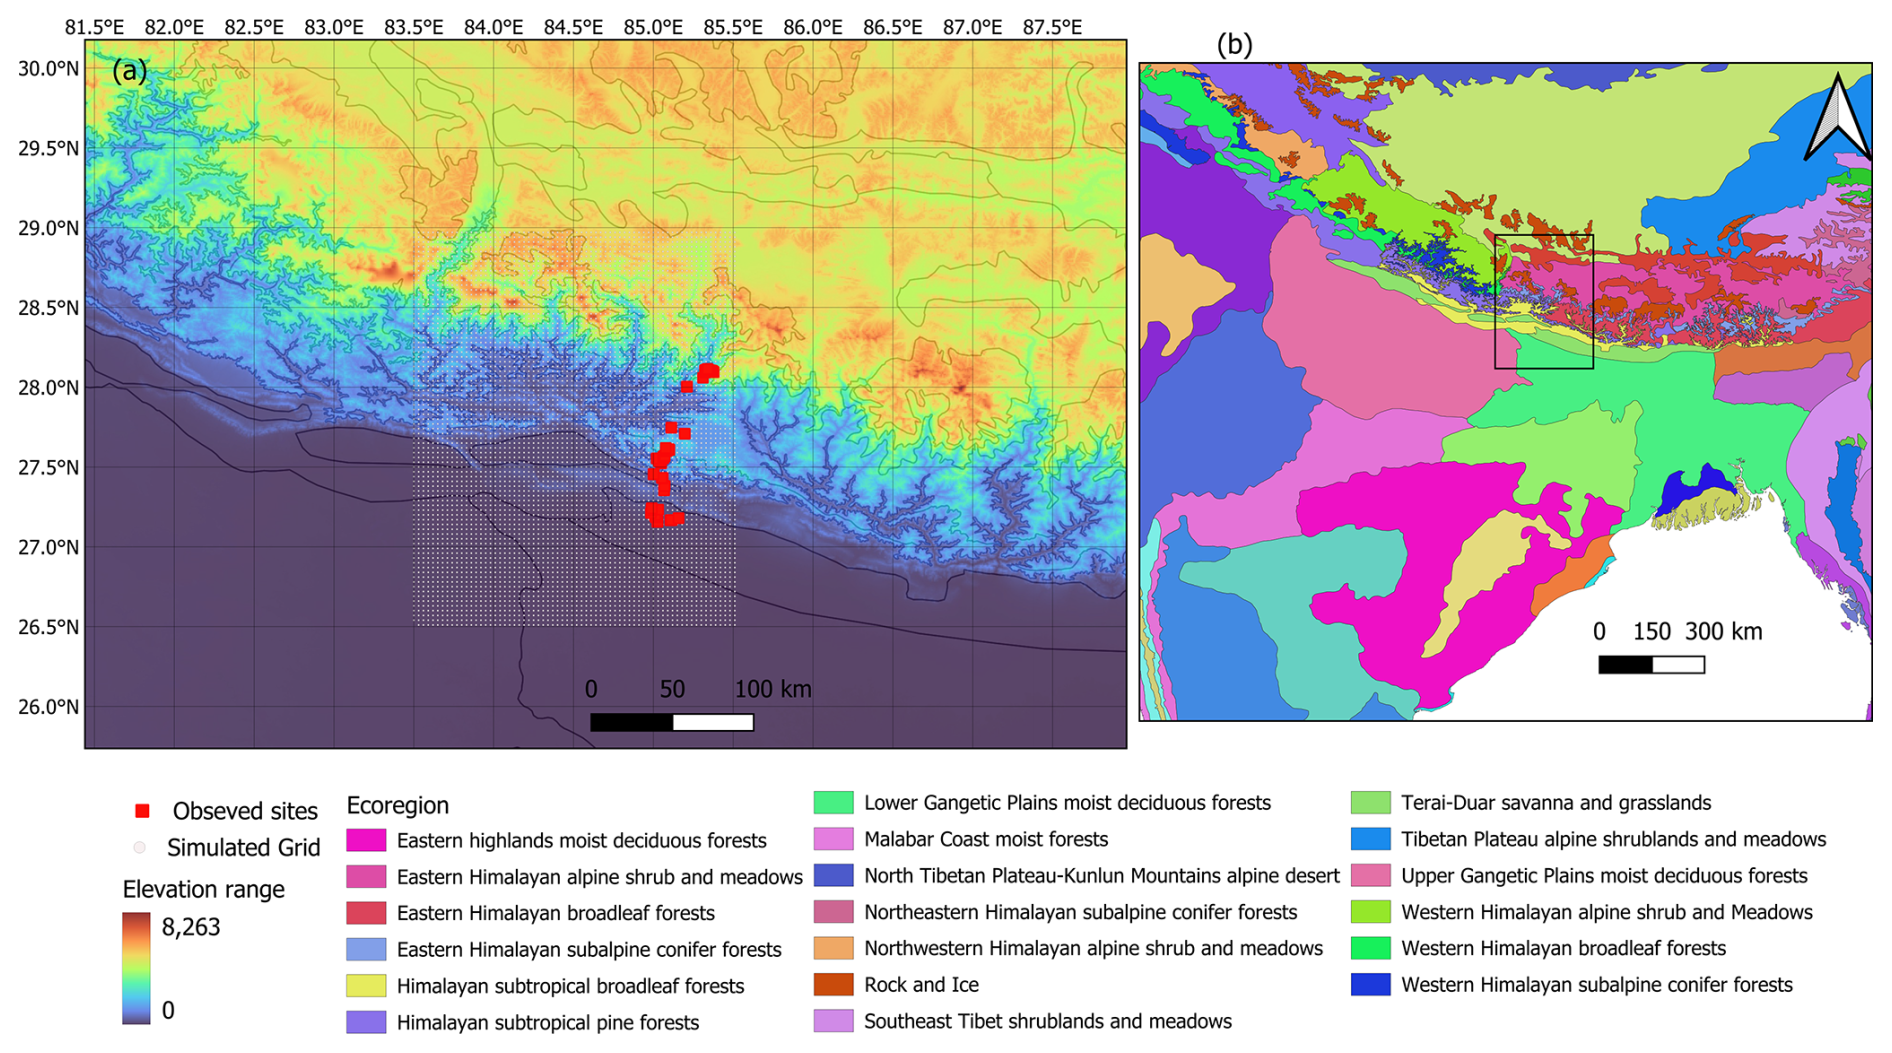
Figure 1Map of the study area with ecoregion (data source: Olson et al., 2001), elevation range (data source: Earth Resources Observation and Science (EROS) Center, 2017), trait data observed sites (Maharjan et al., 2021), and simulated grids along the elevation gradient of the central Himalayas [Supplement Fig. S1 shows the spatial distribution of forest types along the gradient].
2.2 Vegetation model description and customization
The Lund-Potsdam-Jena General Ecosystem Simulator (LPJ-GUESS) is a process-based dynamic vegetation model used to simulate ecosystem responses to environmental changes at regional or global level based on local, neighbourhood-scale interactions among simulated plants (Smith et al., 2001, 2014). It represents generalized ecophysiological processes such as photosynthesis, autotrophic (plant) and heterotrophic (soil) respiration, carbon, water, and nitrogen cycling. The model adopts gap dynamics theory (Bugmann et al., 1996; Scherstjanoi et al., 2014) to simulate tree population dynamics through plant establishment, growth, and mortality (De Paula et al., 2021; Sitch et al., 2003; Smith et al., 2001). The model is applied across a continuous geographic grid. Vegetation in each grid cell is represented as a mixture of PFTs whose distribution is governed by bioclimatic envelopes for establishment and survival. Within its bioclimatic envelope, PFT abundance is further influenced by the interactions between co-occurring individuals that affect carbon assimilation and allocation, reproduction, and survival within local patches, nominally 0.1 ha in size. The overall vegetation of a grid cell is aggregated across multiple patches (here 15), representing random samples of the wider landscape within each grid cell. PFT-specific parameters and growth strategies determine performance under different climates, CO2 concentrations, and stages of vegetation development.
The model accounts for structural responses to competitive and environmental conditions through adaptive allometric relations (DBH-Height, DBH-Crown Area, DBH-Crown Volume) and a dynamic bole height scheme for each cohort. This allows allometric scaling and carbon allocation to respond dynamically to canopy crowding conditions defined by the availability of photosynthetically active radiation (Paudel et al., 2026). The model simulates leaf area index (LAI) from leaf carbon pool using PFT-specific SLA (prescribed as a PFT parameter), emerging from carbon allocation, phenology and turnover processes.
To represent the diversity of vegetation composition along the Himalayan elevation gradient, we modified the following features to customize the model for application to our study area.
The default model has 12 PFTs, defined to represent the dominant biomes of the world. For this study, we defined a new set of regional tree PFTs tailored to local conditions using a multivariate hybrid (hierarchical) clustering approach (see Sect. 3.3 and Supplement for the details of the clustering approach and derived PFTs). These PFTs represented major vegetation strategies for coping with competition (biotic stress) and harsh climatic conditions (abiotic stress) across the gradient. Tree PFT parameters and their derivation are further discussed in Sect. 3.3 below. Both C3 and C4 grass PFTs with default parameter values (defined for the global level) were retained (Peng et al., 2024), representing distinct photosynthetic pathways and associated physiological differences that influence their relative abundance along the elevation gradient.
Bioclimatic limits (mean minimum and maximum temperature for the 20 years coldest month for establishment and survival; mean minimum warmest month temperature for establishment) control each PFT's establishment and survival in a given grid cell. The model defines these limits for global biomes ranging from tropical to boreal ecosystems. For this study, four climatic limits are defined: tropical, subtropical, temperate, and alpine. Climatic ranges were adopted from Jackson (1994) and modified based on the ranges recorded by Maharjan et al. (2021).
2.3 Data Sources for model input and parameterisation
The CRU-JRA (v2.4.5d) global gridded climate dataset was downscaled to a 3 km spatial resolution using bicubic interpolation (Latombe et al., 2018) and used as climate-forcing data for our model simulations. This method increases spatial resolution but does not explicitly account for topographic effects such as lapse-rate-driven elevation and associated terrain condition. The CRU-JRA is a gridded daily dataset with 0.5° × 0.5° spatial resolution from 2001 to 2022 (Araghi and Martinez, 2024). We used monthly mean air temperature, precipitation, wind speed, incoming solar radiation, specific humidity, number of wet days, and minimum and maximum temperature as inputs. Wet days are defined as days with non-zero precipitation (>0 mm) and monthly counts are obtained using daily precipitation data for model simulation. All variables except for precipitation were interpolated to daily values; for precipitation, the monthly sum was divided equally across the number of wet days per month. Soil properties and the atmospheric nitrogen deposition rates (Lamarque et al., 2013) were configured using 0.5° × 0.5° spatial resolution. Annual atmospheric CO2 concentration data from NOAA (1901–2022) are used as input data (Friedlingstein et al., 2023). Elevation values of each simulated grid were extracted from the GTOPO30 dataset provided by the U.S. Geological Survey (Earth Resources Observation and Science (EROS) Center, 2017) with a horizontal resolution of 30 arcsec (approx. 1 km).
Trait values of the 31 most abundant tree species - based on the frequency of observation and total carbon contribution identified by Maharjan et al. (2021) were compiled from Maharjan et al. (2021), Jackson (1994), and Thakur and Phulara (2014). Tree allometry data (DBH, total tree height, crown radius, crown height) were compiled from the Tallo database (a global tree allometry and crown architecture database) (Jucker et al., 2022) and BAAD (a biomass and allometry database for woody plants) (Falster et al., 2015). Elevation data across the simulated grid were extracted from Earth Resources Observation and Science (EROS) Center (2000) and were used for plotting simulated outputs (Supplement Fig. S2 shows the patterns of environmental variables along the gradient).
A divisive hierarchical clustering approach was used to group tree species into distinct PFTs based on similarities in traits and life-history strategies. Both phenological and morphological characteristics traits were considered. Species were first stratified into four temperature-defined groups (tropical, subtropical, temperate, and alpine) based on their dominant climatic distribution (Jackson, 1994; Thakur and Phulara, 2014), ensuring that broad-scale bioclimatic filtering were accounted for prior to clustering. Within each temperature stratum, hierarchical clustering using Ward's method (Murtagh and Legendre, 2014) was applied to standardized trait data, including specific leaf area (SLA), wood density, leaf phenology, and leaf longevity, to group species into functionally similar clusters. The clustering further incorporated ecological strategy variables, including life-history strategy (fast vs. slow growing; early vs. late successional), shade tolerance (tolerant, intermediate, intolerant), and drought resistance (tolerant vs. sensitive), alongside structural traits such as maximum tree height. Species were progressively grouped based on multivariate similarity in these traits, resulting in 13 distinct functional clusters, including three PFTs within the conifer group (see Supplement for further details of the clustering approach and derived PFTs). The resultant PFTs are designed to represent the functional diversity required to simulate structure, composition, and productivity along the elevation gradient.
The following parameters were updated for each tree PFT: leaf phenology, drought tolerance, wood density, SLA, shade tolerance, leaf longevity, and leaf turnover rate (Table 1). The values of these parameters, compiled from the sources mentioned above, were averaged across species included in the PFTs emerging from the clustering procedure described above. In the model, shade tolerance is linked to life history strategies, which influence growth, reproduction, and survival of PFTs across different light environments. Here, parameters and their values (Supplement Table S2), as defined by Hickler et al. (2004), were adapted in model simulation to represent these dynamics. Similarly, quantile regression was used to estimate allometric scaling parameters (DBH relative to height, DBH relative to crown area, and DBH relative to crown volume) under three different stand crowding conditions (5 %, 50 % and 95 %), allowing us to evaluate structural response to competition and their influence on ecosystem dynamics.
Table 1Tree PFTs and parameter values used for simulation, including bioclimatic limits, Shade tolerance parameters and their values, and allometric relations (see Supplement Tables S1 and S2 for details).
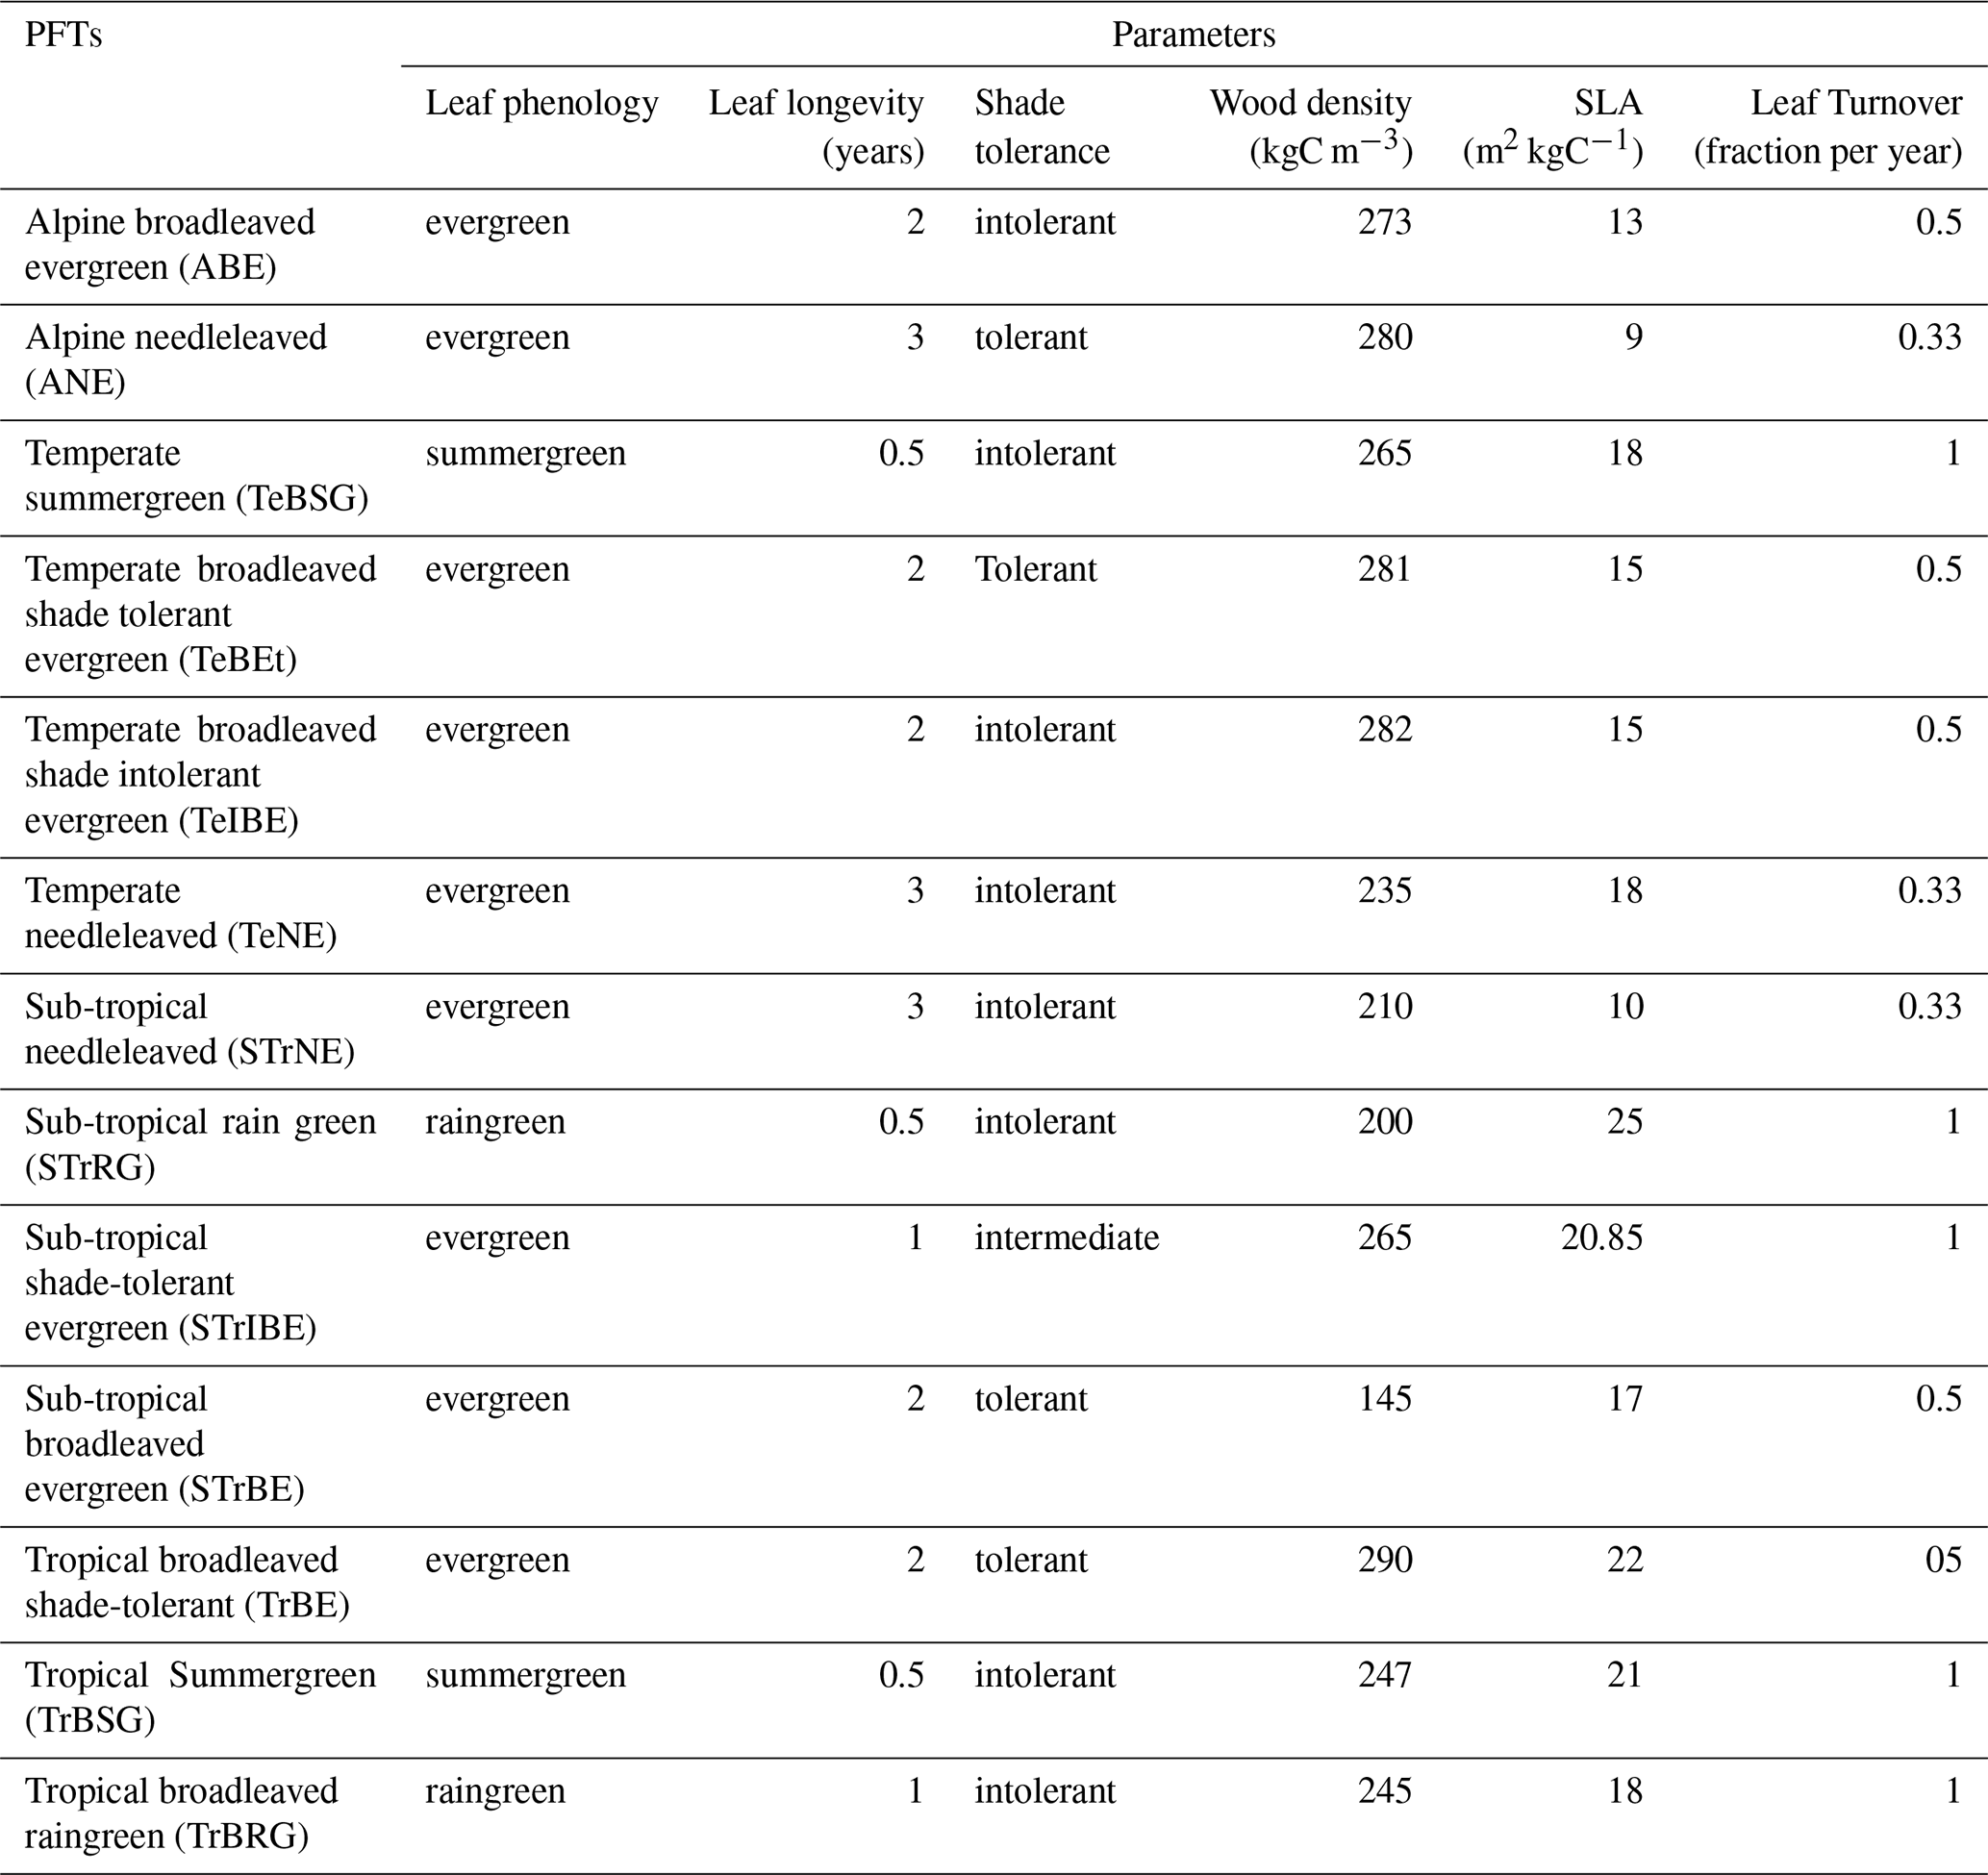
Data source: Jackson (1994); Maharjan et al. (2021); Thakur and Phulara (2014).
2.4 Simulation protocol and model validation
Using the aforementioned forcing data and PFTs parameterized with traits, the model was run with 15 patches in each grid cell of 1000 m2, simulating the period from 1901 to 2022. A spin-up of 500 years, recycling the first 30 years of the observed climate data set, was performed to achieve an initial steady state for vegetation structure. We ran LPJ-GUESS in cohort mode (Smith et al., 2001, 2014), using the BLAZE fire model to account for the impacts of weather-related fire disturbances on vegetation structure (Rabin et al., 2017) and applied a generic return interval of 100 years for patch-destroying disturbances, following Pugh et al. (2019).
We implemented a neighbour removal experiment in the model to assess the effects of competitive neighbour individuals and PFTs on the performance of the selected PFTs (Monteux et al., 2024). Individuals of all other woody PFTs except the PFT of interest were removed from the simulation after model year 1950. C3 grass or C4 grass forming the understory of the woody stand was retained. However, to allow the ecosystem to re-equilibrate and account for the effects caused by removing neighbours, we allowed target PFTs to grow for another 50 years (i.e., model year 2000) until the ecosystem recovered and productivity stabilized according to the prevailing environmental conditions.
Gross primary productivity (GPP) data from Bi and Zhou (2022) (0.05° × 0.05° spatial resolution), produced using the leaf light use efficiency model from 2010 to 2020, were compared with simulated GPP from 2010 to 2020 along the elevation gradient, focusing on the evaluation of variation in GPP across elevations despite differences in spatial resolution. Plot level above-ground biomass data by Khanal and Boer (2023), estimated from forested area in the national forest inventory, was compared with simulated patch-level above-ground biomass from the model to validate the broader patterns in above-ground biomass distribution across the ecosystem regardless of land use conditions. Similarly, the bole height (height up to the first branch) measured and elevation range recorded by Maharjan et al. (2021) along the studied gradient were compared with simulated values to evaluate the model's ability to capture structural and compositional variability along the elevation gradient. Although these observed values predominantly represent dominant species along the gradient, they were treated as independent observational datasets for evaluating model performance in representing structural variability. Additionally, to further validate the structural component, MODIS derived LAI of 1 km resolution from 2000 to 2022 (Myneni et al., 2015) was compared with simulated monthly LAI, with model evaluation focusing on elevation-dependent patterns given differences in spatial resolution between the observational and simulated datasets.
2.5 Competition index and rank abundance curve (RAC) of FPC for evenness
An index of competition was calculated for each PFT to quantify the effects of neighbour removal on the performance of the target PFT. The target PFT's performance was evaluated using simulated carbon mass production from 2000 to 2020 with and without competition. The competition index (CI) was calculated using the index matrices approach of Avolio et al. (2019) and Brooker and Kikvidze (2008) with modifications, rather than using empirically derived coefficients from species-removal experiments. We modified the equation by Avolio et al. (2019) and Brooker and Kikvidze (2008) to more intuitively represent each PFT's optimum competitive capacity relative to potentially co-occurring woody PFTs. This approach allows the CI to represent the relative competitive capacity of each PFT under different competition conditions. A CI value of 1 indicates no effect from competitors, while a value close to 0 indicates a significant impact from the competitor's presence.
where CI is the competition index in year i, Cmass−N and Cmass+N are the carbon masses of the target PFTs in the presence (+N) and absence (−N) of a competitor in year i.
The rank abundance curve (RAC) of relative foliar projective cover (FPC) of each tree PFT present in a grid cell was used to quantify PFTs evenness, defined as similarity in local abundances among PFTs along the elevation gradient. PFT level evenness and richness calculated using FPC were used as indicators of dominant functional strategies and competitive hierarchy shaping ecosystem structure and carbon dynamics across the elevation gradient. Following Avolio et al. (2019), Smith and Wilson (1996) and Whittaker (1965), the natural logarithm of relative FPC was plotted against the inverse of PFT rank, and a regression between rank and log FPC was used to calculate the slope of the curve in each grid point using simulated FPC from 2000 to 2022. The slope of the RAC was used as a robust (independent of species richness) measure of evenness by Smith and Wilson (1996). A steeper slope would indicate greater dominance by one or a few PFTs relative to other co-occurring PFTs, while a flatter slope indicates greater evenness. Evenness was plotted against elevation to examine the patterns of change in evenness in relation to changes in growth conditions. Similarly, the number of PFTs in each latitude band was used as an indicator of functional richness, representing the diversity of ecological strategies. We hypothesise that evenness increases with elevation due to reduced competition, and the abundance of PFTs decreases under environmental stress at higher elevations.
3.1 Spatial variability in productivity and structure along the gradient
Simulated annual GPP showed strong agreement with GPP estimated by Bi and Zhou (2022) using the leaf light use efficiency model, both datasets displaying a gradual increase in productivity up to approximately 2500 m. At the northern end of the gradient, annual GPP decreased sharply as temperature declined, with some grids having very low productivity (GPP value close to zero) (Fig. 2). Monthly GPP shows a progressive shortening of the productive season and a decrease in monthly productivity with increasing elevation (Supplement Figs. S3 and S4 for monthly GPP), characterized by fewer months of productivity at higher elevations.
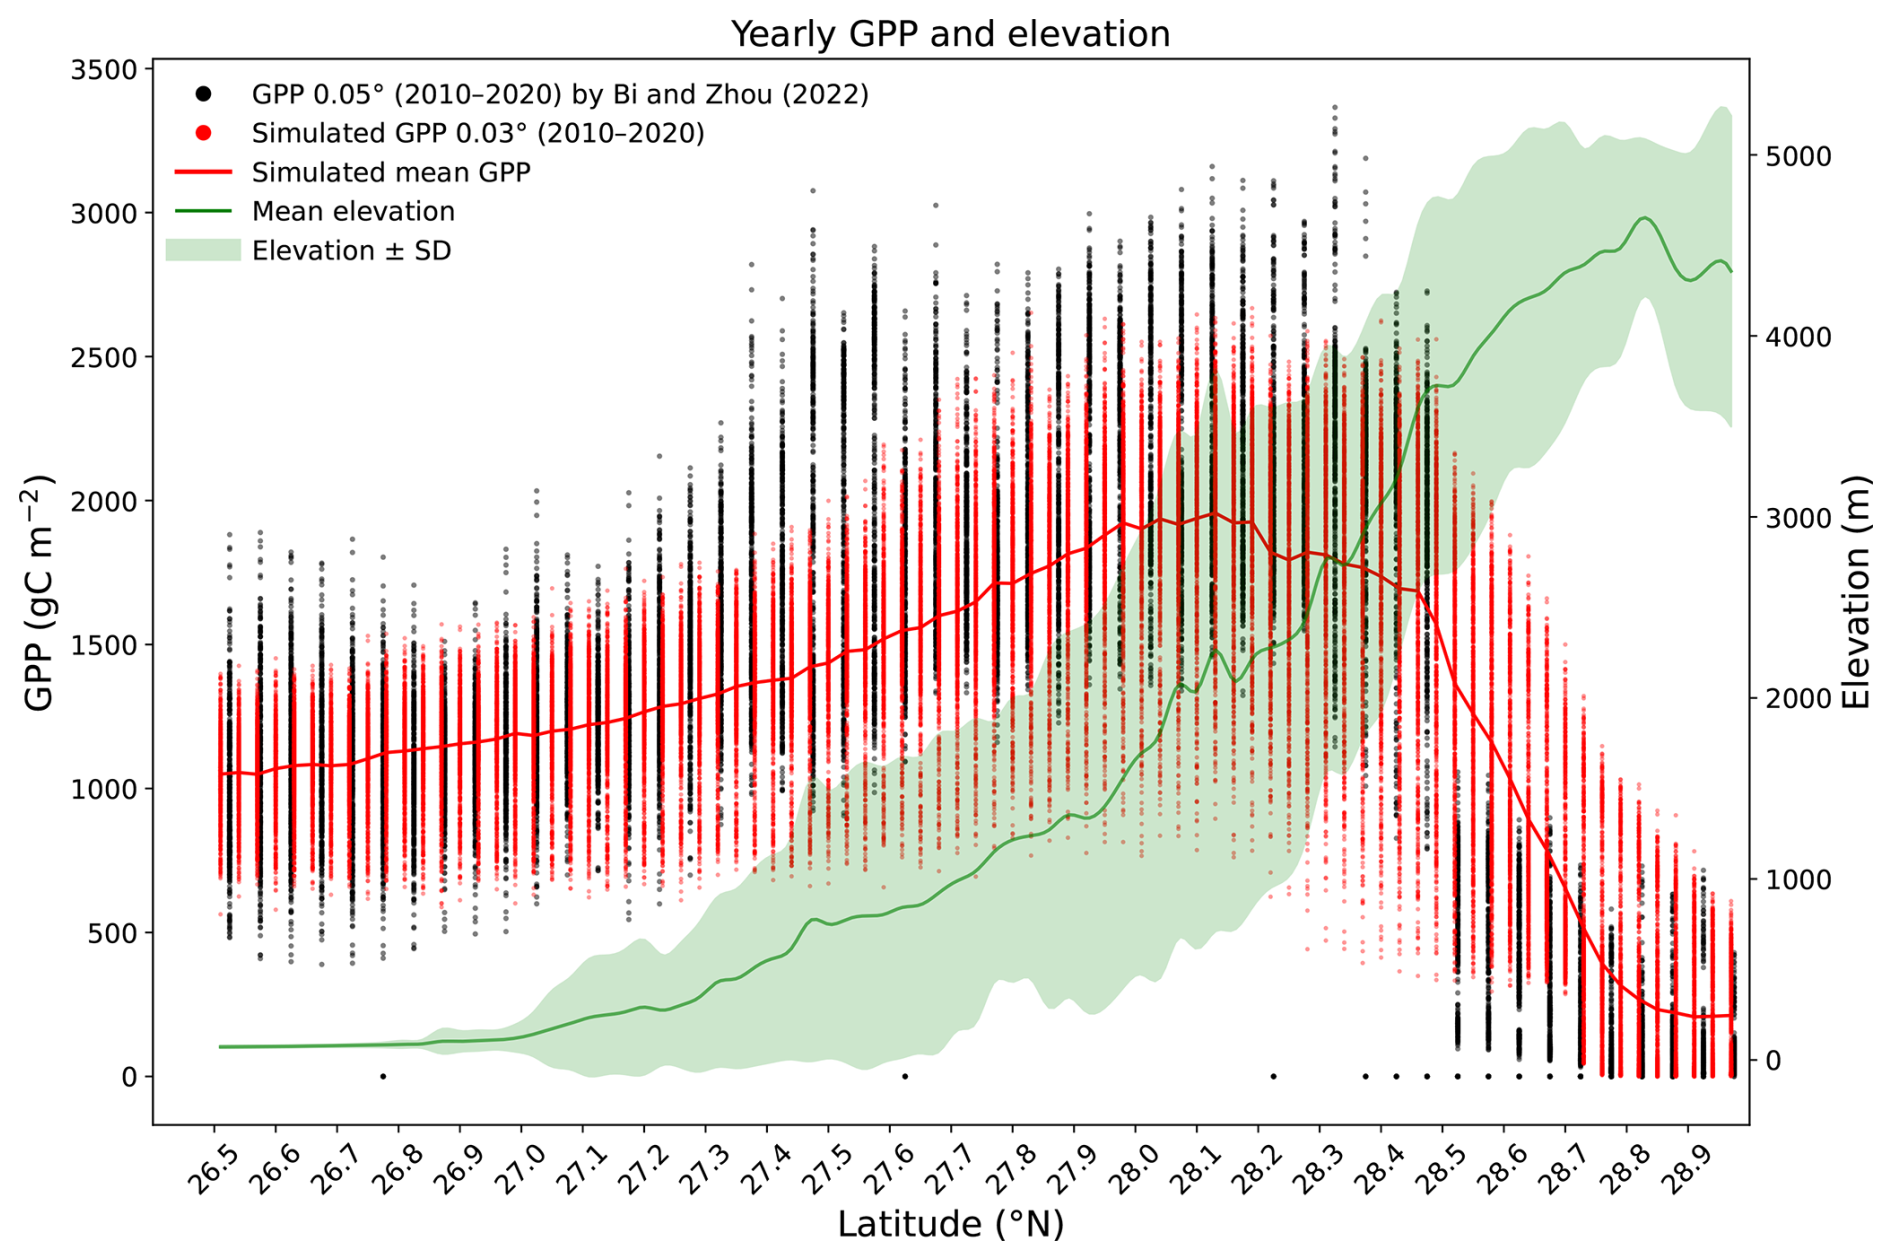
Figure 2Simulated annual GPP (0.03° × 0.03°, red point) and annual GPP from the Bi and Zhou (2022) (0.05° × 0.05°, black point) from 2010 to 2020 across grids along the elevation gradient of the Himalayas along with mean elevation (green line) and elevation range (greed shaded area) for each latitude.
Simulated above-ground biomass at the patch level closely matched observed plot-level above-ground biomass measured at forest areas of the gradient (Fig. 3). In the northern regions of the gradient, where Rhododendron PFTs dominate, the model underestimated the observed biomass (Fig. 3), whereas in the mid-latitude range (27.4–28.0° N), it slightly overestimated above-ground biomass, coinciding with areas of higher PFT abundance. Above-ground biomass showed a peak at mid-elevations followed by a decline toward higher elevations. Notably, the patch-level above-ground biomass did not show any clear patterns with the simulated age of the patch. In some simulated grids, young patches exhibited higher above-ground biomass productivity compared to older ones, suggesting that trait-based responses and environmental conditions have a stronger influence on productivity than patch age.
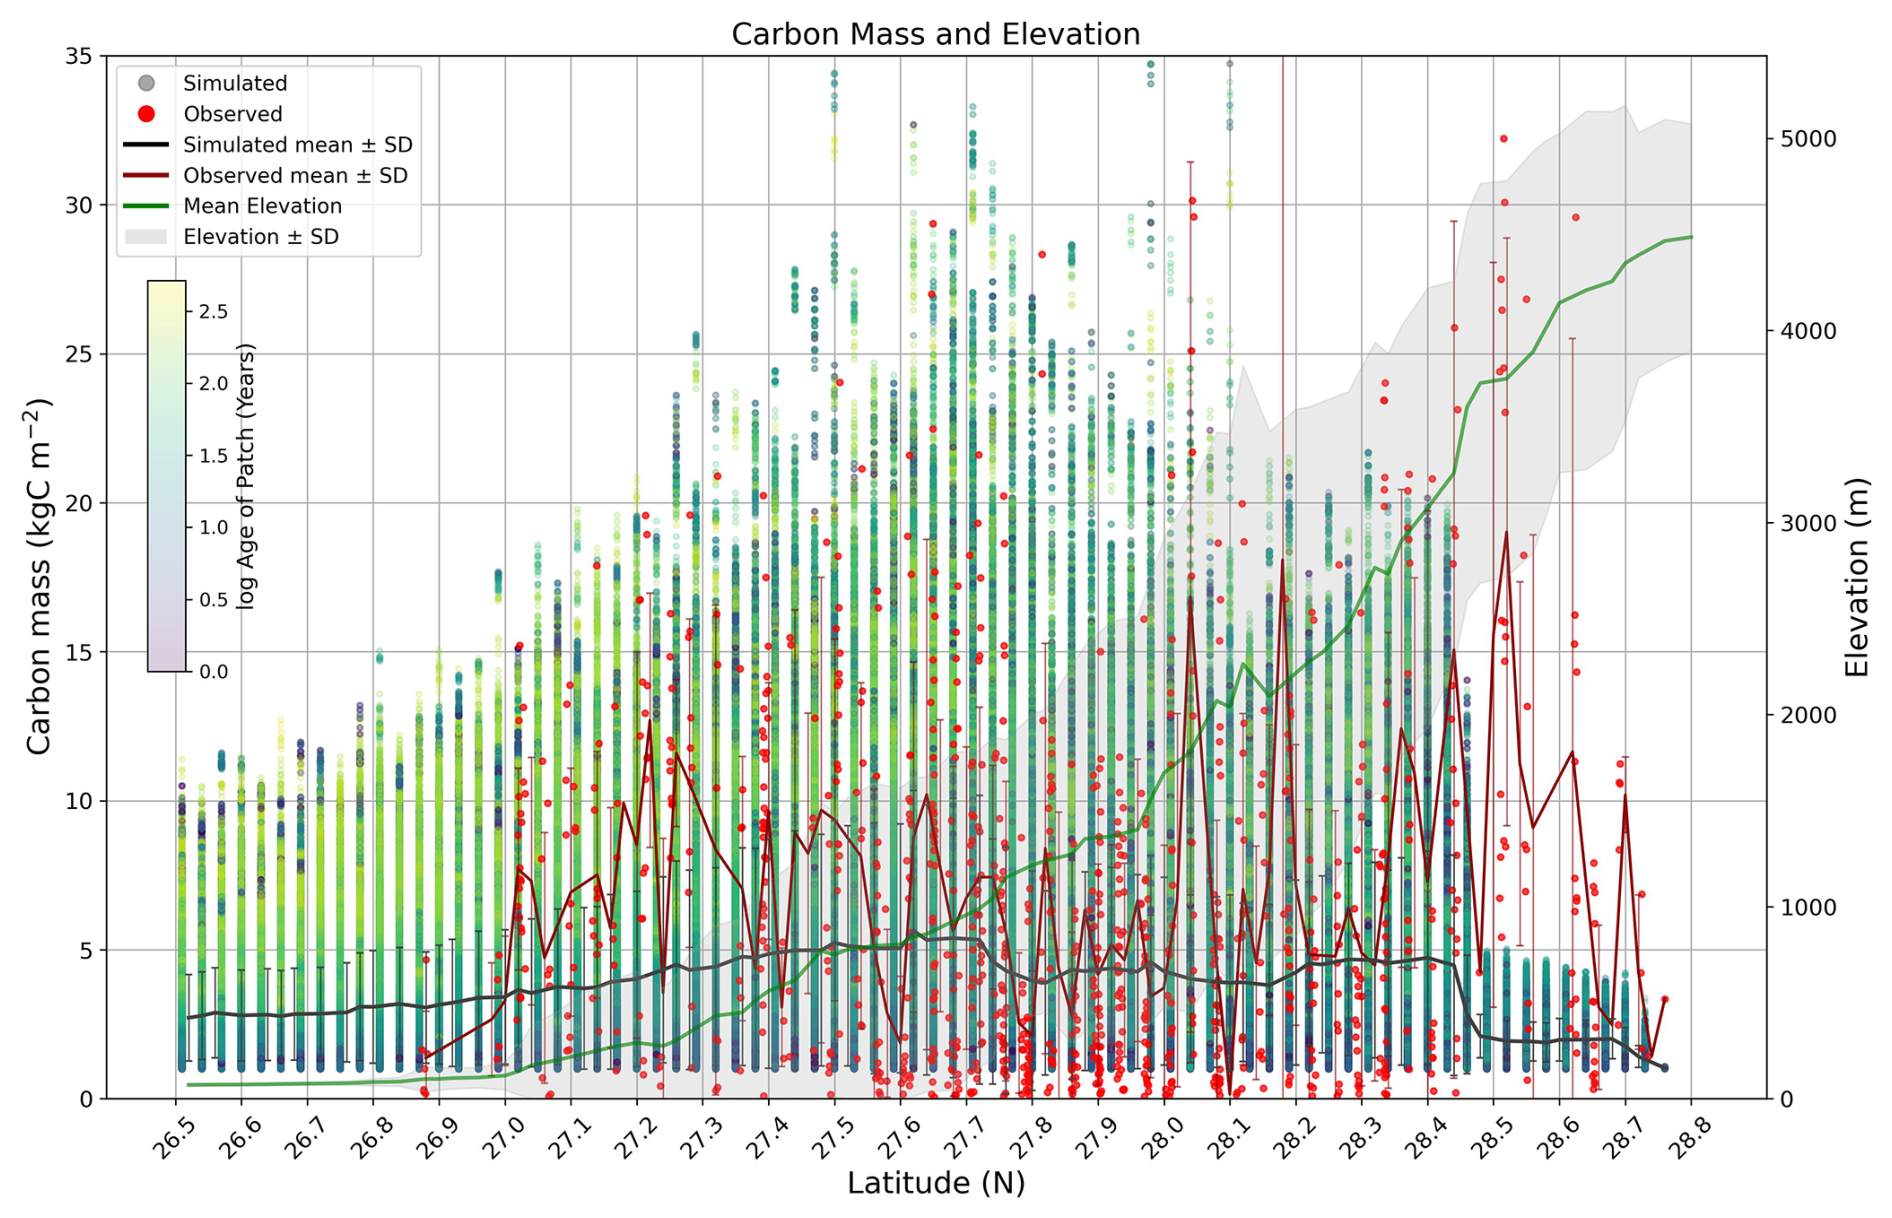
Figure 3Simulated above-ground biomass per patch (2010–2015) for tree PFTs with the age of the patch (in years) and observed above-ground biomass per plot in forest areas along the elevation gradient of the Himalayas.
Similar to productivity and biomass, vegetation structural attributes also varied along the elevation gradient. Simulated and MODIS LAI show similar patterns with substantial overlap between the two datasets (Fig. 4 – top panel). MODIS LAI shows greater variability in monthly LAI values compared to simulated LAI. Simulated LAI of tree PFTs increased from approximately 5 m2 m−2 at lower elevations to about 8 m2 m−2 at mid-elevations, followed by a gradual decline toward higher elevations (Fig. 4 – bottom panel). Elevated LAI values at higher elevations were maintained primarily by evergreen PFTs, whose LAI remained relatively constant throughout the year and by C3 grasses. Six PFTs contributed the most to LAI, each with varying zones (elevational range) of dominance. In the southern part of the gradient, two PFTs – tropical broadleaved raingreen and tropical broadleaved evergreen – exhibit higher PFT-specific LAI. Sub-tropical needle-leaved PFTs form maximum LAI in mid-elevation (∼ 3.2 m2 m−2), followed by alpine evergreen broadleaved (∼ 4 m2 m−2) in higher elevation. C4 and C3 grasses contribute significantly to LAI along the gradient, with C3 grasses being dominant in cold regions, with an LAI of 3.2 m2 m−2 (Fig. 4 – bottom panel).
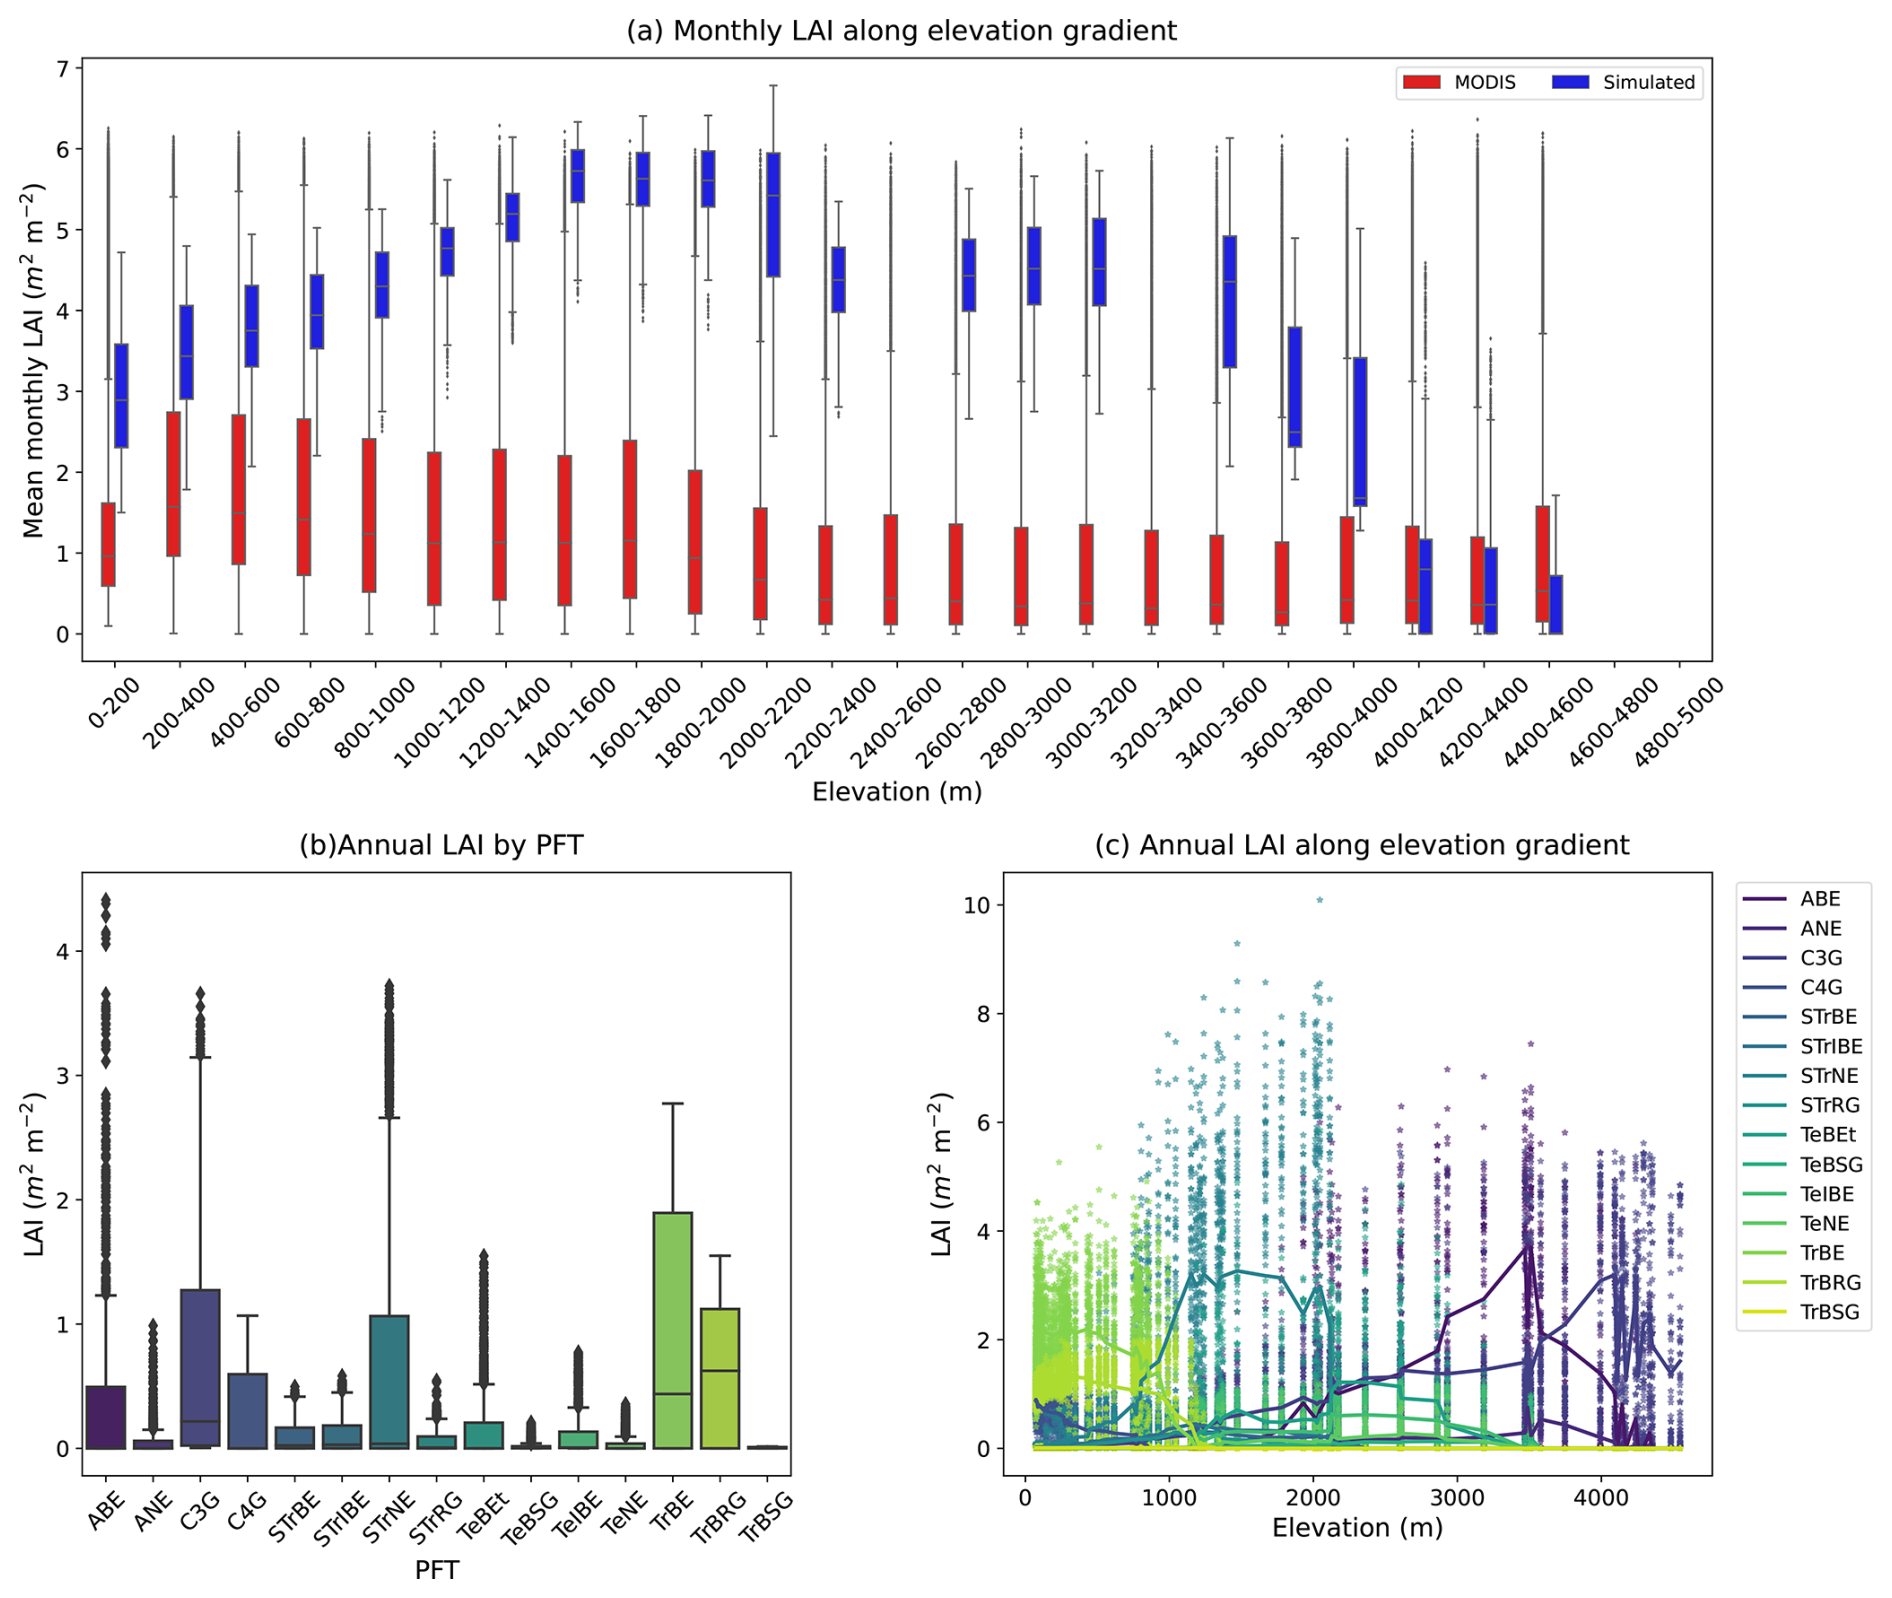
Figure 4LAI across the elevational gradient. Top panel (a): comparison of monthly simulated LAI (3 km resolution) and MODIS LAI (1 km resolution) plotted against elevation, with points representing mean monthly LAI values at individual grid. Bottom panel: (b) boxplot of simulated annual LAI by PFTs and (c) line plot of total annual LAI (line represents mean LAI for each PFT and dots representing LAI at simulated grids across latitude) across the elevation gradient by PFTs.
Comparison of simulated (2010–2015) and measured bole heights from Maharjan et al. (2021) shows that both follow the same patterns, although the model exhibits more pronounced variability across most PFTs (Fig. 5). It indicates that bole height varies with PFTs, with tropical broad-leaved raingreen (TrBRG) having a large bole height, followed by temperate shade-intolerant evergreen (TeIBE) (Fig. 5). Mean bole height remained similar up to the temperate zone (approximately up to 3500 m) and declined sharply at higher elevation, particularly in the upslope alpine zone, where bole heights remain consistently smaller (Fig. 5).
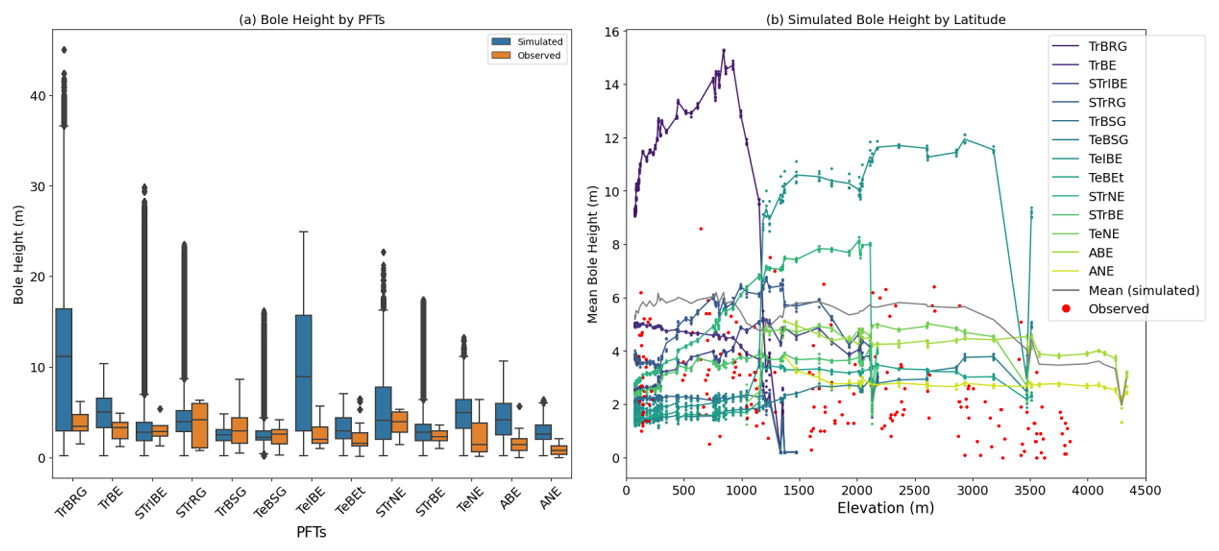
Figure 5(a) Boxplot of simulated and observed bole height from Maharjan et. al. (2021) (median with ranges and outliers) and (b) bole height for PFTs (dot denoting the bole height of each cohort of PFTs simulated in the grid), (grey line) and observed bole height (red dots) across PFTs along the elevation gradient.
3.2 PFT performance and competition index along the elevation gradient
Total ecosystem level carbon mass production varies along the gradient and depends on the abundance of PFTs' (Fig. 6; Supplement Fig. S5). Total carbon mass production is highest in mid-lower elevations (around 1000 m), where multiple PFTs contributed to ecosystem productivity including broadleaved evergreen, deciduous trees, and conifers (Supplement Fig. S5 for total carbon mass production along the elevation). At lower elevations, tropical broadleaved raingreen PFTs had the maximum contribution in carbon mass production, whereas temperate shade-intolerant evergreen PFTs had the maximum carbon mass production in temperate regions. In colder regions at higher elevations, alpine broadleaved evergreen PFTs (dominated by Rhododendron species) contribute most to total carbon mass production (Fig. 6).
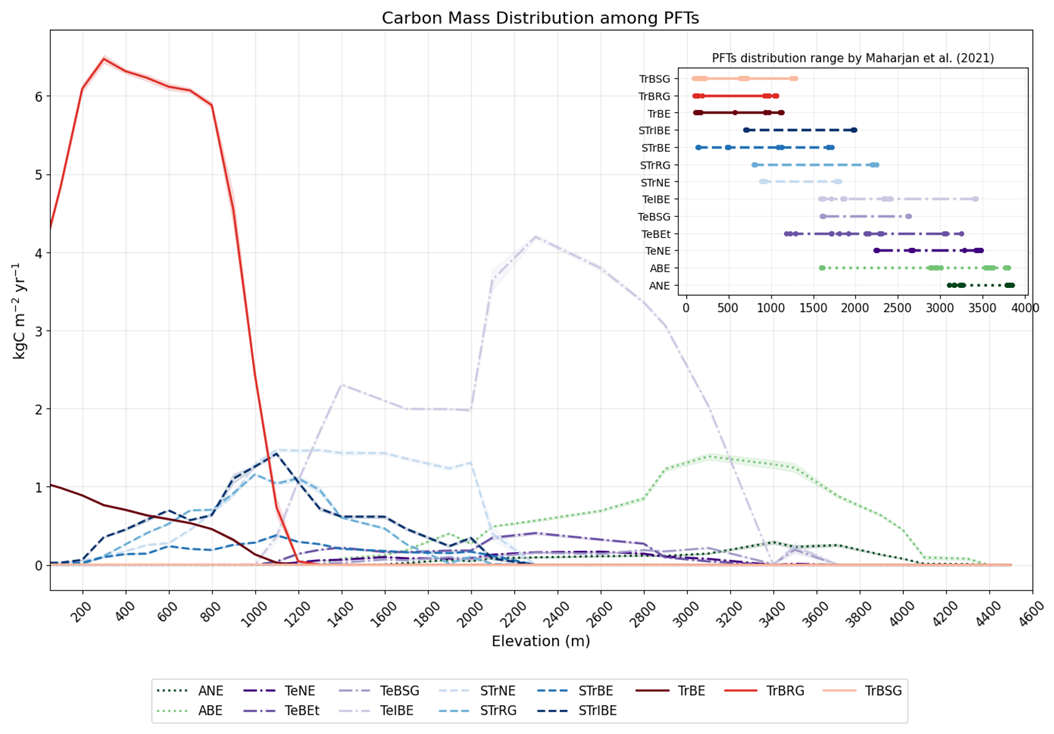
Figure 6Carbon mass production by PFT along the elevation gradient (the inset figure shows the PFTs' distribution ranges recorded by Maharjan et al. (2021) in the gradient).
The mean CI plotted against elevation shows that removing competitors has different levels of impact on carbon mass production among PFTs (Fig. 7). PFT responses to the absence of competition differ within and outside their dominant climatic ranges. Within their dominant growth regions, TrBRG and ABE were least impacted by the presence of neighbours, with CI values over 0.9 (Fig. 7). At the lower elevation range, the presence of temperate PFTs was more random, and their performance was not enhanced by neighbour removal. For example, the CI values of TeIBE, TeBSG, and TeBEt were higher (∼ 0.9), suggesting similar performance with and without competitors (Fig. 7). In general, subtropical PFTs benefited from competitor removal in the model (Fig. 7). There were no clear patterns and associations of PFTs' CI with average annual temperature, as PFTs' performance depends on climatic niche and the presence of neighbours (Fig. 7).
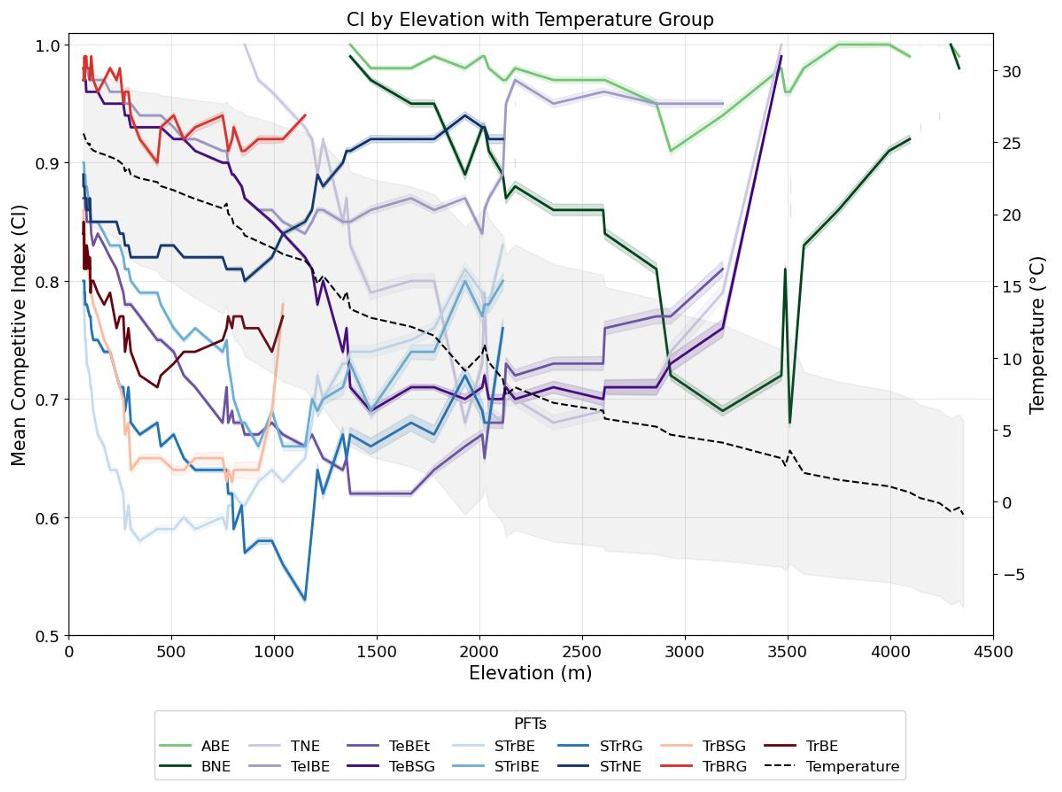
Figure 7Mean competitive index of PFTs and mean annual temperature (green line) with standard deviation of temperature in the last 30 years (green shaded area) along the elevation gradient.
3.3 Community composition and evenness along the elevation gradient
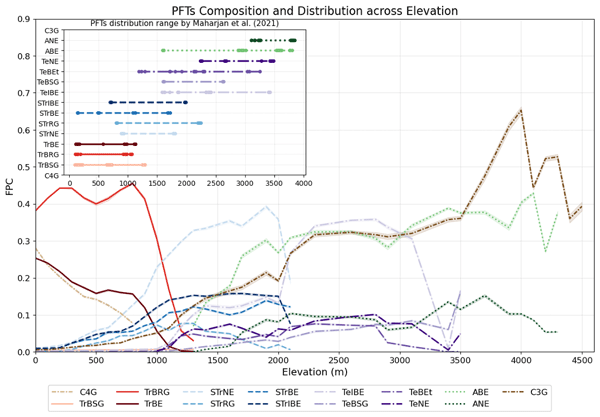
The simulated results show that PFT composition and dominance vary along the elevational gradient, with the total number of PFTs decreasing with an increase in elevation. At lower elevations, three PFTs – tropical broadleaved raingreen, tropical broadleaved evergreen, and C4 grass – dominate FPC, despite the presence of over ten PFTs in thais area. At the higher end of the gradient, alpine needle-leaved and alpine evergreen broadleaved form tree crown cover, while C3 grass dominance increases with elevation, reaching up to 70 % in FPC. Sub-tropical needleleaved and temperate shade-intolerant evergreen PFTs dominate the mid-elevation range, showing variability in PFT composition and distribution along the gradient. In the mid-elevation gradient, an area dominated by sub-tropical and temperate PFTs, PFT composition changes more frequently than at the ends of the gradient (Fig. 8).
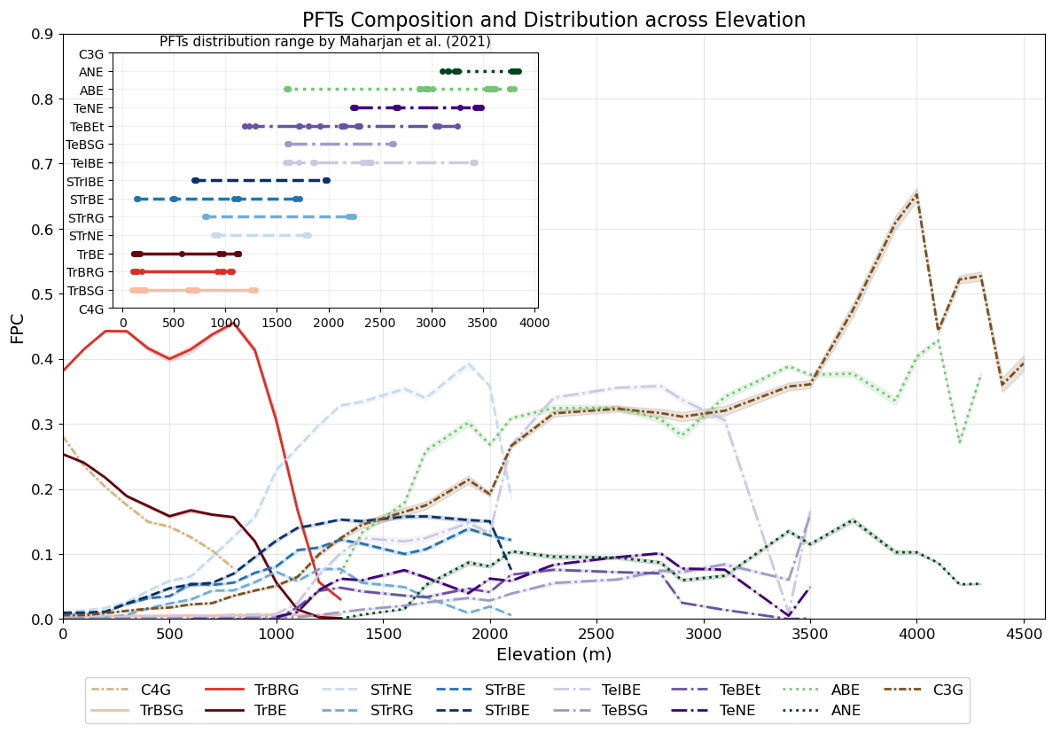
Figure 8PFTs distribution and composition by fractional projective cover along the elevation gradient (inset figure shows the PFTs distribution ranges recorded by Maharjan et al., 2021 in the elevation gradient).
The RAC coefficient value, calculated for each simulated grid using the FPC value of trees, shows that PFT's evenness increases rapidly along the elevation gradient starting from mid-elevation (after 2000 m) (Fig. 9). As elevation increases, PFT abundance decreases, from a maximum of 10 PFTs in lower elevations to just two in higher elevations (Fig. 9). In the high PFT abundance area, the competition was higher, characterized by the competitive dominance of a few PFTs (Supplement Fig. S6). For example, tropical broadleaved raingreen, tropical broadleaved evergreen in lower elevation, sub-tropical conifers, and subtropical intermediate shade tolerant broadleaves in the mid-elevation range (Supplement Fig. S5). These patterns suggest a symmetrical competition for light and nutrients at lower elevation despite richness in species composition. In contrast, regions with low PFT abundance exhibited higher evenness (coefficient value close to 0), indicating reduced competition and a stronger role of environmental filtering. Here, plant adaptation to temperature and soil nutrient limitation becomes the primary driver of vegetation structure and composition. A more detailed breakdown of PFT-specific FPC distributions and dominance patterns along the elevation gradient is provided in Supplement Fig. S6.
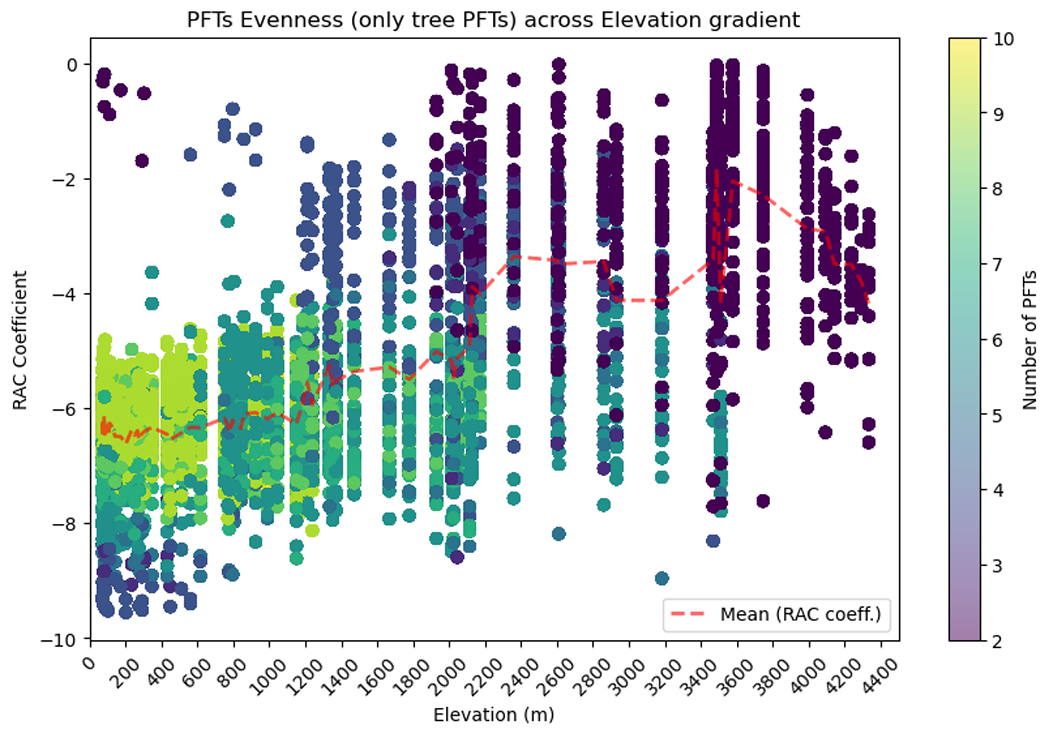
Figure 9PFTs evenness (RAC coefficient) across latitude with the number of PFTs (present) in each simulated grid.
Deciduousness and shade tolerance emerge as the two most dominant plant adaptation mechanisms of vegetation which vary systematically along the elevation gradient. The proportion of shade-tolerant species decreases with elevation. Intermediate shade tolerance (Schima wallichii) has maximum FPC in the mid-elevation ranges (1200–2500 m), suggesting that these elevation ranges offer a balance in light and temperature conditions, favouring flexible growth strategies. Deciduous broadleaved species form dominant crown coverage in lower elevations, but their contribution to FPC decreases with increased elevation. In contrast, evergreen conifer contribution to FPC increases with an increase in elevation up to 4500 m, corresponding to zones dominated by coniferous species, mainly Abies and Juniperus (Fig. 10). At the cold end of the gradient, the alpine broadleaved evergreen, especially Rhododendron spp., contributes the maximum in FPC. Notably, around 1000 m elevation (Fig. 10), both shade tolerance and deciduousness exhibit high evenness in PFT distribution, indicating a transitional zone where multiple plant adaptation strategies coexist due to overlapping ecological niches.
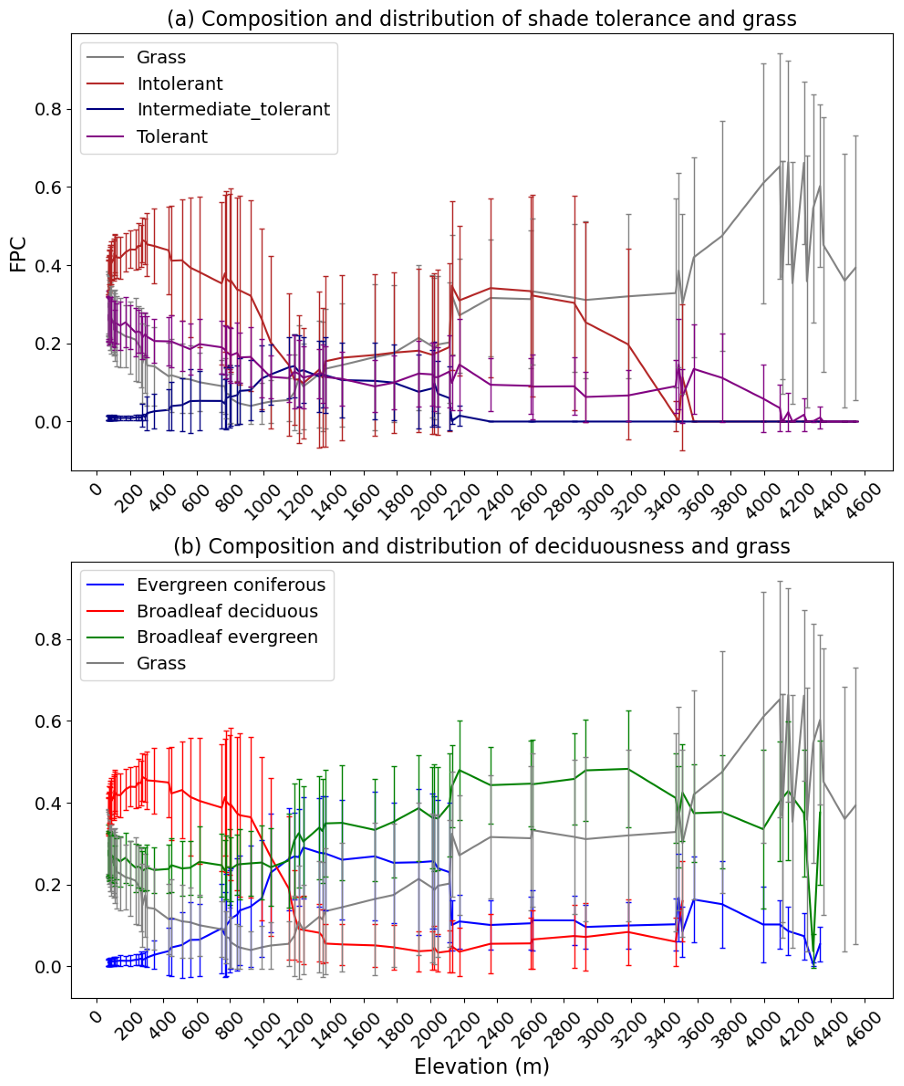
Figure 10Distribution and composition of PFTs adaptation strategies (shade tolerance and deciduousness) and grasses (line represents mean and bar represents standard deviation) along the elevation gradient.
We evaluated the complex interaction between growth conditions, PFT abundance, productivity, and competitive interactions by simulating these factors and their interdependent dynamics along the Himalayan elevation gradient. Our results reveal that both abiotic and biotic filters generate distinct ecosystem states through elevation-dependent niche differences. As expected, our model predicted pronounced shifts in ecosystem structure, composition, and productivity along the gradient, reflecting a transition from competition-regulated community assembly at lower elevations to stress-filtered assembly at higher elevations. At lower elevations, warmer temperatures and relatively higher nutrient availability allowed many PFTs to coexist within their physiological tolerance limits, resulting in intense asymmetric competition for light. Under these conditions, realised niches dominate community structure, with a few competitively superior PFTs suppressing others despite functional richness. In contrast, colder and nutrient-limited conditions at higher elevations constrained community composition and structure to a few cold-tolerant species with short bole heights, operating within their physiological niches, resulting in more even but less diverse stands. These patterns support our hypothesis that vegetation structure, composition, and productivity along the elevation gradient are structured by a shift from realised niches, defined by competitive interactions at lower elevations, to physiological niches, shaped by stress (freezing temperatures) at higher elevations and align with the predictions of the stress gradient hypothesis.
The model reliably reproduced key ecological patterns along the elevation gradient, with strong agreement between simulated outcomes and observations or independent reconstructed variables, supporting the plausibility of the results and the underlying mechanisms. Simulated GPP decreased with elevation, in agreement with the estimates from the leaf light use efficiency model by Bi and Zhou (2022), reflecting the strong control of temperature and growing-season length on carbon uptake in montane ecosystems. This decline aligned with the distribution of cold-tolerant PFTs such as Rhododendron (ABE), Alpine coniferous species (ANE) and C3 grasses found at higher elevations, consistent with the National Forest Inventory, which identifies that Rhododendron and Abies are the two most dominant species in higher elevations of the Himalayas (DFRS, 2015).
Simulated above-ground biomass and bole height patterns closely matched plot-based forest inventory measurements from Khanal and Boer (2023) and bole height from Maharjan et al. (2021), indicating that the model captures key structural and functional forest responses to elevation. Above-ground biomass gradually increased, before a significant decline with elevation (temperature) due to climatic stress, which is consistent with the patterns reported by Thakur et al. (2024). Observed biomass at higher elevations exhibits marked spatial variability, which may arise from local topographic and microclimatic heterogeneity that favours the growth of fir (Abies spp.), brown oak (Quercus spp.), and Rhododendron spp., particularly in deep gorges and on southern aspects (Khanal et al., 2025; Thakur and Chawla, 2019; Tito et al., 2020) enabling certain PFTs to extend their realised niche beyond broader elevational trends. These species attain high biomass through contrasting strategies: brown oak and Rhododendron attain high biomass primarily through high wood density and structural investment, while fir attains high biomass through large stem volume and tall stature despite relatively lower wood density (Kumar et al., 2024) and these species have physiological tolerance to cold and nutrient limitation combined with persistent canopy cover. Although the model does not represent detailed soil chemistry, the presence of Rhodendron and Abies PFTs in the simulation aligns with their known adaptation mechanisms to high pH and low nutrients, characterized by a wide distribution range (Thakur et al., 2024), which are implicitly represented by trait parameters within the PFT framework.
Vegetation structure along the elevation gradient was significantly impacted by the environmental conditions. In lower elevations, favourable growth conditions promote crowded stand conditions, taller bole heights, facilitating competitive advantages through increased light interception and asymmetric competition. Additionally, taller bole height of trees in these conditions may result from a trade-off, where some resources are allocated away from other parts, such as stem and branch development (Tsunoda et al., 2025). Pokhrel and Sherpa (2020) also found significant associations between tree height, DBH, and above-ground biomass and elevation in the central Himalayas. With the increase in altitude, tree growth declines, and light competition weakens, resulting in forests with similar basal area and total tree height (Coomes and Allen, 2007). In contrast, alpine environments favour structurally compact morphologies with reduced height growth but sustained leaf area through evergreen strategies. The relatively high LAI at higher elevations despite declining productivity was associated with an increase in abundance of evergreen vegetation (Figs. 5 and 10). This pattern reflects survival strategies, including heat dissipation to avoid damage by excessive radiation in warm periods, as well as physiological adjustments such as increasing intercellular fluid concentration and using reactive oxygen to withstand chilling temperatures to tolerate low-temperature stress (Li et al., 2022). Although these physiological mechanisms/strategies are not explicitly parameterized in the model, they emerge implicitly through trait-based PFTs representation.
The simulated vegetation community exhibited a distinct shift in compositional patterns across the elevation gradient that reflects changing competitive and abiotic conditions. At lower elevations, favourable climatic conditions support high PFT richness and functional diversity; along with strong asymmetric competition, resulting in dominance by a few competitively superior PFTs operating within their realised niches. Among more than ten PFTs present, Shorea robusta (PFT-TrBRG) emerged as the dominant climax species, showing consistency with national forest inventory data, which show that Shorea robusta and its associated species, such as Terminalia alata, Mollunthous philippines, and Lagerstroemina parviflora, are the most common and productive in terms of biomass in the southern central Himalayas (DFRS, 2015). The competitive dominance and higher productivity these species were linked to drought and fire resistance (Gautam and Devoe, 2006), conferring competitive advantages under seasonal climatic variability. In contrast, higher elevations supported only a few PFTs (Supplement Fig. S5), with community composition shaped by abiotic stress such as low temperature and short growing seasons (Fig. 7). Under these conditions, competitive exclusion weakens, and no single PFT dominates, resulting in more even but less diverse communities. Ahmad et al. (2025) also stated that functional diversity is higher in lower elevation, even though species richness and phylogenetic diversity are higher in mid-elevation across the Himalayas. These elevational shifts in dominance and diversity is broadly consistent with the stress-gradient hypothesis, which explains that abiotic stress dominates in harsher conditions, and competition is more influential in benign environment (Bertness and Callaway, 1994). Additionally, the simulated PFTs composition is consistent with mid-domain effects (Colwell and Lees, 2000; Smith and Wilson, 1996) with a large number of PFT peaks at the intermediate elevation range (1000–2000 m), likely due to geometric constraints on range overlap (Figs. 6, 8, and 10). Overall, PFTs richness and diversity decline monotonically at higher elevation, with higher elevation characterized by fewer and more specialized PFTs adapted to extreme climatic conditions (Fig. 8).
The difference in PFTs' performance and dominance along the gradient emerge from an interaction between climatic condition and trait-mediated trade-offs that regulate carbon allocation, growth form, and competitive ability under contrasting climatic constraint. Overall, tropical broadleaved raingreen (TrBRG) was the most productive, followed by temperate evergreen (TeIBE) and alpine evergreen (ABE) across the elevation gradient. This result is consistent with the national forest inventory report, which states species contribution in overall productions varies with elevation (DFRS, 2015). At lower elevations, PFTs with rapid growth rate, efficient light capture, and high carbon gain dominate through asymmetric competition for light and space, which is translated into competitive superiority, reinforcing realised niche occupation and hierarchical dominance structures. However, in higher elevation balance shifts from competitive suppression to persistence under environmental stress and overall ecosystem productive decreases. These variations in productivity among PFTs therefore reflect underlying trait trade-offs, particularly involving wood density, size–density relationships, growth allocation strategies and their niche (Khanal et al., 2024). PFTs characterised by dense wood and conservative growth strategies maintain biomass through structural investment and stress tolerance, whereas PFTs achieving large stem volume sustain biomass primarily through size expansion when climatic conditions permit. As these contrasting strategies converge under harsher alpine conditions, performance differences among PFTs diminish, competitive hierarchies weaken, and no single PFT consistently dominates (Naud et al., 2019), despite broad climatic niche breadth in taxa such as Rhododendron.
A range of mechanisms, including deciduousness, shade tolerance, and drought resistance, allometric relationships, and wood density collectively determine how PFTs allocate carbon, compete for resources, and persist under varying environmental conditions. An lower elevations, deciduousness emerges as an adaptation to escape seasonal drought, enabling drought avoidance and rapid resource use under seasonal climates. In contrast, higher elevations favour evergreen and shade tolerant PFTs adapted to stresses such as cooler temperatures, shorter growing seasons, and harsher growing conditions. Similarly, allometric traits such as crown dimension-DBH, height-DBH, and wood density affected competitive interaction and competitive dynamics. In lower elevations, PFT coverage in the crown showed a clear hierarchy with the differences in competitive dominance in productivity and FPC. Our study further emphasizes that growth conditions, coupled with biotic and abiotic interactions, and trade-offs between growth and adaptation to multiple stresses drive the overall ecosystem functioning along the elevation gradient. Under ongoing global change, relaxation of thermal constraints at higher elevations may intensify competition in currently stress-filtered communities, while increased climatic variability may narrow the zone of higher functional diversity at mid-elevations, with consequences for ecosystem resilience and carbon storage.
4.1 Limitations
We used high-resolution climate data (3 km) as forcing data to capture heterogeneity in climatic conditions along the elevation gradient. However, the model does not fully capture the variability in microclimatic conditions that creates distinct topoclimatic conditions which favour high biomass accumulation created by small-scale topography. This may partially account for the underestimation of above-ground carbon stock in our simulations especially in high elevations. With the elevation increase, climatic heterogeneity amplifies with more diverse climatic conditions (Guan et al., 2024). Integrating slope and aspect in the model could enhance its ability to characterize vegetation dynamics and composition dynamics, particularly in mountain regions where variation in radiation, soil moisture, and temperature across slope orientations plays a crucial role. Regional species trait data were used for defining functional groups representing 31 dominant tree species along the gradient. While, this approach captures the major functional strategies governing ecosystem processes, some locally abundant or patch-dominant species that contribute to overall ecosystem functioning and structural heterogeneity may not be explicitly represented. As a result, fine-scale variation in biomass, functioning, structure and community composition may be smoothed in the simulations. This reflects a limitation of using generalized PFTs, which may not fully capture species-specific responses and local ecological variability. Incorporating an expanded trait database and higher function resolution could further enhance the representation of local biodiversity and ecosystem structural component across complex mountain ecosystem.
Even though dynamic vegetation models like LPJ-GUESS integrate competition for space, light, and soil resources among neighbouring plants, this competitive framework may not fully account for how trait-based plasticity alters competitive interactions under different growth conditions. This can limit the model's ability to capture the full range of ecosystem dynamics. Integrating the allometric relation defined based on growth (competition) conditions helped to better characterise above-ground competition for light and space, whereas competition for below-ground resources, i.e. water and nitrogen in the model, largely follows proportionately with plant size. In reality, differential root profiles, including deep water access via tap roots characteristic of certain tree taxa, and other factors such as mycorrhizal associations or release of root exudates to promote nutrient mineralisation and uptake are known to predict plant success in environments characterised by below-ground resource limitations (Freschet et al., 2021). Dynamic root allocation based on resource availability in different layers is not currently simulated in LPJ-GUESS. Integrating root trait data, especially the distribution of fine roots in different soil profiles, root and mycorrhizal association (De Paula et al., 2021), and interlinking them with soil depth, may better capture below-ground competition processes. The current version of LPJ-GUESS incorporates a climate-driven prognostic wildfire scheme (SIMFIRE-BLAZE; Rabin et al., 2017) which impacts the composition, structure, and dynamics of the vegetation. However, other forms of disturbance, such as wood cutting and managed fires, herbivory, insect pest impacts, and wind-throw shape vegetation composition and demography, compounding with the biophysical and ecological mechanisms included in the model (Brewer, 2011; Grime, 1973; Hall et al., 2012; Laurent et al., 2017).
Incorporating trait data and allometric relations of regional PFTs into LPJ-GUESS model, this study provides a mechanistic representation of vegetation dynamics along the Himalayan elevation gradient. The model successfully reproduced spatial patterns generally consistent with observed in vegetation composition, structure, and productivity, and capturing key ecological processes across contrasting climatic conditions. Our results show that environmental conditions, biotic and abiotic interactions, allometric relations, and associated functional trade-offs jointly shape ecosystem processes and drive the competition patterns and adaptation mechanisms. At the productive end of the gradient, competitive interactions among woody PFTs in crowded stands had a strong influence on PFT performance and abundance. These interactions, together with the realised niches of PFTs, led to reduced evenness in PFT distribution, as certain PFTs become dominant in different climatic conditions. This did not translate into higher PFT richness in the way predicted by classical niche theory, suggesting favourable environmental conditions may buffer competitive exclusion and promote species coexistence despite competitive dominance hierarchies. In contrast, under more stressful conditions, only a few PFTs survive and grow, exhibiting higher evenness in composition and shorter stature. The increase in evenness with elevation reflects reduced crowding and weak asymmetric competition, with the surviving PFTs adapting and persisting by occupying their physiological niches in response to prevailing abiotic stress, particularly cold and freezing temperatures. Our findings highlight how variations in climatic conditions, resource availability, the climatic niche of PFTs, and unique adaptation mechanisms interact with PFT traits and adaptation strategies to shape vegetation composition patterns and productivity, thereby acting as overall controls on ecosystem function along the gradient. Further study, integrating heterogeneity in topographic conditions with different disturbances, along with a representation of below-ground competition (especially root profiles and groundwater dynamics), could enhance our understanding of ecosystem responses to global changes and extreme events, as well as their adaptation mechanisms in the central Himalayas.
The customized LPJ-GUESS version used in this study has been archived in the LPJ-GUESS Zenodo community [https://doi.org/10.5281/zenodo.17214801, Paudel et al., 2025a]. The forcing data, simulated output, that reproduce the analyses presented in the manuscript have been deposited in Zenodo [https://doi.org/10.5281/zenodo.17214851, Paudel et al., 2025b].
The supplement related to this article is available online at https://doi.org/10.5194/bg-23-4999-2026-supplement.
PP: conceptualization and design (lead); data curation (lead); simulation (lead); formal analysis (lead); writing – original draft (lead); writing – review and editing (lead). SO: Supervision (supporting); writing – review and editing (supporting). MT: Supervision (supporting); writing – review and editing (supporting); Supervision (supporting); writing – review and editing (supporting). MP: Supervision (supporting); writing – review and editing (supporting). DM: Supervision (supporting); writing – review and editing (supporting). BS: Supervision (lead); conceptualization and design (supporting); writing – original draft (supporting); writing – review and editing (equal).
The contact author has declared that none of the authors has any competing interests.
Publisher's note: Copernicus Publications remains neutral with regard to jurisdictional claims made in the text, published maps, institutional affiliations, or any other geographical representation in this paper. The authors bear the ultimate responsibility for providing appropriate place names. Views expressed in the text are those of the authors and do not necessarily reflect the views of the publisher.
We thank Drew Holzworth and Andrew (Alf) Leahy for their technical support throughout this work. Similarly, we would like to thank Dr Surya Kumar Maharjan for advice on trait data mapping and sourcing to parameterize this model setup.
This research was supported by the Commonwealth through an Australian Government Research Training Program Scholarship for Prashant Paudel's PhD at Western Sydney University. Stefan Olin was supported by the Modelling the Regional and Global Earth System (MERGE) Project.
The publication of this article was funded by the Swedish Research Council, Forte, Formas, and Vinnova.
This paper was edited by Benjamin Stocker and reviewed by two anonymous referees.
Acharya, B. K., Chettri, B., and Vijayan, L.: Distribution pattern of trees along an elevation gradient of Eastern Himalaya, India, Acta Oecologica, 37, 329–336, https://doi.org/10.1016/j.actao.2011.03.005, 2011.
Ahmad, M., Luo, Y.-H., Rathee, S., Spicer, R. A., Zhang, J., Wambulwa, M. C., Zhu, G.-F., Cadotte, M. W., Wu, Z.-Y., Khan, S. M., Maity, D., Li, D.-Z., and Liu, J.: Multifaceted plant diversity patterns across the Himalaya: Status and outlook, Plant Divers., 47, 529–543, https://doi.org/10.1016/j.pld.2025.04.003, 2025.
Araghi, A. and Martinez, C. J.: Evaluation of CRU-JRA gridded meteorological dataset for modeling of wheat production systems in Iran, Int. J. Biometeorol., 68, 1201–1211, https://doi.org/10.1007/s00484-024-02659-9, 2024.
Asner, G. P., Anderson, C. B., Martin, R. E., Knapp, D. E., Tupayachi, R., Sinca, F., and Malhi, Y.: Landscape-scale changes in forest structure and functional traits along an Andes-to-Amazon elevation gradient, Biogeosciences, 11, 843–856, https://doi.org/10.5194/bg-11-843-2014, 2014.
Avolio, M. L., Forrestel, E. J., Chang, C. C., La Pierre, K. J., Burghardt, K. T., and Smith, M. D.: Demystifying dominant species, New Phytol., 223, 1106–1126, https://doi.org/10.1111/nph.15789, 2019.
Ayer, S., Yadav, B. K., and Bhatta, K. P.: What drives the regeneration dynamics in Central Himalayan Mountain Forests of Nepal?, Environ. Chall., 21, 101359, https://doi.org/10.1016/j.envc.2025.101359, 2025.
Bertness, M. D. and Callaway, R.: Positive interactions in communities, Trends Ecol. Evol., 9, 191–193, https://doi.org/10.1016/0169-5347(94)90088-4, 1994.
Bi, W. and Zhou, Y.: A global 0.05° dataset for gross primary production of sunlit and shaded vegetation canopies (1992–2020), DRYAD [data set], https://doi.org/10.5061/DRYAD.DFN2Z352K, 2022.
Brewer, J. S.: Disturbance-mediated competition between perennial plants along a resource supply gradient: Disturbances and competition, J. Ecol., 99, 1219–1228, https://doi.org/10.1111/j.1365-2745.2011.01846.x, 2011.
Brooker, R. W. and Kikvidze, Z.: Importance: an overlooked concept in plant interaction research, J. Ecol., 96, 703–708, https://doi.org/10.1111/j.1365-2745.2008.01373.x, 2008.
Bugmann, H., Fischlin, A., and Kienast, F.: Model convergence and state variable update in forest gap models, Ecol. Model., 89, 197–208, https://doi.org/10.1016/0304-3800(95)00135-2, 1996.
Colwell, Robert. K. and Lees, D. C.: The mid-domain effect: geometric constraints on the geography of species richness, Trends Ecol. Evol., 15, 70–76, https://doi.org/10.1016/S0169-5347(99)01767-X, 2000.
Coomes, D. A. and Allen, R. B.: Effects of size, competition and altitude on tree growth, J. Ecol., 95, 1084–1097, https://doi.org/10.1111/j.1365-2745.2007.01280.x, 2007.
De Frenne, P., Graae, B. J., Rodríguez-Sánchez, F., Kolb, A., Chabrerie, O., Decocq, G., De Kort, H., De Schrijver, A., Diekmann, M., Eriksson, O., Gruwez, R., Hermy, M., Lenoir, J., Plue, J., Coomes, D. A., and Verheyen, K.: Latitudinal gradients as natural laboratories to infer species' responses to temperature, J. Ecol., 101, 784–795, https://doi.org/10.1111/1365-2745.12074, 2013.
De Paula, M. D., Forrest, M., Langan, L., Bendix, J., Homeier, J., Velescu, A., Wilcke, W., and Hickler, T.: Nutrient cycling drives plant community trait assembly and ecosystem functioning in a tropical mountain biodiversity hotspot, New Phytol., 232, 551–566, https://doi.org/10.1111/nph.17600, 2021.
DFRS: State of Nepal's Forests, Department of Forest Research and Survey, Kathmandu, ISBN 978-9937-8896-3-6, 2015.
Dhakal, B. P.: Traits and species distribution along the altitudinal gradient of the Himalayas, Nepal, M.Sc. thesis, Wageningen University & Research, Wageningen, the Netherlands, 1–75, https://www.researchgate.net/publication/325780659_Traits_and_species_distribution_along_the_altitudinal_gradient_of_the_Himalayas_Nepal (last access: 10 July 2024), 2018.
Díaz, S., Kattge, J., Cornelissen, J. H. C., Wright, I. J., Lavorel, S., Dray, S., Reu, B., Kleyer, M., Wirth, C., Colin Prentice, I., Garnier, E., Bönisch, G., Westoby, M., Poorter, H., Reich, P. B., Moles, A. T., Dickie, J., Gillison, A. N., Zanne, A. E., Chave, J., Joseph Wright, S., Sheremet'ev, S. N., Jactel, H., Baraloto, C., Cerabolini, B., Pierce, S., Shipley, B., Kirkup, D., Casanoves, F., Joswig, J. S., Günther, A., Falczuk, V., Rüger, N., Mahecha, M. D., and Gorné, L. D.: The global spectrum of plant form and function, Nature, 529, 167–171, https://doi.org/10.1038/nature16489, 2016.
Drollinger, S., Müller, M., Kobl, T., Schwab, N., Böhner, J., Schickhoff, U., and Scholten, T.: Decreasing nutrient concentrations in soils and trees with increasing elevation across a treeline ecotone in Rolwaling Himal, Nepal, J. Mt. Sci., 14, 843–858, https://doi.org/10.1007/s11629-016-4228-4, 2017.
Dyola, N., Sigdel, S. R., Liang, E., Babst, F., Camarero, J. J., Aryal, S., Chettri, N., Gao, S., Lu, X., Sun, J., Wang, T., Zhang, G., Zhu, H., Piao, S., and Peñuelas, J.: Species richness is a strong driver of forest biomass along broad bioclimatic gradients in the Himalayas, Ecosphere, 13, https://doi.org/10.1002/ecs2.4107, 2022.
Earth Resources Observation and Science (EROS) Center: Shuttle Radar Topography Mission (SRTM) 1 Arc-Second Global, USGS [data set], https://doi.org/10.5066/F7PR7TFT, 2000.
Earth Resources Observation and Science (EROS) Center: Global 30 Arc-Second Elevation (GTOPO30), USGS [data set], https://doi.org/10.5066/F7DF6PQS, 2017.
Falster, D. S., Duursma, R. A., Ishihara, M. I., Barneche, D. R., FitzJohn, R. G., Vårhammar, A., Aiba, M., Ando, M., Anten, N., Aspinwall, M. J., Baltzer, J. L., Baraloto, C., Battaglia, M., Battles, J. J., Bond-Lamberty, B., Van Breugel, M., Camac, J., Claveau, Y., Coll, L., Dannoura, M., Delagrange, S., Domec, J.-C., Fatemi, F., Feng, W., Gargaglione, V., Goto, Y., Hagihara, A., Hall, J. S., Hamilton, S., Harja, D., Hiura, T., Holdaway, R., Hutley, L. S., Ichie, T., Jokela, E. J., Kantola, A., Kelly, J. W. G., Kenzo, T., King, D., Kloeppel, B. D., Kohyama, T., Komiyama, A., Laclau, J.-P., Lusk, C. H., Maguire, D. A., Le Maire, G., Mäkelä, A., Markesteijn, L., Marshall, J., McCulloh, K., Miyata, I., Mokany, K., Mori, S., Myster, R. W., Nagano, M., Naidu, S. L., Nouvellon, Y., O'Grady, A. P., O'Hara, K. L., Ohtsuka, T., Osada, N., Osunkoya, O. O., Peri, P. L., Petritan, A. M., Poorter, L., Portsmuth, A., Potvin, C., Ransijn, J., Reid, D., Ribeiro, S. C., Roberts, S. D., Rodríguez, R., Saldaña-Acosta, A., Santa-Regina, I., Sasa, K., Selaya, N. G., Sillett, S. C., Sterck, F., Takagi, K., Tange, T., Tanouchi, H., Tissue, D., Umehara, T., Utsugi, H., Vadeboncoeur, M. A., Valladares, F., Vanninen, P., Wang, J. R., Wenk, E., Williams, R., De Aquino Ximenes, F., Yamaba, A., Yamada, T., Yamakura, T., Yanai, R. D., and York, R. A.: BAAD: a Biomass And Allometry Database for woody plants: Ecological Archives E096-128, Ecology, 96, 1445–1445, https://doi.org/10.1890/14-1889.1, 2015.
Freschet, G. T., Roumet, C., Comas, L. H., Weemstra, M., Bengough, A. G., Rewald, B., Bardgett, R. D., De Deyn, G. B., Johnson, D., Klimešová, J., Lukac, M., McCormack, M. L., Meier, I. C., Pagès, L., Poorter, H., Prieto, I., Wurzburger, N., Zadworny, M., Bagniewska-Zadworna, A., Blancaflor, E. B., Brunner, I., Gessler, A., Hobbie, S. E., Iversen, C. M., Mommer, L., Picon-Cochard, C., Postma, J. A., Rose, L., Ryser, P., Scherer-Lorenzen, M., Soudzilovskaia, N. A., Sun, T., Valverde-Barrantes, O. J., Weigelt, A., York, L. M., and Stokes, A.: Root traits as drivers of plant and ecosystem functioning: current understanding, pitfalls and future research needs, New Phytol., 232, 1123–1158, https://doi.org/10.1111/nph.17072, 2021.
Friedlingstein, P., O'Sullivan, M., Jones, M. W., Andrew, R. M., Bakker, D. C. E., Hauck, J., Landschützer, P., Le Quéré, C., Luijkx, I. T., Peters, G. P., Peters, W., Pongratz, J., Schwingshackl, C., Sitch, S., Canadell, J. G., Ciais, P., Jackson, R. B., Alin, S. R., Anthoni, P., Barbero, L., Bates, N. R., Becker, M., Bellouin, N., Decharme, B., Bopp, L., Brasika, I. B. M., Cadule, P., Chamberlain, M. A., Chandra, N., Chau, T.-T.-T., Chevallier, F., Chini, L. P., Cronin, M., Dou, X., Enyo, K., Evans, W., Falk, S., Feely, R. A., Feng, L., Ford, D. J., Gasser, T., Ghattas, J., Gkritzalis, T., Grassi, G., Gregor, L., Gruber, N., Gürses, Ö., Harris, I., Hefner, M., Heinke, J., Houghton, R. A., Hurtt, G. C., Iida, Y., Ilyina, T., Jacobson, A. R., Jain, A., Jarníková, T., Jersild, A., Jiang, F., Jin, Z., Joos, F., Kato, E., Keeling, R. F., Kennedy, D., Klein Goldewijk, K., Knauer, J., Korsbakken, J. I., Körtzinger, A., Lan, X., Lefèvre, N., Li, H., Liu, J., Liu, Z., Ma, L., Marland, G., Mayot, N., McGuire, P. C., McKinley, G. A., Meyer, G., Morgan, E. J., Munro, D. R., Nakaoka, S.-I., Niwa, Y., O'Brien, K. M., Olsen, A., Omar, A. M., Ono, T., Paulsen, M., Pierrot, D., Pocock, K., Poulter, B., Powis, C. M., Rehder, G., Resplandy, L., Robertson, E., Rödenbeck, C., Rosan, T. M., Schwinger, J., Séférian, R., Smallman, T. L., Smith, S. M., Sospedra-Alfonso, R., Sun, Q., Sutton, A. J., Sweeney, C., Takao, S., Tans, P. P., Tian, H., Tilbrook, B., Tsujino, H., Tubiello, F., van der Werf, G. R., van Ooijen, E., Wanninkhof, R., Watanabe, M., Wimart-Rousseau, C., Yang, D., Yang, X., Yuan, W., Yue, X., Zaehle, S., Zeng, J., and Zheng, B.: Global Carbon Budget 2023, Earth Syst. Sci. Data, 15, 5301–5369, https://doi.org/10.5194/essd-15-5301-2023, 2023.
Gautam, K. H. and Devoe, N. N.: Ecological and anthropogenic niches of sal (Shorea robusta Gaertn. f.) forest and prospects for multiple-product forest management – a review, For. Int. J. For. Res., 79, 81–101, https://doi.org/10.1093/forestry/cpi063, 2006.
Grime, J. P.: Competitive Exclusion in Herbaceous Vegetation, Nature, 242, 344–347, https://doi.org/10.1038/242344a0, 1973.
Guan, Y., Liu, J., Cui, W., Chen, D., Zhang, J., Lu, H., Maeda, E. E., Zeng, Z., and Beck, H. E.: Elevation Regulates the Response of Climate Heterogeneity to Climate Change, Geophys. Res. Lett., 51, e2024GL109483, https://doi.org/10.1029/2024GL109483, 2024.
Hall, A. R., Miller, A. D., Leggett, H. C., Roxburgh, S. H., Buckling, A., and Shea, K.: Diversity–disturbance relationships: frequency and intensity interact, Biol. Lett., 8, 768–771, https://doi.org/10.1098/rsbl.2012.0282, 2012.
Hickler, T., Smith, B., Sykes, M. T., Davis, M. B., Sugita, S., and Walker, K.: Using a Generalized Vegetation Model to Simulate Vegetation Dynamics in Northeastern USA, Ecology, 85, 519–530, https://doi.org/10.1890/02-0344, 2004.
Jackson, J. K..: Manual of Afforestation in Nepal, Second edn., Ministry of Forests and Soil Conservation, Forest Research and Survey Centre, Kathmandu, Nepal, 496 pp., http://frtc.gov.np/downloadfiles/book2-1702615738.pdf (last access: 1 June 2024), 1994.
Jucker, T., Fischer, F. J., Chave, J., et al.: Tallo: A global tree allometry and crown architecture database, Glob. Change Biol., 28, 5254–5268, https://doi.org/10.1111/gcb.16302, 2022.
Khanal, S. and Boer, M. M.: Plot-level estimates of aboveground biomass and soil organic carbon stocks from Nepal's forest inventory, Sci. Data, 10, 406, https://doi.org/10.1038/s41597-023-02314-9, 2023.
Khanal, S., Nolan, R. H., Medlyn, B. E., and Boer, M. M.: Disentangling contributions of allometry, species composition and structure to high aboveground biomass density of high-elevation forests, For. Ecol. Manag., 554, 121679, https://doi.org/10.1016/j.foreco.2023.121679, 2024.
Khanal, S., Nolan, R. H., Medlyn, B. E., and Boer, M. M.: Topoclimatic factors create favourable conditions for carbon-dense forests in the Central Himalayas, Sci. Rep., 15, 35134, https://doi.org/10.1038/s41598-025-19127-y, 2025.
Kumar, P., Kumar, A., Patil, M., Hussain, S., and Singh, A. N.: Factors influencing tree biomass and carbon stock in the Western Himalayas, India, Front. For. Glob. Change, 6, 1328694, https://doi.org/10.3389/ffgc.2023.1328694, 2024.
Lamarque, J.-F., Shindell, D. T., Josse, B., Young, P. J., Cionni, I., Eyring, V., Bergmann, D., Cameron-Smith, P., Collins, W. J., Doherty, R., Dalsoren, S., Faluvegi, G., Folberth, G., Ghan, S. J., Horowitz, L. W., Lee, Y. H., MacKenzie, I. A., Nagashima, T., Naik, V., Plummer, D., Righi, M., Rumbold, S. T., Schulz, M., Skeie, R. B., Stevenson, D. S., Strode, S., Sudo, K., Szopa, S., Voulgarakis, A., and Zeng, G.: The Atmospheric Chemistry and Climate Model Intercomparison Project (ACCMIP): overview and description of models, simulations and climate diagnostics, Geosci. Model Dev., 6, 179–206, https://doi.org/10.5194/gmd-6-179-2013, 2013.
Latombe, G., Burke, A., Vrac, M., Levavasseur, G., Dumas, C., Kageyama, M., and Ramstein, G.: Comparison of spatial downscaling methods of general circulation model results to study climate variability during the Last Glacial Maximum, Geosci. Model Dev., 11, 2563–2579, https://doi.org/10.5194/gmd-11-2563-2018, 2018.
Laurent, L., Mårell, A., Korboulewsky, N., Saïd, S., and Balandier, P.: How does disturbance affect the intensity and importance of plant competition along resource gradients?, For. Ecol. Manag., 391, 239–245, https://doi.org/10.1016/j.foreco.2017.02.003, 2017.
Li, H., Guo, Q., Yang, L., Quan, H., and Wang, S.: Seasonal Eco-Physiology Characteristics of Four Evergreen Rhododendron Species to the Subalpine Habitats, Forests, 13, 653, https://doi.org/10.3390/f13050653, 2022.
Liang, J., Ding, Z., Lie, G., Zhou, Z., Singh, P. B., Zhang, Z., and Hu, H.: Species richness patterns of vascular plants and their drivers along an elevational gradient in the central Himalayas, Glob. Ecol. Conserv., 24, e01279, https://doi.org/10.1016/j.gecco.2020.e01279, 2020.
Luitel, D. R., Jha, P. K., Siwakoti, M., Shrestha, M. L., and Munniappan, R.: Climatic Trends in Different Bioclimatic Zones in the, Climate, 8, 1–18, https://doi.org/10.3390/cli8110136, 2020.
Maharjan, S. K., Sterck, F. J., Dhakal, B. P., Makri, M., and Poorter, L.: Functional traits shape tree species distribution in the Himalayas, J. Ecol., 109, 3818–3834, https://doi.org/10.1111/1365-2745.13759, 2021.
Maletha, A., Maikhuri, R. K., Bargali, S. S., Sharma, A., Negi, V. S., and Rawat, L. S.: Vegetation dynamics and soil nutrient availability in a temperate forest along altitudinal gradient of Nanda Devi Biosphere Reserve, Western Himalaya, India, PLoS ONE, 17, 1–22, https://doi.org/10.1371/journal.pone.0275051, 2022.
Måren, I. E., Karki, S., Prajapati, C., Yadav, R. K., and Shrestha, B. B.: Facing north or south: Does slope aspect impact forest stand characteristics and soil properties in a semiarid trans-Himalayan valley?, J. Arid Environ., 121, 112–123, https://doi.org/10.1016/j.jaridenv.2015.06.004, 2015.
MoFSC: Conservation Landscapes of Nepal, Ministry of Forests and Soil Conservation, Kathmandu, Nepal, https://lib.icimod.org/records/2h0bn-8rw98 (last access: 14 June 2024), 2016.
Monteux, S., Blume-Werry, G., Gavazov, K., Kirchhoff, L., Krab, E. J., Lett, S., Pedersen, E. P., and Väisänen, M.: Controlling biases in targeted plant removal experiments, New Phytol., 242, 1835–1845, https://doi.org/10.1111/nph.19386, 2024.
Muñoz Mazón, M., Klanderud, K., Finegan, B., Veintimilla, D., Bermeo, D., Murrieta, E., Delgado, D., and Sheil, D.: How forest structure varies with elevation in old growth and secondary forest in Costa Rica, For. Ecol. Manag., 469, 118191, https://doi.org/10.1016/j.foreco.2020.118191, 2020.
Murtagh, F. and Legendre, P.: Ward's Hierarchical Agglomerative Clustering Method: Which Algorithms Implement Ward's Criterion?, J. Classif., 31, 274–295, https://doi.org/10.1007/s00357-014-9161-z, 2014.
Myneni, R., Knyazikhin, Y., and Park, T.: MYD15A2H MODIS/Aqua Leaf Area Index/FPAR 8-Day L4 Global 500m SIN Grid V006, NASA Land Processes Distributed Active Archive Center [data set], https://doi.org/10.5067/MODIS/MYD15A2H.006, 2015.
Naud, L., Måsviken, J., Freire, S., Angerbjörn, A., Dalén, L., and Dalerum, F.: Altitude effects on spatial components of vascular plant diversity in a subarctic mountain tundra, Ecol. Evol., 9, 4783–4795, https://doi.org/10.1002/ece3.5081, 2019.
Olson, D. M., Dinerstein, E., Wikramanayake, E. D., Burgess, N. D., Powell, G. V. N., Underwood, E. C., D'amico, J. A., Itoua, I., Strand, H. E., Morrison, J. C., Loucks, C. J., Allnutt, T. F., Ricketts, T. H., Kura, Y., Lamoreux, J. F., Wettengel, W. W., Hedao, P., and Kassem, K. R.: Terrestrial Ecoregions of the World: A New Map of Life on Earth, BioScience, 51, 933, https://doi.org/10.1641/0006-3568(2001)051[0933:TEOTWA]2.0.CO;2, 2001.
Paudel, P., Olin, S., and Smith, B.: LPJ-GUESS Code for Himalaya (Elevation gradient), Zenodo [code and data set], https://doi.org/10.5281/zenodo.17214801, 2025a.
Paudel, P., Olin, S., and Smith, B.: Forcing data and model output for Himalayas Elevation Gradient, Zenodo [data set], https://doi.org/10.5281/zenodo.17214851, 2025b.
Paudel, P., Olin, S., Tjoelker, M., Pontarp, M., Metcalfe, D., and Smith, B.: Impacts of Tree Allometry on Structure, Composition, Functioning and Competitive Interactions in Savanna Ecosystems on the Northern Australian Tropical Transect, J. Biogeogr., 53, e70131, https://doi.org/10.1111/jbi.70131, 2026.
Peng, S., Terrer, C., Smith, B., Ciais, P., Han, Q., Nan, J., Fisher, J. B., Chen, L., Deng, L., and Yu, K.: Carbon restoration potential on global land under water resource constraints, Nat. Water, 2, 1071–1081, https://doi.org/10.1038/s44221-024-00323-5, 2024.
Pierce, S., Brusa, G., Vagge, I., and Cerabolini, B. E. L.: Allocating CSR plant functional types: the use of leaf economics and size traits to classify woody and herbaceous vascular plants, Funct. Ecol., 27, 1002–1010, https://doi.org/10.1111/1365-2435.12095, 2013.
Pokhrel, S. and Sherpa, C.: Analyzing the relationship, distribution of tree species diversity, and above-ground biomass on the Chitwan-Annapurna landscape in Nepal, Int. J. For. Res., 2020, https://doi.org/10.1155/2020/2789753, 2020.
Poudel, A. S., Shrestha, B. B., Joshi, M. D., Muniappan, R., Adiga, A., Venkatramanan, S., and Jha, P. K.: Predicting the Current and Future Distribution of the Invasive Weed Ageratina adenophora in the Chitwan-Annapurna Landscape, Nepal, Mt. Res. Dev., 40, R61–R71, https://doi.org/10.1659/MRD-JOURNAL-D-19-00069.1, 2020.
Pugh, T. A. M., Arneth, A., Kautz, M., Poulter, B., and Smith, B.: Important role of forest disturbances in the global biomass turnover and carbon sinks, Nat. Geosci., 12, 730–735, https://doi.org/10.1038/s41561-019-0427-2, 2019.
Rabin, S. S., Melton, J. R., Lasslop, G., Bachelet, D., Forrest, M., Hantson, S., Kaplan, J. O., Li, F., Mangeon, S., Ward, D. S., Yue, C., Arora, V. K., Hickler, T., Kloster, S., Knorr, W., Nieradzik, L., Spessa, A., Folberth, G. A., Sheehan, T., Voulgarakis, A., Kelley, D. I., Prentice, I. C., Sitch, S., Harrison, S., and Arneth, A.: The Fire Modeling Intercomparison Project (FireMIP), phase 1: experimental and analytical protocols with detailed model descriptions, Geosci. Model Dev., 10, 1175–1197, https://doi.org/10.5194/gmd-10-1175-2017, 2017.
Satyakam, Zinta, G., Singh, R. K., and Kumar, R.: Cold adaptation strategies in plants – An emerging role of epigenetics and antifreeze proteins to engineer cold resilient plants, Front. Genet., 13, 909007, https://doi.org/10.3389/fgene.2022.909007, 2022.
Scherstjanoi, M., Kaplan, J. O., and Lischke, H.: Application of a computationally efficient method to approximate gap model results with a probabilistic approach, Geosci. Model Dev., 7, 1543–1571, https://doi.org/10.5194/gmd-7-1543-2014, 2014.
Shah, S., Shrestha, K. K., and Scheidegger, C.: Variation in Plant Functional Traits along Altitudinal Gradient and Land Use Types in Sagarmatha National Park and Buffer Zone, Nepal, Am. J. Plant Sci., 10, 595–614, https://doi.org/10.4236/ajps.2019.104043, 2019.
Shrestha, K. B., Hofgaard, A., and Vandvik, V.: Recent treeline dynamics are similar between dry and mesic areas of Nepal, central Himalaya, J. Plant Ecol., 8, 347–358, https://doi.org/10.1093/jpe/rtu035, 2015.
Sigdel, S. R., Liang, E., Wang, Y., Dawadi, B., and Camarero, J. J.: Tree-to-tree interactions slow down Himalayan treeline shifts as inferred from tree spatial patterns, J. Biogeogr., 47, 1816–1826, https://doi.org/10.1111/jbi.13840, 2020.
Sigdel, S. R., Liang, E., Rokaya, M. B., Rai, S., Dyola, N., Sun, J., Zhang, L., Zhu, H., Chettri, N., Chaudhary, R. P., Camarero, J. J., and Peñuelas, J.: Functional traits of a plant species fingerprint ecosystem productivity along broad elevational gradients in the Himalayas, Funct. Ecol., 383–394, https://doi.org/10.1111/1365-2435.14226, 2022.
Sitch, S., Smith, B., Prentice, I. C., Arneth, A., Bondeau, A., Cramer, W., Kaplan, J. O., Levis, S., Lucht, W., Sykes, M. T., Thonicke, K., and Venevsky, S.: Evaluation of ecosystem dynamics, plant geography and terrestrial carbon cycling in the LPJ dynamic global vegetation model, Glob. Change Biol., 9, 161–185, https://doi.org/10.1046/j.1365-2486.2003.00569.x, 2003.
Smith, B. and Wilson, J. B.: A Consumer's Guide to Evenness Indices, Oikos, 76, 70, https://doi.org/10.2307/3545749, 1996.
Smith, B., Prentice, I. C., and Sykes, M. T.: Representation of vegetation dynamics in the modelling of terrestrial ecosystems: Comparing two contrasting approaches within European climate space, Glob. Ecol. Biogeogr., 10, 621–637, https://doi.org/10.1046/j.1466-822X.2001.t01-1-00256.x, 2001.
Smith, B., Wårlind, D., Arneth, A., Hickler, T., Leadley, P., Siltberg, J., and Zaehle, S.: Implications of incorporating N cycling and N limitations on primary production in an individual-based dynamic vegetation model, Biogeosciences, 11, 2027–2054, https://doi.org/10.5194/bg-11-2027-2014, 2014.
Thakur, D. and Chawla, A.: Functional diversity along elevational gradients in the high altitude vegetation of the western Himalaya, Biodivers. Conserv., 28, 1977–1996, https://doi.org/10.1007/s10531-019-01728-5, 2019.
Thakur, G., Kumar, P., Bhardwaj, D. R., Prakash, P., and Poonam: Dynamics of aboveground vegetation biomass and carbon stocks along the altitudinal gradients and overstorey composition types in the temperate Himalayan region, Trees For. People, 16, 100553, https://doi.org/10.1016/j.tfp.2024.100553, 2024.
Thakur, R. B. and Phulara, N. K. (Eds.): A compendium of tree species of Nepal, 2nd edn., D. K. Agencies (P) Ltd., Kathmandu, Nepal, 375 pp., ISBN 9789937275583, 2014.
Thorne, J. H., Choe, H., Dorji, L., Yangden, K., Wangdi, D., Phuntsho, Y., and Beardsley, K.: Species richness and turnover patterns for tropical and temperate plants on the elevation gradient of the eastern Himalayan Mountains, Front. Ecol. Evol., 10, 1–15, https://doi.org/10.3389/fevo.2022.942759, 2022.
Tito, R., Vasconcelos, H. L., and Feeley, K. J.: Mountain Ecosystems as Natural Laboratories for Climate Change Experiments, Front. For. Glob. Change, 3, 38, https://doi.org/10.3389/ffgc.2020.00038, 2020.
Tsunoda, Y., Tsuda, T., and Ohno, Y.: Influence of stand structure on tree height: A comparative study across 46 species, For. Ecol. Manag., 578, 122474, https://doi.org/10.1016/j.foreco.2024.122474, 2025.
Whittaker, R. H.: Dominance and Diversity in Land Plant Communities: Numerical relations of species express the importance of competition in community function and evolution, Science, 147, 250–260, https://doi.org/10.1126/science.147.3655.250, 1965.
Zhu, L., Zhang, Y., Ye, H., Li, Y., Hu, W., Du, J., and Zhao, P.: Variations in leaf and stem traits across two elevations in subtropical forests, Funct. Plant Biol., 49, 319–332, https://doi.org/10.1071/FP21220, 2022.