
the Creative Commons Attribution 4.0 License.
the Creative Commons Attribution 4.0 License.
 | 24 Jul 2026
Global vegetation responses to wet and dry soil moisture extremes
Xueyan Cheng
Chunhui Zhan
Martin G. De Kauwe
Anke Hildebrandt
Rene Orth
Hydrological extremes are continuing to intensify under climate change. However, the responses of vegetation to dry and wet soil moisture extremes, and the dominant mechanisms of these responses, have not yet been analysed consistently. In this study, we utilized long-term observations of Normalized Difference Vegetation Index (NDVI) as a proxy of vegetation responses to soil moisture extremes. We then analysed related predictors with a machine-learning attribution approach to assess the role of pre-extreme vegetation conditions, characteristics of extremes, and of the environmental background. Vegetation generally loses greenness during dry extremes, indicated by widespread and consistent negative NDVI anomalies. This is mainly modulated by the characteristics of the extreme (especially seasonal timing) and pre-extreme vegetation conditions, which reflect varying vegetation vulnerability. In contrast, wet extremes lead to more heterogeneous responses, including both positive and negative NDVI anomalies. Negative vegetation responses during wet extremes are most consistently associated with pre-extreme vegetation conditions, while environmental background variables such as climate (e.g., long-term mean air temperature, aridity) and topographic variability show comparatively stronger relevance than for dry extremes. Extreme characteristics also contribute substantially, though with greater regional variability than for dry extremes. This illustrates that vegetation response to wet extremes is complex and potentially influenced by different processes. Further, vegetation stress can occur even under relatively less severe extremes when responses are strongly modulated by environmental background conditions, indicating localized vulnerability arising from adverse climatic, soil, or topographic conditions. These results highlight the roles of seasonal timing and of environmental background conditions for impacts of soil moisture extremes on vegetation. This clarifies the predictability of ecosystem responses to hydrological extremes and serves as a basis for related management planning.
- Article
(3693 KB) - Full-text XML
-
Supplement
(3053 KB) - BibTeX
- EndNote


Vegetation function affects the exchange of carbon, water, and energy between the land surface and the atmosphere. When hydrological conditions are outside their normal range, these processes can be disrupted (De Luca et al., 2020). Wet and dry extremes alter plant water availability and can consequently affect vegetation productivity and growth which will induce changes to the land carbon and energy cycles. The frequency and intensity of hydrological extremes are projected to increase, reflected e.g. in the growing seasonal amplitude of precipitation minus evapotranspiration (P-ET) in many regions (Allan, 2023), in rainfall events that are becoming more intense but less frequent (Feldman et al., 2024) and also in drying or wetting soil moisture trends in different regions (Berg et al., 2016). However, their occurrence and impacts vary widely across regions and biomes (De Luca et al., 2020), underscoring the need to understand the regional modulation of larger-scale hydrological patterns.
Dry extremes affect vegetation by inducing water stress, leading to stomatal closure (Knipfer et al., 2020) and decreased carbon uptake. In severe cases, this can lead to tissue damage due to hydraulic failure or carbon starvation (Anderegg et al., 2011; McDowell et al., 2008; Liu et al., 2024; Chen et al., 2025; Humphrey et al., 2021). On the contrary, wet extremes have received far less attention despite their potential to induce comparable stress (Feddes et al., 1988; Famiglietti et al., 2021; Yang et al., 2023; Li et al., 2019). Excessive soil moisture can directly impair vegetation through waterlogging, which can increase susceptibility to pathogens or fungal infections, cause root oxygen deficiency, and limit nutrient uptake (Li et al., 2019). This can lead to leaf shedding and reduced photosynthetic capacity (Kreuzwieser and Rennenberg, 2014). Meteorological conditions which often accompany large precipitation amounts, such as reduced radiation, strong winds, or lower temperatures, can further aggravate vegetation stress (Yang et al., 2023). Consequently, wet extremes can also trigger decreases in greenness (Jiang et al., 2019), a proxy for changes in canopy structure and leaf area.
While the overall relevance of dry and wet extremes for vegetation function is well established, important knowledge gaps remain regarding the spatial variability of their impacts and the mechanisms driving this variability. Existing studies have shown that vegetation responses can differ between regions in terms of the magnitude or even the sign of impacts (Xiao et al., 2025; O and Park, 2024). Insights from previous research particularly on droughts suggest that the characteristics of the dry extremes, including their timing, duration, and severity (Meng et al., 2024; Guisset et al., 2024), can substantially influence vegetation responses. The long-term climatic background and biome types also shape how ecosystems respond to dry extremes by determining their adaptive strategies (Vicente-Serrano et al., 2013; Li and Hu, 2024). In terms of wet extremes, site-level evidence shows that vegetation responses can be more strongly influenced by site-specific factors, such as vegetation type, soil characteristics, and climate conditions, rather than the severity of the extreme event itself (McCormick et al., 2025). Moreover, the vegetation condition prior to the extreme can influence the subsequent vegetation dynamics (so called “carryover effects”) and thus, the response of vegetation during hydrological extremes (Lian et al., 2021). However, it remains unclear to what extent environmental background conditions, characteristics of the extremes (e.g., severity and timing), and pre-extreme vegetation conditions jointly shape vegetation responses across regions and biomes, particularly for wet extremes. In addition, because previous studies have often differed in vegetation and hydrological datasets, extreme definitions, and spatial or temporal scales, directly comparing the dominant predictors of vegetation responses to wet and dry extremes at the global scale remains challenging.
Leveraging long-term Earth observation datasets, we provide here a global, systematic assessment of vegetation greenness responses to both wet and dry soil moisture extremes. We identify the key factors shaping vegetation greenness anomalies across regions for both types of extremes. The identification of influential factors (referred to as predictors in the following) in this study is challenged by inconsistencies among observational datasets and collinearity among considered predictors (Jiang et al., 2024). In order to account for this, we develop an effective machine-learning-based attribution approach that ensures to isolate relevant predictors with the most explanatory power while minimizing collinearity between considered predictors. This way, our approach enables a clearer separation of the roles of environmental background conditions, extreme characteristics, and pre-extreme vegetation conditions.
Specifically, in this study we address three scientific questions: (1) How does vegetation greenness respond to wet and dry soil moisture extremes globally? (2) Which factors drive the spatial variability of vegetation responses during wet and dry extremes? (3) Through which processes do these factors influence vegetation greenness under hydrological extremes?
2.1 Identification of hydrological extremes
Daily soil moisture data from ERA5-Land with a 0.1° resolution from 2000–2023 were used to identify hydrological extremes since soil moisture is directly related to water availability of vegetation (Liu et al., 2020; Muñoz-Sabater et al., 2021). We used the thickness-weighted average soil moisture of the top three layers (0–100 cm) as a proxy for root-zone soil moisture because vegetation responses are more strongly associated with sub-surface than near-surface soil moisture in most regions (Li et al., 2021), and rooting depths commonly exceed the uppermost soil layers across much of the globe (Stocker et al., 2023).
We defined hydrological extremes based on two types of thresholds. (i) The overall threshold was selected as the 5th and 95th percentiles (for dry and wet extremes, respectively) of the entire soil moisture time series. (ii) The seasonal threshold was selected as the 5th and 95th percentiles (for dry and wet extremes, respectively) of the soil moisture of the respective time-of-year. For this purpose, we considered soil moisture data within a 15 d moving window centred on the respective calendar day and across all considered years. Extremes were detected when soil moisture exceeded both thresholds. The combined use of overall and seasonal thresholds ensures that detected events are both rare in the context of the long-term soil moisture distribution and anomalous relative to the typical seasonal conditions. This avoids identifying regularly occurring seasonal dry or wet periods as hydrological extremes.
We considered detected, consecutive extreme events as one event if soil moisture did not recover beyond the 25th or 75th percentiles (for dry and wet extremes, respectively) in between them. This way, not every single day of considered extremes was necessarily exceeding the overall and seasonal thresholds. We also determined the start and end of the identified extremes as the days when soil moisture first crossed the 95th (5th) percentile, and the last day it remained above (below) that threshold (see Fig. S1 in the Supplement as an example of wet extreme identification).
Events shorter than 5 d were excluded to reduce the influence of transient soil moisture fluctuations that are less likely to induce measurable vegetation responses, particularly for processes such as waterlogging stress that require sustained anomalous conditions. To avoid potential effects of frozen soil, we only considered data from days where the mean air temperature of the previous 15 d was above 2 °C. Daily air temperature data used for this purpose were obtained from ERA5-Land.
2.2 Vegetation greenness anomaly during extremes
We utilized Normalized Difference Vegetation Index (NDVI) dataset with a 0.1° resolution from MOD13C1, while considering only data with the best and second best quality levels (Didan et al., 2015). The data comes from time steps of 16 d and we used the same value in each of the 16 d in order to convert the NDVI series to a daily resolution to match the other variables. We used the 16 d NDVI product because it provides comparatively robust and spatially consistent vegetation estimates through the incorporation of multiple observations and strict quality-control procedures within each compositing period (Didan and Barreto, 2019). To exclude the periods when vegetation was inactive, we disregard days with NDVI below 0.1. In order to study the influence of hydrological extremes on vegetation, we considered NDVI anomalies. To calculate anomalies, we removed long-term linear trends and seasonality in each grid cell. The seasonality was removed by subtracting a smoothed calendar day-specific average from the detrended series, which was calculated by a 30 d moving window centred around the considered calendar day to ensure the representative seasonality. Only when there were more than 10 % data available (72 d) in the 30 d moving window across all years, the seasonality was calculated, to make sure the average is representative for the specific time of the year.
2.3 Variables used for attribution of vegetation anomalies
To investigate the variables influencing vegetation greenness during extreme events, we considered three categories of potential predictors (Table S1 in the Supplement):
-
Pre-extreme Vegetation Condition. The vegetation's greenness state before the current extreme event.
-
Extreme Characteristics. Event-specific features such as extreme severity, seasonal timing of the extreme, shortwave radiation, and vapour pressure deficit (VPD) during the extreme.
-
Environmental Background. Grid cell properties including tree cover, short vegetation cover, deciduous vegetation cover, evergreen vegetation cover, aridity index, topography, soil texture, and long-term mean air temperature.
When considering pre-extreme conditions, we did not use the day before the first day of the hydrological extreme, but instead the last 10 d before soil moisture was below the 25th or above the 75th percentile (for dry and wet extremes, respectively) in terms of both the overall and seasonal thresholds. This ensures that pre-extreme conditions are not already affected by the developing extreme. Thereby, the pre-extreme vegetation condition was calculated as NDVI percentiles to ensure comparability across vegetation types and to avoid overlap with NDVI anomalies, which served as the target variable in our analysis. However, only days with soil moisture within the less extreme range were included in this calculation, which means that days with soil moisture exceeding the 75th percentile (for wet extremes) or below the 25th percentile (for dry extremes) were excluded.
Extreme-event severity was quantified using the accumulated anomalies of the water availability index during each extreme. This index was derived from accumulating precipitation (as positive values) and evapotranspiration (as negative values) from the start of every year (Tramontana et al., 2016), where values are capped at zero to mimic runoff. Precipitation was taken from the Multi-Source Weighted-Ensemble Precipitation dataset (MSWEP), and evapotranspiration from the Global Land Evaporation Amsterdam Model (GLEAM 4.1a).
The seasonal timing of each extreme was expressed as the temporal distance between the day of the highest or lowest soil moisture (for wet and dry extremes, respectively) and the day of the peak of the seasonal cycle of NDVI. Negative values were used to represent extremes that happened before the NDVI peak, and positive values for extremes that happened after the NDVI peak.
Mean anomalies of surface shortwave radiation downwards from ERA5-Land represented radiation availability during the extreme, while mean VPD anomalies from ERA5-Land captured atmospheric water demand. Anomalies were calculated by removing the long-term linear trend and seasonal cycle from each variable.
The environmental background was characterized by land cover information from the ESA-CCI Global Plant Functional Types dataset (Harper et al., 2023), which was averaged over the entire available time period. Short vegetation cover was defined as the combined fraction of grassland and shrubland cover. A spatial mask was applied to exclude grid cells that were >50 % non-vegetated, >50 % cropland-dominated, or where tree, shrub, or grassland cover changed by more than 5 % between 2000 and 2022. The aridity index was calculated as the ratio of the long-term mean surface net radiation (converted to mm) to the long-term mean precipitation (Budyko, 1974), both derived from ERA5-Land data for 2000–2023. The standard deviation of elevation from the ETOPO Global Relief Model (NOAA National Centers for Environmental Information, 2022) was used to represent topographic variability, indicating drainage conditions. Soil texture was characterized by the sand fraction from the Harmonized World Soil Database v2.0 (FAO and IIASA, 2023).
2.4 Machine learning-based attribution approach
We employed Random Forest (RF) models to attribute vegetation greenness anomalies during extremes to their influential predictors. The RF framework identifies predictors that are strongly associated with vegetation responses, while mechanistic interpretations are based on existing ecological understanding rather than direct causal inference. The target variable was the mean NDVI anomalies during each extreme event. Although all aforementioned predictors could potentially influence vegetation responses, collinearity among them may bias variable importance estimates (Jiang et al., 2024). To address this, we adopted a predictor selection approach (an example for a specific region is also described in Sect. S1 in the Supplement).
First, we randomly selected subsets of 2, 4, 6, 8, 10, and 12 predictor variables from all 13 variables (see previous section). Subsets of each size were selected up to 400 times randomly, and then analysed with a RF model. For each model, we recorded (i) the out-of-bag (OOB) score expressing the explanatory power of the selected predictor variables, and (ii) the maximum concurvity among individual predictors expressing collinearity, where concurvity (approximated using second-degree polynomial functions) measures the extent to which a predictor can be explained by all other predictors (Jiang et al., 2024). In contrast to correlation measures, concurvity can additionally capture non-linear dependencies among predictors, which is particularly relevant for environmental variables with potentially complex relationships. Across RF models with the same number of predictors, only models with relatively high predictive performance (OOB score above the 70th percentile) and low collinearity among predictors (concurvity below the 30th percentile) were retained (Fig. S2).
In order to select the optimal number of considered predictors, we examined the increase in median OOB score across all retained RF models for a given number of predictors when increasing the number of predictors. Then, the optimal number of predictors was determined as the number where further increases of the OOB score were less than 10 % (Fig. S3). Further, to measure the relevance of each predictor, we counted the number of considered RF models in which it ranked in the top half of all predictors as determined by permutation importance.
We applied the algorithm to all identified wet or dry extremes separately in a climate reference region defined by the Intergovernmental Panel on Climate Change (IPCC) (Iturbide et al., 2020). Only regions with more than 2000 extremes were considered for further analysis to ensure enough samples for the attribution analysis (4 regions were excluded for wet extremes and 7 for dry extremes). And only extremes with negative NDVI anomalies were considered (additional analyses considering any NDVI anomaly response were also performed for test purposes). This was done to specifically isolate vegetation stress responses, as combining positive and negative NDVI anomalies would mix fundamentally different ecological processes and complicate the interpretation of predictor effects. The number of extremes that were retained to do attribution analysis and the amount of models that were finally selected are shown in Fig. S4. The average OOB score and concurvity for the chosen models in each region are shown in Fig. S5 (Fig. S6 is the same, but for models for extremes with both negative and positive NDVI anomalies).
Partial dependence plots (PDPs) were used to investigate the relationship between individual predictor variables and NDVI anomalies during extremes. As representative case studies, the two regions with the most negative NDVI anomalies during wet or dry extremes were selected (Fig. S7) separately.
3.1 Regionally clustered and shorter wet extremes versus widespread and longer dry extremes
Wet extremes are more spatially concentrated, whereas dry extremes occur more broadly and uniformly across regions (cf. Fig. 1a and 1c) and typically last longer (cf. Fig. 1b and 1d). As a result of the combined threshold approach, the detected extremes represent soil moisture that is rare within the long-term record and anomalous for the respective time of year, facilitating consistent comparisons across regions and seasons.
Hotspots of wet extremes are located in the eastern North America (ENA), eastern and southern South America (NES, SES), central and southern Africa (CAF, WSAF, ESAF), and boundary of Tibetan Plateau (TIB) and eastern Asia (EAS) (Fig. 1a). In contrast, dry extremes are more frequent in eastern North America (ENA), eastern and southern South America (NES, SES), and east southern Africa (ESAF), and they broadly affect NDVI across Europe (NEU, WCE, MED) (Fig. 1c). On average, dry extremes persist longer (mean = 34.3 d) than wet extremes (mean = 19.7 d). Because consecutive extreme days were grouped into individual events, spatial differences in event counts also reflect how soil moisture anomalies persist and recur over time. We note that a filter was applied to ensure sufficient NDVI data to represent vegetation responses during multiple phases of each considered extreme event (see Sect. S2). Consequently, spatial differences in the number of retained events also reflect regional differences in NDVI data availability. The most common reason for excluding an event was insufficient NDVI data availability (Fig. S8).
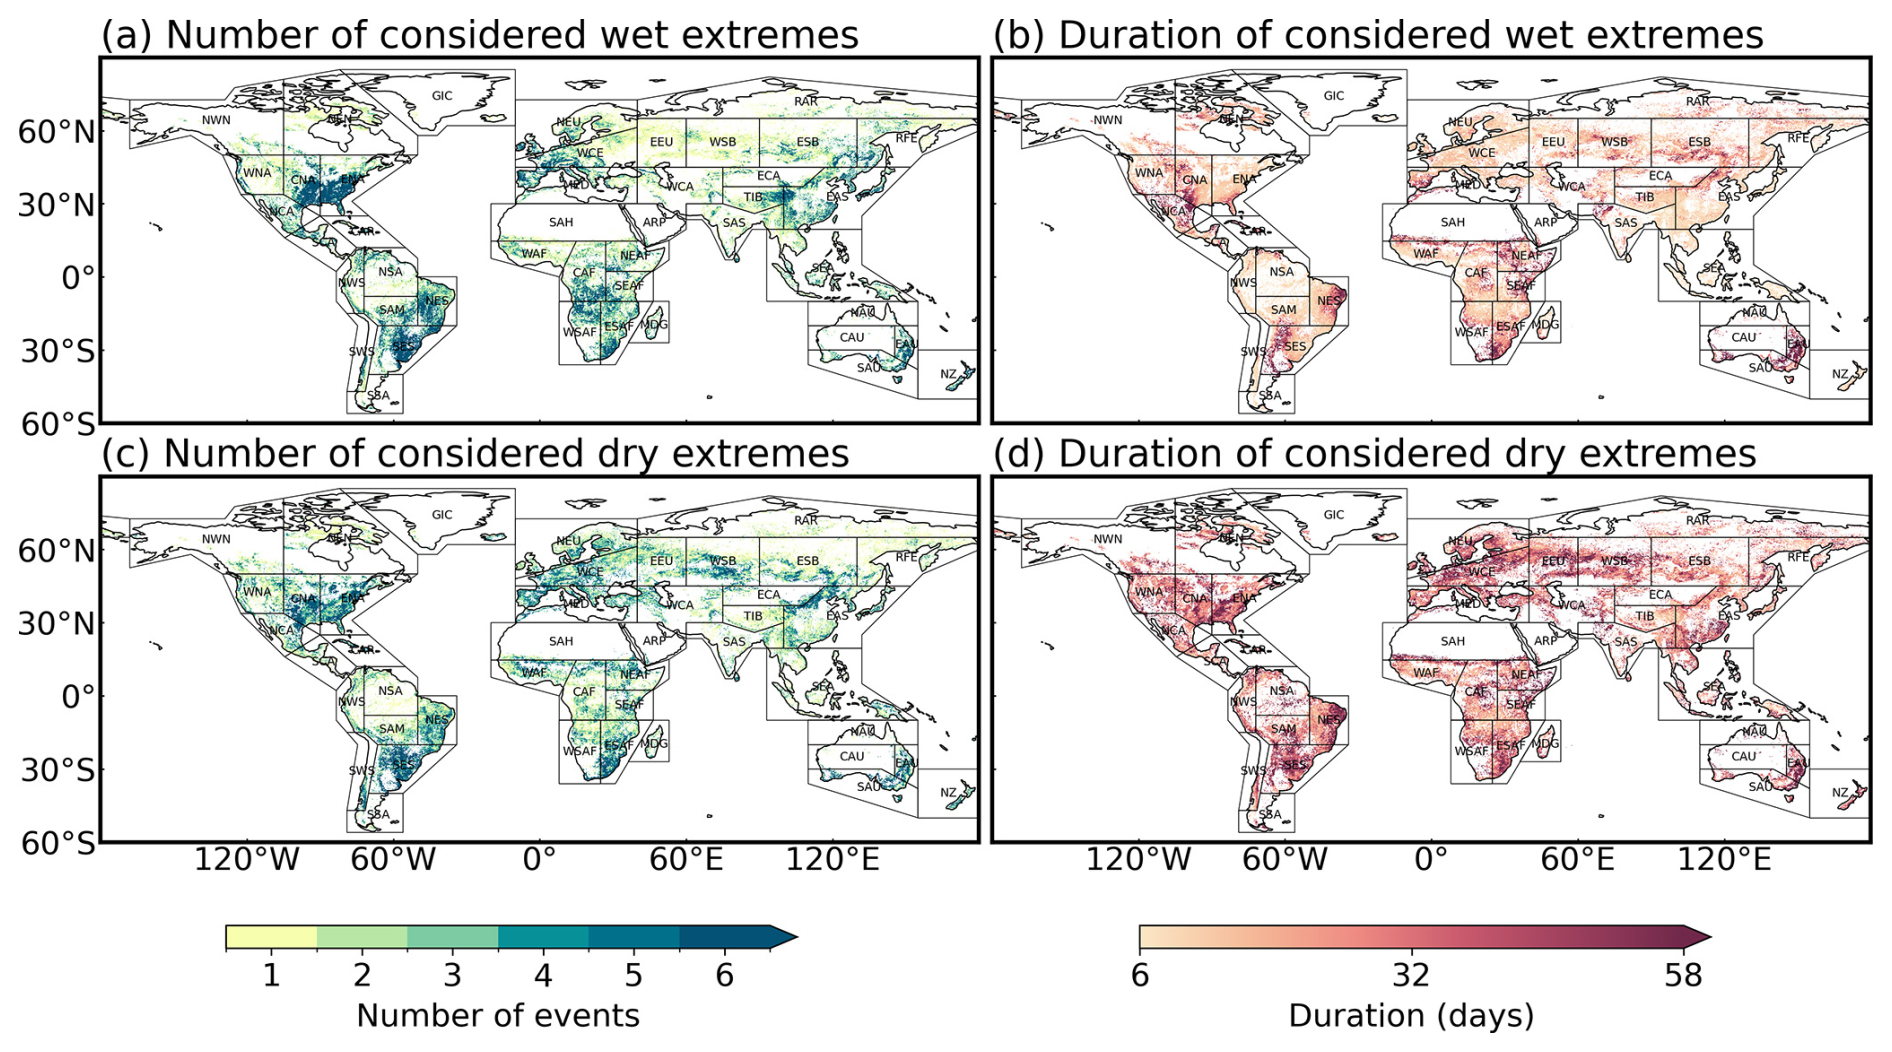
Figure 1Number and average duration of wet and dry extremes during 2000–2023. (a), (b) are for wet extremes and (c), (d) are for dry extremes. The results are coarsened to 0.2° spatial resolution for visualization. Depicted regions are according to the IPCC climate reference regions (Iturbide et al., 2020).
3.2 Vegetation responses to hydrological extremes vary in both magnitude and direction
Vegetation responses to wet and dry extremes can result in either greening or browning, where the same region may respond differently across individual events (Fig. 2). The spatial representativeness of these patterns may vary across regions because events with insufficient NDVI data availability were excluded from the analysis (Fig. S8).
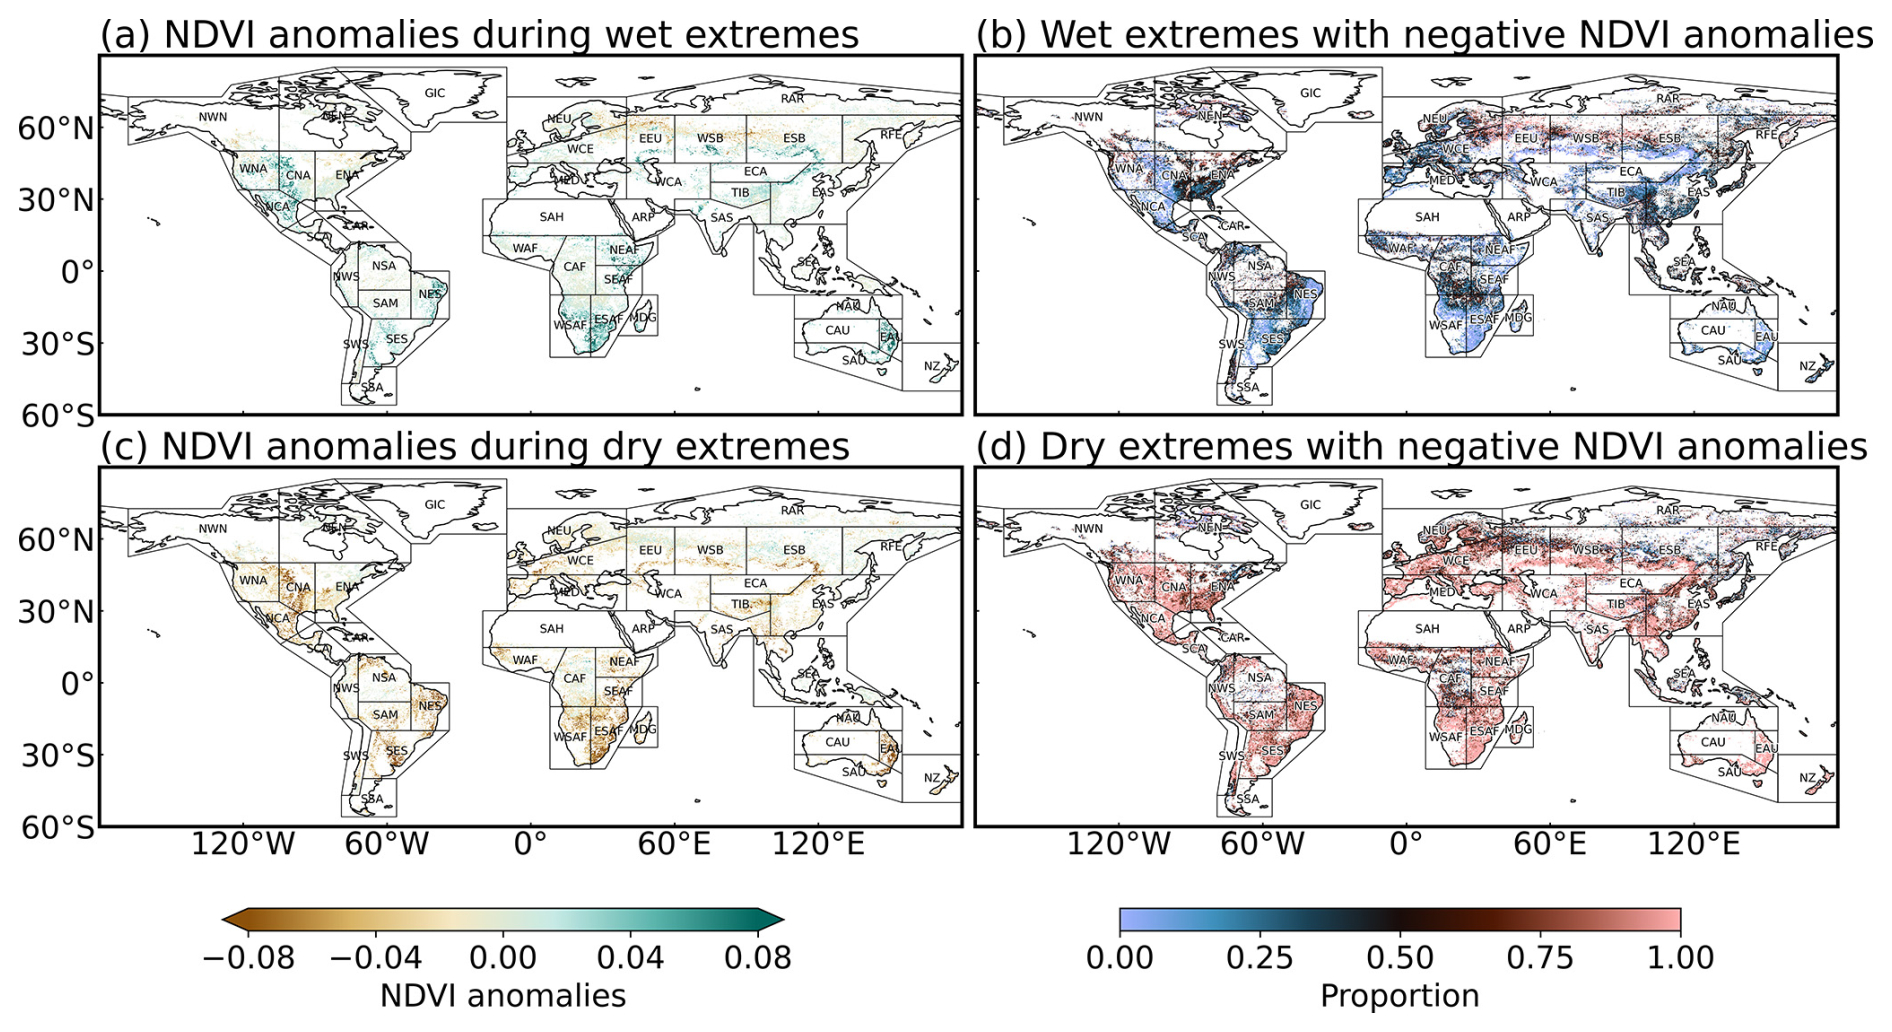
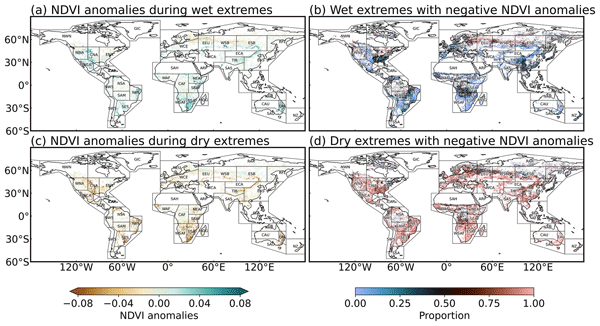
Figure 2Global vegetation response to wet and dry soil moisture extremes. (a, c) Average NDVI anomalies and (b, d) proportion of events causing below-normal NDVI (negative NDVI anomalies) during wet and dry extremes. The results are coarsened to 0.2° spatial resolution for visualization. Spatial representativeness may vary across regions due to differences in data availability and event filtering; corresponding data availability flags are shown in Fig. S8.
On average, the vegetation is greener in most regions during wet extremes. However, distinct browning signals are observed in eastern Europe and the boreal forests of Russia (Fig. 2a). Divergent response direction to wet extremes is particularly pronounced in southeastern North America (ENA), along the eastern coast of Asia (EAS), and within tropical forests (SAM, CAF, SEA), suggesting that many wet extremes can impose stress on vegetation. During dry extremes, vegetation generally exhibits browning, and the direction of response is more consistent than during wet extremes. Nonetheless, positive NDVI anomalies are observed in high-latitude regions of the Northern Hemisphere and in central Africa (Fig. 2c), which may be because of the concurrent warmer and sunnier conditions. A part of the spatial heterogeneity of vegetation responses is associated with differences in vegetation types: short vegetation, including shrublands and grasslands, shows larger-magnitude average NDVI anomalies during extremes than tree-dominated systems (Fig. S9), indicating greater sensitivity of short vegetation to soil moisture extremes.
It is worth noting that NDVI losses during dry extremes may also reflect wildfire effects in regions prone to fire activity (e.g., eastern South America, boreal forest in Russia and eastern Australia), as dry conditions facilitate ignition and spread. However, the spatial pattern of NDVI anomalies does not exactly mirror global burned-area distributions (Moritz et al., 2014), suggesting that the detected response primarily reflects vegetation stress under soil moisture deficits rather than fire disturbance.
While Fig. 2a and c provide an overview of mean vegetation responses, the low consistency of NDVI anomalies across individual events in regions such as eastern North America (ENA), central Africa (CAF) for wet extremes (Fig. 2b) and boreal forests in Eurasia for dry extremes (NEU, EEU, WSB) (Fig. 2d) highlights that even under similar environmental conditions, vegetation responses to hydrological extremes can differ substantially. The regional distributions of NDVI anomalies further illustrate this heterogeneity and the coexistence of positive and negative responses within most IPCC regions (Fig. S7). In particular, the highly inconsistent response direction observed in boreal and tropical forests underscores the complex and context-dependent nature of vegetation responses in these ecosystems.
3.3 Factors influencing vegetation responses to hydrological extremes
Vegetation responses to both wet and dry extremes are jointly shaped by pre-extreme conditions, extreme characteristics, and environmental background in all regions. At the same time, the relevance of these factors differs regionally (Fig. 3).
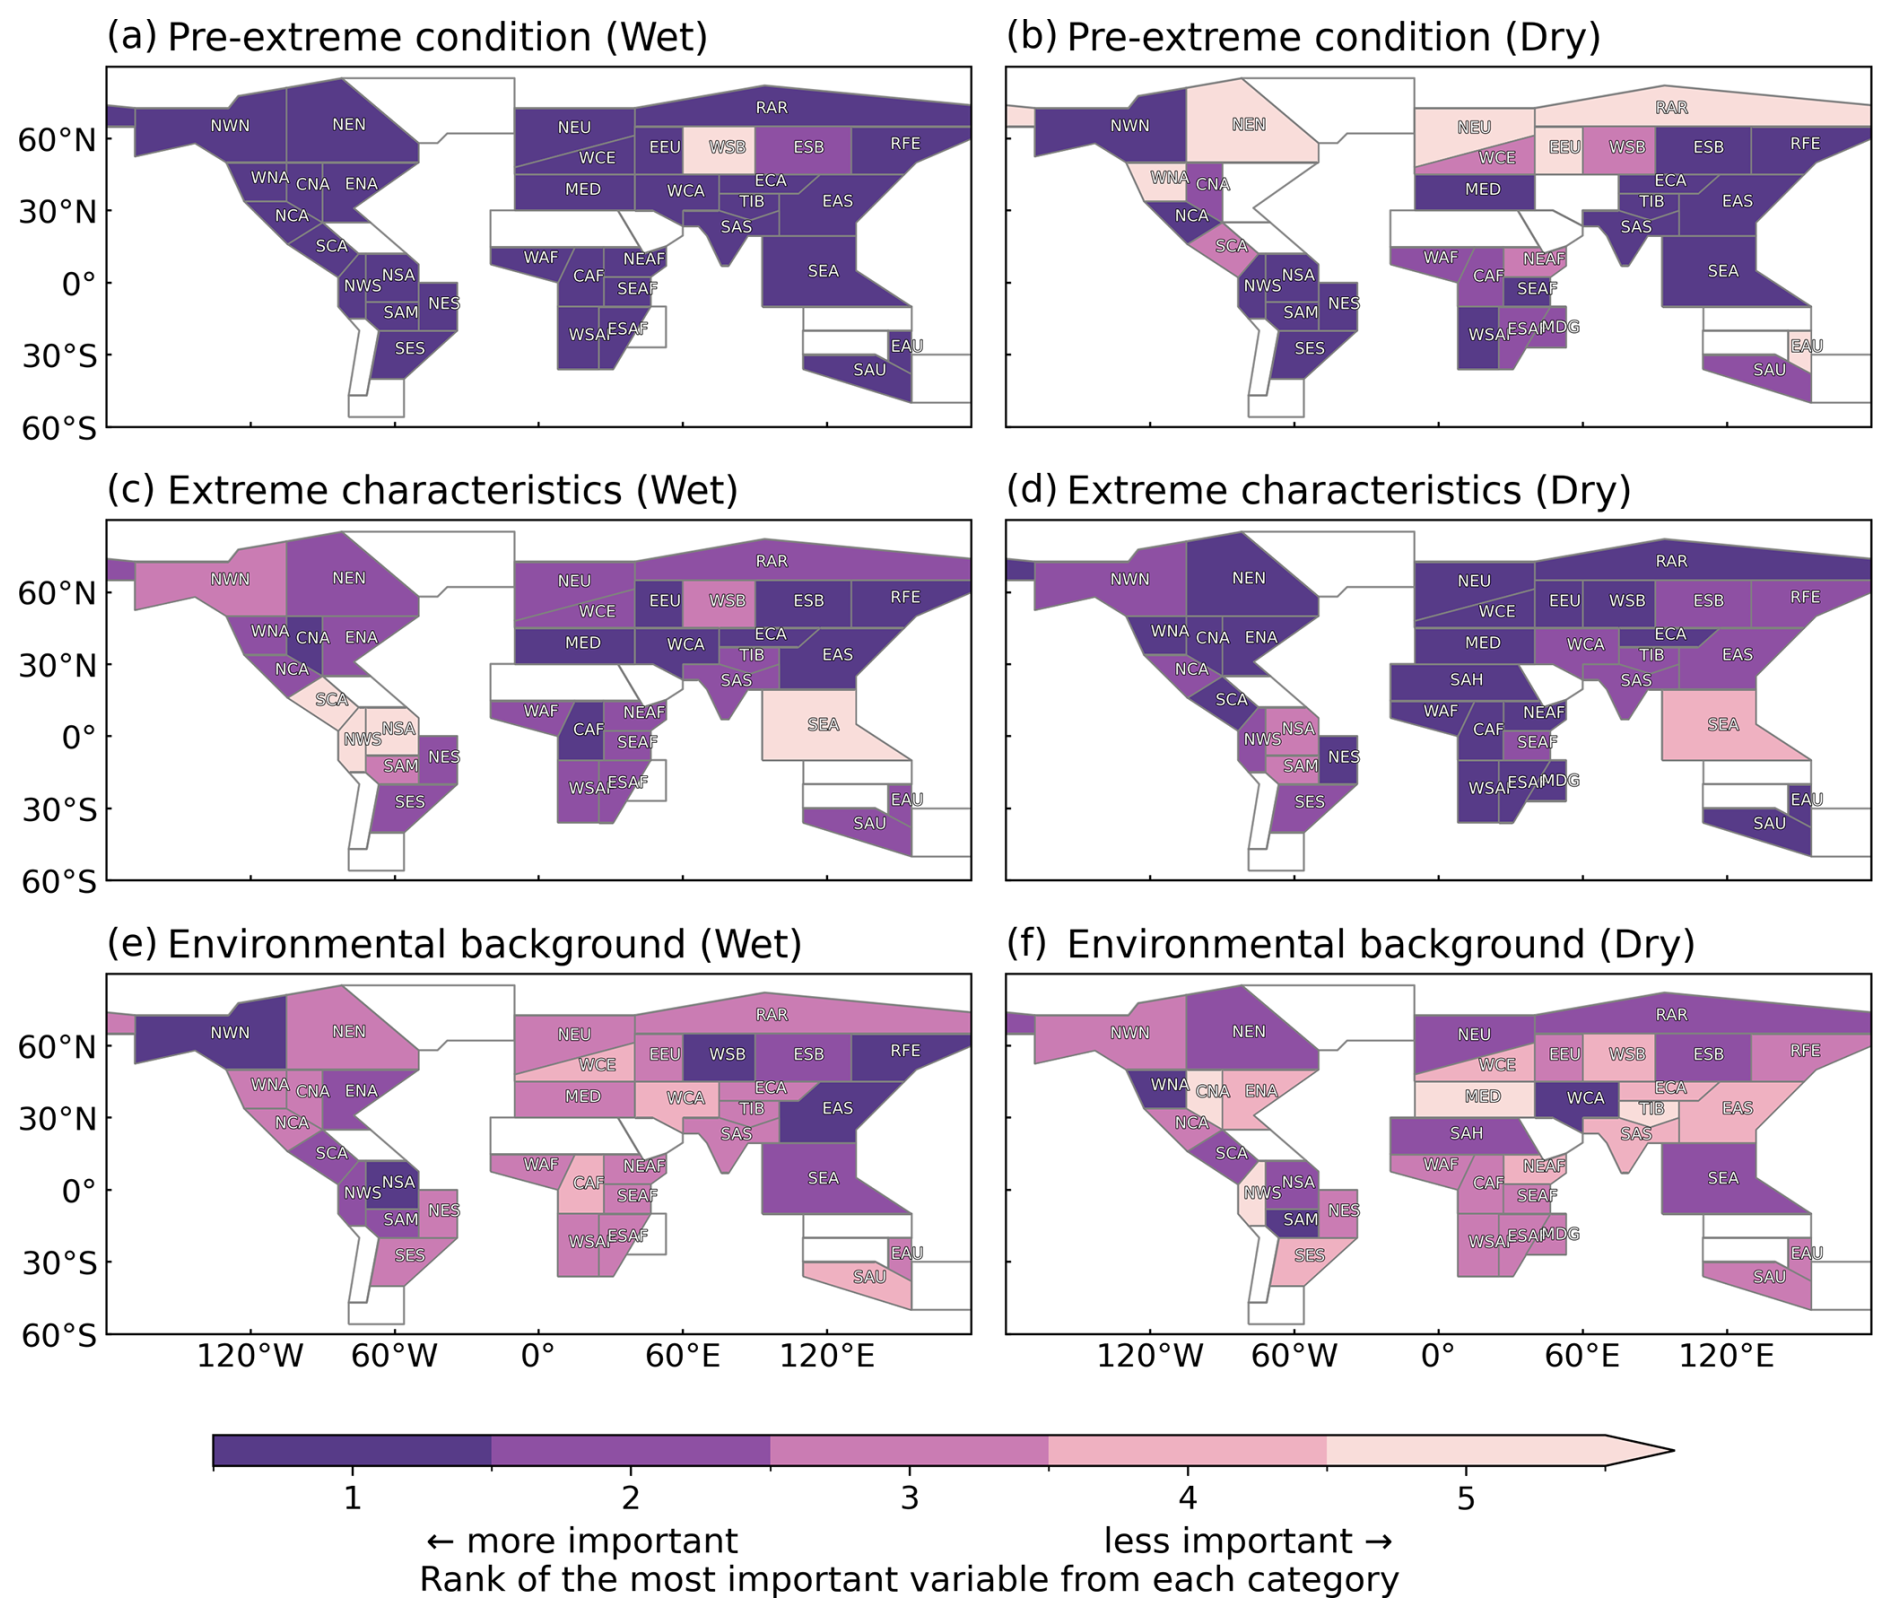
Figure 3Relevance of pre-extreme vegetation condition, extreme characteristics and environmental background for negative vegetation responses to (a, c, e) wet and (b, d, f) dry events. Relevance is expressed as the rank of the most important variable for explaining vegetation greenness anomalies during extremes from each category. The top variables are ranked across categories. Note that each category contains a different number of variables and the attribution is based only on extremes with negative NDVI anomalies (see Table S1 and Sect. 2.3).
Pre-extreme conditions emerge as the dominant factor explaining negative NDVI anomalies during wet extremes across most regions (Fig. 3a). They are also important for dry extremes, though their influence is weaker in high-latitude regions of the Northern Hemisphere (Fig. 3b). This highlights the critical role of pre-extreme vegetation conditions in modulating ecosystem responses to hydrological extremes.
Extreme characteristics, including extreme severity, timing, energy availability, and atmospheric water demand, constitute the most influential category for explaining negative NDVI anomalies during dry extremes (Fig. 3d). These variables also substantially affect vegetation responses during wet extremes, ranking as the first or second most important factor in most regions, except in specific tropical forests, such as those in southeastern Asia (SEA) and northern South America (NSA) (Fig. 3c).
Environmental background generally plays a less important role compared to the other two categories. However, the influence of environmental background is stronger (or equal) in 14 (12) out of 34 regions for wet extremes than for dry extremes. Moreover, environmental background becomes more relevant when considering only negative NDVI anomalies. For wet extremes, its relevance increases compared with analyses including both positive and negative responses in most regions (cf. Figs. 3e and S10e). A similar pattern appears for dry extremes (cf. Figs. 3f and S10f), though the effect is less spatially extensive than for wet extremes. This suggests that environmental background conditions modulate vegetation vulnerability to hydrological extremes and can provide valuable context for anticipating vegetation stress.
Overall, pre-extreme vegetation conditions and extreme characteristics constitute the two most influential categories across most regions, while environmental background generally plays a secondary but regionally important role, particularly for negative vegetation responses during wet extremes.
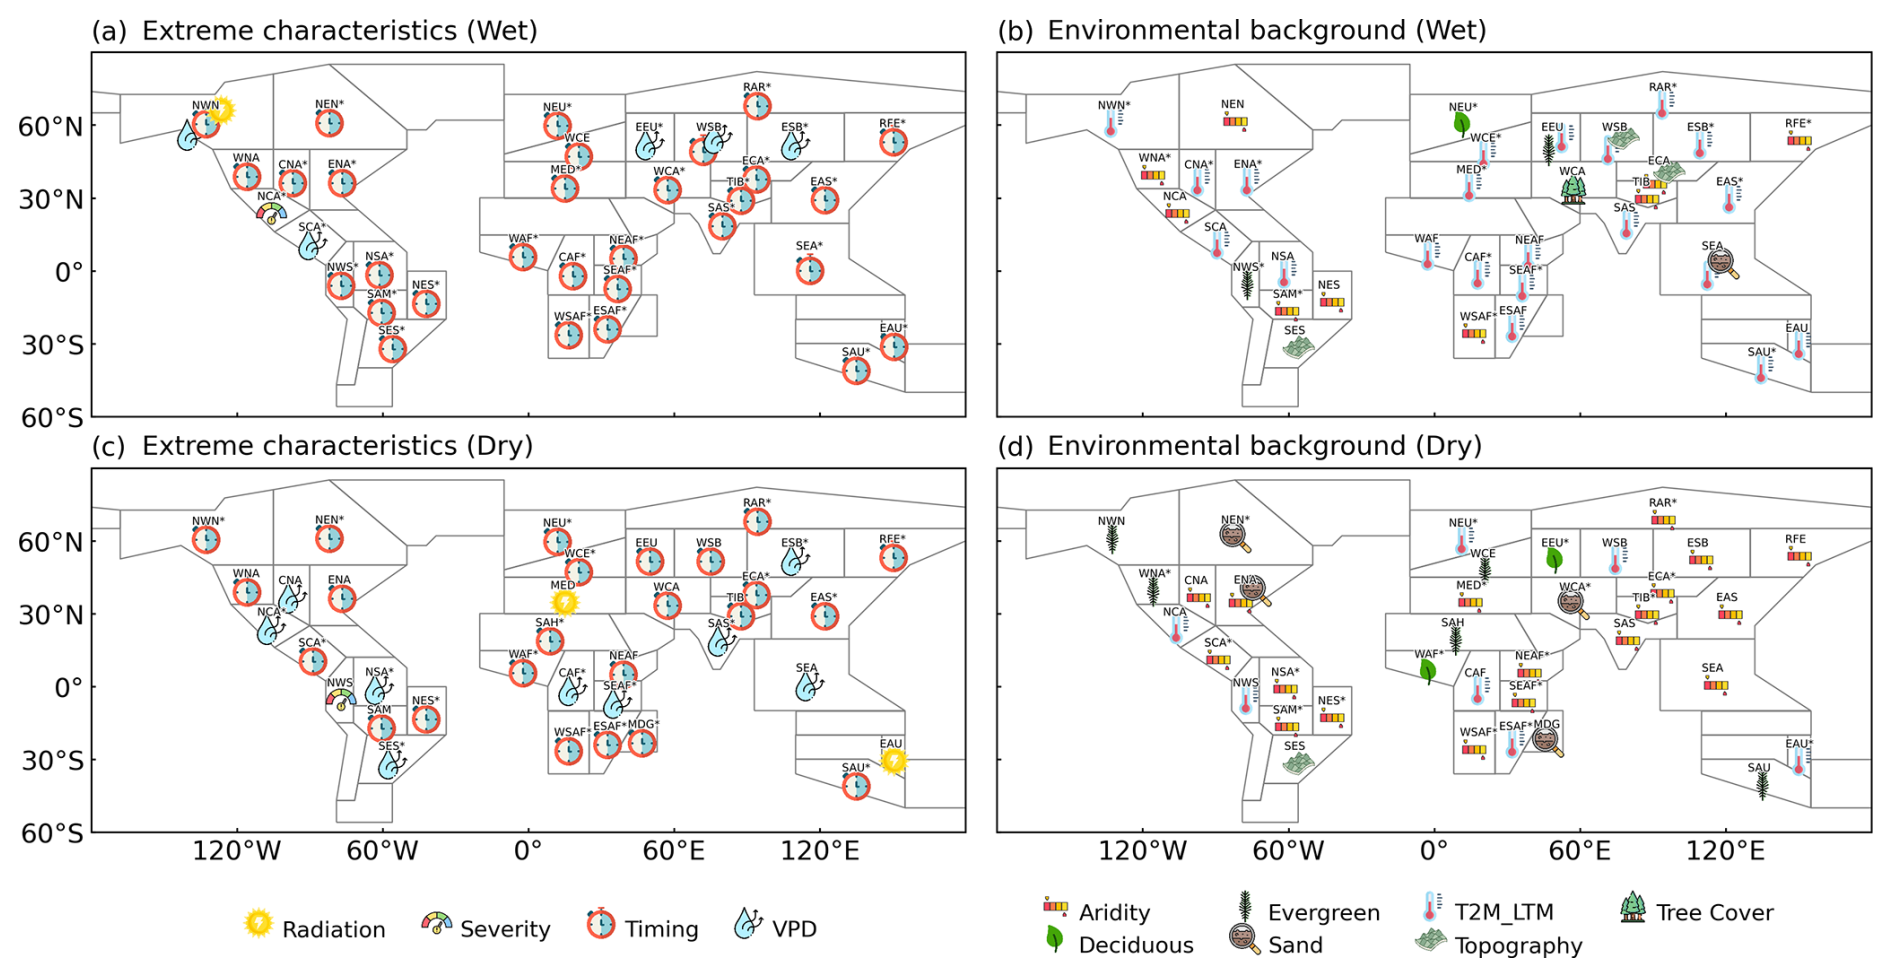
Figure 4Most relevant variables for negative vegetation responses during wet (a, b) and dry (c, d) extremes in terms of extreme characteristics and environmental background. Multiple variables are shown in case their relevance is the same according to the ranking. The asterisk next to each region label indicates that the most relevant variable was selected at least 50 % more frequently than the second most relevant variable within that category. Note that the attribution analysis is based only on extremes with negative NDVI anomalies.
We further show the leading variable within each category (extreme characteristics and environmental background) in Fig. 4. Timing of extremes (i.e., the temporal distance between the highest (lowest) soil moisture day for wet (dry) extremes and the day of seasonal NDVI peak) emerges as the most dominant factor from all extreme characteristics that drives negative NDVI anomalies during both wet and dry extremes. For dry extremes, VPD also exerts a stronger influence in tropical regions, whereas for wet extremes, it becomes more important in high-latitude areas. Among environmental variables, long-term mean air temperature is most influential during wet extremes in more regions (Fig. 4b), while aridity dominates for dry extremes (Fig. 4d). Other factors, such as vegetation type (deciduous or evergreen vegetation ratio), soil texture (proportion of sand), and topography (topographic variability), also play notable but regionally confined roles.
The global distributions of dominant factors are similar between the wet and dry extremes when considering both positive and negative NDVI responses to extremes (Fig. S11). For example, aridity explains whether vegetation greenness increases or decreases during a wet extreme, therefore becoming more pronounced when both response directions are included (Fig. S11b).
The robustness and interpretability of these regional attribution patterns depend on the explanatory performance of the RF models and the degree of concurvity among the selected predictors (Fig. S5). The average OOB scores of the selected RF models across all regions ranged from 0.22 to 0.62 (SD = 0.11), while the average concurvity values ranged from 0.23 to 0.66 (SD = 0.11). RF model performance varied across IPCC regions and between wet and dry extremes. Lower OOB scores and higher concurvity values were generally found in regions with relatively fewer retained events, such as Eastern Central Asia (ECA) for wet extremes and Russian-Arctic (RAR) for dry extremes (Fig. S4). Lower explanatory power was also observed in regions where vegetation responses to hydrological extremes were comparatively weak or spatially heterogeneous, such as Western Africa (WAF) for wet extremes and Central Africa (CAF) for dry extremes (Fig. 2). In contrast, regions with stronger and more spatially coherent NDVI anomalies during extremes generally showed higher OOB scores and lower concurvity among predictors. Overall, OOB scores were slightly lower for wet extremes than for dry extremes, consistent with the more heterogeneous vegetation responses observed during wet extremes. Nevertheless, the RF models generally retained moderate-to-high explanatory power and low-to-moderate concurvity across most regions, indicating that the identified attribution patterns are robust and that the selected predictors capture meaningful variability in vegetation responses to hydrological extremes.
3.4 Regional case studies of dominant predictors on vegetation responses to extremes
We performed a case study analysis of the relationships between the NDVI response and the identified most relevant predictors in the two regions with the most negative NDVI anomalies during wet and dry extremes, respectively (Fig. 5). For wet extremes, the most affected regions are Eastern Europe (EEU) and Northern Europe (NEU), while for dry extremes, they are Eastern Australia (EAU) and Eastern South Africa (ESAF) (Fig. S7). Although vegetation responses to wet extremes are regionally heterogeneous and can include both positive and negative NDVI anomalies, EEU and NEU also exhibited relatively high proportions of wet extremes associated with vegetation browning (53 % in EEU and 46 % in NEU), supporting their selection as representative case-study regions.
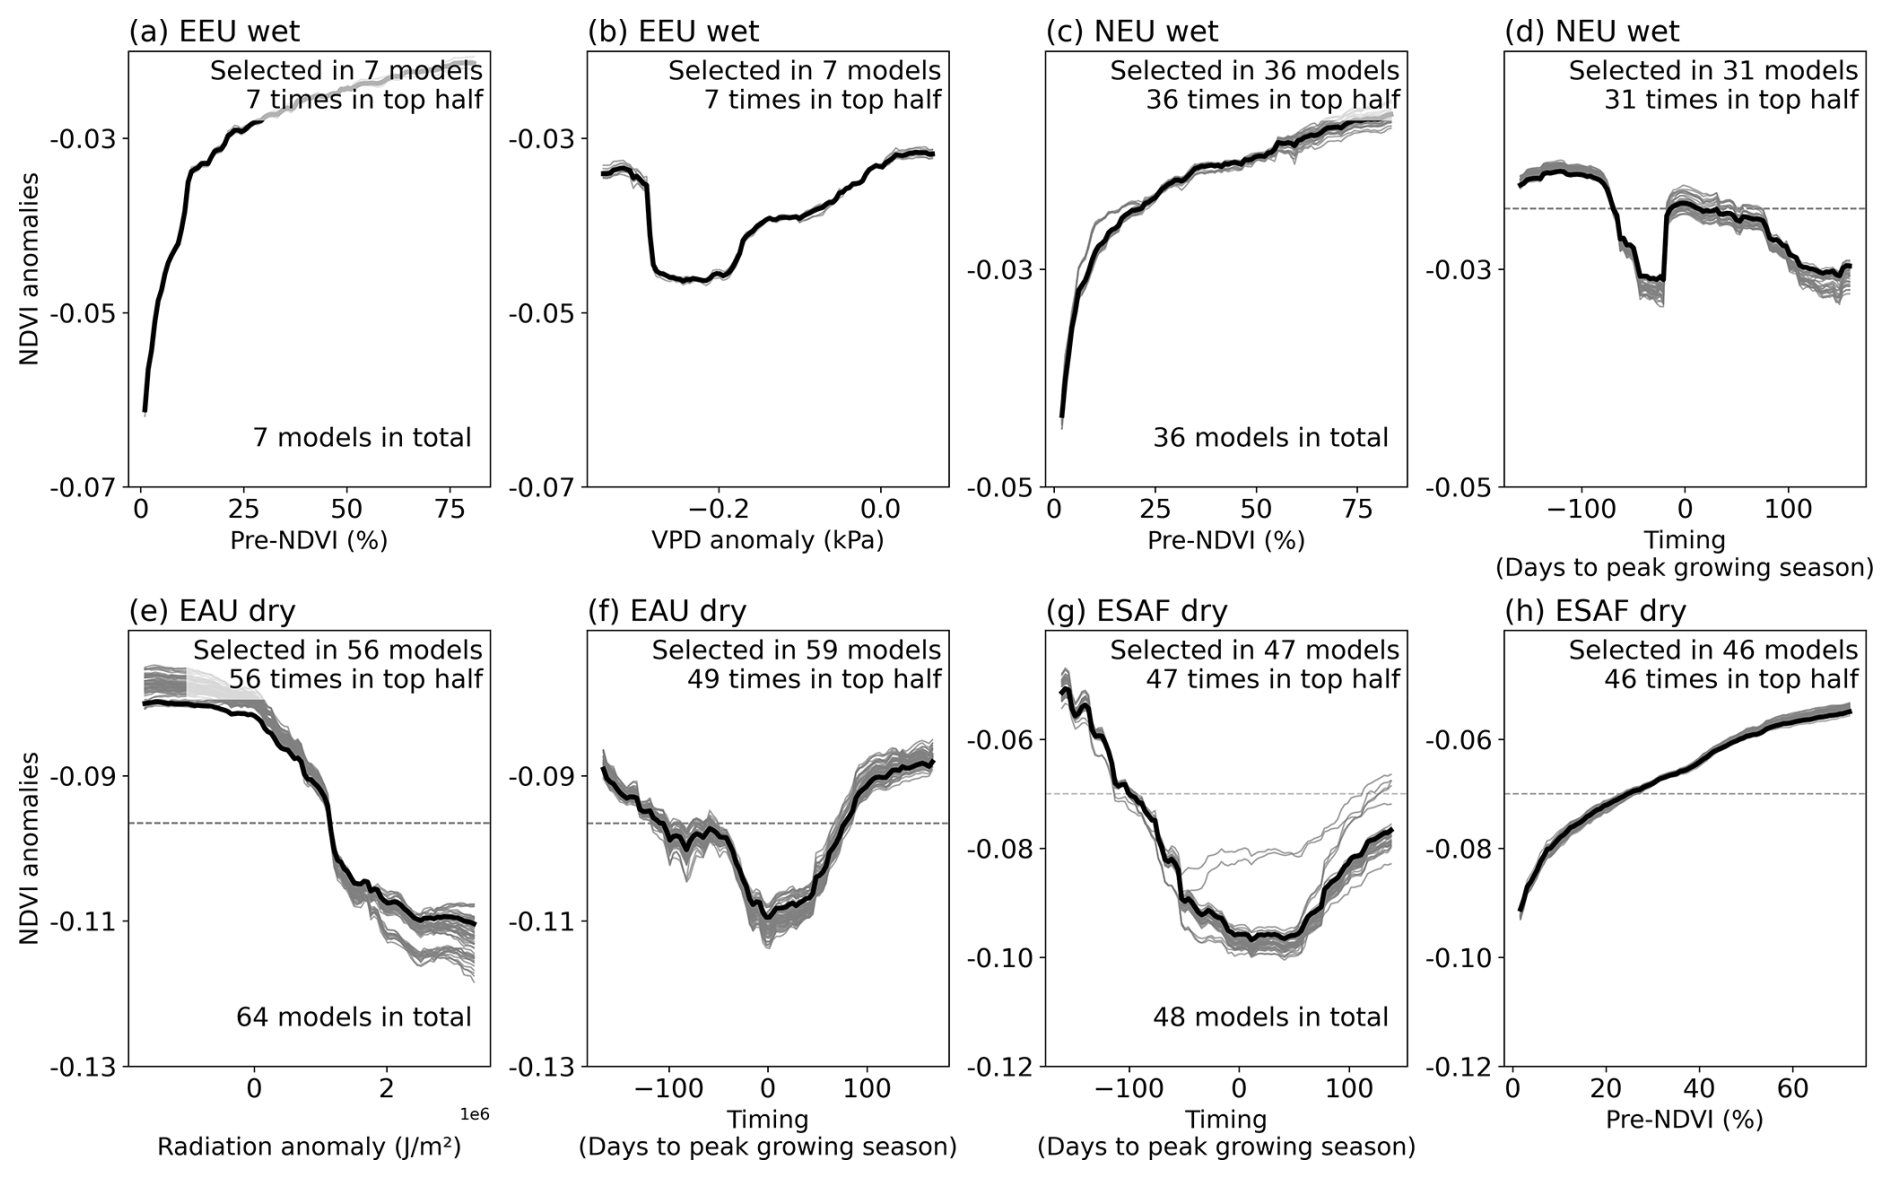
Figure 5Relationships between vegetation response and two most relevant predictor variables during wet and dry extremes, shown as partial dependence plots. Results are presented for the two regions with the most pronounced negative NDVI anomalies for dry and wet extremes, respectively. They are Eastern and Northern Europe (EEU, NEU) for wet extremes, and Eastern Australia (EAU) and Eastern South Africa (ESAF) for dry extremes (see detailed rankings in Figure S7). Each panel indicates the total number of Random Forest models meeting the criteria of relatively low collinearity and high explanatory power, along with the frequency with which the displayed variables were selected and ranked in the top half. Gray lines show partial dependence relationships from individual random forest models, while the bold black line represents the mean response across all models. The horizontal line denotes the mean NDVI anomaly from models excluding the target predictor.
Higher pre-extreme NDVI percentiles, which indicate greener vegetation conditions before the event, are associated with less negative NDVI anomalies during both types of extremes (Fig. 5a, c, h). Further, vegetation tends to experience more negative NDVI anomalies when extremes occur near the peak of the growing season (i.e., when timing is around 0 in Fig. 5d, f, g). Moreover, higher VPD during wet extremes (Fig. 5b) and lower solar radiation (Fig. 5e) during dry extremes correspond to less negative NDVI anomalies, highlighting that atmospheric water demand and energy availability jointly modulate vegetation responses to soil moisture extremes.
Vegetation greenness responses to dry extremes consistently lead to widespread negative NDVI anomalies, while responses to wet extremes are more divergent, exhibiting both negative and positive NDVI anomalies across regions. These patterns reflect differences in the factors shaping vegetation response to extremes. Our attribution results show that environmental background conditions, particularly long-term mean air temperature, aridity, and topography, play a substantially stronger role in explaining negative NDVI anomalies during wet extremes than in explaining both negative and positive NDVI anomalies, while dry-extreme responses are more tightly linked to the characteristics of the extremes themselves. The global perspective applied in our study provides a foundation for identifying regions where ecosystems are most vulnerable and for understanding why similar extremes can generate divergent vegetation outcomes across biomes and climatic contexts. In this section we discuss some specific aspects and implications related to our results.
4.1 Divergent vegetation responses to wet and dry extremes
Wet extremes exhibit shorter durations and more spatially concentrated patterns than dry extremes. They are typically associated with precipitation events and therefore often occur as short-lived pulses, because excess soil moisture can rapidly dissipate through drainage and evapotranspiration once rainfall ceases. In contrast, dry extremes tend to persist longer because soil moisture deficits accumulate gradually over time, consistent with previous findings (Zolina et al., 2013; Breinl et al., 2020). Spatially, dry extremes are generally more widespread, reflecting their strong association with large-scale circulation anomalies and enhanced atmospheric evaporative demand (Zhou et al., 2019). Wet extremes, by contrast, are closely linked to precipitation-event characteristics, including event frequency, intensity and spatial distribution, which can vary substantially across space and contribute to context-dependent vegetation responses (Feldman et al., 2024). Together with local differences in soil drainage and water-storage capacity, this event-scale variability can lead to more spatially variable wet conditions and helps explain the more regionally heterogeneous vegetation responses observed during wet extremes.
Notably, vegetation responses during wet and dry extremes include both greening and browning in different regions, in agreement with earlier global-scale assessments (Famiglietti et al., 2021). By explicitly quantifying the relative proportions of positive and negative NDVI responses across similar events (Fig. 2b), we further identify regions where vegetation is prone to suffer from excess or deficient soil moisture. The divergent response directions underscore the need for attribution analysis to disentangle their dominant predictors for both extremes.
4.2 Different dominant predictors of vegetation response to wet and dry extremes
Wet and dry extremes trigger fundamentally different functional responses in vegetation. During wet extremes, excess soil moisture alters soil aeration, reduces oxygen availability to roots, impairs nutrient uptake (Bailey-Serres and Voesenek, 2008) and further influences the hydraulic conductance of roots and causes dehydration of plants (Haverroth et al., 2025). These responses unfold gradually and depend on how water accumulates, drains, and interacts with vegetation traits, resulting in vegetation responses that vary widely across space. By contrast, dry extremes can impose moisture limitation: reduced water supply and increased demand lead to stomatal closure, which can ultimately result in hydraulic failure and carbon starvation (McDowell et al., 2008). Because this pathway is more direct and occurs on shorter timescales, vegetation responses to drought are generally more uniform (Fig. 2d) and closely tied to the timing and severity of the water deficit (Fig. 4c).
These mechanistic differences explain why environmental background exerts a stronger influence on vegetation responses during wet extremes in some regions. The consequences of excess moisture depend heavily on factors such as drainage capacity (linked to soil texture and topography), climatic constraints on evapotranspiration, and the thermal environment that shapes recovery potential (reflected in long-term mean air temperature and aridity). Vegetation cover types and conditions also modify how strongly waterlogging affects root functioning, leading to divergent greenness responses (Fig. S9). In contrast, the direct water-stress exerted by dry extremes leaves less room for background conditions to mediate the impacts. Vegetation responses primarily reflect the characteristics of the dry extreme itself. As a result, wet-extreme responses are substantially more heterogeneous across regions than dry-extreme responses, because the ecological consequences of excess soil moisture are more strongly modulated by local environmental conditions. This distinction clarifies our finding that environmental background and pre-extreme vegetation conditions explain more variability in wet-extreme responses than in dry-extreme responses.
Moreover, it is important to note that wet extremes in this study are defined relative to the local soil moisture climatology and overall records, representing periods that are wetter than usual for each grid cell. Consequently, in arid or semi-arid regions, wet extremes may not actually saturate the soil, but can instead provide a crucial water supply to vegetation, leading to positive NDVI anomalies. In such regions, the direction and magnitude of the vegetation response to wet extremes therefore depend on environmental background factors such as aridity and long-term mean air temperature, which together determine whether additional soil moisture alleviates water limitation or induces waterlogging stress. This context-dependence explains why pre-extreme conditions and background variables emerge as more relevant for wet extremes. In contrast, although dry extremes are also defined relative to local climatology, NDVI anomalies tend to be consistently negative during dry extremes even in humid or temperate ecosystems (Vicente-Serrano et al., 2013), especially in those areas with more short vegetation (Walther et al., 2019). As a result, while wet extremes can either alleviate or exacerbate stress depending on background conditions, dry extremes predominantly induce water stress across most environments.
4.3 Implications for extreme impact prediction and regional adaptations
Overall, our results indicate differences in the predictability of NDVI outcomes of hydrological extremes in different regions. This is expected to be high in the case of a dominant influence of environmental background conditions for modulating the vegetation response, because these background conditions are known in advance. The predictability is expected to be medium in the case of dominant pre-extreme vegetation conditions which are known before the actual start of an event but have to be monitored continuously. Relatively low predictability is expected when extreme characteristics dominate the vegetation response.
In terms of dry extremes, there is considerable spatial overlap between areas that show pronounced negative NDVI anomalies (Fig. 2c), regions where the magnitude of greenness loss is strongly driven by extreme characteristics (Fig. 3d), and areas projected to face increasing agricultural and ecological drought exposure (IPCC, 2023). This applies to western North America (WNA), western and Mediterranean Europe (WCE, MED), central and eastern Asia (WCA, ECA, EAS), northeastern South America (NES), western and southern Africa (WAF, WSAF, ESAF) and southern Australia (SAU). Specifically, the timing of individual extremes is the most relevant characteristic to determine the impacts. Consequently, improving early-warning systems, seasonal forecasts, and drought monitoring will be essential for reducing ecological losses because of dry extremes in these regions.
For wet extremes, vegetation responses are more strongly shaped by environmental background across a larger portion of the globe. Regions in which the magnitudes of negative NDVI anomalies during wet extremes depend mostly on long-term climatic, soil, and land-cover conditions should receive particular attention, because these background characteristics largely determine vegetation vulnerability to excess soil moisture. This is evident in Northwestern North America (NWN), Northern South America (NSA), Western Siberia (WSB) and Southeastern Asia (SEA), where the magnitudes of negative NDVI anomalies during wet extremes show strong dependence on long-term mean air temperature, topography and soil texture, which constrains drainage and shapes soil waterlogging risk. These results highlight that in many regions the susceptibility to wet extremes arises from inherent environmental constraints, implying that vegetation stress can occur even under moderate events because drainage capacity or rooting conditions are limiting. Consequently, environmental background variables offer a promising basis for predicting regional tolerance to waterlogging and for prioritizing areas where excess moisture poses increasing risks (McCormick et al., 2025).
In addition, our results emphasize the importance of the timing of extremes and pre-extreme vegetation conditions. Early-growing-season wet extremes often cause more substantial reductions in greenness than late-growing-season events, particularly in colder regions where excess soil water coincides with low temperatures and thus are more detrimental (Jørgensen et al., 2019). Conversely, drought events occurring anytime within the growing season tend to reduce greenness, although the magnitude remains influenced by the pre-extreme vegetation condition. This is consistent with previous findings showing that preceding vegetation states are strongly correlated with current vegetation states and can exert influences that coincide with, or even exceed those of concurrent climatic drivers – a phenomenon commonly referred to as the carryover effect (Lian et al., 2021). These findings underscore that evaluating vegetation responses to hydrological extremes should account for both pre-extreme vegetation conditions and extreme timing (Meng et al., 2024), as neglecting these factors may bias estimates of vegetation sensitivity and obscure regional differences in extreme impacts. Evaluations of terrestrial biosphere models highlight the necessity to better represent the processes that govern how water stress and phenology interact (De Kauwe et al., 2017). Considering that seasonal timing is a key determinant of extreme impacts, improving model representations of phenological sensitivity would allow future projections to more accurately capture the timing-dependent pathways. Our findings provide an important foundation for guiding these developments and for benchmarking next-generation models that explicitly account for timing and pre-extremes vegetation conditions as drivers of ecosystem resilience.
4.4 Future directions
This study identifies wet and dry soil moisture extremes relative to the local climatology and overall records at each grid cell. This percentile-based framework is well-suited for global analysis, but it does not necessarily capture absolute hydrological thresholds of vegetation's response to extremes such as root-zone waterlogging or imply that all detected events correspond to ecologically stressful conditions (Smith, 2011). Accurately characterizing such absolute extremes remains challenging at large scales due to limitations in root depth representation and soil moisture retrieval accuracy. The analysis in this study is based on the ERA5-Land soil moisture dataset. While it provides a consistent global perspective, future work could explore additional datasets or ensemble approaches to further assess the robustness of the results and incorporate emerging datasets and modelling approaches that better resolve root-zone saturation dynamics and waterlogging processes (Stocker et al., 2023). In addition, the NDVI data used in this study are based on 16 d composite products that were temporally interpolated to daily resolution to align with daily soil moisture extremes. This interpolation may smooth short-term vegetation dynamics and introduce uncertainties in the timing and magnitude of rapid responses. As a result, fine-scale variability in vegetation responses may be dampened, and the exact alignment between NDVI and extreme events should be interpreted with a degree of caution. Future work could benefit from vegetation products with higher effective temporal resolution that combine frequent observations with robust quality screening and uncertainty characterization. This would help better capture rapid vegetation responses during hydrological extremes while accounting for known challenges in optical vegetation records, including cloud contamination, atmospheric effects and temporal gap filling. Future work could also benefit from emerging indicators of vegetation functioning, such as solar-induced chlorophyll fluorescence (SIF), once sufficiently long observational records become available.
Plant functional type proportions were used to represent vegetation types in this study, which provides an appropriate and widely applied basis for global-scale attribution. However, aggregating classifications inevitably smooths local heterogeneity in species composition and structural traits that influence hydrological sensitivity. And variations in plant functional types are only considered across space in our study, and not across time, which may lead to an underestimation of their relevance. Future work could benefit from incorporating continuous vegetation metrics with both higher spatial and temporal resolution to better capture variation in different vegetation strategies in terms of responding to hydrological extremes.
Our finding that higher pre-extreme NDVI is associated with less negative NDVI anomalies suggests that pre-extreme vegetation conditions may influence short-term resistance to both wet and dry extremes. While this study focused on in-event greenness anomalies, future research could extend this perspective by explicitly quantifying vegetation resistance (Zhang et al., 2025) and recovery trajectories (Wang et al., 2025) following both types of extremes. Such analyses could deepen understanding of post-extreme legacy effects (Jiang et al., 2019), including hydraulic impairment, reduced root function, or delayed phenological responses.
In this study, we provide for the first time a global assessment of vegetation greenness responses to wet and dry extremes within a consistent framework. Dry extremes consistently reduce NDVI across most regions while responses to wet extremes are more heterogeneous, with both greening and browning observed. This variability arises because wet extreme impacts depend more strongly on pre-extreme vegetation conditions and environmental background, highlighting a more context-dependent response pathway.
Regions in which wet extreme responses depend heavily on environmental background need more attention, because local climatic, soil, and topographic conditions can amplify vegetation stress even during relatively moderate events. These regions include Northwestern North America (NWN), Northern South America (NSA), Western Siberia (WSB) and Southeastern Asia (SEA). The high relevance of pre-extreme vegetation conditions and timing of extremes for both types of extremes underscores the necessity to consider both aspects in extreme early-warning and impact assessments. By revealing similarities and differences of large-scale vegetation response to wet and dry soil moisture extremes, we provide a basis for targeted impact mitigation and long-term adaptation through e.g. extremes early-warning and forestry practices.
In the future, improved identification of waterlogging and finer, more continuous, trait-based representations of vegetation types could better resolve ecosystem sensitivity to excess moisture. Explicit evaluation of vegetation resistance and recovery would further help build a more complete understanding of ecosystem responses to hydrological extremes.
All the codes used for this manuscript are available online, https://doi.org/10.5281/zenodo.18234861 (Cheng, 2026).
Normalized Difference Vegetation Index is MOD13C1 16-daily data sourced from https://doi.org/10.5067/MODIS/MOD13C1.061 (Didan, 2021). Soil moisture, air temperature, shortwave radiation downwards are available from https://www.ecmwf.int/en/era5-land (last access: 23 July 2026). Elevation information is from ETOPO Global Relief Model 2022 (https://www.ncei.noaa.gov/products/etopo-global-relief-model, last access: 23 July 2026). Multi-Source Weighted-Ensemble Precipitation dataset (MSWEP) is sourced from https://climatedataguide.ucar.edu/climate-data/global-high-resolution-precipitation-mswep (Beck et al., 2019). Global Land Evaporation Amsterdam Model (GLEAM 4.1a) data is from https://www.gleam.eu/ (last access: 23 July 2026). Soil texture data is from https://www.fao.org/soils-portal/data-hub/soil-maps-and-databases/harmonized-world-soil-database-v20/en/ (last access: 23 July 2026).
The supplement related to this article is available online at https://doi.org/10.5194/bg-23-5117-2026-supplement.
XC, CZ, and RO conceptualized the study. MGDK and AH contributed to methodology. XC performed formal analysis, visualization, and original draft preparation. The study was supervised by CZ, RO and AH. All authors contributed to editing and reviewing the manuscript.
The contact author has declared that none of the authors has any competing interests.
Publisher's note: Copernicus Publications remains neutral with regard to jurisdictional claims made in the text, published maps, institutional affiliations, or any other geographical representation in this paper. The authors bear the ultimate responsibility for providing appropriate place names. Views expressed in the text are those of the authors and do not necessarily reflect the views of the publisher.
The authors thank Sophia Walther and Kelley De Polt from the Max Planck Institute for Biogeochemistry and Christiane Werner and Josephin Kroll from the University of Freiburg for insightful discussions and suggestions. The authors also thank the two anonymous reviewers for their constructive comments and suggestions. X.C. acknowledges support from the International Max Planck Research School for Global Biogeochemical Cycles.
X.C. was supported by a PhD scholarship from the German Academic Exchange Service (DAAD) through the Graduate School Scholarship Programme. X.C., R.O., and C.Z. received support from the appointment funds of the Faculty of Environment and Natural Resources at the University of Freiburg.
This open-access publication was funded by the University of Freiburg.
This paper was edited by Andrew Feldman and reviewed by two anonymous referees.
Allan, R. P.: Amplified seasonal range in precipitation minus evaporation, Environ. Res. Lett., 18, 094004, https://doi.org/10.1088/1748-9326/acea36, 2023.
Anderegg, W. R., Berry, J. A., Smith, D. D., Sperry, J. S., Anderegg, L. D., and Field, C. B.: The roles of hydraulic and carbon stress in a widespread climate-induced forest die-off, P. Natl. Acad. Sci. USA, 109, 233–237, https://doi.org/10.1073/pnas.1107891109, 2011.
Bailey-Serres, J. and Voesenek, L. A. C. J.: Flooding stress: acclimations and genetic diversity, Annu. Rev. Plant Biol., 59, 313–339, https://doi.org/10.1146/annurev.arplant.59.032607.092752, 2008.
Beck, H. E., Wood, E. F., Pan, M., Fisher, C. K., Miralles, D. G., van Dijk, A. I. J. M., McVicar, T. R., and Adler, R. F.: MSWEP V2 global 3-hourly 0.1° precipitation: Methodology and quantitative assessment, B. Am. Meteorol. Soc., 100, 473–500, https://doi.org/10.1175/BAMS-D-17-0138.1, 2019 (data available at: https://climatedataguide.ucar.edu/climate-data/global-high-resolution-precipitation-mswep, last access: 24 July 2026).
Berg, A., Sheffield, J., and Milly, P. C.: Divergent surface and total soil moisture projections under global warming. Geophys. Res. Lett., 44, 236–244, https://doi.org/10.1002/2016GL071921, 2016.
Breinl, K., Di Baldassarre, G., Mazzoleni, M., Lun, D., and Vico, G.: Extreme dry and wet spells face changes in their duration and timing. Environ. Res. Lett., 15, 074040, https://doi.org/10.1088/1748-9326/ab7d05, 2020.
Budyko, M. I.: Climate and Life, English edn., International Geophysics Series, vol. 18, edited by: Miller, D. H., Academic Press, New York, USA, 508 pp., ISBN 978-0-12-139450-9, 1974.
Chen, L., Brun, P., Buri, P., Fatichi, S., Gessler, A., McCarthy, M. J., Pellicciotti, F., Stocker, B., and Karger, D. N.: Global increase in the occurrence and impact of multiyear droughts, Science, 387, 278–284, https://doi.org/10.1126/science.ado4245, 2025.
Cheng, X.: Data associated with Global vegetation responses to wet and dry soil moisture extremes, Zenodo [data set], https://doi.org/10.5281/zenodo.18234861, 2026.
De Kauwe, M. G., Medlyn, B. E., Walker, A. P., Zaehle, S., Asao, S., Guenet, B., Harper, A. B., Hickler, T., Jain, A. K., Luo, Y., Lu, X., Luus, K., Parton, W. J., Shu, S., Wang, Y.-P., Werner, C., Xia, J., Pendall, E., Morgan, J. A., Ryan, E. M., Carrillo, Y., Dijkstra, F. A., Zelikova, T. J., and Norby, R. J.: Challenging terrestrial biosphere models with data from the long-term multifactor Prairie Heating and CO 2 Enrichment experiment, Glob. Chang. Biol., 23, 3623–3645, https://doi.org/10.1111/gcb.13643, 2017.
De Luca, P., Messori, G., Wilby, R. L., Mazzoleni, M., and Di Baldassarre, G.: Concurrent wet and dry hydrological extremes at the global scale, Earth Syst. Dynam., 11, 251–266, https://doi.org/10.5194/esd-11-251-2020, 2020.
Didan, K.: MODIS/Terra Vegetation Indices 16-Day L3 Global 0.05Deg CMG V061, NASA Land Processes Distributed Active Archive Center [data set], https://doi.org/10.5067/MODIS/MOD13C1.061, 2021.
Didan, K. and Barreto-Muñoz, A.: MODIS Vegetation Index User's Guide (MOD13 Series), version 3.10, Collection 6.1, Vegetation Index and Phenology Lab, The University of Arizona, Tucson, AZ, USA, 33 pp., https://lpdaac.usgs.gov/documents/621/MOD13_User_Guide_V61.pdf (last access: 23 July 2026), 2019.
Didan, K., Munoz, A. B., Solano, R., and Huete, A.: MODIS vegetation index user's guide (MOD13 series), University of Arizona, vegetation index and Phenology Lab, 35, 2–33, 2015.
Famiglietti, C. A., Michalak, A. M., and Konings, A. G.: Extreme wet events as important as extreme dry events in controlling spatial patterns of vegetation greenness anomalies, Environ. Res. Lett., 16, 074014, https://doi.org/10.1088/1748-9326/abfc78, 2021.
FAO and IIASA: Harmonized World Soil Database version 2.0, FAO, Rome, Italy, and IIASA, Laxenburg, Austria, https://doi.org/10.4060/cc3823en, 2023.
Feddes, R. A., Kabat, P., Van Bakel, P., Bronswijk, J. J. B., and Halbertsma, J.: Modelling soil water dynamics in the unsaturated zone – state of the art, J. Hydrol., 100, 69–111, https://doi.org/10.1016/0022-1694(88)90182-5, 1988.
Feldman, A. F., Feng, X., Felton, A. J., Konings, A. G., Knapp, A. K., Biederman, J. A., and Poulter, B.: Plant responses to changing rainfall frequency and intensity, Nat. Rev. Earth Environ., 5, 276–294, https://doi.org/10.1038/s43017-024-00534-0, 2024.
Guisset, C., Dendoncker, M., Vincke, C., and Ponette, Q.: Drought timing, intensity, and consecutiveness have more influence on Douglas fir growth response than site conditions and stand density in European temperate climate, For. Ecol. Manag., 569, 122177, https://doi.org/10.1016/j.foreco.2024.122177, 2024.
Harper, K. L., Lamarche, C., Hartley, A., Peylin, P., Ottlé, C., Bastrikov, V., San Martín, R., Bohnenstengel, S. I., Kirches, G., Boettcher, M., Shevchuk, R., Brockmann, C., and Defourny, P.: A 29-year time series of annual 300 m resolution plant-functional-type maps for climate models, Earth Syst. Sci. Data, 15, 1465–1499, https://doi.org/10.5194/essd-15-1465-2023, 2023.
Haverroth, E. J., Da-Silva, C. J., Taggart, M., Oliveira, L. A., and Cardoso, A. A.: Shoot hydraulic impairments induced by root waterlogging: parallels and contrasts with drought, Plant Physiol., 197, kiae336, https://doi.org/10.1093/plphys/kiae336, 2025.
Humphrey, V., Berg, A., Ciais, P., Gentine, P., Jung, M., Reichstein, M., Seneviratne, S. I., and Frankenberg, C.: Soil moisture–atmosphere feedback dominates land carbon uptake variability, Nature, 592, 65–69, https://doi.org/10.1038/s41586-021-03325-5, 2021.
Intergovernmental Panel on Climate Change (IPCC): Summary for Policymakers, in: Climate Change 2021: The Physical Science Basis. Contribution of Working Group I to the Sixth Assessment Report of the Intergovernmental Panel on Climate Change, edited by: Masson-Delmotte, V., Zhai, P., Pirani, A., Connors, S. L., Péan, C., Berger, S., Caud, N., Chen, Y., Goldfarb, L., Gomis, M. I., Huang, M., Leitzell, K., Lonnoy, E., Matthews, J. B. R., Maycock, T. K., Waterfield, T., Yelekçi, O., Yu, R., and Zhou, B., Cambridge University Press, Cambridge, UK and New York, NY, USA, 3–32, https://doi.org/10.1017/9781009157896.001, 2023.
Iturbide, M., Gutiérrez, J. M., Alves, L. M., Bedia, J., Cerezo-Mota, R., Cimadevilla, E., Cofiño, A. S., Di Luca, A., Faria, S. H., Gorodetskaya, I. V., Hauser, M., Herrera, S., Hennessy, K., Hewitt, H. T., Jones, R. G., Krakovska, S., Manzanas, R., Martínez-Castro, D., Narisma, G. T., Nurhati, I. S., Pinto, I., Seneviratne, S. I., van den Hurk, B., and Vera, C. S.: An update of IPCC climate reference regions for subcontinental analysis of climate model data: definition and aggregated datasets, Earth Syst. Sci. Data, 12, 2959–2970, https://doi.org/10.5194/essd-12-2959-2020, 2020.
Jiang, P., Liu, H., Piao, S., Ciais, P., Wu, X., Yin, Y., and Wang, H.: Enhanced growth after extreme wetness compensates for post-drought carbon loss in dry forests, Nat. Commun., 10, 195, https://doi.org/10.1038/s41467-018-08229-z, 2019.
Jiang, S., Sweet, L. B., Blougouras, G., Brenning, A., Li, W., Reichstein, M., Denzler, J., Shangguan, W., Yu, G., Huang, F., and Zscheischler, J.: How interpretable machine learning can benefit process understanding in the geosciences. Earth's Future, 12, e2024EF004540, https://doi.org/10.1029/2024EF004540, 2024.
Jørgensen, M., Torp, T., and Mølmann, J. A. B.: Impact of waterlogging and temperature on autumn growth, hardening and freezing tolerance of timothy (Phleum pratense), J. Agron. Crop Sci., 206, 242–251, https://doi.org/10.1111/jac.12385, 2019.
Knipfer, T., Bambach, N., Hernandez, M. I., Bartlett, M. K., Sinclair, G., Duong, F., Kluepfel, D. A., and McElrone, A. J.: Predicting stomatal closure and turgor loss in woody plants using predawn and midday water potential, Plant Physiol., 184, 881–894, https://doi.org/10.1104/pp.20.00500, 2020.
Kreuzwieser, J. and Rennenberg, H.: Molecular and physiological responses of trees to waterlogging stress, Plant Cell Environ., 37, 2245–2259, https://doi.org/10.1111/pce.12310, 2014.
Li, H. and Hu, Y.: Responses of vegetation low-growth to extreme climate events on the Mongolian Plateau, Glob. Ecol. Conserv., 56, e03292, https://doi.org/10.1016/j.gecco.2024.e03292, 2024.
Li, W., Migliavacca, M., Forkel, M., Walther, S., Reichstein, M., and Orth, R.: Revisiting global vegetation controls using multi-layer soil moisture, Geophys. Res. Lett., 48, e2021GL092856, https://doi.org/10.1029/2021GL092856, 2021.
Li, Y., Guan, K., Schnitkey, G. D., DeLucia, E., and Peng, B.: Excessive rainfall leads to maize yield loss of a comparable magnitude to extreme drought in the United States, Glob. Change Biol., 25, 2325–2337, https://doi.org/10.1111/gcb.14628, 2019.
Lian, X., Piao, S., Chen, A., Wang, K., Li, X., Buermann, W., Huntingford, C., Peñuelas, J., and Myneni, R. B.: Seasonal biological carryover dominates northern vegetation growth, Nat. Commun., 12, 983, https://doi.org/10.1038/s41467-021-21223-2, 2021.
Liu, L., Gudmundsson, L., Hauser, M., Qin, D., Li, S., and Seneviratne, S. I.: Soil moisture dominates dryness stress on ecosystem production globally, Nat. Commun., 11, 4892, https://doi.org/10.1038/s41467-020-18631-1, 2020.
Liu, Q., Guo, H., Zhang, J., Li, S., Li, J., Yao, F., Mahecha, M. D., and Peng, J.: Global assessment of terrestrial productivity in response to water stress, Sci. Bull., 69, 2352–2356, https://doi.org/10.1016/j.scib.2024.05.033, 2024.
McCormick, E. L., Famiglietti, C. A., Feng, D., Michalak, A. M., and Konings, A. G.: Susceptibility to photosynthesis suppression from extreme storms is highly site-dependent, Glob. Change Biol., 31, e70257, https://doi.org/10.1111/gcb.70257, 2025.
McDowell, N., Pockman, W. T., Allen, C. D., Breshears, D. D., Cobb, N., Kolb, T., Plaut, J., Sperry, J., West, A., Williams, D. G., and Yepez, E. A.: Mechanisms of plant survival and mortality during drought: why do some plants survive while others succumb to drought?, New Phytol., 178, 719–739, https://doi.org/10.1111/j.1469-8137.2008.02436.x, 2008.
Meng, Z., Wu, X., Li, Y., and Wang, X.: Drought timing differentiates the drought responses of vegetation growth on the Tibetan Plateau, J. Geophys. Res.-Biogeo., 129, e2024JG008179, https://doi.org/10.1029/2024JG008179, 2024.
Moritz, M. A., Batllori, E., Bradstock, R. A., Gill, A. M., Handmer, J., Hessburg, P. F., Leonard, J., McCaffrey, S., Odion, D. C., Schoennagel, T., and Syphard, A. D.: Learning to coexist with wildfire, Nature, 515, 58–66, https://doi.org/10.1038/nature13946, 2014.
Muñoz-Sabater, J., Dutra, E., Agustí-Panareda, A., Albergel, C., Arduini, G., Balsamo, G., Boussetta, S., Choulga, M., Harrigan, S., Hersbach, H., Martens, B., Miralles, D. G., Piles, M., Rodríguez-Fernández, N. J., Zsoter, E., Buontempo, C., and Thépaut, J.-N.: ERA5-Land: a state-of-the-art global reanalysis dataset for land applications, Earth Syst. Sci. Data, 13, 4349–4383, https://doi.org/10.5194/essd-13-4349-2021, 2021.
NOAA National Centers for Environmental Information: ETOPO 2022 15 Arc-Second Global Relief Model. NOAA National Centers for Environmental Information, https://doi.org/10.25921/fd45-gt74 (last access: 21 November 2025), 2022.
O, S. and Park, S. K.: Global ecosystem responses to flash droughts are modulated by background climate and vegetation conditions, Commun. Earth Environ., 5, 88, https://doi.org/10.1038/s43247-024-01247-4, 2024.
Smith, M. D.: An ecological perspective on extreme climatic events: a synthetic definition and framework to guide future research, J. Ecol., 99, 656–663, https://doi.org/10.1111/j.1365-2745.2011.01798.x, 2011.
Stocker, B. D., Tumber-Dávila, S. J., Konings, A. G., Anderson, M. C., Hain, C., and Jackson, R. B.: Global patterns of water storage in the rooting zones of vegetation, Nat. Geosci., 16, 250–256, https://doi.org/10.1038/s41561-023-01125-2, 2023.
Tramontana, G., Jung, M., Schwalm, C. R., Ichii, K., Camps-Valls, G., Ráduly, B., Reichstein, M., Arain, M. A., Cescatti, A., Kiely, G., Merbold, L., Serrano-Ortiz, P., Sickert, S., Wolf, S., and Papale, D.: Predicting carbon dioxide and energy fluxes across global FLUXNET sites with regression algorithms, Biogeosciences, 13, 4291–4313, https://doi.org/10.5194/bg-13-4291-2016, 2016.
Vicente-Serrano, S. M., Gouveia, C., Camarero, J. J., Beguería, S., Trigo, R., López-Moreno, J. I., Azorín-Molina, C., Pasho, E., Lorenzo-Lacruz, J., Revuelto, J., Morán-Tejeda, E., and Sanchez-Lorenzo, A.: Response of vegetation to drought time-scales across global land biomes, P. Natl. Acad. Sci. USA, 110, 52–57, https://doi.org/10.1073/pnas.1207068110, 2013.
Walther, S., Duveiller, G., Jung, M., Guanter, L., Cescatti, A., and Camps-Valls, G.: Satellite observations of the contrasting response of trees and grasses to variations in water availability, Geophys. Res. Lett., 46, 1429–1440, https://doi.org/10.1029/2018GL080535, 2019.
Wang, C., Chen, J., Lee, S. C., Xiong, L., Su, T., Lin, Q., and Xu, C. Y.: Response and recovery times of vegetation productivity under drought stress: Dominant factors and relationships, J. Hydrol., 655, 132945, https://doi.org/10.1016/j.jhydrol.2025.132945, 2025.
Xiao, J., Sun, F., Wang, T., and Hong, W.: Green and blue water response to drought modulated by background climate and vegetation, Commun. Earth Environ., 6, 488, https://doi.org/10.1038/s43247-025-02476-x, 2025.
Yang, H., Munson, S. M., Huntingford, C., Carvalhais, N., Knapp, A. K., Li, X., Peñuelas, J., Zscheischler, J., and Chen, A.: The detection and attribution of extreme reductions in vegetation growth across the global land surface, Glob. Change Biol., 29, 2351–2362, https://doi.org/10.1111/gcb.16595, 2023.
Zhang, M., Yuan, X., Zeng, Z., Pan, M., Wu, P., Xiao, J., and Keenan, T. F.: A pronounced decline in northern vegetation resistance to flash droughts from 2001 to 2022, Nat. Commun., 16, 2984, https://doi.org/10.1038/s41467-025-58253-z, 2025.
Zhou, S., Williams, A. P., Berg, A. M., Cook, B. I., Zhang, Y., Hagemann, S., Lorenz, R., Seneviratne, S. I., and Gentine, P.: Land–atmosphere feedbacks exacerbate concurrent soil drought and atmospheric aridity, P. Natl. Acad. Sci. USA, 116, 18848–18853, https://doi.org/10.1073/pnas.1904955116, 2019.
Zolina, O., Simmer, C., Belyaev, K., Gulev, S. K., and Koltermann, P.: Changes in the duration of European wet and dry spells during the last 60 years, J. Climate, 26, 2022–2047, https://doi.org/10.1175/JCLI-D-11-00498.1, 2013.