
the Creative Commons Attribution 4.0 License.
the Creative Commons Attribution 4.0 License.
 | 06 Aug 2026
Diatom community assemblages and microbial degradation resistance modulate local heterogeneity in diatom contribution to carbon export in the western North Pacific Subtropical Gyre
Feng Li
Hongzhen Jiang
Linwei Liu
Zhouyi Jiang
Lu Huang
Kehui Feng
Zuozhu Wen
Xin Liu
Changping Chen
Kuanbo Zhou
Diatoms typically make a high contribution to carbon export (defined as more carbon exported relative to their production) in productive coastal and upwelling regions. However, oligotrophic subtropical gyres are vast but uniformly nutrient-poor, supporting only very low diatom abundances. This raises a critical question: can diatoms still achieve a high contribution to carbon export in such nutrient-limited regions, and if so, what factors enable this? Here, we integrated taxonomic, sediment trap, and metagenomic analyses at five stations in the western North Pacific Subtropical Gyre. Our observations reveal distinct niche partitioning: Navicula and Rhizosolenia tend to be enriched in the nutrient-depleted surface mixed layer, while Nitzschia, Chaetoceros, and Thalassiosira prevail in the deep chlorophyll maximum, reflecting hydrographic and nutrient influences on community assembly. Within our limited station coverage, measured intact cell fluxes ranged from 103 to 105 cells m−2 d−1, with estimated carbon fluxes of 0.11–313.03 µg C m−2 d−1. The total fluxes of diatom cells, biogenic silica, and carbon export were highest at Station K2b, which is influenced by the Kuroshio. At this station, the contribution of diatom export remained high, with the large, carbon-rich Rhizosolenia species dominating the sinking flux. Community assembly, characterized by functional traits such as cell size, carbon content, and fucose-containing sulfated polysaccharides (FCSPs) production, influences export composition and magnitude. Metagenomic analyses indicate a widespread capacity for degrading common diatom polysaccharides, but genes encoding the essential enzyme (GH107) for cleaving FCSPs are nearly absent across all stations. This deficit, together with the prevalence of FCSP-producing diatoms, suggests that biochemical resistance may assist carbon export. Our findings provide preliminary support that diatom community assemblages (shaped by hydrodynamics and nutrient supply) and microbial degradation resistance (via limited FCSP-targeting enzymes) modulate local heterogeneity in diatom export contribution. We conclude that predicting the biological pump's response to global change may require accounting not only for which diatoms are present, but also for which organic byproducts are protected from rapid remineralization. These results are based on a limited number of stations and a single season, and therefore warrant further testing.
- Article
(2451 KB) - Full-text XML
-
Supplement
(930 KB) - BibTeX
- EndNote


The Biological Carbon Pump (BCP) is a cornerstone of the ocean's capacity to sequester atmospheric carbon, responsible for the majority of the dissolved inorganic carbon (DIC) gradient from the surface to the deep sea (Simon et al., 2025). Its efficiency, however, is not a simple function of primary production but is governed by a complex interplay of physical, ecological, and biogeochemical processes that control the composition of phytoplankton communities, the aggregation and sinking of particles, and the microbial remineralization of organic matter during descent (Kwon et al., 2009; McDonnell et al., 2015; Guidi et al., 2016; Tréguer et al., 2018).
Among phytoplankton, diatoms are often pivotal to efficient carbon export (Tréguer et al., 2018; Zhang et al., 2018; Stukel et al., 2023). They are widely distributed and can rapidly achieve high biomass under favorable conditions. However, like other phytoplankton, diatom-derived carbon is susceptible to bacterial remineralization during process. Heterotrophic bacteria use carbohydrate-active enzymes (CAZymes) to degrade key polysaccharides such as laminarin, mannans, and extracellular polymers, making the balance between export and degradation a fundamental control point for carbon sequestration. Diatoms have evolved traits that counteract this process. Their silica frustules provide ballast, enhancing particle sinking velocity and thus reducing exposure to degradation (Tréguer et al., 2018). More critically, many diatoms produce specific extracellular polymers, notably fucose-containing sulfated polysaccharides (FCSPs), which drive the formation of sticky, gel-like transparent exopolymer particles (TEP) (Vidal-Melgosa et al., 2021). These TEP facilitate particle aggregation and, due to their complex sulfated structure, exhibit significant resistance to bacterial degradation (Vidal-Melgosa et al., 2021). This combination of physical (ballasting) and biochemical (polymer-mediated aggregation and preservation) traits enables diatoms to contribute disproportionately more to deep carbon flux than their share of primary production would suggest (Henson et al., 2019). In other words, diatoms can achieve a high contribution to carbon export, defined as more carbon exported relative to their production. However, in vast oligotrophic regions, the extent to which these diatom-traits translate into efficient export remains uncertain.
The North Pacific Subtropical Gyre (NPSG) presents a puzzling context for this diatom-driven export paradigm. It is a vast oligotrophic region with strong surface stratification, persistently low inorganic nutrients, and consequently low primary productivity. The region is dominated by picophytoplankton and a tightly regenerating microbial loop, resulting in a relatively weak biological pump (Karl et al., 2012; Letscher et al., 2016; Xiu and Chai, 2020; Dai et al., 2023). Moreover, the strongly stratified water column creates distinct niche environments: a nutrient-depleted surface layer (NDL) overlying a nutrient-replete deep layer (NRL) (Dore et al., 2008; Dai et al., 2023). In such an oligotrophic setting, larger phytoplankton such as diatoms typically occur at low abundance, raising a critical question: can they maintain a high contribution to carbon export, and what factors might enable this?
Previous work at Station ALOHA in the eastern NPSG has shown that episodic diatom blooms, particularly those involving diatom-diazotroph associations (DDAs) such as Rhizosolenia or Hemiaulus with Trichodesmium or Richelia, can drive substantial carbon export to the deep sea (Scharek et al., 1999a, b; Karl et al., 2012). These studies suggest that nutrient loading, especially the biological input of fixed nitrogen, favors selected diatom species in the mixed layer and may play a role in bloom initiation and development (Krause et al., 2013; Foreman et al., 2026). However, in the understudied western NPSG, the abundance, community composition, and functioning of diatom communities, as well as their contributions to export, remain poorly understood. Furthermore, the western NPSG features distinct hydrodynamic regimes, including the Kuroshio-influenced, Kuroshio Extension, gyre interior, and North Equatorial Current. These regimes, together with the vertical physicochemical gradient, may promote differentiation in diatom community structure, potentially leading to local heterogeneity in the magnitude, composition, and contribution of diatoms to carbon export.
To address these gaps, this study employed an integrated approach combining taxonomic community analysis, sediment trap flux measurements, and metagenomic profiling of bacterial CAZymes across five stations representing four biogeochemically distinct subregions in the western NPSG. Our objectives were to: (1) characterize the spatial and vertical structure of diatom communities and their carbon export fluxes; (2) assess local heterogeneity in diatom contribution to export; (3) evaluate the potential for diatom-derived carbon to resist bacterial degradation; and (4) explore factors that may related to local heterogeneity in diatom contribution to export. By linking community ecology, flux biogeochemistry, and microbial genomics, this study provides a preliminary framework for understanding how diatom assemblages and potentially degradation resistance may interact to modulate local export heterogeneity in the oligotrophic region.
2.1 Western NPSG and sampling stations
Sampling was carried out in the western NPSG during two research cruises on the R/V Tan Kah Kee: the KK2003 expedition in summer (July–August 2020) and the KK2007 expedition in winter (January–February 2021).
A total of five stations were occupied. Stations were chosen to represent four main distinct hydrodynamic regimes in the western NPSG: Kuroshio-influenced (K2b, 125° E, 20° N), Kuroshio Extension (M35, 155° E, 33° N), gyre interior (M22, 155° E, 20° N; WPS, 140° E, 20° N), and North Equatorial Current (K8a, 155° E, 12.5° N). These regions differ in hydrodynamic conditions, which my influence nutrient supply, depth of mixing surface layer, diatom community, and carbon export (Zhang et al., 2026).
2.2 Sample collections
Water samples for diatom taxonomy and abundance analysis were collected from three predefined depths: the surface mixed layer (5 m), the deep chlorophyll a maximum (DCM), and 200 m, using Niskin-X bottles. During the summer cruise, all five stations were sampled (Fig. 1a), with the DCM depth varying station-specifically: K2b (110 m), WPS (145 m), M22 (155 m), K8a (150 m), and M35 (95 m). Winter sampling was conducted only at stations M22 and K8a due to rough sea conditions (Fig. 1b).
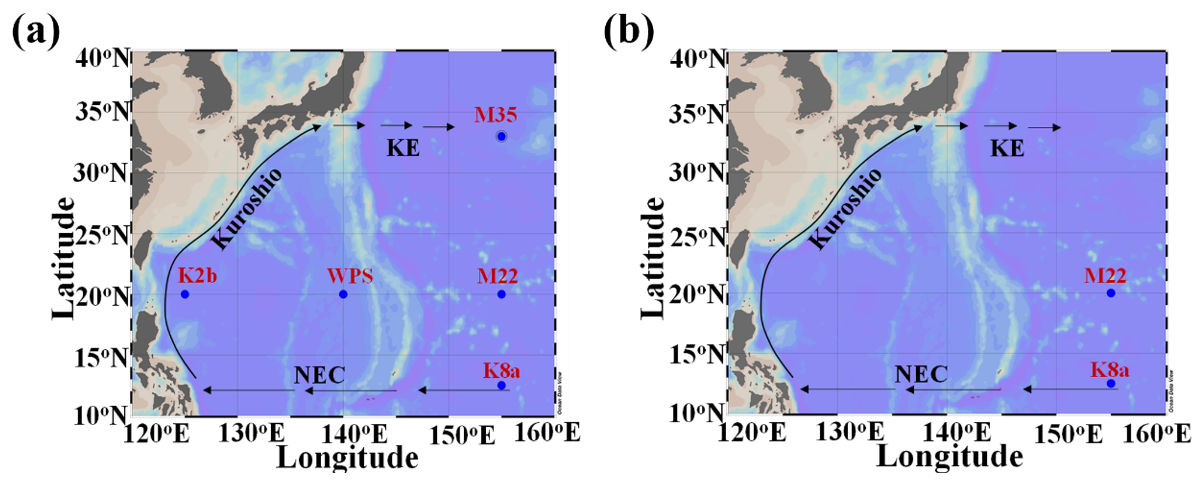
Figure 1Sampling stations in the western North Pacific Subtropical Gyre (NPSG) during summer (Chinese KK2003 cruise) and winter (Chinese KK2007 cruise). (a) Sampling stations established in summer, (b) Sampling stations established in winter. Schlitzer, Reiner, Ocean Data View, https://odv.awi.de (last access: 1 October 2025).
Following established protocols (Wiedmann et al., 2020), custom-made sediment traps were deployed at depths of 50, 100, and 200 m to collect settling particulate matter for diatom export flux analysis. During the summer cruise, traps were successfully recovered only at stations K2b, M22, and K8a (owing to rough sea conditions at other stations), allowing quantification of diatom carbon export fluxes at these three sites. Winter trap deployments were also attempted but failed due to high sea state.
For metagenomic analysis, a total of 39 samples were obtained: during summer, seawater from 5 m and the DCM at all five stations was filtered in situ (100–120 L per sample) through 0.2 µm (142 mm) polycarbonate membranes using a high-volume pump; each filter was subdivided into eight aliquots, stored in cryovials, and kept at −80 °C. In winter, water sampling was additionally performed at 200 m depth at station M22.
A complete summary of sampling stations and depths is provided in Table S1 in the Supplement.
2.3 Environmental data
The environmental data collected during sampling were obtained by the research group led by Du et al. (2025). In situ measurements of temperature and salinity were performed using a Seabird SBE 911 conductivity-temperature-depth (CTD) sensor. Nutrient concentrations were determined onboard immediately after collection, using 500 mL seawater samples analyzed with a Technicon AA3 Auto-Analyzer (Bran-Luebbe, GmbH, Germany). For chlorophyll a analysis, an aliquot of the 8 L seawater subsample was filtered through a Whatman GF/F glass-fiber filter, and the retained pigments were extracted with 2 mL of N,N-dimethylformamide (Huang et al., 2010). The extracted pigments were subsequently quantified using an Agilent 1100 Series High-Performance Liquid Chromatograph (HPLC) (Agilent Technologies, USA).
2.4 Diatom taxonomy and counting
For diatom taxonomic analysis, 20 L of seawater was collected at each sampling site and immediately fixed with Lugol's solution (1.5 % vol vol). Samples were stored in opaque plastic bags to avoid light exposure prior to laboratory processing. Given the typical low diatom abundance in oligotrophic waters and the prevalence of small-sized taxa, a concentration-based approach combined with filtration was selected to improve detection sensitivity (Jiang et al., 2019), as conventional filtration methods may fail to capture smaller cells due to pore size constraints (Zhang et al., 2022).
The procedure involved: (1) settling for three days; (2) siphoning two-thirds of the supernatant and filtering it through an 8 µm nylon mesh to retain floating small-cell species; (3) adding the retained small cells back to the settled sample and resuspending the mixture; and (4) repeating steps 1–3 until a final volume of 10 mL was obtained. A flow diagram is provided in Supplement Fig. S1. Throughout processing, meticulous care was taken to minimize cell damage, including gentle shaking and slow liquid transfers, to preserve fragile, lightly silicified frustules.
Methodological note: This procedure likely underestimates the water-column abundance of large or fragile taxa (e.g., Rhizosolenia) due to cell damage during concentration handling. Consequently, our reported abundance of Rhizosolenia in water sample should be considered a lower bound. Sediment trap samples also underwent concentration steps; therefore, trap fluxes for these taxa are likewise underestimates.
For the identification and counting of diatom species, 100 µL of the resulting concentrate was transferred to a 0.1 mL phytoplankton counting chamber and analyzed using a light microscope (Olympus BX51) at 200× and 400× magnifications (Jiang et al., 2019). Diatom identification was conducted with the support of standard taxonomic references (e.g. Yang and Dong, 2006; Yang and Lin, 2021) and online databases such as https://diatoms.org/genera (last access: 13 March 2022), http://www.protistcentral.org/Project/getList (last access: 13 March 2022), and https://plankton.mio.osupytheas.fr/ (last access: 13 March 2022). Triplicate counting was carried out to determine the abundance of diatom species.
Diatom abundance (N, cells L−1) was calculated using the following formulas:
In Eq. (1), N represents the abundance of diatoms (cells L−1). N1 denotes the count of diatoms in a specific volume of concentrated sample (cells). V2 indicates the total post-concentration sample volume (mL). V1 refers to the volume used for observation (µL), and V represents the pre-concentration total sample volume (L).
2.5 Estimation of carbon biomass of total phytoplankton and diatoms
Total phytoplankton carbon biomass (primary production) was estimated by converting chlorophyll a (Chl a) concentration into carbon equivalents using a carbon-to-Chl a ratio (C: Chl a), with C: Chl a value derived from in situ measurements at the ALOHA station at corresponding depths (Wang et al., 2015; Liu et al., 2016). Total Chl a was quantified by HPLC analysis: filters were extracted with 2 mL of N,N-dimethylformamide, and the extracts were analyzed using an Agilent 1100 series HPLC system (Huang et al., 2010).
For diatom carbon biomass estimation, considering that the same diatom species may exhibit variations in cell size between oligotrophic and coastal regions, which consequently leads to differences in cellular carbon content, we (1) initially measured cell sizes from scanning electron micrographs (SEM) of diatom cells; (2) biovolume was then calculated based on cell dimensions using appropriate geometric models (Sun and Liu, 2003); (3) carbon content was subsequently estimated using the empirical formula of Eppley et al. (1970). Alternatively, carbon content was derived using the volume-to-carbon conversion relationship proposed by Menden-Deuer and Lessard (2000); (4) for several rare genus for which micrographs were not available, species-specific carbon content values were compiled from existing literature (Harrison et al., 2015; Chitari and Anil, 2017; Chen et al., 2023; Rath and Mitbavkar, 2023); (5) subsequently, the average carbon content among known species within each genus was adopted as the representative carbon content for that genus. The resulting average carbon biomass values for each genus included in this study are summarized in Table S2. Finally, the error bounds for carbon content estimates at each station are presented in Table S3.
The diatom production proportion (DPP) was then calculated for each sampling layer as the ratio of diatom carbon production to total phytoplankton carbon production, based on their respective carbon biomass contributions.
For SEM observation, samples were acid-treated, gold-coated, and imaged following the protocol described by Li et al. (2022). Diatom cell sizes were then measured using ImageJ software.
2.6 Diatom community analysis
Diatom community diversity was assessed based on carbon biomass using three α diversity indices: Species richness index (Pielou, 1966), Simpson index (Siqueiros Beltrones et al., 2025), and Pielou evenness index (Pielou, 1966).
Richness counts the number of species present, reflecting community complexity (Taurozzi and Scalici, 2025).
The Simpson diversity index was calculated as 1−D, where D is the probability that two randomly selected individuals belong to the same species. Values of 1−D range from 0 to 1: values near 0 indicate dominance by a few species, while values near 1 indicate even species distribution (Buzas and Hayek, 2005).
Pielou's evenness index (J) quantifies the uniformity of species abundance distribution (Kunakh et al., 2023).
2.7 Fluxes of diatom cells and the estimated carbon biomass
Floating sediment traps were deployed at selected sites for 72 h. Each trap consisted of 12 tubes (10 cm diameter × 50 cm height) per depth. After collection, one tube was randomly selected for concentration, yielding a final volume of 20 mL. From this, 5 mL aliquots were analyzed using an inverted microscope and the Utermöhl method (Utermöhl, 1958) at 200× and 400× magnifications. Owing to the scarcity of samples, the results of three counts from a single tube will be regarded as the final value. The same principle applies to the subsequent particulate organic carbon (POC) flux and biogenic silica (BSi) flux.
Diatom cells flux (F) was calculated as:
where F represents diatom cells flux (cells m−2 d−1), N1 is the observed diatom count in a specific sample volume (cells), V2 is the post-concentration sample volume (mL), V1 is the volume used for sample observation (µL), A denotes the collector's cross-sectional area (m3), and T is the sediment trap's collection time (d).
The estimated carbon biomass flux for each site was acquired by converting the cell fluxes of all species at the site into the sum of the average carbon biomass values corresponding to the genus of each species.
2.8 The fluxes of total POC and BSi
Total POC concentration in the sediment traps was quantified using an elemental analyzer-isotope ratio mass spectrometer (EA-IRMS; vario PYRO cube coupled with Isoprime 100) following the removal of inorganic carbon via acid fumigation with concentrated HCl (24 h, room temperature) (Wang et al., 2025). A procedural carbon blank correction (< 6 µg C) was applied to all POC measurements.
The diatom export proportion (DEP) at 200 m was calculated for each station as the ratio of diatom carbon export to total phytoplankton carbon export.
For BSi analysis, samples were oven-dried (50 °C, 24 h) and subjected to a one-step wet-alkaline digestion (0.2 M NaOH, 100 °C, 40 min) to solubilize particulate silica (Lam et al., 2018). The dissolved silicon concentrations were then determined spectrophotometrically by measuring the silico-molybdate blue complex using a Technicon AA3 Auto-Analyzer (Bran + Luebbe GmbH). Replicate analyses of selected filter samples confirmed a methodological uncertainty of < 10 % (Cao et al., 2020).
Sediment trap-derived POC export fluxes were calculated as follows:
where [POC] are the POC concentrations collected by the traps. A denotes the collector's cross-sectional area (m3), and T is the sediment trap's collection time (d).
The same calculation was carried out for BSi export flux.
2.9 Metagenomic analysis and MAG reconstruction
Total DNA was extracted following manufacturer protocols and sequenced on the Illumina HiSeq 2500 platform (PE 150) at Shanghai Majorbio Bio-pharm Technology Co., Ltd. Raw data were processed using Fastp (v0.20.0, https://github.com/OpenGene/fastp, last access: 28 November 2022) to filter low-quality reads. Clean reads were assembled into contigs using MEGAHIT (v1.1.2), and open reading frames (ORFs) were predicted using MetaGene (Noguchi et al., 2006). Redundant genes were removed using CD-HIT (v4.6.1), resulting in a non-redundant gene catalog (Fu et al., 2012). Taxonomic and functional annotations were performed against the NR (http://ncbi.nlm.nih.gov/, last access: 20 October 2023), EggNOG (http://eggnog.embl.de/, last access: 20 October 2023), and KEGG (http://www.genome.jp/kegg) databases. Carbohydrate-active enzymes (CAZymes) were annotated using the dbCAN2 database(http://bcb.unl.edu/dbCAN2/download/Datab, last access: 20 October 2023). Metagenome-assembled genomes (MAGs) were reconstructed using the ATLAS workflow (Kieser et al., 2020) with default parameters.
2.10 Data visualization and statistical analysis
Sampling map was visualized using Ocean Data View (ODV, v5.3.0). Both α-diversity indices and Spearman correlation analyses between diatom assemblages and physicochemical parameters were conducted using the R package vegan (Dixon, 2003). To evaluate significant differences in α-diversity indices, the T-test and Wilcoxon Rank Sum were applied (Wong Chin et al., 2022).
Spearman's rank correlation analyses were calculated using Prism 9 (GraphPad Software) with two-tailed P-values and approximate 95 % confidence intervals determined for all comparisons. (Schreiber et al., 2016). Importantly, Spearman correlations were performed separately for each depth layer (5 m and DCM) based on data from five independent sampling stations (n=5 per layer), rather than on sequential depth points within a single vertical profile. Each station yielded one discrete sample for the surface mixed layer and one for the DCM, with concurrent matched measurements of environmental variables and diatom abundances collected for each layer.
Comparative analyses of cell abundance and estimated carbon biomass across sampling sites or seasons were conducted using Student's t-test (Student, 1908), and data visualization (e.g. histograms) was performed using GraphPad Prism 9 (Li et al., 2024).
3.1 Description of environmental gradients among the four hydrodynamic regimes
In this study, five stations were strategically selected to represent four distinct hydrodynamic regimes in the western NPSG, covering a wide range of oceanographic settings. Based on vertical profiles of temperature and salinity within the upper 200 m, clear differences in mixed layer depth were observed across the four regimes. The Kuroshio mainstream (Station K2b, Fig. 2) and the Kuroshio Extension (Station M35, Fig. S2) displayed the shallowest mixed layers (10–20 m). In contrast, the North Equatorial Current (Station K8a) exhibited the deepest mixed layer (∼ 90 m; Fig. 2). The subtropical gyre interior (Stations M22 and WPS) showed intermediate mixed layer depths (∼ 50 m; Figs. 2 and S2).
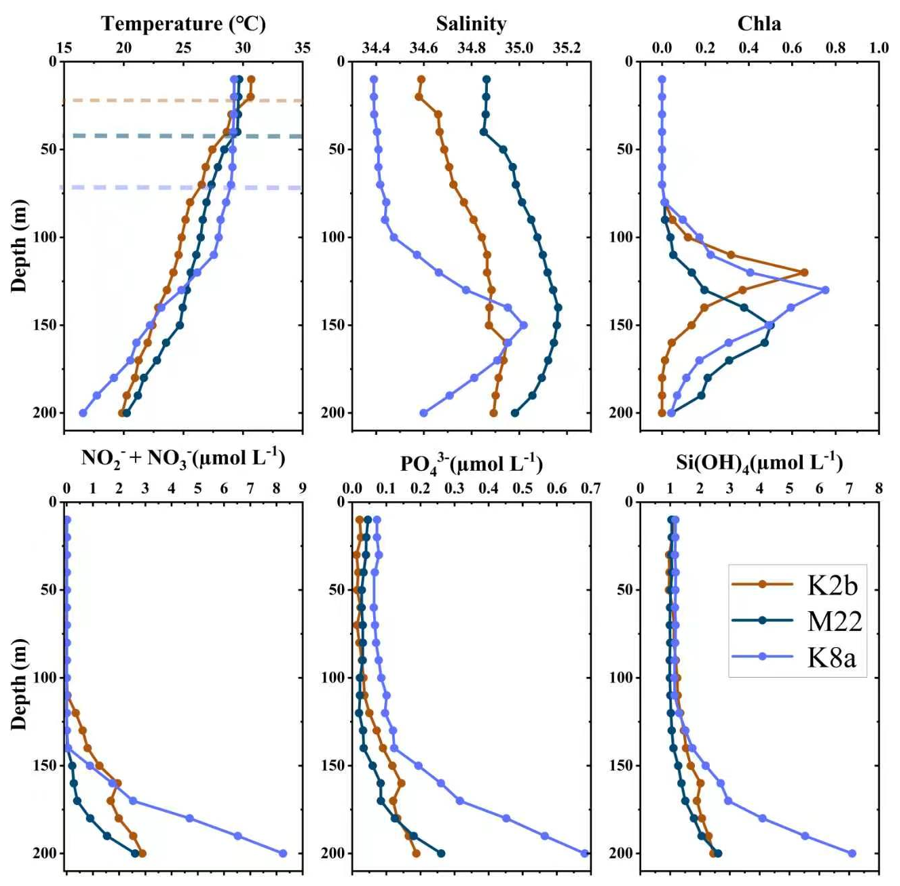
Figure 2Vertical profiles of temperature, salinity, nutrients, and chlorophyll a within the 0–200 m layer during summer season. In the temperature graph, the dotted lines indicate the approximate positions of the bottom of the surface mixed layer at different stations.
Vertical profiles of nutrients and chlorophyll a (Chl a) in the upper 200 m indicated that all stations were characterized by strong stratification, with extremely low nutrient concentrations in the upper mixed layer (corresponding to the NDL) and a sharp increase in nutrients below the thermocline (corresponding to the NRL), accompanied by a prominent and deep chlorophyll maximum (DCM) layer (Fig. 2). The depth of this sharp nutrient increase varied among stations, reflecting differences in the pycnocline base depth. Within the mixed layer, all nutrients were present at very low concentrations across stations. However, near the bottom of the 200 m depth, higher nutrient concentrations were observed at Station K8a than at the other stations.
Comparing nutrient profiles with mixed layer depths revealed clear distinctions in stratification intensity among the four hydrodynamic regimes (Figs. 2 and S2). The thickness of the pycnocline (calculated as the depth of the pycnocline base minus the mixed layer depth) varied notably among stations. Stations K2b, M22, and WPS exhibited the thickest pycnocline, reaching approximately 100 m. In contrast, stations M35 and K8a had a shallower pycnocline, approximately 50–60 m.
Collectively, these regions differ in mixed layer depth, pycnocline base depth, stratification intensity, and nutrient availability.
3.2 Diatom abundance and community structure in water column
Within this physicochemical framework, diatom communities, diatom abundance, and estimated carbon biomass showed significant spatial and vertical heterogeneity (P<0.05) (Fig. 3).
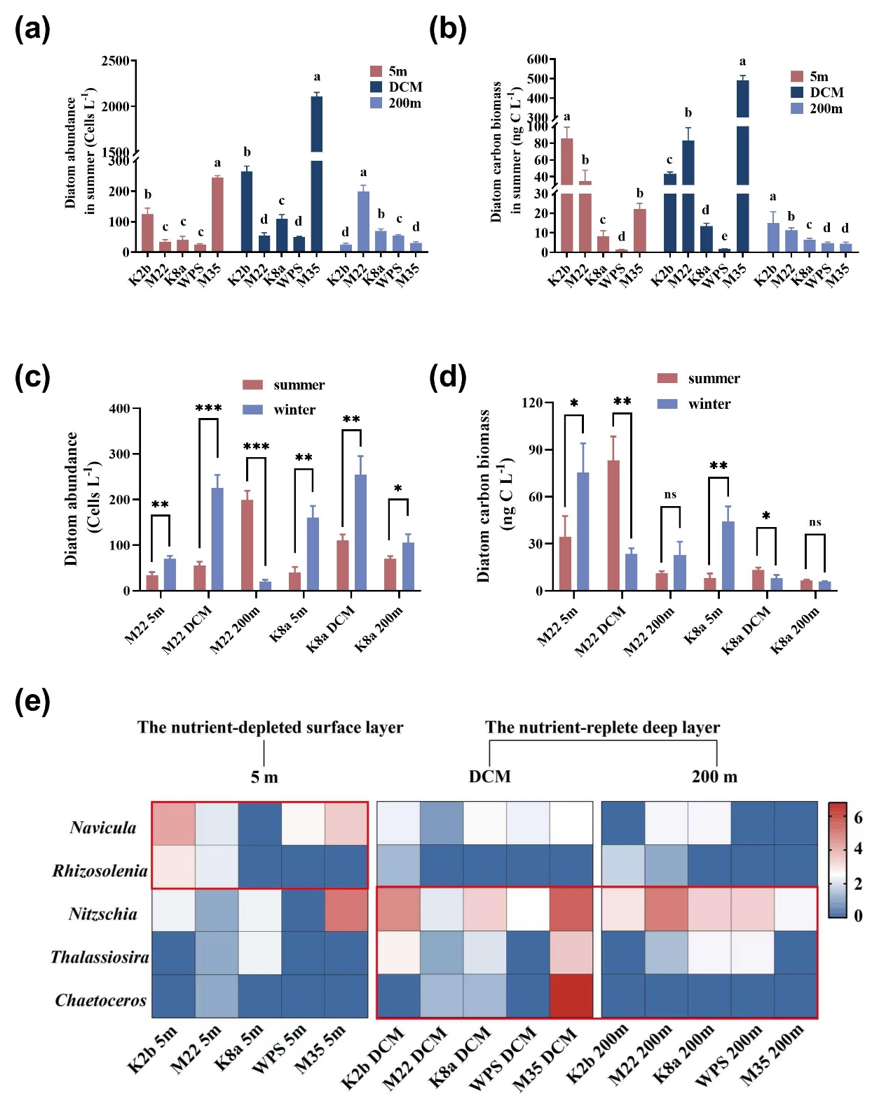
Figure 3The regional heterogeneity of diatom abundance, estimated carbon biomass, and dominated species in the western North Pacific Subtropical Gyre (NPSG). (a) Abundance of diatoms at three depths across five stations in summer. The significance marked in the legend represents the within-layer comparison. (b) Estimated carbon biomass of diatoms at three depths across five stations in summer. The significance marked in the legend represents the within-layer comparison. (c) Comparison of diatom abundance between summer and winter. (d) Comparison of diatom carbon biomass estimates between summer and winter. (e) Heat map depicting the relative abundance of dominant diatoms in the water column. KE: Kuroshio Extension area; NEC: North Equatorial Current. The DCM layer depths in summer for stations K2b, WPS, M22, K8a, and M35 are 110, 145, 155, 150, and 95 m, respectively. In winter, the DCM layer depths for stations M22 and K8a are 135 and 146 m, respectively.
In summer, measured intact cell abundance across the regions ranged from 25 to 2110 cells L−1, and estimated carbon biomass ranged from 1.34 to 491.36 ng C L−1. At the surface mixed layer (5 m), the maximum cell abundance was detected at Station M35, whereas the highest estimated carbon biomass was observed at Station K2b (Fig. 3a, b). This disparity can be attributed to the contribution of Rhizosolenia, which was dominant at Station K2b and possesses a higher carbon biomass per cell owing to its larger cell size. At the DCM layer, both the maximum cell abundance and the highest estimated carbon biomass were identified at Station M35 (Fig. 3a, b). Vertical profiles revealed that maximum diatom carbon biomass generally coincided with the DCM, with the exception of Stations K2b and WPS, where at WPS non-diatom groups likely dominated the DCM community (Fig. 3b). Notably, winter biomass in the mixed layer at Stations M22 and K8a exceeded summer values, underscoring seasonal dynamics (Fig. 3d).
Community composition analysis identified 37 taxa from 26 genera during summer, displaying clear vertical niche differentiation linked to nutrient gradients. Taxa such as Navicula and Rhizosolenia exhibited higher abundance in the surface mixed layer (within the NDL) than in the NRL, whereas Nitzschia, Chaetoceros, and Thalassiosira tended to be dominant in the DCM and at 200 m (corresponding to the NRL) (Fig. 3e). The contribution of different genera to community carbon biomass varied widely: large-celled Rhizosolenia dominated the biomass at Stations K2b (33 %–95 % across layers) and M22 (0 %–74 % across layers), while the small but ubiquitous Nitzschia and Thalassiosira were the main carbon biomass contributors at Stations M22 (0 %–27 % across layers) and K8a (62 %–76 % across layers), respectively (Table S4). This structured community distribution sets the stage for understanding differential contributions to export.
3.3 Spatial and temporal variability in diatom diversity
Diatom α-diversity, assessed through species richness, Pielou evenness, and the Simpson index (based on estimated carbon biomass), varied significantly across stations and seasons (P<0.05) (Fig. 4, Tables S5, S6). During summer, station M22 in the gyre interior had significantly higher species richness than stations K8a (P<0.01) and WPS (P<0.01) (Fig. 4a). The Pielou evenness index at M22 was significantly lower than at stations K8a, WPS, and M35 (P<0.05, Fig. 4b), indicating that a less even distribution of carbon biomass among species at M22 compared to the other three stations.
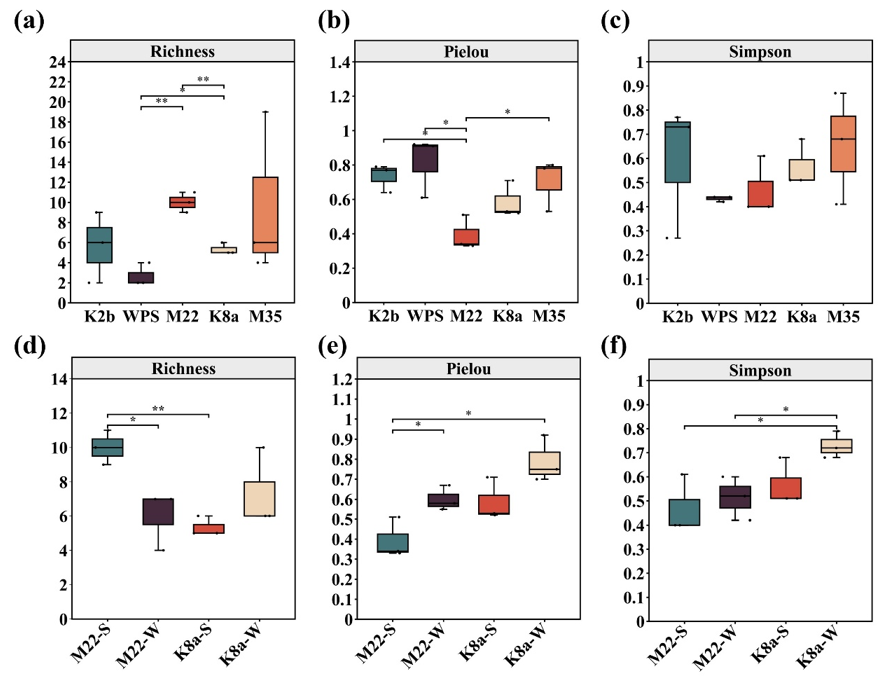
Figure 4Alpha diversity index of the diatom community. (a, d) Richness index; (b, e) Pielou evenness index; (c, f) Simpson index. (a–c) Alpha diversity indices during the summer season. (d–f) Comparison of alpha diversity indices between summer and winter. “M22-S”, “M22-W”, “K8a-S”, and “K8a-W” represent M22-summer, M22-winter, K8a-summer, and K8a-winter, respectively. The boxes indicate the ranges of the first and third quartiles, the line inside each box represents the median, and the whiskers show the lowest and highest data points (mean ± 1.5 SD). Note that Simpson's index is presented as 1-D. Asterisks indicate statistically significant results (; ).
Seasonally, species richness at M22 was lower in winter than in summer (P<0.05, Fig. 4d). In contrast, Pielou evenness at M22 was higher in winter than in summer; likewise, evenness at K8a in winter exceeded that at M22 in summer (Fig. 4e), suggesting a more even distribution of carbon biomass during winter at both stations. The Simpson index at K8a in winter was significantly higher than at M22 in both seasons (P<0.05, Fig. 4f), reflecting greater diversity at K8a in winter. These patterns highlight that diversity is not static but responds to local physicochemical conditions and seasonal forcing.
3.4 Linking diatom communities to environmental drivers
Spearman's correlation analysis in summer revealed the relationships between dominant diatom taxa and environmental factors, underscoring niche specialization (Fig. 5). In the surface mixed layer (n=5), the abundances of Thalassiosira and Thalassionema showed perfect positive correlations with NO, and NO + NO (r=1, P<0.001 for both), indicating that both genera respond identically in rank order to subtle variations in nitrate availability. Given the very low concentrations of these nutrients in the surface mixed layer, the abundances of Thalassiosira and Thalassionema were correspondingly low. These two genera also exhibited a perfect positive correlation with each other (r=1, P<0.001) (Fig. 5a), suggesting they occupy equivalent nitrate niches.
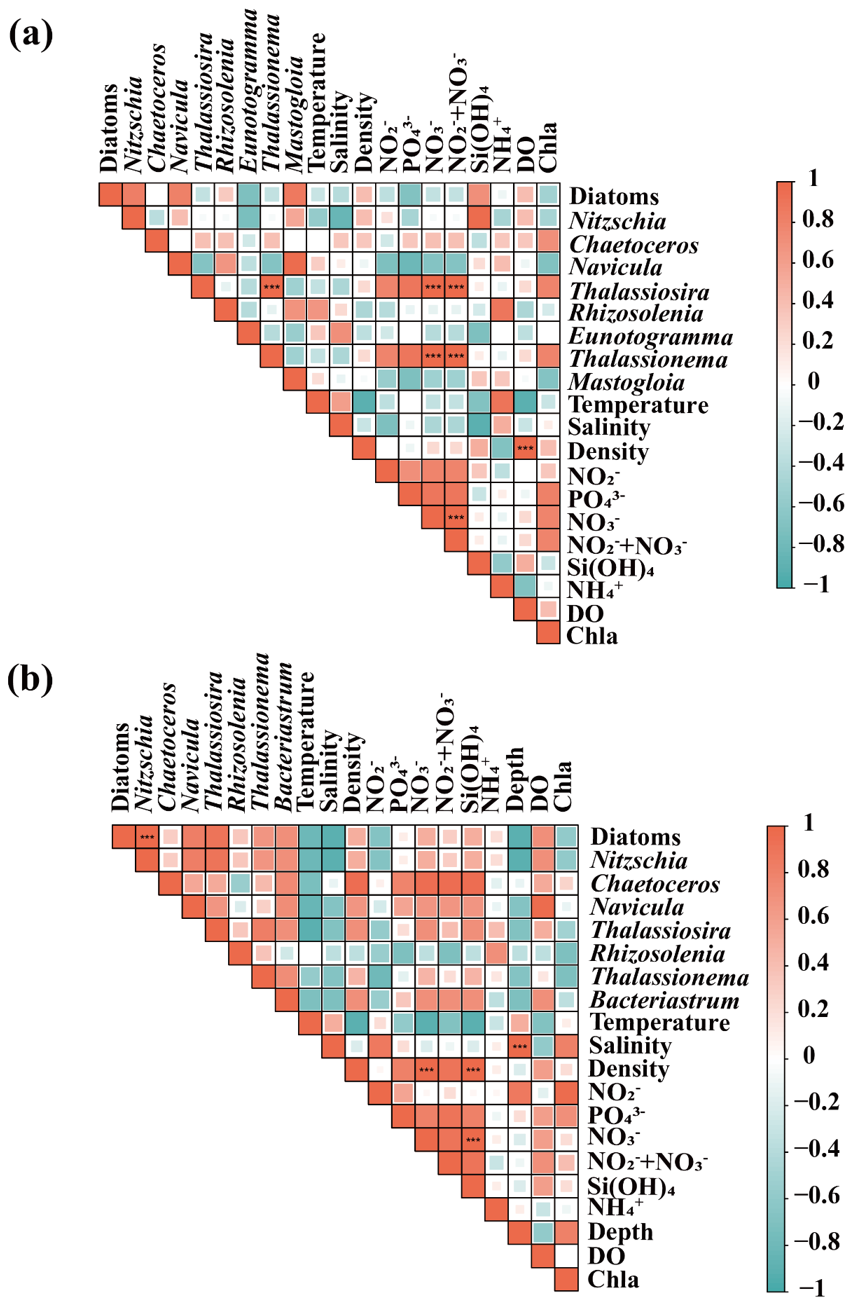
Figure 5Spearman's correlation between diatoms and environmental factors in summer. (a) Surface seawater layer (b) Deep chlorophyll maximum (DCM) layer. NO: nitrite, PO: phosphate, NO: nitrate, Si (OH)4: silicic acid, NH: ammonium, DO: dissolved oxygen, Chl a: chlorophyll a. Asterisks denote significant correlations after Benjamini-Hochberg correction (, p<0.001).
In contrast, within the DCM (n=5), the abundance of the widespread genus Nitzschia was perfectly positively correlated with total diatom abundance (r=1, P<0.001), confirming its central role in the diatom community and indicating that Nitzschia constitutes the overwhelming majority of the diatom assemblage in this layer (Fig. 5b). These correlations demonstrate that the vertical stratification of diatom taxa is underpinned by distinct physicochemical affinities. The perfect rank correlations (r=1) arise because all paired samples share identical rank orders, a consequence of the small sample size (n=5) combined with highly consistent ecological responses within each depth layer, rather than indicating a deterministic biological relationship.
3.5 Magnitude and composition of diatom export flux
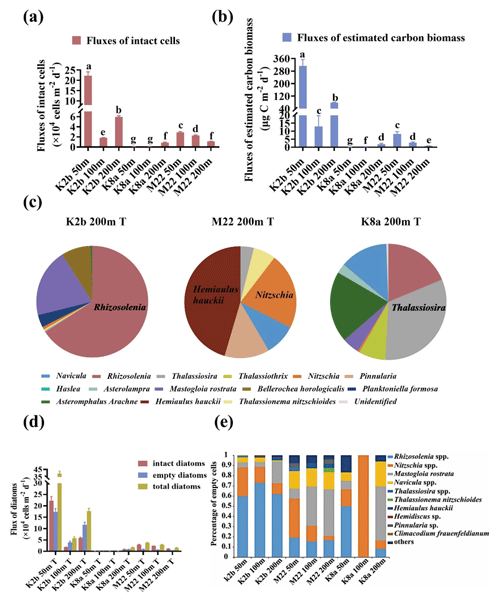
Diatom export fluxes, quantified via sediment traps at three stations (K2b, M22, K8a) in summer, revealed local heterogeneity (P<0.05) (Fig. 6a, b). Intact cell fluxes ranged from 103 to 105 cells m−2 d−1 (Table S7), and the estimated carbon fluxes ranged from 0.11 to 313.03 µg C m−2 d−1. The highest fluxes were observed at Station K2b, which is influenced by the Kuroshio (Fig. 6a). This observation is supported by the diatom cells flux, the estimated carbon flux, and the BSi flux (Table 1).
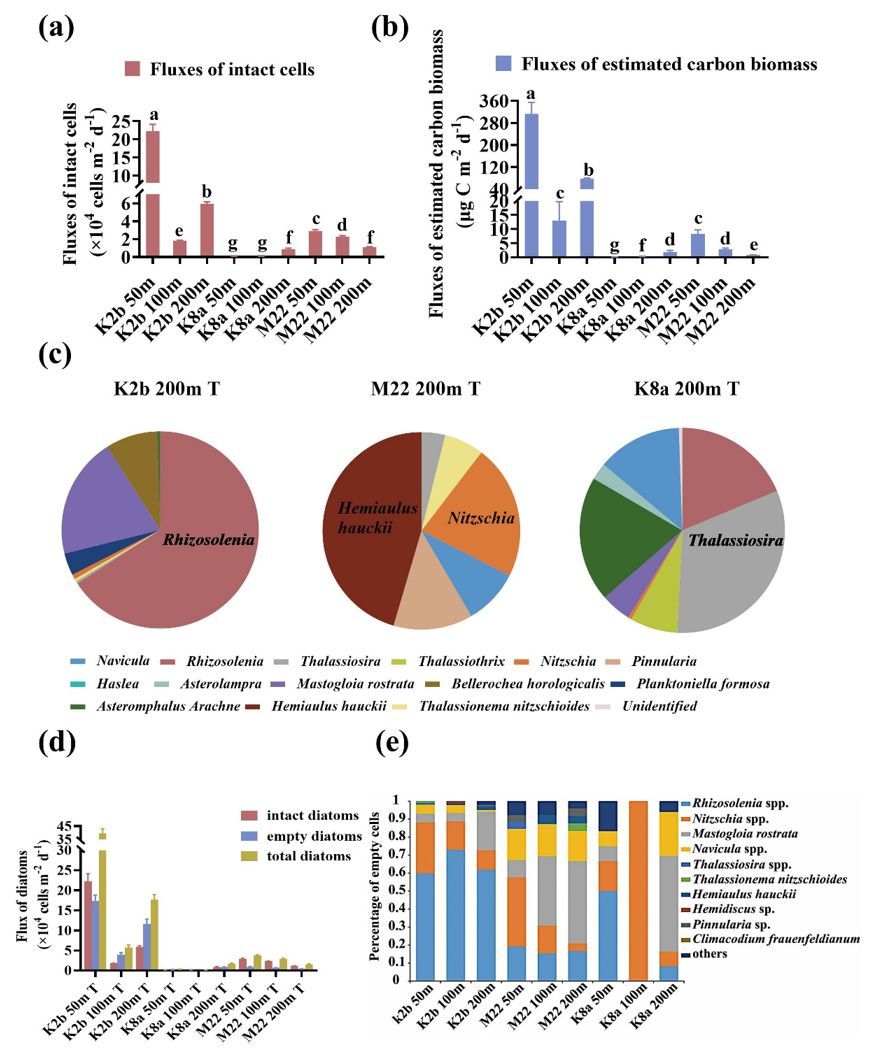
Figure 6Vertical flux of diatom cells at a depth of 200 m in the western NPSG. (a) Fluxes of intact diatom cells. (b) Fluxes of estimated carbon biomass. Different lowercase letters indicate significant differences in intact cell flux or estimated carbon biomass flux among the samples. (c) Comparison of the relative contributions of diatom genera based on the estimated carbon biomass from the 200 m depth sediment trap. (d) Total, empty, and intact diatom cells in trap samples. (e) Species composition and relative abundance of empty diatom frustules in trap samples. The labels “K2b 5m”, “K2b 150m”, and “K2b 200m” denote water samples collected at depths of 5, 150, and 200 m, respectively, from station K2b. The labels “K2b 50m T”, “K2b 100m T”, and “K2b 200m T” refer to trap samples collected at corresponding depths of 50, 100, and 200 m at station K2b. This naming convention is consistently applied to samples from stations M22 and K8a. Twenty liters of water were collected per depth interval for cell abundance analysis, and one sediment trap tube (10 cm diameter × 50 cm height) was used per depth interval for diatom flux analysis.
Table 1Comparison of diatom cell flux, estimated carbon flux, BSi flux, and diatom contribution to export at 200 m depth across three stations in the western NPSG during summer.
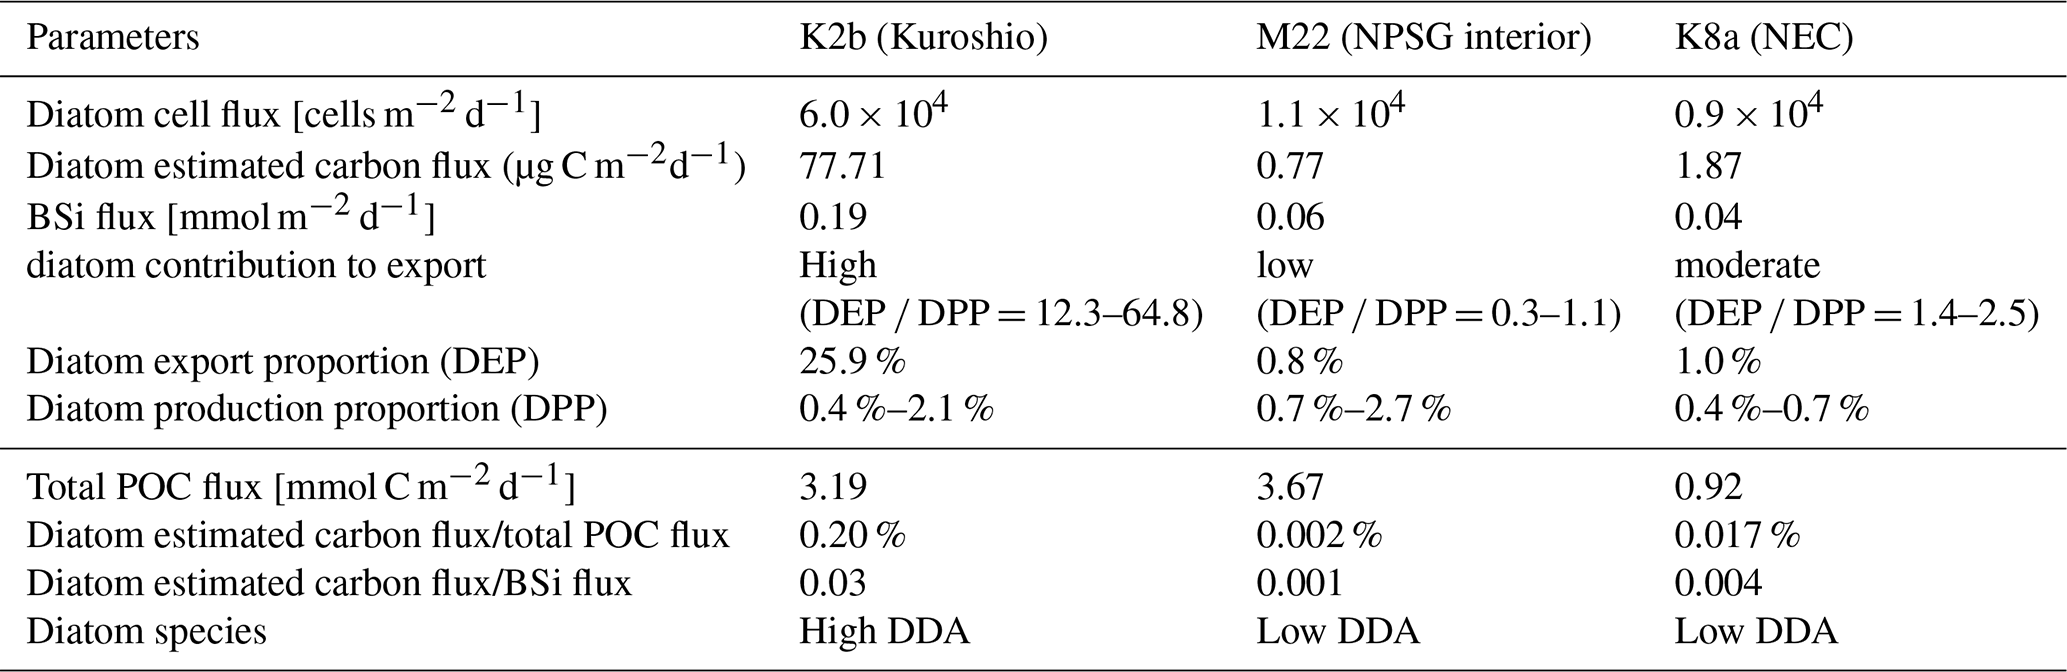
Notes: BSi: biogenic silica; POC flux: particulate organic carbon flux; DDA: diatom–diazotroph associations; Diatom production proportion: the ratio of diatom carbon production to the total carbon production of phytoplankton within the water column; Diatom export proportion: the ratio of diatom carbon export flux to the total phytoplankton carbon export flux.
We inferred the source depth of exported diatoms by matching dominant taxa in sediment traps with their peak occurrence depths in the water column, assuming that export contribution is proportional to source-layer abundance (Scharek et al., 1999a). While widely used, we acknowledge that this assumption may not fully capture species-specific differences in sinking rates or grazing pressure. The taxonomic composition of the exported diatoms closely reflected the vertically stratified source communities. At K2b, export at 200 m was dominated by Rhizosolenia (contributing 66 % of diatom carbon export; Fig. 6c, Table S4), which originated primarily from the NDL (67 %). At Station K8a, export was dominated by Thalassiosira, while at Station M22, Hemiaulus and Nitzschia were the main contributors (Fig. 6c); all were sourced mainly from the NRL (Table S4). This consistency in dominance between water-column and trap samples suggests that water-column taxonomic composition largely determines export composition, with these species sinking passively.
Notably, a significant fraction of sinking cells were empty frustules (Fig. 6d, e), indicating active bacterial degradation of organic matter during sinking, particularly for Rhizosolenia and Nitzschia.
3.6 Local heterogeneity in the contribution of diatom to export
At 200m depth of the three stations, diatom cell fluxes ranged from 0.9 × 10⁴ to 6.0 × 10⁴ cells m−2 d−1. Estimated diatom carbon flux also varied greatly, from 0.77 µg C m−2 d−1 at M22 to 77.71 µg C m−2 d−1 at K2b. Biogenic silica (BSi) flux followed a similar pattern, being highest at K2b (0.19 mmol m−2 d−1) and lowest at K8a (0.04 mmol m−2 d−1).
A notable local disparity in diatom contribution to export was identified among stations (Table 1). We defined this contribution using two metrics: the diatom export proportion (DEP) at 200 m, defined as the ratio of diatom carbon export flux to total phytoplankton carbon export flux, and the diatom production proportion (DPP), defined as the ratio of water-column diatom carbon production to total phytoplankton carbon production. When the ratio DEP DPP > 1, diatom carbon is preferentially exported, indicating a high contribution of diatoms to export. Diatom contribution to export differed markedly among stations (Tables 1, S8, S9). Station K2b showed the highest contribution (DEP = 25.9 % vs. DPP = 0.4 %–2.1 %; DEP DPP = 12.3–64.8). In contrast, Station M22 in the gyre interior exhibited a low contribution (DEP = 0.8 % vs. DPP = 0.7 %–2.7 %; DEP DPP = 0.3–1.1). Station K8a also showed a high contribution, albeit with moderate magnitude, with DEP (1.0 %) slightly above its DPP (0.4 %–0.7 %) and DEP DPP = 1.4–2.5. Correspondingly, diatom carbon flux relative to total POC flux was highest at K2b (0.20 %) and much lower at M22 (0.002 %) and K8a (0.017 %). The ratio of diatom carbon flux to BSi flux was also highest at K2b (0.03), suggesting that a larger fraction of exported carbon was associated with diatom biomass at this site. Notably, K2b was the only station where a high diatom-diazotroph association (DDA) was observed, whereas M22 and K8a had low DDA levels.
Among the three stations studied, diatom carbon export was not directly correlated with total POC flux (Table 1), suggesting that different factors may regulate these two quantities. However, this observation is based on a small number of stations and requires further testing with larger datasets. If this decoupling is confirmed, it would imply that the community structure of diatoms and the functional traits of dominant species, rather than the total production, are primary drivers of the diatom's contribution to export.
3.7 Metagenomic evidence for limited bacterial degradation of key diatom polymers
Metagenomic analysis of water bacteria across five stations assessed the genetic potential for degrading diatom-derived organic matter (Fig. 7). The high relative abundance of glycosyl transferases (GT) and glycoside hydrolases (GH) within the six functional CAZyme modules (Fig. 7a) indicates a bacterial community adapted for both polysaccharide synthesis (GT) and degradation (GH), highlighting its pivotal role in the processing of environmental carbohydrates, including diatom- derived POC.
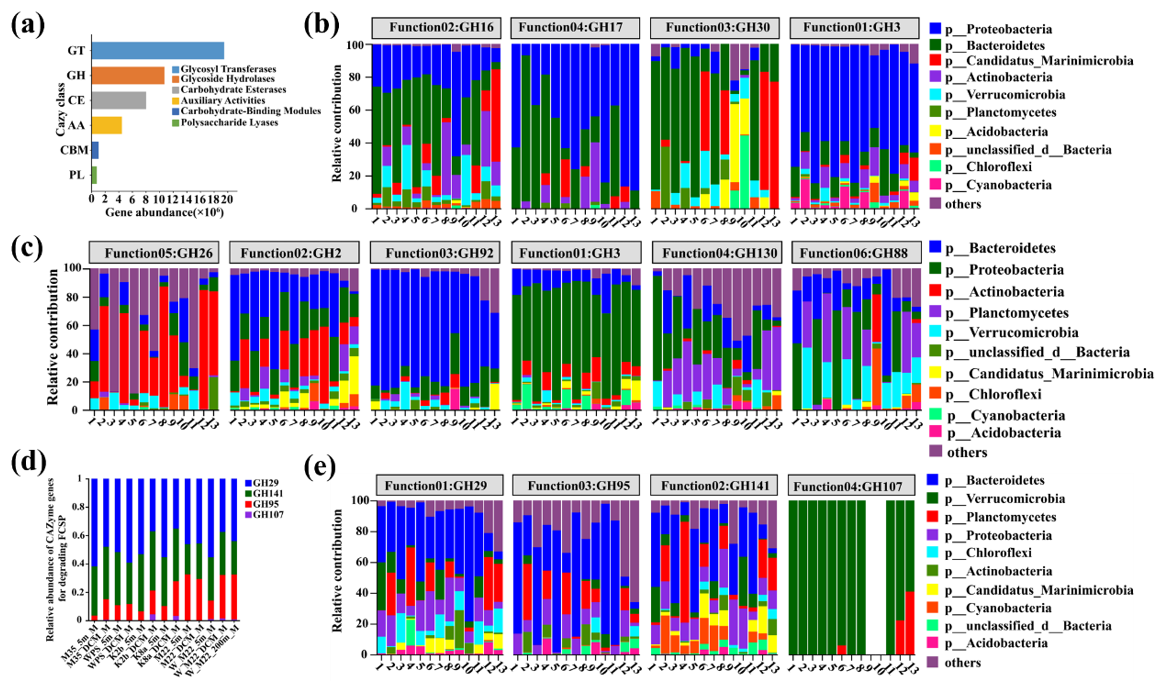
Figure 7Composition and abundance of CAZyme genes, along with the contribution of dominant microbial groups at the phylum level. (a) CAZyme gene composition and abundance detected in this study. (b) Contribution of dominant microbial groups to CAZymes for degrading laminarin. (c) Contribution of dominant microbial groups to CAZymes for degrading mannans. (d) Composition and relative abundance of CAZyme genes for degrading fucose-containing sulfated polysaccharides (FCSP). (e) Contribution of dominant microbial groups to CAZymes for degrading FCSP. “M35_ 5m_ M” and “M35_ DCM_M” denote water samples collected at depths of 5 m and the depth of maximum chlorophyll a (DCM), respectively, from station M35 during the summer cruise for metagenomic analysis. This naming convention is consistently applied to samples from four additional stations (WPS, K2b, M22, and K8a). “W_M22_ 5m_M”, “W_M22_DCM_M”, and “W_M22_ 200m_M” refer to water samples collected at depths of 5 m, DCM, and 200 m, respectively, from station M22 during the winter cruise for metagenomic analysis. Samples “1” to “10” represent summer collections at M35_5m, M35_DCM, WPS_5m, WPS_DCM, K2b_5m, K2b_DCM, K8a_5m, K8a_DCM, M22_5m, and M22_DCM, while “11”, “12”, and “13” represent winter collections at M22_5m, M22_DCM, and M22_200m, respectively. Taxa with a relative abundance below 0.01 in all samples were aggregated into the category “others”.
While genes responsible for degrading common diatom polysaccharides like laminarin (e.g. GH16, GH17, GH30, GH3, Unfried et al., 2018) and mannan (e.g. GH26, GH2, GH92, GH3, GH130, GH88, Kappelmann et al., 2019) were widespread and taxonomically diverse (Fig. 7b, c), a key gene for cleaving the sulfated fucan backbone of FCSPs, glycoside hydrolase 107 (GH107) (Nagao et al., 2017), was notably scarce or absent (Fig. 7d, e). Given that dominant diatoms in this region (e.g., Chaetoceros, Thalassiosira, Nitzschia) are known FCSP producers (Huang et al., 2021; Vidal-Melgosa et al., 2021), this genetic deficit suggests a limited bacterial capacity to degrade this specific polymer. Furthermore, genomic analysis of key degraders like Bacteroidetes revealed few polysaccharide utilization loci (PULs), and none targeting FCSPs (Fig. S3). This implies that diatom-derived FCSPs may resist rapid microbial breakdown, potentially enhancing the preservation and export of diatom-associated carbon.
4.1 Local heterogeneity in diatom export contribution are associated with diatom community assemblages
Our results reveal pronounced local heterogeneity in diatom contribution to carbon export among three stations in the western NPSG. Within our limited station coverage, the Kuroshio-influenced station K2b exhibited the highest diatom cell flux, BSi flux, estimated carbon flux, and export contribution (DEP DPP = 12.3–64.8), while the gyre interior station M22 showed the lowest contribution (DEP DPP = 0.3–1.1) despite having a similar or even higher total POC flux. This disparity in the contribution of diatom export is primarily attributed to the distinct dominant export taxa across stations.
The dominant export taxa differed markedly among the investigated stations: Rhizosolenia at K2b, Nitzschia and Hemiaulus at M22, and Thalassiosira at K8a. Their diverse cell sizes directly influence cellular carbon content and their export contribution. Rhizosolenia is the largest and most carbon-rich; its dominance at K2b, contributes to its highest export contribution. This indicates that cell size and carbon content are key functional traits associated with contribution. In contrast, the smaller Nitzschia and Thalassiosira, although abundant in both water and traps at M22 and K8a, contributed less carbon per cell, thereby accounting for the lower contributions at those stations. These findings are consistent with the established view that larger cells sink faster and carry more carbon per individual (Tréguer et al., 2018). Thus, our taxonomic and trait-based analyses provide evidence that diatom community composition may modulate export magnitude and composition. Overall, diatom export contribution is not simply a function of total productivity but is associated with community composition.
Previous studies have also reported the role of Rhizosolenia in deep (2000–4000 m) export events at Staion ALOHA and elsewhere (Scharek et al., 1999b; Agusti et al., 2015), as well as its potential for rapid, aggregate-mediated sinking (Agusti et al., 2015). These findings propose a hypothesis that Rhizosolenia potentially play a key role in the deep-sea carbon sink of the western NPSG. Despite the relatively lower export contribution at M22, Nitzschia has also been previously identified in the deep ocean (1003) in the northern South China Sea (Ran et al., 2015). It represents a high-efficiency pathway for organic carbon export relative to silica (low Si C ratio; Brzezinski, 1985). Therefore, it may also facilitate long-term carbon sequestration (Sabine et al., 2004; Ran et al., 2015; Zhang et al., 2018). Other taxa such as Thalassiosira and Chaetoceros possess additional traits (e.g., resting spores, polymer exudation) that may also be associated with enhanced export (Rembauville et al., 2016; Huang et al., 2021; Vidal-Melgosa et al., 2021). Thus, although the immediate export contribution at M22 or K8a appears low, their dominant exported diatom taxa could possibly exert a long-term influence on carbon storage owing to their capacity to reach depths below 1000 m. Naturally, this possibility necessitates future validation using deeper sediment trap samples.
Taken together, these findings suggest that a trait-based approach, which takes into account key functional groups rather than solely total biomass, is beneficial for understanding the ocean's carbon sink. It should be noted that our observations are based on limited spatial and temporal coverage, and the long-term implications of the observed export patterns require further testing.
4.2 Local hydrodynamic conditions may influence the assemblages of diatom communities
Previous study has shown that shallow mixed layers favor the growth of diatom-diazotroph associations (DDAs) and large, carbon-rich taxa (Foreman et al., 2026). Similarly, the shallow mixed layer (10–20 m) at the Kuroshio-influenced station K2b may help retain large diatoms such as Rhizosolenia in the surface layer. Moreover, K2b displayed the highest measured rates of fixed nitrogen release (higher surface NH concentrations observed at K2b than at other stations; Fig. S2) compared to stations M22 and K8a, despite peak nitrogen fixation rates being recorded in the interior NPSG (Dai et al., 2023; Shen et al., 2024). Therefore, nitrogen fixation provides a critical source of bioavailable nitrogen, which may support the proliferation of Rhizosolenia and thereby enhance diatom-mediated carbon export at K2b. This finding is in line with prior observations at Station ALOHA in the eastern NPSG, where episodic DDA blooms drive significant export (Scharek et al., 1999a; Karl et al., 2012).
In contrast, the gyre interior (M22) and NEC station (K8a) have deeper mixed layers (∼ 50 and ∼ 90 m, respectively), which more strongly restrict surface nutrient availability. Under such conditions, the dominant sinking taxa mainly originate from the DCM and consist of smaller diatoms (Nitzschia and Thalassiosira) with lower cellular carbon content. Notably, our study showed that the abundance of Thalassiosira had a significant strong positive correlation with NO and NO + NO (r=1, P< 0.001 for both). At K8a, nutrient concentrations of NO and NO + NO at the base of the euphotic layer were higher than at other stations, which may favor the growth of DCM-dominant species such as Thalassiosira.
These observations suggest that local hydrodynamic conditions, specifically the varying depth of the mixed layer and the associated nutrient regimes, may influence different diatom assemblages. These assemblages, in turn, contribute to the diverse export contributions observed across stations.
4.3 Microbial degradation resistance may enhance the contribution to exports
A novel aspect of our study is the metagenomic evidence indicating limited bacterial capacity for degrading FCSPs. FCSPs are produced by many diatoms, including Chaetoceros, Thalassiosira, and Nitzschia, all of which are present in our samples. The near-absence of GH107 genes, which encode enzymes essential for cleaving the sulfated fucan backbone of FCSPs, suggests that these polymers may resist rapid microbial breakdown. This biochemical resistance is associated with enhanced particle aggregation and preservation during sinking, thereby increasing carbon transfer efficiency. We acknowledge that our evidence is indirect (based on gene presence/absence rather than expression or enzymatic activity) and that FCSP production was not directly measured. Nevertheless, the combination of widespread FCSP-producing diatoms and limited degradation potential supports the view that biochemical resistance, together with diatom community assemblages, is associated with local export heterogeneity
4.4 A framework for local heterogeneity in the western NPSG
Previous work at Station ALOHA in the eastern NPSG has demonstrated that episodic DDA blooms drive substantial diatom export (Scharek et al., 1999a, b; Karl et al., 2012). Our observations from the western NPSG extend these findings by showing that local heterogeneity in diatom contribution to carbon export exists and is associated with both diatom community assemblages (linked to hydrodynamics and nutrient supply) and microbial degradation resistance (via limited FCSP-targeting enzymes). This framework complements other mechanisms (e.g., grazing, aggregation) and highlights two underappreciated factors in oligotrophic systems. Future studies should test this framework with expanded station networks, seasonal sampling, and direct measurements of FCSP degradation. From a broader perspective, predicting the biological pump's response to global change may require accounting not only for which diatoms are present, but also for which of their organic byproducts are protected from rapid remineralization.
4.5 Limitations of this study
In this study, several limitations should be considered. (1) Spatial and temporal coverage: Our conclusions are based on five stations sampled in a single summer cruise, with sediment trap data at only three stations; winter trap data are absent. Thus, the observed patterns may not represent full spatial or temporal variability. (2) Methodological biases: The diatom enumeration method (sedimentation concentration) likely underestimates large or fragile taxa such as Rhizosolenia in both water and trap samples; however, this does not substantially affect the interpretation of K2b's high export contribution due to the high value of DEP DPP ratio (12.3–64.8) at K2b. Carbon biomass estimates mainly rely on cellsize measurements and volume-to-carbon conversions rather than direct measurements, but our approach accounts for sitespecific variations in cell size and thus more accurately reflects oligotrophic diatoms. This methodological choice also has limited impact on the comparative conclusions regarding export contribution. (3) Indirect evidence for FCSP degradation: Our metagenomic evidence is based on gene presence/absence, not direct measurements of enzymatic activity or degradation rates. Thus, the proposed associations should be interpreted with caution.
Given these constraints, our findings should be interpreted within the context of the sampled stations and season. Future work should include multi-season, multi-year sampling, direct measurements of diatom carbon content in oligotrophic waters, and experimental tests of FCSP degradability. Despite these limitations, our integrated approach provides a mechanistic, process-oriented foundation for understanding local heterogeneity in diatom-driven carbon export in oligotrophic oceans.
This study investigated whether and how diatoms maintain a high contribution to carbon export in the oligotrophic western NPSG, and what factors are associated with local heterogeneity. Our results lead to the following conclusions. Diatoms can maintain a high contribution to carbon export in this oligotrophic region, but the magnitude varies locally. Within our limited station coverage, diatom contribution to export (assessed by DEP DPP) was high at both the Kuroshio-influenced station K2b (driven by large, carbonrich Rhizosolenia) and the NEC station K8a, as indicated by DEP DPP > 1, although the degree of contribution differed between the two stations (K2b > K8a). In contrast, at the gyre interior station M22, diatoms did not exhibit a high contribution to export, as DEP DPP < 1. We propose a framework in which diatom community assemblages (linked to hydrodynamics and nutrient supply) and microbial degradation resistance (via limited FCSP-targeting enzymes) are associated with local heterogeneity in diatom contribution to carbon export.
The data that supports the findings of this study are available in the Supplement of this article. The raw metagenomic dataset has been deposited in China national center for Bioinformation with the project ID https://ngdc.cncb.ac.cn/gsub/submit/bioproject/PRJCA069659/overview (last access: 24 July 2026).
The supplement related to this article is available online at https://doi.org/10.5194/bg-23-5419-2026-supplement.
FL: Investigation, Writing – original draft, Formal analysis; HJ: Investigation, Visualization; LL: Formal analysis, Visualization; ZJ: Formal analysis, Visualization; LH: Formal analysis, Visualization; KF: Formal analysis, Visualization; ZW: Investigation; XL: Investigation; CC: Resources; KZ: Investigation, Formal analysis; JL: Conceptualization, Funding acquisition, Resources, Writing – original draft, Validation, Writing – review & editing. The final manuscript was approved by all the authors.
The contact author has declared that none of the authors has any competing interests.
Publisher's note: Copernicus Publications remains neutral with regard to jurisdictional claims made in the text, published maps, institutional affiliations, or any other geographical representation in this paper. The authors bear the ultimate responsibility for providing appropriate place names. Views expressed in the text are those of the authors and do not necessarily reflect the views of the publisher.
The authors gratefully acknowledge the financial support of the National Natural Science Foundation of China. Environmental data were kindly provided by Dr. Xianghui Guo and Zhimian Chao from College of Ocean and Earth Sciences, Xiamen University, Xiamen, China.
This work was supported by the National Natural Science Foundation of China (grant nos. 41890804, 42276037, and 42076115)
This paper was edited by Emilio Marañón and reviewed by two anonymous referees.
Agusti, S., González-Gordillo, J. I., Vaqué, D., Estrada, M., Cerezo, M. I., Salazar, G., Gasol, J. M., and Duarte, C. M.: Ubiquitous healthy diatoms in the deep sea confirm deep carbon injection by the biological pump, Nat. Commun., 6, 7608, https://doi.org/10.1038/ncomms8608, 2015.
Belcher, A., Henley, S. F., Hendry, K., Wootton, M., Friberg, L., Dallman, U., Wang, T., Coath, C., and Manno, C.: Seasonal cycles of biogeochemical fluxes in the Scotia Sea, Southern Ocean: a stable isotope approach, Biogeosciences, 20, 3573–3591, https://doi.org/10.5194/bg-20-3573-2023, 2023.
Brzezinski, M. A.: The Si:C:N ratio of marine diatoms: interspecific variability and the effect of some environmental variables, J. Phycol., 21, 347–357, https://doi.org/10.1111/j.0022-3646.1985.00347.x, 1985.
Buzas, M. A. and Hayek, L.-A. C.: On richness and evenness within and between communities, Paleobiology, 31, 199–220, http://www.jstor.org/stable/4096804 (last access: 20 December 2025), 2005.
Cao, Z., Wang, D., Zhang, Z., Zhou, K., Liu, X., Wang, L., Huang, B., Cai, P., and Dai, M.: Seasonal dynamics and export of biogenic silica in the upper water column of a large marginal sea, the northern South China Sea, Prog. Oceanogr., 188, 102421, https://doi.org/10.1016/j.pocean.2020.102421, 2020.
Chen, D., Shi, Z., Li, R., Li, X., Cheng, Y., and Xu, J.: Hydrodynamics drives shifts in phytoplankton community composition and carbon-to-chlorophyll a ratio in the northern South China Sea, Front. Mar. Sci., 10, 1293354, https://doi.org/10.3389/fmars.2023.1293354, 2023.
Chitari, R. R. and Anil, A. C.: Estimation of diatom and dinoflagellate cell volumes from surface waters of the Northern Indian Ocean, Oceanologia, 59, 389–395, https://doi.org/10.1016/j.oceano.2017.03.001, 2017.
Dai, M., Luo, Y., Achterberg, E. P., Browning, T. J., Cai, Y., Cao, Z., Chai, F., Chen, B., Church, M. J., Ci, D., Du, C., Gao, K., Guo, X., Hu, Z., Kao, S., Laws, E. A., Lee, Z., Lin, H., Liu, Q., Liu, X., Luo, W., Meng, F., Shang, S., Shi, D., Saito, H., Song, L., Wan, X. S., Wang, Y., Wang, W., Wen, Z., Xiu, P., Zhang, J., Zhang, R., and Zhou, K.: Upper Ocean Biogeochemistry of the Oligotrophic North Pacific Subtropical Gyre: From Nutrient Sources to Carbon Export, Rev. Geophys., 61, e2022RG000800, https://doi.org/10.1029/2022RG000800, 2023.
Dixon, P.: VEGAN, a package of R functions for community ecology, J. Vegetation Sci., 14, 927–930, https://doi.org/10.1111/j.1654-1103.2003.tb02228.x, 2003.
Dore, J. E., Letelier, R. M., Church, M. J., Lukas, R., and Karl, D. M.: Summer phytoplankton blooms in the oligotrophic North Pacific Subtropical Gyre: Historical perspective and recent observations, Prog. Oceanogr., 76, 2–38, https://doi.org/10.1016/j.pocean.2007.10.002, 2008.
Du, C., Dai, M., Liu, Z., Hu, Z., Yang, J.-Y. T., Zhou, K., Lin, H., Yuan, Z., Wang, L., Huang, T., Guo, L., Wang, Z., and Kao, S.-J.: Diapycnal fluxes of nutrients in the North Pacific Subtropical Gyre, Global Planet. Change, 253, 104973, https://doi.org/10.1016/j.gloplacha.2025.104973, 2025.
Eppley, R. W., Reid, F., and Strickland, J.: Estimates of phytoplankton crop size, growth rate, and primary production, Calif. Univ. Scripps Inst. Oceanogr. Bull., 17, 33–42, ISBN 0520093623, 1970.
Foreman, R. K., Barone, B., Grabowski, E., Bjorkman, K. M., HenderikxFreitas, F., Garcia, C. A., Manck, L. E., White, A. E., Church, M. J., and Karl, D. M.: Biogeochemical anatomy and ecosystem dynamics of a large phytoplankton bloom north of the Hawaiian Islands, Prog. Oceanogr., 241, 103620, https://doi.org/10.1016/j.pocean.2025.103620, 2026.
Fu, L., Niu, B., Zhu, Z., Wu, S., and Li, W.: CD-HIT: accelerated for clustering the next-generation sequencing data, Bioinformatics, 28, 3150–3152, https://doi.org/10.1093/bioinformatics/bts565, 2012.
Guidi, L., Chaffron, S., Bittner, L., Eveillard, D., Larhlimi, A., Roux, S., Darzi, Y., Audic, S., Berline, L., Brum, J. R., Coelho, L. P., Espinoza, J. C. I., Malviya, S., Sunagawa, S., Dimier, C., Kandels-Lewis, S., Picheral, M., Poulain, J., Searson, S., Tara Oceans Consortium Coordinators, Stemmann, L., Not, F., Hingamp, P., Speich, S., Follows, M., Karp-Boss, L., Boss, E., Ogata, H., Pesant, S., Weissenbach, J., Wincker, P., Acinas, S. G., Bork, P., De Vargas, C., Iudicone, D., Sullivan, M. B., Raes, J., Karsenti, E., Bowler, C., and Gorsky, G.: Plankton networks driving carbon export in the oligotrophic ocean, Nature, 532, 465–470, https://doi.org/10.1038/nature16942, 2016.
Harrison, P. J., Zingone, A., Mickelson, M. J., Lehtinen, S., Ramaiah, N., Kraberg, A. C., Sun, J., McQuatters-Gollop, A., and Jakobsen, H. H.: Cell volumes of marine phytoplankton from globally distributed coastal data sets, Estuar. Coast Shelf S., 162, 130–142, https://doi.org/10.1016/j.ecss.2015.05.026, 2015.
Henson, S., Le Moigne, F., and Giering, S.: Drivers of Carbon Export Efficiency in the Global Ocean, Global Biogeochem. Cy., 33, 891–903, https://doi.org/10.1029/2018GB006158, 2019.
Huang, B., Hu, J., Xu, H., Cao, Z., and Wang, D.: Phytoplankton community at warm eddies in the northern South China Sea in winter 2003/2004, Deep-Sea Res. Pt. II., 57, 1792–1798, https://doi.org/10.1016/j.dsr2.2010.04.005, 2010.
Huang, G., Vidal-Melgosa, S., Sichert, A., Becker, S., Fang, Y., Niggemann, J., Iversen, M. H., Cao, Y., and Hehemann, J.: Secretion of sulfated fucans by diatoms may contribute to marine aggregate formation, Limnol. Oceanogr., 66, 3768–3782, https://doi.org/10.1002/lno.11917, 2021.
Jiang, Z., Gao, Y., Chen, Y., Du, P., Zhu, X., Liao, Y., Liu, X., and Zeng, J.: Spatial heterogeneity of phytoplankton community shaped by a combination of anthropogenic and natural forcings in a long narrow bay in the East China Sea, Estuar. Coast Shelf S., 217, 250–261, https://doi.org/10.1016/j.ecss.2018.11.028, 2019.
Kappelmann, L., Krüger, K., Hehemann, J.-H., Harder, J., Markert, S., Unfried, F., Becher, D., Shapiro, N., Schweder, T., Amann, R. I., and Teeling, H.: Polysaccharide utilization loci of North Sea Flavobacteriia as basis for using SusC/D-protein expression for predicting major phytoplankton glycans, ISME J., 13, 76–91, https://doi.org/10.1038/s41396-018-0242-6, 2019.
Karl, D. M., Church, M. J., Dore, J. E., Letelier, R. M., and Mahaffey, C.: Predictable and efficient carbon sequestration in the North Pacific Ocean supported by symbiotic nitrogen fixation, P. Natl. Acad. Sci. USA, 109, 1842–1849, https://doi.org/10.1073/pnas.1120312109, 2012.
Kieser, S., Brown, J., Zdobnov, E. M., Trajkovski, M., and McCue, L. A.: ATLAS: a Snakemake workflow for assembly, annotation, and genomic binning of metagenome sequence data, BMC Bioinf., 21, 257, https://doi.org/10.1186/s12859-020-03585-4, 2020.
Krause, J. W., Brzezinski, M. A., Villareal, T. A., and Wilson, C.: Biogenic silica cycling during summer phytoplankton blooms in the North Pacific subtropical gyre, Deep-Sea Res. Pt. I, 71, 49–60, 2013.
Kunakh, O. M., Volkova, A. M., Tutova, G. F., and Zhukov, O. V.: Diversity of diversity indices: Which diversity measure is better, Biosys. Divers., 31, 131–146, https://doi.org/10.15421/012314, 2023.
Kwon, E. Y., Primeau, F., and Sarmiento, J. L.: The impact of remineralization depth on the air–sea carbon balance, Nat. Geosci., 2, 630–635, https://doi.org/10.1038/ngeo612, 2009.
Lam, P. J., Lee, J.-M., Heller, M. I., Mehic, S., Xiang, Y., and Bates, N. R.: Size-fractionated distributions of suspended particle concentration and major phase composition from the U.S. GEOTRACES Eastern Pacific Zonal Transect (GP16), Mar. Chem., 201, 90–107, https://doi.org/10.1016/j.marchem.2017.08.013, 2018.
Letscher, R. T., Primeau, F., and Moore, J. K.: Nutrient budgets in the subtropical ocean gyres dominated by lateral transport, Nat. Geosci., 9, 815–819, https://doi.org/10.1038/ngeo2812, 2016.
Li, C., Tan, L., Gao, Y., Li, X., Sun, L., Liang, J., Zhang, J., Huang, L. and Chen, C.:Morphology of Amphora lunulata AH Wachnicka & EE Gaiser and its transfer to Seminavis DG Mann, Diatom Res., 37, 63–69, https://doi.org/10.1080/0269249X.2022.2041490, 2022.
Li, D., Wang, H., Li, Y., Cao, Y., Wu, K., and Wang, Q.: Current trends and hotspots of etiology of auditory neuropathy in the past 30 years: A bibliometric analysis, J. Otol., 19, 113–119, https://doi.org/10.1016/j.joto.2024.07.003, 2024.
Liu, X., Xiao, W., Landry, M. R., Chiang, K.-P., Wang, L., and Huang, B.: Responses of Phytoplankton Communities to Environmental Variability in the East China Sea, Ecosystems, 19, 832–849, https://doi.org/10.1007/s10021-016-9970-5, 2016.
Menden-Deuer, S. and Lessard, E. J.: Carbon to volume relationships for dinoflagellates, diatoms, and other protist plankton, Limnol. Oceanogr., 45, 569–579, https://doi.org/10.4319/lo.2000.45.3.0569, 2000.
McDonnell, A. M. P., Boyd, P. W., and Buesseler, K. O.: Effects of sinking velocities and microbial respiration rates on the attenuation of particulate carbon fluxes through the mesopelagic zone, GBC, 29, 175–193, https://doi.org/10.1002/2014GB004935, 2015.
Nagao, T., Kumabe, A., Komatsu, F., Yagi, H., Suzuki, H., and Ohshiro, T.: Gene identification and characterization of fucoidan deacetylase for potential application to fucoidan degradation and diversification, J. Biosci. Bioeng., 124, 277–282, https://doi.org/10.1016/j.jbiosc.2017.04.002, 2017.
Noguchi, H., Park, J., and Takagi, T.: MetaGene: prokaryotic gene finding from environmental genome shotgun sequences, Nucleic Acids Res., 34, 5623–5630, https://doi.org/10.1093/nar/gkl723, 2006.
Pielou, E. C.: The measurement of diversity in different types of biological collections, J. Theor. Biol., 13, 131–144, https://doi.org/10.1016/0022-5193(66)90013-0, 1966.
Ran, L., Chen, J., Wiesner, M. G., Ling, Z., Lahajnar, N., Yang, Z., Li, H., Hao, Q., and Wang, K.: Variability in the abundance and species composition of diatoms in sinking particles in the northern South China Sea: Results from time-series moored sediment traps, Deep-Sea Res. Pt. II, 122, 15–24, https://doi.org/10.1016/j.dsr2.2015.07.004, 2015.
Rath, A. R. and Mitbavkar, S.: Diatom community dynamics in a tropical brackish coastal ecosystem from an ecological and biogeochemical perspective: A size-fractionated approach, Cont. Shelf Res., 263, 105039, https://doi.org/10.1016/j.csr.2023.105039, 2023.
Rembauville, M., Manno, C., Tarling, G.A., Blain, S., and Salter, I.: Strong contribution of diatom resting spores to deep-sea carbon transfer in naturally iron-fertilized waters downstream of South Georgia, Deep-Sea Res. Pt. I, 115, 22–35, https://doi.org/10.1016/j.dsr.2016.05.002, 2016.
Sabine, C. L., Feely, R. A., Gruber, N., Key, R. M., Lee, K., Bullister, J. L., Wanninkhof, R., Wong, C. S., Wallace, D. W. R., Tilbrook, B., Millero, F. J., Peng, T.-H., Kozyr, A., Ono, T., and Rios, A. F.: The Oceanic Sink for Anthropogenic CO2, Science, 305, 367–371, https://doi.org/10.1126/science.1097403, 2004.
Scharek, R., Tupas, L., and Karl, D.: Diatom fluxes to the deep sea in the oligotrophic North Pacific gyre at Station ALOHA, Mar. Ecol. Prog. Ser., 182, 55–67, https://doi.org/10.3354/meps182055, 1999a.
Scharek, R., Latasa, M., Karl, D. M., and Bidigare, R. R.: Temporal variations in diatom abundance and downward vertical flux in the oligotrophic North Pacific gyre, Deep-Sea Res. Pt. I., 46, 1051–1075, https://doi.org/10.1016/S0967-0637(98)00102-2, 1999b.
Schreiber, F., Littmann, S., Lavik, G., Escrig, S., Meibom, A., Kuypers, M. M. M., and Ackermann, M.: Phenotypic heterogeneity driven by nutrient limitation promotes growth in fluctuating environments, Nat. Microbiol., 1, 16055, https://doi.org/10.1038/nmicrobiol.2016.55, 2016.
Shen, H., Wan, X. S., Zou, W., Dai, M., Xu, M. N., and Kao, S.-J.: Light-driven integration of diazotroph-derived nitrogen in euphotic nitrogen cycle, Nat. Commun., 15, 9193, https://doi.org/10.1038/s41467-024-53067-x, 2024.
Simon, E., Lacour, L., Claustre, H., Bock, N., Cornec, M., Sauzède, R., Schmechtig, C., and Coppola, L.: Linking Surface Phytoplankton Dynamics to Small-Particle Fluxes in the Mesopelagic Zone: Insights From High Latitude Bioregions Using BGC-Argo Floats, GBC, 39, e2024GB008447, https://doi.org/10.1029/2024GB008447, 2025.
Siqueiros Beltrones, D. A., Echevarría Herrera, E., López-Fuerte, F. O., and Martínez, Y. J.: Species Diversity of Benthic Marine Diatoms from a Natural Protected Area in Cuba, Diversity, 17, 181, https://doi.org/10.3390/d17030181, 2025.
Student: The Probable Error of a Mean, Biometrika, 6, 1, https://doi.org/10.2307/2331554, 1908.
Stukel, M. R., Irving, J. P., Kelly, T. B., Ohman, M. D., Fender, C. K., and Yingling, N.: Carbon sequestration by multiple biological pump pathways in a coastal upwelling biome, Nat. Commun., 14, 2024, https://doi.org/10.1038/s41467-023-37771-8, 2023.
Sun, J. and Liu, D.: Geometric models for calculating cell biovolume and surface area for phytoplankton, J. Plankton Res., 25, 1331–1346, https://doi.org/10.1093/plankt/fbg096, 2003.
Taurozzi, D. and Scalici, M.: Climbing the elevational gradient: Diatom diversity patterns across temporary ponds, Environ. Res., 285, 122630, https://doi.org/10.1016/j.envres.2025.122630, 2025.
Tréguer, P., Bowler, C., Moriceau, B., Dutkiewicz, S., Gehlen, M., Aumont, O., Bittner, L., Dugdale, R., Finkel, Z., Iudicone, D., Jahn, O., Guidi, L., Lasbleiz, M., Leblanc, K., Levy, M., and Pondaven, P.: Influence of diatom diversity on the ocean biological carbon pump, Nat. Geosci., 11, 27–37, https://doi.org/10.1038/s41561-017-0028-x, 2018.
Unfried, F., Becker, S., Robb, C. S., Hehemann, J.-H., Markert, S., Heiden, S. E., Hinzke, T., Becher, D., Reintjes, G., Krüger, K., Avcı, B., Kappelmann, L., Hahnke, R. L., Fischer, T., Harder, J., Teeling, H., Fuchs, B., Barbeyron, T., Amann, R. I., and Schweder, T.: Adaptive mechanisms that provide competitive advantages to marine bacteroidetes during microalgal blooms, ISME J., 12, 2894–2906, https://doi.org/10.1038/s41396-018-0243-5, 2018.
Utermöhl, H.: Zur Vervollkommnung der quantitativen Phytoplankton-Methodik: Mit 1 Tabelle und 15 abbildungen im Text und auf 1 Tafel, SIL Communications, 1953–1996, 9, 1–38, https://doi.org/10.1080/05384680.1958.11904091, 1958.
Vidal-Melgosa, S., Sichert, A., Francis, T. B., Bartosik, D., Niggemann, J., Wichels, A., Willats, W. G. T., Fuchs, B. M., Teeling, H., Becher, D., Schweder, T., Amann, R., and Hehemann, J.-H.: Diatom fucan polysaccharide precipitates carbon during algal blooms, Nat. Commun., 12, 1150, https://doi.org/10.1038/s41467-021-21009-6, 2021.
Wang, C., Zhang, K., Cao, Z., Zhou, K., Yuan, Z., Chen, J., Ma, Y., Zhou, B., Liu, X., Cai, Y., Shi, D., and Dai, M.: Size-fractionated C:N:P:Si stoichiometry of particulate matter in the subtropical Western North Pacific, Global Planet. Change, 246, 104732, https://doi.org/10.1016/j.gloplacha.2025.104732, 2025.
Wang, L., Huang, B., Liu, X., and Xiao, W.: The modification and optimizing of the CHEMTAX running in the South China Sea, Acta Oceanol. Sin., 34, 124–131, https://doi.org/10.1007/s13131-015-0621-z, 2015.
Wiedmann, I., Ceballos-Romero, E., Villa-Alfageme, M., Renner, A. H. H., Dybwad, C., van der Jagt, H., Svensen, C., Assmy, P., Wiktor, J. M., Tatarek, A., Rozanska-Pluta, D. M., and Iversen, M. H.: Arctic Observations Identify Phytoplankton Community Composition as Driver of Carbon Flux Attenuation, Geophys. Res. Lett., 47, e2020GL087465, https://doi.org/10.1029/2020GL087465, 2020.
Wong Chin, J. M., Puchooa, D., Bahorun, T., Neergheen, V. S., Aullybux, A. A., Beedessee, G., Nazurally, N., Alrefaei, A. F., and Jeewon, R.: Metabarcoding assessment of fungal diversity in brown algae and sponges of Mauritius, Front. Microbiol., 13, 1003790, https://doi.org/10.3389/fmicb.2022.1003790, 2022.
Xiu, P. and Chai, F.: Eddies Affect Subsurface Phytoplankton and Oxygen Distributions in the North Pacific Subtropical Gyre, Geophys. Res. Lett., 47, e2020GL087037, https://doi.org/10.1029/2020GL087037, 2020.
Yang, Q. and Lin, G.: Species Diversity of Phytoplankton in the Western Pacific, Beijing, Ocean Press, ISBN 9787030635914, 2021 (in Chinese).
Yang, S. and Dong, S.: Atlas of Common Marine Planktonic Diatoms in Chinese Seas, Qingdao, Ocean University of China Press, 2006 (in Chinese).
Zhang, A., Liu, H., Li, C., Chen, C., Liang, J., Sun, L., and Gao, Y.: Relationship between toxic and harmful microalgae and environmental factors in typical mariculture areas of East China Sea, J. Ocean. Limnol., 40, 2401–2415, https://doi.org/10.1007/s00343-022-2125-y, 2022.
Zhang, C., Dang, H., Azam, F., Benner, R., Legendre, L., Passow, U., Polimene, L., Robinson, C., Suttle, C. A., and Jiao, N.: Evolving paradigms in biological carbon cycling in the ocean, Nat. Sci. Rev., 5, 481–499, https://doi.org/10.1093/nsr/nwy074, 2018.
Zhang, L., Wen, Z., Hong, H., Kang, S., Jiang, P., Lin, S. Shi, D., and Li, X. Seasonal shift of dissolved organic matter stoichiometry in the surface North Pacific subtropical gyre: Regulation by enhanced N2 fixation and DOP utilization. Geophys. Res. Lett., 53, e2025GL120193, https://doi.org/10.1029/2025GL120193, 2026.