
the Creative Commons Attribution 4.0 License.
the Creative Commons Attribution 4.0 License.
 | 11 Aug 2026
Exploring silicon isotope fractionation by silicoflagellates: results from a KOSMOS experiment off Peru
Kristin Doering
Allanah Joy Paul
Avy Bernales
Sonia Sanchez Ramirez
Elisabeth von der Esch
Michelle Graco
Tim Boxhammer
Lennart Thomas Bach
Ulf Riebesell
Martin Frank
The Peruvian Upwelling is known for its exceptionally high surface water productivity and the presence of one of the world's largest Oxygen Minimum Zones. The upwelling of silicate-rich subsurface waters typically supports diatom-dominated primary productivity in this region. However, warmer surface waters and subsequent changes in stratification and nutrient supply can cause a shift in plankton communities from diatoms to dinoflagellates and silicoflagellates, which affects the silicon (Si) and carbon (C) cycles.
In 2017, we investigated the Si cycle in a field experiment off the coast of Peru. Pelagic mesocosms (∼55 000 L) were deployed for 50 d from February to April to simulate upwelling conditions, which coincided with a coastal El Niño. This unique setting allowed us to study the evolution of stable silicon isotopes in seawater (δ30SidSi) and its direct comparison to the produced biogenic material (δ30SibSi) without the influence of unaccountable water mass mixing. On day 12, approximately 40 % of the surface water of the mesocosms was replenished with nitrate-depleted deep water (low N : Si and N : P ratios), which strongly influenced the phytoplankton community. Prior to the addition of the deep water, the phytoplankton community was dominated by diatoms but shifted towards a pronounced dominance of flagellates, including silicoflagellates. At the beginning of the experiment, when diatoms dominated the phytoplankton community, the δ30SidSi distribution in the surface water (+1.4 ‰ to +2.5 ‰) was within the same range as observed in previous seawater studies in the Peruvian upwelling. After deep water addition, low N : Si (0.02 to 0.2 mol mol−1), strongly deviating from the preferred 1:1 ratio for diatoms, favored silicoflagellate (and dinoflagellate) growth and resulted in higher δ30SidSi values (up to +4.1 ‰) in the surface waters. The strong increase in δ30SidSi was associated with low δ30SibSi values (−0.26 ‰ to +0.65 ‰) caused by high Si isotope fractionation factors between seawater and silicoflagellates. For the first time, the field experiment allowed us to estimate the Si isotope fractionation factor for silicoflagellates ( ‰ ± 0.56 ‰), which is remarkably high compared to diatoms (−1.1 ‰) and may provide a novel tool to study changes in the present and past marine silicon cycle. However, this value should be confirmed through culture experiments before it can be established as a reliable proxy.
- Article
(4415 KB) - Full-text XML
-
Supplement
(753 KB) - BibTeX
- EndNote


The Peruvian Upwelling is characterized by exceptionally high rates of productivity induced by Ekman suction of subsurface waters enriched in dissolved silicic acid (Si(OH)4, hereafter referred to as dSi) and other macronutrients such as phosphate and nitrate (e.g., Bruland et al., 2005; Strub et al., 1987). The presence of nutrient-rich surface waters and high solar radiation at this low latitude results in high primary productivity along the coast throughout the year, with chlorophyll (Chl a) reaching concentrations of up to 10 mg m−3 (Echevin et al., 2008; Franz et al., 2012). The export of plankton and organic matter from the surface and its decomposition at depth produces one of the largest subsurface oxygen minimum zones (OMZs) in the global ocean (Karstensen et al., 2008; Pennington et al., 2006). Fluctuations in phytoplankton biomass have been linked to intra- and interannual environmental variability, directly affecting the nutrient stoichiometry and phytoplankton communities (Echevin et al., 2008; Ochoa et al., 2010). Coastal upwelling off Peru occurs year-round, reaching peak intensity during the austral winter (June–September) when strengthened trade winds drive nutrient-rich conditions, marked by high concentrations of dSi in surface waters. This environment is highly favorable for the growth of diatoms, a group of phytoplankton that have a strict requirement for silica, which they use to build their cell walls, known as frustules (e.g., Tréguer et al., 2018; Werner, 1977). Diatoms play a crucial role in the marine silicon and carbon cycle, as they are the primary organisms responsible for the uptake of dSi and carbon from seawater (Ragueneau et al., 2000).
In contrast, during the austral summer (December to March) or during El Niño–Southern Oscillation (ENSO) warm phases, coastal upwelling is weakened or disrupted. This results in warmer sea surface temperatures, enhanced stratification, and a reduction of dissolved silicate (dSi) concentrations in surface waters. As a result, diatoms, which are highly dependent on dSi, become less competitive, leading to shifts in the phytoplankton community. Later successional phytoplankton stages, such as dinoflagellates and silicoflagellates, which have different ecological and nutritional requirements, become more dominant (e.g. Ochoa et al., 2010). These shifts in phytoplankton composition strongly affect the marine silicon cycle, but also the carbon cycle. While carbon uptake rates in some silicoflagellate species (e.g., Dictyocha perlaevis) have been shown to be comparable to other phototrophic phytoplankton (e.g., Taguchi and Laws, 1985), there is still insufficient data on carbon uptake comparing different species of silicoflagellates or changes in environmental conditions (Closset et al., 2025).
With regard to the marine silicon cycle, diatoms are the most important phytoplankton group in the Peruvian Upwelling System, whereas other silicifying organisms, such as radiolaria and silicoflagellates, play a minor role due to low abundances. These organisms contribute less significantly to the silicon cycle and are generally absent in surface waters during periods of strong upwelling, when diatom blooms are most prevalent (Franz et al., 2012; Grasse et al., 2021).
Several studies in the Peruvian Upwelling investigated the stable Si isotope distribution in seawater (δ30SidSi) and biogenic particles (δ30SibSi) to improve our understanding of the Si cycle at present (Ehlert et al., 2012; Grasse et al., 2013, 2016, 2020, 2021) and in the past (e.g., Doering et al., 2016a, b, 2019; Ehlert et al., 2013). The main factor controlling δ30Si in the euphotic zone is dSi utilization by siliceous phytoplankton, mainly diatoms, which preferentially incorporate the lighter Si isotopes into their frustules thereby elevating the δ30Si of the surrounding seawater (e.g., De La Rocha et al., 1997). Several culture studies have shown that the Si isotope fractionation factor between seawater and diatoms (εdiatom: mean −1.1 ‰ ± 0.4 ‰, 1 s.d.) is species-dependent (De La Rocha et al., 1997; Sutton et al., 2013) and appears to be independent of temperature (12 to 23 °C; De La Rocha et al., 1997), pCO2 concentrations (Milligan et al., 2004), and growth rate (Sun et al., 2014). Further experiments suggest that isotopic fractionation is primarily driven by early kinetic effects during rapid silica precipitation rather than biomolecule-specific processes (Cassarino et al., 2021).
However, some of the results of previous studies are contradictory, and Meyerink et al. (2017) have suggested that nutrient availability (e.g., dSi, Fe, ) affecting growth rate, Si uptake, and bSi content in the cell influences Si isotope fractionation. In addition, isotopic fractionation may be related to the biochemical pathways involved in Si metabolism and may reflect the organism's affinity for dSi and efficiency of Si uptake and utilization. It has remained unclear what exactly the controlling factors of fractionation are and why differences in the Si isotope fractionation factors are observed between different phylogenetic taxa and even on a species level. While silica uptake pathways in diatoms are intensively studied (e.g. Thamatrakoln and Hildebrand, 2008; Closset et al., 2025), those in silicoflagellates remain unknown.
In terms of the isotope fractionation factor, the best-studied group is diatoms, but other marine silicifiers, such as radiolaria, sponges, and choanoflagellates, also show discrimination of the heavy Si isotopes during incorporation. While radiolaria appear to have Si isotope fractionation factors similar to diatoms (Doering et al., 2021), the highest fractionation has been observed for sponges and choanoflagellates (up to −5 ‰ and −7 ‰, respectively; Hendry and Robinson, 2012; Marron et al., 2019; Sutton et al., 2018). The isotope fractionation factor for silicoflagellates (εsilicos) is still unknown and so far, no studies have been conducted on their silica uptake pathways. Silicoflagellates differ markedly from diatoms in their morphological structure. While diatoms possess two overlapping valves with many pores, silicoflagellates form a basket-like skeleton composed of hollow tubes (Preisig, 1994). In some species, double skeletons (often interpreted as pre-division stages) can occur (McCartney et al., 2014).
The assessment of a Si isotope fractionation factor between marine siliceous organisms (e.g., diatoms) and seawater (εSi) during field studies can be based on conceptual models either assuming a Rayleigh-type (closed system) system or a steady-state model (open system; see Grasse et al., 2021). Applying these models to a highly dynamic system such as the Peruvian Upwelling is challenging, since the temporal evolution of δ30SidSi is often oversimplified. A more accurate reconstruction of dSi utilization requires accounting for additional processes, including mixture from multiple sources (vertical and horizontal nutrient supply, as well as repeated nutrient intrusions), and the integration of dissolution processes (Grasse et al., 2021). In addition, the dissolution of biogenic material in the euphotic zone may bias estimations of the Si isotope fractionation factor towards lower values (Grasse et al., 2013, 2016, 2021).
In 2017, we conducted a KOSMOS (Kiel Off-Shore Mesocosms for Future Ocean Simulations) experiment off Lima (Peru) for 50 d to understand how upwelling of water masses with different nutrient stoichiometries (N : Si and N : P) affects phytoplankton communities. While upwelling of nutrient rich water in the Peruvian upwelling generally induces diatom blooms (e.g. Franz et al., 2012; Grasse et al., 2021), low N : Si ratios would lead to shifts in the phytoplankton communities. The unique setting of the experiment made it possible to study the evolution of δ30SidSi and δ30SibSi in a closed system without the influence of horizontal water mass mixing. We observed a shift from a diatom-dominated community (day 1 to 10, phase I) to a (silico-)flagellate-dominated community (day 13 to 42, phase II). This shift provided novel insights into the silicon cycle in the Peruvian upwelling system, enabling us to determine a silicon isotope fractionation factor for silicoflagellates for the first time. In addition, the newly obtained data shows the potential impact of silicoflagellates on the composition of dissolved silicon isotopes in upwelling regions. This allows us to identify the environmental conditions under which their contribution could have a measurable impact on the distribution of marine silicon isotopes.
2.1 Mesocosm set-up and sampling
Eight mesocosms (M1–M8) were deployed 6 km off the Peruvian coast close to San Lorenzo Island (12.0555° S, 77.2348° W). Each mesocosm consisted of a cylindrical, 17 m long polyurethane bag (2 m diameter) attached to a conical sediment trap (2 m) in an 8 m tall flotation frame. On 25 February the water was enclosed in the polyurethane bag containing approximately 55 000 L of water (Fig. 1). The experiment started on 25 February 2017 (Day 0) and was conducted for 50 d (for details on the experiment and sampling schedule, see Bach et al., 2020). After their closure, the waters inside the mesocosms remained isolated from surrounding Pacific seawater. Repetitive sampling of the water column within the mesocosms included an integrated water sample from the mixed layer (ML) and the bottom layer (BL). The lower sampling depth for the ML was adjusted during the experiment to account for a shift in the ML and oxycline depth and included 5, 10, and 13 m, respectively (Table S1 in the Supplement).
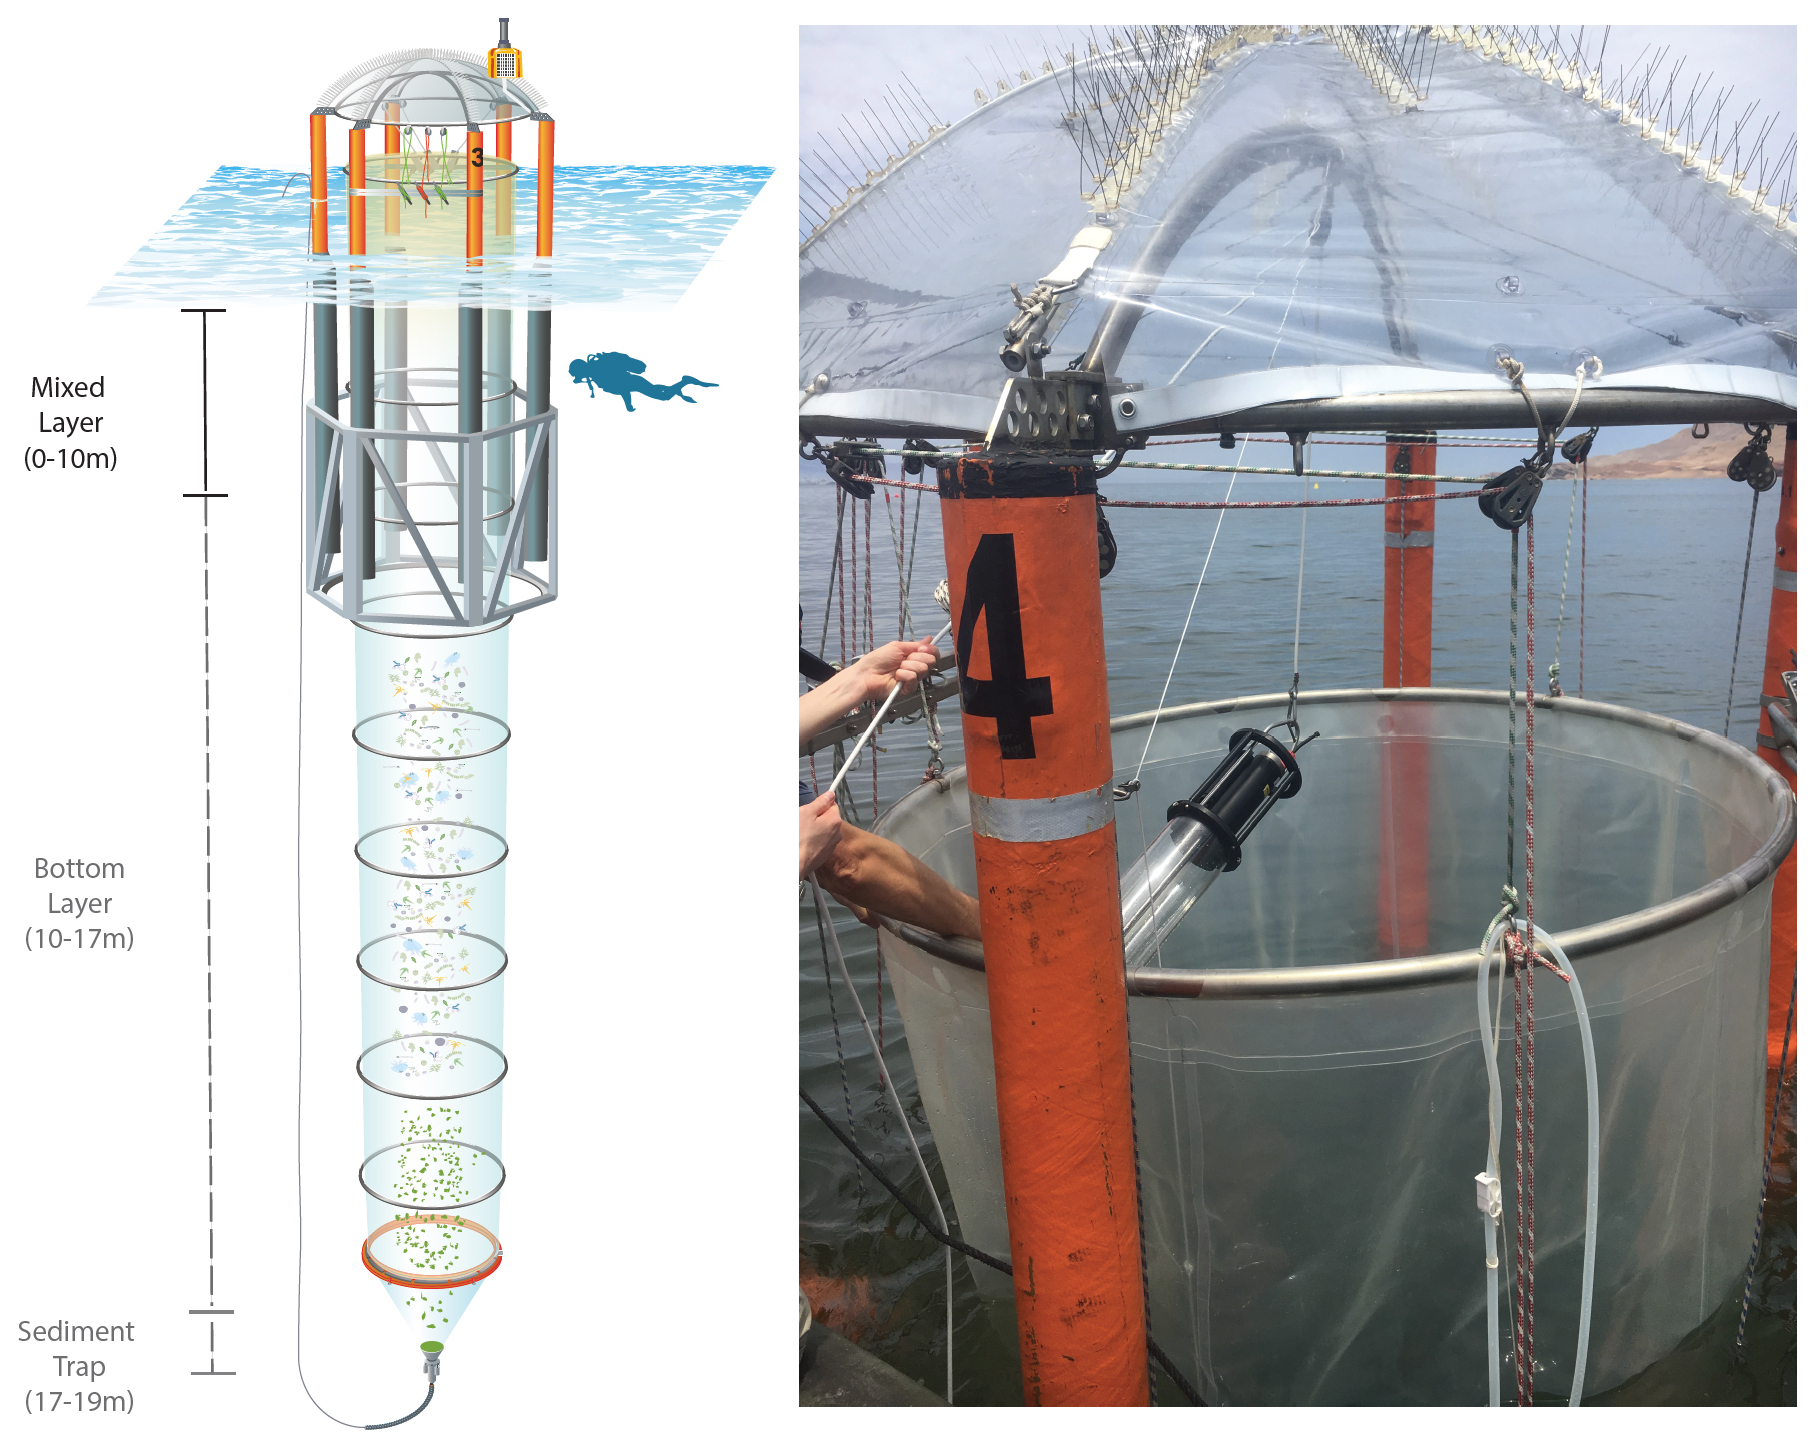
Figure 1Schematic figure of a modified KOSMOS illustration from Rita Erven (GEOMAR) and Bach et al. (2020) (this special issue). Integrated seawater samples were taken from the Mixed Layer (ML) and the Bottom Layer (BL). Please note that the ML/BL sampling depth was adjusted in the course of the entire experiment. This study only discusses data from the ML. Further details are provided in Sect. 2.1. See Bach et al. (2020) for a detailed location map and experimental setup.
DW for the simulated upwelling event was collected along the Instituto del Mar del Perú (IMARPE) time-series transect (Graco et al., 2017). The water was sampled on Day 5 (St. 1; 30 m, St. 12.028° S, 77.22° W) and Day 10 (St. 3, 70 m, 12.04° S, 77.38° W). Samples from both stations were characterized by different nutrient ratios and therefore described as “extreme” (DIN : P of 0.2 mol mol−1; DIN : Si of 0.02 mol mol−1) and “moderate” (DIN : P of 1.7 mol mol−1; DIN : Si of 0.2 mol mol−1) DW. On 8 and 9 March 2017 (Days 11 and 12), we exchanged water enclosed in each mesocosm with water collected from Station 1 (M1, M4, M5, M8) or Station 3 (M2, M3, M6, M7). The exchange was carried out in two steps using a submersible pump (Grundfos SP 17-5R, pump rate ∼18 m3 h−1). On Day 8, BW was exchanged. We installed the pump for about 30 to 40 min in each mesocosm and pumped 9 m3 out of each bag from a depth of 11 to 12 m. On Day 11, the pump was installed inside the collector bags, and 10 m3 of water were injected into a depth of 14 to 17 m. On Day 12, the procedure was repeated to exchange the surface water. In that case, approximately 10 m3 of water were removed from 8 to 9 m depth and replaced with 12 m3 of water evenly to the depth range from 1 to 9 m. This corresponded to an addition of 40 % DW to the surface (mixed) layer.
Sampling and CTD casts within the mesocosms were undertaken from small boats that departed from La Punta Harbor (Callao) and were transported to laboratories in Club Náutico Del Centro Naval and the Instituto del Mar del Perú (IMARPE) for filtration and nutrient measurements. Every 2nd day, subsamples for nutrients and natural Si isotopes were sampled from the mixed layer (ML). For δ30SidSi and δ30SibSi, 115 to 2000 mL of seawater was filtered through a 0.65 µm Polycarbonate filter (Whatman®, 0.65 µm pore size, 47 mm). Immediately after filtration, the seawater filtrate for δ30SidSi was acidified to pH 2 and stored in the dark. Filters for δ30SibSi were dried at 40 °C. Dissolved and particulate Si samples were later processed at GEOMAR, Helmholtz Centre for Ocean Research, Kiel, Germany.
2.2 Dissolved inorganic nutrients and bSi concentrations
Samples for inorganic nutrients were filtered (0.45 µm filter, Sterivex, Merck) immediately after arrival in the laboratories of IMARPE. The subsequent analyses of dSi, , , concentrations were carried out using an autosampler (XY2 autosampler, SEAL Analytical) and a continuous flow analyzer (QuAAtroAutoAnalyzer, SEAL Analytical) connected to a fluorescence detector (FP-2020, JASCO). Phosphate and dSi were analyzed colorimetrically following the procedures by Murphy and Riley (1962) and Mullin and Riley (1955), respectively. Nitrate and nitrite were quantified via the formation of a pink azo dye as established by Morris and Riley (1963). Ammonium concentrations were determined fluorometrically (Kérouel and Aminot, 1997). The accuracy was monitored by including certified reference materials (CRM; BW, KANSO) during measurement sessions and ranged between ±5 % to ±10 %. For further analytical details see Bach et al. (2020). BSi filters were leached with 0.1 M NaOH at 85 °C in 60 mL Nalgene polypropylene bottles at Club Náutico Del Centro Naval. After 135 min, the leaching process was terminated with 0.05 M H2SO4, and the dSi concentration was measured spectrophotometrically following Hansen and Koroleff (1999). The bSi concentration was measured for all size fractions, as well as for size classes smaller than 20 µm and larger than 20 µm.
2.3 Phytoplankton assemblages
Seawater subsamples from the ML (25 and 50 mL) were analyzed for phytoplankton assemblages (including dead cells) in the laboratories of IMARPE (Instituto del Mar del Perú, La Punta). Cell counts were carried out according to the method of Utermöhl (1958), in which the sample was allowed to settle for approximately 24 h. Cells were counted under Nikon and Leica inverted light microscopes at ×125 magnification ( µm; ocular: 12.5×) and expressed in . In addition, we calculated the relative abundance (in %) considering only marine silicifiers (diatoms and silicoflagellates) and the relative abundance (in %) for siliceous and non-siliceous plankton (e.g., dinoflagellates, coccolithophores) from microscopy data. More information on all phytoplankton groups analyzed, including pigment data, can be found in Bach et al. (2020).
2.4 Biovolume
To estimate the biovolume of various species, we referred to the 2024 Nordic Microalgae Biovolume List (NOMP, Olenina et al., 2006). This resource is among the most comprehensive compilations currently available. Table S2 in the Supplement presents examples of encountered diatom species (e.g., Skeletonema costatum, mean diameter of 6 μm), some of the largest observed species (e.g., Actinocyclus, mean diameter 46 µm), as well as silicoflagellates (mean diameter between 23 and 30 µm) during days 13 and 17. For Dictyocha octonaria, the biovolume and diameter could not be directly retrieved; instead, the diameter was determined from SEM images (example shown in Fig. 5d), and the biovolume was estimated by assuming a half-sphere shape, which is also applied for Dictyocha fibula (Olenina et al., 2006).
Where V is the Biovolume, and d the diameter. Given the broad variability in biovolume (Table S2), the values provided should be considered as approximate estimates.
2.5 Sample preparation and measurements of δ30SidSi and δ30SibSi
For preparation of samples for δ30SidSi measurements, the seawater pH (9 to 10) was raised with 1 M NaOH to scavenge dSi with the precipitated Mg(OH)2 (MAGIC, Karl and Tien, 1992; Reynolds et al., 2006; Grasse et al., 2016). BSi filters for δ30SibSi measurements were treated according to Varela et al. (2004) including a leaching step with 0.2 N NaOH in a 90 °C water bath (for details, see also Grasse et al., 2021). In a second leach step, the filter was treated with 0.5 mL of 2.5 M HF for 48 h to dissolve lithogenic silicate (LSi). Although Ragueneau and Tréguer (1994) pointed out that up to 15 % of lithogenic silicate (LSi) can dissolve during sodium hydroxide digestion, our own measurements provide evidence that LSi dissolution in our samples, especially the samples used to determine the fractionation factor, was much lower (less than 5 %), except for 2 samples from Day 1. Most likely, coastal nearshore waters captured in the mesocosms contained higher lithogenic content, which subsequently sank out of the surface layer after the mesocosms were closed. Assuming that the samples contained up to 15 % LSi, the reported δ30Si values may be underestimated by 0.2 ‰, assuming a mean isotope signature of −1.07 ‰ for clay minerals. Lithogenic primary minerals are heavier at −0.2 ‰ (Sutton et al., 2018), resulting in an offset of 0.02 ‰. Both values are within the analytical error margin. As the lithogenic content of most samples was less than 15 %, the δ30SibSi values were not corrected. The ratios in the bSi samples were not measured. As demonstrated by Grasse et al. (2021), the Al correction method is limited since ratios depend on external factors and diatom cell conditions (e.g., living versus dead), rather than exclusively indicating lithogenic contamination. Furthermore, these ratios may have been heavily biased in the mesocosms, which were not trace metal-free.
The dissolved sample (dSi, bSi) was loaded onto a cation exchange column (AG50X8, 200 mesh, Biorad®; for details, see Grasse et al., 2021). Samples with low dSi concentrations (<4 µmol L−1) were gently evaporated to double the concentration after column chemistry. According to Hughes et al. (2011), this should not affect δ30Si. Detailed preparation protocols are described in Ehlert et al. (2012) and Grasse et al. (2013).
Samples were analyzed using an Aridus II nebulizer coupled to a Nu Plasma MC-ICP-MS (Nu Instruments™, Wrexham, UK). Each analysis involved 50 to 60 cycles in sample-standard bracketing mode against NBS28. Si isotope compositions are reported in the δ notation, representing the deviation of the isotope ratio of the sample (Rsample) from that of a reference standard (Rstandard) in parts per thousand (‰).
The accuracy of measurements was checked daily using solid reference standards and seawater standards. Repeated measurements of BB, Diatomite, and IRMM18 resulted in mean δ30Si of −10.66 ‰ ± 0.18 ‰ (2 s.d., n=14), +1.22 ‰ ± 0.14 ‰ (2 s.d., n=28) and −1.43 ‰ ± 0.23 ‰ (2 s.d., n=10), which are in good agreement with Reynolds et al. (2007). The seawater inter-calibration standards Aloha 1000 m and Aloha 300 m resulted in +1.25 ‰ ± 0.16 ‰ (2 s.d.; n=53) and +1.72 ‰ ± 0.10 ‰ (M2 s.d., n=8), which is in excellent agreement with the mean values obtained by the GEOTRACES Si isotope inter-calibration study (+1.24 ‰ ± 0.20 ‰; +1.68 ‰ ± 0.35 ‰, Mean ± 2 s.d.; Grasse et al., 2017).
2.6 Calculation of the in situ Si isotope fractionation factor for silicoflagellates
The mesocosms are closed containers, in which dSi was replenished on day 11 (bottom water) and day 12 (surface water). The isotope fractionation factor between silicifiers and seawater (εsilicos) can, therefore, be calculated after dSi replenishment, assuming a Rayleigh-type fractionation (closed system) (Mariotti et al., 1981; De La Rocha et al., 1997; Sun et al., 2014). Although the closed system model best describes the surface layer of the mesocosm, it should be acknowledged that it is not a fully closed system. Biomass and its corresponding Si isotope signatures can be lost through sinking. In addition, dissolution can potentially lower isotope signatures and affect the overall results. Unfortunately, we were not able to calculate the Si isotope fractionation factor prior to the addition of deep water (Phase I), given that the dSi concentrations were partly increasing over time as a result of mixing and changes in the ML depth (see Fig. 2a). The Rayleigh-type model is expressed by the following equations.
where δ30SidSi, and δ30SibSi are the Si isotope values of the substrate (dSi) and the initial dSi concentration on day 13 (no sampling on day 12) as well as of the product (bSi) on day 17, respectively. The remaining fraction f was calculated according to Eq. (5) using the dSi concentration from day 13 (dSisource) and 17 (dSifinal). The time range between days 13 and day 17 was used as it marked the initial decline in dSi following the increase directly linked to deep water addition. After day 17, dSi was increasing again (Fig. 2a).

Figure 2Dissolved concentrations and nutrient ratios during the experiment. The deep water (DW) additions on days 11 and 12 are marked by a gray bar. M1 data are indicated with filled red squares, M2 with filled blue squares, and M7 with filled blue triangles, indicating the admixture with either “extreme” DW (red) or “moderate” DW (blue). Open black symbols in (a) show the dSi range of the other mesocosm experiments as a comparison. (a) dSi concentration (in µmol L−1), (b) dSi drawdown (in %) calculated by dividing the dSi concentration during the experiment with the initial dSi at the beginning of the experiment (day 1) and after replenishment of dSi on day 12. The horizontal line indicates the initial 100 % calculated with the initial dSi on day 1 for the first 10 d and day 12 for the rest of the experiment. Data above the 100 % line must be influenced by mixing with high dSi from the BL. (c) DIN : P ratio (in M M−1), (d) DIN : dSi (in M M−1). N reflects all dissolved nitrogen species (DIN=NOx and NH4).
To calculate the Si isotope fractionation factors in the two different mesocosms where silicoflagellates were on both days the dominant taxa, Eq. (4) was solved for εsilicos and calculated according to the following Eq. (6) (Sun et al., 2014), which uses a Rayleigh-type model and takes into account the utilized fraction f.
The offset (Δ30Si, also called the apparent fractionation factor) between δ30SibSi and δ30SidSi was calculated according to Eq. (7) (Table 1). The apparent fractionation factor is often determined in field studies investigating the marine Si cycle (e.g., Varela et al., 2016; Grasse et al., 2021)
The propagated error for Δ30Si is defined as follows
Table 1Nutrient concentrations, Si isotope data (δ30SidSi and δ30SibSi), percentage of diatoms and silicoflagellates (abbreviated as Silicos) according to cell counts for selected days in surface waters and the two different deep water (DW) types added to the ML on day 12. ; . ∗ Values are used to calculate the Si isotope fractionation factors. A detailed list of all nutrients and stable isotope measurements in ML is in Table S1. The experiment was separated into three different phases, indicated in the second column.

2.7 Statistical and Sensitivity Analysis of the Si Isotope Fractionation Factors
Monte Carlo simulations were performed to propagate the uncertainty in the calculated ε derived from analytical errors of Si isotope measurements (Robert and Casella, 2004). 2000 Monte Carlo simulations were performed assuming a normal distribution. This allows a random generation of possible results that substitute a range of values based on a probability distribution of measured δ30Si values. The simulation was performed in Excel with the Analysis ToolPak, allowing random number generation within the 2 s.d. error (0.2 ‰). Additionally, we performed a sensitivity analysis incorporating deviations in initial dSi and δ30Si values. This included 10 % over and underestimation of the dSi source and a ±0.2 ‰ shift in δ30Si.
The dissolved and particulate (in-)organic nutrient data have been described and discussed in detail by Bach et al. (2020). Here, we only list the most relevant findings for the investigation of the Si cycle. The water column, enclosed at the beginning of the study, was thermally stratified with a thermocline at approximately 5 m, which shifted to approximately 10 m after DW addition. The thermocline roughly corresponded to the oxycline. Below, the water in the BL was depleted in oxygen concentrations (<50 µmol L−1) compared to the ML (>200 µmol L−1, Bach et al., 2020). δ30SidSi was only analyzed in the surface waters from three mesocosms (M1, M2, and M7) as the measurements are highly time- and labor-intensive. These mesocosms were selected because they represented a large range in dSi concentrations (Fig. 2a). δ30SibSi measurements were only conducted on selected filters for the estimation of the Si isotope fractionation factor (Table 1).
3.1 Deep Water
Nutrient concentrations, as well as , were determined for both DW types (“extreme” and “moderate”, see Table 1). Both DWs showed similar dSi concentrations (DWextreme: 17.4 µmol L−1; DWmoderate: 19.6 µmol L−1) and concentrations (∼2.5 µmol L−1) but deviated in their N : Si ratio (0.02 versus 0.2) as well as N : P ratios (0.1 versus 1.7). The δ30SidSi values for DW “moderate” and DW “extreme” were indistinguishable within error with +1.54 ‰ ± 0.12 ‰ and +1.47 ‰ ± 0.19 ‰, respectively.
3.2 Dissolved nutrients and nutrient ratios in the euphotic surface layer
The dSi concentration in the ML initially ranged between 2.1 and 4.1 µmol L−1 within the first ten days (Phase I) in M1, M2 and M7 (Fig. 2a). This variability in dSi concentrations during the first ten days was mainly the result of a shift in sampling depth on day 4 to follow the deepening of the ML depth (Fig. 2a). This resulted in an increase in dSi compared to Day 1 (Fig. 2b). After DW addition (Day 12), dSi in the ML increased to 9 µmol L−1 (day 13) in M1 and M2 and 6 µmol L−1 in M7, due to addition of DW with higher dSi (17.4 µmol L−1; DW: 19.6 µmol L−, Table 1).
Between day 13 and day 20, dSi in the ML decreased by 20 % to 50 % resulting in dSi concentrations between 3 and 8 µmol L−1 (Fig. 2a and b). From day 20 to 35, dSi increased in M2 and M7, while it remained relatively constant in M1. By the end of the experiment (after Day 35), dSi had decreased to approximately 3 µmol L−1 in M1, M2, and M7, resulting in an overall drawdown between 30 % and 70 %.
During the first 10 d of the experiment DIN : dSi ratios () ranged between 0.5 and 1.5 mol mol−1 and decreased for both treatments after the DW addition (Fig. 2c). Between days 15 and 40, the DIN : dSi ratio was close to 0 and only slightly increased at the end of the experiment (after Day 38) due to surface eutrophication with by defecating seabirds (Inca tern, Larosterna inca, Bach et al., 2020, see also video from Boxhammer et al., 2019).
DIN : P values were extremely low and showed a pattern similar to DIN : dSi. While they were higher during the first 10 d (1 to 7 mol mol−1), they decreased sharply after the DW addition and were close to 0 mol mol−1 after day 15 with a slight increase towards the end of the experiment (Fig. 2d). Phosphate concentrations were rather stable throughout the experiment (mostly between 1.5 and 2 µmol L−1), NOx was nearly depleted by day 17 (<0.1 µmol L−1).
3.3 BSi concentrations and siliceous plankton development (diatoms and silicoflagellates)
At the beginning of the experiment, bSi concentrations in M1, M2, and M7 were similar, ranging from 3 to 4 µmol L−1, and mainly consisted of particles smaller than 20 µm, which accounted for 40 % to 50 % of total bSi (Fig. S1 in the Supplement). In M2 and M7 a strong increase in bSi was observed between days 3 and 4 (maximum bSi: 6.5 µmol L−1), whereas M1 remained constant over time (Table 1; Fig. 3a). This was reflected by an increase in diatom cell counts obtained from microscopy data (see Sect. 2.3; Table S1, Fig. 3b), which were highest during this time with abundances of 10 and 18×106 cells L−1 in M7 and M2, respectively. When only considering silicifying plankton, diatoms contributed up to 100 % of the cell counts (Fig. 3c). The most common diatom species were Skeletonema costatum, Cerataulina pelagica, Cylindrotheca closterium, Guinardia delicatula, Thalassiosira sp., Leptocylindrus danicus and Entomoneis alata var. alata (new name: Entomoneis paludosa). After day 8, bSi concentrations dropped to <1 µmol L−1 together with diatom cell counts below 1×10⁶ cells L−1. Silicoflagellate abundances were generally low from day 1 to 10 in all mesocosms ( cells L−1) and were slightly increasing before DW addition on day 10 in M2 and M7 with up to 0.038×10⁶ cells L−1. Two different silicoflagellate species were observed: Dictyocha fibula and Dictyocha octonaria (also known as Octactis octonaria; up to 30 µm in diameter without spines, for details, see Sect. S1 in the Supplement). For a detailed list of all diatom and silicoflagellate cell counts, see Tables S1 and S2.
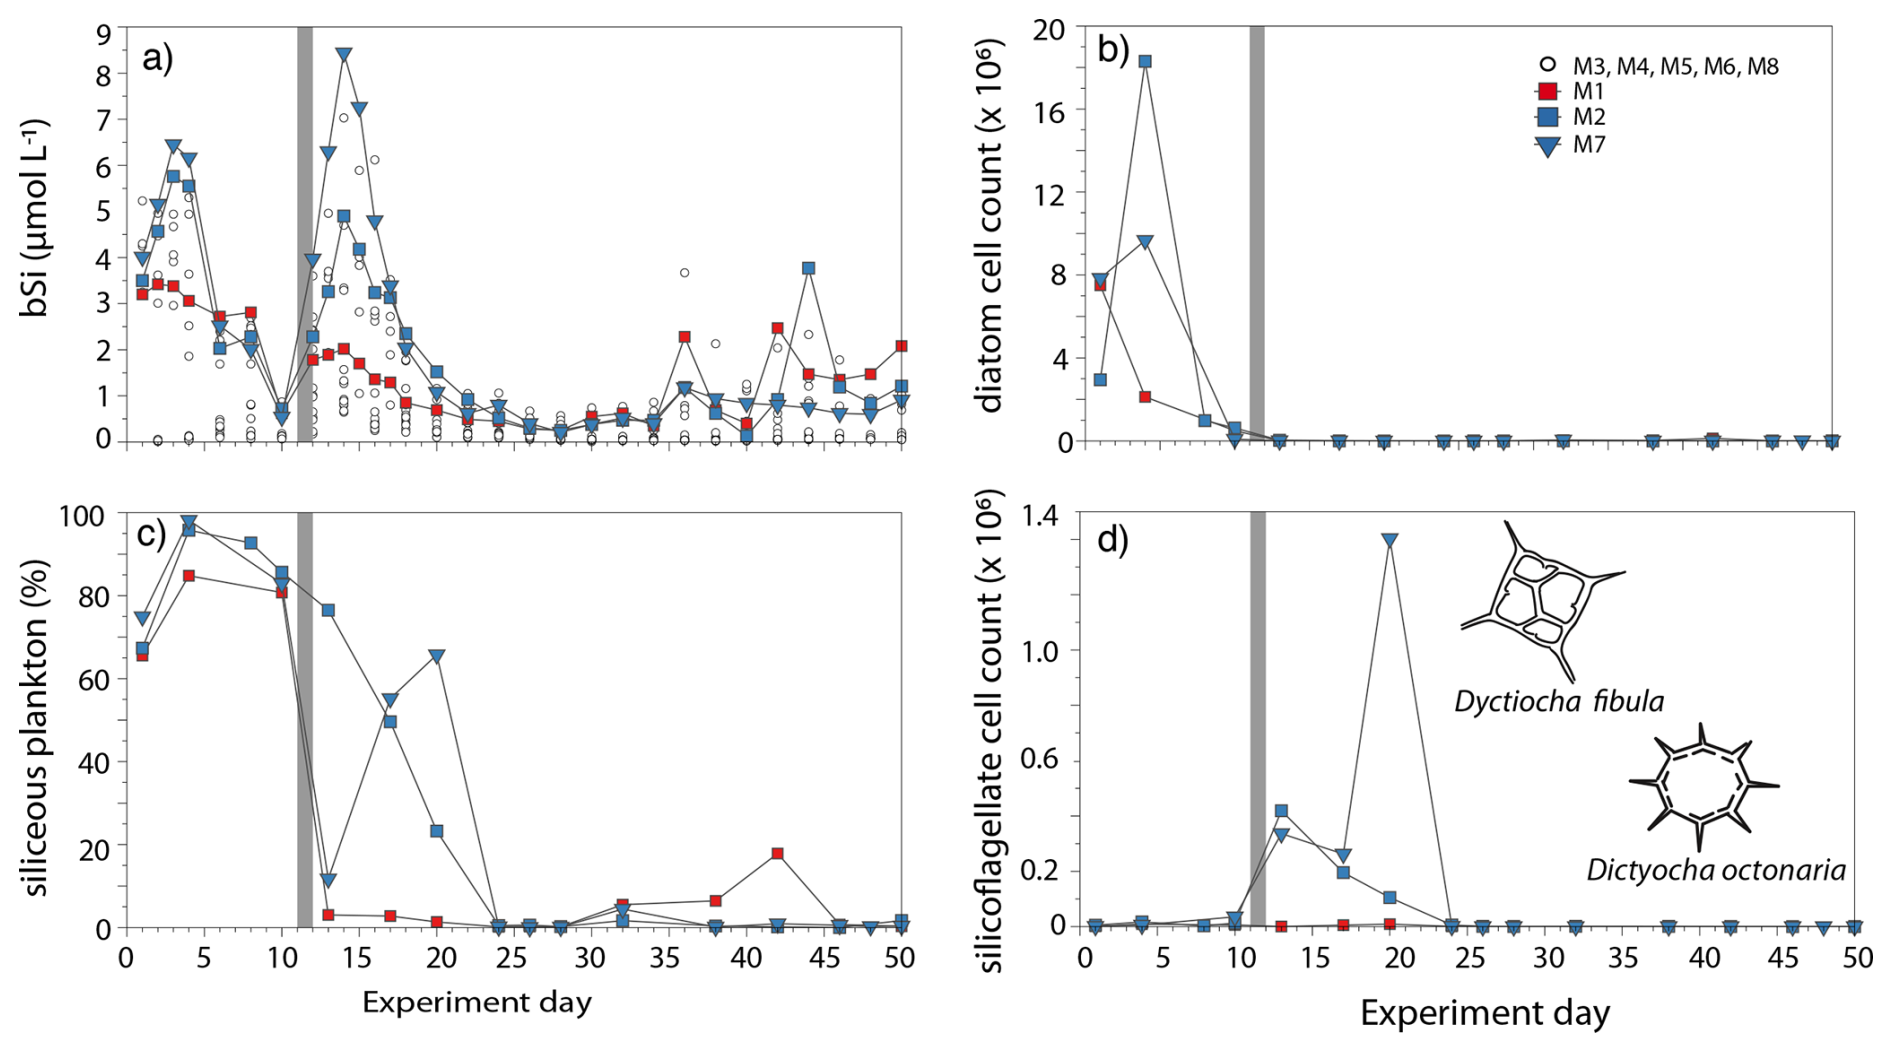
Figure 3(a) bSi concentration (in µmol L−1) during the experiment. The DW additions on days 11 and 12 are marked by a gray bar. M1 data are indicated with open red squares, M2 with open blue squares and M7 with open blue circles indicating the admixture with either “extreme” DW (red) or “moderate” DW (blue). Open black symbols in (a) show the dSi range of the other mesocosm experiment as a comparison. (b) Diatom cell count (in ×106 cells L−1). (c) The fraction of siliceous plankton (diatoms and silicoflagellates; in %) with respect to all plankton (including non-siliceous organisms, like dinoflagellates) according to cell abundances from microscopic data. (d) Silicoflagellate cell counts (in ×106 cells L−1). Please note the different scales in (b) and (d). In (d), schematic figures of both silicoflagellate species are shown. The most abundant species is Dictyocha octonaria.
After the DW addition (day 12), the bSi immediately increased, ranging between 2 µmol L−1 (M1) and 8 µmol L−1 (M7), associated with higher silicoflagellate cell counts of up to 0.4×10⁶ cells L−1 on day 13. On day 15, bSi concentrations decreased to <0.5 µmol L−1 until day 35 and slightly increased towards the end of the experiment, ranging between 1 and 2 µmol L−1 (with a maximum of 4 µmol L−1). Overall, bSi closely correlated with diatom and silicoflagellate cell counts, except for day 20, when we observed the highest sillicoflagellate cell counts of 1.4×10⁶ cells L−1. However, this does not affect the calculation of the Si isotope fractionation factor as we used data from days 13 and 17.
3.4 δ30SidSi and δ30SibSi in surface waters
δ30SidSi signatures showed a large range from +0.75 ‰ to +4 ‰ during the 50 d long study period. During Phase I, δ30SidSi in all three mesocosms was similar, with values generally between +2 ‰ and +2.7 ‰ (Fig. 4a). The DW was added on day 12 to the surface layer with a low δ30SidSi signature of +1.5 ‰. Despite this relatively low δ30SidSi signature of the DW, δ30SidSi in all three mesocosms evolved to values ranging between +3 ‰ and +4 ‰ on day 14 (M7) and day 17 (M1, M2). This sharp increase in δ30SidSi was caused by the rapid decline of dSi concentration (up to 50 % removal within 1 d, see also 3.2) shortly after DW addition. After day 17, δ30SidSi values constantly decreased, with the lowest δ30SidSi values observed in M1 and M2 at the end of the experiment (+0.75 ‰ to +1.2 ‰).
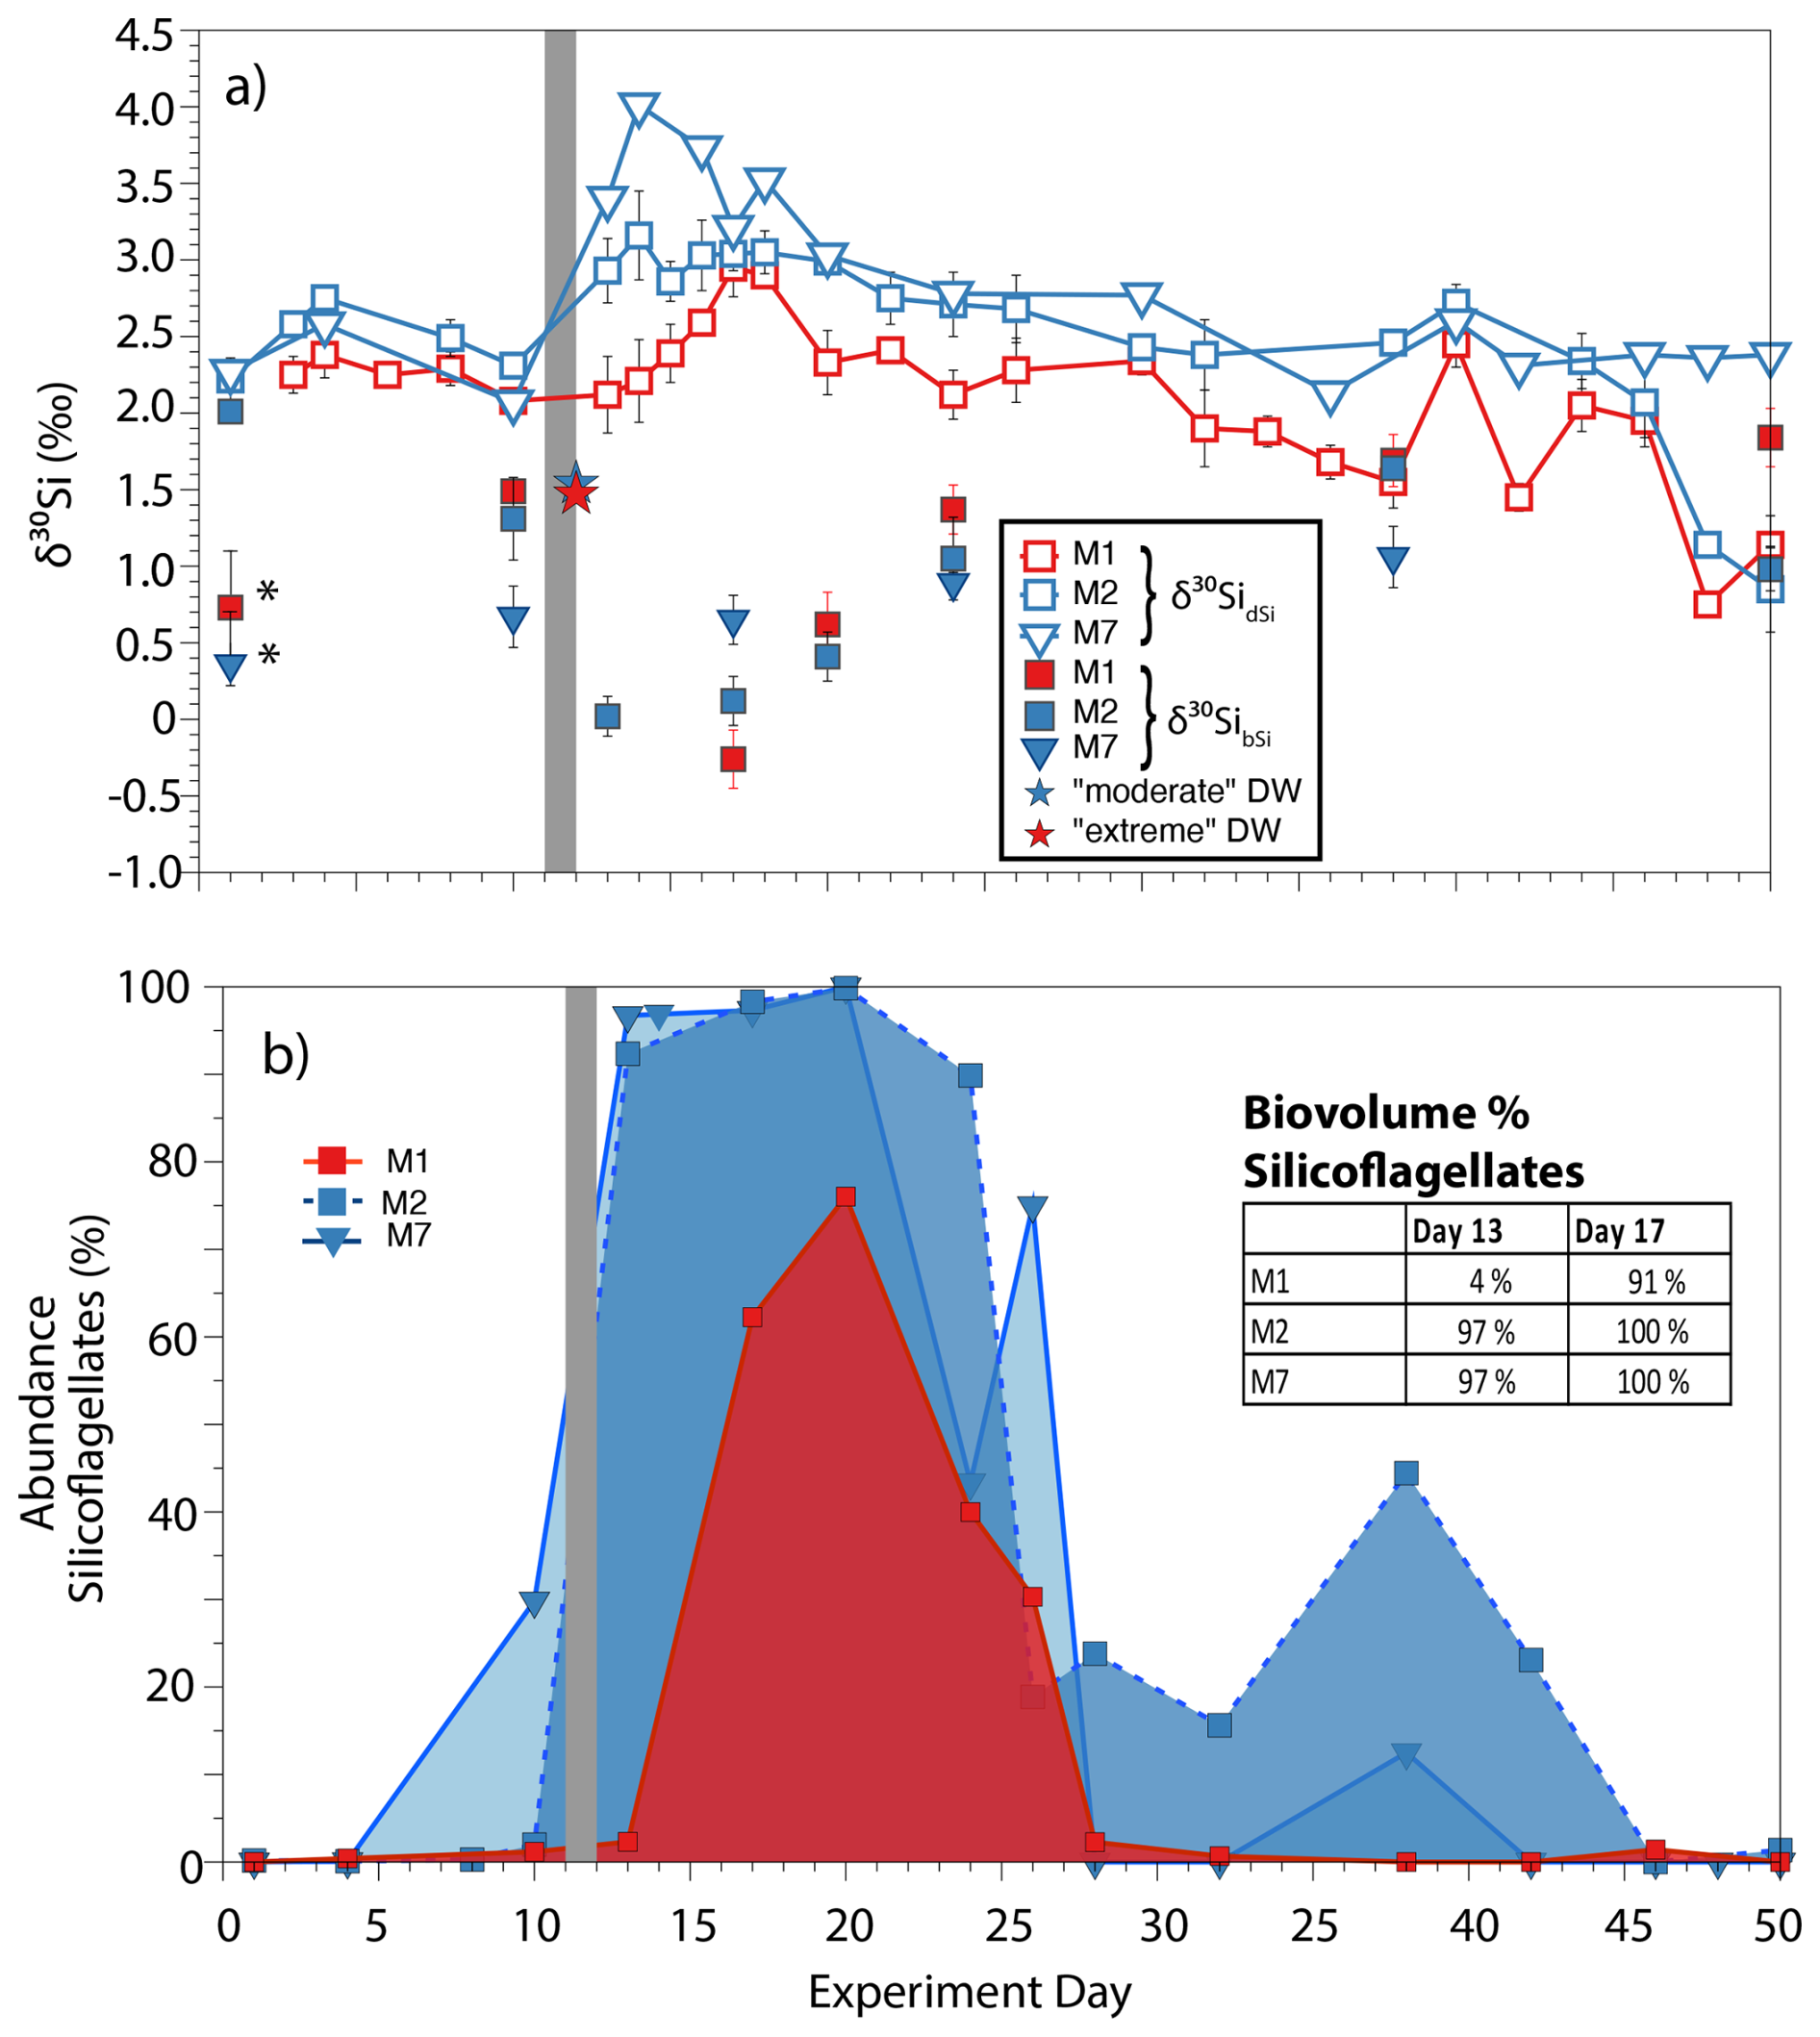
Figure 4(a) Dissolved and particulate silicon isotope data per day. δ30SidSi is marked by open symbols and δ30SibSi by closed symbols. Red squares show data from M1, blue squares from M2, and blue squares from M7. The stars indicate δ30SidSi of the “extreme” DW (red, +1.47 ‰) and the “moderate” DW (blue, +1.54 ‰). The asterisk (*) marks two samples with higher LSi content. Both DW types show similar dSi concentrations with 17.43 and 19.60 µmol L−1. (b) Relative abundance of silicoflagellates (in %) obtained from cell counts compared to diatom abundances (M1: red-shaded area; M2: blue-shaded area with dashed line, and M7: blue-hatched area with solid line). The percentage of the silicoflagellates mean biovolume is given in the table. Please note that mean biovolume is only an estimate, and minimum-maximum biovolume ranges can vary widely (Table S2).
δ30SibSi was only analyzed in selected samples and ranged between +0.8 ‰ and +2 ‰. After the DW addition, δ30SibSi decreased to values between −0.5 ‰ and +0.6 ‰ and then constantly increased until day 24. The δ30SibSi signal was generally lower than that of δ30SidSi, with few exceptions at the end of the experiment (days 38 and day 50).
3.5 Isotopic fractionation
We observed a smaller offset between δ30SidSi and δ30SibSi() within the first ten days of the experiment than during the days after DW addition. From day 1 to 10, Δ30Si ranged between −0.2 ‰ and −1.9 ‰ (Fig. S2 in the Supplement, Table 1). Directly after the DW addition, Δ30Si decreased to −3.2 ‰ (M1), −2.9 ‰ (M2), and −2.6 ‰ (M7), respectively. After day 17, Δ30Si markedly increased towards positive values (+0.1 ‰ to +0.7 ‰) at the end of the experiment (day 50).
The Si isotope fractionation factor εSilicos was calculated after DW addition according to Eq. (6) from two independent mesocosm experiments. εsilicos was −3.47 ‰ and −3.60 ‰ for M2 and M7, respectively (Table 2). Error estimates were derived from a Monte-Carlo simulation with 2000 random combinations of δ30SidSi and δ30SibSi values, taking a 2 s.d. error of 0.20 ‰ into account as well as a sensitivity analysis.
Table 2The measured δ30SidSi and δ30SibSi values, as well as the calculated fractionation factors (εsilicos) for M2 and M7. M1 was not used because it contains large amounts of diatoms with different growth rates compared to silicoflagellates. The error of the mean (2 s.d.) and the average error resulting from the Monte Carlo simulations (2 s.d. Monte Carlo) are given.

The sensitivity analysis revealed minimum and maximum εsilicos values of −3.86 ‰ (M2) and −4.05 ‰ (M7) and −3.53 ‰ (M2) and −3.37 ‰ (M7), respectively. These values yielded an error of ±0.56 ‰ (2 s.d.), which is slightly higher than the uncertainty obtained from the Monte Carlo simulation.
3.6 BSi increase per day, biovolume and biogenic silica content per cell
At the beginning of the experiment and after the addition of DW, a constant increase in bSi was observed over more than two sampling days in M2 and M7 (Fig. 3a). These data could be used to calculate the net increase in bSi per day (Fig. S3 in the Supplement). Before the addition of DW, when mainly diatoms were abundant, the bSi increase per day was 1.1 and 1.2 µmol d−1 for M2 and M7, respectively. After the DW addition, the bSi increase was 0.12, 1.31 and 2.3 µmol d−1 for M1, M2 and M7, respectively, corresponding to the highest abundance of silicoflagellates (97 %). Because a small number of very large diatom cells (>100 µm) could potentially influence the silicon cycle, we quantified the biovolume of the samples (biovolume normalized to cell counts). The biovolume data revealed that silicoflagellates were the dominant group after DW addition (Fig. S4 in the Supplement, Table S2). Overall, very few diatom cells ranging between 50 and 100 µm (e.g. Actinocyclus) were observed and no cells larger than 100 µm (e.g. Coscinodiscus).
A very interesting finding was a pronounced difference in the relationship between bSi content and cell counts before and after DW addition. While we observed similar bSi concentrations (median of 3.3 and 3.3 µmol L−1), the diatom-dominated phase (days 1–9) had cell counts several orders of magnitude higher (Fig. 5a), as here cells smaller than 20 µm were dominating. The bSicell ratio was significantly lower for the diatom (median: 1.2 pmol Si per cell; mean: 1.4 pmol Si per cell, min=0.30, max=4.6, n=9) than for the silicoflagellate-dominated samples between days 13 and 20 (median: 17 pmol Si per cell, mean: 64.65 pmol Si per cell, min=7.18, max=181.20, n=6, Fig. 5b). To minimize the bias introduced by a small number of disproportionately large cells, we highlighted samples containing 95 % silicoflagellates. Within this subset, samples composed almost exclusively of silicoflagellates exhibited a median of 15.10 pmol per cell (mean: 15.22 pmol per cell). However, the estimated values must be treated with caution given that the error is particularly high for samples with low cell counts.
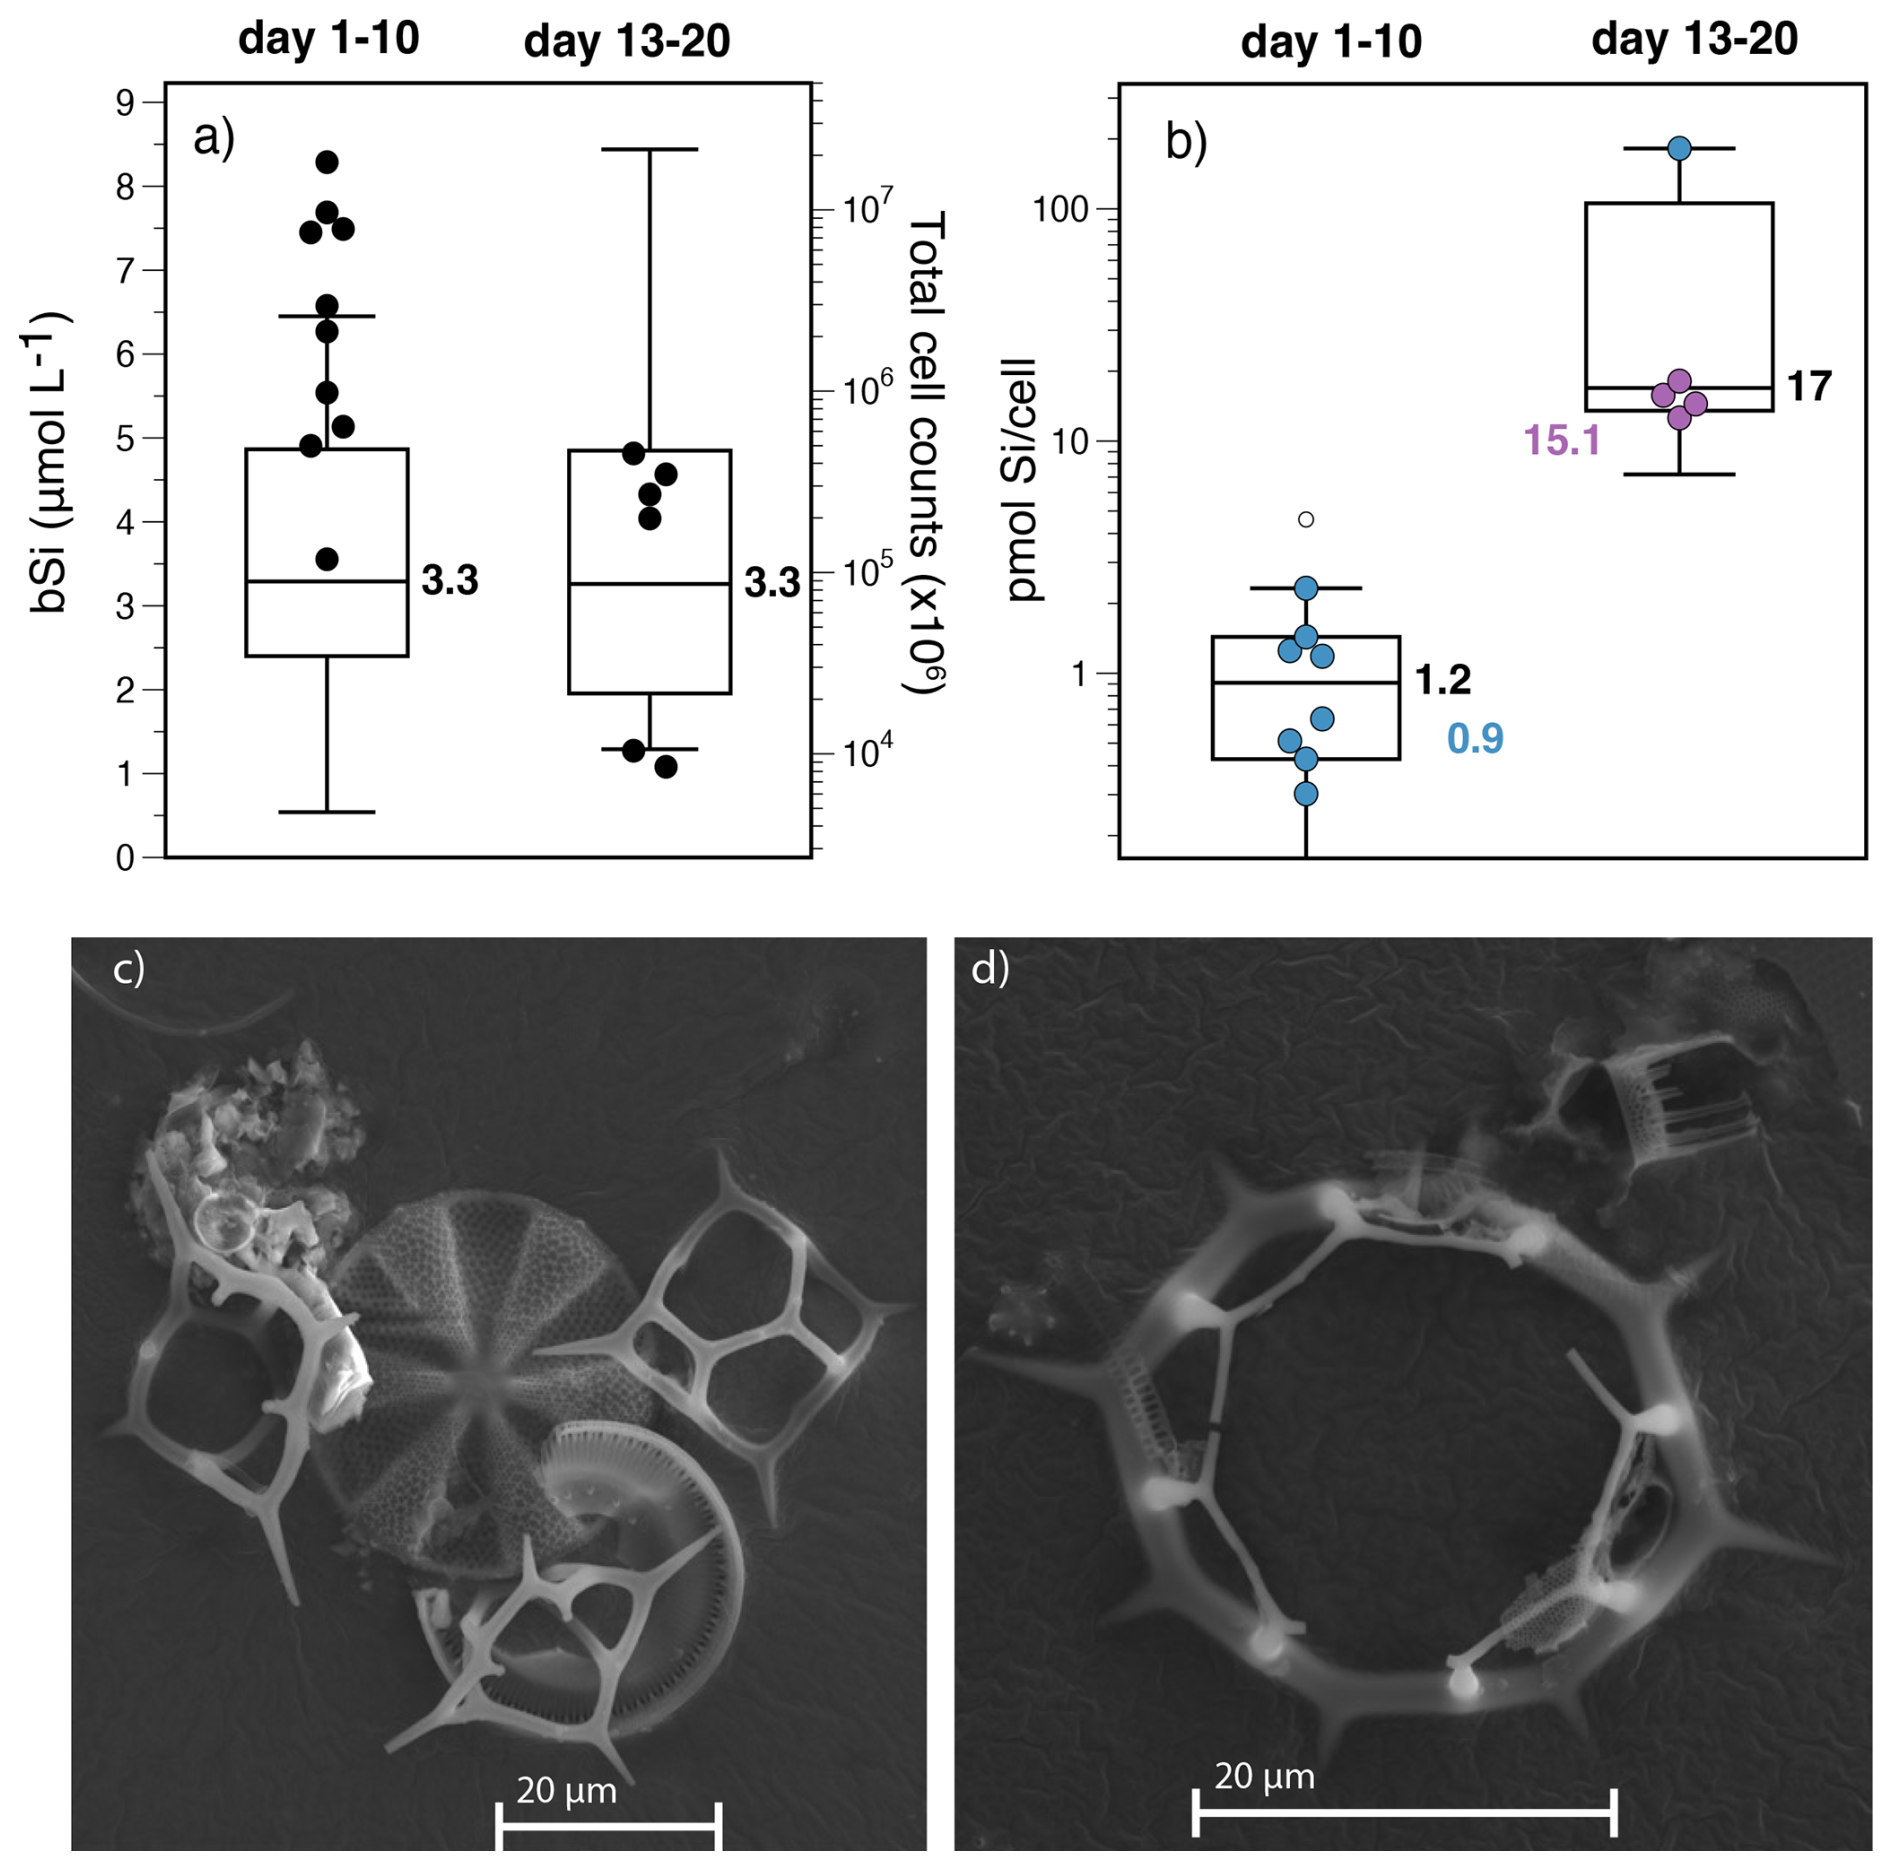
Figure 5(a) Box plots showing the biogenic silica (bSi) concentration (left axis) before (day 1–9) and after DW addition (day 13–19). Dots indicate higher cell counts (>106) before DW water addition and lower cell counts after DW addition. (b) Boxplot with included data points (black dots) reveal low pmol Si per cell values for the diatom-dominated phase (day 1–9) and higher pmol Si per cell values after DW addition (day 13–19), when silicoflagellates where dominating. Samples that contain more than 95 % diatoms are labeled in blue, samples with more than 95 % silicoflagellates in purple. Numbers next to the boxplots indicate the median. (c) SEM picture of diatoms and Dictyocha fibula (d) SEM picture of Dictyocha octonaria.
3.7 Comparison with Pacific water compositions outside of the mesocosms
In addition to the sampling within the mesocosms, we analyzed δ30SidSi of Pacific seawater outside the mesocosms over the 50 d of the experiment. There, the dSi concentrations ranged between 4.7 and 16 µmol L−1 with no apparent pattern (Fig. S5 in the Supplement). The δ30SidSi signature was highest within the first 5 d (+1.8 ‰), then remained constant near +1.6 ‰, possibly resulting from constant admixture of “new” dSi. The lowest δ30SidSi value was observed on day 50 (+1.2 ‰, Table S1, Fig. S5). According to microscopic analysis, diatoms were the dominant phytoplankton (>99 %), species throughout, except for day 50, when diatoms only accounted for 30 % of the silicifying community (Table S1).
4.1 Phase I: diatom-dominated surface waters
The mesocosm study, conducted over a 50 d period with deep water replenishment on day 12, provided insights into the evolution of δ30SidSi and δ30SibSi under closed-system conditions. During the initial 10 d, diatoms were the predominant phytoplankton group, making up nearly 100 % of the siliceous phytoplankton community and up to 59 % when including non-siliceous groups such as dinoflagellates (Bach et al., 2020). The diatom community was primarily composed of small, rapidly blooming species like Skeletonema costatum (less than 20 µm in diameter). Despite high DINdSi ratios (approximately 1 mol mol−1) during this period (Fig. 2c), both chlorophyll α (not shown) and bSi concentrations showed a decline after day 1 in M1 and after day 4 in M2 and M7 (Fig. 3a; Table S1). This reduction in productivity could be attributed to two main factors: (a) significant light attenuation within the water column due to the high biomass standing stock in the surface layer (Bach et al., 2020), and (b) the mixing with Chl α-depleted water of the bottom layer (see method part 2.1).
During Phase I, the δ30SidSi signature remained stable (+2.1 ‰ to +2.5 ‰) indicating a balance between nutrient uptake (increase in δ30SidSi) and dissolution (decrease in δ30SidSi) in surface waters. δ30SibSi (+0.4 ‰ to +1.5 ‰) was constantly lower than δ30SidSi due to the “preferential” uptake of lighter isotopes leaving the seawater enriched in heavy isotopes (e.g., De La Rocha et al., 1997). This resulted in an apparent isotope fractionation factor between silicifiers (mainly diatoms during the first 10 d) and seawater (Δ30Si) of around −1 ‰ (ε value could not be estimated during the first 10 d, see Sect. 2.5). This observation is in good agreement with laboratory studies investigating the Si isotope fractionation factor for diatoms with an overall mean εdiatom of −1.1 ‰ (e.g., Sutton et al., 2013, 2018) as well as field estimates from the region (Δ30Si of −0.4 ‰ to −1.1 ‰; e.g. Grasse et al., 2021).
4.2 Phase II: the dominance of silicoflagellates
Shortly before the addition of DW, diatom cell counts dropped and did not recover after the addition of DW despite high dSi concentrations (∼6 to 9 µmol L−1) in the surface water (Fig. 2a). Instead, we observed an increase in the abundance of silicoflagellates, especially in M2 and M7, associated with higher bSi concentrations, although silicoflagellate cell counts were only 0.1 % to 8 % compared to diatom cell counts in Phase I (Fig. 5a). This abrupt community shift may have been caused by a strong decrease in DIN and therefore very low DIN : Si ratios (<0.7), creating unfavorable conditions for diatoms, which typically require a 1:1 DIN ratio for optimal growth (e.g. Brzezinski, 1985; Brzezinski et al., 2008).
Silicoflagellates often co-occur with diatoms but usually play a subordinate role, especially off the Peruvian Coast (e.g., Grasse et al., 2021; Ochoa et al., 2010). Under nutrient-rich conditions, diatoms typically outcompete silicoflagellates due to their higher growth rates that can reach doubling times of less than 24 h (Werner, 1977). In contrast, silicoflagellates replicate approximately every two days (Valkenburg and Norris, 1970). The distribution and abundance of silicoflagellates in the water column may be influenced by a number of factors (e.g. water temperature, salinity, nutrient availability and grazing), though the relationships are neither simple nor consistent (e.g., Sancetta, 1990, for more details see Sect. S1). Blooms are frequently observed in organically enriched environments, suggesting mixotrophic capability (Quéguiner, 2017), which is advantageous when nutrient availability fluctuates.
In the upper ocean, dSi uptake and subsequent dissolution in subsurface waters are the main processes leading to a close correlation between δ30SidSi and dSi concentration (Fig. 6). Since diatoms are the dominant species incorporating dSi, the isotopic signature thus generally serves as a tracer of the diatom-driven silicon cycle, with values ranging from +1.7 ‰ to +3.0 ‰ in the coastal surface ocean and +1.5 ‰ in the subsurface (Ehlert et al., 2012; Grasse et al., 2021). Interestingly, samples dominated by silicoflagellates deviated from this trend showing higher δ30SidSi at moderate concentrations (5 to 9 µmol L−1) due to greater isotope fractionation. The silicoflagellate bloom was associated with δ30SidSi of up to +4.1 ‰ and low δ30SibSi (−0.26 ‰ to +0.65 ‰); Fig. 6. This may explain some exceptionally high δ30SidSi values (up to 4.4 ‰) observed in the Eastern Equatorial Pacific (Grasse et al., 2013) that deviate from the common ) relationship.
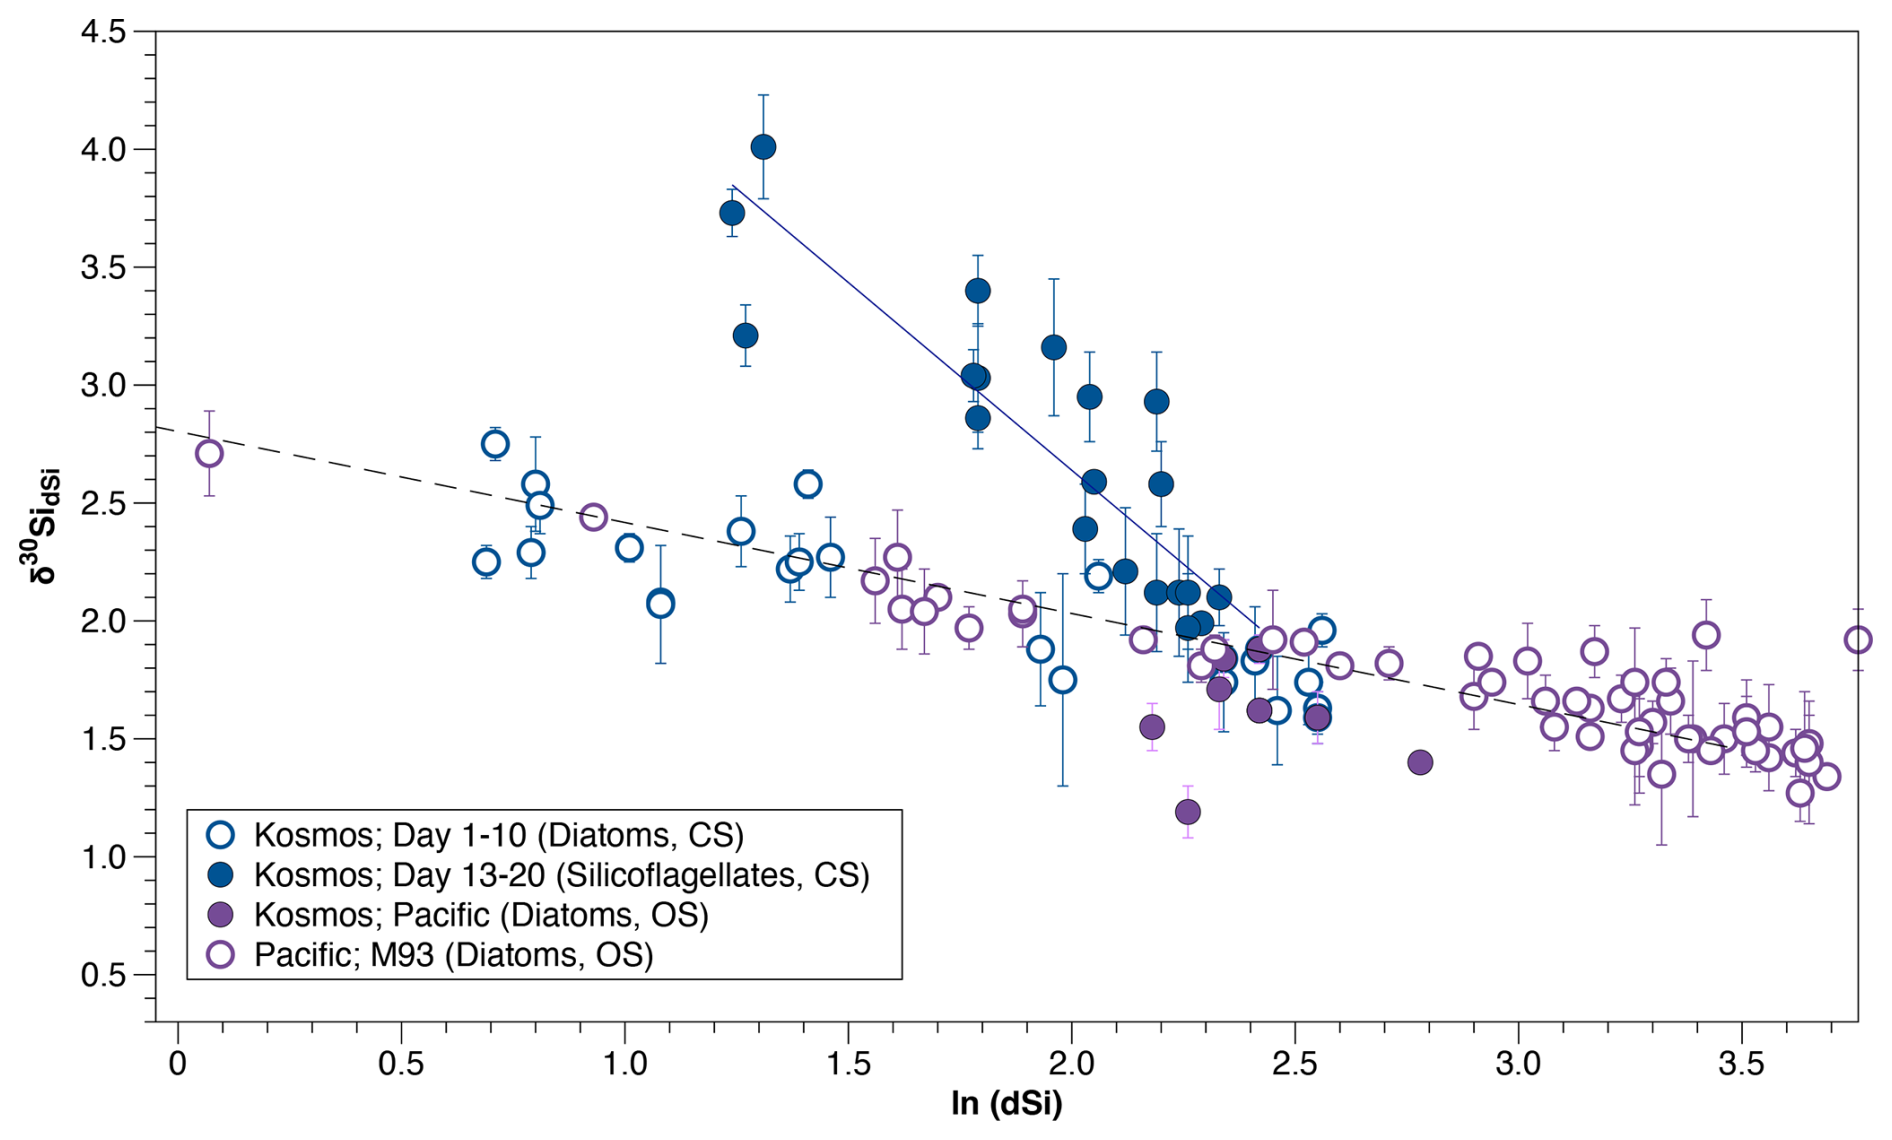
Figure 6Compilation of δ30SidSi versus the natural logarithm of dSi displaying data of this study separated for samples from day 1 to 10 (open blue circles), when diatoms dominated the phytoplankton community and from day 13 to 20 (closed blue circles), when silicoflagellates were dominant. Colored dots indicate δ30SidSi data from the Pacific from this study (sampled outside of the mesocosms; closed purple circles) and a previous cruise (open purple circles; M93) published in Grasse et al. (2021), where diatoms were the dominating phytoplankton. CS: closed system OS: open system. Regression lines for diatom-dominated samples are defined as ; r2=0.38 and for silicoflagellate-dominated samples: ; r2=0.78.
Future studies should consider that even low silicoflagellate abundances can significantly influence surface water δ30SidSi signatures. Although, their skeletons typically comprise only 1 % to 2 % of marine sediment siliceous fractions (Riedel, 1959), observational data remain insufficient to fully assess their abundance in surface waters, which can be highly patchy and seasonally variable. While silicoflagellates likely exert minimal influence on the modern ocean δ30Si budget, their role may have been more significant in the geological past (see Sect. 4.2).
4.3 Phase III (days 44 to 50)
Towards the end of the experiment, a slight increase in bSi and a decrease in dSi was observed as a result of diatom growth after day 35. Orni-eutrophication during the last 10 d enabled new phytoplankton growth through the relief from N-limitation in the surface layer. Interestingly, δ30SidSi only partly shows an increase expected from enhanced dSi utilization, and also decreases towards the end of the experiment with the lowest δ30SidSi values observed during the KOSMOS experiment in M1 and M2 (+1.1 ‰ and +0.9 ‰, respectively). Relatively low δ30SidSi values (minimum value of +1.2 ‰) are also observed in surface samples from the Pacific outside of the mesocosms (Fig. S4; Fig. 6: Pacific samples; comparison with all δ30SidSi data from the region). Such low values have not yet been reported for surface waters in the Peruvian Upwelling region. The lowest δ30SidSi values observed so far (+1.7 ‰, Ehlert et al., 2012) reflect recent upwelling with a low δ30SidSi signature in subsurface waters (mean +1.5 ‰, Grasse et al., 2021; Fig. 5). Such values could instead be explained by input of small lithogenic particles characterized by low δ30SidSi (−1 ‰ to −3 ‰; Sutton et al., 2018). Even lower values (−0.33 ‰) in surface waters were observed above the Northern Kerguelen Plateau, clearly influenced by lithogenic input (Cotard et al., 2025). Very small dust particles could only have been transported into the mesocosm by wind from the nearby Island of San Lorenzo. The samples from the Pacific (outside the mesocosm) may also have been influenced by river runoff and enhanced lithogenic transport. During the sampling period, the Peruvian upwelling experienced a very rare coastal El Niño which caused unusually intense precipitation in Peru and exceptionally high freshwater runoff, resulting in elevated lithogenic inputs into coastal waters (Rodríguez-Morata et al., 2019; Geilert et al., 2023), which is the most likely explanation for the observed low δ30SidSi signatures.
4.4 The Si isotope fractionation factor of silicoflagellates
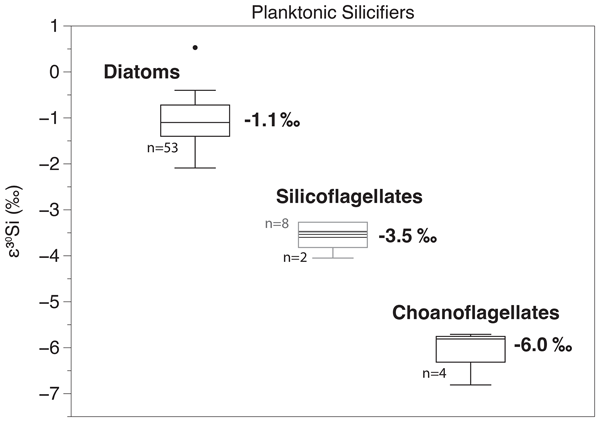
Our mesocosm experiment offered a unique opportunity to determine, for the first time, the Si isotope fractionation factor of silicoflagellates, an organism group that has not previously been investigated in field-based silicon isotope studies and for which laboratory culturing remains particularly challenging (Taguchi and Laws, 1985). We calculated a mean εsilicos of −3.54 ‰ ± 0.56 ‰ (mean ± 2 s.d. obtained during the sensitivity analysis). While this value represents a robust first-order estimate, it may be biased because the mesocosm surface layer was not a fully closed system. Episodic mixing, dissolution, and biomass transfer between layers could have affected the isotope mass balance and, consequently, the calculated fractionation factor. Nevertheless, for a field-based mesocosm experiment this approach provides the best available estimate, although confirmation under controlled culture conditions is required. The calculated εsilicos is higher than the Si isotope fractionation factor for diatoms that was determined during culture experiments (−1 ‰), but lower than those of sponges (−5 ‰) and choanoflagellates (−6.5 ‰) (Hendry and Robinson, 2012; Marron et al., 2019; Sutton et al., 2018, Fig. 7).
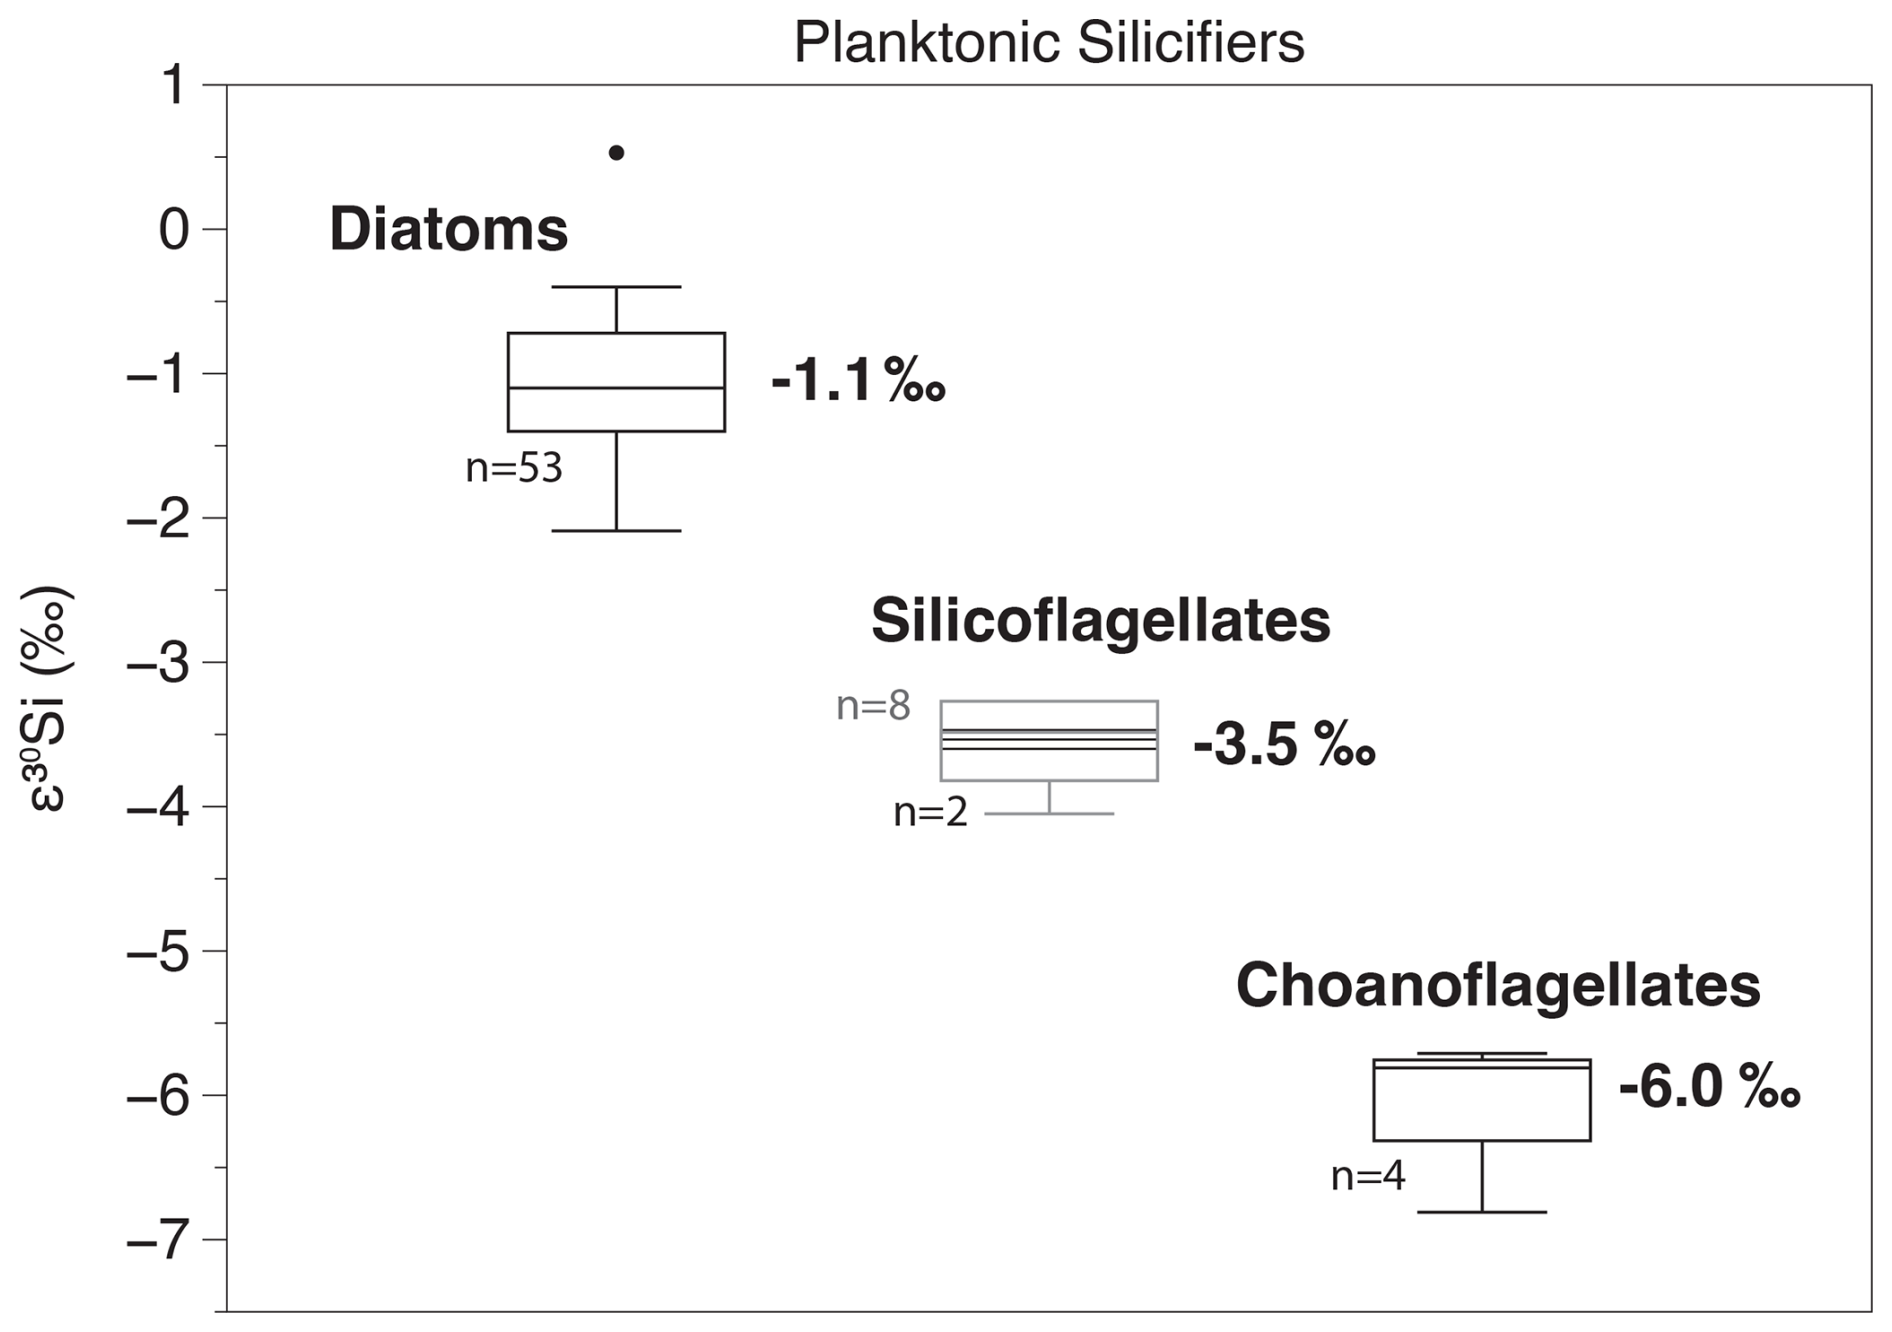
Figure 7Overview of the Si isotope fractionation factor for planktonic silicifiers (diatoms, silicoflagellates, choanoflagellates). The gray box plot for silicoflagellates presents all Si isotope fractionation values obtained during the sensitivity analysis. Median values are given. Radiolaria are not shown, as only an apparent isotope fractionation factor, derived from core-top data (sediment) and seawater data, is available (Doering et al., 2021). Data is derived from De La Rocha et al. (1997), Sutton et al. (2013), Milligan et al. (2004), Meyerink et al. (2017), Sun et al. (2014), Marron et al. (2019) and this study.
The factors controlling Si isotope fractionation remain unclear, limited understanding of the biochemical processes governing fractionation during dSi uptake and conversion to bSi. For diatoms, fractionation is thought to occur during dSi transport across the cell membrane via sodium-coupled silicate transporters (SITs, Hildebrand et al., 1997; Thamatrakoln et al., 2006). At low dSi concentrations (<30 µmol L−1), uptake is generally SIT-mediated, while at higher concentrations, dSi enters by diffusion (Shrestha and Hildebrand, 2014; Thamatrakoln and Hildebrand, 2008). SITs have been reported for most diatom species, radiolaria, choanoflagellates and Florenciella sp., a non-siliceous stramenopile belonging to the dictyochophyte lineage (“silicoflagellates”), though the transporter gene families in silicoflagellates bearing a silicon skeleton remain unclear. A second transporter family, LSi2-like, is found in choanoflagellates, sponges, and diatoms (Marron et al., 2016). The presence of different transporter families alongside different fractionation factors has led to the suggestion of a taxonomic component to Si isotope fractionation during biosilicification (Hendry et al., 2018). Sponges and choanoflagellates (“Opisthokonts”) show high Si isotope fractionation factors (up to −7 ‰; Hendry and Robinson, 2012; Marron et al., 2019), whereas stramenopiles, such as diatoms show lower values (Fig. S6 in the Supplement). However, our intermediate fractionation factor for silicoflagellates challenges this taxonomic framework, as dictyochophytes also belong to the stramenopiles.
Alternatively, Si isotope fractionation in silicoflagellates may be controlled by nutrient availability (e.g., dSi, Fe, ), affecting Si uptake, growth rate, and cellular bSi content (e.g. Paasche, 1973; Takeda, 1998). Calculated bSicell ratios for silicoflagellates were approximately 15 pmol per cell, roughly 15 times higher than those of diatoms in this study (1.2 pmol per cell). While the the biogenic content of small, fast-blooming diatom cells is in good agreement with literature values generally ranging between approximately 0.1 and 1 depending on light and nutrient limitation (e.g., Claquin et al., 2002), no published data for the bSi content of silicoflagellates are available for comparison. The elevated bSicell ratio indicates more strongly silicified cells, potentially with fewer pores which might be the reason for the strong isotope fractionation. However, further research is required to clarify the processes driving the high fractionation factor.
δ30Si data obtained from siliceous organisms (e.g., diatoms, radiolaria, and sponge spicules) preserved in sediment cores have provided valuable insight into past Si cycling (e.g., Doering et al., 2016a, b, 2019, 2021; Hendry and Robinson, 2012). However, reconstructing past dSi concentrations and utilization requires knowledge of species abundances in the sediment, in addition to careful purification of the Si isotope samples. Silicoflagellates may be particularly useful for reconstructing biogeochemical conditions under which diatoms are absent and their occurrence following diatom blooms could help constrain the role of non-diatom silicifiers in the Si cycle. They likely play an important role in understanding biogeochemical conditions under which diatoms are absent. Their occurrence following diatom blooms may also help constrain the role of non-diatom silicifiers in the silicon cycle, and knowledge of their fractionation factor could improve estimates of δ30Si of dissolved silica under nutrient-limiting conditions, allowing assessment of whether dSi was fully consumed or whether nitrate limitation prevailed. Further insights can be obtained from the fractionation factor associated with dSi uptake. Despite existing studies on silicoflagellate abundances in sediments (e.g., Bukry, 1981; Amigo, 1999; McCartney et al., 2010; McCartney et al., 2022), no studies have been conducted so far on δ30Si of silicoflagellates preserved in sediments. The obtained Si isotope fractionation factor for silicoflagellates, therefore, provides the basis for a new paleo proxy for the reconstruction of the past Si cycle. Silicoflagellates experienced periods of high abundance, particularly from the Late Cretaceous to the early Paleogene. During these periods, they may have contributed significantly to bSi production, influencing local or even basin-scale Si isotope signatures. While we can only make hypothetical assumptions about their potential impact, dedicated studies would be required to properly evaluate this possibility.
Our KOSMOS experiment off the coast of Peru provided a unique opportunity to study the silicon cycle of the Peruvian upwelling under controlled conditions. The addition of nitrate-depleted deep water (low DIN : Si ratios) triggered a community shift from diatoms to mixotrophic silicoflagellates. Due to the low abundance of silicoflagellates in natural environments and the difficulties encountered when attempting to culture them, information on this taxonomic group is scarce. The silicoflagellate bloom was associated with a pronounced increase in of up to +4.1 ‰ and low (−0.26 ‰ to +0.65 ‰). Surface waters dominated by silicoflagellates exhibit a pronounced deviation from the characteristic relationship typically observed in the Peruvian OMZ between in and dissolved dSi concentrations. For the first time, a Si isotope fractionation factor between seawater and silicoflagellates () is reported. This value is significantly higher than the diatom fractionation factor (). The stronger isotopic fractionation expressed by silicoflagellates may be attributed to their comparatively higher degree of silicification. Although silicoflagellates play a minor role in the modern ocean compared to diatoms, they can influence the marine Si cycle, leading to increased silicon drawdown and bSi removal from the euphotic zone. The Si isotope fractionation factor for silicoflagellates provides a novel tool for understanding past dSi utilization, especially during nutrient depleted conditions, when diatoms are absent. However, dedicated culture experiments are needed to verify und better understand the Si isotope fractionation factor of silicoflagellates.
The data is published in Zenodo: https://doi.org/10.5281/zenodo.20125629 (Grasse, 2026).
The supplement related to this article is available online at https://doi.org/10.5194/bg-23-5515-2026-supplement.
UR, LTB, TB, MG designed the experiment. KD, TB, EvdE, AJP, AB, PG contributed to the sampling. PG, KD, AB, SSR and EvdE analyzed data. PG wrote the manuscript with comments from all co-authors.
At least one of the (co-)authors is a guest member of the editorial board of Biogeosciences for the special issue “Ecological and biogeochemical functioning of the coastal upwelling system off Peru: an in situ mesocosm study”. The peer-review process was guided by an independent editor, and the authors also have no other competing interests to declare.
Publisher's note: Copernicus Publications remains neutral with regard to jurisdictional claims made in the text, published maps, institutional affiliations, or any other geographical representation in this paper. The authors bear the ultimate responsibility for providing appropriate place names. Views expressed in the text are those of the authors and do not necessarily reflect the views of the publisher.
This article is part of the special issue “Ecological and biogeochemical functioning of the coastal upwelling system off Peru: an in situ mesocosm study”. It is not associated with a conference.
This project was supported by the Collaborative Research Centre SFB 754 Climate-Biogeochemistry Interactions in the Tropical Ocean, financed by the German Research Foundation (DFG).
Additional funding was provided by the EU project AQUACOSM and the Leibniz Award 2012 granted to U.R. SEM analyses were performed by Kristin Doering and supported by the European Research Council (ERC) under the European Union's Horizon 2020 research and innovation programme (grant agreement no. 833454). We thank all participants of the KOSMOS-Peru 2017 study for assisting in mesocosm sampling and maintenance and for the amazing team spirit during this campaign. We are particularly thankful to the staff of the Instituto del Mar del Perú (IMARPE) for their support during the planning, preparation and execution of this study and to the captains and crews of BAP MORALES, IMARPE VI and BIC HUMBOLDT for support during deployment and recovery of the mesocosms and various operations in the course of this investigation. Special thanks go to the Marina de Guerra del Perú, in particular the submarine section of the Navy of Callao, and to the Dirección General de Capitanías y Guardacostas. We would also like to acknowledge L. M. Rickels for her illustration of the mesocosm. This was, however, not included in the final version of the manuscript. This work is a contribution in the framework of the Cooperation agreement between the IMARPE and GEOMAR through the German Ministry for Education and Research (BMBF) project ASLAEL 12-016 and the national project Integrated Study of the Upwelling System off Peru developed by the Direction of Oceanography and Climate Change of IMARPE, PPR 137 CONCYTEC.
This research has been supported by the Collaborative Research Centre SFB 754 Climate-Biogeochemistry financed by the German Research Foundation (DFG) (grant no. 27542298), the EU project AQUACOSM (ID 731065), and the European Research Council (ERC) under the European Union's Horizon 2020 research and innovation programme (grant no. 833454).
The article processing charges for this open-access publication were covered by the GEOMAR Helmholtz Centre for Ocean Research Kiel.
This paper was edited by Javier Arístegui and reviewed by Jill Sutton and one anonymous referee.
Amigo, A. E.: Miocene silicoflagellate stratigraphy: Iceland and Rockall Plateaus, in: Proceedings of the Ocean Drilling Program, Scientific Results, Vol. 162, edited by: Raymo, M. E., Jansen, E., and O'Connell, S., Ocean Drilling Program, College Station, TX, 63–81, https://doi.org/10.2973/odp.proc.sr.162.001.1999, 1999.
Bach, L. T., Paul, A. J., Boxhammer, T., von der Esch, E., Graco, M., Schulz, K. G., Achterberg, E., Aguayo, P., Arístegui, J., Ayón, P., Baños, I., Bernales, A., Boegeholz, A. S., Chavez, F., Chavez, G., Chen, S.-M., Doering, K., Filella, A., Fischer, M., Grasse, P., Haunost, M., Hennke, J., Hernández-Hernández, N., Hopwood, M., Igarza, M., Kalter, V., Kittu, L., Kohnert, P., Ledesma, J., Lieberum, C., Lischka, S., Löscher, C., Ludwig, A., Mendoza, U., Meyer, J., Meyer, J., Minutolo, F., Ortiz Cortes, J., Piiparinen, J., Sforna, C., Spilling, K., Sanchez, S., Spisla, C., Sswat, M., Zavala Moreira, M., and Riebesell, U.: Factors controlling plankton community production, export flux, and particulate matter stoichiometry in the coastal upwelling system off Peru, Biogeosciences, 17, 4831–4852, https://doi.org/10.5194/bg-17-4831-2020, 2020.
Boxhammer, T., Bach, L. T., Sswat, M., and Riebesell, U.: Orni-eutrophication by Inca terns (Larosterna inca) during the KOSMOS study 2017 in the coastal upwelling system off Peru, OceanRep, GEOMAR [video], https://doi.org/10.3289/ORNI_EUTROPHICATION, 2019.
Bruland, K. W., Rue, E. L., Smith, G. J., and DiTullio, G. R.: Iron, macronutrients and diatom blooms in the Peru upwelling regime: brown and blue waters of Peru, Mar. Chem., 93, 81–103, https://doi.org/10.1016/j.marchem.2004.06.011, 2005.
Brzezinski, M. A.: The Si : C : N ratio of marine diatoms: Interspecific variability and the effect of some environmental variables, J. Phycol., 21, 347–357, https://doi.org/10.1111/j.0022-3646.1985.00347.x, 1985.
Brzezinski, M. A., Dumousseaud, C., Krause, J. W., Measures, C. I., and Nelson, D. M.: Iron and silicic acid concentrations together regulate Si uptake in the equatorial Pacific Ocean, Limnol. Oceanogr., 53, 875–889, https://doi.org/10.4319/lo.2008.53.3.0875, 2008.
Bukry, D.: Cretaceous Arctic silicoflagellates, Geo-Mar. Lett., 1, 57–63, https://doi.org/10.1007/bf02463303, 1981.
Cassarino, L., Curnow, P., and Hendry, K. R.: A biomimetic peptide has no effect on the isotopic fractionation during in vitro silica precipitation, Sci. Rep.-UK, 11, 9698, https://doi.org/10.1038/s41598-021-88881-6, 2021.
Claquin, P., Martin-Jézéquel, V., Kromkamp, J. C., Veldhuis, M. J. W., and Kraay, G. W.: Uncoupling of silicon compared with carbon and nitrogen metabolisms and the role of the cell cycle in continuous cultures of Thalassiosira pseudonana (Bacillariophyceae) under light, nitrogen, and phosphorus control, J. Phycol., 38, 922–930, https://doi.org/10.1046/j.1529-8817.2002.t01-1-01220.x, 2002.
Closset, I., Baronas, J. J., Torricella, F., de Tombeur, F., Liguori, B. T. P., Petrucciani, A., Bryan, N., López-Acosta, M., Churakova, Y., Thielecke, A. U., Zhang, Z., Llopis Monferrer, N., Pickering, R. A., Guyomard, M., and Zhu, D.: Silicification in the ocean: from molecular pathways to silicifiers' ecology and biogeochemical cycles, Ocean Sci., 21, 3427–3470, https://doi.org/10.5194/os-21-3427-2025, 2025.
Cotard, E., Deteix, V., Vivier, F., Dapoigny, A., Caquineau, S., and Cardinal, D.: Significant impact of lithogenic dissolution from subantarctic volcanic islands on the regional marine silicon cycle, Limnol. Oceanogr., 70, 3711–3724, 2025.
De La Rocha, C. L., Brzezinski, M. A., and DeNiro, M. J.: Fractionation of silicon isotopes by marine diatoms during biogenic silica formation, Geochim. Cosmochim. Ac., 61, 5051–5056, https://doi.org/10.1016/s0016-7037(97)00300-1, 1997.
Doering, K., Ehlert, C., Grasse, P., Crosta, X., Fleury, S., Frank, M., and Schneider, R.: Differences between mono-generic and mixed diatom silicon isotope compositions trace present and past nutrient utilisation off Peru, Geochim. Cosmochim. Ac., 177, 30–47, https://doi.org/10.1016/j.gca.2015.12.029, 2016a.
Doering, K., Erdem, Z., Ehlert, C., Fleury, S., Frank, M., and Schneider, R.: Changes in diatom productivity and upwelling intensity off Peru since the Last Glacial Maximum: Response to basin-scale atmospheric and oceanic forcing, Paleoceanography, 31, 1453–1473, https://doi.org/10.1002/2016PA002936, 2016b.
Doering, K., Ehlert, C., Martinez, P., Frank, M., and Schneider, R.: Latitudinal variations in δ30Si and δ15N signatures along the Peruvian shelf: quantifying the effects of nutrient utilization versus denitrification over the past 600 years, Biogeosciences, 16, 2163–2180, https://doi.org/10.5194/bg-16-2163-2019, 2019.
Doering, K., Ehlert, C., Pahnke, K., Frank, M., Schneider, R., and Grasse, P.: Silicon Isotope Signatures of Radiolaria Reveal Taxon-Specific Differences in Isotope Fractionation, Frontiers in Marine Science, 8, 666896, https://doi.org/10.3389/fmars.2021.666896, 2021.
Echevin, V., Aumont, O., Ledesma, J., and Flores, G.: The seasonal cycle of surface chlorophyll in the Peruvian upwelling system: A modelling study, Prog. Oceanogr., 79, 167–176, https://doi.org/10.1016/j.pocean.2008.10.026, 2008.
Ehlert, C., Grasse, P., Mollier-Vogel, E., Böschen, T., Franz, J., de Souza, G. F. de, Reynolds, B. C., Stramma, L., and Frank, M.: Factors controlling the silicon isotope distribution in waters and surface sediments of the Peruvian coastal upwelling, Geochim. Cosmochim. Ac., 99, 128–145, https://doi.org/10.1016/j.gca.2012.09.038, 2012.
Ehlert, C., Grasse, P., and Frank, M.: Changes in silicate utilisation and upwelling intensity off Peru since the Last Glacial Maximum – insights from silicon and neodymium isotopes, Quaternary Sci. Rev., 72, 18–35, https://doi.org/10.1016/j.quascirev.2013.04.013, 2013.
Franz, J., Krahmann, G., Lavik, G., Grasse, P., Dittmar, T., and Riebesell, U.: Dynamics and stoichiometry of nutrients and phytoplankton in waters influenced by the oxygen minimum zone in the eastern tropical Pacific, Deep-Sea Res. Pt. I, 62, 20–31, https://doi.org/10.1016/j.dsr.2011.12.004, 2012.
Geilert, S., Frick, D., Garbe-Schönberg, D., Scholz, F., Sommer, S., Grasse, P., Vogt, C., and Dale, A. W.: Coastal El Niño triggers rapid marine silicate alteration on the seafloor, Nat. Commun., 14, 1676, https://doi.org/10.1038/s41467-023-37186-5, 2023.
Graco, M. I., Purca, S., Dewitte, B., Castro, C. G., Morón, O., Ledesma, J., Flores, G., and Gutiérrez, D.: The OMZ and nutrient features as a signature of interannual and low-frequency variability in the Peruvian upwelling system, Biogeosciences, 14, 4601–4617, https://doi.org/10.5194/bg-14-4601-2017, 2017.
Grasse, P.: Silicon Isotope Signatures from a Mesocosm Experiment off Peru (2017, SFB754), Zenodo [data set], https://doi.org/10.5281/zenodo.20125629, 2026.
Grasse, P., Ehlert, C., and Frank, M.: The influence of water mass mixing on the dissolved Si isotope composition in the Eastern Equatorial Pacific, Earth Planet. Sc. Lett., 380, 60–71, https://doi.org/10.1016/j.epsl.2013.07.033, 2013.
Grasse, P., Ryabenko, E., Ehlert, C., Altabet, M. A., and Frank, M.: Silicon and nitrogen cycling in the upwelling area off Peru: A dual isotope approach, Limnol. Oceanogr., 61, 1661–1676, https://doi.org/10.1002/lno.10324, 2016.
Grasse, P., Brzezinski, M. A., Cardinal, D., de Souza, G. F., Andersson, P., Closset, I., Cao, Z., Dai, M., Ehlert, C., Estrade, N., François, R., Frank, M., Jiang, G., Jones, J. L., Kooijman, E., Liu, Q., Lu, D., Pahnke, K., Ponzevera, E., and Zhang, Z.: GEOTRACES inter-calibration of the stable silicon isotope composition of dissolved silicic acid in seawater, J. Anal. Atom. Spectrom., 32, 562–578, https://doi.org/10.1039/c6ja00302h, 2017.
Grasse, P., Closset, I., Jones, J. L., Geilert, S., and Brzezinski, M. A.: Controls on Dissolved Silicon Isotopes Along the U. S. GEOTRACES Eastern Pacific Zonal Transect (GP16), Global Biogeochem. Cy., 34, https://doi.org/10.1029/2020gb006538, 2020.
Grasse, P., Haynert, K., Doering, K., Geilert, S., Jones, J. L., Brzezinski, M. A., and Frank, M.: Controls on the Silicon Isotope Composition of Diatoms in the Peruvian Upwelling, Frontiers in Marine Science, 8, 697400, https://doi.org/10.3389/fmars.2021.697400, 2021.
Hansen, H. P. and Koroleff, F.: Determination of nutrients, in: Methods of Seawater Analysis, edited by: Grasshoff, K., Kremling, K., and Ehrhardt, M., Wiley-VCH, Weinheim, Germany, 159–228, https://doi.org/10.1002/9783527613984.ch10, 1999.
Hendry, K. R. and Robinson, L. F.: The relationship between silicon isotope fractionation in sponges and silicic acid concentration: Modern and core-top studies of biogenic opal, Geochim. Cosmochim. Ac., 81, 1–12, https://doi.org/10.1016/j.gca.2011.12.010, 2012.
Hendry, K. R., Marron, A. O., Vincent, F., Conley, D. J., Gehlen, M., Ibarbalz, F. M., Quéguiner, B., and Bowler, C.: Competition between Silicifiers and Non-silicifiers in the Past and Present Ocean and Its Evolutionary Impacts, Frontiers in Marine Science, 5, 22, https://doi.org/10.3389/fmars.2018.00022, 2018.
Hildebrand, M., Volcani, B. E., Gassmann, W., and Schroeder, J. I.: A gene family of silicon transporters, Nature, 385, 688–689, https://doi.org/10.1038/385688b0, 1997.
Hughes, H. J., Delvigne, C., Korntheuer, M., de Jong, J., André, L., and Cardinal, D.: Controlling the mass bias introduced by anionic and organic matrices in silicon isotopic measurements by MC-ICP-MS, J. Anal. Atom. Spectrom., 26, 1892–1896, https://doi.org/10.1039/C1JA10110B, 2011.
Karl, D. M. and Tien, G.: MAGIC: A sensitive and precise method for measuring dissolved phosphorus in aquatic environments, Limnol. Oceanogr., 37, 105–116, https://doi.org/10.4319/lo.1992.37.1.0105, 1992.
Karstensen, J., Stramma, L., and Visbeck, M.: Oxygen minimum zones in the eastern tropical Atlantic and Pacific oceans, Prog. Oceanogr., 77, 331–350, https://doi.org/10.1016/j.pocean.2007.05.009, 2008.
Kérouel, R. and Aminot, A.: Fluorometric determination of ammonia in sea and estuarine waters by direct segmented flow analysis, Mar. Chem., 57, 265–275, https://doi.org/10.1016/S0304-4203(97)00040-6, 1997.
Mariotti, A., Germon, J. C., Hubert, P., Kaiser, P., Letolle, R., Tardieux, A., and Tardieux, P.: Experimental determination of nitrogen kinetic isotope fractionation: Some principles; illustration for the denitrification and nitrification processes, Plant Soil, 62, 413–430, https://doi.org/10.1007/bf02374138, 1981.
Marron, A., Cassarino, L., Hatton, J., Curnow, P., and Hendry, K. R.: Technical note: The silicon isotopic composition of choanoflagellates: implications for a mechanistic understanding of isotopic fractionation during biosilicification, Biogeosciences, 16, 4805–4813, https://doi.org/10.5194/bg-16-4805-2019, 2019.
Marron, A. O., Ratcliffe, S., Wheeler, G. L., Goldstein, R. E., King, N., Not, F., de Vargas, C., and Richter, D. J.: The evolution of silicon transport in eukaryotes, Mol. Biol. Evol., 33, 3226–3248, https://doi.org/10.1093/molbev/msw209, 2016.
McCartney, K., Witkowski, J., and Harwood, D. M.: Early evolution of the silicoflagellates during the Cretaceous, Mar. Micropaleontol., 77, 83–100, https://doi.org/10.1016/j.marmicro.2010.08.001, 2010.
McCartney, K., Witkowski, J., Jordan, R. W., Daugbjerg, N., Malinverno, E., van Wezel, R., Kano, H., Abe, K., Scott, F., Schweizer, M., Young, J. R., Hallegraeff, G. M., and Shiozawa, A.: Fine structure of silicoflagellate double skeletons, Mar. Micropaleontol., 113, 10–19, https://doi.org/10.1016/j.marmicro.2014.08.006, 2014.
McCartney, K., Witkowski, J., Jordan, R. W., Abe, K., Januszkiewicz, A., Wróbel, R., Bąk, M., and Soeding, E.: Silicoflagellate evolution through the Cenozoic, Mar. Micropaleontol., 172, 102108, https://doi.org/10.1016/j.marmicro.2022.102108, 2022.
Meyerink, S. W., Ellwood, M. J., Maher, W. A., Price, G. D., and Strzepek, R. F.: Effects of iron limitation on silicon uptake kinetics and elemental stoichiometry in two Southern Ocean diatoms, Eucampia antarctica and Proboscia inermis, and the temperate diatom Thalassiosira pseudonana, Limnol. Oceanogr., 62, 2445–2462, https://doi.org/10.1002/lno.10578, 2017.
Milligan, A. J., Varela, D. E., Brzezinski, M. A., and Morel, F. M. M.: Dynamics of silicon metabolism and silicon isotopic discrimination in a marine diatomas a function of pCO2, Limnol. Oceanogr., 49, 322–329, https://doi.org/10.4319/lo.2004.49.2.0322, 2004.
Morris, A. W. and Riley, J. P.: The determination of nitrate in sea water, Anal. Chim. Acta, 29, 272–279, https://doi.org/10.1016/S0003-2670(00)88614-6, 1963.
Mullin, J. and Riley, J. P.: The colorimetric determination of silicate with special reference to sea and natural waters, Anal. Chim. Acta, 12, 162–176, https://doi.org/10.1016/S0003-2670(00)87825-3, 1955.
Murphy, J. and Riley, J. P.: Colorimetric method for determination of P in soil solution, Anal. Chim. Acta, 27, 31–36, 1962.
Ochoa, N., Taylor, M. H., Purca, S., and Ramos, E.: Intra- and interannual variability of nearshore phytoplankton biovolume and community changes in the northern Humboldt Current system, J. Plankton Res., 32, 843–855, https://doi.org/10.1093/plankt/fbq022, 2010.
Olenina, I., Hajdu, S., Edler, L., Andersson, A., Wasmund, N., Busch, S., Göbel, J., Gromisz, S., Huseby, S., Huttunen, M., Jaanus, A., Kokkonen, P., Ledaine, I., and Niemkiewicz, E.: Biovolumes and size-classes of phytoplankton in the Baltic Sea, HELCOM Baltic Sea Environmental Proceedings, 106, 1–144, ISSN 0357-2994, 2006.
Paasche, E.: Silicon and the ecology of marine plankton diatoms. I. Thalassiosira pseudonana (Cyclotella nana) grown in a chemostat with silicate as limiting nutrient, Mar. Biol., 19, 117–126, https://doi.org/10.1007/bf00353582, 1973.
Pennington, J. T., Mahoney, K. L., Kuwahara, V. S., Kolber, D. D., Calienes, R., and Chavez, F. P.: Primary production in the eastern tropical Pacific: A review, Prog. Oceanogr., 69, 285–317, https://doi.org/10.1016/j.pocean.2006.03.012, 2006.
Preisig, H. R.: Siliceous structures and silicification in flagellated protists, Protoplasma, 181, 29–42, https://doi.org/10.1007/BF01666387, 1994.
Quéguiner, B.: The Biogeochemical Cycle of Silicon in the Ocean, https://doi.org/10.1002/9781119136880.fmatter, 2017.
Ragueneau, O. and Tréguer, P.: Determination of biogenic silica in coastal waters: applicability and limits of the alkaline digestion method, Mar. Chem., 45, 43–51, https://doi.org/10.1016/0304-4203(94)90090-6, 1994.
Ragueneau, O., Tréguer, P., Leynaert, A., Anderson, R. F., Brzezinski, M. A., DeMaster, D. J., Dugdale, R. C., Dymond, J., Fischer, G., François, R., Heinze, C., Maier-Reimer, E., Martin-Jézéquel, V., Nelson, D. M., and Quéguiner, B.: A review of the Si cycle in the modern ocean: recent progress and missing gaps in the application of biogenic opal as a paleoproductivity proxy, Global Planet. Change, 26, 317–365, https://doi.org/10.1016/s0921-8181(00)00052-7, 2000.
Reynolds, B. C., Frank, M., and Halliday, A. N.: Silicon isotope fractionation during nutrient utilization in the North Pacific, Earth Planet. Sc. Lett., 244, 431–443, https://doi.org/10.1016/j.epsl.2006.02.002, 2006.
Reynolds, B. C., Aggarwal, J., André, L., Baxter, D., Beucher, C., Brzezinski, M. A., Engström, E., Georg, R. B., Land, M., Leng, M. J., Opfergelt, S., Rodushkin, I., Sloane, H. J., van den Boorn, S. H. J. M., Vroon, P. Z., and Cardinal, D.: An inter-laboratory comparison of Si isotope reference materials, J. Anal. Atom. Spectrom., 22, 561–568, https://doi.org/10.1039/B616755A, 2007.
Riedel, W. R.: Siliceous organic remains in pelagic sediments, https://doi.org/10.2110/pec.59.01.0080, 1959.
Robert, C. and Casella, G.: Monte Carlo statistical methods, Vol. 2, Springer, https://doi.org/10.1007/978-1-4757-4145-2, 2004.
Rodríguez-Morata, C., Díaz, H. F., Ballesteros-Canovas, J. A., Rohrer, M., and Stoffel, M.: The anomalous 2017 coastal El Niño event in Peru, Clim. Dynam., 52, 5605–5622, https://doi.org/10.1007/s00382-018-4466-y, 2019.
Sancetta, C.: Seasonal occurrence of silicoflagellate morphologies in different environments of the eastern Pacific Ocean, Mar. Micropaleontol., 16, 285–291, https://doi.org/10.1016/0377-8398(90)90007-9, 1990.
Shrestha, R. P. and Hildebrand, M.: Evidence for a Regulatory Role of Diatom Silicon Transporters in Cellular Silicon Responses, Eukaryot. Cell, 14, 29–40, https://doi.org/10.1128/EC.00209-14, 2014.
Strub, P. T., Allen, J. S., Huyer, A., Smith, R. L., and Beardsley, R. C.: Seasonal cycles of currents, temperatures, winds, and sea level over the northeast Pacific continental shelf: 35° N to 48° N, J. Geophys. Res.-Oceans, 92, 1507–1526, https://doi.org/10.1029/jc092ic02p01507, 1987.
Sun, X., Olofsson, M., Andersson, P. S., Fry, B., Legrand, C., Humborg, C., and Mörth, C.-M.: Effects of growth and dissolution on the fractionation of silicon isotopes by estuarine diatoms, Geochim. Cosmochim. Ac., 130, 156–166, https://doi.org/10.1016/j.gca.2014.01.024, 2014.
Sutton, J. N., Varela, D. E., Brzezinski, M. A., and Beucher, C. P.: Species-dependent silicon isotope fractionation by marine diatoms, Geochim. Cosmochim. Ac., 104, 300–309, https://doi.org/10.1016/j.gca.2012.10.057, 2013.
Sutton, J. N., André, L., Cardinal, D., Conley, D. J., de Souza, G. F., Dean, J., Dodd, J., Ehlert, C., Ellwood, M. J., Frings, P. J., Grasse, P., Hendry, K., Leng, M. J., Michalopoulos, P., Panizzo, V. N., and Swann, G. E. A.: A Review of the Stable Isotope Bio-geochemistry of the Global Silicon Cycle and Its Associated Trace Elements, Front. Earth Sci., 5, 112, https://doi.org/10.3389/feart.2017.00112, 2018.
Taguchi, S. and Laws, E.: Application of a single-cell isolation technique to studies of carbon assimilation by the subtropical silicoflagellate Dictyocha perlae vis, Mar. Ecol. Prog. Ser., 23, 251–255, https://doi.org/10.3354/meps023251, 1985.
Takeda, S.: Influence of iron availability on nutrient consumption ratio of diatoms in oceanic waters, Nature, 393, 774–777, https://doi.org/10.1038/31674, 1998.
Thamatrakoln, K. and Hildebrand, M.: Silicon Uptake in Diatoms Revisited: A Model for Saturable and Nonsaturable Uptake Kinetics and the Role of Silicon Transporters, Plant Physiol., 146, 1397–1407, https://doi.org/10.1104/pp.107.107094, 2008.
Thamatrakoln, K., Alverson, A. J., and Hildebrand, M.: Comparative Sequence analysis of diatoms silicon transporters: Toward a mechanistic model of silicon transport, J. Phycol., 42, 822–834, https://doi.org/10.1111/j.1529-8817.2006.00233.x, 2006.
Tréguer, P., Bowler, C., Moriceau, B., Dutkiewicz, S., Gehlen, M., Aumont, O., Bittner, L., Dugdale, R., Finkel, Z., Iudicone, D., Jahn, O., Guidi, L., Lasbleiz, M., Leblanc, K., Levy, M., and Pondaven, P.: Influence of diatom diversity on the ocean biological carbon pump, Nat. Geosci., 11, 27–37, https://doi.org/10.1038/s41561-017-0028-x, 2018.
Utermöhl, H.: Zur Vervollkommnung der quantitativen Phytoplankton-Methodik, Int. Ver. The., 9, 1–38, 1958.
Valkenburg, S. D. and Norris, R. E.: The growth and morphology of the silicoflagellate Dictyocha fibula (Ehrenberg) in culture, J. Phycol., 6, 48–54, https://doi.org/10.1111/j.1529-8817.1970.tb02356.x, 1970.
Varela, D., Brzezinski, M. A., Beucher, C. P., Jones, J. L., Giesbrecht K. E., Lansard, B., and Mucci, A.: Heavy silicon isotopic composition of silicic acid and biogenic silica in Arctic waters over the Beaufort shelf and the Canada Basin, Global Biogeochem. Cy., 30, 804–824, https://doi.org/10.1002/2015GB005277, 2016.
Varela, D. E., Pride, C. J., and Brzezinski, M. A.: Biological fractionation of silicon isotopes in Southern Ocean surface waters, Global Biogeochem. Cy., 18, GB1047, https://doi.org/10.1029/2003GB002140, 2004.
Werner, D. (Ed.).: The Biology of Diatoms, Botanical Monographs, Vol. 13, Blackwell Scientific Publications/University of California Press, ISBN-10 0521714699, 1977.