
the Creative Commons Attribution 4.0 License.
the Creative Commons Attribution 4.0 License.
 | 04 Sep 2026
Seasonal variations and controlling factors of nitrogen fluxes at the sediment-water interface in a semi-enclosed inland sea
Zhaosen Wu

Jie Shi
Xiaokun Ding
Masatoshi Nakakuni
Kuninao Tada
Nitrogen fluxes across the sediment-water interface and nitrogen removal from sediments are essential components of nitrogen cycle in semi-enclosed inland seas. However, the difficulty in observational sampling hinders continuous data availability that is necessary to understand their seasonal variations and underlying mechanisms. To address this issue, we developed a one-dimensional sediment nitrogen-cycle model and used sensitivity experiments to quantify the relative roles of environmental and biogeochemical drivers. Model results indicate that 48 % of particulate organic nitrogen (PON) settling into sediments is returned to the bottom water as dissolved inorganic nitrogen (DIN), while 6 % is removed via N-loss flux (dinitrogen gas and nitrous oxide). The seasonal variations of PON and DIN fluxes are controlled by fundamentally different mechanisms, with PON flux primarily regulated by bottom-water PON concentration and bottom stress, while DIN flux is mainly governed by temperature-dependent biogeochemical transformations and nitrogen availability. These contrasting responses reveal a decoupling between particulate and dissolved nitrogen fluxes, reflecting the buffering capacity of sediments. Denitrification controls nitrogen removal but its amount is not large because the oligotrophic conditions of the study site limits the nitrate availability.
- Article
(4453 KB) - Full-text XML
-
Supplement
(937 KB) - BibTeX
- EndNote


Sediments play a crucial role in regulating the storage and removal of nitrogen within semi-enclosed inland seas, which significantly influences the balance and stability of the ecosystem (Huettel et al., 2014; Zhang et al., 2020; Kalvelage et al., 2013; Thamdrup, 2012). On one hand, the sediment can bury substantial amounts of nitrogen, potentially on par with river inputs (Liu et al., 2021; Han et al., 2021; Lønborg and Markager, 2021). On the other hand, because of remineralization, the sediment continuously releases dissolved inorganic nitrogen (DIN) into the overlying water (Devol, 2015; Boynton et al., 2017; Liu et al., 2012). In semi-enclosed inland seas, vertical mixing facilitates the contribution of DIN from sediments as a vital nutrient source for primary production because of shallow water depth (Huettel et al., 2014; Yi et al., 2023; Leng et al., 2023; Liu and Yin, 2007; Berelson et al., 2013; Leynaert et al., 2011; Mei Liu et al., 2011). Notably, the sediment serves as the primary anoxic environment in these regions, where key nitrogen removal processes, such as denitrification and anammox, occur. These processes are essential for regulating nitrogen inventories and influencing nutrient structure in these areas. Some research indicates that continental shelves, which constitute merely 7.5 % of the global seafloor, are responsible for 44 % of fixed nitrogen losses (Devol, 2015; Mctigue et al., 2016; Huang et al., 2021; Jäntti and Hietanen, 2012; Khalil and Rasmussen, 2012). Furthermore, nitrous oxide, one of the gaseous forms of nitrogen removal, is a significant greenhouse gas that contributes to global warming (Quick et al., 2019; Wilson et al., 2020; Yang et al., 2022).
To clarify the function of the sediment in ecological and environmental changes, it is necessary to conduct a quantitative analysis of nitrogen fluxes at the sediment-water interface in semi-enclosed inland seas, along with their seasonal variations. Direct observation of particulate organic nitrogen (PON) flux at this interface poses challenges due to the influence of resuspension processes. PON flux measurement techniques are confined to in situ observations, with relatively limited studies. In contrast, DIN flux can be obtained not only through in situ methods but also via laboratory experiments. Consequently, numerous studies focused on DIN flux and its seasonal variations primarily through in situ observations, incubation experiments, or estimations based on Fick's First law (De Vittor et al., 2012; Mu et al., 2017; Chen et al., 2023). For example, studies in the northern Adriatic Sea and the Baltic Sea have demonstrated the same conclusion that DIN flux exhibits seasonal variations, with higher levels in summer and lower levels in winter, likely influenced by water temperature (De Vittor et al., 2012; Niemistö et al., 2018). There are also studies identifying organic matter deposition as an important factor influencing sedimentary nitrogen cycling and DIN fluxes (Albert et al., 2021; Ratmaya et al., 2022). However, the relative contributions of organic matter supply and temperature to seasonal variations in nitrogen fluxes remain poorly quantified. Furthermore, the directions and controlling mechanisms of ammonium () and nitrate () fluxes vary considerably among coastal environments, with sediments acting either as sources or sinks of these nitrogen species. In addition to DIN exchange, nitrogen removal processes such as denitrification and anammox have also been reported to exhibit pronounced seasonal variability, generally with higher rates in summer and lower rates in winter (Zhang et al., 2018; Rich et al., 2020; Teng and Lin, 2024). Previous studies suggest that dissolved oxygen (DO), temperature, organic matter availability, bioturbation, and hydrodynamic conditions can all influence these processes (Mu et al., 2017; De Vittor et al., 2015; Dale et al., 2022; Bohlen et al., 2011; Ratmaya et al., 2022; Zhou et al., 2022).
However, sedimentary nitrogen cycling involves a cascade of interconnected transformations linking particulate organic nitrogen deposition, mineralization, nitrification, denitrification, and nitrogen removal. As a result, changes in organic matter input do not necessarily lead to proportional changes in DIN release or nitrogen loss. Different nitrogen pools and fluxes may respond to environmental forcing through distinct pathways and timescales, potentially causing decoupled responses between particulate and dissolved nitrogen fluxes. Consequently, despite extensive observational studies, a mechanistic framework capable of explaining the seasonal variability of sedimentary nitrogen cycling and the contrasting responses of different nitrogen fluxes remains lacking. Quantifying nitrogen fluxes at the sediment–water interface in semi-enclosed inland seas and elucidating their seasonal dynamics and controlling mechanisms are crucial for understanding benthic nutrient recycling, evaluating the contribution of sediments to ecosystem functioning, and improving predictions of biogeochemical responses to environmental change.
Numerical modelling is a valuable tool for understanding the factors that govern nitrogen fluxes at the sediment-water interface. Typically, nitrogen fluxes at this interface derived from empirical formulas serve as essential boundary conditions for modelling the aquatic nitrogen cycle in semi-enclosed inland seas (Lønborg and Markager, 2021). However, this approach largely overlooks the changes occurring within the sediment and the corresponding flux responses to these alterations. An alternative approach is the implementation of a box model, which investigates nitrogen processes within the sediment. Nonetheless, the box model's treatment of all sediment as a single domain, coupled with its failure to account for the vertical distribution of chemical substances – particularly oxidants such as DO – limits its capacity to provide a comprehensive understanding of the nitrogen cycling processes within the sediment (Yang et al., 2022). A one-dimensional vertical sediment model addresses this limitation, albeit at the cost of increased complexity and computational demands (Radtke et al., 2019; Umlauf et al., 2023). It not only reproduces seasonal variations in nitrogen fluxes but also provides a framework for disentangling the relative roles of environmental forcing and internal biogeochemical processes in regulating sedimentary nitrogen cycling. Despite the clear advantages of this modelling approach over empirical formulas and box models, well-validated applications remain relatively scarce.
This study focuses on the unclear seasonal variations in the magnitude and direction of nitrogen fluxes at the sediment–water interface in semi-enclosed inland seas, alongside the insufficiently understood underlying mechanisms with controlling factors driving these changes. We developed a one-dimensional vertical sediment model to simulate nitrogen cycling and accurately quantify nitrogen fluxes at the interface. Supported by monthly continuous observations conducted in the bottom water and sediment of Harima Nada in Japan, a typical semi-enclosed inland sea characterized by restricted water exchange, seasonal stratification, and active sediment-water nutrient cycling, we obtained a robust dataset for model validation. The model successfully reproduced the seasonal variations in the concentrations of three nitrogen species within the sediment and nitrogen fluxes at the sediment-water interface. Additionally, numerical experiments were further conducted to disentangle the relative roles of organic matter supply, temperature, DO, and benthic processes in controlling seasonal nitrogen cycling. Particular attention was given to the contrasting responses of particulate and dissolved nitrogen fluxes and to the mechanisms that regulate the transfer of deposited organic nitrogen into DIN and nitrogen loss pathways. By identifying the dominant controls on different nitrogen pools and fluxes, this study provides new insights into the mechanisms governing sedimentary nitrogen cycling in semi-enclosed coastal systems and improves our ability to predict benthic responses to environmental change and eutrophication management.
2.1 Study area
Harima Nada is situated within Seto Inland Sea, the largest semi-enclosed sea in Japan (Fig. 1). It has an average water depth of 26 m and is connected to Osaka Bay and Hiuchi Nada on the eastern and western sides, respectively. To the south, it connects to the Pacific Ocean through the Naruto Strait and Kii Channel (Zhu et al., 2019; Chang et al., 2009). Harima Nada is strongly controlled by seasonal variations in wind forcing and density structure (Tong-u-dom et al., 2023). Its hydrographic circulation exhibits clear seasonal patterns: in winter, a wind-driven downwind circulation dominates under the prevailing north-westerly winds, whereas in summer, a density-driven cyclonic circulation develops due to the horizontal change in stratification. The water column structure also shows pronounced seasonality. Stratification intensifies in summer, promoting the formation of bottom cold water, while in winter, the water column becomes vertically well mixed. These seasonal changes in circulation and stratification jointly regulate the spatial distribution of temperature, salinity, and currents within the basin.
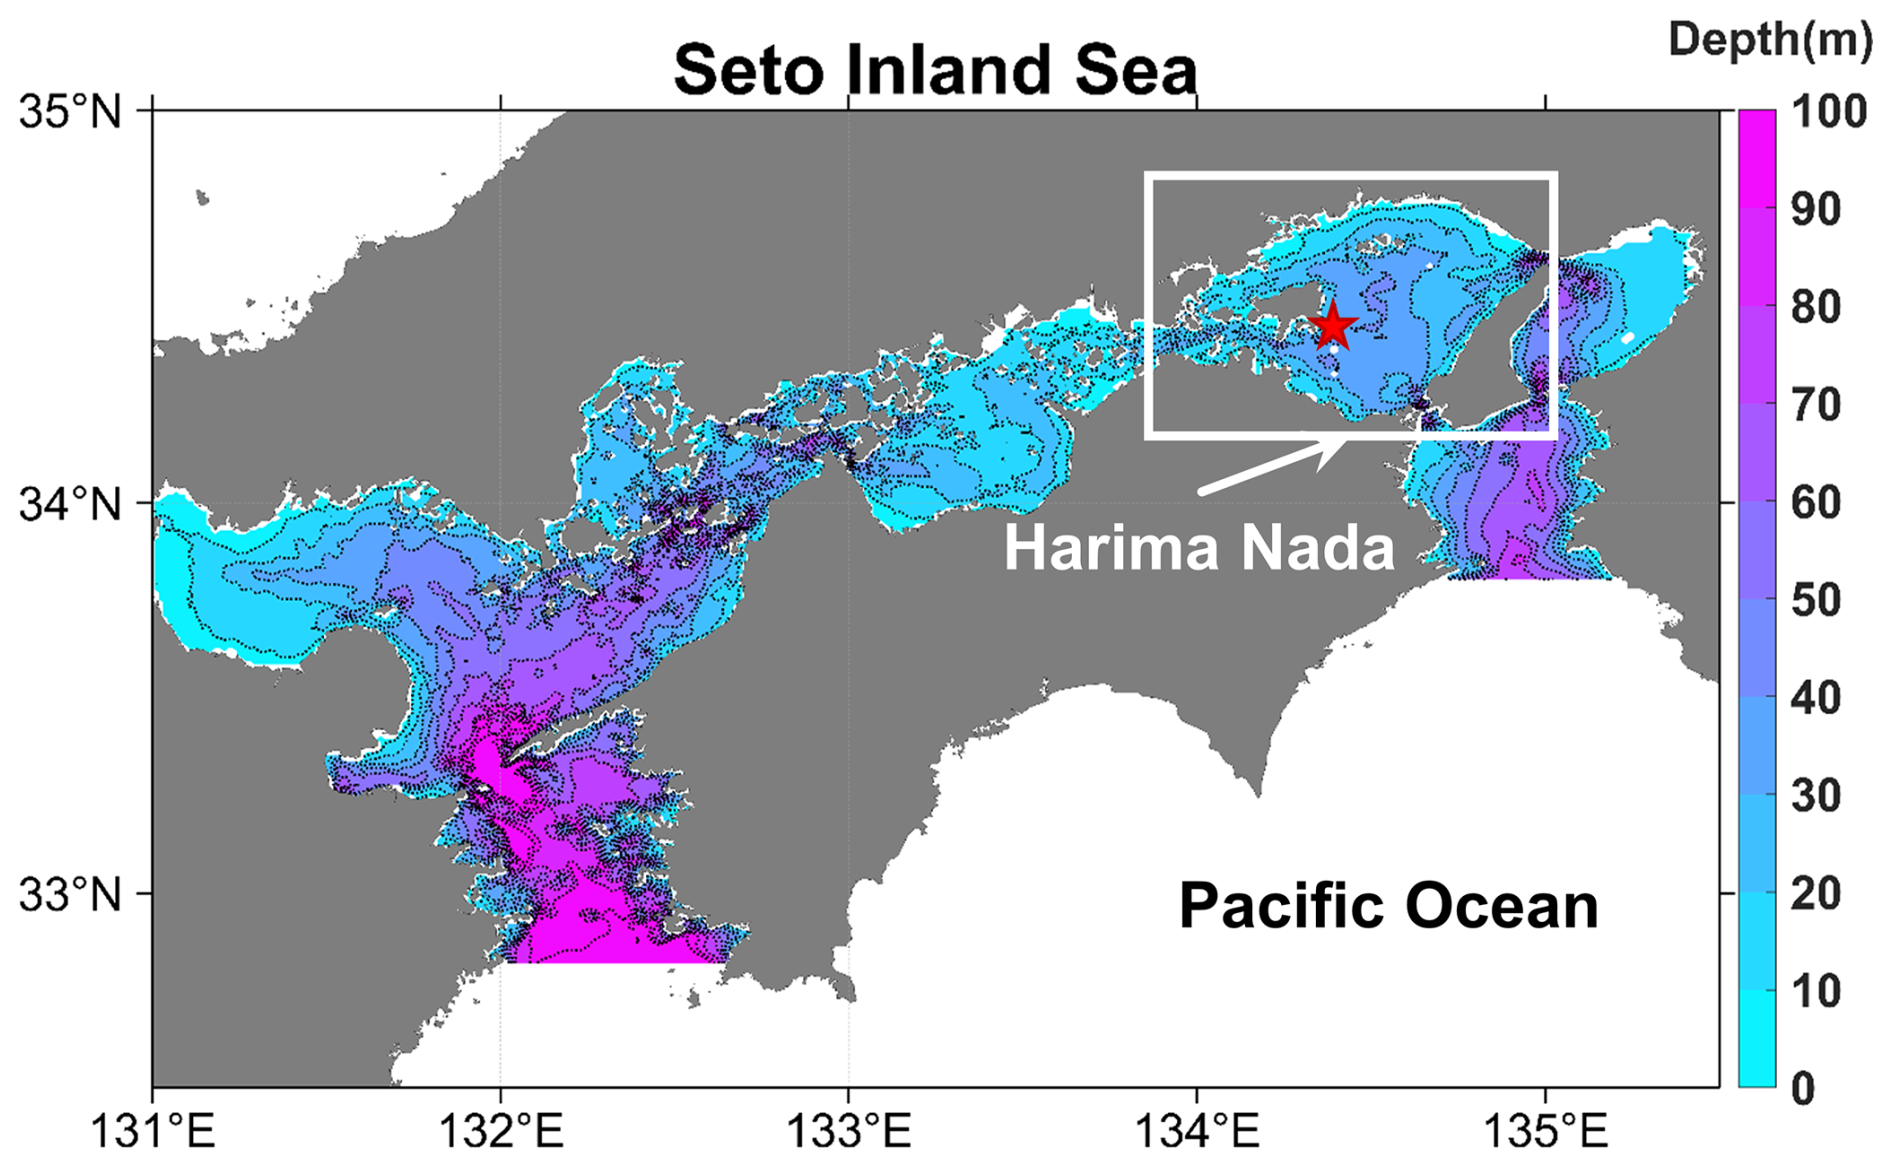
Figure 1Study area of the Harima Nada, Japan. The red star represents the site where the observational data used in this study were collected.
Based on the dataset from the Japanese Ministry of the Environment (https://water-pub.env.go.jp/water-pub/mizu-site/mizu/kouiki/dataMap.asp, last access: 2 September 2026), DO concentrations in Harima Nada range from 180 to 300 mmol m−3 (Fig. S1 in the Supplement). Surface DO exhibits clear seasonal variability, with the lowest values observed in autumn and the highest in winter. Controlled by hydrodynamic conditions, bottom DO reach its minimum in summer due to the intensification of stratification, while vertical mixing in winter leads to the highest bottom DO concentrations.
Chlorophyll concentrations and primary production in the water column are primarily regulated by nutrient availability (Leng et al., 2023; Tong-u-dom et al., 2025). During summer, elevated chlorophyll levels are observed in the estuarine region due to increased riverine nutrient input (Fig. S2 in the Supplement). In autumn and winter, enhanced vertical mixing redistributes DO, promoting higher chlorophyll concentrations in bottom waters. A previous study estimated the annual primary production in Harima Nada to be approximately 320 (Tada, 2021).
Most of the sediments in the Harima Nada are muddy, with a mud content exceeding 70 %. Such fine-grained sediments support abundant macrobenthic communities throughout Harima Nada (Tsujino, 2018; Umehara et al., 2019). Previous studies have shown that sediment properties, particularly mud content, organic matter content, and redox conditions, strongly influence the abundance and community structure of benthic organisms in this region (Nishijima et al., 2015). Through bioturbation, bioirrigation, and organic matter processing, benthic organisms can affect sediment biogeochemical cycling and nutrient transformations in this region.
Over the past several decades, the environment of the Seto Inland Sea has undergone significant changes (Ishii et al., 2014; Yamamoto et al., 2021). With the continuous observations of sediments in Harima Nada by our collaborators, we have realized that the DIN input from sediments in this area is comparable to that from rivers, exhibiting notable seasonal variations (Leng et al., 2023; Nakakuni et al., 2024). However, the driving factors and mechanisms behind these seasonal changes remain unclear. Therefore, Harima Nada serves as an excellent study area, and these observational data can provide a sufficient validation to ensure the reliability of model results (Nakakuni et al., 2024). This allows us to examine the seasonal variations in sediment nitrogen cycling and interfacial nitrogen fluxes, as well as their controlling mechanisms. Additionally, this study lays the groundwork for future exploration of how sediment nitrogen cycling responds to long-term changes in the aquatic environment.
2.2 Model descriptions
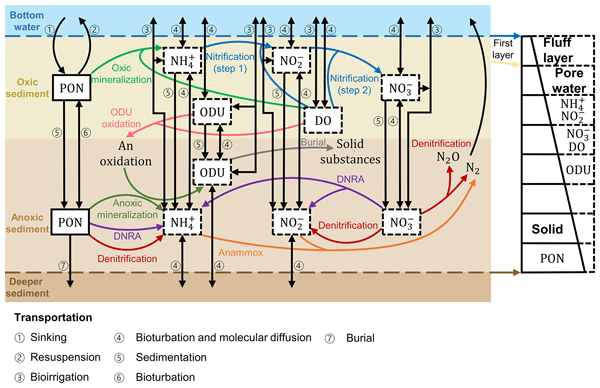
Based on the theory of early diagenesis (Berner, 1980), we have developed a biogeochemical model for sediment (Fig. 2). This model encompasses two components: solid matter and pore water. The state variables consist of the concentrations of two types of PON (fast-decayed and slow-decayed ones) for the solid matter and the concentrations of , , , DO, and ODU (the oxygen demand units) in the pore water. Throughout this study, PON refers to particulate organic nitrogen in the sediment solid phase and excludes dissolved nitrogen species in porewater. ODU is a lumped variable representing reduced metabolites generated by anoxic mineralization (e.g. reduced Fe, Mn, and sulfur species), expressed in oxygen-equivalent units to quantify their potential oxygen demand upon re-oxidation (Soetaert et al., 1996). Additionally, we set a fluff layer at the top of sediment, where the active benthos and material exchange processes with the above water column occur (Lee et al., 2002; Kuhrts et al., 2006; Laima et al., 2002).
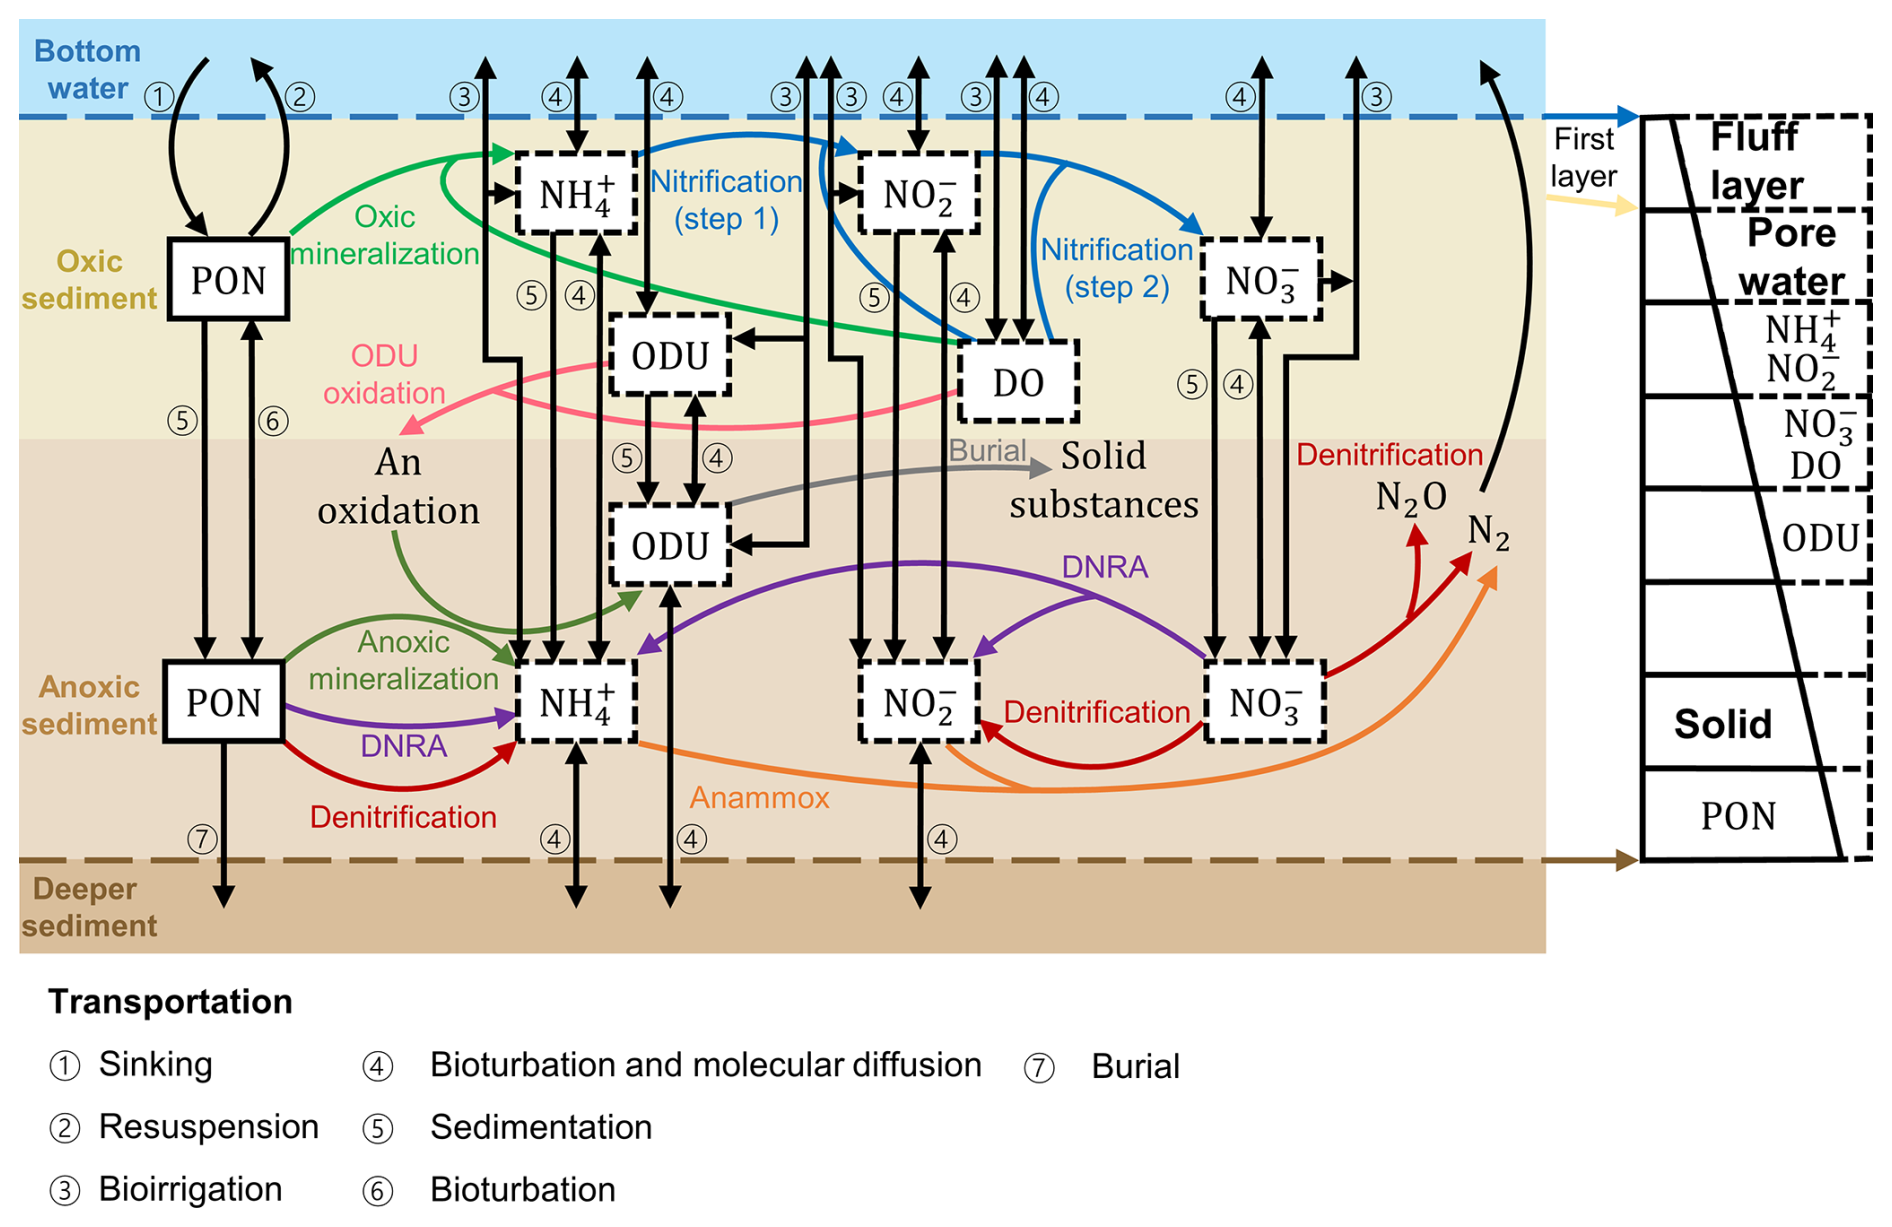
Figure 2Physical and biogeochemical processes for nitrogen cycle in the sediment model. Six state variables in the model are PON, , , , DO, and ODU (the oxygen demand units). PON is a solid substance (enclosed by solid lines), while , , , DO, and ODU are solutes in the pore water (enclosed by dash lines). The physical processes and biogeochemical processes are denoted by black arrows and coloured arrows, respectively. The numbers with circle denote the transport processes included in the model. The panel on the right represents the sediment separated into two distinct phases: solid and dissolved components, with porosity diminishing with increasing depth. The surface layer of the model is identified as the fluff layer.
In the solid part, the fast-decayed and slow-decayed PON are treated with a large and small mineralization rate, respectively. Both of them undergo identical vertical transport processes, including downward sedimentation driven by gravity and vertical diffusion caused by bioturbation. Their mineralization occurring within the sediment provides a flux of into the pore water.
In the pore water, the dissolved , , , DO, and ODU are transported and diffused vertically, as corresponding to both bioturbation and molecular diffusion. The biogeochemical processes occurring within the pore water include nitrification, denitrification, anammox, dissimilatory nitrate reduction to ammonium (DNRA), ODU oxidation, and ODU burial. ODU oxidation denotes the oxygen-mediated re-oxidation of reduced compounds represented by ODU, resulting in oxygen consumption. ODU burial represents the permanent removal of these reduced compounds from the active sediment layer through downward sediment transport into deeper sediments (Soetaert et al., 1996).
At the sediment-water interface, the exchange of solid matter is controlled by the bottom shear stress. The solid matter in the water column sinks into the fluff layer when the bottom stress is below a critical value, while resuspension occurs when the bottom stress exceeds this threshold. The exchange fluxes of , , , DO, and ODU at the interface are determined by the product of the diffusion coefficient, including both bioturbation and molecular diffusion, and their concentration gradient between the fluff layer and the overlying water.
In the deepest layer of sediment, only the slow-decayed PON is allowed to move downward and leave the model domain via burial. The exchange fluxes of , , and ODU between the model domain and the underlying pore water are calculated by the product of the diffusion coefficient and the concentration gradient derived from the model results at the nearest grid point and the observations in the underlying pore water. Because and DO are assumed absent in the underlying deep anoxic sediments, no diffusive exchange across the lower boundary is allowed, and their bottom-boundary fluxes are therefore set to zero.
2.3 Equations and parameters
The equations for the concentrations of solid matter () and dissolved matter () are as follows:
Where z (m) is vertical axis for sediment depth, t (s) is time, Φ is the sediment porosity, DB (m2 s−1) is the bioturbation coefficient, DM (m2 s−1) is the molecular diffusion coefficient, ω (m s−1) is the sedimentation velocity, α (s−1) is the bioirrigation coefficient, (mmol m−3) is the concentration of dissolved matter in the bottom water, Rs is the biochemical reaction rate of PON, and Rd is the biochemical reaction rate of dissolved matter, including , , , DO, and ODU. Since the sediment type in the study area is muddy, the advection of pore water in sandy sediments controlled by pressure is neglected.
The vertical profile of DB is expressed as Eq. (3) (Radtke et al., 2019).
Where zmax (m) is the depth down to which the maximum bioturbation coefficient () is applied, zd (m) is the decaying length scale of (m2 s−1).
DM of dissolved matter in the pore water is a function of porosity, and is expressed as follows (Boudreau et al., 1998; Radtke et al., 2019):
where DT (m2 s−1) is the diffusion coefficient of the dissolved matter in the particle-free liquid at T °C. The relationship between DT and temperature (T) is expressed as (Soetaert et al., 1996):
where D0 (m2 s−1) is the diffusion coefficient of the dissolved matter in the particle-free liquid at 0 °C, a () is an ion-specific coefficient.
Bioirrigation characterizes the dissolved matter exchange caused by biological burrowing activities, and the coefficient decreases with depth (Dale et al., 2011):
The parameters α1 (s−1) and α2 (m) represent the magnitude of bioirrigation and the depth at which it decreases to half of α1, respectively.
The biochemical reactions are expressed in Eqs. (7)–(12), and their formulations are summarized in Table 1 (Soetaert et al., 1996; Capet et al., 2016; Akbarzadeh et al., 2018). The reaction rates are regulated by DO availability, electron acceptor competition, and temperature. Following Soetaert et al. (1996), the limitation functions associated with different mineralization pathways are normalized by their sum () to partition organic matter mineralization among oxic mineralization, denitrification, and anoxic mineralization, ensuring that the combined mineralization rate does not exceed the prescribed first-order degradation rate. In the model, temperature correction is applied only to organic matter mineralization, which serves as the primary source of reactive nitrogen and reduced substances in the sediment. The influence of temperature on other nitrogen transformation processes is represented indirectly through coupled biogeochemical interactions and temperature-dependent molecular diffusion. Following Akbarzadeh et al. (2018), several pathway-partitioning and leakage coefficients are introduced to account for the incomplete conversion of nitrogen intermediates and the distribution of products among nitrate reduction pathways. All related coefficients and parameters are listed in Table 2. The sensitivity analysis of model parameters is presented in Fig. S3 and Sect. S1 in the Supplement.
Table 1Reaction formulas and rate expressions.
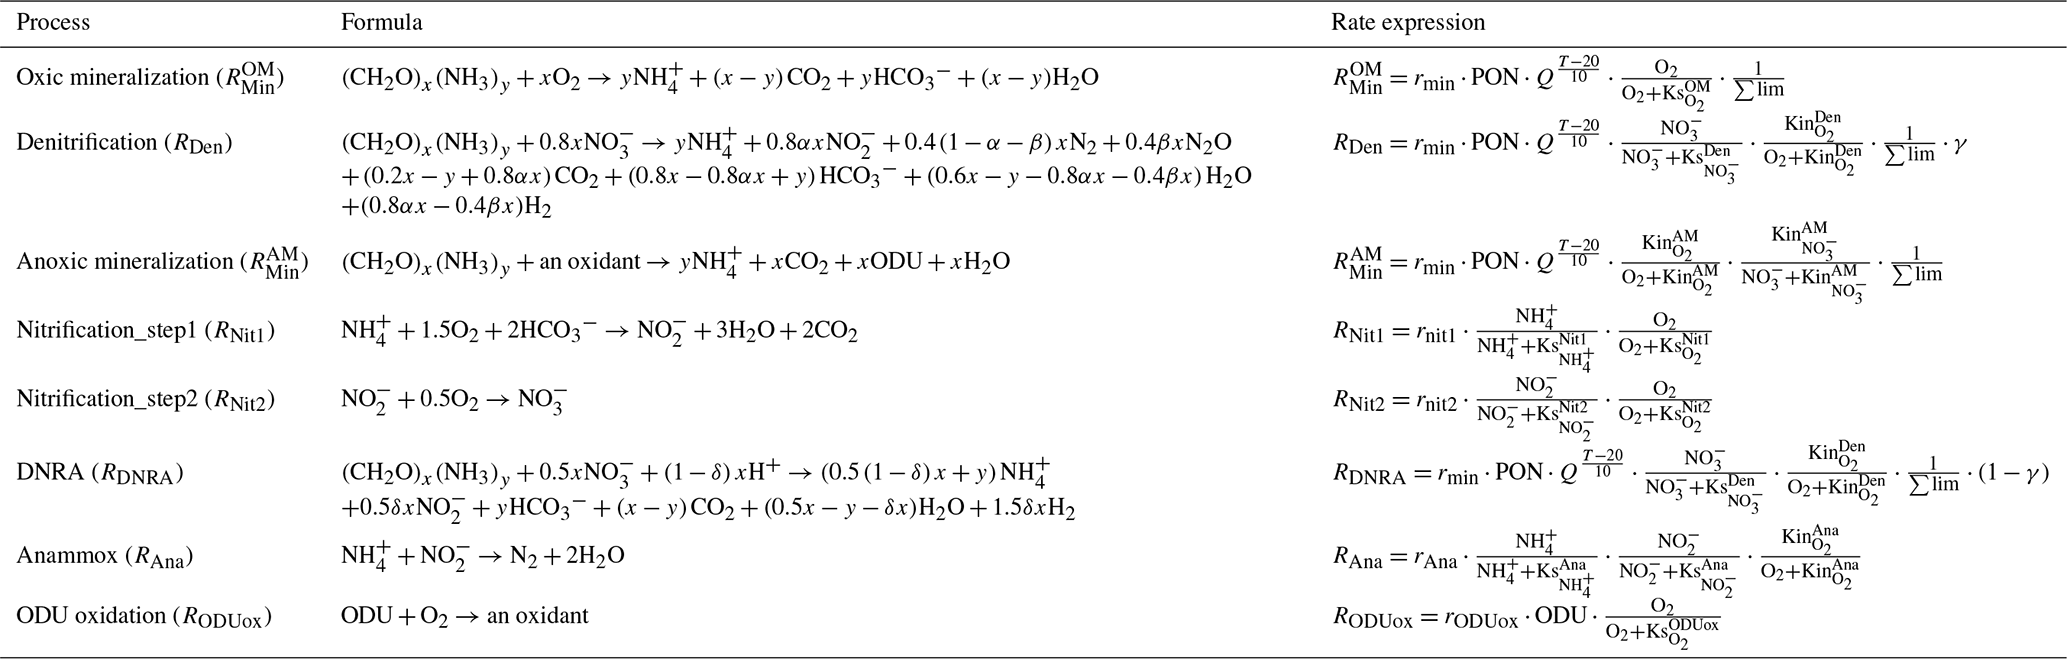
. is used to rescale competing mineralization pathway, ensuring that the combined mineralization rate does not exceed the maximum first-order degradation rate (Soetaert et al., 1996).
x:y denotes the molar C:N ratio of organic matter.
Table 2Model parameters. (L: based on literature; M: constrained with the model, I: independently determined from observations).
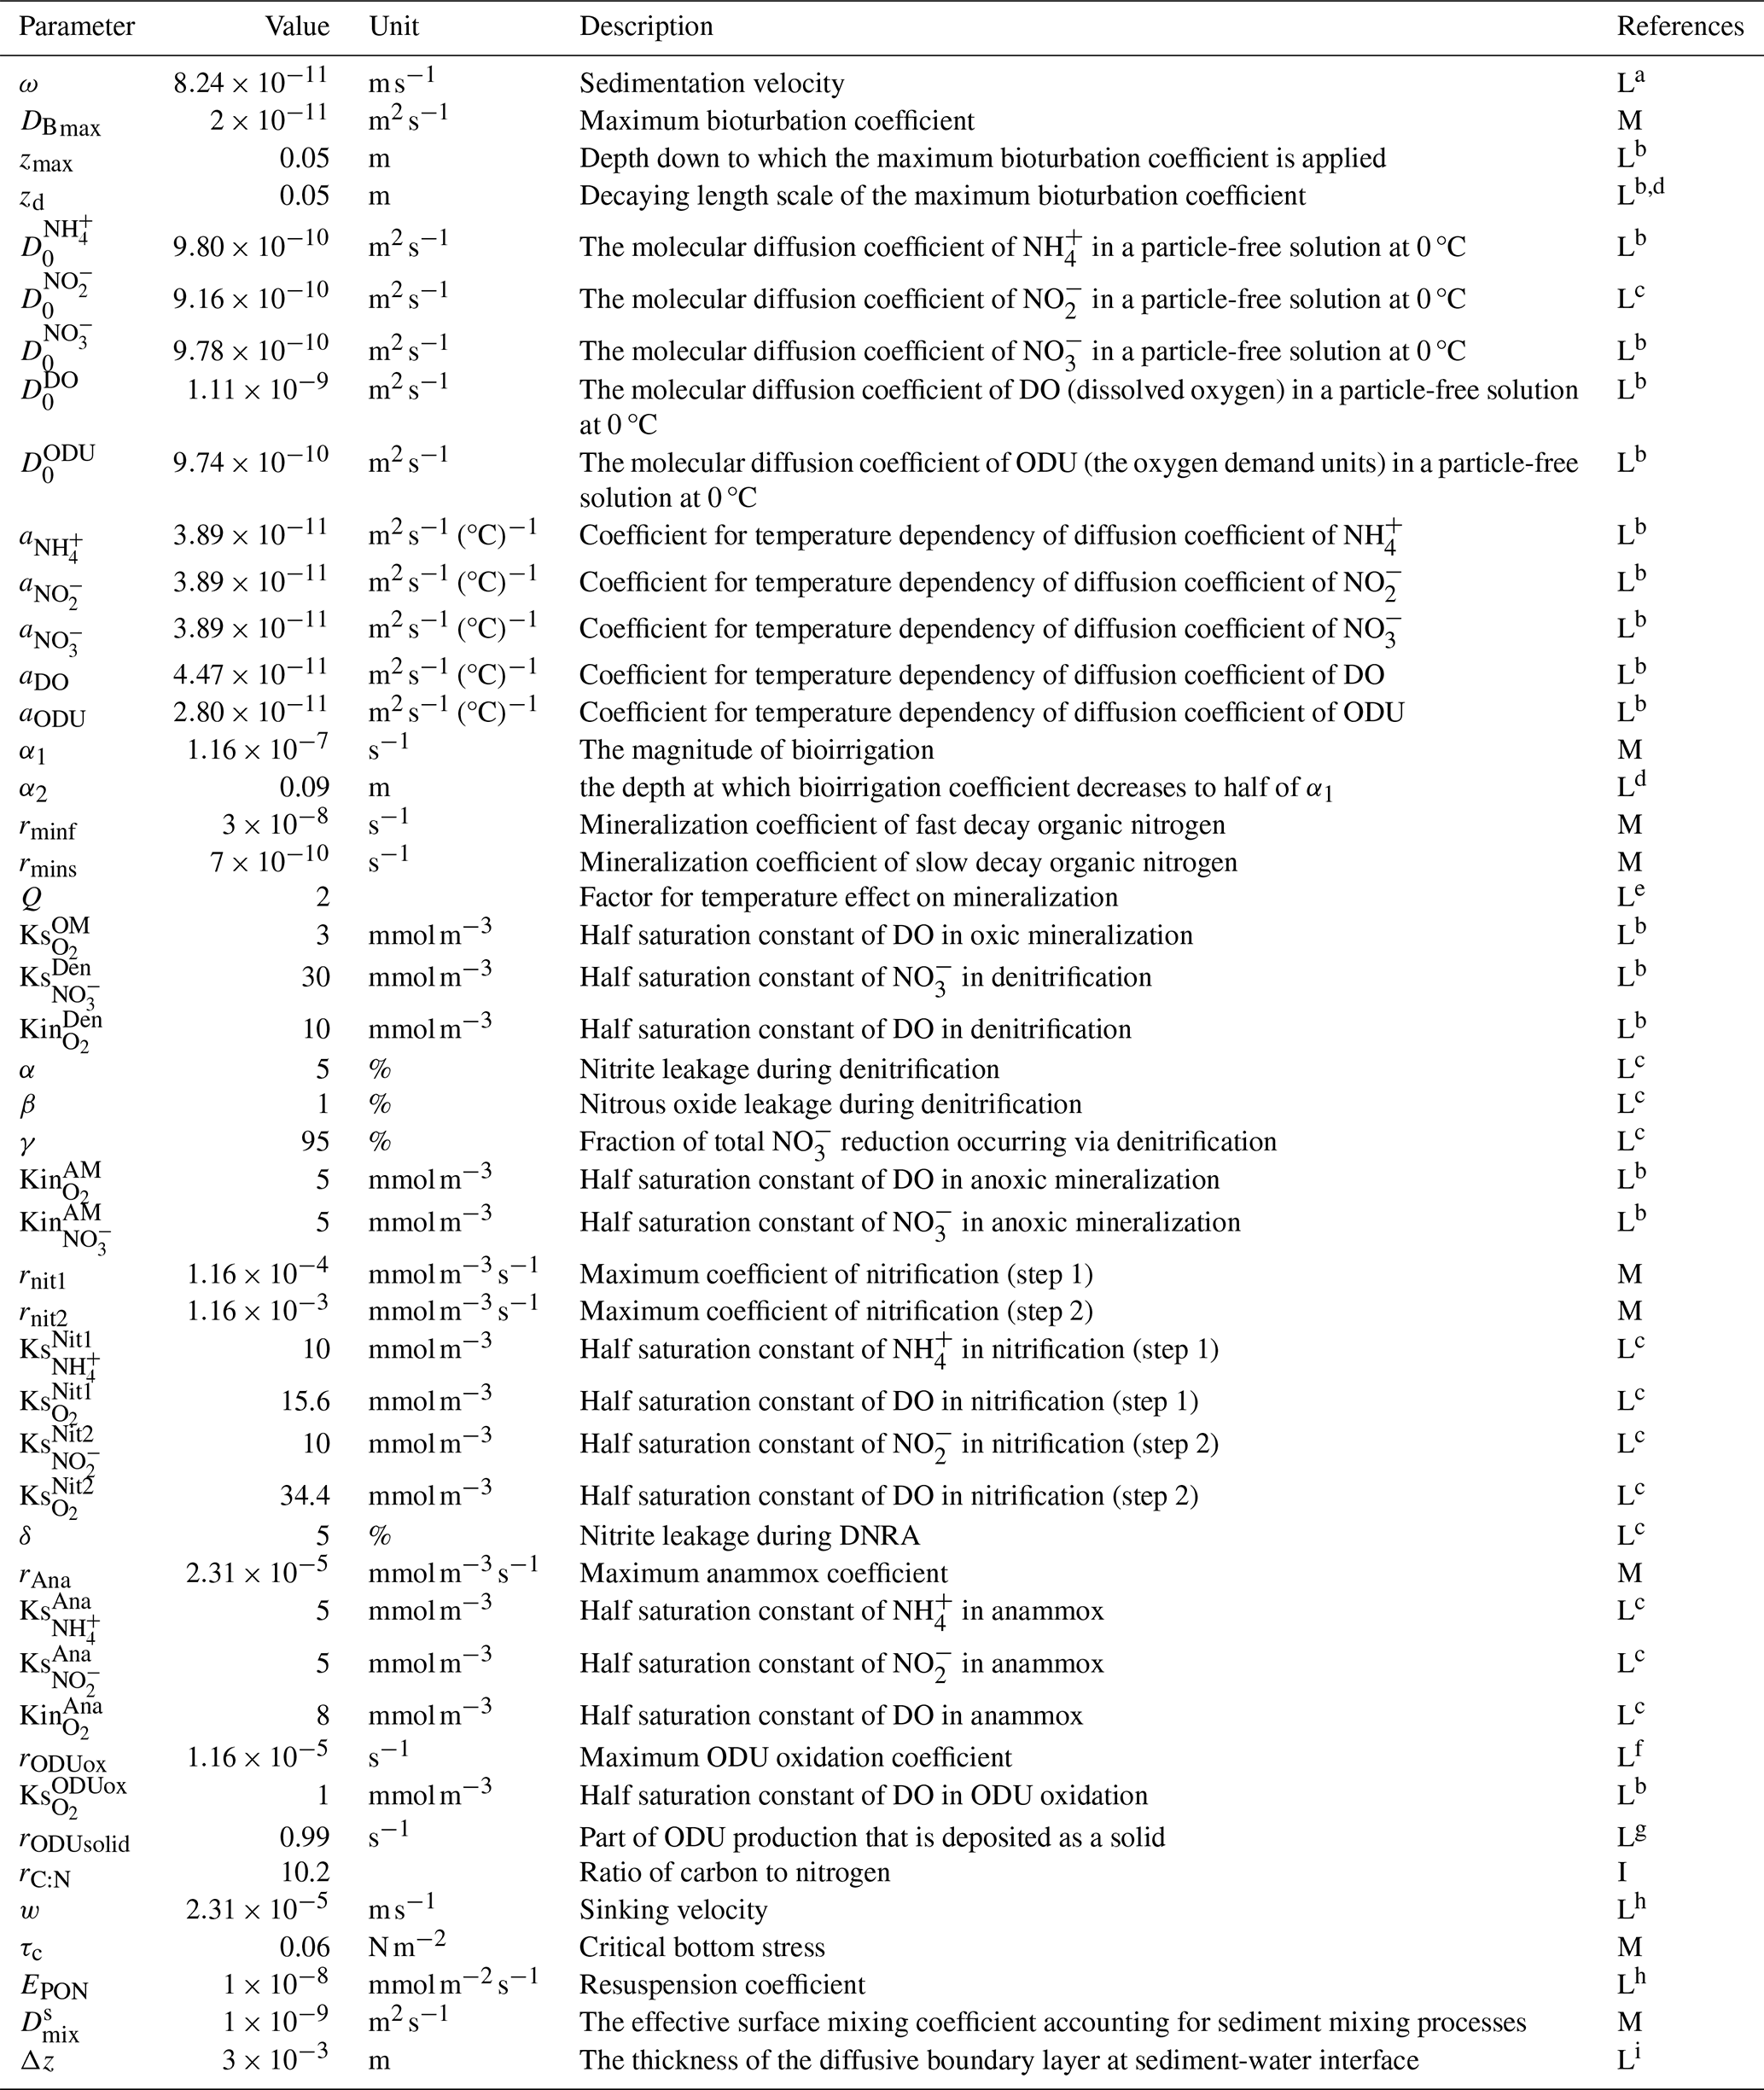
a Ichimi et al. (2005); b Soetaert et al. (1996); c Akbarzadeh et al. (2018); d Dale et al. (2011); e Capet et al. (2016); f Laurent et al. (2016); g Pastor et al. (2011); h Ding et al. (2020); i Wang et al. (2016)
Due to the high benthic biomass and rapid organic matter turnover within the fluff layer, mineralization in this layer was assumed to be substantially enhanced relative to the underlying sediment (Lee et al., 2002; Kuhrts et al., 2006; Laima et al., 2002). The enhancement factor was treated as a tuning parameter and was finally set to 50 based on model calibration against observed sediment biogeochemical characteristics.
At the sediment-water interface, the sinking and resuspension of PON depend on the bottom stress. The exchange flux (Fs) is expressed as (Wang, 2002):
where w (m s−1) is the sinking velocity of particles in the bottom water, (mmol m−3) is concentration of PON in the bottom water, τ (N m−2) is the bottom stress, τc (N m−2) is the critical bottom stress, Es () is the resuspension coefficient.
The exchange of solutes (, , , DO, and ODU) are mainly through bioturbation, bioirrigation and molecular diffusion, and the flux (Fd) is expressed as (Boudreau et al., 1998):
where (m2 s−1) is the effective surface mixing coefficient accounting for sediment mixing processes such as bioturbation and resuspension, (m2 s−1) is the surface molecular coefficient, (mmol m−3) is the concentration of dissolved matter in the pore water of fluff layer, Δz (m) is the thickness of the diffusive boundary layer at sediment-water interface.
At the bottom of the model domain, the slow-decayed PON is allowed to move out as the burial process with a flux (Bs) as (Radtke et al., 2019):
where superscript of b represents the deepest layer of the model domain.
The bottom fluxes (Bd) of , , and ODU are expressed as:
where are the concentrations in the pore water under the deepest layer of the model domain (mmol m−3), whose values are given from observations.
2.4 Model configurations
The model configuration, including all initial and boundary conditions used in the simulations, is described in this section.
Since this study focuses on seasonal changes at the sediment–water interface, the sediment depth in the model was set to 10 cm and uniformly divided into 100 layers.
The initial sediment concentration profile of PON was obtained from core observations in Harima Nada in July 2020, while those of , , and were derived from observations conducted in April (Nakakuni et al., 2024). The DO profile was adopted from previous observations in the Seto Inland Sea (Sayama et al., 2002). The ODU concentration was initially set to 100 mmol m−3 and allowed to evolve dynamically within the model. In addition, the porosity profile was prescribed as a constant input condition throughout the simulation (Fig. S4 and Sect. S2 in the Supplement).
Monthly observations of bottom water temperature and concentrations of , () and DO from April 2020 to April 2021 were used to prescribe the upper boundary conditions, while and concentration beneath the model domain from April 2020 to May 2021 served as the bottom boundary conditions (Nakakuni et al., 2024). The concentration of PON and in the bottom water were collected from the seasonal dataset of Japanese Ministry of the Environment from January 2020 to May 2021. The bottom stress was derived from a hydrodynamic model for the Seto Inland Sea (Zhu et al., 2019) (Fig. 3). The ODU concentration in the bottom water was set to 0 mmol m−3, while its concentration in the deeper sediment was assumed to be the initial value of 100 mmol m−3 (Soetaert et al., 1996). Forced by these boundary conditions, the sediment model simulated the nitrogen cycle changes in the sediments of Harima Nada from April 2020 to March 2021. Additionally, the model was calculated for a long time (more than 170 years) to reach a steady-state condition, wherein the input and output fluxes of materials become balanced.
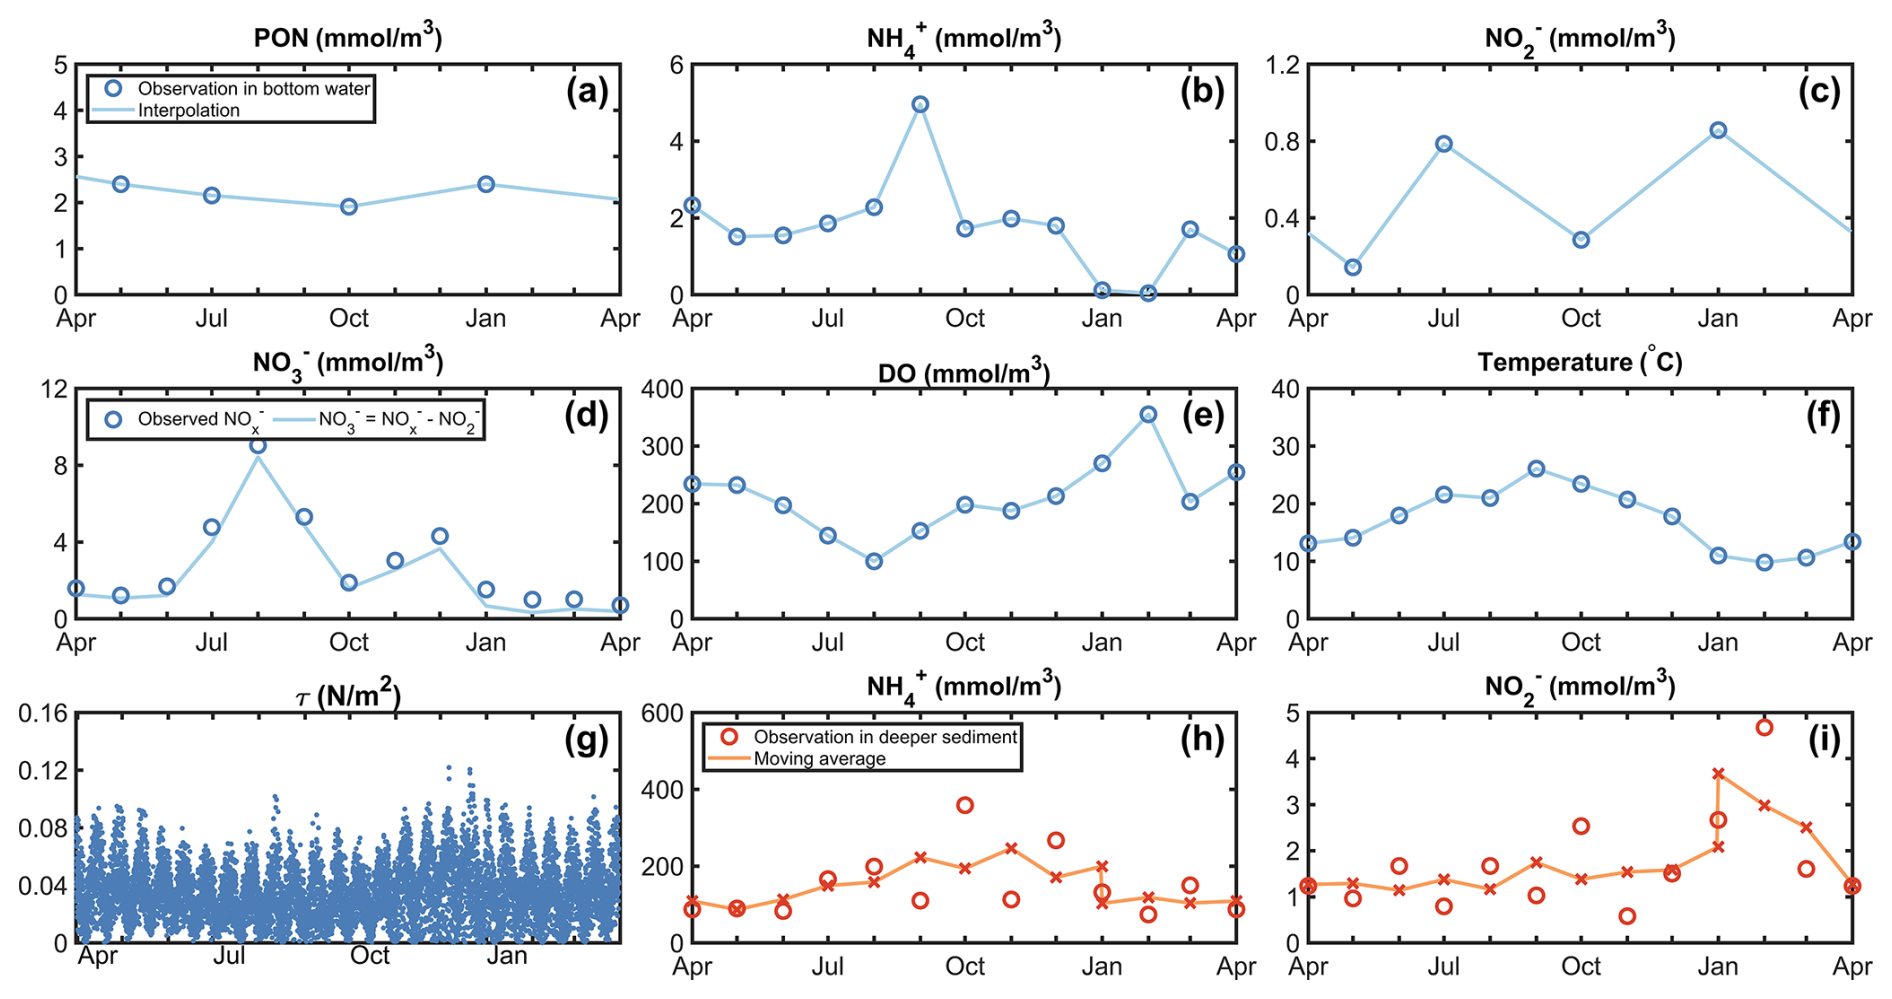
Figure 3Model boundary conditions for the simulation period spanning April 2020–March 2021: (a) PON concentration, (b) concentration, (c) concentration, (d) concentration, (e) DO concentration in the bottom water, (f) bottom water temperature, (g) bottom stress, (h) concentration and (c) concentration in the layer below model domain (10–12 cm). The extrapolation shown in panels (a) and (c) utilizes the observed values from January 2020 and May 2021 for interpolation, which are not displayed in this figure. For panels (h) and (i), monthly observations are smoothed using a three-point moving average to reduce intra-seasonal variability.
3.1 Seasonal variations of the particle and dissolved nitrogen concentrations in the sediment
The monthly concentrations of PON, , DO, , and at different layers from 0 to 10 cm in the model domain are shown in Fig. 4, alongside the corresponding observed data. The comparison between the model results and the observations, especially the seasonal variations, suggests a reliable performance of the model.
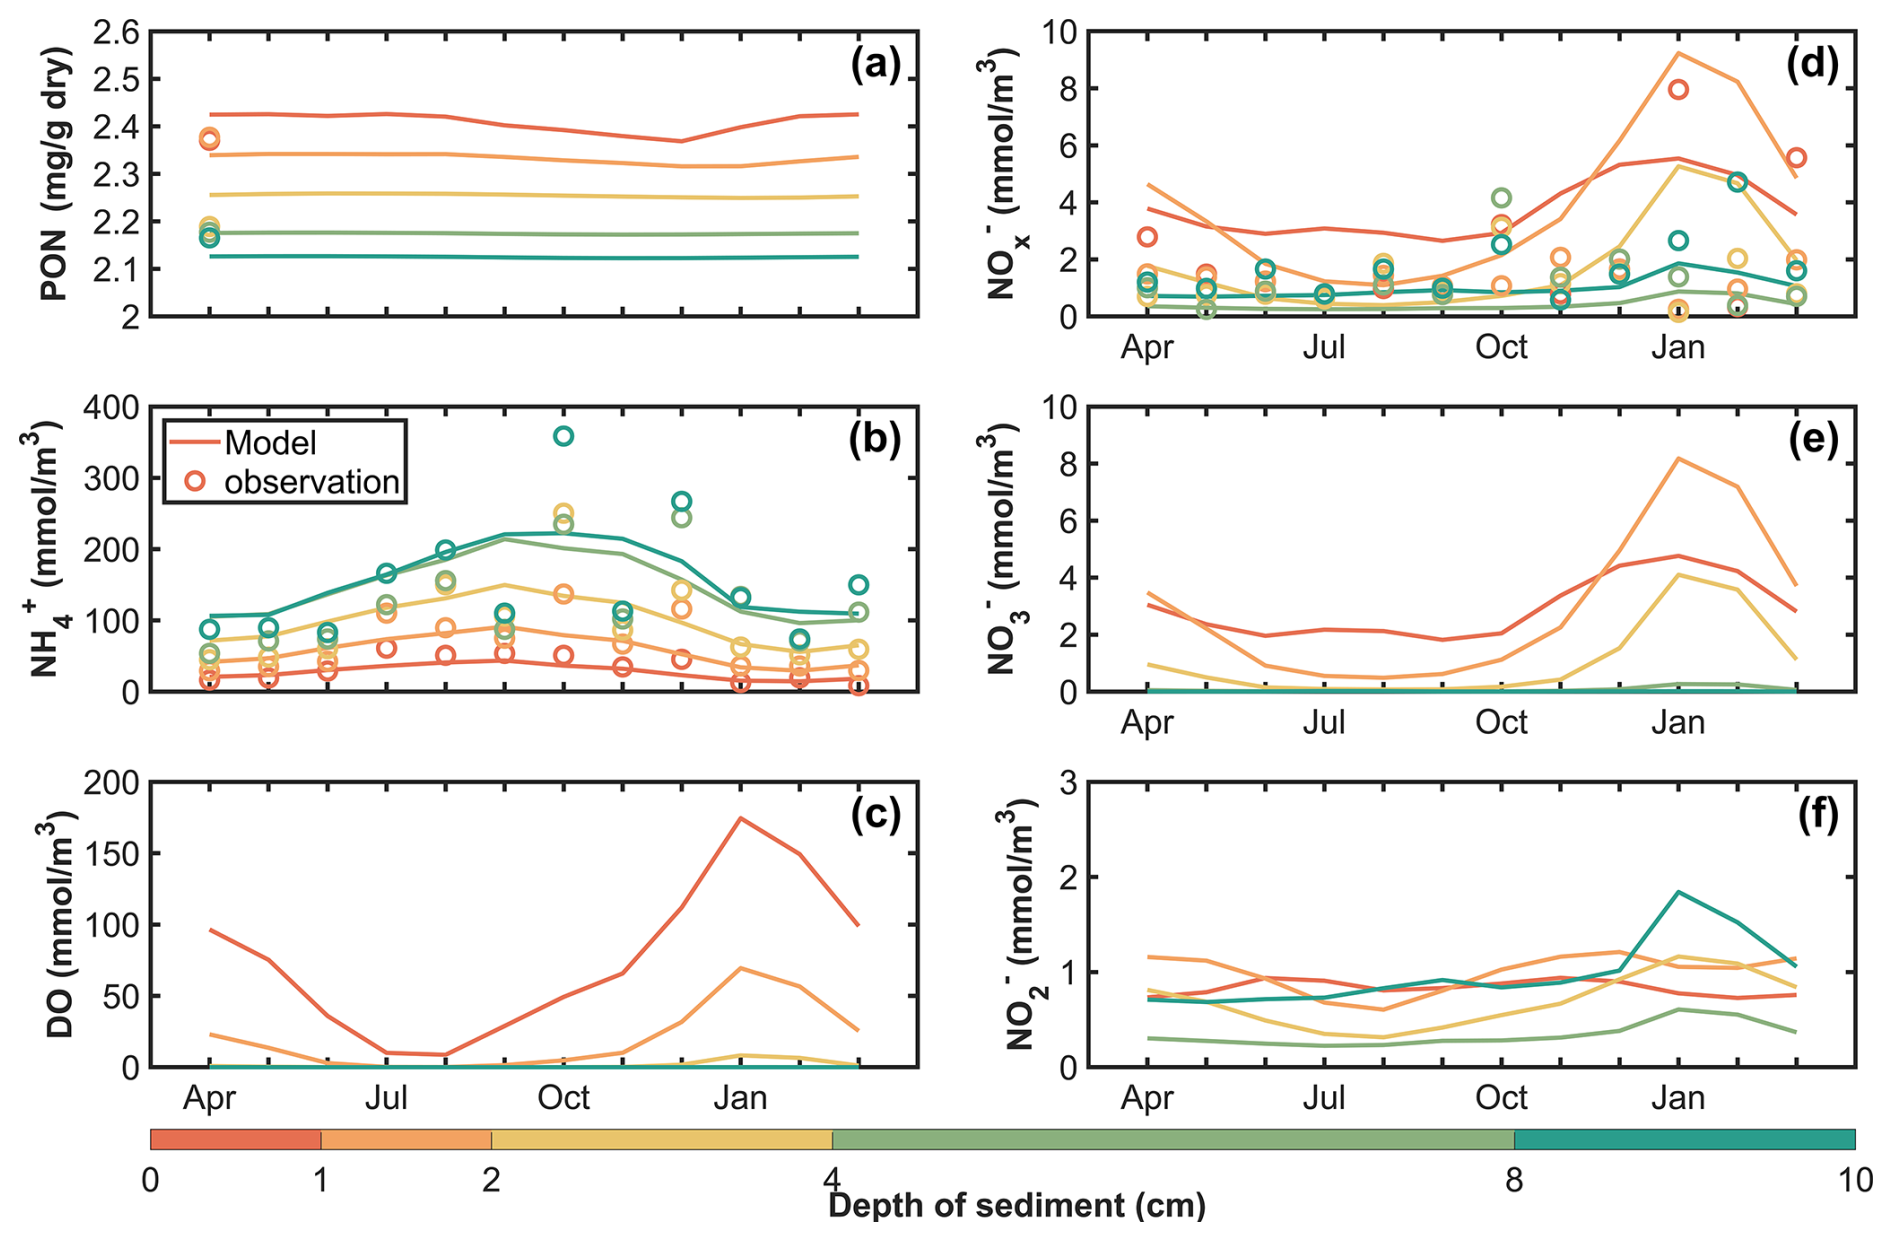
Figure 4The seasonal variations of concentrations of (a) PON, (b) , (c) DO, (d) (), (e) and (f) in different layers in the sediment. Colours represent different depth. In all the panels, lines are model results and circles are the observation data.
The concentration of PON in the sediment was consistently greater in the surface layer compared to the underlying layers (Fig. 4a). Its seasonal variation was apparent in the upper 2 cm of sediment and almost disappears in the layers below 2 cm. In the 0–1 cm layer, the PON concentration decreased from a value of 2.43 mg g−1 in April to a minimum value of 2.37 mg g−1 in December, followed by an increase back to 2.43 mg g−1 in March. In the deep layer of the sediment (8–10 cm), the PON concentration remained around 2.12 mg g−1 throughout the year.
The concentration had a minimum value at the surface and a maximum value at the deepest layer (Fig. 4b), which was contrary to the vertical distribution of PON concentrations. The concentrations presented significant seasonal variations across entire sediment layers, with the range of variation increasing with depth. For example, the concentration in the 0–1 cm layer presented the lowest value of 14.65 mmol m−3 in February and the highest value of 43.79 mmol m−3 in September; however, the concentration in the deep layer of the sediment (8–10 cm) presented the lowest value of 106.44 mmol m−3 in April and the highest value of 222.35 mmol m−3 in October. Except for the episodic high values observed in the deep sediment layer during autumn, the model successfully reproduced the seasonal variation of concentration across all sediment layers, which was characterized by lower levels in winter and spring and elevated levels in summer and autumn.
The DO concentration profiles exhibited a clear vertical gradient, with higher values at the surface and lower values in deeper layers (Fig. 4c). Surface DO reach a maximum of 174.51 mmol m−3 in January and decreased to a minimum of 8.70 mmol m−3 in August. The oxygen penetration depth (OPD) remained below 1 cm from June to October, and extended below 2 cm only during January and February.
was the dominant component of (Fig. 4d and e). From December to April, a subsurface maximum appeared at the layer of 1–2 cm, whereas during the rest of the year the highest concentrations occurred at the surface layer. Within the 0–4 cm layer, exhibited a pronounced seasonal pattern, with lower concentrations in summer and higher concentrations in winter. Specifically, concentrations ranged from 1.82 to 4.76 mmol m−3 in the 0–1 cm layer, 0.49–8.18 mmol m−3 in the 1–2 cm layer, and 0.08–3.58 mmol m−3 in the 2–4 cm layer. Below 4 cm, the concentrations remained close to zero throughout the year.
also showed the similar seasonal pattern, with lower concentrations in summer and higher concentrations in winter (Fig. 4f). The maximum value of 1.84 mmol m−3 occurred in January at the deepest layer. Vertically, the maxima alternated between the 0–2 cm layer and the 8–10 cm layer. Notably, during January to February, the maximum concentration in the 8–10 cm layer exceeded 1 mmol m−3, whereas in other months the peak values remained around 1 mmol m−3.
3.2 The flux of PON, DIN and N-loss (N2 and N2O) between bottom water and sediment
In this section, we introduce the fluxes across the sediment–water interface, including the net sinking flux of PON and the exchange fluxes of solutes driven by molecular diffusion and bioturbation. Bioirrigation is not included in these fluxes because it is represented as a source–sink term distributed in the sediment column rather than as an interface flux. Its contribution is also substantially smaller than the calculated sediment–water fluxes as shown in Sect. 3.3.
At the sediment-water interface, PON sank from the bottom water to the sediment throughout the year (Fig. 5a). The PON flux exhibited a bimodal seasonal pattern, with two peaks in July (2.14 ) and February (1.96 ), and a minimum in November (1.50 ).
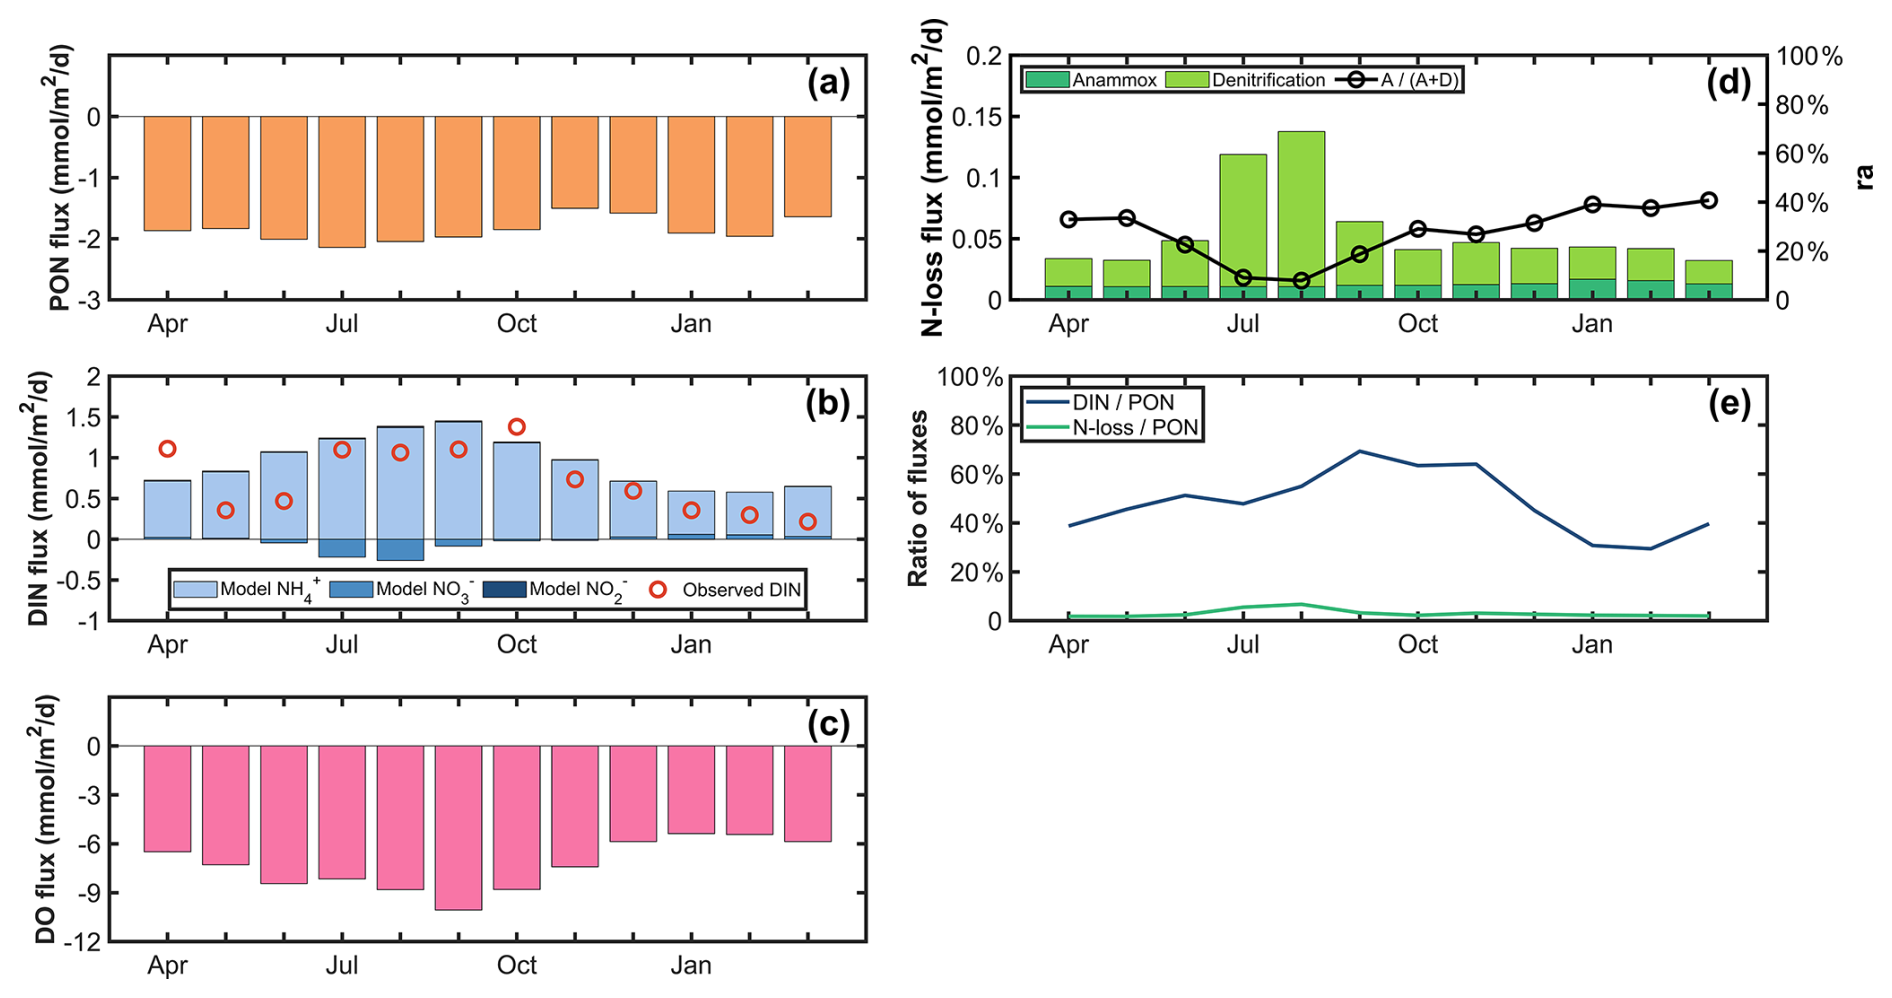
Figure 5The fluxes of (a) PON, (b) DIN, (c) DO, (d) N-loss (N2 and N2O) at the sediment-water interface in the model, and (e) the ratios of DIN and N-loss fluxes to PON flux. The red circles in (b) are the values given by observations. DIN in (b) are sum of , , and , whose fluxes are presented in different colour in the same panel. Positive values indicate upward fluxes from the sediment toward the overlying water, whereas negative values indicate downward fluxes into the sediment. In (d), ra represents the proportion of the anammox in N-loss flux.
DIN in the Harima Nada was released from the sediment into the bottom water throughout the year, exhibiting the highest flux of 1.37 in September and the lowest flux of 0.58 in February (Fig. 5b). The DIN flux and its seasonal variation given by the model exhibit a general agreement with observations (Nakakuni et al., 2024). The flux dominated the seasonal variability of DIN flux, reaching a maximum of 1.44 in September and a minimum of 0.52 in February. In contrast, the fluxes were substantially smaller. From June to November, was transported from the bottom water into the sediment, with a maximum influx of 0.26 in August. From December to April, was released from the sediment into the overlying water, with a peak of 0.06 in January. The fluxes were negligible. A slight influx into the sediment occurred in January (0.002 ), whereas in all other months was released from the sediment, with a maximum of 0.02 in August. The DO flux continuously supplies DO from the bottom water to the sediment and is the only source of DO for the sediment. It reached the highest value in September at 10.06 and its lowest in January at 5.37 (Fig. 5c).
N-loss is produced through denitrification and anammox inside the sediment, generating N2 and N2O that are released to the overlying water. The N-loss flux across the sediment-water interface reached its peak of 0.14 in August and the lowest value of 0.03 in March (Fig. 5d). Denitrification-derived N2 and N2O constituted the dominant components of N-loss flux and controlled its seasonal variability, with values ranging from 0.02 to 0.13 . In contrast, the N2 production via anammox showed weak seasonal variation, remaining approximately constant at 0.01 . Consequently, the relative contribution of anammox to N-loss flux (ra %) was lowest in August (8 %) and highest in March (41 %). Although N2 was the main product of denitrification, the flux of N2O, a potent greenhouse gas, was not negligible. It varied from 0.19 to 1.27 , with a mean value of 0.44 .
The ratio of DIN flux to PON flux (RDIN/PON) reflects the fraction of nitrogen that sinks into the sediment and later releases back to the seawater (Fig. 5e). RDIN/PON increased from 39 % in April to a peak of 69 % in September, with the annual average of 48 %. The ratio of N-loss flux to PON flux (RN-loss/PON) represented the proportion of nitrogen removed from the sediment. The highest value of RN-loss/PON was 7 % in August while the lowest value was 2 % in May. The sum of RDIN/PON and RN-loss/PON ranged from 32 % in February to 73 % in September, with an annual average of 51 %. It suggested that around 50 % of the PON flux sinking from seawater was retained in the sediment on average, with this retention rate potentially reaching nearly 70 % during certain months.
3.3 The budgets of PON, , and in the sediment
The annual budgets for the four forms of nitrogen in the sediment of Harima Nada are estimated from the model results (Fig. 6). To facilitate comparison with the fluxes presented in the preceding sections, all fluxes and reaction rates are expressed as annual mean daily values (). The sinking of PON from bottom water was the source of PON in the sediment, quantified at 1.86 . Since the primary production in the Harima Nada in 2020 was estimated to be 8.02 (Tada, 2021), it could be interpreted that about 23 % of the particles produced by primary production sank into the sediment. Within the deeper layers of the sediment, the burial rate of PON was 0.72 , representing 39 % of the PON flux into the sediment and 9 % of the primary production. The rest 1.12 of PON flux into the sediment was mineralized to , which became the main source of in the sediment.
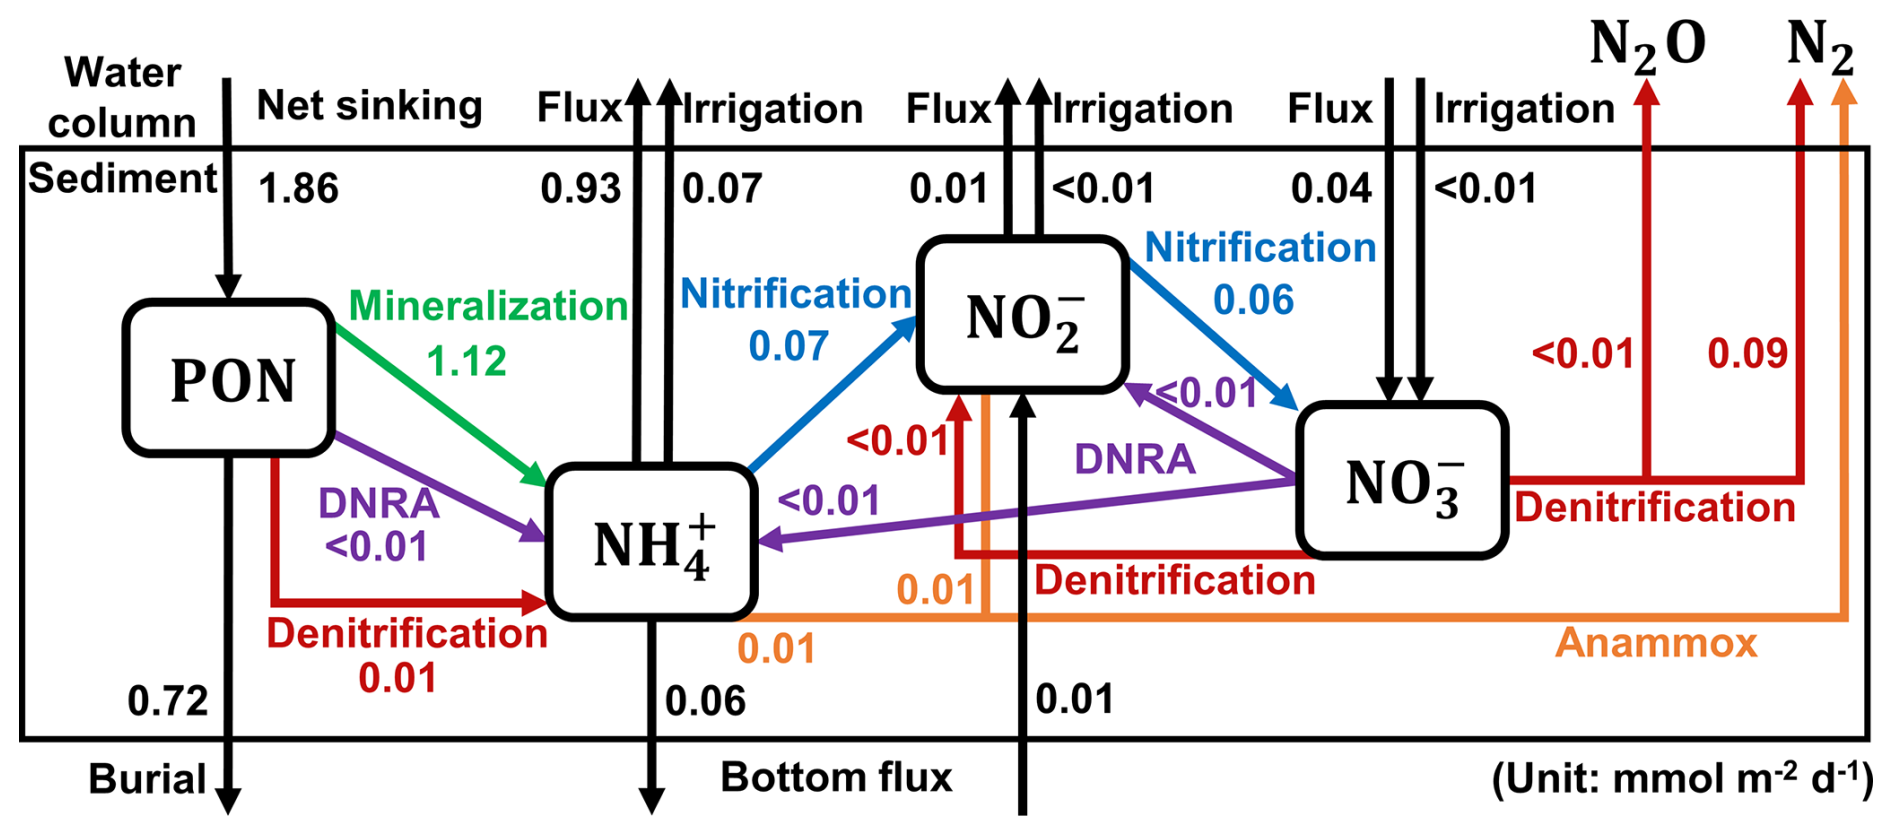
Figure 6Nitrogen budgets in the sediment model of Harima Nada. All fluxes and reaction rates are expressed as annual mean daily values ().
In addition to mineralization, was also produced via denitrification and DNRA in the model, but the contributions from these two processes were considerably lower. Additionally, a flux of 0.06 of was transferred to the deeper sediment located beneath the model domain. Furthermore, has four sinks: the nitrification of to had a rate of 0.07 , the anammox of to N2 had a rate of 0.01 , the upward flux through the sediment-water interface was quantified at 0.93 and 0.07 of was released from the sediment by bioirrigation.
At the sediment–water interface, was released into the overlying water with a flux of 0.01 , while bioirrigation contributed less than 0.01 . Nitrification converted 0.06 of into . inputs from the bottom water to the sediment occurred via diffusive exchange and bioirrigation, amounting to 0.04 and less than 0.01 , respectively. DNRA consumed less than 0.01 of , whereas denitrification produced 0.09 of N2 and N2O. In total, nitrogen removal processes (denitrification and anammox) generated 0.10 of N2 and N2O, corresponding to approximately 6 % of the PON sinking flux. Overall, bioirrigation is much weaker than the diffusive flux of solutes between sediments and water, and their seasonal variations shown in Fig. S5 and Sect. S3 in the Supplement.
4.1 Factors affecting the seasonal variations of nitrogen inventories in the sediment
The model results show that the concentrations of PON, , , and DO in the sediment exhibit apparent seasonal variations. To clarify the factors controlling these seasonal variations, we carried out seven sensitivity experiments, in which we removed the seasonal variation of one of the following seven variables by substituting its monthly means with its annual mean: PON concentration (PONbw), concentration (), concentration (), concentration (), DO concentration (DObw), and water temperature in the bottom water, as well as bottom stress. Figure 7 shows the calculation results of the seven sensitivity experiments alongside the results described in Sect. 3 (referred to “Control” in Fig. 7).
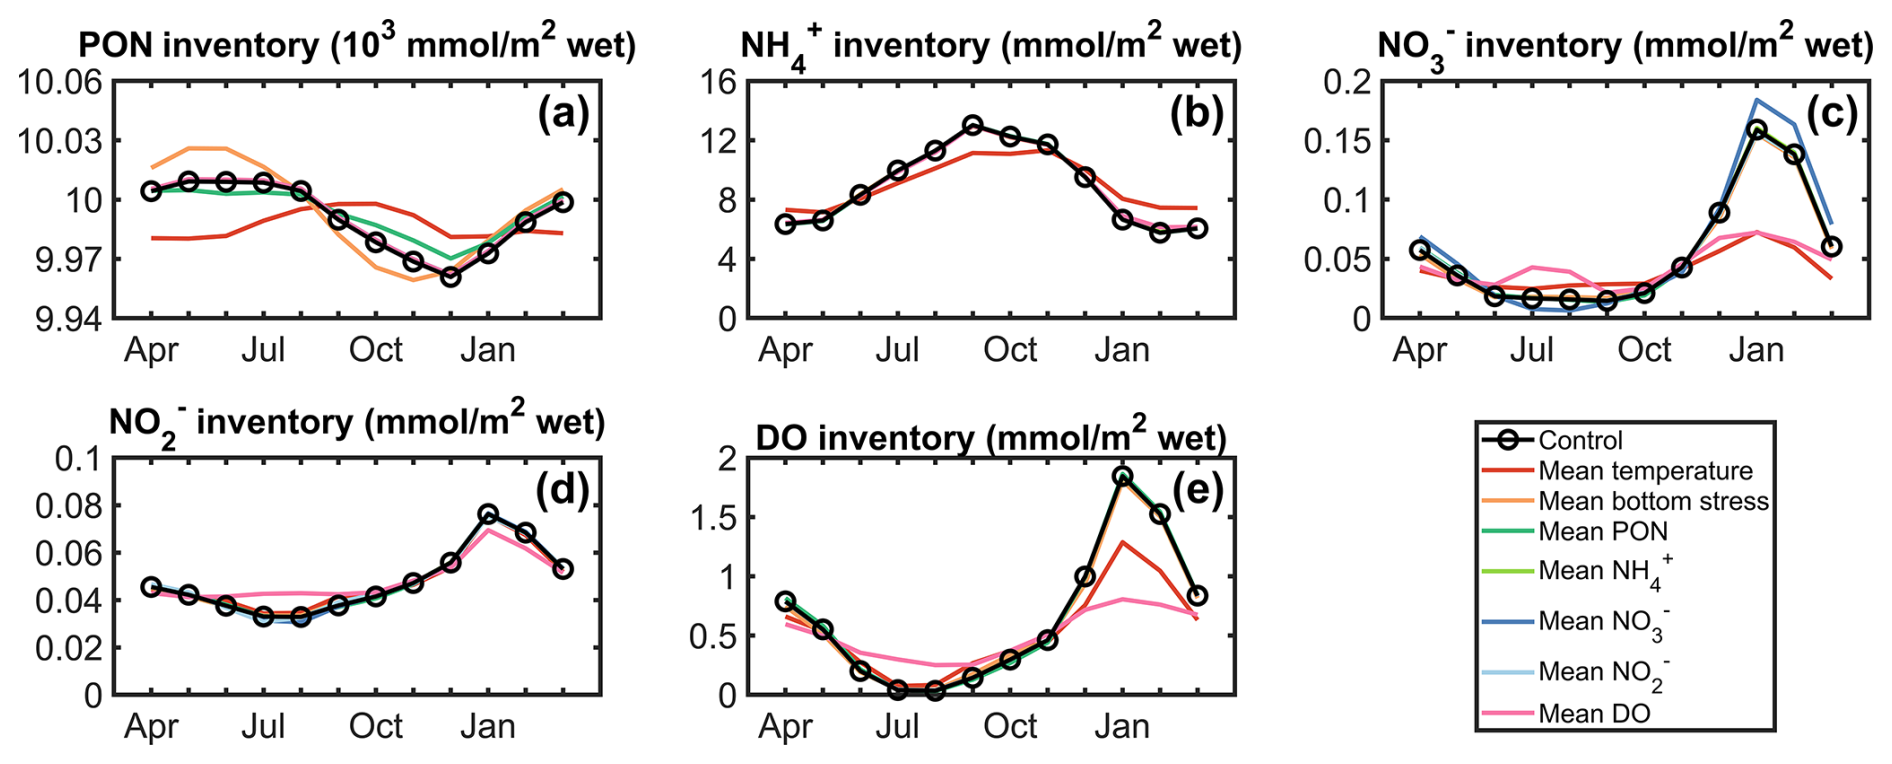
Figure 7Comparisons of the model results among eight calculations (seven sensitivity experiments and one control run). The sensitivity experiments include the cases removing the seasonal variations of PON concentration (dark green line, “Mean PON”), concentration (light green line, “Mean ”), concentration (dark blue line, “Mean ”), concentration (light blue line, “Mean ”), DO concentration (pink line, “Mean DO”) and water temperature (red line, “Mean temperature”) in the overlying water, as well as of the bottom stress (orange line, “Mean bottom stress”). (a) PON inventory; (b) inventory; (c) inventory; (d) inventory; (e) DO inventory.
The concentration of PONbw, bottom stress and the bottom water temperature significantly influence the seasonal variation of PON inventory in the sediment (Fig. 7a). Sinking of PONbw serves as the source of PON in the sediment, and its temporal variations are controlled by those in the concentration of PONbw and bottom stress (Fig. 8a). The variations in bottom water temperature can change the mineralization rate in the sediment (Fig. S6a and Sect. S4 in the Supplement). Although these seasonal variations can directly affect the PON inventory, the corresponding seasonal fluctuation in PON inventory represents only a very small fraction of the total sedimentary PON pool.
Among the seven factors examined, bottom water temperature is the dominant driver of the seasonal variability in the inventory (Fig. 7b) because it directly regulates the mineralization rate that produces in the sediment (Fig. S6 and Sect. S4 in the Supplement). Although mineralization depends on both organic matter availability and temperature, seasonal variations in PON supply induce only minor perturbations to the sedimentary PON reservoir in the model domain. Consequently, the amount of organic matter available for mineralization remains relatively stable on seasonal timescales. In contrast, seasonal changes in temperature substantially alter mineralization rates and therefore production in the whole sediment domain. Since mineralization is the primary source of in the sediment (Fig. 6), bottom water temperature ultimately exerts the strongest control on the seasonal variability of inventory.
The inventory is primarily controlled by bottom water temperature and DObw concentration, while the influence of concentration is comparatively weaker (Fig. 7c). During summer, high temperatures enhance denitrification and increase consumption (Fig. S6d in the Supplement). At the same time, reduced DO supply from the overlying water suppresses nitrification (Fig. S6b and c in the Supplement), limiting the replenishment of sedimentary . The combined effects of enhanced consumption and reduced production result in relatively low concentrations during summer. In winter, lower temperatures weaken denitrification, while higher DO availability promotes nitrification, allowing to accumulate within the sediment. Variations in concentration can further modify sedimentary levels through molecular diffusion across the sediment–water interface, although their influence is smaller than that of temperature and oxygen availability. Therefore, unlike , which is primarily regulated by mineralization, the inventory is jointly controlled by nitrification and denitrification and is consequently more sensitive to changes in sediment redox conditions. As an intermediate product of nitrification, is primarily controlled by DObw concentration (Fig. 7d).
Since sedimentary DO is supplied exclusively from the overlying water, DO concentrations within the sediment depend largely on DObw(Fig. 7e). In winter, lower temperatures reduce the consumption of DO through mineralization, allowing more DO to be preserved within the sediment. This also explains the deeper OPD developed in winter.
The different controlling factors identified for PON, , and DO inventories reflect the hierarchical structure of nitrogen cycling within the sediment. PON serves as the primary nitrogen reservoir and provides the substrate for mineralization. However, because the sedimentary PON inventory is substantially larger than the seasonal variation in PON deposition, fluctuations in external PON supply only weakly affect the amount of organic matter available for decomposition. Consequently, the seasonal variability of inventory is governed mainly by temperature-dependent mineralization rather than by changes in PON input. produced through mineralization subsequently fuels nitrification. As an intermediate product of nitrification, remains at relatively low concentrations but responds sensitively to oxygen availability because its production depends directly on nitrification activity. is further generated through nitrification and consumed through denitrification. Therefore, the inventory is controlled by the balance between nitrification and denitrification and is particularly sensitive to temperature and oxygen availability. These results indicate that the seasonal variability of sedimentary nitrogen cycling is regulated through a cascade of coupled biogeochemical processes, in which different environmental factors affect different stages of the nitrogen cycle with varying strengths. Among them, temperature exerts the strongest influence because it simultaneously affects mineralization, nitrification, denitrification and molecular diffusion, thereby propagating through the entire nitrogen cycle. In contrast, variations in external PON supply primarily influence the sedimentary organic matter pool and have limited effects on downstream nitrogen transformations because the large sedimentary PON reservoir buffers short-term fluctuations in organic matter deposition.
4.2 Factors affecting the seasonal variations in the sediment-water fluxes of nitrogen
The seasonal variation in PON flux across the sediment–water interface is primarily controlled by the PONbw concentration and bottom stress (Fig. 8a). Elevated PONbw concentrations enhance the downward settling flux of particulate organic matter into the sediment. In contrast, an inverse seasonal relationship is observed between the PON flux and bottom stress (Fig. 3h), indicating that stronger hydrodynamic forcing during winter and spring promotes sediment resuspension and reduces the net deposition of PON. These results suggest that the seasonal variability of PON flux is governed mainly by physical processes occurring at the sediment–water interface.
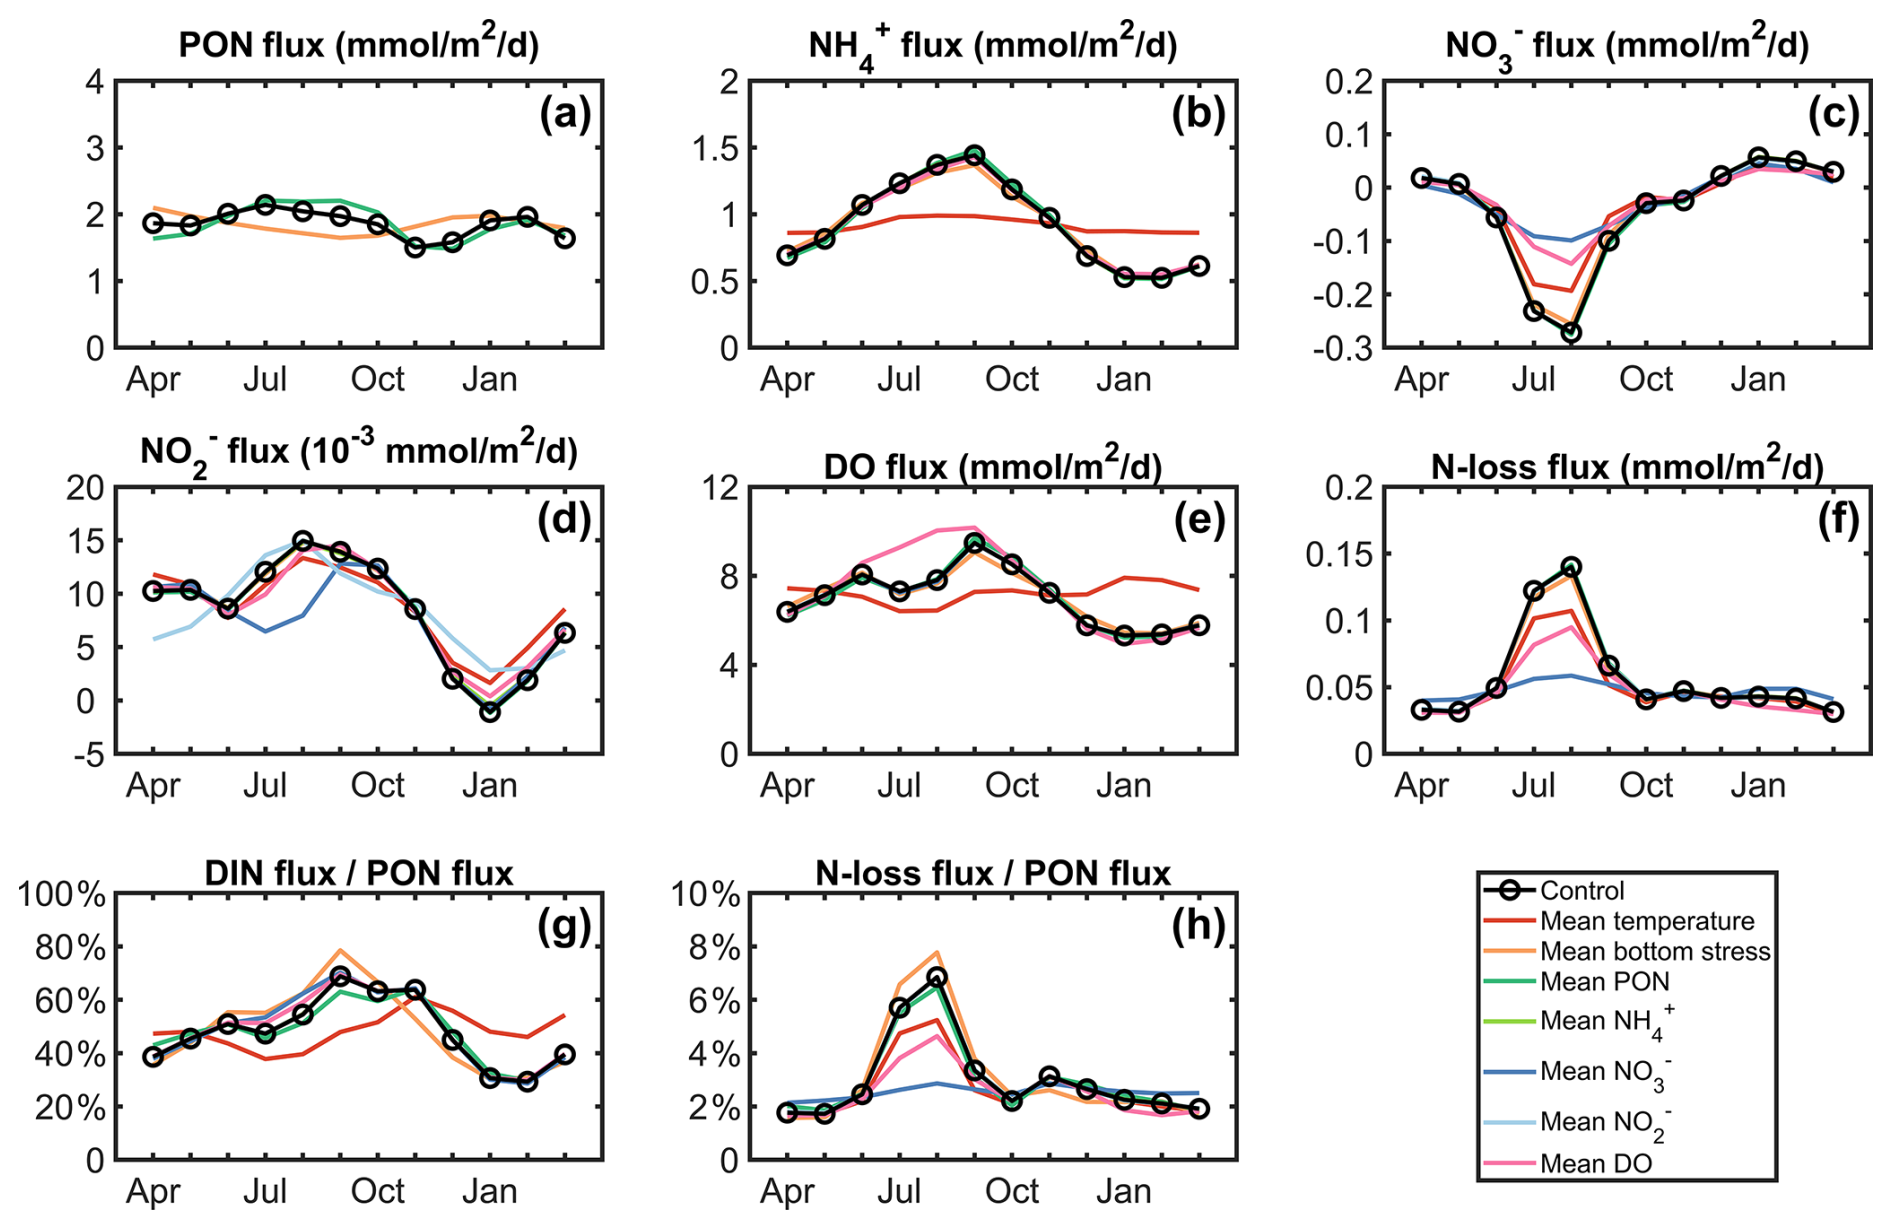
Figure 8Comparisons of the model results among eight calculations (seven sensitivity experiments and one control run). The sensitivity experiments include the cases removing the seasonal variations of PON concentration (dark green line, “Mean PON”), concentration (light green line, “Mean ”), concentration (dark blue line, “Mean ”), concentration (light blue line, “Mean ”), DO concentration (pink line, “Mean DO”) and water temperature (red line, “Mean temperature”) in the overlying water, as well as of the bottom stress (orange line, “Mean bottom stress”). (a) PON flux; (b) flux; (c) flux; (d) flux; (e) DO flux; (f) N-loss flux; (g) ratio of DIN flux to PON flux; (h) ratio of N-loss to PON flux.
In contrast to the PON flux, the seasonal variability of flux is primarily controlled by bottom water temperature (Fig. 8b). Because the concentrations within the sediment are substantially higher than those in the bottom water, seasonal changes in sedimentary inventory directly determine the magnitude of release flux (Figs. 3b and 4b). As demonstrated in Sect. 4.1, temperature strongly regulates mineralization rates and therefore controls production within the sediment. Consequently, temperature-driven changes in sedimentary inventory dominate the seasonal variability of flux.
The seasonal variability of flux is governed by a combination of bottom water temperature, DObw, and concentration (Fig. 8c). Higher temperatures during summer enhance mineralization and increase production, thereby supplying substrate for nitrification. Elevated temperatures also accelerate molecular diffusion and strengthen solute exchange across the sediment–water interface. However, oxygen depletion within the sediment during summer suppresses nitrification and maintains low sedimentary concentrations. This favors the diffusion of from the overlying water into the sediment. The relatively high concentration during summer further enhances this downward flux. Compared with and , the fluxes are much smaller but exhibit high sensitivity to bottom water temperature as well as variations in , , and DObw concentrations (Fig. 8d), reflecting the role of as a transient intermediate in coupled nitrification–denitrification processes.
The contrasting controls on PON and DIN fluxes reveal an important characteristic of sedimentary nitrogen cycling. Although PON deposition supplies organic matter to the sediment, seasonal changes in PON flux do not lead to proportional changes in DIN release. The depositional amount of PON on monthly timescales is several orders of magnitude smaller than the existing sedimentary PON inventory and therefore represents only a minor perturbation to the sediment organic matter reservoir. This large internal reservoir buffers the influence of short-term fluctuations in organic matter deposition, causing sedimentary mineralization rates to respond much more strongly to temperature rather than to seasonal variations in PON input. As a result, sediment DIN fluxes are controlled primarily by internal biogeochemical processing rather than by immediate organic matter supply. Since the flux constitutes the dominant component of DIN flux, temperature-driven mineralization ultimately becomes the principal driver of seasonal DIN release. These findings suggest that approaches estimating sediment DIN fluxes solely from PON deposition or near-bottom PON concentrations may substantially misrepresent seasonal variability if sediment biogeochemical transformations and their temperature dependence are not explicitly considered.
In addition to temperature, oxygen availability also plays a critical role in regulating nitrogen transformations within the sediment. The DO flux is also largely controlled by bottom water temperature (Fig. 8e). Temperature influences the DO flux through two pathways. First, it regulates molecular diffusion and therefore affects DO transport across the sediment–water interface. Second, it controls oxygen consumption within the sediment through oxic mineralization and nitrification, which together account for most of the sediment oxygen demand. Seasonal changes in temperature therefore simultaneously affect both DO transport and consumption. In addition, the decline in DObw concentrations associated with summer stratification in Harima Nada reduces the concentration gradient across the sediment–water interface and further limits oxygen uptake by the sediment.
N-loss from the sediment is dominated by denitrification (Fig. 6). However, low sedimentary concentrations during summer limit the availability of electron acceptors for denitrification, making external supply increasingly important. Consequently, the enhanced downward flux of from the bottom water contributes directly to the summer maximum in denitrification and N-loss flux. The seasonal variability of N-loss therefore reflects controls similar to those governing the flux, namely bottom water temperature, DObw, and concentration (Fig. 8f). The ratios RDIN/PON and RN-loss/PON provide useful indicators of nitrogen recycling and removal efficiency in semi-enclosed inland seas. The seasonal variation of RDIN/PON is mainly regulated by bottom water temperature and bottom stress (Fig. 8g), whereas RN-loss/PON is controlled primarily by bottom water temperature, DObw, and concentration (Fig. 8h).
Overall, the seasonal dynamics of nitrogen cycling at the sediment–water interface exhibit a transition from physically controlled particulate nitrogen deposition to biogeochemically controlled dissolved nitrogen recycling and nitrogen removal. These results demonstrate that the seasonal variability of sedimentary nitrogen recycling is governed primarily by internal biogeochemical processes, particularly temperature-dependent mineralization and coupled nitrification–denitrification dynamics, rather than by short-term fluctuations in organic matter deposition.
4.3 Comparisons with other coastal seas
Numerous studies have quantified nitrogen fluxes across the sediment–water interface in coastal and shelf environments, revealing substantial variability in both the magnitude and direction of individual nitrogen fluxes (Zhou et al., 2017; Sun et al., 2021; Canion et al., 2014; Lin et al., 2017; De Vittor et al., 2012; Mu et al., 2017; Rich et al., 2020; Dale et al., 2022; Bohlen et al., 2011; Ratmaya et al., 2022; Zhou et al., 2022). Despite this variability, the reported fluxes can be interpreted within a common mechanistic framework. Specifically, the flux is primarily controlled by the balance between sedimentary production and availability in bottom waters, the flux by the balance among nitrification, denitrification, and supply from the overlying water, and the N-loss flux by the availability of reactive nitrogen, particularly , to support denitrification. The fluxes simulated for Harima Nada are discussed below within this framework and compared with observations from other coastal environments (Table 3).
Table 3Benthic fluxes () reported in some regions; positive values represent the release from sediment to water.
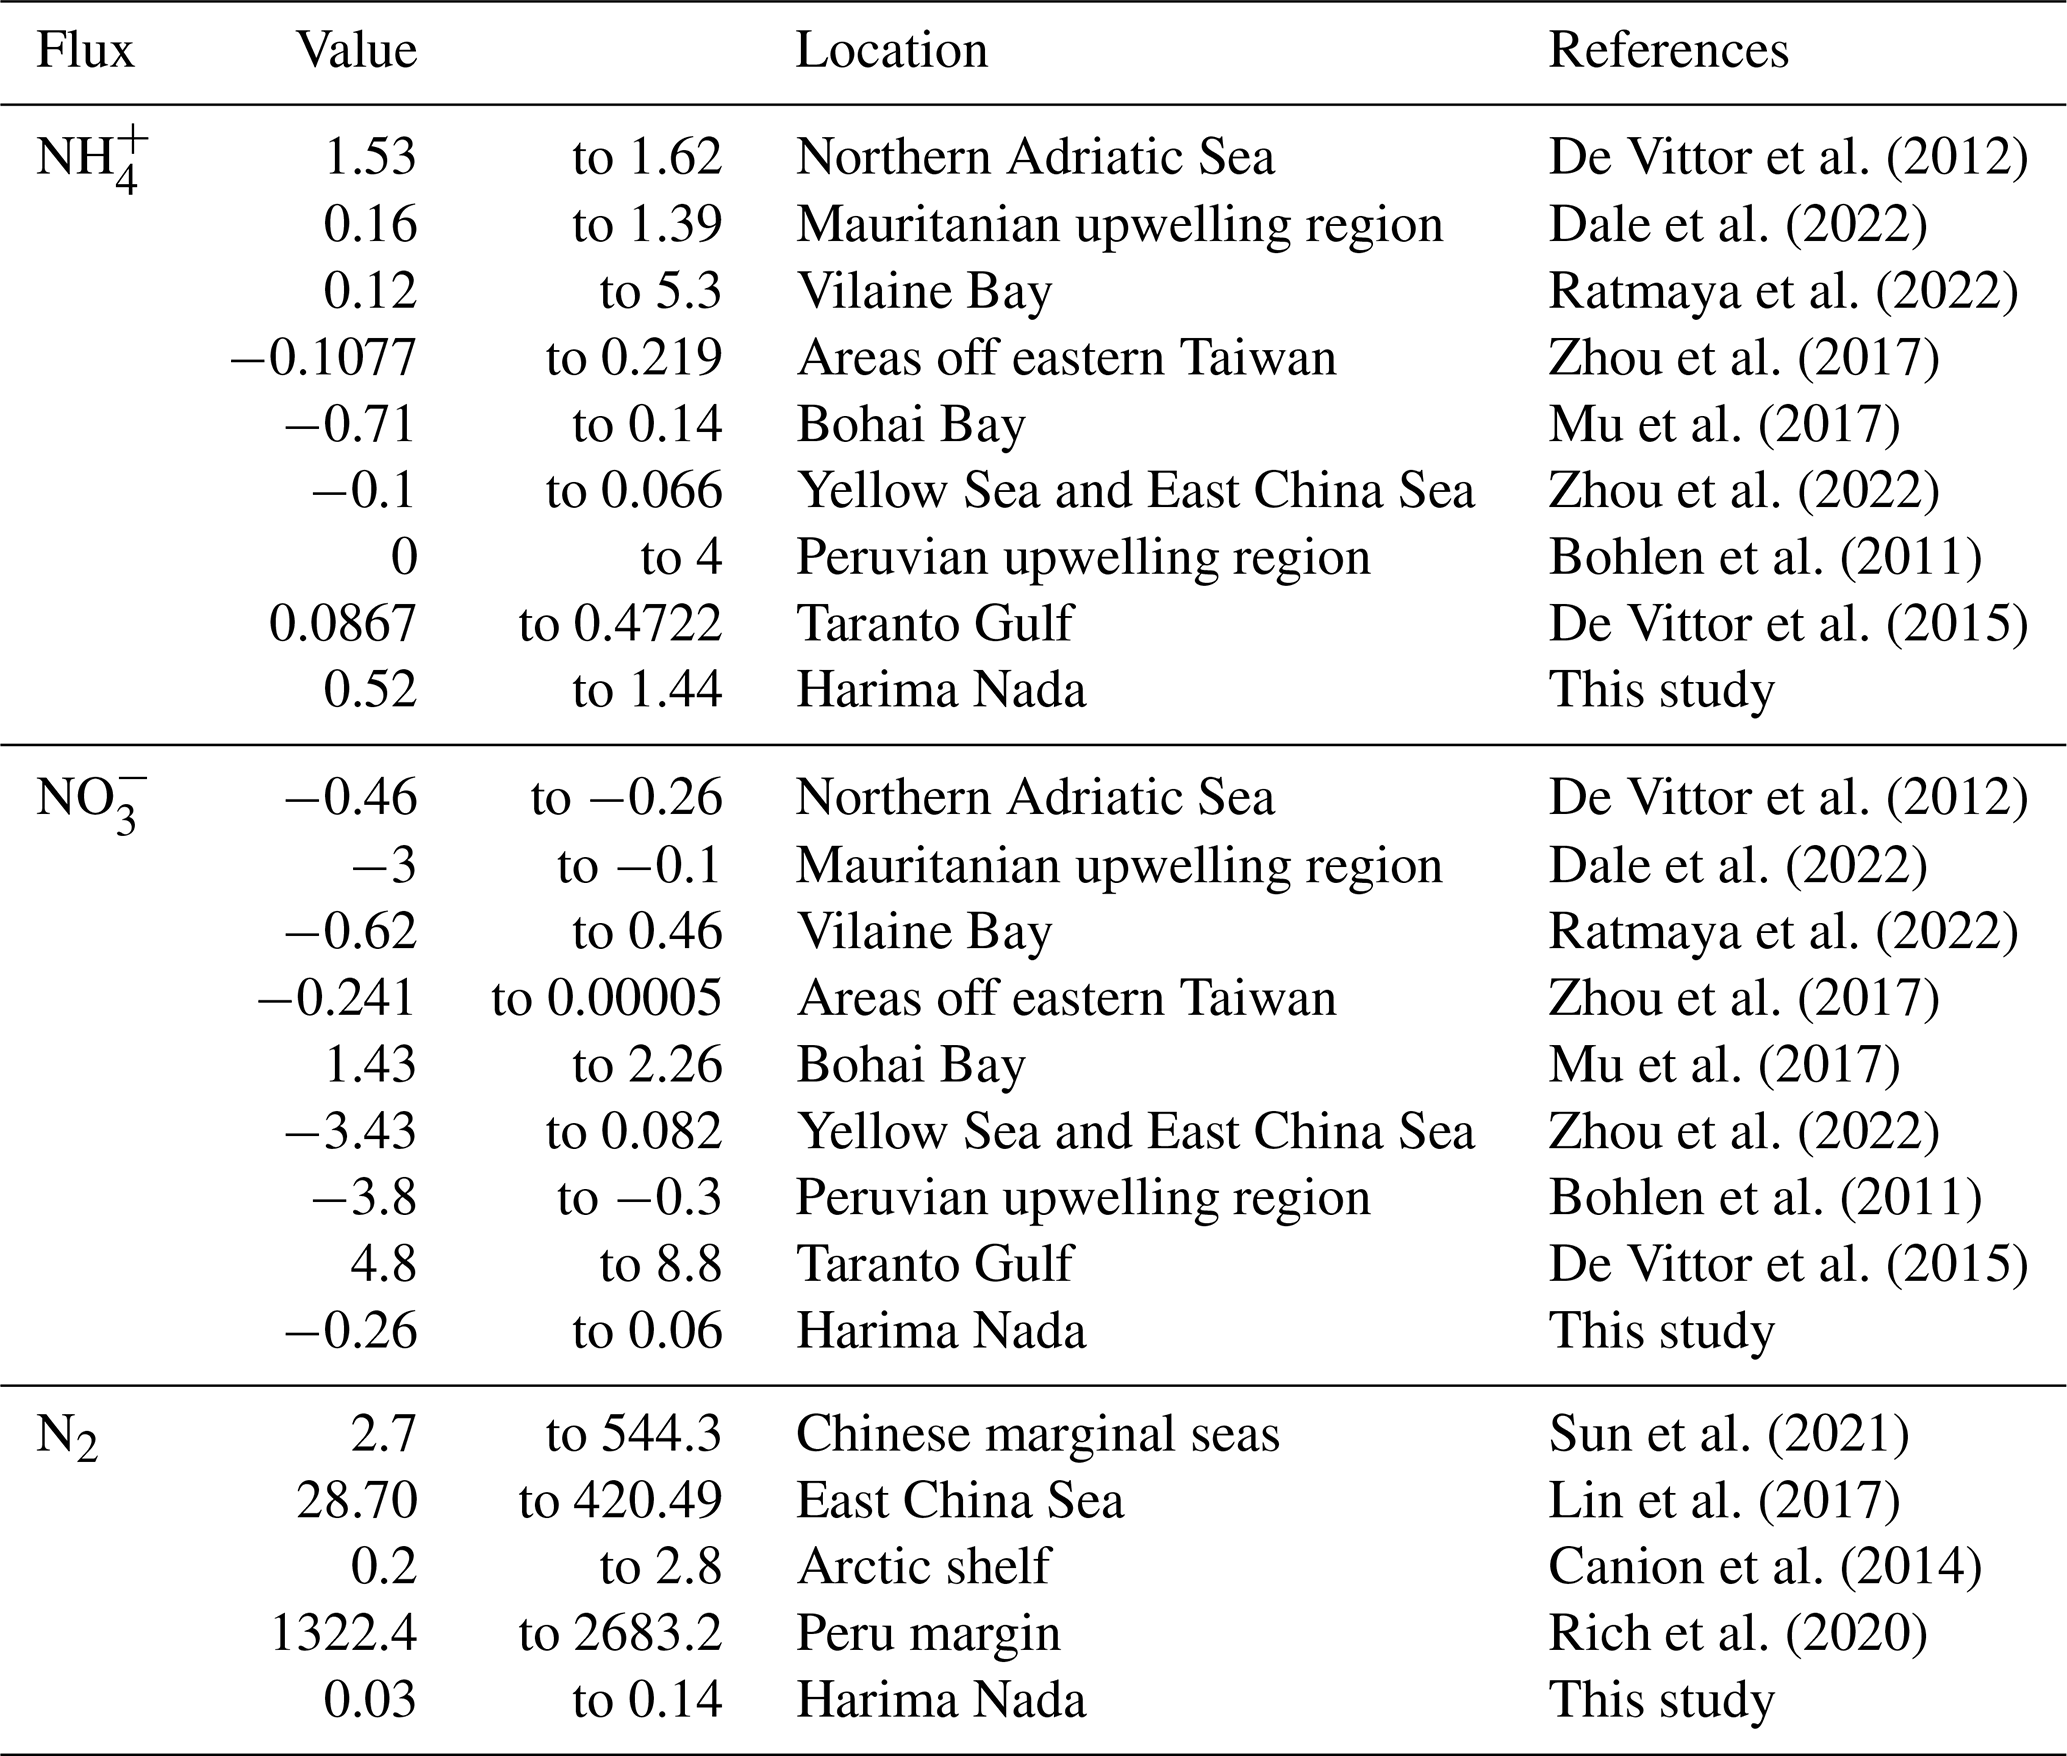
is consistently released from the sediment to the overlying water in Harima Nada. This upward flux is driven by continuous mineralization of organic matter, which maintains sedimentary concentrations substantially higher than those in bottom waters and thereby sustains an upward concentration gradient across the sediment–water interface. Similar upward fluxes have been reported in the northern Adriatic Sea, Vilaine Bay, the Mauritanian upwelling region, and the Peruvian upwelling region (De Vittor et al., 2012; Ratmaya et al., 2022; Dale et al., 2022; Bohlen et al., 2011). In contrast, downward fluxes were observed in Bohai Bay, the Yellow Sea and East China Sea, and areas off eastern Taiwan and have been associated with elevated concentrations in bottom waters or relatively weak sedimentary accumulation, which reduce or reverse the concentration gradient across the sediment–water interface (Mu et al., 2017; Zhou et al., 2017; Zhou et al., 2022). These observations suggest that the direction of flux is generally determined by the balance between sedimentary production and concentrations in the overlying water.
The flux exhibits pronounced seasonal variability in both magnitude and direction. In Harima Nada, this variability reflects shifts in the balance among nitrification, denitrification, and supply from the overlying water. During summer, strong stratification promotes hypoxia and suppresses nitrification, thereby reducing in situ production. Meanwhile, denitrification continues to consume and bottom-water concentrations reach seasonal maxima. As a result, sedimentary concentrations become lower than those in the overlying water, producing a downward flux. In winter, improved oxygen conditions enhance nitrification and reduce depletion within the sediment, leading to an upward flux. Similar seasonal reversals have been reported in Vilaine Bay, where temporal changes in oxygen conditions and nitrogen transformation processes lead to alternating periods of release and uptake (Ratmaya et al., 2022). In contrast, systems such as the Mauritanian upwelling region, the Peruvian upwelling region, and areas off eastern Taiwan exhibit persistent sedimentary uptake of because continuous consumption within sediments, together with relatively high bottom-water concentrations, maintains a persistent concentration gradient that drives diffusion from the water column into the sediment (Bohlen et al., 2011; Zhou et al., 2017; Dale et al., 2022). Conversely, predominantly upward fluxes reported in Bohai Bay and Taranto Gulf suggest that sedimentary production exceeds consumption, allowing porewater concentrations to be higher than those in bottom waters (Mu et al., 2017; De Vittor et al., 2015). These comparisons indicate that differences among coastal systems can largely be interpreted as shifts in the balance between sedimentary production, sedimentary consumption, and external supply.
The N-loss flux in Harima Nada accounts for approximately 6 % of the sinking PON flux and is substantially lower than values reported in many other coastal and shelf seas, including the East China Sea, Chinese marginal seas, and the Peru margin (Sun et al., 2021; Lin et al., 2017; Rich et al., 2020). Our simulations indicate that denitrification is the dominant pathway of nitrogen removal, consistent with numerous previous studies. Consequently, the relatively low N-loss flux in Harima Nada can be largely attributed to limited availability. Because both sedimentary and bottom-water concentrations remain comparatively low, denitrification is constrained by the supply of its principal reactant, resulting in reduced N2 production. In contrast, previous studies have reported substantially higher N-loss fluxes in the sediment environments characterized by abundant organic matter inputs and greater availability, which support more intensive denitrification activity (Lin et al., 2017; Rich et al., 2020; Sun et al., 2021). These comparisons suggest that the magnitude of N-loss reflects the combined effects of organic matter supply, oxygen availability, and availability. In Harima Nada, however, the relatively low concentrations in both sediments and bottom waters appear to be the primary factor constraining denitrification and limiting N2 production. In addition, the concentrations remain low in the sediment and are insufficient to sustain high rates of anammox. Consequently, availability primarily controls the seasonal variability of the relative contribution of anammox to total N-loss. During summer hypoxia, reduced production suppresses anammox but favours denitrification, resulting in the lowest relative contribution of anammox during this period.
Taken together, the above comparisons suggest that, despite large differences in environmental settings and flux magnitudes among coastal systems, a common set of mechanisms governs benthic nitrogen cycling. The flux is primarily controlled by the balance between organic matter mineralization and accumulation in bottom waters, whereas the flux reflects the balance among nitrification, denitrification, and external supply. In turn, the magnitude of N-loss is strongly constrained by availability because denitrification constitutes the dominant nitrogen removal pathway. These mechanisms consistently explain both the seasonal variability observed in Harima Nada and the differences reported among other coastal environments, indicating that they may represent general controls on sedimentary nitrogen cycling in coastal ecosystems.
While these results provide insights into the mechanisms controlling sedimentary nitrogen cycling in Harima Nada, several limitations should be acknowledged. First, the model is one-dimensional and therefore does not resolve spatial heterogeneity in sediment properties, organic matter deposition, and benthic biogeochemical processes across Harima Nada. Second, direct observations of individual benthic nitrogen fluxes, including , , , and N-loss fluxes, are not available for independent validation. Consequently, uncertainties remain in the quantitative estimates of individual transformation pathways despite the generally good agreement between simulations and available observations. Nevertheless, the model provides a process-based framework linking organic matter supply, oxygen availability, and bottom-water nutrient conditions to sediment nitrogen fluxes. Future studies combining direct benthic flux measurements with spatially resolved sediment biogeochemical models would help evaluate the generality of the controlling mechanisms identified here and further constrain regional nitrogen budgets.
This study quantified the seasonal variations in nitrogen fluxes across the sediment–water interface in Harima Nada using a one-dimensional sediment nitrogen cycling model and identified the key environmental factors controlling these variations. The results showed that PON deposition consistently represented the dominant pathway of nitrogen input to the sediment, greatly exceeding the contribution from downward fluxes. The seasonal variability of PON deposition was primarily controlled by bottom-water PON concentration and bottom stress.
Although PON deposition supplied the organic matter supporting nitrogen mineralization, seasonal variations in DIN fluxes were largely decoupled from seasonal variations in PON deposition. The large sedimentary PON reservoir buffered short-term fluctuations in organic matter input, which results in only minor changes in sedimentary nitrogen inventories. Instead, temperature-dependent biogeochemical processes exerted stronger control on sediment–water DIN exchange. Continuous mineralization maintained an upward flux throughout the year, and its seasonal variability was primarily regulated by bottom-water temperature through its influence on mineralization rates and sedimentary inventory. In contrast, the magnitude and direction of flux varied seasonally under the combined influence of temperature-dependent nitrogen transformation processes and bottom-water concentrations. These findings suggest that the approaches estimating sediment-water DIN exchange flux solely from PON deposition, while neglecting temperature-dependent sediment processes and bottom-water nitrogen concentrations, may substantially misrepresent the seasonal dynamics of DIN fluxes.
Denitrification was identified as the dominant pathway of nitrogen removal and was primarily responsible for the seasonal variability of N-loss. Although was continuously regenerated within the sediment through nitrification, sedimentary concentrations remained relatively low under the oligotrophic conditions of Harima Nada and were frequently supplemented by supplied from the overlying water. Consequently, denitrification was constrained by limited availability, resulting in relatively low N-loss rates. This finding highlights the importance of availability as a key regulator of nitrogen removal in nitrogen-limited coastal environments.
Collectively, the results demonstrate that seasonal benthic nitrogen fluxes cannot be inferred solely from organic matter deposition. Instead, sedimentary nitrogen cycling is governed by the interaction among organic matter supply, oxygen availability, and bottom-water nutrient concentrations. Within this framework, organic matter deposition controls nitrogen inputs to the sediment, oxygen conditions regulate internal nitrogen transformation pathways, and bottom-water nutrient concentrations influence the magnitude and direction of sediment–water nutrient fluxes. The balance among these factors ultimately determines the seasonal variability of benthic nitrogen fluxes and nitrogen removal.
Several limitations should be acknowledged. The present model is one-dimensional and therefore does not resolve spatial heterogeneity in sediment properties and benthic biogeochemical processes. In addition, direct observations of individual benthic nitrogen fluxes and nitrogen removal rates are still lacking in Harima Nada, introducing uncertainty into the quantitative estimates of specific nitrogen transformation pathways. Furthermore, the model was developed primarily for muddy sediments and does not explicitly account for porewater advection, which may become an important transport process in highly permeable sandy sediments. Application of the model to such environments would therefore require appropriate correction of porewater flow velocity and associated solute transport processes. Nevertheless, the model successfully reproduces the observed seasonal variations in sediment nitrogen concentrations and DIN fluxes, providing a process-based framework for understanding sedimentary nitrogen cycling in semi-enclosed inland seas dominated by muddy sediments.
Future integration of this modelling framework with long-term environmental observations will provide a valuable tool for assessing the impacts of eutrophication, de-eutrophication, and climate-driven warming on sediment nitrogen cycling, sediment–water nutrient exchange, and the capacity of coastal sediments to remove reactive nitrogen, thereby improving our understanding of long-term biogeochemical responses to environmental change in semi-enclosed coastal seas.
The source code of the numerical model used in this study is available on request. Please contact the corresponding author.
The supplement related to this article is available online at https://doi.org/10.5194/bg-23-6053-2026-supplement.
ZW: conceptualization, methodology, software, validation, visualization, writing (original draft preparation). XG: formal analysis, methodology, resources, supervision, writing (review and editing). JS: supervision, writing (review and editing). XD: methodology, software. MN: data curation, investigation, resources. KT: data curation, investigation, resources.
The contact author has declared that none of the authors has any competing interests.
Publisher's note: Copernicus Publications remains neutral with regard to jurisdictional claims made in the text, published maps, institutional affiliations, or any other geographical representation in this paper. The authors bear the ultimate responsibility for providing appropriate place names. Views expressed in the text are those of the authors and do not necessarily reflect the views of the publisher.
This research was performed by the Environment Research and Technology Development Fund (JPMEERF20255002) of the Environmental Restoration and Conservation Agency Provided by the Ministry of Environment of Japan. We thank Akihiko Morimoto and Naoki Yoshie who worked in the Center for Marine Environmental Studies, Ehime University, Japan and provided valuable suggestions for our research. Z. Wu thanks the China Scholarship Council (CSC) and the Ministry of Education, Culture, Sports, Science and Technology, Japan (MEXT) for a project on Joint Usage/Research Center, Leading Academia in Marine and Environmental Research (LaMer) for supporting his study in Japan.
This research was performed by the Environment Research and Technology Development Fund (grant no. JPMEERF20255002) of the Environmental Restoration and Conservation Agency Provided by the Ministry of Environment of Japan.
This paper was edited by Jack Middelburg and reviewed by Andy Dale and two anonymous referees.
Akbarzadeh, Z., Laverman, A. M., Rezanezhad, F., Raimonet, M., Viollier, E., Shafei, B., and Van Cappellen, P.: Benthic nitrite exchanges in the Seine River (France): an early diagenetic modeling analysis, Sci. Total Environ., 628–629, 580–593, https://doi.org/10.1016/j.scitotenv.2018.01.319, 2018.
Albert, S., Bonaglia, S., Stjärnkvist, N., Winder, M., Thamdrup, B., and Nascimento, F. J. A.: Influence of settling organic matter quantity and quality on benthic nitrogen cycling, Limnol. Oceanogr., 66, 1882–1895, https://doi.org/10.1002/lno.11730, 2021.
Berelson, W. M., McManus, J., Severmann, S., and Reimers, C. E.: Benthic flux of oxygen and nutrients across Oregon/California shelf sediments, Cont. Shelf Res., 55, 66–75, https://doi.org/10.1016/j.csr.2013.01.009, 2013.
Berner, R.: Early Diagenesis: A Theoretical Approach, Princeton, ISBN 0-691-08258-8, 1980.
Bohlen, L., Dale, A. W., Sommer, S., Mosch, T., Hensen, C., Noffke, A., Scholz, F., and Wallmann, K.: Benthic nitrogen cycling traversing the Peruvian oxygen minimum zone, Geochim. Cosmochim. Ac., 75, 6094–6111, https://doi.org/10.1016/j.gca.2011.08.010, 2011.
Boudreau, B. P., Mucci, A., Sundby, B., Luther, G. W., and Silverberg, N.: Comparative diagenesis at three sites on the Canadian continental margin, J. Mar. Res., 56, 1259–1284, https://doi.org/10.1357/002224098765093634, 1998.
Boynton, W. R., Ceballos, M. A. C., Bailey, E. M., Hodgkins, C. L. S., Humphrey, J. L., and Testa, J. M.: Oxygen and nutrient exchanges at the sediment-water interface: a global synthesis and critique of estuarine and coastal data, Estuar. Coast., 41, 301–333, https://doi.org/10.1007/s12237-017-0275-5, 2017.
Canion, A., Overholt, W. A., Kostka, J. E., Huettel, M., Lavik, G., and Kuypers, M. M.: Temperature response of denitrification and anaerobic ammonium oxidation rates and microbial community structure in Arctic fjord sediments, Environ. Microbiol., 16, 3331–3344, https://doi.org/10.1111/1462-2920.12593, 2014.
Capet, A., Meysman, F. J. R., Akoumianaki, I., Soetaert, K., and Grégoire, M.: Integrating sediment biogeochemistry into 3D oceanic models: a study of benthic-pelagic coupling in the Black Sea, Ocean Model., 101, 83–100, https://doi.org/10.1016/j.ocemod.2016.03.006, 2016.
Chang, P.-H., Guo, X., and Takeoka, H.: A numerical study of the seasonal circulation in the Seto Inland Sea, Japan, J. Oceanogr., 65, 721–736, https://doi.org/10.1007/s10872-009-0062-4, 2009.
Chen, S., Gao, D., Zhang, J., Zheng, Y., Li, X., Dong, H., Yin, G., Han, P., Liang, X., Liu, M., Müller, C., and Hou, L.: Gross nitrogen transformations in intertidal sediments of the Yangtze estuary: distribution patterns and environmental controls, Geoderma, 429, https://doi.org/10.1016/j.geoderma.2022.116233, 2023.
Dale, A. W., Sommer, S., Bohlen, L., Treude, T., Bertics, V. J., Bange, H. W., Pfannkuche, O., Schorp, T., Mattsdotter, M., and Wallmann, K.: Rates and regulation of nitrogen cycling in seasonally hypoxic sediments during winter (Boknis Eck, SW Baltic Sea): sensitivity to environmental variables, Estuar. Coast. Shelf Sci., 95, 14–28, https://doi.org/10.1016/j.ecss.2011.05.016, 2011.
Dale, A. W., Clemens, D., Dähnke, K., Korth, F., Wankel, S. D., Schroller-Lomnitz, U., Wallmann, K., and Sommer, S.: Nitrogen cycling in sediments on the NW African margin inferred from N and O isotopes in benthic chambers, Frontiers in Marine Science, 9, https://doi.org/10.3389/fmars.2022.902062, 2022.
De Vittor, C., Faganeli, J., Emili, A., Covelli, S., Predonzani, S., and Acquavita, A.: Benthic fluxes of oxygen, carbon and nutrients in the Marano and Grado Lagoon (northern Adriatic Sea, Italy), Estuar. Coast. Shelf S., 113, 57–70, https://doi.org/10.1016/j.ecss.2012.03.031, 2012.
De Vittor, C., Relitti, F., Kralj, M., Covelli, S., and Emili, A.: Oxygen, carbon, and nutrient exchanges at the sediment–water interface in the Mar Piccolo of Taranto (Ionian Sea, southern Italy), Environ. Sci. Pollut. R., 23, 12566–12581, https://doi.org/10.1007/s11356-015-4999-0, 2015.
Devol, A. H.: Denitrification, anammox, and N2 production in marine sediments, Annu. Rev. Mar. Sci., 7, 403–423, https://doi.org/10.1146/annurev-marine-010213-135040, 2015.
Ding, X., Guo, X., Zhang, C., Yao, X., Liu, S., Shi, J., Luo, C., Yu, X., Yu, Y., and Gao, H.: Water conservancy project on the Yellow River modifies the seasonal variation of Chlorophyll-a in the Bohai Sea, Chemosphere, 254, 126846, https://doi.org/10.1016/j.chemosphere.2020.126846, 2020.
Han, A., Kao, S. J., Lin, W., Lin, Q., Han, L., Zou, W., Tan, E., Lai, Y., Ding, G., and Lin, H.: Nutrient budget and biogeochemical dynamics in Sansha Bay, China: a coastal bay affected by intensive mariculture, J. Geophys. Res.-Biogeo., 126, https://doi.org/10.1029/2020jg006220, 2021.
Huang, F., Lin, X., Hu, W., Zeng, F., He, L., and Yin, K.: Nitrogen cycling processes in sediments of the Pearl River Estuary: spatial variations, controlling factors, and environmental implications, CATENA, 206, 105545, https://doi.org/10.1016/j.catena.2021.105545, 2021.
Huettel, M., Berg, P., and Kostka, J. E.: Benthic exchange and biogeochemical cycling in permeable sediments, Annu. Rev. Mar. Sci., 6, 23–51, https://doi.org/10.1146/annurev-marine-051413-012706, 2014.
Ichimi, K., Tada, K., and Montani, S.: The phytoplankton assemblage of the past and present in the Seto Inland Sea-the expectation from sediment core samples, Aquabiology, 27, 214–221, 2005.
Ishii, D., Yanagi, T., and Sasakura, S.: Long-term trends in the occurrence of red tides in the Seto Inland Sea, Japan, Oceanography in Japan, 23, 217–236, https://doi.org/10.5928/kaiyou.23.6_217, 2014.
Jäntti, H. and Hietanen, S.: The effects of hypoxia on sediment nitrogen cycling in the Baltic Sea, Ambio, 41, 161–169, https://doi.org/10.1007/s13280-011-0233-6, 2012.
Kalvelage, T., Lavik, G., Lam, P., Contreras, S., Arteaga, L., Löscher, C. R., Oschlies, A., Paulmier, A., Stramma, L., and Kuypers, M. M. M.: Nitrogen cycling driven by organic matter export in the South Pacific oxygen minimum zone, Nat. Geosci., 6, 228–234, https://doi.org/10.1038/ngeo1739, 2013.
Khalil, M. A. K. and Rasmussen, R. A.: The global sources of nitrous oxide, J. Geophys. Res.-Atmos., 97, 14651–14660, https://doi.org/10.1029/92jd01222, 2012.
Kuhrts, C., Seifert, T., and Fennel, W.: Modeling transport of fluff layer material in the Baltic Sea, Hydrobiologia, 554, 25–30, https://doi.org/10.1007/s10750-005-1003-x, 2006.
Laima, M., Maksymowska-Brossard, D., Sauriau, P.-G., Richard, P., Girard, M., Gouleau, D., and Joassard, L.: Fluff deposition on intertidal sediments: effects on benthic biota, ammonium fluxes and nitrification rates, Biogeochemistry, 61, 115–133, https://doi.org/10.1023/a:1020264414924, 2002.
Laurent, A., Fennel, K., Wilson, R., Lehrter, J., and Devereux, R.: Parameterization of biogeochemical sediment–water fluxes using in situ measurements and a diagenetic model, Biogeosciences, 13, 77–94, https://doi.org/10.5194/bg-13-77-2016, 2016.
Lee, J.-Y., Tett, P., Jones, K., Jones, S., Luyten, P., Smith, C., and Wild-Allen, K.: The PROWQM physical–biological model with benthic–pelagic coupling applied to the northern North Sea, J. Sea Res., 48, 287–331, https://doi.org/10.1016/S1385-1101(02)00182-X, 2002.
Leng, Q., Guo, X., Zhu, J., and Morimoto, A.: Contribution of the open ocean to the nutrient and phytoplankton inventory in a semi-enclosed coastal sea, Biogeosciences, 20, 4323–4338, https://doi.org/10.5194/bg-20-4323-2023, 2023.
Leynaert, A., Longphuirt, S. N., An, S., Lim, J.-H., Claquin, P., Grall, J., Kwon, B. O., and Koh, C. H.: Tidal variability in benthic silicic acid fluxes and microphytobenthos uptake in intertidal sediment, Estuar. Coast. Shelf S., 95, 59–66, https://doi.org/10.1016/j.ecss.2011.08.005, 2011.
Lin, X., Liu, M., Hou, L., Gao, D., Li, X., Lu, K., and Gao, J.: Nitrogen losses in sediments of the East China Sea: spatiotemporal variations, controlling factors, and environmental implications, J. Geophys. Res.-Biogeo., 122, 2699–2715, https://doi.org/10.1002/2017jg004036, 2017.
Liu, H. and Yin, B.: Annual cycle of carbon, nitrogen and phosphorus in the Bohai Sea: a model study, Cont. Shelf Res., 27, 1399–1407, https://doi.org/10.1016/j.csr.2007.01.015, 2007.
Liu, S. M., Li, L. W., Zhang, G. L., Liu, Z., Yu, Z., and Ren, J. L.: Impacts of human activities on nutrient transports in the Huanghe (Yellow River) estuary, J. Hydrol., 430–431, 103–110, https://doi.org/10.1016/j.jhydrol.2012.02.005, 2012.
Liu, X., Stock, C. A., Dunne, J. P., Lee, M., Shevliakova, E., Malyshev, S., and Milly, P. C. D.: Simulated global coastal ecosystem responses to a half-century increase in river nitrogen loads, Geophys. Res. Lett., 48, e2021GL094367, https://doi.org/10.1029/2021GL094367, 2021.
Lønborg, C. and Markager, S.: Nitrogen in the Baltic Sea: long-term trends, a budget and decadal time lags in responses to declining inputs, Estuar. Coast. Shelf S., 261, 107529, https://doi.org/10.1016/j.ecss.2021.107529, 2021.
McTigue, N. D., Gardner, W. S., Dunton, K. H., and Hardison, A. K.: Biotic and abiotic controls on co-occurring nitrogen cycling processes in shallow Arctic shelf sediments, Nat. Commun., 7, 13145, https://doi.org/10.1038/ncomms13145, 2016.
Mei Liu, S., Wei Li, L., and Zhang, Z.: Inventory of nutrients in the Bohai, Cont. Shelf Res., 31, 1790–1797, https://doi.org/10.1016/j.csr.2011.08.004, 2011.
Mu, D., Yuan, D., Feng, H., Xing, F., Teo, F. Y., and Li, S.: Nutrient fluxes across sediment-water interface in Bohai Bay Coastal Zone, China, Mar. Pollut. Bull., 114, 705–714, https://doi.org/10.1016/j.marpolbul.2016.10.056, 2017.
Nakakuni, M., Yamaguchi, H., Ichimi, K., and Tada, K.: Seasonal variation in pore water nutrients and their fluxes from the bottom sediments in Harima Nada, Seto Inland Sea, J. Oceanogr., 80, 219–232, https://doi.org/10.1007/s10872-024-00719-7, 2024.
Niemistö, J., Kononets, M., Ekeroth, N., Tallberg, P., Tengberg, A., and Hall, P. O. J.: Benthic fluxes of oxygen and inorganic nutrients in the archipelago of Gulf of Finland, Baltic Sea – effects of sediment resuspension measured in situ, J. Sea Res., 135, 95–106, https://doi.org/10.1016/j.seares.2018.02.006, 2018.
Nishijima, W., Umehara, A., Okuda, T., and Nakai, S.: Variations in macrobenthic community structures in relation to environmental variables in the Seto Inland Sea, Japan, Mar. Pollut. Bull., 92, 90–98, https://doi.org/10.1016/j.marpolbul.2014.12.051, 2015.
Pastor, L., Cathalot, C., Deflandre, B., Viollier, E., Soetaert, K., Meysman, F. J. R., Ulses, C., Metzger, E., and Rabouille, C.: Modeling biogeochemical processes in sediments from the Rhône River prodelta area (NW Mediterranean Sea), Biogeosciences, 8, 1351–1366, https://doi.org/10.5194/bg-8-1351-2011, 2011.
Quick, A. M., Reeder, W. J., Farrell, T. B., Tonina, D., Feris, K. P., and Benner, S. G.: Nitrous oxide from streams and rivers: a review of primary biogeochemical pathways and environmental variables, Earth-Sci. Rev., 191, 224–262, https://doi.org/10.1016/j.earscirev.2019.02.021, 2019.
Radtke, H., Lipka, M., Bunke, D., Morys, C., Woelfel, J., Cahill, B., Böttcher, M. E., Forster, S., Leipe, T., Rehder, G., and Neumann, T.: Ecological ReGional Ocean Model with vertically resolved sediments (ERGOM SED 1.0): coupling benthic and pelagic biogeochemistry of the south-western Baltic Sea, Geosci. Model Dev., 12, 275–320, https://doi.org/10.5194/gmd-12-275-2019, 2019.
Ratmaya, W., Laverman, A. M., Rabouille, C., Akbarzadeh, Z., Andrieux-Loyer, F., Barillé, L., Barillé, A.-L., Le Merrer, Y., and Souchu, P.: Temporal and spatial variations in benthic nitrogen cycling in a temperate macro-tidal coastal ecosystem: observation and modeling, Cont. Shelf Res., 235, https://doi.org/10.1016/j.csr.2022.104649, 2022.
Rich, J. J., Arevalo, P., Chang, B. X., Devol, A. H., and Ward, B. B.: Anaerobic ammonium oxidation (anammox) and denitrification in Peru margin sediments, J. Mar. Syst., 207, https://doi.org/10.1016/j.jmarsys.2018.09.007, 2020.
Sayama, M., Sohma, A., and Takasugi, Y.: Experimental analysis of the effect of flow velocity on oxygen dynamics near the water-sediment interface in a coastal zone, Proceedings of Coastal Engineering, 49, 996–1000, https://doi.org/10.2208/proce1989.49.996, 2002.
Soetaert, K., Herman, P. M. J., and Middelburg, J. J.: A model of early diagenetic processes from the shelf to abyssal depths, Geochim. Cosmochim. Ac., 60, 1019–1040, https://doi.org/10.1016/0016-7037(96)00013-0, 1996.
Sun, L., Wang, C., Yu, H., Liu, D., Houlton, B. Z., Wang, S., Zeng, X., Bai, E., Fang, Y., and Jia, Y.: Biotic and abiotic controls on dinitrogen production in coastal sediments, Global Biogeochem. Cy., 35, https://doi.org/10.1029/2021gb007069, 2021.
Tada, K.: Primary production, nutrients and nutrient release from bottom sediments in coastal water, Journal of Water Environment Society of Japan, 44, 137–141, 2021.
Teng, Z. and Lin, X.: Sediment nitrates reduction processes affected by non-native Sonneratia apetala plantation in South China, Sci. Total Environ., 906, 167523, https://doi.org/10.1016/j.scitotenv.2023.167523, 2024.
Thamdrup, B.: New pathways and processes in the global nitrogen cycle, Annu. Rev. Ecol. Evol. S., 43, 407–428, https://doi.org/10.1146/annurev-ecolsys-102710-145048, 2012.
Tong-u-dom, S., Morimoto, A., Leng, Q., and Guo, X.: Seasonal variation in the current field and development of bottom cold water in Harima-Nada, J. Oceanogr., 80, 1–20, https://doi.org/10.1007/s10872-023-00702-8, 2023.
Tong-U-Dom, S., Morimoto, A., Guo, X., Leng, Q., Yoshie, N., Tada, K., Ichimi, K., Yamaguchi, H., and Nakakuni, M.: Lower trophic ecosystem dynamics in the eastern part of the Seto Inland Sea and their response to changes in nutrient supply from the rivers, Prog. Oceanogr., 239, https://doi.org/10.1016/j.pocean.2025.103565, 2025.
Tsujino, M.: Biomass and production of macrobenthos in the Seto Inland Sea Japan, Nippon Suisan Gakk., 84, 211–220, https://doi.org/10.2331/suisan.17-00042, 2018.
Umehara, A., Nakai, S., Okuda, T., Ohno, M., and Nishijima, W.: Benthic quality assessment using M-AMBI in the Seto Inland Sea, Japan, Mar. Environ. Res., 148, 67–74, https://doi.org/10.1016/j.marenvres.2019.05.007, 2019.
Umlauf, L., Klingbeil, K., Radtke, H., Schwefel, R., Bruggeman, J., and Holtermann, P.: Hydrodynamic control of sediment-water fluxes: consistent parameterization and impact in coupled benthic-pelagic models, J. Geophys. Res.-Oceans, 128, https://doi.org/10.1029/2023jc019651, 2023.
Wang, J., Zhao, L., Fan, R., and Wei, H.: Scaling relationships for diffusive boundary layer thickness and diffusive flux based on in situ measurements in coastal seas, Prog. Oceanogr., 144, 1–14, https://doi.org/10.1016/j.pocean.2016.03.001, 2016.
Wang, X. H.: Tide-induced sediment resuspension and the bottom boundary layer in an idealized estuary with a muddy bed, J. Phys. Oceanogr., 32, 3113–3131, https://doi.org/10.1175/1520-0485(2002)032{<}3113:Tisrat{>}2.0.Co;2, 2002.
Wilson, S. T., Al-Haj, A. N., Bourbonnais, A., Frey, C., Fulweiler, R. W., Kessler, J. D., Marchant, H. K., Milucka, J., Ray, N. E., Suntharalingam, P., Thornton, B. F., Upstill-Goddard, R. C., Weber, T. S., Arévalo-Martínez, D. L., Bange, H. W., Benway, H. M., Bianchi, D., Borges, A. V., Chang, B. X., Crill, P. M., del Valle, D. A., Farías, L., Joye, S. B., Kock, A., Labidi, J., Manning, C. C., Pohlman, J. W., Rehder, G., Sparrow, K. J., Tortell, P. D., Treude, T., Valentine, D. L., Ward, B. B., Yang, S., and Yurganov, L. N.: Ideas and perspectives: A strategic assessment of methane and nitrous oxide measurements in the marine environment, Biogeosciences, 17, 5809–5828, https://doi.org/10.5194/bg-17-5809-2020, 2020.
Yamamoto, T., Orimoto, K., Asaoka, S., Yamamoto, H., and Onodera, S.-i.: A conflict between the legacy of eutrophication and cultural oligotrophication in Hiroshima Bay, Oceans, 2, 546–565, https://doi.org/10.3390/oceans2030031, 2021.
Yang, J.-Y. T., Hsu, T.-C., Tan, E., Lee, K., Krom, M. D., Kang, S., Dai, M., Hsiao, S. S.-Y., Yan, X., and Zou, W.: Sedimentary processes dominate nitrous oxide production and emission in the hypoxic zone off the Changjiang River estuary, Sci. Total Environ., 827, 154042, https://doi.org/10.1016/j.scitotenv.2022.154042, 2022.
Yi, Y., Gao, Y., Wu, X., Jia, W., and Liu, Q.: Modeling the effect of artificial flow and sediment flux on the environment and plankton of an estuary, Int. J. Sediment Res., 38, 335–348, https://doi.org/10.1016/j.ijsrc.2023.02.001, 2023.
Zhang, X., Zhang, Q., Yang, A., Hou, L., Zheng, Y., Zhai, W., and Gong, J.: Incorporation of microbial functional traits in biogeochemistry models provides better estimations of benthic denitrification and anammox rates in coastal oceans, J. Geophys. Res.-Biogeo., 123, 3331–3352, 2018.
Zhang, X., Ward, B. B., and Sigman, D. M.: Global nitrogen cycle: critical enzymes, organisms, and processes for nitrogen budgets and dynamics, Chem. Rev., 120, 5308–5351, https://doi.org/10.1021/acs.chemrev.9b00613, 2020.
Zhou, F., Gao, X., Zhang, Y., Yuan, H., Song, J., Liu, K., Yang, B., and Zhuang, W.: Potential mobility of inorganic nutrients and its controls at the sediment-water interface in the main path of Kuroshio Current off eastern Taiwan, Mar. Pollut. Bull., 119, 270–276, https://doi.org/10.1016/j.marpolbul.2017.04.002, 2017.
Zhou, N., Zhang, G. L., and Liu, S. M.: Nutrient exchanges at the sediment-water interface and the responses to environmental changes in the Yellow Sea and East China Sea, Mar. Pollut. Bull., 176, 113420, https://doi.org/10.1016/j.marpolbul.2022.113420, 2022.
Zhu, J., Guo, X., Shi, J., and Gao, H.: Dilution characteristics of riverine input contaminants in the Seto Inland Sea, Mar. Pollut. Bull., 141, 91–103, https://doi.org/10.1016/j.marpolbul.2019.02.029, 2019.