
the Creative Commons Attribution 4.0 License.
the Creative Commons Attribution 4.0 License.
 | 17 Sep 2026
How beech ecophysiology shapes temperate forest gross primary productivity – Part 2: Identifying critical timeframes across phenological stages
Jonathan Bitton

Bernard Heinesch
Catherine Charles
Bernard Longdoz
Seasonal processes fundamentally shape forest carbon uptake, yet their timing and sensitivity remain poorly resolved. Using a 24-year eddy-covariance record from a maturing beech forest (FR-Hes), we developed three annual ecophysiological indicators (IRise, IPeak and IDrop) of gross primary productivity (GPP) and assessed their environmental controls using phenology-aligned sliding correlations across multiple window lengths and start dates relative to the start of season (SOS). This framework allowed us to identify precise seasonal timeframes in which climate drivers exert disproportionate influence on ecosystem productivity. Early-season growth rate (IRise) emerged from the interaction between reserve availability, leaf ontogeny and early-spring (SOS+10 to SOS+31) light/temperature conditions. Peak productivity (IPeak) was strongly shaped by canopy structural development and, critically, by a 1 week precipitation window around bud-set (SOS+56 to SOS+63) in the previous year, highlighting a developmental bottleneck that governs next-year canopy potential. Mid-season decline (IDrop) was driven overwhelmingly by atmospheric demand: two short VPD-sensitive windows (SOS+92 to SOS+106, corresponding to stress buildup before drop onset, and SOS+107 to SOS+114, reflecting atmospheric stress after drop onset) determined the intensity of the summer drop, with flash-drought years exhibiting earlier and sharper declines when these windows coincide with rapid early-summer warming. Extreme summers produced a second striking pattern: when soil water remained available, peak GPP increased proportionally to temperature and radiation, suggesting active acclimation via thermotolerance, stomatal cooling and structural adjustments. Thinning effects, by contrast, were modest and transient. These findings demonstrate that beech forest productivity is governed by brief, phenologically constrained time windows that integrate physiology, developmental history and atmospheric forcing. By resolving these windows, our approach provides a mechanistic foundation for phenology-explicit carbon-cycle models and sharper predictions of forest responses under increasing climatic variability.
- Article
(3951 KB) - Full-text XML
- Companion paper
-
Supplement
(2254 KB) - BibTeX
- EndNote


Forest ecosystems are central to the regulation of the global carbon cycle, acting as dynamic interfaces between the biosphere and atmosphere (Houghton, 1996). Through their capacity for carbon assimilation and storage, forests influence climate feedbacks and provide essential ecosystem services, including biodiversity support and biogeochemical regulation (Cieslik et al., 2013; Monks et al., 2009). As living archives, trees encode past and present environmental variability in their growth rings, growth patterns and chemical composition (Anchukaitis, 2017; Binda et al., 2021; Douglass, 1925; Sheppard, 2010). However, the increasing frequency and severity of droughts and extreme weather events pose significant threats to forest resilience, particularly in European deciduous stands (Geßler et al., 2007; Latte et al., 2015; Prislan et al., 2019). Understanding forest responses to climate change requires a multidisciplinary approach that integrates plant physiology, which examines internal processes such as photosynthesis, transpiration and respiration; biogeochemistry, which tracks carbon and nutrient fluxes between soil, vegetation and the atmosphere; and phenology, which investigates the timing of biological events in relation to environmental change. Together, these disciplines provide a comprehensive view of how forests both respond to and influence environmental conditions across spatial and temporal scales (Bonan, 2015). Effectively combining biological processes, phenological data and nutrient dynamics with carbon flux measurements improves the accuracy of ecosystem-scale assessments and enhances model predictions of carbon sequestration (Campioli et al., 2013; Fang et al., 2020; Migliavacca et al., 2015).
Despite methodological advances, many studies still emphasize short-term climatic drivers of forest carbon exchanges, often overlooking internal ecosystem processes such as phenological stage, tree age or carbon reserve dynamics, which are more difficult to monitor (Delpierre et al., 2012; Moreaux et al., 2020; Shao et al., 2015; Stagakis et al., 2022). Experimental setups using juvenile trees or controlled environments offer high temporal resolution but lack ecological realism (Hesse et al., 2023; Tognetti et al., 1995), while large-scale field experiments are constrained by cost, duration and replication (Wullschleger and Hanson, 2006). Chronosequences and gradient studies approximate long-term studies by substituting time for space, but often identify phenotypic adjustments and miss site-specific responses to environmental fluctuations (Meier and Leuschner, 2008). Together, these approaches each capture only part of forest temporal dynamics and face practical or conceptual limitations for sustained monitoring. As a result, long-term, high-resolution insights from forest stands remain scarce (Kannenberg et al., 2020; Wankmüller et al., 2024; Yu et al., 2022).
To address these limitations, long-term eddy covariance datasets offer a unique opportunity to investigate forest carbon dynamics under real-world conditions (Ulrich and Grossiord, 2023; Verbeeck et al., 2008). These datasets provide continuous measurements essential for capturing both immediate and delayed ecosystem responses to environmental change (Fu et al., 2015; Schimming et al., 2010). However, interpreting such data requires analytical tools capable of disentangling seasonal phases of carbon dynamics and identifying legacy effects or structural changes due to forest management (Farley et al., 2018). Without these advanced data-processing techniques, many studies overlook the influence of past stress events, such as droughts (Yu et al., 2022). This gap in understanding delayed mechanisms limits the ability of models to represent physiological processes (Kannenberg et al., 2020).
European beech (Fagus sylvatica L.), a dominant species in Central European forests, is particularly well-suited for long-term ecophysiological studies due to its ecological importance, physiological sensitivity and documented responses to climate variability (Chiesi et al., 2016). Beech stands exhibit pronounced phenological patterns (Fig. 1), which influence carbon uptake and allocation throughout the growing season (Bednářová et al., 2014; Skvareninova et al., 2024; Stagakis et al., 2022). However, these patterns are increasingly disrupted by the rising frequency of extreme climatic events, leading to measurable declines in forest carbon assimilation (Gennaretti et al., 2020). To understand how beech responds to such pressures in terms of carbon uptake dynamics and physiological functioning, it is essential to examine not only net carbon exchange but also the seasonal structure of its productivity. Gross primary productivity (GPP), the total carbon assimilated through photosynthesis, varies markedly across the growing season and is shaped by both external climatic drivers and internal physiological processes (Delpierre et al., 2012). Phenological timing, such as the onset of leaf development or the timing of summer decline, plays a critical role in modulating GPP, yet remains underrepresented in many flux-based studies (Wu et al., 2013).
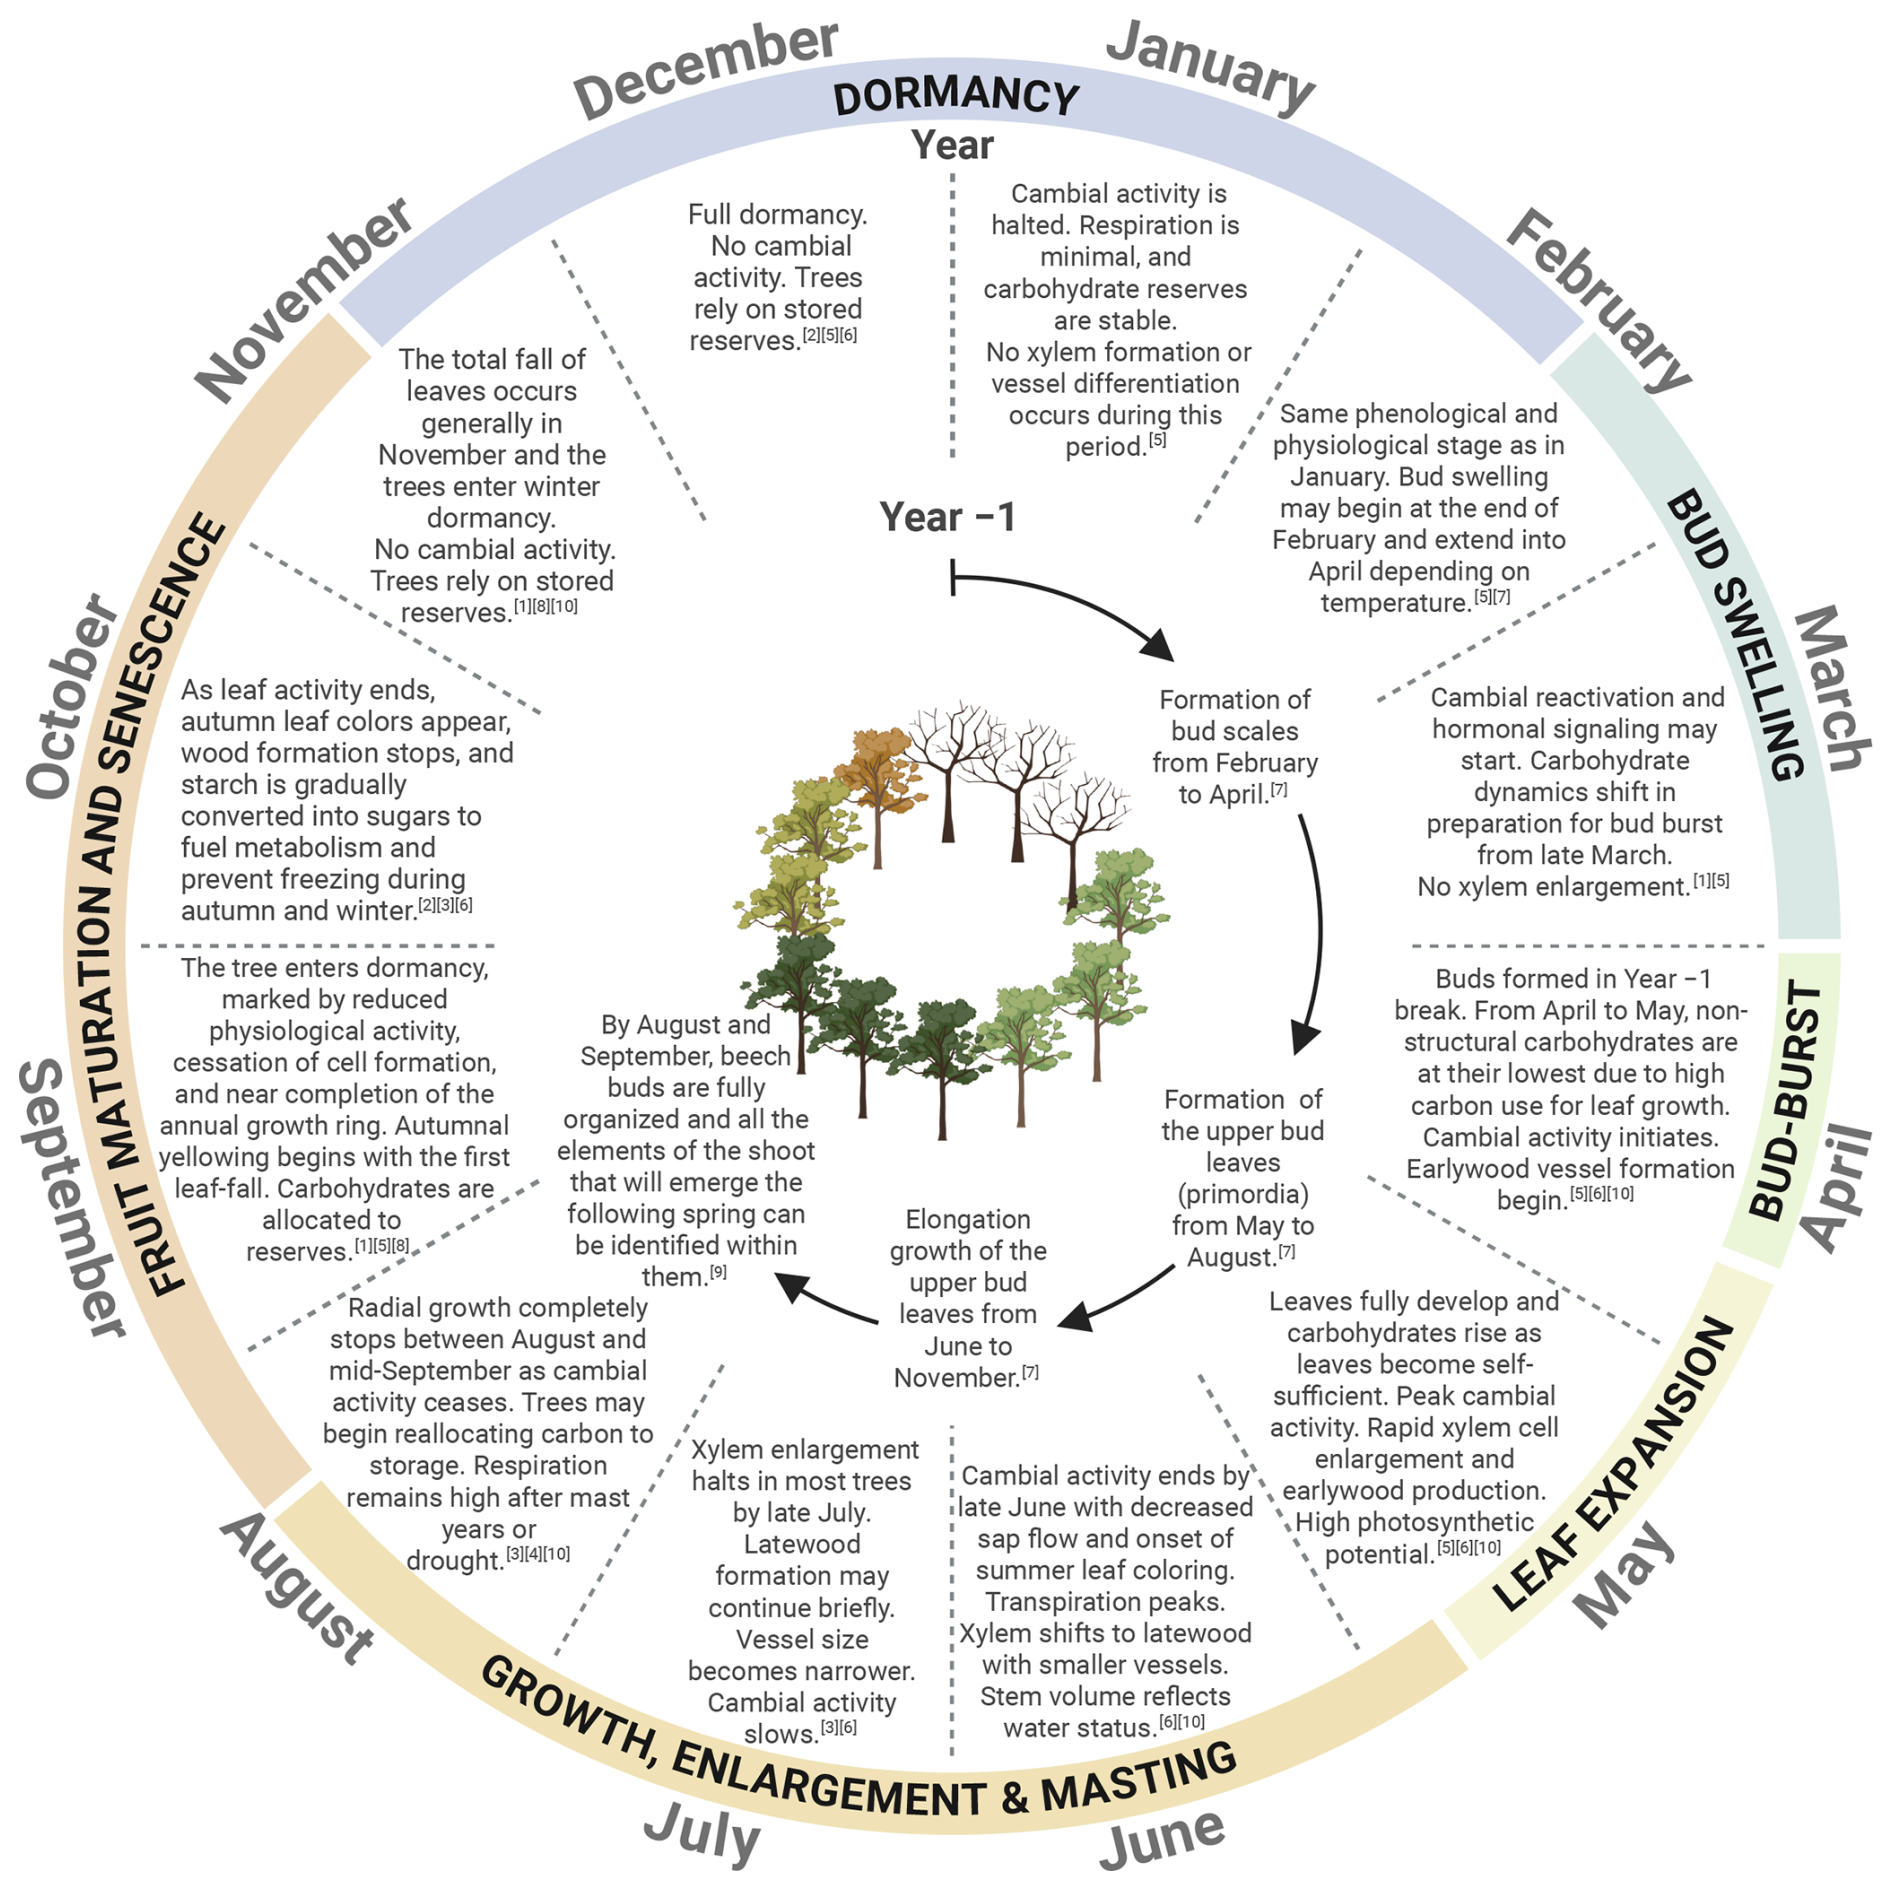
Figure 1Schematic view of phenological processes affecting beech ecophysiology. References: [1] Barbaroux and Bréda (2002); [2] Bednářová et al. (2014); [3] Čufar et al. (2008); [4] Lebourgeois et al. (2005); [5] Luo et al. (2024); [6] Noyer et al. (2023); [7] Roloff (1987); [8] Teissier du Cros (1981); [9] Thiébaut and Puech (1984); [10] Urban et al. (2014). Figure created using BioRender (2026).
To address these gaps, we investigate the seasonal dynamics of GPP in a beech-dominated temperate forest using a 24-year eddy covariance record from the Integrated Carbon Observation System (ICOS) Hesse site (FR-Hes) in northeastern France. The overall objective is to clarify how beech ecophysiological processes shape photosynthetic dynamics at the ecosystem scale, with a focus on seasonal variability in GPP. By developing three ecophysiological indicators (IRise, IPeak and IDrop), we quantify the rate of early-season GPP increase, the magnitude of peak assimilation and the intensity of mid-season decline. These indicators are used to examine how environmental drivers, forest structure and legacy effects influence carbon uptake across years. Specifically, we aim to: (1) characterize intra-annual GPP dynamics in relation to beech phenology by segmenting fluxes into key developmental stages; (2) identify the dominant environmental GPP driving variables for each stage, including relevant temporal timescales and legacy effects; (3) link each phenological phase to underlying physiological processes and evaluate their environmental sensitivity; and (4) connect leaf-level mechanisms to canopy-scale photosynthetic behavior to assess their scalability. This approach aims to bridge the gap between phenology, physiology and ecosystem-scale modeling, ultimately improving the understanding of photosynthetic processes in beech forest stands.
2.1 Study site
The Hesse Forest is a temperate broadleaf deciduous forest located in northeastern France, on a relatively flat terrain (slope < 5 %) at an elevation of 310 m above sea level. The site experiences a mean annual temperature of 10 °C and receives 880 mm of precipitation annually. As of 2005, the 40-year forest stand was composed of 90 % European beech (Fagus sylvatica L.), naturally regenerated following the clear-cutting of a mature beech forest in 1965. The main accompanying species include hornbeam (Carpinus betulus L.) and sessile oak (Quercus petraea (Matt) Liebl.) along with other Quercus species. Due to high canopy closure, understory vegetation is sparse. The stand is managed through regular thinning operations conducted every 5 to 6 years. By 2020, successive thinning had reduced the proportion of beech in the vicinity of the flux tower to 75 % of the total basal area, with oak and hornbeam each representing approximately 10 %. The soil is classified as intermediate between a luvisol and a stagnic luvisol. Clay content ranges from 25 % to 35 % within the top 100 cm of the soil profile, increasing to about 40 % below 100 cm. This deep clay layer facilitates the formation of a perched water table during wet winters. Tree roots extend to depths of up to 150 cm, with the highest root density observed in the upper 40 cm. A more detailed description of the site can be found in Granier et al. (2008) and Campioli et al. (2011).
2.2 Fluxes and environmental variables
Since 1996, an eddy covariance (EC) tower (48.6741° N, 7.0647° E) has continuously measured carbon dioxide (CO2), water vapor, air temperature and wind speed above the forest canopy. From these measurements, 30 min fluxes of sensible heat (H), latent heat (LE) and net ecosystem exchange of CO2 (NEE) were calculated using standard procedures described in Aubinet et al. (2012). NEE was further partitioned into its two components: ecosystem respiration (Reco), representing carbon emissions, and gross primary productivity (GPP), representing carbon assimilation. This partitioning was performed using the nighttime-based algorithm implemented in the standard REddyProc routine (Wutzler et al., 2018).
Twenty-four years of flux data were used for this study, spanning from January 1997 to October 2020. We combined PI-processed data from 1997 to 2014 with ICOS-processed records for 2014–2020 (Cuntz et al., 2022). During the 24-year period, a major storm in December 1999 necessitated the replacement of the original tower. As the forest canopy continued to grow, it reached approximately 5 m below the EC sensors by 2013 (Bernard Longdoz, personal communication, 2024). To maintain accurate flux measurements above the canopy, a third tower was installed and became fully operational the same year. Footprint analyses indicate that at least 80 % of the flux data collected across all towers originated from the beech-dominated proportion of the forest (Campioli et al., 2011; Göckede et al., 2008; Matthias Cuntz, personal communication, 2024). Two major data gaps occurred due to instrument failures: one from December 1999 to April 2000 and another covering the entire year of 2004.
In addition to flux measurements, the towers are equipped with sensors for continuous monitoring of meteorological variables. Four key variables were recorded at the canopy level throughout the study period: incoming solar radiation (Rg) from which the daily light exposure duration (DL) was derived, precipitation (P), air temperature (Tair) and air humidity, used to calculate vapor pressure deficit (VPD). Water availability for plant uptake was assessed using relative extractable water (REW) (Granier et al., 2008). Due to the absence of soil moisture measurements during the first ten years of the study, REW was modelled using the BILJOU water balance model, specifically parametrized for the Hesse site (Granier et al., 1999).
To characterize drought conditions at the Hesse site, we computed drought indices following the approach of Granier et al. (1999), incorporating both the intensity and duration of stress events. Three stress-specific indices were created based on physiological thresholds: REW < 0.4 for edaphic drought, VPD > 12 hPa for atmospheric drought and Tair > 25 °C for heat stress. For each stress day, the intensity was calculated as the absolute difference between the daily average observed value and its threshold, normalized by the maximum deviation observed (fixed to 0.4 for REW). Annual severity indices were obtained by summing these normalized intensities across all stress days. Equations (1)–(3) illustrate the computation for non-bissextile years y.
To provide an integrated measure for identifying years experiencing the strongest overall drought stress, the three indices were combined into a normalized drought index (nDI). Each index was standardized (mean-centered and scaled by its standard deviation) and the standardized values were summed for each year as:
where 〈〉 denotes the interannual mean and σ the standard deviation. The nDI thus reflects the severity of drought conditions across multiple stress types.
Further details on data processing choices and corrections are provided in Sect. S1 of the Supplement.
2.3 Physiological and phenological data
2.3.1 Biomass
Physiological measurements at the Hesse site have been relatively limited over the 24-year study period. Among the available data, tree circumference at breast height was manually measured twice annually, before and after the rapid growing phase, on a 0.12 ha subplot surrounding the flux tower. Previous studies have demonstrated that this subplot is representative of the broader forest stand due to its structural homogeneity (Granier et al., 2008). Due to technical issues, pre-growth season measurements were not collected in 2019 and 2020.
Circumference values (circ, cm) were converted into total tree biomass, including aboveground and belowground components (B, kg) using an on-site calibrated allometric equation based on Le Goff and Ottorini (2001) and later revised by Ottorini (2012, unpublished dataset):
The applicability of this relationship is further supported by comparison with independent allometric equations for beech (Henry et al., 2013). Details are provided in Sect. S2 and Fig. S2 in the Supplement.
Annual tree carbon storage (Sg) in gC m−2 was then calculated as the difference between successive biomass entries normalized by the subplot area and multiplied by a mean carbon concentration ratio of 0.475 (Bernard Longdoz, personal communication, 2025; Barbaroux et al., 2003; Pretzsch, 2009). Due to missing 2019 and 2020 pre-growth data, Sg for 2018–2020 were replaced by the mean annual carbon storage over this period.
To investigate intra-annual dynamics of biomass accumulation, automatic dendrometers were installed on 15 trees, recording circumference growth at 30 min intervals from 2000 to 2020. Two metrics were derived from these values:
-
Median daily growth proportion (gpct), computed by dividing daily growth by the annual growth range according to Eq. (6) and taking the median across trees. The annual growth range (AGR) was defined as the difference between median circumference values after (October–December) and before (January–March) the rapid growth phase.
-
Daily carbon allocation to biomass (Sb), calculated as the product of the above proportion and Sg, divided by daily GPP:
A daily time-step was chosen to reflect the close-coupling between growth and recent photoassimilates (Keel et al., 2007; Tang et al., 2022), and to align with common practices in carbon allocation modeling (Merganičová et al., 2019).
2.3.2 LAI and canopy conductance
Leaf area index (LAI), defined as the one-sided area of leaves per unit ground area (Meier and Leuschner, 2008), was assessed annually until 2012 using two methods: litter traps and a site-calibrated LAI-2000 Plant Canopy Analyzer (LI-COR, Inc., Lincoln, NE, USA). Both methods yielded similar dynamics (r=0.55, p=0.026), though discrepancies were observed following drought years and the 1999 storm. These differences stem from the spatial sampling: LAI2000 estimates are based on one measurement above the canopy and a broad set below, while litter traps are confined to the 0.12 ha plot. Consequently LAI-2000 was considered more representative of the forest and preferred for analysis.
To further characterize canopy function, stand-level surface canopy conductance (gc) was estimated using the simplified formulation (Bréda et al., 2006):
where R is the molar gas constant and E is the water vapor flux.
2.3.3 Phenological markers
As a deciduous species, beech exhibits strong seasonal variation in photosynthetic activity. Periods of active carbon assimilation and leaf development define the growing season (GS), which typically spans from April to October at Hesse site. The boundaries of these periods are defined by the start of season (SOS) and end of season (EOS) dates, which serve as key phenological markers.
To estimate SOS, three canopy-related variables were available:
-
Relative light transmission (RLT) through the canopy, computed following Aubinet et al. (2018), using either paired short-wave radiative sensors (above and below canopy) or a network of 15 photosynthetically active radiation (PAR) sensors at ground level paired with one above the canopy.
-
Albedo, computed as the ratio of reflected to incoming solar radiation, both measured by the above-canopy short-wave radiative sensor.
-
NDVI, derived as the difference between near-infrared and red reflectance divided by their sum, with both incoming and reflected radiation measured at the canopy top using wavelength-specific sensors.
All metrics either sharply decrease (RLT) or increase (Albedo and NDVI) at SOS. These metrics had varying degrees of data completeness: 33.3 % and 62.5 % missing data for RLT (shortwave and PAR, respectively), 16.7 % for albedo and 58.3 % for NDVI. In 8.3 % years, none of the three metrics were available. To ensure consistency, SOS dates were primarily determined using GPP, which had complete temporal coverage, and refined using additional variables when available. The following criteria were applied sequentially to identify a single date consistent with both structural and spectral canopy changes:
-
A sharp increase in GPP, identified via a peak in wavelet coefficients in the 5 to 7 d period band;
-
A sharp decrease in RLT, using an 80 % threshold, preferably computed from PAR sensors;
-
An increase of at least 20 % in albedo and NDVI, indicating canopy greening.
SOS dates computed using this approach correspond to the onset of rapid greening, when buds have broken but leaves remain unfolded. For the year 1997, the SOS date identified by our method matches the budburst timing reported by Lebaube et al. (2000), providing independent support for the correctness of our SOS detection.
EOS dates, less clearly marked in GPP, albedo and NDVI signals, were estimated based on an increase in RLT, using a 20 % threshold. No gaps were present for EOS estimation.
2.4 GPP indicators
To investigate the ecophysiological functioning of the forest, we analyzed the intra-annual dynamics of GPP, used here as an integrative measure of canopy photosynthetic activity. Because GPP exhibits pronounced seasonal cycles, we defined a set of indicators that enable consistent comparisons across years. These indicators were derived using a wavelet-based approach relying on the Wavelet Area Interpretation (WAI), described in detail in the companion paper that forms the first part of this study (Bitton et al., 2026). Briefly, WAI involves computing wavelet coefficients from the GPP time series using the continuous wavelet transform, whose general formulation is:
Equation (9) computes the area under the product curve of a signal x(t) and a scaled and translated wavelet function ψa,b(t), where a is the scale (related to period) and b is the time location. The WAI consists in interpreting the resulting wavelet coefficient W(a,b) by decomposing it into contributions from different parts of the signal.
Wavelet coefficients were computed at 30-minute intervals using the 2nd derivative of Gaussian (DOG2, also known as the “Mexican Hat”) wavelet across periods ranging from 3 to 7 months. Repeating peaks were consistently found in April, June and November, corresponding to distinct phases of the GS. These patterns informed the development of three GPP indicators:
- i.
IRise, which captures the rate of increase in GPP at the onset of the GS. It is derived from the 3-month April peak using the DOG1 wavelet. Prior to wavelet decomposition, GPP was normalized on a yearly basis by its annual maximum (evaluated using a 30 d sliding mean), ensuring comparability across years by removing amplitude differences.
- ii.
IPeak, which quantifies the magnitude of peak GPP during early summer. It is extracted using a Gaussian window aligned with the GPP maximum, corresponding to the right lobe of the 7-month April DOG1 peak.
- iii.
IDrop, which characterizes the relative intensity of the mid-season decline in GPP, typically occurring in late summer in response to increasing water and atmospheric stress. It is calculated as the ratio between the DOG2 June and November peaks at a 6-month period. IDrop captures the magnitude of the decline following peak productivity, with higher values indicating a stronger seasonal asymmetry between spring/early-summer and late-summer/autumn GPP values.
Computation steps for the three indicators are illustrated in Fig. S1 and a schematic representation in relation to the seasonal GPP trajectory is provided in Fig. 4. Although indicators retain the dimensionality of the original signal, they represent wavelet-derived metrics and should be interpreted comparatively rather than as absolute fluxes, as their values depend on wavelet properties and normalization.
To mitigate edge effects, where high-period wavelets extend beyond the signal boundaries, GPP data were periodically padded at the signal edges (1997, 2020) as well as before and after gaps (2000, 2004). Nonetheless, indicators for early 2000 and late 2020 were excluded due to partially missing data during the GS.
As a final addition to phenological markers, we used the WAI to define mid-season drop dates (MSD), which capture the timing of the summer decline in photosynthetic activity. MSD was derived from the June peak of the DOG2 wavelet by identifying its second zero-crossing, which marks the onset of the mid-season drop.
2.5 Statistical analysis
To assess the influence of environmental drivers on the three GPP indicators, we computed Pearson correlation coefficients (r) across multiple timescales and time steps. This correlation approach was chosen for its ability to visually highlight periods of influence, combining statistical significance with ecological relevance. Pearson (linear) correlations were preferred over Spearman (rank) correlations, as both yielded similar results, but Pearson's approach offers more direct interpretability and straightforward extension to partial correlation for continuous variables. In addition, Pearson correlations, by operating on raw values rather than ranks, facilitate the identification of specific years exhibiting outlying behavior, which was a key aspect of the analysis.
For each environmental variable, we computed localized yearly averages using sliding time windows of varying lengths, from one week up to the full growing season (using 1 week steps), and different starting dates (using 1 d steps) spanning the entire year. To account for interannual variability in beech phenology (Capdevielle-Vargas et al., 2015), window start dates were aligned relative to SOS for each year. This phenology-based alignment ensures that driver effects are assessed across consistent biological stages rather than fixed calendar dates.
This approach produced one average value per year for each window configuration (e.g. one VPD value for a 1 week window starting at SOS+0, another for a 1 week window starting at SOS+1, etc.). These values were then correlated with the corresponding annual indicator values over the 24-year period. The resulting matrix of correlation coefficients, with each entry corresponding to a specific window length and start date, was visualized using correlograms, which highlight how correlation strength and timing vary across the season (Fig. 2). To explore potential legacy effects, the same analysis was repeated using the previous-year environmental variables correlated with current-year indicator values.
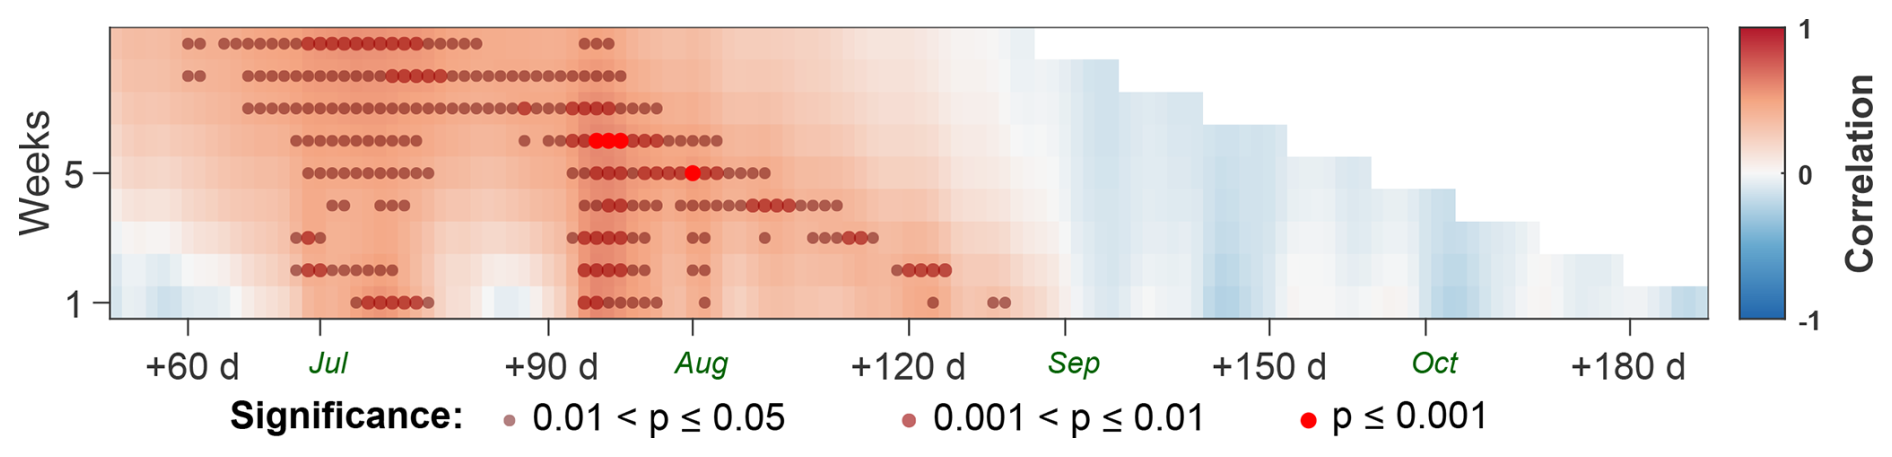
Figure 2Correlogram showing the relationship between IRise and last-year precipitation averaged over different window sizes (y-axis, in weeks) and starting dates (x-axis, in days relative to SOS). Average calendar dates (across all years) at which each month begins are indicated in green. Correlations were computed on a 1 week × 1 d grid and lightly smoothed using an anisotropic Gaussian filter (σx=0.8 d, σy=1.3 d) for clarity. Statistical significance, computed on the unsmoothed correlations, is represented by markers whose size, opacity and color saturation scale with p-value. Colors indicate correlation sign and magnitude (red = positive; blue = negative). The strongest correlation occurs for a 6 week window, which can be decomposed into two shorter windows of influence: one at 3 weeks (SOS+94 d) and one at 2 weeks (SOS+120 d).
To analyze these graphs, we used a data-driven, pattern-based approach aimed at identifying periods of consistent and ecophysiologically meaningful correlations for each indicator. The procedure combines visual pattern recognition and statistical selection and can be summarized in four steps:
-
Identification of regions of influence. Regions of consistent and significant correlations were first identified visually in the correlograms, as clusters of contiguous significant values across both dimensions (window length and starting date). These regions were interpreted as periods during which a variable showed a consistent relationship with the indicator.
-
Extraction of characteristic windows. Within each region, local maxima were identified to represent characteristic windows of influence. To avoid redundancy, maxima were required to be separated by at least one week in window length and 5 d in start date. Long-scale correlations (several weeks) were systematically decomposed into shorter-scale components by identifying local maxima within the same region (see Fig. 2).
-
Grouping of overlapping windows across variables. To identify sets of variables potentially associated with the same underlying process, characteristic windows were grouped across environmental variables when they overlapped in time. Overlapping windows were defined as windows sharing at least five common days. Long-scale windows were systematically grouped together, as they represent broad seasonal controls, while short-scale windows typically formed distinct subgroups corresponding to more localized processes.
-
Identification of dominant variables. Within each group of overlapping windows, partial correlations were used to identify the most influential variables. Following a classical regression-based variable selection procedure, a variable was considered dominant if it rendered all others non-significant when controlled for. If several variables remained significant, they were interpreted as co-dominant influences. This selection strategy prioritizes parsimony while retaining ecophysiologically meaningful variables, rather than enforcing a strict single-variable selection.
Given the large number of tested correlations and their interdependence, statistical significance was used as a screening criterion rather than a strict inferential threshold. Only correlation patterns showing temporal coherence within variables and consistency across overlapping variables were retained. All correlations were further evaluated using scatter plots to ensure that relationships were not driven by a small number of years and were supported by sufficient variability in the data. In cases where specific years disproportionately influenced the results or obscured relationships, e.g. during extreme weather or thinning events, they were temporarily excluded to assess their impact on correlations. Overall, this approach helps identify robust relationships while reducing the likelihood of spurious correlations.
To evaluate the influence of thinning events on GPP indicators, we calculated the mean residuals of linear models across all significant correlations. This helped identify whether forest behavior (according to each indicator) deviated from expected responses to environmental conditions. In cases where specific years had a disproportionate influence on indicators, they were excluded to isolate thinning-related impacts.
For clarity, only the selected variables identified through this methodology are presented in the Results section, with variations noted when specific years strongly influenced indicator values. Nonetheless, all correlograms and numerical values of the highest significant correlations are available in Figs. S4–S8 and Tables S1–S5. Results and figures were produced using Matlab R2022a (The MathWorks Inc, 2022).
3.1 Temporal dynamics
3.1.1 Fluxes and phenological/physiological variables
Over the 24-year study period, the Hesse forest consistently acted as a carbon sink, except for 1998, which showed a positive NEE (Table 1; Fig. S3). Interannual variability in GPP and Reco was substantial, with notable respiration peaks in 1998, 2014, 2018, 2019 and 2020. The peaks in 1998 and 2014 occurred late in the season (post-September, not shown), suggesting delayed carbon release dynamics.
Table 1Overview of carbon fluxes, physiological and phenological variables collected or derived from the Hesse forest site over the 24-year study period. Carbon fluxes: NEE = net ecosystem exchange, GPP = gross primary productivity, Reco = ecosystem respiration; Phenology: SOS = start of season, MSD = mid-season drop, EOS = end of season; Physiology: LAI = leaf area index, BG = annual biomass growth, BTh = biomass thinned, NbTh = number of shoots removed, RBRI = relative biomass removal index (mean biomass of removed trees divided by mean biomass of all trees on the stand); Environmental stress: nDI = normalized drought index.
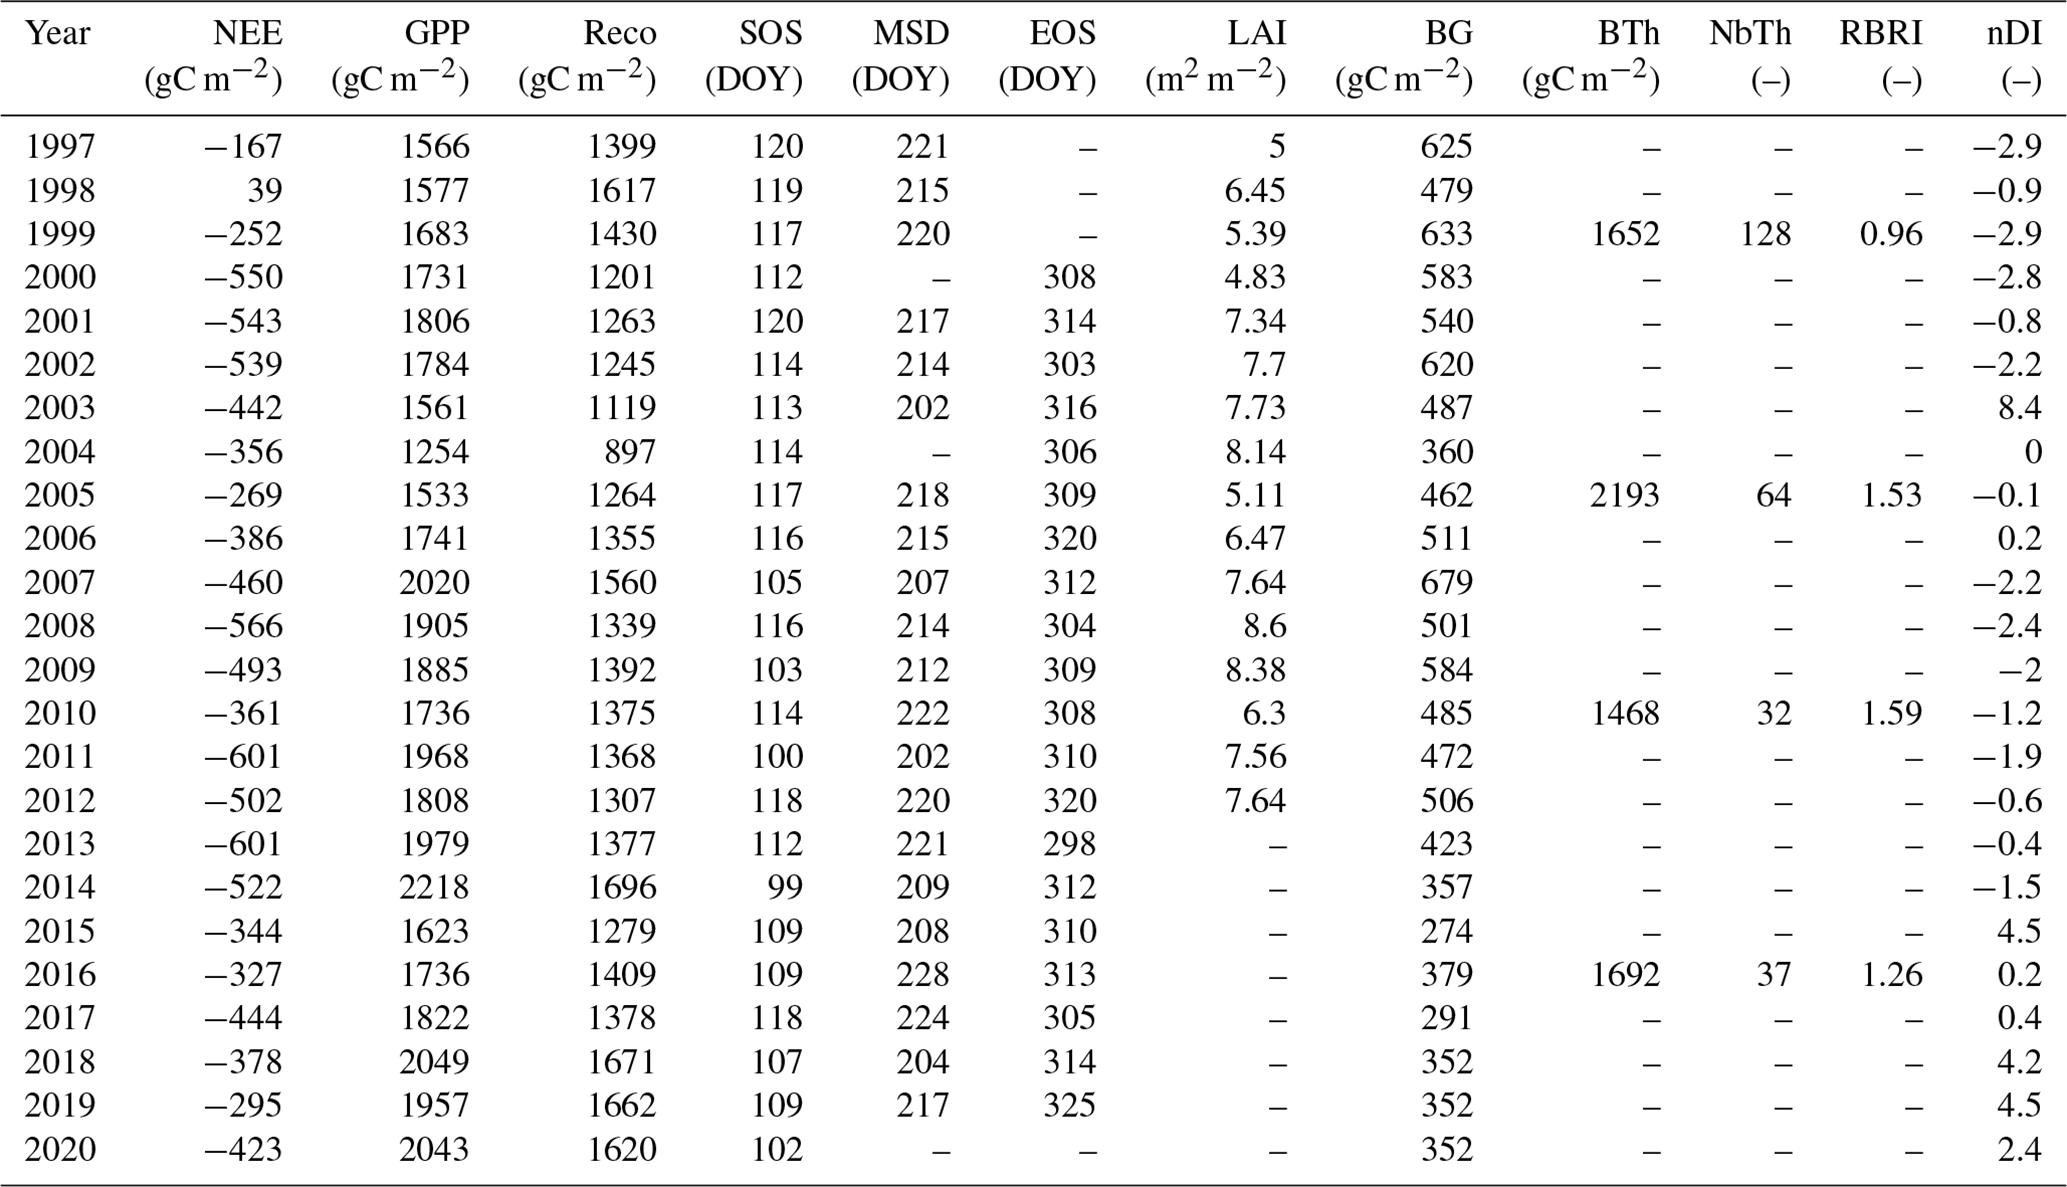
Phenological trends revealed a significant advancement in the SOS at a rate of −0.51 d yr−1 (p=0.004), while neither the EOS nor MSD exhibited significant trends. Consequently, the GS lengthened over time. The mid-season GPP drop occurred on average 103 ± 0.6 d after SOS, with 2003 standing out as an exceptionally early drop year.
LAI was strongly affected by thinning events. The most intense thinning occurred in 2005, involving the removal of a large proportion of dominant trees (biomass 53 % larger than the average tree, see Table 1) and resulting in a 37 % reduction in LAI. Thinnings in 1999, 2010 and 2016 were less intense but still led to measurable LAI reductions (16 % in 1999 and 25 % in 2010). The 1999 thinning, although targeting small-sized individuals, also resulted in a substantial biomass reduction due to the high number of individuals removed.
3.1.2 Temporal trends and relationships among GPP indicators
IRise showed a slight but significant negative trend (slope = −0.0065 yr−1, p=0.03) over the study period (Fig. 3). In contrast, IPeak exhibited a strong positive trend (slope = 108.53 gC m−2 yr−1, p < 0.001), with extreme values observed in 2013, 2014, 2018, 2019 and 2020. IDrop showed no significant long-term trend (slope = 0.088 yr−1, p = 0.4). High values were observed in 2003, 2015, 2018 and 2019, all associated with elevated drought indices (Table 1). Other years showed relatively stable IDrop values, with dampened interannual variability.
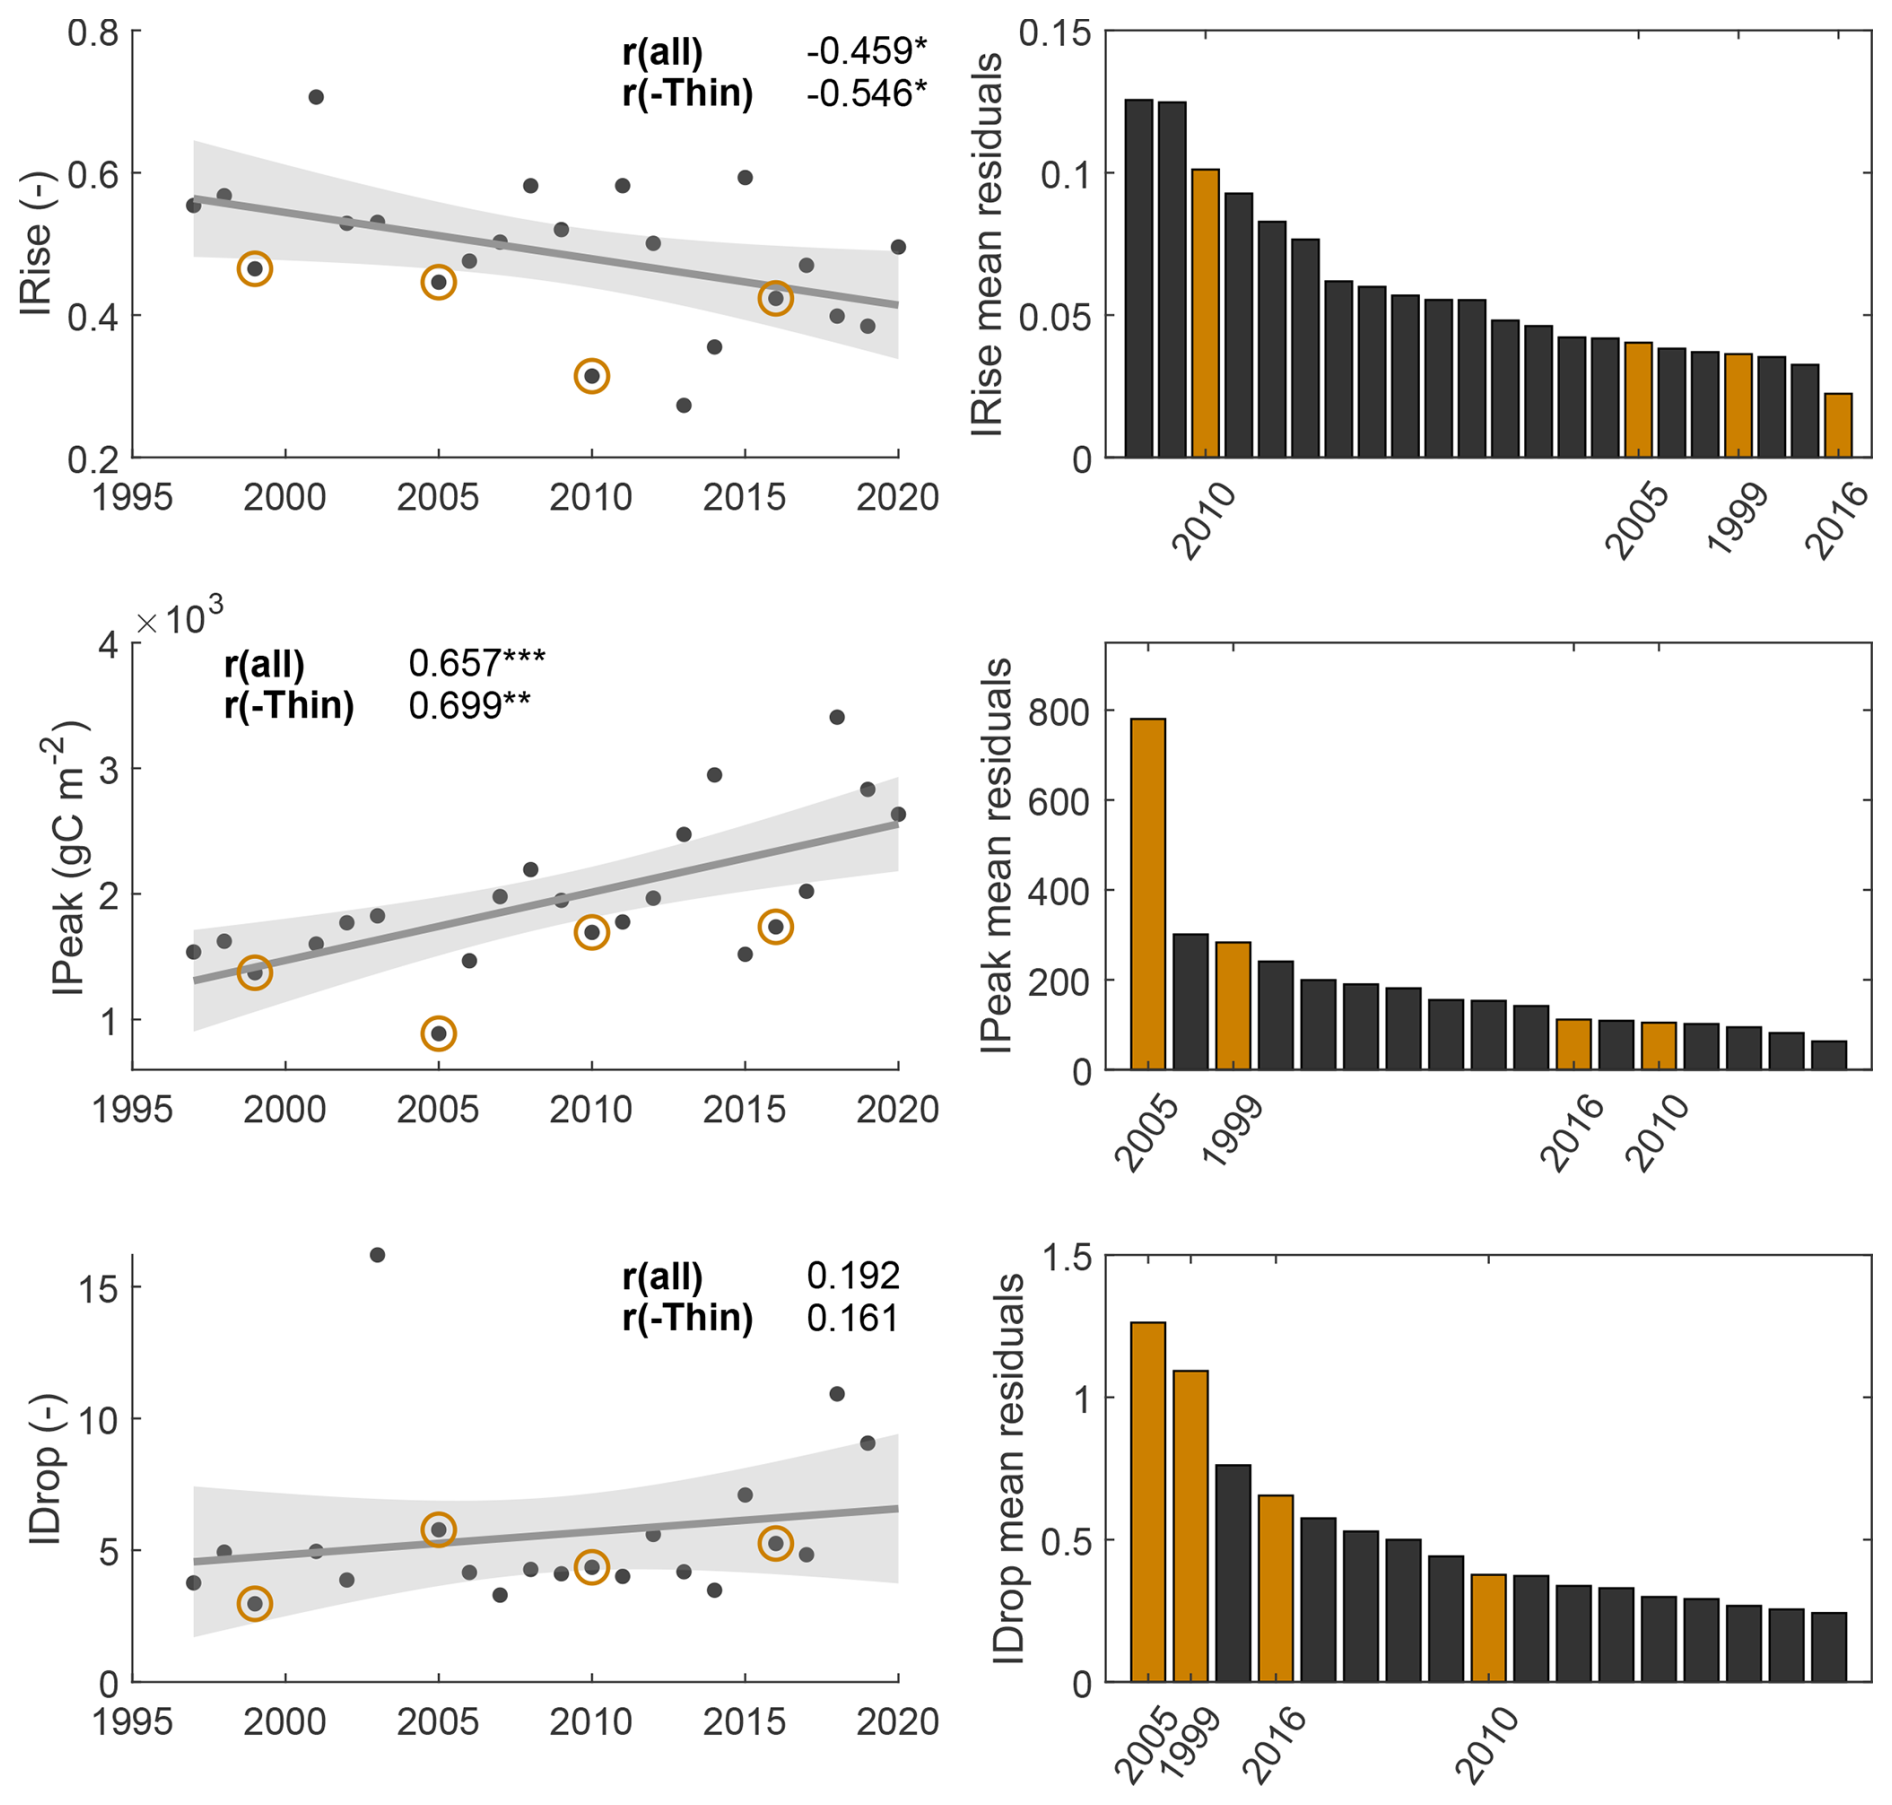
Figure 3Left panels: Temporal trajectories of the three GPP phenological indicators (IRise, IPeak, IDrop) over the 24-year observation period. Each panel shows the fitted linear regression (solid line) with its 95 % confidence interval (shaded area). Years during which thinning operations were conducted are highlighted with yellow circles. Correlation coefficients are reported both for the full time series and for the subset excluding thinning years. Statistical significance is denoted by one, two or three stars for p ≤ 0.05, 0.01 and 0.001, respectively. Indicators represent wavelet-derived metrics and should be interpreted comparatively. Right panels: Mean residuals obtained by averaging residuals across all significant indicator–environmental driver regressions. Residuals represent deviations from expected forest functional responses based on these relationships. Thinning years are shown as yellow bars. Years are ordered by decreasing mean residual importance. Extreme years for IPeak (2013, 2014, 2018, 2019, 2020) and IDrop (2003, 2015, 2018, 2020) were removed prior to computing residual means.
A negative correlation was observed between IRise and IPeak (r = −0.42, p = 0.05), which became stronger when thinning years were excluded (r = −0.7, p = 0.001). Extreme IPeak years had a significant effect on this relationship (Fig. S4). This suggests that years with rapid early-season GPP development tend to have lower peak productivity, possibly due to earlier saturation or stress onset, but may also reflect structural or phenological trade-offs (e.g. canopy development or forest maturation effects). In contrast, IDrop showed no correlation with either IRise or IPeak, indicating that mid-season declines are governed by distinct processes.
3.1.3 Thinning effects on indicators
Analysis of mean residuals from significant indicator-driver relationships (Fig. 3) revealed thinning effects on IPeak (after exclusion of extreme-summer years) and IDrop (after exclusion of drought years). Although thinning years generally exhibited reduced IRise, these reductions did not scale with thinning intensity (Table 1). This mismatch is particularly evident in 2010, a low-intensity thinning year that nevertheless showed the strongest decline in IRise.
Thinning effects were most apparent for IPeak, particularly in 2005, where the intense thinning led to a marked reduction in IPeak relative to other years. The substantial biomass removal that year produced an IPeak value lower than expected from environmental drivers alone, indicating a direct impact on canopy productive capacity. In 1999, although the total biomass removed was smaller, the thinning affected a similar proportion of the stand (about 23 % in 1999 compared to 26 % in 2005). However, its impact on IPeak was more limited, with residuals remaining within the expected range, likely reflecting the lower dominance of the extracted trees (biomass 4 % lower than the stand average, see Table 1). Thinnings in 2010 and 2016 produced minimal effects, consistent with the small number of trees removed (32 and 37, respectively) and their modest contribution to total biomass (about 17 % each), despite the presence of some dominant individuals.
Thinning impacts on IDrop were variable and did not show a consistent relationship with thinning intensity. In 1999, the decline in GPP was smaller than expected. Conversely, 2005 exhibited a larger-than-expected decline. This contrast likely reflects a methodological artefact arising when excluding drought years: in doing so, the strongest (2005) and weakest (1999) GPP declines were removed from the dataset, meaning the observed patterns may partly reflect dataset composition rather than thinning effects alone.
3.2 Environmental drivers of IRise
Correlations between IRise and environmental variables revealed two distinct regions of influence (Fig. 4): one associated with the current GS and another with the previous year's GS.
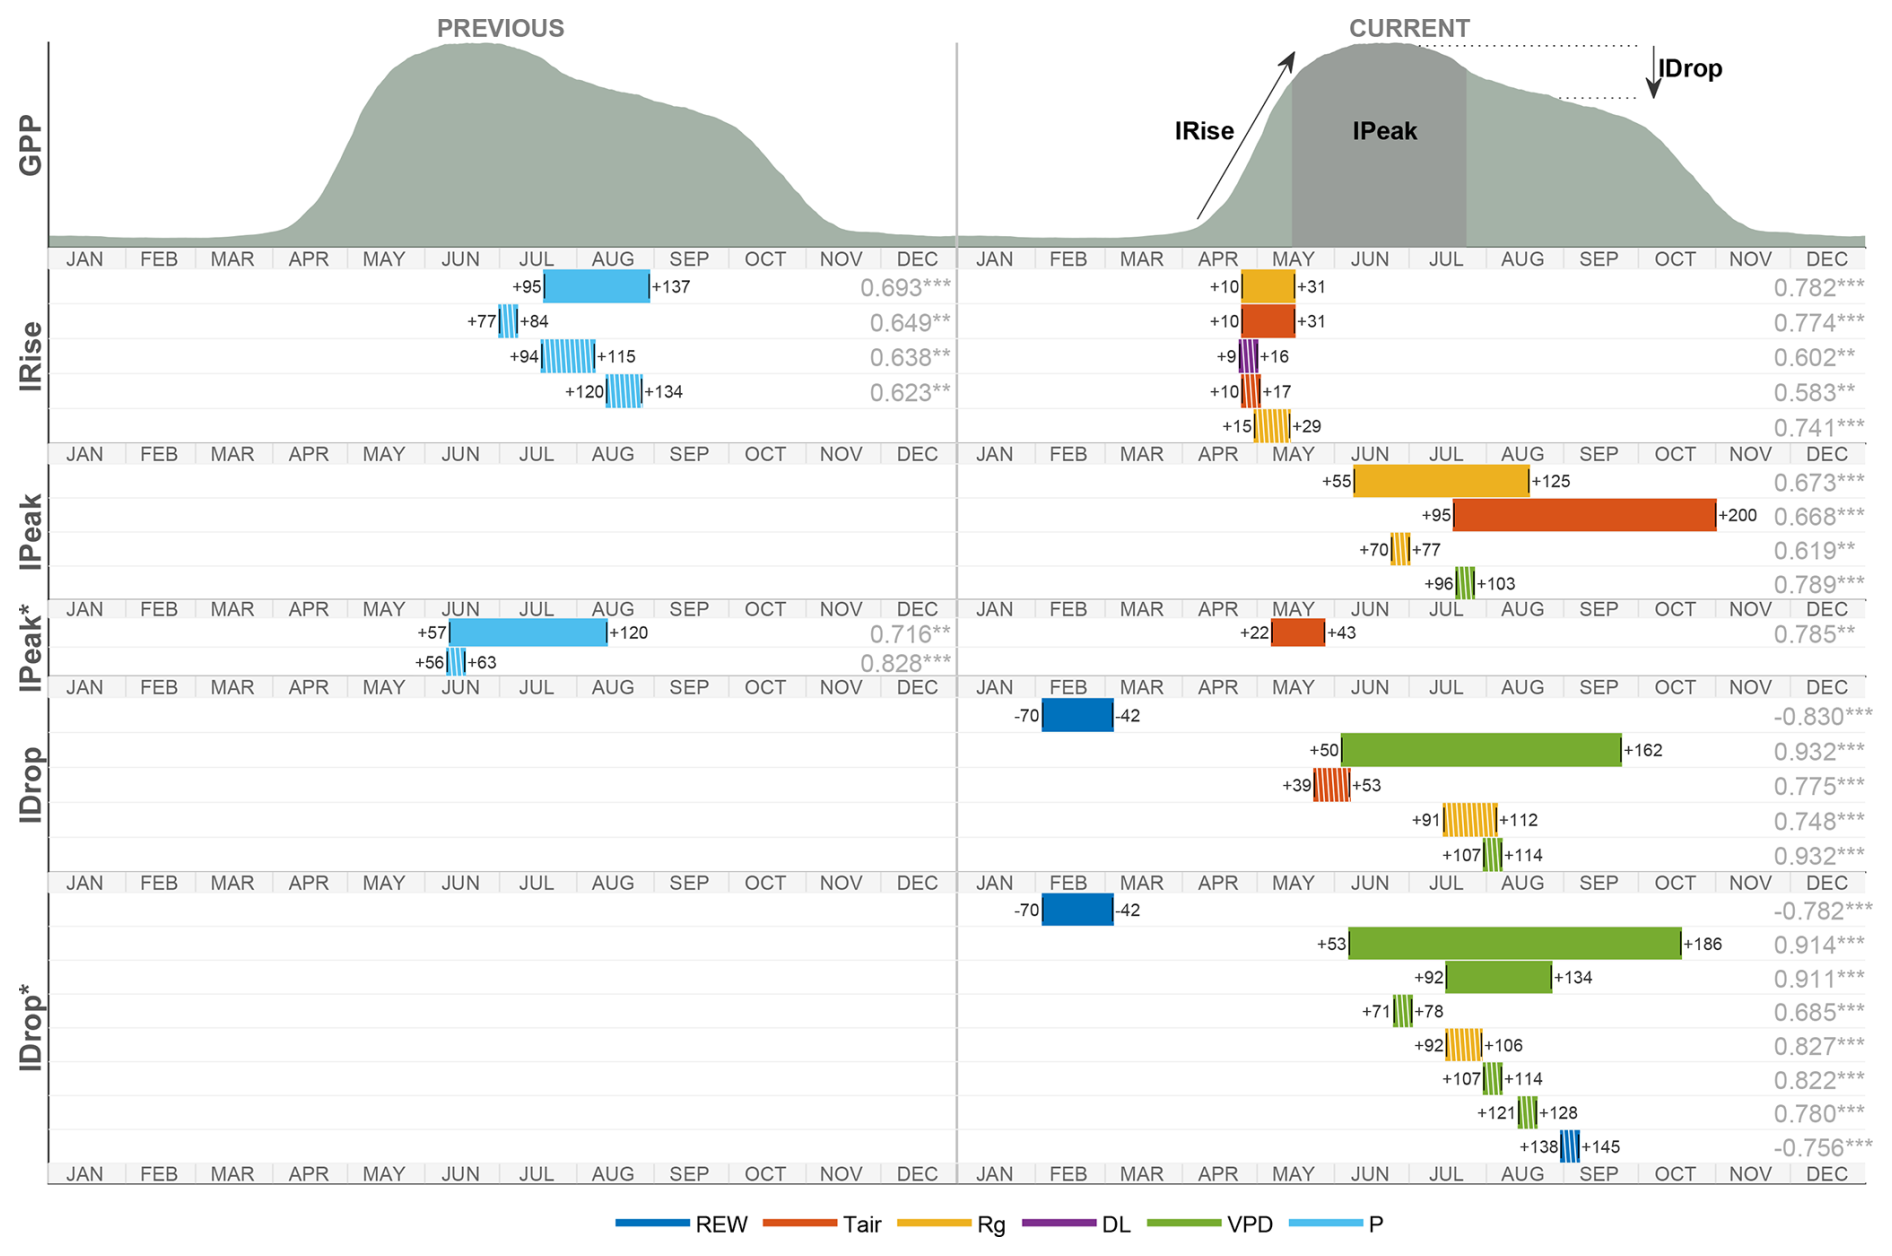
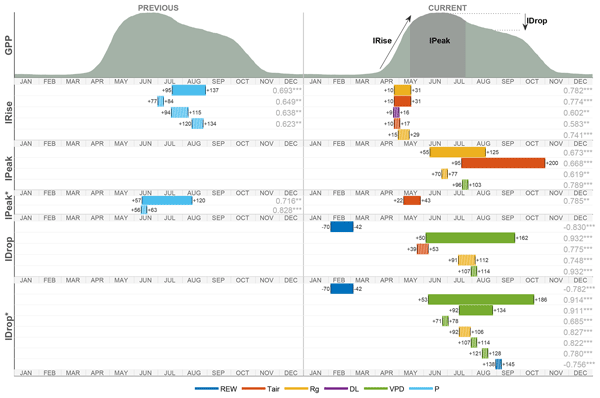
Figure 4Influence of environmental drivers on GPP seasonal dynamics. The upper panel shows modelled GPP (following Bitton et al., 2026) for the previous and current year, together with a schematic representation of the three seasonal indicators. The lower panels depict, for each indicator and its modified variants (IPeak* excluding thinning and extreme-summer years; IDrop* excluding the exceptional 2003 drought year), the time windows during which each environmental driver is most strongly correlated with the indicator. Windows are presented in chronological order, with long-scale effects (filled bars) displayed above short-scale effects (hatched bars). Window boundaries are expressed in days relative to SOS. Colors represent the different drivers and correlation coefficients with their significance levels (stars indicating p ≤ 0.05, p ≤ 0.01 and p ≤ 0.001) are shown next to each bar. Previous-year effects appear to the left of the vertical divider and current-year effects to the right.
3.2.1 Current-year influences
The first region covers the early GS, particularly from SOS+9 to SOS+31, a period corresponding to rapid LAI development in beech. During this phase, IRise was positively correlated with Rg, Tair and VPD, and negatively correlated with REW and P (Fig. S5; Table S1). Partial correlation analysis identified Rg and Tair as co-dominant drivers of early-season GPP increase, with the apparent effects of P and VPD largely mediated by their co-variation with these two variables. In contrast, the negative correlation with REW (Table S1) likely reflects a mechanistic link: faster GPP development implies accelerated vegetative growth and increased root water uptake. DL showed limited influence compared to Rg, suggesting that light intensity is more influential than photoperiod during this 4 week phase.
Two short-term windows were identified within this period: a 1 week interval (SOS+9 to SOS+17) during which IRise correlated with Tair,10–17 and DL9–16 and a subsequent 2 week interval (SOS+15 to SOS+30) in which Rg,15–29 exerted the strongest influence on IRise. During this latter window, short-term correlations with meteorological variables reached their highest values.
3.2.2 Previous-year influences
The second region of influence was in the middle of the previous GS. During this period, environmental drivers displayed correlation patterns opposite to those observed for the current-year GS (Fig. S6; Table S2). Among them, P95–137 emerged as the dominant driver, with the influence of other variables becoming non-significant after partial correlation adjustment. Based on the direction of these correlations, P appears to act as an integrator of concurrent climatic conditions: increased cloud cover reduces Rg and Tair, while water inputs raise REW and lower VPD.
This precipitation window coincides with the end of annual biomass accumulation, occurring after approximately 90 % of the median yearly growth in beech (Fig. 5a). It marks a breakpoint in biomass storage, where the slope of accumulation decreases sharply (from 0.91 % d−1 between SOS+57 and SOS+95 to 0.28 % d−1between SOS+95 and SOS+120). Remaining annual storage was significantly influenced by P95–137 (r = 0.62, p = 0.003), reaching up to 27 % in wetter years. Over the same period, P95–137 was negatively correlated with IDrop (r = −0.51, p = 0.019), indicating that wetter conditions buffer mid-season GPP declines. Together, these observations link P95–137 to enhanced biomass storage and reduced stress sensitivity. However, the proportion of GPP allocated to biomass during this window was low (Fig. 5b), implying that other physiological processes, potentially related to carbon allocation or reserve formation, may also respond to precipitation and contribute to higher IRise in the following year.
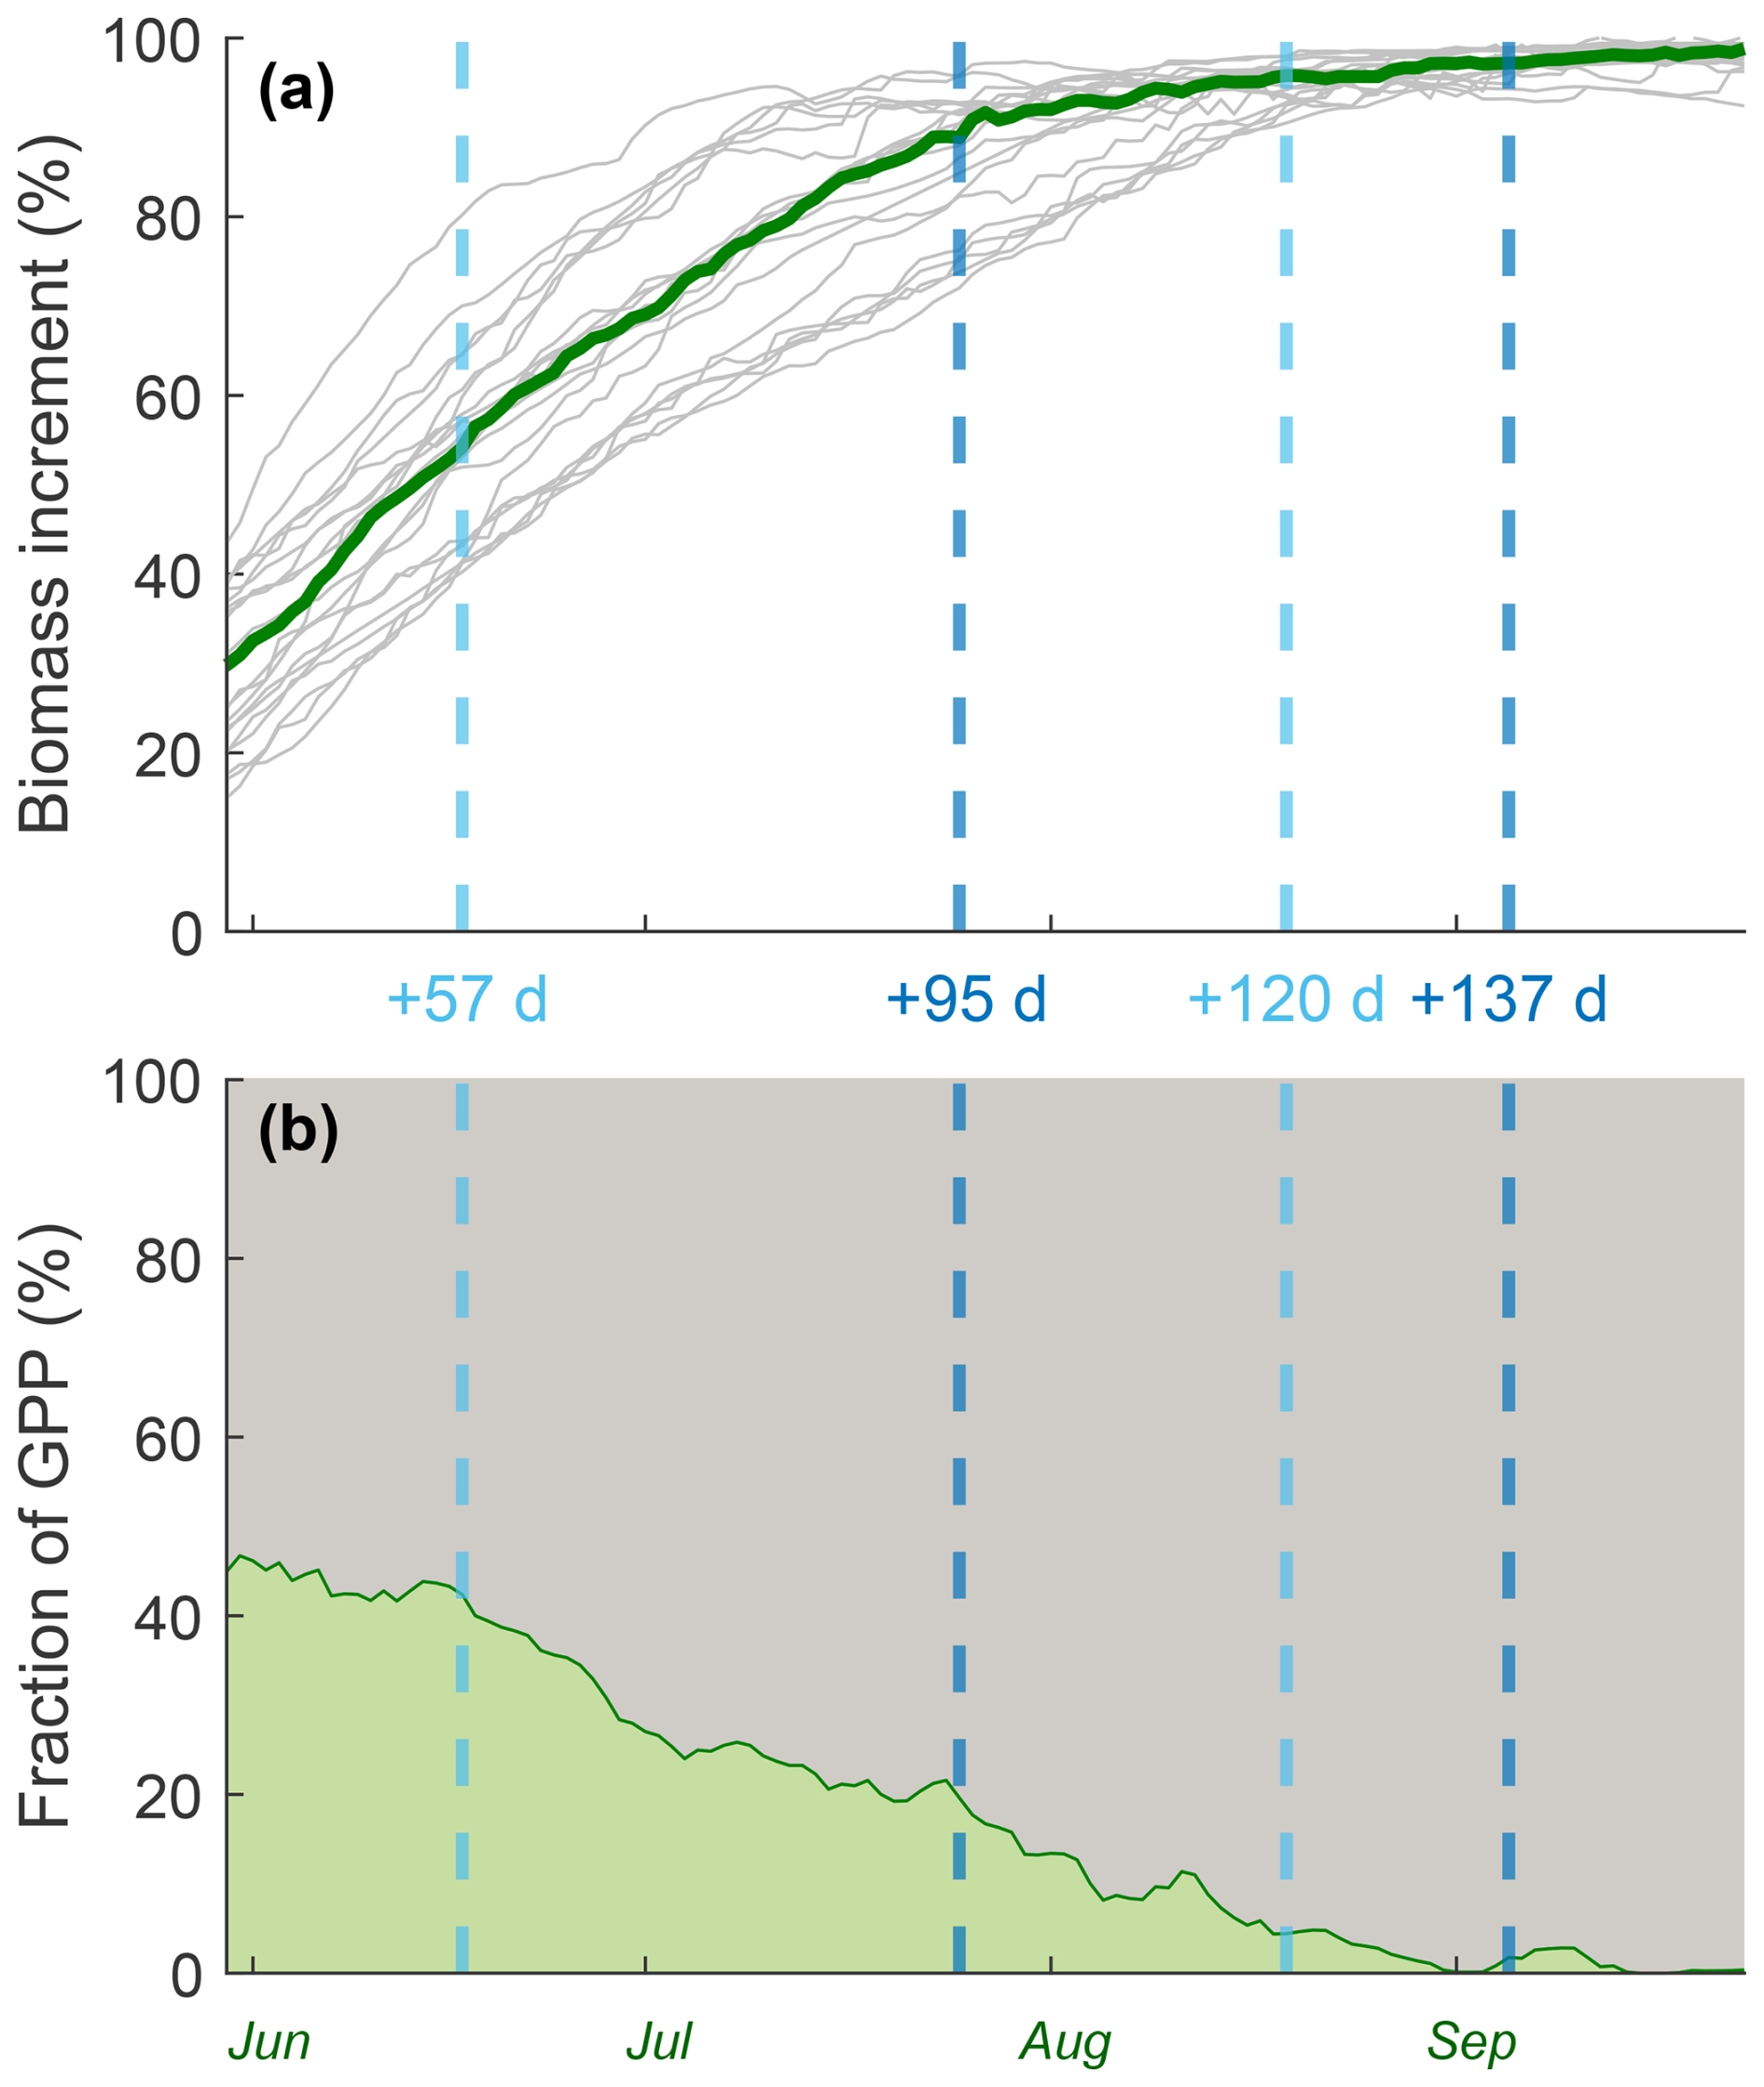
Figure 5Effect of precipitation on tree physiological responses. Vertical dashed lines indicate the long-term correlation windows for P with IPeak (SOS+57 to SOS+120, light blue) and IRise (SOS+95 to SOS+137, dark blue). Average calendar dates marking the start of each month (computed across all years) are shown in green. (a) Temporal evolution of median daily biomass accumulation expressed as a proportion of total annual storage. Individual yearly trajectories are shown in grey and the multi-year median is shown in green. (b) Daily fraction of GPP allocated to biomass storage (light green) versus other metabolic or structural processes (dark gray).
In addition to this long-term influence, three short-term precipitation windows were identified between SOS+77 and SOS+134, each corresponding to key phenological transitions. The first (P77–84) occurs directly after the summer solstice when radiation is maximal; the second (P94–115) centers on the mid-season GPP drop and coincides with peak temperatures; the third (P120–134) follows the drop and may reflect recovery dynamics. These windows suggest that precipitation interacts with transitional phases of the GS to shape next-year early-season productivity.
3.3 Environmental drivers of IPeak
3.3.1 Current-year influences
Correlations between IPeak and environmental variables revealed distinct periods of influence during the current GS (Fig. 4). Two long-term correlation windows were identified. The first, associated with Rg,55–125, spans the period of peak GPP; the second, linked to Tair,95–200, extends beyond the IPeak computation interval (SOS to SOS+120). At shorter timescales, the strongest correlation occurred with VPD96–103 in early August, immediately preceding the mid-season GPP decline. A significant correlation was also observed with Rg,70–77 in early July, shortly after the average date of the summer solstice. These two short-term windows are linked to key environmental cues: maximum incident radiation (on average at SOS+61) and maximum air temperatures (on average at SOS+100). The approx. 40 d lag between these two peaks aligns with the offset observed between the long-term correlation windows.
A third correlation window, with Rg,151–158, was detected at the end of the GS (Fig. S6; Table S2). Its correlation with Rg,70–77 (r = 0.51, p = 0.015) and Tair,95–200 (r = 0.69, p < 0.001) suggests continuity in radiation effects, which may explain why the effect of Tair,95–200 extends beyond the IPeak computation window. This window was therefore not retained for further analysis.
Scatter plots of the strongest correlations (Fig. 6) revealed a threshold-type response, whereby only particularly high values of Rg, Tair and VPD within their respective windows exerted a significant influence on IPeak. Approximate daily mean threshold values were observed around 250 W m−2 for Rg, 16 °C for Tair and 10 hPa for VPD. The year 2003 stood out as an outlier, as its premature GPP decline disrupted the expected IPeak response (see Sect. 3.4.1).
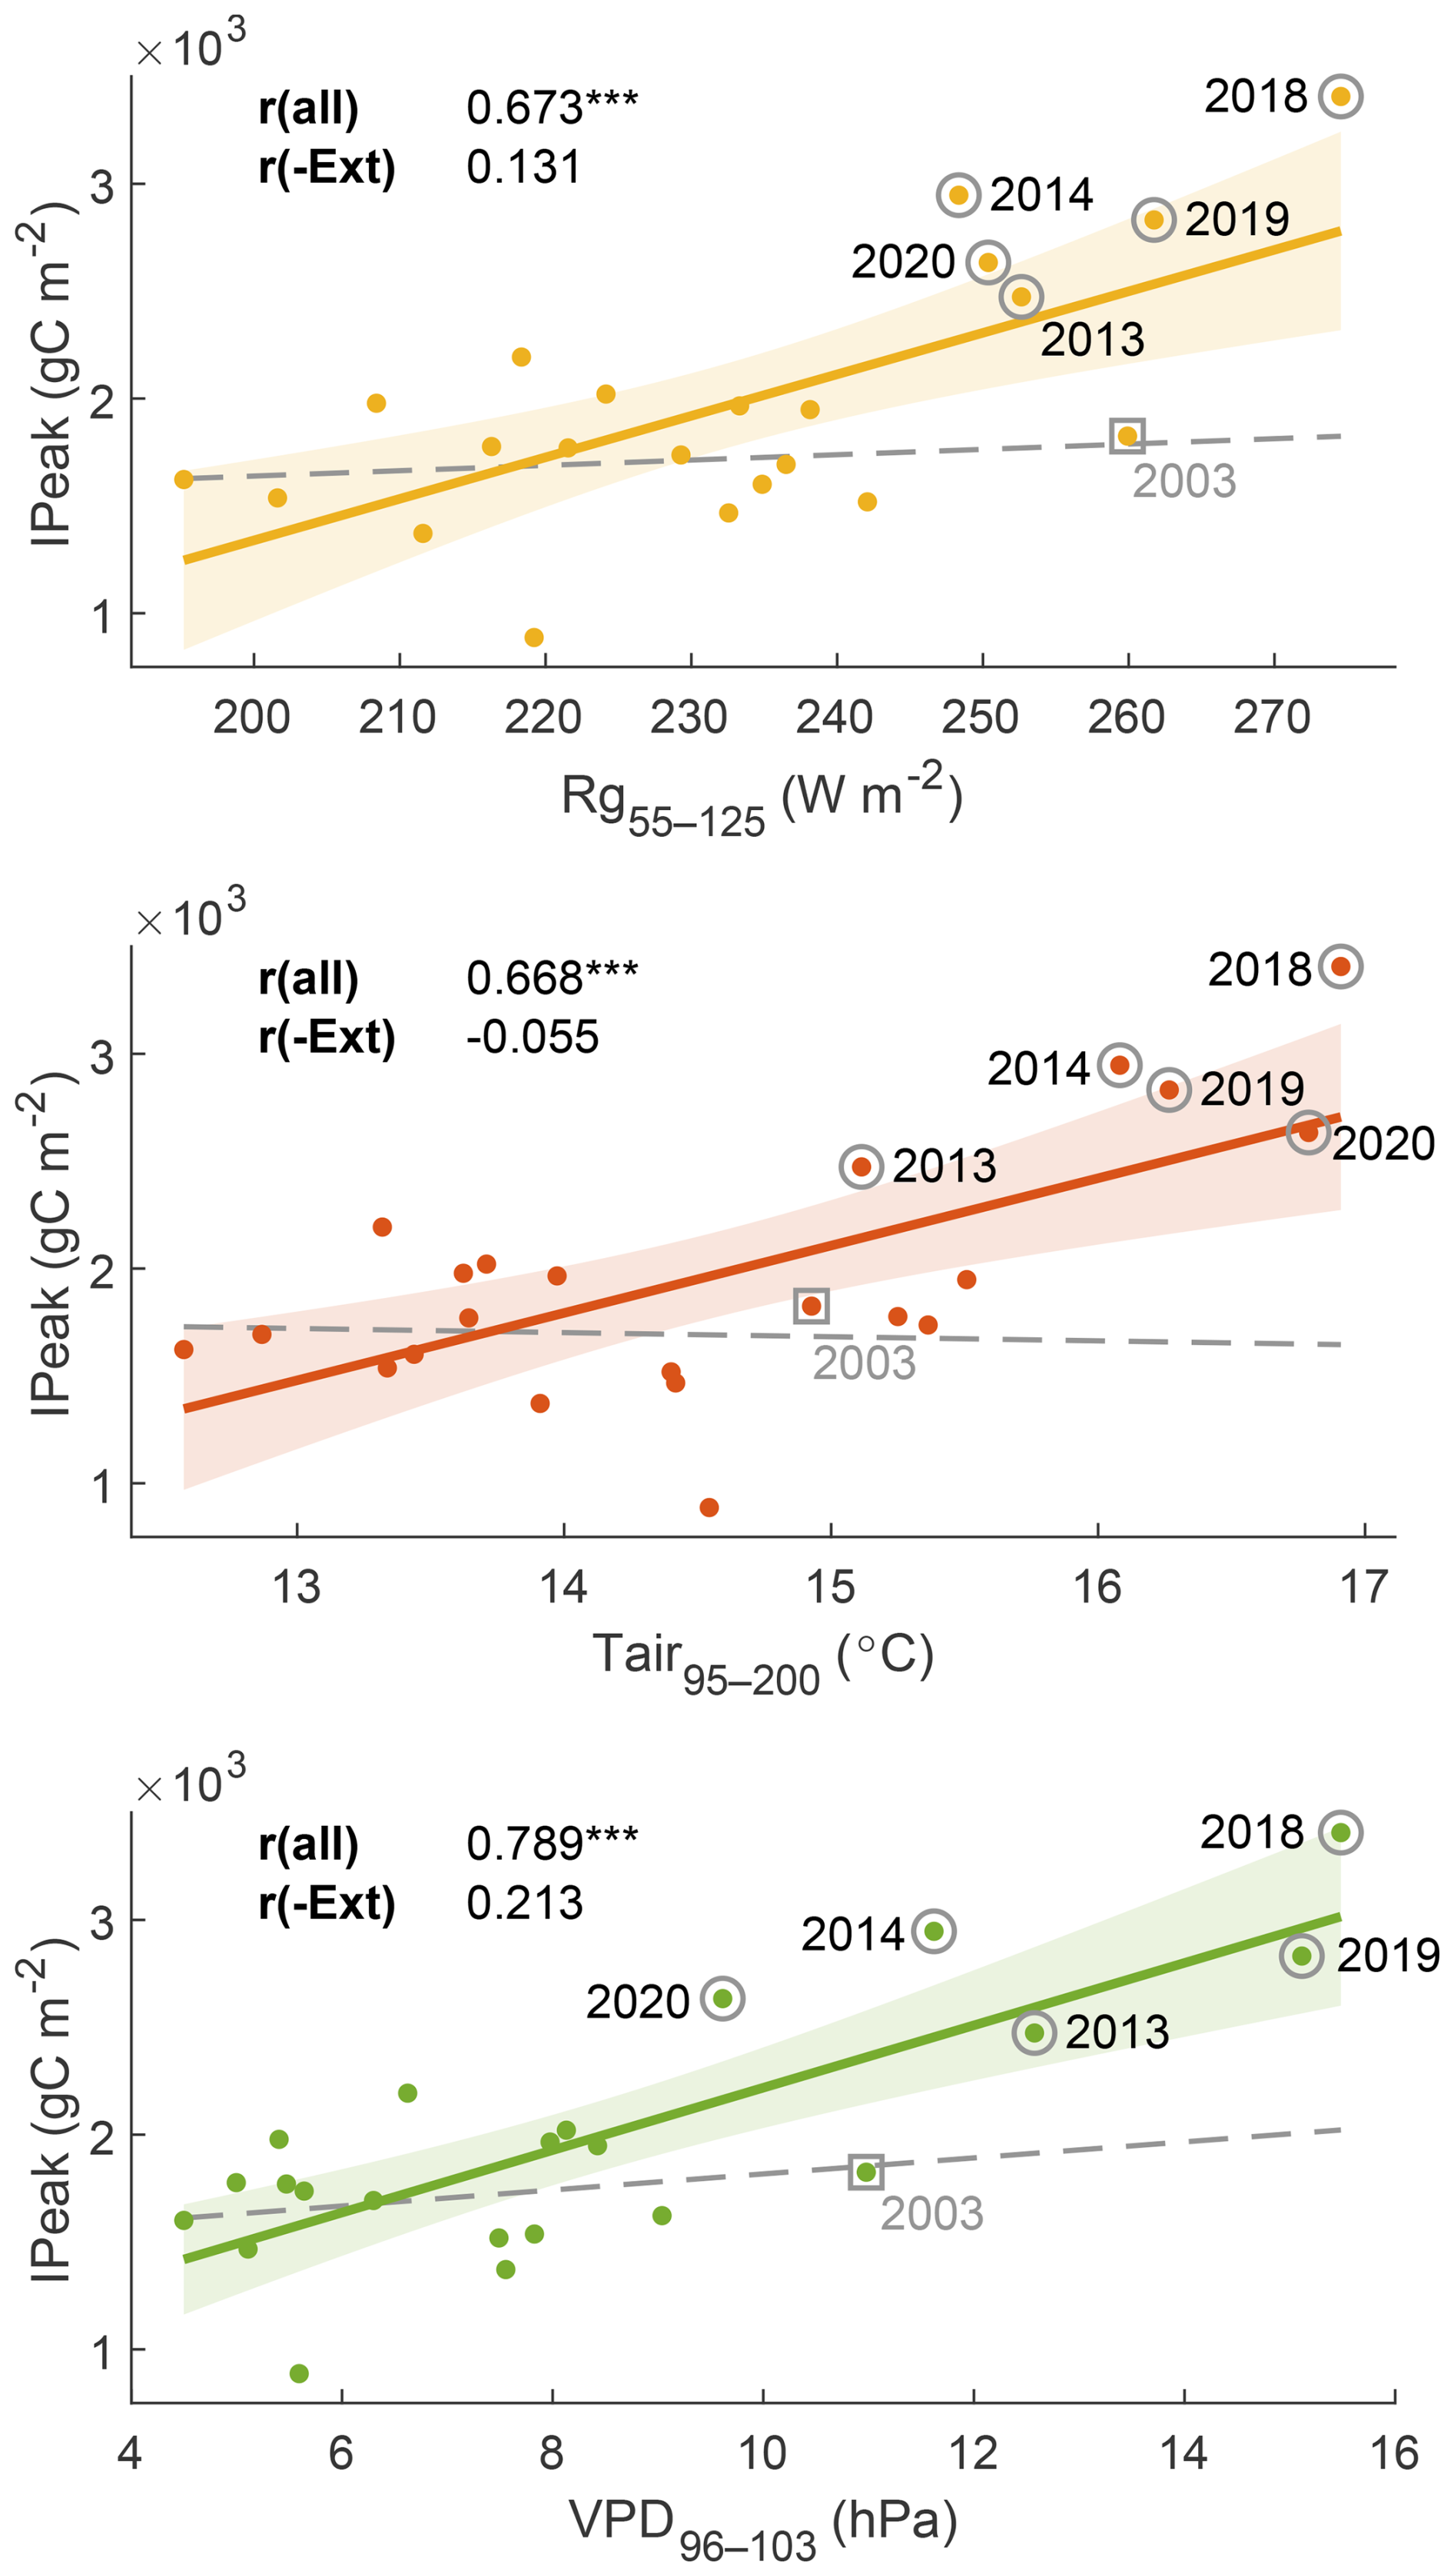
Figure 6Scatter plots illustrating the strongest correlations between IPeak and mean environmental drivers. Each panel displays the fitted linear regression (solid line) with its 95 % confidence interval (shaded area). The dashed grey line represents the regression excluding extreme-summer years, which are indicated by grey circles. The outlier year 2003 is additionally highlighted with a grey square. Correlation coefficients are reported both for the full time series (all) and for the subset excluding extreme-summer years (−Ext). Statistical significance is indicated by one, two or three stars for p ≤ 0.05, 0.01 and 0.001, respectively. Approximate threshold values (250 W m−2 for Rg, 16 °C for Tair, and 10 hPa for VPD) mark the conditions above which IPeak responds to environmental drivers. Although IPeak retains the units of GPP, it represents a wavelet-derived metric and should be interpreted comparatively rather than as an absolute flux.
Extreme years (2013, 2014, 2018, 2019 and 2020) were concentrated at the end of the time series and disproportionately strengthened several correlations. This temporal clustering created artificially elevated correlations between IPeak and previous-year GS variables, as consecutive extreme conditions reinforced statistical associations. Although these correlations were statistically significant, they were not interpreted further due to their redundancy and their limited explanatory value relative to current-year variables, which more directly reflect physiological controls.
Despite the absence of long-term measurements of physiological processes such as masting, fine root production and carbon reserve dynamics, available data nonetheless provide insight into mechanisms underlying IPeak variability. Tree-growth records (Table 1) indicate no increase in stored biomass during extreme years, despite the stand being in a growth phase. Instead, biomass accumulation declined from 2013 onward, coinciding with the onset of extreme conditions. Although autotrophic respiration was not measured, ecosystem respiration was elevated between SOS and SOS+120 in 2018–2020 (Fig. 7) and an additional late-season peak was observed in 2014 (data not shown). In contrast, respiration levels in 2013 were comparable to non-extreme years. Estimated canopy conductance was generally elevated during extreme years, with particularly high values in 2013, 2014 and 2018 (Fig. 7), suggesting physiological adjustments to stress or resource availability.
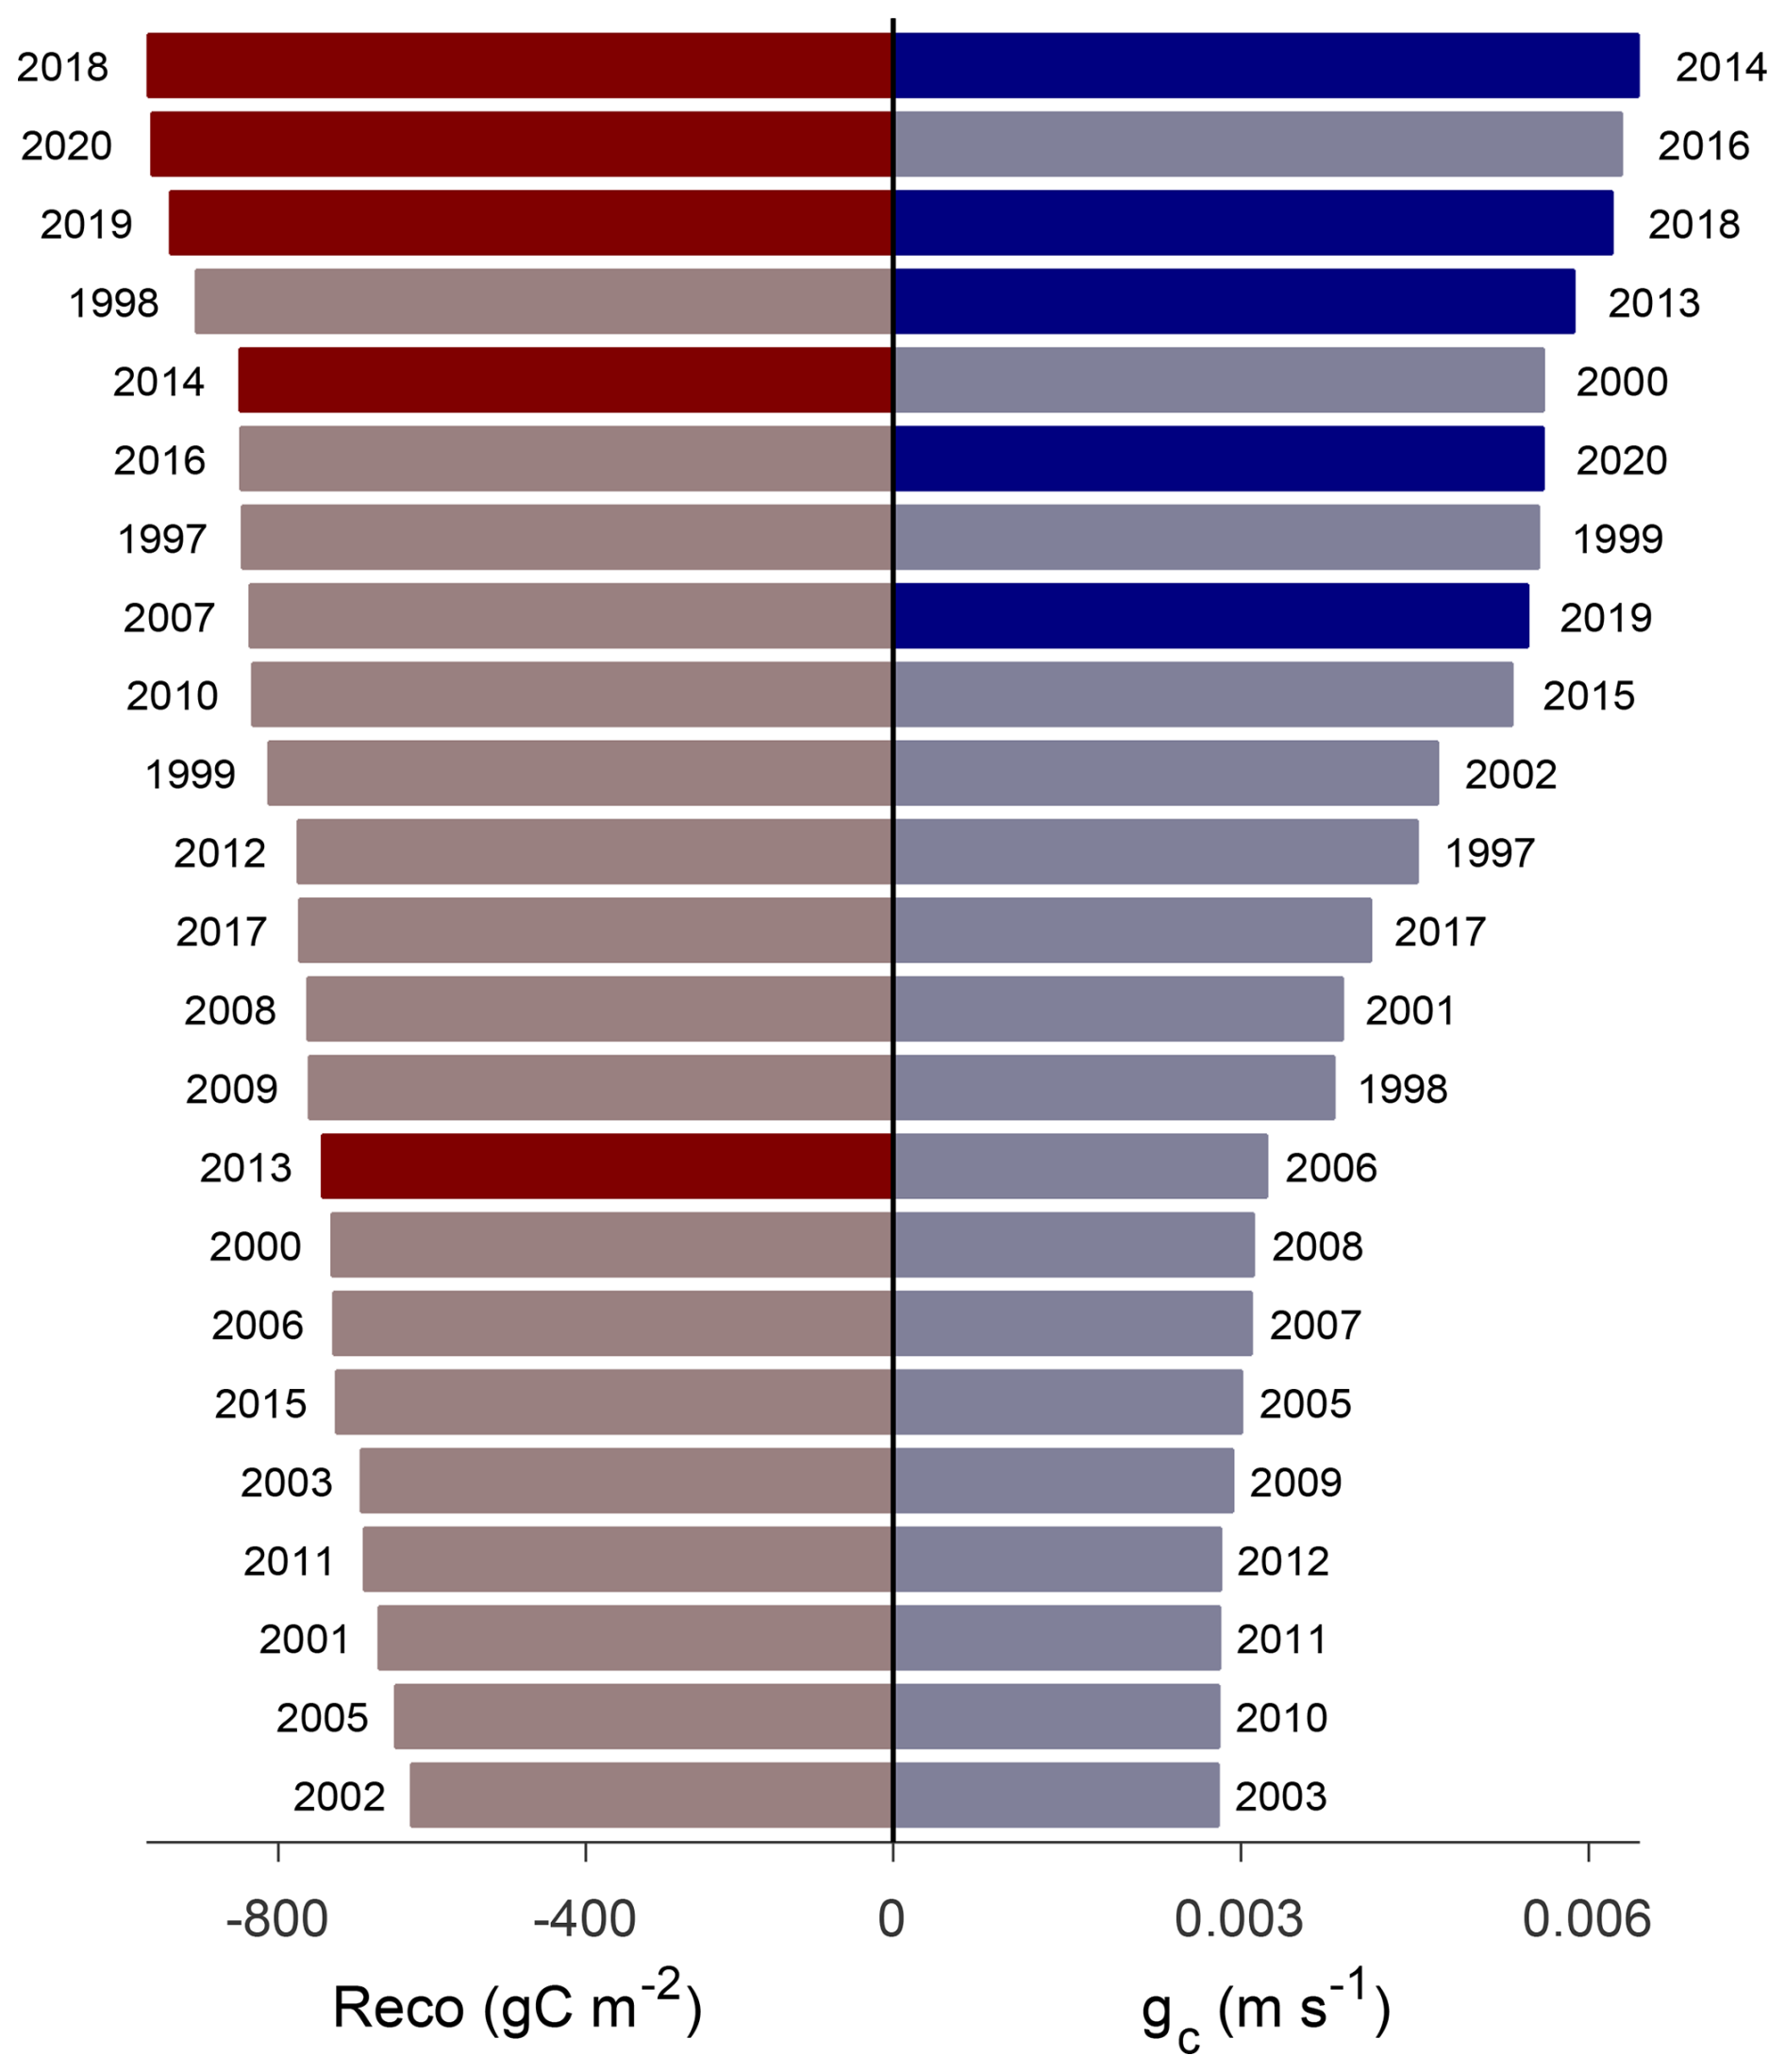
Figure 7Cumulative ecosystem respiration (Reco, left side) and canopy conductance (gc, right side) integrated over the IPeak integration period (SOS to SOS+120). Years are ranked independently for each variable in decreasing order of magnitude. Each horizontal bar represents a single year, with labels positioned on the corresponding side of the axis. Extreme-summer years (2013, 2014, 2018, 2019 and 2020) are highlighted using darker colors, whereas all other years are shown with lighter shades. A vertical line separates the two variables for clarity.
3.3.2 Exclusion of extreme and thinning years
In the subset of years unaffected by extreme summer stress or thinning events, representing approximately 60 % of the dataset, environmental controls on IPeak were generally weak (Figs. 4; S7; Table S3). Only two windows of influence were identified: one in the current year for Tair,22–43 and one in the previous year for P57–120. Within this second period, a short but dominant window (P56–63) emerged, coinciding with a tipping point in biomass allocation (Fig. 5b) marking the transition from stem growth to a diversification of physiological activities. Given the short duration of this window and the reduced sample size (12 years), we performed a leave-one-out sensitivity analysis, which confirmed that the P56–63 relationship remained stable (r= 0.76–0.87 across iterations) and was not driven by any single year.
The P57–120 window partially overlaps with the previous-year P95–137 window influencing IRise but occurs earlier in the season. Similar relationships were observed with remaining biomass growth (r = 0.6, p=0.004) and IDrop (r = −0.53, p = 0.013), suggesting that IPeak and IRise respond to shared environmental conditions, albeit through distinct physiological pathways.
3.4 Environmental drivers of IDrop
3.4.1 Current-year influences
IDrop was primarily controlled by current-year environmental conditions, with only marginal contributions from previous-year variables. Therefore, subsequent analyses focused on current-year correlations.
All environmental drivers contributed to the buildup of hydrological stress, but their influence occurred at distinct phenological stages (Fig. S9; Table S5). The long-term influence of Rg on IDrop extended from SOS+8 onward, reflecting early-season increases in solar input associated with atmospheric warming. This warming intensified from SOS+32 as rising Tair accelerated evapotranspiration and reduced soil water availability. VPD, driven by declining atmospheric humidity or the influx of dry air masses, exacerbated drying starting SOS+53. In contrast, precipitation partially alleviated emerging stress from SOS+58 by replenishing moisture inputs. Finally, REW began influencing IDrop from SOS+81, marking the stage at which cumulative soil moisture depletion became limiting.
The year 2003 exhibited an exceptionally early GPP decline (88 d after SOS, compared to the mean of 103.5 ± 0.6 d). This anomaly corresponds to stress accumulation during the Tair,39–53 window and a sharp VPD107–114 spike immediately after the drop (Fig. 4, IDrop; Figs. 6; S8; Table S4). The abrupt onset and magnitude of this VPD stress dominated the environmental signal in 2003, supporting its exclusion from the general correlation analysis. Removing 2003 extended the correlation windows for Rg and P, and delayed the onset of VPD and Tair effects by 3 and 1 weeks, respectively (Fig. S9; Table S5).
VPD emerged as the dominant driver of IDrop, governing both long- and short-term correlations (Fig. 4, IDrop*). This highlights the prevalence of atmospheric drought stress over edaphic limitations in shaping mid-season GPP declines. The period surrounding the drop was particularly influential. Correlations with VPD remained strongly significant even when the correlation window was narrowed, with a secondary maximum correlation observed for VPD92–134. Within this broader window, two key phases were identified. The first precedes the drop and reflects the buildup of water stress associated with elevated Rg,92–106. Immediately after the drop onset, the second phase corresponds to a sharp rise in atmospheric dryness, captured by VPD107–114. Together, these two phases bracket the GPP decline and underscore the dual role of pre-drop energy input and post-drop atmospheric dryness in amplifying IDrop. An additional window (VPD121–128) suggested sustained post-drop atmospheric stress, although it was strongly correlated with VPD107–114 (r = 0.78, p < 0.001) and largely driven by the year 2018 (data not shown). These findings suggest that accumulated atmospheric stress after the drop plays a key role in determining the magnitude of IDrop.
Additional short-term windows were detected:
-
SOS+70 to SOS+78: Influence of VPD71–78 following the summer solstice, reflecting stress accumulation during peak solar input.
-
SOS+138 to SOS+158: Influence of REW138–145 in early September, indicating constraints from accumulated soil moisture depletion. Although VPD144–158 also correlates with IDrop, its strong correlation with VPD107–114 (r = 0.75, p < 0.001) suggests it mainly reflects the persistence of prevailing meteorological conditions (particularly in highly stressed years such as 2018) rather than an independent stressor. In contrast, REW captures cumulative soil water limitation during this late phase and therefore provides complementary information. This window indicates that REW becomes locally relevant at the end of the growing season, although VPD remains the dominant control across most of the short-term influences identified throughout the season.
-
SOS−70 to SOS−42: A pre-season REW window, potentially reflecting antecedent soil moisture effects. However, the low interannual variability in REW during this period (3 %–4 %) limits interpretability.
3.4.2 Relationship with other indicators
Several correlation windows identified for IDrop overlapped with those observed for IPeak in relation to current-year Rg, Tair and VPD (Fig. 4). This convergence suggests that both indicators share a similar sensitivity to environmental stressors occurring during the same periods. Notably, years with stronger mid-season GPP declines also tended to have higher IPeak values, indicating that both metrics respond coherently to the intensity and timing of hydrometeorological constraints.
A second group of overlaps involved previous-year precipitation, specifically P95–137 for IRise and, albeit only at the large-scale window, P57–120 for IPeak. These patterns point to a lagged influence across the three indicators, whereby conditions associated with pronounced mid-season GPP declines are also linked to reduced IRise (and, to a lesser extent, IPeak) in the subsequent year. Such carry-over effects suggest that drought-related stress not only affects current-year productivity but may also constrain ecosystem recovery and growth potential during the following GS.
This Discussion is structured around the main seasonal phases of beech productivity. We first examine the ecophysiological controls governing early-season carbon uptake, followed by the mechanisms shaping peak productivity and responses to early-summer extremes. We then analyze the drivers of the mid-season decline and the legacy effects of past water limitation. Finally, we assess the influence of thinning and broader structural changes, and discuss the main limitations of our approach. Together, these sections provide an integrated interpretation of the critical time windows identified in this study.
4.1 Early-season controls on carbon uptake and beech development
4.1.1 Post-budburst phase (SOS to SOS+10): role of reserves and delayed carbon autonomy
At our site, the sensitivity of IRise to meteorological conditions reaches a maximum 9 to 10 d after SOS, which coincides with the typical duration of initial leaf unfolding in beech (Bednářová et al., 2014; Henneken et al., 2013; Kikuzawa and Lechowicz, 2011; Luo et al., 2024; Slovíková and Bednářová, 2014; Urban et al., 2014; Zahnd et al., 2023). At the onset of the GS, leaf production is largely supported by non-structural carbohydrates (NSC) reserves accumulated during the previous year (Luo et al., 2024), especially during the first week post-budburst, when up to 80 % of leaf production may be sustained by stored carbon (Campioli et al., 2011; Davi et al., 2008; Kuptz et al., 2011). Newly emerged leaves become photosynthetically active rapidly and tend toward autotrophy at about 10 % expansion, but the transition from heterotrophy to autotrophy is gradual (Keel and Schädel, 2010; Klein et al., 2016). This 9–10 d lag between SOS and the peak sensitivity of IRise is consistent with delayed carbon autonomy suggested by Epron et al. (2012) and Pantin et al. (2012): approx. 90 % of the carbon invested in foliage during unfolding may be supplied by adjacent branches (Klein et al., 2016), with branch NSC reaching a minimum about 20 d after budburst (Schädel et al., 2009). Leaves may become carbon-autonomous within 2–3 weeks, while still being partially supported by local reserves during early expansion (Hoch et al., 2013; Kuptz et al., 2011).
4.1.2 From reserve-driven to environment-driven growth (SOS+9 to SOS+38)
Starting around SOS+10, Rg and Tair emerge as the primary drivers of IRise (Fig. 4). As reserves decline, canopy development increasingly depends on external energy inputs to sustain leaf development and expand its ground coverage (Fox et al., 2018; Ma et al., 2025; Pantin et al., 2012; Yang et al., 2017), maintain cambial activity, repair and extend hydraulic pathways (Barbaroux and Bréda, 2002; Brüggemann et al., 2011; Urban et al., 2014) and replenish carbohydrates in leaves and branches (Klein et al., 2016; Luo et al., 2024). This transition marks a shift from reserve-driven growth to photosynthesis-driven development, with increasing reliance on environmental inputs. As such, photosynthetic activity shows heightened dependence on irradiance, which regulates the input of photons and drives photosynthesis (Tsukaya, 1995), and on air temperature, which influences the kinetics of photosynthetic reactions by enhancing CO2 diffusion in leaves and stimulating Rubisco activity and electron transfer between photosystems (Morot-Gaudry et al., 2021). Apparent effects of VPD, P and REW are present but largely mediated by their covariation with Rg and Tair (Table S1), which is consistent with the lack of structural water limitation at the site during early GS (Kikuzawa and Lechowicz, 2011).
4.1.3 Light controls on leaf ontogeny: from exposure to intensity
Across SOS+9 to SOS+38, IRise exhibits the strongest correlation with Rg. However, the relationship between IRise and light evolves rapidly: an early window (SOS+9 to SOS+16) suggests a stronger role for exposure followed by a second window (SOS+15 to SOS+29) dominated by intensity. This shift is compatible with leaf ontogeny: during the first phase, apical leaves continue to unfold (Bednářová et al., 2014; Granier and Tardieu, 2009; Pantin et al., 2012; Van Volkenburgh, 1999; Vitasse, 2013; Zahnd et al., 2024), while already unfolded leaves undergo cellular expansion (Granier and Tardieu, 2009; Sack et al., 2012). Young leaves exhibit limited photosynthetic capacity (lower chlorophyll, immature enzymatic and thylakoid structures: Kikuzawa and Lechowicz, 2011; Morley et al., 2020; Pantin et al., 2012), which favors carbon sequestration under lower irradiance, and have high developmental priority along with a close proximity to carbon sources (Granier and Tardieu, 1999). These may explain the greater importance of exposure early on. As maturation progresses, individual photosynthetic capacity increases, strengthening the correlation of IRise with Rg, consistent with the stimulatory effect of irradiance on expansion (Granier and Tardieu, 2009; Tardieu et al., 1999; Van Volkenburgh, 1999).
Interestingly, our data indicates limited influence of spring irradiance on IPeak (Fig. 4; Table S3), which may reflect a compensatory mechanism: higher incident light can increase expansion rates while simultaneously shortening the duration of development, leading ultimately to unchanged final leaf area and photosynthetic capacity (Granier and Tardieu 2009). Nonetheless, light quality and timing during flushing may still modulate leaf morphology and sun/shade differentiation, influencing LAI and canopy photosynthetic efficiency (Bequet et al., 2011; Lichtenthaler et al., 1981; Tsukaya, 1995).
4.1.4 Temperature and leaf traits: windows and plausible mechanisms
Higher air temperatures increase the rate of GPP rise during leaf development, mostly from SOS+9 to SOS+16. This is expected, as temperature governs plant metabolic processes and defines organ growth potential (Pantin et al., 2012), enhancing cell expansion (Parent et al., 2010), leaf initiation rates (Savvides et al., 2016) and triggering hyponastic responses (Casal and Balasubramanian, 2019; Legris, 2023).
In the absence of summer extremes, air temperature emerges as the only significant environmental determinant of IPeak in spring (Fig. 4; Table S3). This relationship is compatible with reported temperature effects on: (i) LAI via enhanced cell expansion and leaf size (Legris, 2023; Van Volkenburgh, 1999); (ii) specific leaf area (SLA) via the production of thinner, more light-efficient leaves (Meier and Leuschner, 2008); (iii) vascular/hydraulic development, supporting increased water and nutrient supply to fully expanded leaves (Barbaroux and Bréda, 2002; Brüggemann et al., 2011; Urban et al., 2014). The timing (end of average elongation, SOS+22 to SOS+43) suggests a late effect of temperature on apical leaves still expanding (Bachofen et al., 2020; Zahnd et al., 2024), which typically have smaller areas (Granier and Tardieu, 2009) but higher photosynthetic capacity (Bachofen et al., 2020; Zahnd et al., 2024), or, alternatively, a temperature-induced extension of elongation duration (Parent et al., 2010), as can occur under environmental hazards (Van Volkenburgh, 1999). A cross-species contribution cannot be excluded (e.g. oak, typically completing expansion approx. 10 d after beech; Zahnd et al., 2023). Nevertheless, the moderate strength and late time of the correlation between IPeak and Tair,22–43 suggest that stand-level properties (canopy stratification, composition) structure LAI and canopy photosynthetic capacity more strongly than spring conditions per se (Bequet et al., 2011, 2012; Le Dantec et al., 2000).
4.2 Early-summer extremes and their ecophysiological impacts on forest carbon uptake
In temperate beech forests, early summer (June–July) typically corresponds to optimal carbon assimilation, with favorable temperatures, high radiation and limited constraints from water or substrates (Campioli et al., 2011; Granier et al., 2008; Moreaux et al., 2020). During this phase, beech allocates carbon to growth resumption, reproduction, defense and reserve accumulation, all while sustaining metabolic reactions (Barbaroux and Bréda, 2002; Brüggemann et al., 2011; Hartmann et al., 2020; Luo et al., 2024). Under such stable (non-extreme) conditions, photosynthesis remains only weakly coupled to short-term environmental fluctuations (Fig. 6, excluding extreme years; Müller-Haubold et al., 2013).
By contrast, in years with early-summer extremes (2013, 2014, 2018, 2019, 2020), the forest displayed a markedly different behavior: GPP increased nearly linearly with Rg, Tair and VPD within their respective windows (Fig. 6), coincident with elevated ecosystem respiration in 2018–2020 and higher canopy conductance in several extreme years, most notably 2013, 2014 and 2018 (Fig. 7). This behavior contrasts with the commonly reported negative impacts of climatic extremes on forest productivity, often inferred from modelling studies or sapling experiments (Deluigi et al., 2025; Tang et al., 2022), and suggests the activation of alternative physiological strategies. We outline four non-exclusive hypotheses and assess their consistency with our observations.
-
Stomatal regulation and thermoregulation. Stomata dynamically coordinate water loss and carbon gain in response to radiation, VPD and soil moisture (Hartmann and Trumbore, 2016; Pantin et al., 2012). When soil moisture remains available, plants can maintain stomatal opening under high VPD to dissipate heat via transpiration, thereby stabilizing leaf temperature and supporting photosynthesis, as part of a strategy called thermoregulation (Green, 2024; Guo et al., 2023). At stand scale, this is reflected in higher canopy conductance (Fig. 7). While thresholds for thermoregulation are debated (Grossiord et al., 2020; Guo et al., 2023), our data (elevated gc and IPeak at high VPD) are consistent with stomata-mediated cooling sustaining carbon uptake in extreme years.
-
Enhanced leaf development and structural acclimation. Higher canopy conductance during extreme years also points to structural adjustments: increased LAI, altered SLA, extended leaf development and/or changes in vertical structure or leaf angle.
LAI strongly regulates stand-level carbon and water fluxes (Bequet et al., 2012; Le Dantec et al., 2000; Meier and Leuschner, 2008) and can vary substantially interannually in beech (Leuschner et al., 2001), responding to radiation (Bequet et al., 2011) and temperature (Deluigi et al., 2025). Previous studies at Hesse (Barbaroux and Bréda, 2002; Campioli et al., 2011) and other stands (Bequet et al., 2011; Bréda and Granier, 1996; Capdevielle-Vargas et al., 2015; Gond et al., 1999; Öztürk et al., 2015) reported LAI increases into mid-summer, forming a three-phase growth pattern. Our results are compatible with late-season LAI expansion triggered by extreme conditions, rather than from rhythmic shoot development (proposed by Bréda and Granier, 1996, for oaks but unlikely for single-flushing species) or development halts (proposed by Bequet et al., 2011). Mid-season leaf development could also explain the slower IRise in years with higher IPeak (negative correlation driven by extreme years, Fig. S4). Increased LAI may arise from larger leaf sizes, a trait commonly observed in warmer/wetter climates (Baird et al., 2021; Meier and Leuschner, 2008) which thickens the boundary layer and favors thermoregulation (Baird et al., 2021; Wright et al., 2017). Nevertheless, litter trap data show LAI rises do not always imply larger average leaves (Öztürk et al., 2015), suggesting localized changes (e.g. sun leaves, see Eschrich et al., 1989), leaf angle shifts (Yang et al., 2023) or vertical structure adjustments (Montpied et al., 2009).
Concurrently, high irradiance and temperature promotes the development of thicker leaves with lower SLA, increased volume of palisade mesophyll cells and higher chlorophyll nitrogen concentrations, all of which enhance photosynthetic capacity (Davi et al., 2008; Guidolotti et al., 2013; Koike et al., 2001; Poorter et al., 2009; Tsukaya, 1995). SLA of beech leaves, in particular, can be increased mid-season (Poorter et al., 2012) and shows significant interannual variability at Hesse (Verbeeck et al., 2008). Stomatal density, which develops after leaf expansion (Legris, 2023), can also rise under high light (Aranda et al., 2001; Goisser et al., 2013; Kim et al., 2005; Montpied et al., 2009) and contribute to greater gas exchange and thermoregulation (Uemura et al., 2000).
-
Acquired thermotolerance and temperature acclimation. Elevated temperatures enhance enzymatic activity and developmental processes, increasing autotrophic respiration (Hartmann et al., 2020; Leuschner, 2020; Parent et al., 2010; Sevanto and Dickman, 2015; Sperling et al., 2017; Wright et al., 2017), which accounts for up to 70 % of total respiratory fluxes (Granier et al., 2008). Although canopy-scale net photosynthesis typically declines once thermal optima (15–28 °C) are exceeded (Gennaretti et al., 2020; Leuschner, 2020), upwards shifts in photosynthetic optima may allow beech to maintain or even enhance carbon uptake during heat episodes, counteracting the photosynthesis-respiration imbalance (Deluigi et al., 2025; Grossiord et al., 2020). This rapid acclimation, called acquired thermotolerance, operates via biochemical and structural adjustments such as membrane stabilization and gene expression (Kaplan et al., 2004; Penfield, 2008). Our observations may suggest at least partial thermal acclimation, as Reco rose significantly during extreme years (Fig. 7), while increased IPeak was observed under high Tair (Fig. 6).
-
Sink-driven regulation of carbon allocation. Alternatively (and likely concurrently), the GPP increase could reflect sink-driven demand rather than source limitation. Even if stem biomass accumulation declines (Table 1), carbon can be reallocated to NSC storage, fine root development or masting. These sinks are critical for long-term survival and drought resilience, and their importance tends to increase with age (Brüggemann et al., 2011; Genet et al., 2010; Guillemot et al., 2015; Pilegaard et al., 2011). Masting can consume up to 50 % of yearly NPP (Leuschner, 2020) and may stimulate GPP to meet reproductive demands (Genet et al., 2010; Müller-Haubold et al., 2013; Pilegaard et al., 2011). It is triggered by interannual temperature contrasts (Lebourgeois et al., 2019) and may become more frequent with climate extremes (Scharnweber et al., 2011). Fine roots, with their high turnover and role in water uptake, can be prioritized before drought onset (Hartmann et al., 2020), particularly when facing summer extremes (Satomura et al., 2006). Fine root growth rate is temperature-sensitive (Blessing et al., 2015; Delpierre et al., 2016) and typically peaks in early summer (Epron et al., 1999; Garthen et al., 2025; Migliavacca et al., 2015). NSC reserves, composed mainly of starch and sucrose in beech (Keel and Schädel, 2010), support respiration, osmoregulation and defense (Hartmann and Trumbore, 2016; Luo et al., 2024). Their accumulation increases with tree age (Delpierre et al., 2016; Hartmann et al., 2020; Müller-Haubold et al., 2013) and repeated drought exposure (Thomas et al., 2024; Tomasella et al., 2019). These sink-driven processes may create a feedback loop where GPP is upregulated to meet internal demands, not external growth, although we lack direct site-level measurements of NSC, roots or seed production to support this hypothesis.
Taken together, our data most strongly supports a combination of stomatal thermoregulation (Hypothesis 1) and structural acclimation (Hypothesis 2) as proximate drivers of high GPP under early-summer extremes. Thermal acclimation (Hypothesis 3) and sink-driven regulation (Hypothesis 4) are plausible but less directly evidenced here and may operate in conjunction with the other mechanisms. The strong correlation between VPD96–103 and IPeak (Fig. 6), along with elevated gc and Reco (Fig. 7), likely reflects a convergence of these processes, enhancing carbon assimilation under high evaporative demand, provided soil water remains available. This same period coincides with heightened IDrop sensitivity to drought-related variables (VPD92–134 and Rg,92–106, see Fig. 4), pointing to a phenological mismatch: extreme summers promote anatomical/structural investment (and high GPP), yet subsequent dryness triggers stronger mid-season declines (Leuschner, 2020; Meier and Leuschner, 2008).
These dynamics reinforce the importance of structural acclimation and phenological timing in shaping forest productivity under climate extremes and argue for models that move beyond stress-centric formulations to incorporate adaptive responses and internal regulation of carbon allocation.
4.3 Mid-season drought-induced limitation of forest photosynthesis
Mid-season dynamics are characterized by a shift in GPP control, with drought-related variables (VPD/REW) emerging as dominant drivers of IDrop (Fig. 4). To place these results in context, we briefly outline the general physiological mechanisms governing drought responses in beech.
Temperate ecosystems typically transition from energy-limited to water-limited regimes over the GS as soils dry (Wankmüller et al., 2024). Plants respond by regulating cell water loss, primarily through reductions in stomatal conductance (Gessler and Zweifel, 2024; Pantin et al., 2012; Tomasella et al., 2019; Wankmüller et al., 2024), together with additional physiological and biochemical adjustments (for an overview, see Leuschner, 2020; Pantin et al., 2012). Stomatal closure proportionally reduces CO2 assimilation and leaf surface cooling, thereby leading to photosynthetic down-regulation during drought (Bréda et al., 2006; Deluigi et al., 2025; Grossiord et al., 2020; Hesse et al., 2023; Tomasella et al., 2019; Wankmüller et al., 2024; Yang et al., 2022).
Beech is relatively drought-sensitive (Ulrich and Grossiord, 2023) and has experienced growth declines under repeated droughts in Europe (Tomasella et al., 2019). At mesic sites such as Hesse, beech behaves anisohydrically (Hájíčková et al., 2024; Hesse et al., 2023; Leuschner, 2020), exerting looser stomatal control to drought and relying on traits such as lower turgor loss point, lower osmotic potential at full turgor and larger hydraulic safety margins (Ulrich and Grossiord, 2023). This strategy permits continued carbon assimilation under mild water limitations, for instance by alleviating tissue water deficit via osmoregulation (Hartmann and Trumbore, 2016; Leuschner, 2020). However, beyond a critical severity, photosynthetic reactions decline sharply (Sevanto and Dickman, 2015), as observed in drought years (2003, 2015, 2018, 2019, 2020).
4.3.1 VPD versus soil water availability: site-specific controls
The mechanisms controlling the threshold triggering GPP limitation remain uncertain at the ecosystem scale (Grossiord et al., 2020; Wankmüller et al., 2024). There is an ongoing debate on the relative importance of both factors, increasing VPD and decreasing REW, to explain reductions in photosynthesis under water stress (e.g. see Liu et al., 2022; Lu et al., 2022). This debate is complexified by the fact that both variables co-occur and influence physiological processes in complex, interrelated ways (Green, 2024; Grossiord et al., 2020).
At our temperate forest site, VPD emerged as the most prominent correlate of the GPP decline intensity (Fig. 4), consistent with evidence that vegetation in mesic environments exhibits higher stomatal sensitivity to atmospheric demand than to soil water limitation (Green, 2024). According to theoretical frameworks (Wankmüller et al., 2024), this pattern suggests that, at our site, limiting hydraulic conductances facing drought are more likely to reside within the plant (roots and/or shoots) than in the soil. Following Wankmüller et al. (2024), soil water retention capacity can modulate which driver dominates: coarse-textured soils exhibit steep drops in hydraulic conductivity with small depletions of water content, favoring soil-driven limitations, whereas more retentive soils buffer edaphic constraints. We therefore attribute the relative importance of VPD over REW at Hesse to the good water-holding capacity of the luvisol. Nevertheless, soil water remains integral to the leaf-to-soil continuum. Access to deeper water can buffer soil moisture deficits (Fu et al., 2020; Liang et al., 2024), which may explain why REW becomes influential later in the season and gains importance when VPD is statistically accounted for (Fig. S9; Table S5; data not shown for partial models).
4.3.2 Two critical phases around the GPP drop
Two key periods were most critical for determining IDrop magnitude: the phase surrounding the onset of the drop (SOS+92 to SOS+106) and the subsequent week (SOS+107 to SOS+114). The former coincides with peak Tair, during which elevated Rg,92–106 jointly drives high VPD and typically low P due to reduced cloud cover (Table S5). This increases evaporative demand and potential soil water use, rapidly triggering stomatal regulation when water/carbon fluxes become excessive. Similar high sensitivity to rapid drought onset during peak GPP has been reported for beech (D'Orangeville et al., 2018; Gennaretti et al., 2020), although rapid flux recovery following precipitation during drought has also been observed (Arend et al., 2016; Granier et al., 2007). Our study reconciles these findings by identifying a second, short period of sensitivity to high VPD (VPD107–114) following the initial decline: while the first window triggers stomatal closure and the onset of the drop, the second reflects accumulating stress that can be temporarily alleviated by rainfall, thereby explaining both the strong sensitivity to drought onset and the rapid recovery observed in previous studies.
During this latter period, acute short-term atmospheric drought can lead to major reductions in GPP, as seen in 2003. This year, the drop occurred earlier, in conjunction with exceptionally high June temperatures (SOS+39 to SOS+53) that intensified VPD and accelerated soil moisture consumption (Zhao et al., 2024). This observation is consistent with temperature-triggered flash drought dynamics (Pendergrass et al., 2020). On-site observations reported premature leaf shedding and partial defoliation in August 2003 (Bréda et al., 2006), a strategy thought to protect hydraulic integrity at the expense of carbon uptake (Leuschner, 2020). Notably, this flash drought did not leave persistent damage at Hesse (Vicca et al., 2016). In contrast, extreme droughts that impair hydraulic conductivity and carbon status (Tomasella et al., 2019) have been associated with beech mortality in subsequent years (Tomasella et al., 2019; Walthert et al., 2021). Hydraulic failure and carbon starvation are invoked as principal mechanisms (Yang et al., 2022). In most cases, adult beeches operate with ample hydraulic safety margins and present considerable recovery capacity (Hesse et al., 2023; Leuschner, 2020; Zang et al., 2014) alongside the ability to remove embolism and restore hydraulic function with the formation of new xylem in spring (Hájíčková et al., 2024). These results suggest site-specific responses to drought, based on age, climate and/or phenotypic adjustments.
4.3.3 Winter REW and mid-summer sensitivity
During late winter (SOS−70 to SOS−42), lower REW was associated with greater mid-season GPP declines. Over this period, IDrop correlated positively with Rg and negatively with P (Fig. S9; Table S5), consistent with early depletion of upper-soil water via evaporation and understory uptake (Granier et al., 1999). The influence of winter REW suggests a potential reduction in soil water and nutrient reserves available to buffer against subsequent drought. While higher winter precipitation can promote spring LAI development (Bequet et al., 2011), we did not observe such a relationship at Hesse, likely due to the mild regional climate and generally sufficient spring soil water. We also considered whether early increases in respiration (from starch-to-sugar conversion and subsequent use; Brüggemann et al., 2011; Yang et al., 2022) could explain the pattern; however, this mechanism would typically produce a positive correlation between IDrop and Tair, which was not detected here. Nonetheless, these interpretations should be viewed cautiously, given the limited variability in REW during this window.
4.4 Legacy effects of water limitation
Legacy effects of water limitation on ecosystem fluxes have often been reported (e.g. Aubinet et al., 2018; Campioli et al., 2011; Granier et al., 2008), but remain difficult to quantify at the stand scale (Yu et al., 2022). In contrast, legacy effects of environmental conditions on beech physiological traits are comparatively well-documented (Meier and Leuschner, 2008), though uncertainties persist regarding the dominant drivers and timing at stand level (Delpierre et al., 2016; Lebourgeois et al., 2019; Legris, 2023; Wankmüller et al., 2024).
In our dataset, previous-year summer-autumn abundant precipitation was associated with higher IRise and IPeak in the following year with overlapping correlation windows (Fig. 4) that suggest partly shared mechanisms. Considering beech phenology (Fig. 1), two processes provide a coherent explanation: (1) reserve formation and hydraulic capacity; and (2) bud formation and primordia development.
4.4.1 Mechanism 1: Reserve formation and hydraulic capacity (mid-summer–autumn)
A substantial fraction of assimilated carbon is diverted to storage pools in late summer and autumn (Blessing et al., 2015; Campioli et al., 2013; Granier et al., 2008; Kuptz et al., 2011), especially when stem growth ceases early under drought (Barbaroux and Bréda, 2002). Toward the end of the GS, soluble sugars are converted into starch and, together with minerals, are translocated to permanent tree organs (Gessler et al., 2017; Perry, 1971), primarily roots (Blessing et al., 2015) and upper stems (Sperling et al., 2017). These reserves support maintenance metabolism and root turnover during winter (Delpierre et al., 2016; Dufrêne et al., 2005; Hartmann and Trumbore, 2016). In spring, they are mobilized to sustain bud-break, early leaf development, fine root production and, though less-pronounced in diffuse-porous beech, xylem formation (Campioli et al., 2011; Delpierre et al., 2016; Genet et al., 2010; Hartmann et al., 2020; Hartmann and Trumbore, 2016; Kuptz et al., 2011).
These sink activities modulate early-season productivity indices (IRise and IPeak), reflecting key legacy effects from both previous-year reserve formation and hydraulic capacity. Our results indicate two pathways which influence these two processes:
-
Xylem formation. Water availability is a primary determinant of beech growth (Lebourgeois et al., 2019), with June–July precipitation frequently highlighted (Leuschner, 2020; Pilegaard et al., 2011; Prislan et al., 2019). In our data, P95–137 and P57–120 correlate positively with remaining biomass growth (Sect. 3.2.2; 3.3.2; Fig. 5a), indicating that wetter summers support sustained growth and thus reserve accrual. While correlations with Tair occur, these are often secondary to P (Müller-Haubold et al., 2013; Scharnweber et al., 2011). In coarse-textured soils, REW can outperform P (Scharnweber et al., 2011) likely due to hydraulic properties (cf. Sect. 4.3.1), but this site dependence cautions against generalization.
Dry summers reduce biomass increment (Hesse et al., 2023; Leuschner et al., 2001; Yu et al., 2022), as allocation shifts to NSC storage (Barbaroux and Bréda, 2002) and fine roots (Leuschner et al., 2001) to offset increased root mortality and maintain water uptake (Hartmann et al., 2020). This reduction in growth not only limits the accumulation of reserves but also impairs xylem development. In diffuse-porous beech, previously-formed xylem, with strong contributions from peripheral rings, is critical for water transport in spring (Barbaroux and Bréda, 2002). Reduced late-season growth therefore constrains hydraulic capacity the following spring, potentially limiting shoot initiation and early development in the subsequent growing season (Tomasella et al., 2019).
-
Phloem transport. Water stress can impair phloem function through several pathways (reduced loading, increased sap viscosity, slower sieve-tube transport), weakening the coupling of photosynthesis and belowground sinks and lowering the net carbon delivery to storage pools (Blessing et al., 2015; Brüggemann et al., 2011; Ruehr et al., 2009; Sevanto and Dickman, 2015). As a result, trees increase consumption of existing reserves, mobilizing stored carbohydrates to sustain metabolic activity, defense and osmotic regulation (Campioli et al., 2011; Hartmann and Trumbore, 2016). Prolonged deficits can deplete starch (Yang et al., 2022), reducing NSC availability for winter maintenance and, ultimately, spring regrowth (Hesse et al., 2023). Consistent with this, higher was associated with smaller IDrop (Sect. 3.2.2; 3.3.2), suggesting a buffering effect on seasonal stress accumulation.
4.4.2 Mechanism 2: Bud formation, primordia number and developmental potential (late spring–mid-summer)
In addition to biomass accumulation, beech trees begin to diversify their physiological activities from mid-June onward (SOS+57, see Fig. 5b). In parallel, bud formation (bud-set) for the following year begins as early as May (Roloff, 1987) and proceeds through primordia differentiation (vegetative, reproductive or compound) (Delpierre et al., 2016; Fox et al., 2018; Hoch et al., 2013). The number and anatomical characteristics of these organs are largely determined during bud formation (Le Dantec et al., 2000; Uemura et al., 2000). Summer precipitation strongly regulates early primordia differentiation, influencing total leaf number (Meier and Leuschner, 2008) and promoting larger buds (Kukk and Sõber, 2015). Because cell number determines final organ size (Ma et al., 2025) and depends on meristem size (Gázquez and Beemster, 2017), water availability during bud formation directly sets the developmental potential of the next leaf cohort. In contrast, drought reduces leaf production (Tomasella et al., 2019) and, when coupled with impaired vascular connectivity, favors cataphyll formation instead of leaf primordia (Kukk et al., 2015).
Light also shapes primordia differentiation, particularly the sun/shade leaf proportion until late July (Eschrich et al., 1989; Legris, 2023). Sun-leaves have higher photosynthetic capacity (additional palisade layer; Lichtenthaler et al., 1981) and can increase primordia number (Eschrich et al., 1989). However, at stand scale, canopy structure constrains light, producing a strong vertical gradient in bud development (Kukk and Sõber, 2015; Montpied et al., 2009). In contrast, precipitation exerts interannual control by supporting biomass increment (larger stem and parent-shoot cross-sectional area), xylem development and hydraulic conductance (Cochard et al., 2005; Kukk and Sõber, 2015), which together promote larger buds with more primordia (Alla et al., 2011; Kukk and Sõber, 2015). In line with this, our analyses highlight previous-year as primary drivers of spring–summer productivity, consistent with light-regulation of within-canopy spatial variability and precipitation-driven interannual variability mediated by xylogenesis and hydraulics.
4.4.3 Short-timescale overlaps and phenological alignment: divergent pathways for IRise and IPeak?
Short-scale correlation windows inform on potential divergent pathways for previous-year precipitation influence on IRise and IPeak.
IRise correlates with previous-year precipitation in three short-scale windows: (i) early-July (P77–84), (ii) around peak Tair (P94–115) and (iii) the week after the GPP drop (P120–134). These overlap with current-year IDrop windows (cf. Sect. 3.4.2) and exhibit strong connection with biomass-increment phases in beech (Fig. 5a): (i) approx. 35 % of annual growth in June–early July (Leuschner, 2020), (ii) sharp declines in late July under water limitation (Campioli et al., 2011; Prislan et al., 2019) and (iii) extended xylogenesis into September when water remains available (Campioli et al., 2011; Noyer et al., 2023). In contrast, IPeak exhibits a strong dependency on a narrow previous-year window (P56–63) centered on the summer solstice, which coincides with the average onset of bud formation in beech stands (Urban et al., 2014). Early-season water deficits at (or just before) bud-set can reduce leaf primordia number, lower individual leaf area and ultimately decrease LAI (Le Dantec et al., 2000; Leuschner, 2020).
Timing of short-scale windows suggests that previous-year precipitation impacts IRise primarily via reserve formation and xylogenesis, whereas IPeak is more directly affected by water availability during bud-set. Our results may highlight a critical 1 week window (SOS+56 to SOS+63) at the onset of bud development during which precipitation exerts a strong influence. Nevertheless, IRise and IPeak likely integrate both physiological processes to varying degrees, not only because they occur in overlapping developmental phases, but also because they are functionally interdependent: primary meristematic growth, which determines bud size and the number of leaf primordia, depends on secondary cambial activity, which in turn governs the anatomical structure and hydraulic efficiency of the sap pathways supplying the buds (Alla et al., 2011; Cochard et al., 2005).
4.5 Structural and disturbance effects on GPP indicators
4.5.1 Thinning effects
At Hesse, thinning events had limited effects on annual fluxes (GPP, Reco, NEE) and on indicators. This stability is consistent with reported compensatory mechanisms, including increased understory vegetation assimilation and reduced autotrophic respiration, that buffer ecosystem-level changes after canopy disturbance (Granier et al., 2008; Vesala et al., 2005).
A thinning effect on IPeak became apparent only after excluding extreme summers. The largest response occurred in 2005, the most severe intervention (Table 1), whereas 1999, 2010 and 2016 exhibited minimal to no effect, in line with Gea-Izquierdo and Sánchez-González (2022). This contrast highlights the role of thinning intensity: severe thinning leads to a substantial reduction in photosynthetic surface that outweighs potential gains in light availability for shade-leaves and reduced competition, resulting in a net decrease in stand-level productivity. In contrast, lighter interventions induce only minor structural changes, which have limited impact on ecosystem-scale GPP. Rapid canopy recovery and leaf acclimation further dampen any transient increase, explaining why thinning rarely produces lasting gains in IPeak at the ecosystem scale (Bequet et al., 2011; Cochard et al., 2005; Granier et al., 2008). The contrast between 2005 and other thinning years aligns with differences in intensity and in the dominance/biomass share of removed trees (Table 1), both of which modulate how stand-level capacity responds.
Thinning effects on IDrop were detectable only when years with severe drops were removed but remained inconsistent across thinning years (Fig. 3). This variability indicates that mid-season GPP declines are primarily controlled by atmospheric and hydrological drivers (VPD, Rg, REW; Fig. 4), while thinning acts indirectly as a context-dependent modulator, by modifying microclimatic conditions (light environment, temperature, soil moisture) and aerodynamic coupling (Hartmann et al., 2020; Vesala et al., 2005).
Overall, thinning effects on fluxes and indicators at Hesse were modest and transient. While thinning alters stand structure and resource distribution, its ecosystem-scale influence is buffered by rapid physiological and structural adjustments, and overshadowed by climatic variability (Aslan et al., 2024; Schulze et al., 2022). Given the limited number of interventions and the strong interannual climatic forcing, these conclusions should be viewed considering restricted statistical power.
4.5.2 Structural changes and forest maturation
Over the study period, the stand evolved from approximately 30 to 55 years old, potentially affecting canopy structure and carbon uptake dynamics. Such ontogenetic changes may influence both early-season development and peak productivity through mechanisms such as increased self-shading, changes in leaf area distribution, and shifts in carbon allocation patterns (Genet et al., 2010).
However, several elements indicate that long-term structural changes alone do not explain the observed variability in GPP indicators. First, available data show no clear long-term increase in leaf area index, suggesting that canopy closure was already largely achieved early in the record. Second, biomass increment decreased after 2013, indicating that the stand had reached a mature phase rather than undergoing continuous growth (Granier et al., 2008). Most importantly, when extreme-summer years are excluded, temporal trends in both IRise and IPeak become non-significant, indicating that the apparent long-term patterns are primarily driven by interannual variability rather than gradual stand development.
Changes in phenology may also contribute to the observed patterns. In particular, the advancement of the SOS increases the duration available to reach peak GPP, effectively reducing the apparent rate of increase captured by IRise (Bitton et al., 2026). This mechanism may also contribute to the negative relationship between IRise and IPeak, as earlier SOS extends the buildup phase (lower IRise), allowing greater cumulative photosynthetic activity around the seasonal peak (higher IPeak).
While structural and ontogenetic processes may contribute to these relationships, our results indicate that their influence is secondary compared to that of climatic variability, particularly extreme-summer conditions. Disentangling these effects remains challenging in long-term observational studies and is therefore acknowledged as a limitation of the present analysis.
4.6 Limitations
Despite the robustness of the identified relationships, several limitations should be acknowledged.
First, the large number of tested correlations raises the issue of multiple comparisons. Because time windows are highly interdependent, classical correction methods (e.g. Bonferroni or FDR) are difficult to apply meaningfully. Our approach therefore relies on the identification of spatially coherent patterns in correlograms rather than isolated significant values. Because of the exploratory and pattern-based nature of the analysis, results should be interpreted as identifying robust relationships rather than testing independent hypotheses and may still be affected by residual multiple-testing biases.
Second, the effective sample size is reduced in subset analyses (e.g. after excluding thinning and extreme years), which limits statistical power. Although sensitivity analyses confirmed the robustness of key relationships, uncertainty remains higher for short time windows and restricted datasets, highlighting the importance of long-term observations.
Third, the site is dominated by beech, but contributions from other species within the flux footprint cannot be fully excluded. While no clear shifts in species-driven canopy dynamics were observed over the study period, with thinning representing the main driver of structural and compositional changes, species-specific differences in phenology or physiology may still introduce additional variability, particularly during the early growing season.
Fourth, structural and ontogenetic changes may influence GPP dynamics over multi-decadal timescales. While our analyses suggest that interannual climatic variability dominates the observed patterns, disentangling these effects from gradual stand development remains challenging in observational studies.
Fifth, legacy effects were investigated only over a one-year lag. Longer-term legacy effects may exist but could not be robustly assessed given the limited sample size and therefore remain an open question.
Sixth, our approach assumes that phenological timing relative to the start of season (SOS) is broadly consistent across years. Deviations from this assumption may affect the alignment between environmental drivers and GPP responses.
Finally, uncertainties associated with flux partitioning (e.g. estimation of ecosystem respiration) may influence GPP estimates. While these uncertainties may impact absolute flux values, their influence on the integrated temporal patterns examined here is expected to be limited, as the indicators are derived over multi-day to seasonal timescales, which reduces the impact of short-term errors.
This 24-year analysis reveals that temperate forests do not respond to climate forcing as uniform carbon-absorbing systems, but as seasonally structured, physiology-driven organisms whose behavior cannot be captured through annual budgets alone. By introducing three indicators (IRise, IPeak and IDrop), we show that the seasonal architecture of GPP carries essential information about forest function, vulnerability and resilience that remain invisible at coarser temporal scales. Four central insights emerge:
-
Seasonal GPP phases are shaped by different environmental and physiological controls. Early-season growth (IRise) emerges from the interaction between reserves, leaf development and light–temperature constraints; peak productivity (IPeak) reflects canopy structural traits and developmental constraints encoded in bud formation the previous year; and mid-summer decline (IDrop) is governed overwhelmingly by atmospheric demand, with soil moisture playing a secondary and delayed role. Thus, the carbon cycle of a maturing beech forest is not a simple response to climate forcing, but the outcome of timing, memory and structural investment across seasons.
-
Previous-year precipitation exerts strong legacy effects, especially a critical 1 week window. Summer–autumn precipitation exerts a measurable imprint on next-year productivity through two interwoven pathways: (i) late-season reserve formation and xylogenesis and (ii) the developmental potential of buds and primordia. These legacy effects influence both IRise and IPeak, shifting the forest's trajectory long before the next growing season begins. Most strikingly, a 1 week precipitation window (P56–63) around the onset of bud-set exhibits the strongest correlation with IPeak, highlighting a short developmental bottleneck during which water availability disproportionately affects next-year canopy capacity. This provides evidence that temperate deciduous forests carry physiological memory, modulating how they capitalize on favorable conditions or absorb climatic stress.
-
Extreme summers can temporarily amplify peak GPP rather than suppress it. Extreme summers, typically assumed to reduce productivity, can sometimes produce exceptionally high peak GPP when atmospheric demand rises but soil moisture remains sufficient. This behavior points to a suite of active acclimation mechanisms (thermotolerance, stomatal regulation, structural adjustments) that enable beech to transiently withstand heat but may heighten sensitivity to subsequent drought in the season. Understanding this balance between short-term resilience and longer-term vulnerability is essential as climatic extremes intensify.
-
Mid-season GPP decline is controlled primarily by VPD, with two critical windows that govern drop onset and intensity. Rather than responding gradually to soil drying, beech GPP declines steeply from brief surges in atmospheric demand (VPD) that occur within two short windows bracketing the drop. A pre-drop onset VPD build-up (due to elevated Rg,92–106) initiates stress, and a post-drop onset VPD spike (VPD107–114) deepens the decline once stomatal regulation is engaged. Flash-droughts occur when both windows align with unusually warm early summers, demonstrating that brief surges in atmospheric demand (and not long-term soil depletion) dictate the timing and magnitude of mid-season productivity loss.
Together, these findings demonstrate that forest carbon dynamics must be understood through the lens of seasonal physiology, not annual summaries. Beech GPP is shaped by phenological stage, legacy effects, structural development and atmospheric demand, each acting within brief but critical timeframes. These insights provide a mechanistic foundation for improving seasonal carbon-cycle models and anticipating forest responses to increasingly irregular climate regimes.
Building on the insights from this long-term study, we propose three research priorities to advance forest ecophysiology:
-
Process-based integration of carbon dynamics and phenology. Future work should link seasonal carbon exchange indicators (like IRise, IPeak and IDrop) to direct physiological measurements of NSC mobilization, bud development, canopy structure and hydraulic function. Trait-based frameworks that connect leaf-level development with stand-level productivity are essential to understand how phenological shifts (e.g., earlier SOS) alter seasonal carbon allocation, canopy formation and ecosystem productivity.
-
Quantification of long-term drought impacts and legacy pathways. The strong influence of previous-year precipitation on current-year productivity emphasizes the need to quantify multi-year drought legacy effects. This includes characterizing temporal trajectories of NSC pools, xylem recovery, bud viability and fine-root dynamics, as well as identifying the conditions under which these legacy mechanisms constrain or enhance future carbon uptake, especially during reserve formation and bud-set.
-
Develop adaptive models and monitoring systems for climate extremes. Atypical GPP increases observed during extreme summers suggest active acclimation mechanisms that current models rarely represent. Future modelling efforts should incorporate trait plasticity and internal regulation processes (e.g., thermal acclimation, stomatal regulation under high VPD, structural adjustments). Expanded long-term monitoring of hydraulic traits, canopy structure and carbon allocation to sinks would further improve predictions of forest responses and recovery to climate extremes.
The WAI code and FR-Hes data used for this study are openly available on GitHub at https://github.com/jonathanbitton/Wavelet-WAI (last access: 1 July 2026). A permanent archived version is available through Zenodo at https://doi.org/10.5281/zenodo.21111957 (Bitton, 2026).
The supplement related to this article is available online at https://doi.org/10.5194/bg-23-6491-2026-supplement.
JB: Conceptualization, Methodology, Formal analysis, Software, Data Curation, Writing – Original Draft, Visualization. BL: Conceptualization, Methodology, Formal analysis, Data Curation, Resources, Supervision, Project administration. CC: Conceptualization, Methodology, Formal analysis, Supervision, Project administration. BH: Conceptualization, Methodology, Formal analysis, Writing – Review & Editing, Supervision, Project administration.
The contact author has declared that none of the authors has any competing interests.
Publisher's note: Copernicus Publications remains neutral with regard to jurisdictional claims made in the text, published maps, institutional affiliations, or any other geographical representation in this paper. The authors bear the ultimate responsibility for providing appropriate place names. Views expressed in the text are those of the authors and do not necessarily reflect the views of the publisher.
The authors acknowledge the Office national des forêts along with the successive scientific and technical teams for continuously managing the Hesse forest site and providing crucial site-specific information. In particular, the authors want to thank Matthias Cuntz, Emily Joetzjer and Jean-Baptiste Lily for sharing the data and providing useful insights on the project. The authors also thank Adeline Fayolle, Aurore Brut and Samuel Nicolay for their continuous guidance and feedback on the research project.
This work was supported by the Fédération Wallonie-Bruxelles; the GIP ECOFOR [convention 2011.11]; the FEDER – Grand Est, France [convention 12000346-36557]; the INRAE Ecology and Biodiversity department; and the CPER de la Région Grand Est 2021–2027.
This paper was edited by Paul Stoy and reviewed by two anonymous referees.
Alla, A. Q., Camarero, J. J., Rivera, P., and Montserrat-Martí, G.: Variant allometric scaling relationships between bud size and secondary shoot growth in Quercus faginea: implications for the climatic modulation of canopy growth, Ann. For. Sci., 68, 1245–1254, https://doi.org/10.1007/s13595-011-0093-z, 2011.
Anchukaitis, K. J.: Tree Rings Reveal Climate Change Past, Present, and Future, P. Am. Philos. Soc., 161, 244–263, 2017.
Aranda, I., Bergasa, L. F., Gil, L., and Pardos, J. A.: Effects of relative irradiance on the leaf structure of Fagus sylvatica L. seedlings planted in the understory of a Pinus sylvestris L. stand after thinning, Ann. For. Sci., 58, 673–680, https://doi.org/10.1051/forest:2001154, 2001.
Arend, M., Sever, K., Pflug, E., Gessler, A., and Schaub, M.: Seasonal photosynthetic response of European beech to severe summer drought: Limitation, recovery and post-drought stimulation, Agr. Forest Meteorol., 220, 83–89, https://doi.org/10.1016/j.agrformet.2016.01.011, 2016.
Aslan, T., Launiainen, S., Kolari, P., Peltola, O., Aalto, J., Bäck, J., Vesala, T., and Mammarella, I.: Thinning turned boreal forest to a temporary carbon source – short term effects of partial harvest on carbon dioxide and water vapor fluxes, Agr. Forest Meteorol., 353, 110061, https://doi.org/10.1016/j.agrformet.2024.110061, 2024.
Aubinet, M., Vesala, T., and Papale, D. (Eds.): Eddy Covariance: A Practical Guide to Measurement and Data Analysis, Springer Netherlands, Dordrecht, https://doi.org/10.1007/978-94-007-2351-1, 2012.
Aubinet, M., Hurdebise, Q., Chopin, H., Debacq, A., De Ligne, A., Heinesch, B., Manise, T., and Vincke, C.: Inter-annual variability of Net Ecosystem Productivity for a temperate mixed forest: A predominance of carry-over effects?, Agr. Forest Meteorol., 262, 340–353, https://doi.org/10.1016/j.agrformet.2018.07.024, 2018.
Bachofen, C., D'Odorico, P., and Buchmann, N.: Light and VPD gradients drive foliar nitrogen partitioning and photosynthesis in the canopy of European beech and silver fir, Oecologia, 192, 323–339, https://doi.org/10.1007/s00442-019-04583-x, 2020.
Baird, A. S., Taylor, S. H., Pasquet-Kok, J., Vuong, C., Zhang, Y., Watcharamongkol, T., Scoffoni, C., Edwards, E. J., Christin, P.-A., Osborne, C. P., and Sack, L.: Developmental and biophysical determinants of grass leaf size worldwide, Nature, 592, 242–247, https://doi.org/10.1038/s41586-021-03370-0, 2021.
Barbaroux, C. and Bréda, N.: Contrasting distribution and seasonal dynamics of carbohydrate reserves in stem wood of adult ring-porous sessile oak and diffuse-porous beech trees, Tree Physiol., 22, 1201–1210, https://doi.org/10.1093/treephys/22.17.1201, 2002.
Barbaroux, C., Bréda, N., and Dufrêne, E.: Distribution of above-ground and below-ground carbohydrate reserves in adult trees of two contrasting broad-leaved species (Quercus petraea and Fagus sylvatica), New Phytol., 157, 605–615, https://doi.org/10.1046/j.1469-8137.2003.00681.x, 2003.
Bednářová, E., Kučera, J., and Merklová, L.: The onset and duration of vegetative phenological stages in European beech (Fagus sylvatica L.) under changing conditions of the environment, Acta Univ. Agric. Silvic. Mendel. Brun., 58, 23–30, https://doi.org/10.11118/actaun201058040023, 2014.
Bequet, R., Campioli, M., Kint, V., Vansteenkiste, D., Muys, B., and Ceulemans, R.: Leaf area index development in temperate oak and beech forests is driven by stand characteristics and weather conditions, Trees, 25, 935–946, https://doi.org/10.1007/s00468-011-0568-4, 2011.
Bequet, R., Kint, V., Campioli, M., Vansteenkiste, D., Muys, B., and Ceulemans, R.: Influence of stand, site and meteorological variables on the maximum leaf area index of beech, oak and Scots pine, Eur. J. For. Res., 131, 283–295, https://doi.org/10.1007/s10342-011-0500-x, 2012.
Binda, G., Di Iorio, A., and Monticelli, D.: The what, how, why, and when of dendrochemistry: (paleo)environmental information from the chemical analysis of tree rings, Sci. Total Environ., 758, 143672, https://doi.org/10.1016/j.scitotenv.2020.143672, 2021.
Bitton, J.: Continuous wavelet transform toolkit with Wavelet Area Interpretation (WAI) (Version v2.0.1), Zenodo [code and data set], https://doi.org/10.5281/zenodo.21111957, 2026.
Bitton, J., Charles, C., Longdoz, B., and Heinesch, B.: How beech ecophysiology shapes temperate forest gross primary productivity – Part 1: A wavelet-based framework for extracting seasonal dynamics, Biogeosciences, 23, 6465–6489, https://doi.org/10.5194/bg-23-6465-2026, 2026.
Blessing, C. H., Werner, R. A., Siegwolf, R., and Buchmann, N.: Allocation dynamics of recently fixed carbon in beech saplings in response to increased temperatures and drought, Tree Physiol., 35, 585–598, https://doi.org/10.1093/treephys/tpv024, 2015.
Bonan, G.: Ecological Climatology: Concepts and Applications, 3rd ed., Cambridge University Press, Cambridge, https://doi.org/10.1017/CBO9781107339200, 2015.
Bréda, N. and Granier, A.: Intra- and interannual variations of transpiration, leaf area index and radial growth of a sessile oak stand (Quercus petraea), Ann. Sci. Forest, 53, 521–536, https://doi.org/10.1051/forest:19960232, 1996.
Bréda, N., Huc, R., Granier, A., and Dreyer, E.: Temperate forest trees and stands under severe drought: a review of ecophysiological responses, adaptation processes and long-term consequences, Ann. For. Sci., 63, 625–644, https://doi.org/10.1051/forest:2006042, 2006.
Brüggemann, N., Gessler, A., Kayler, Z., Keel, S. G., Badeck, F., Barthel, M., Boeckx, P., Buchmann, N., Brugnoli, E., Esperschütz, J., Gavrichkova, O., Ghashghaie, J., Gomez-Casanovas, N., Keitel, C., Knohl, A., Kuptz, D., Palacio, S., Salmon, Y., Uchida, Y., and Bahn, M.: Carbon allocation and carbon isotope fluxes in the plant-soil-atmosphere continuum: a review, Biogeosciences, 8, 3457–3489, https://doi.org/10.5194/bg-8-3457-2011, 2011.
Campioli, M., Gielen, B., Göckede, M., Papale, D., Bouriaud, O., and Granier, A.: Temporal variability of the NPP-GPP ratio at seasonal and interannual time scales in a temperate beech forest, Biogeosciences, 8, 2481–2492, https://doi.org/10.5194/bg-8-2481-2011, 2011.
Campioli, M., Verbeeck, H., Van den Bossche, J., Wu, J., Ibrom, A., D'Andrea, E., Matteucci, G., Samson, R., Steppe, K., and Granier, A.: Can decision rules simulate carbon allocation for years with contrasting and extreme weather conditions? A case study for three temperate beech forests, Ecol. Model., 263, 42–55, https://doi.org/10.1016/j.ecolmodel.2013.04.012, 2013.
Capdevielle-Vargas, R., Estrella, N., and Menzel, A.: Multiple-year assessment of phenological plasticity within a beech (Fagus sylvatica L.) stand in southern Germany, Agr. Forest Meteorol., 211–212, 13–22, https://doi.org/10.1016/j.agrformet.2015.03.019, 2015.
Casal, J. J. and Balasubramanian, S.: Thermomorphogenesis, Annu. Rev. Plant Biol., 70, 321–346, https://doi.org/10.1146/annurev-arplant-050718-095919, 2019.
Chiesi, M., Chirici, G., Marchetti, M., Hasenauer, H., Moreno, A., Knohl, A., Matteucci, G., Pilegaard, K., Granier, A., Longdoz, B., and Maselli, F.: Testing the applicability of BIOME-BGC to simulate beech gross primary production in Europe using a new continental weather dataset, Ann. For. Sci., 73, 713–727, https://doi.org/10.1007/s13595-016-0560-7, 2016.
Cieslik, S., Tuovinen, J.-P., Baumgarten, M., Matyssek, R., Brito, P., and Wieser, G.: Chapter 2 – Gaseous Exchange Between Forests and the Atmosphere, in: Developments in Environmental Science, vol. 13, edited by: Matyssek, R., Clarke, N., Cudlin, P., Mikkelsen, T. N., Tuovinen, J.-P., Wieser, G., and Paoletti, E., Elsevier, 19–36, https://doi.org/10.1016/B978-0-08-098349-3.00002-5, 2013.
Cochard, H., Coste, S., Chanson, B., Guehl, J. M., and Nicolini, E.: Hydraulic architecture correlates with bud organogenesis and primary shoot growth in beech (Fagus sylvatica), Tree Physiol., 25, 1545–1552, https://doi.org/10.1093/treephys/25.12.1545, 2005.
Čufar, K., Prislan, P., de Luis, M., and Gričar, J.: Tree-ring variation, wood formation and phenology of beech (Fagus sylvatica) from a representative site in Slovenia, SE Central Europe, Trees, 22, 749–758, https://doi.org/10.1007/s00468-008-0235-6, 2008.
Cuntz, M., Longdoz, B., and ICOS Ecosystem Thematic Centre: Warm winter 2020 ecosystem eddy covariance flux product from Hesse, ICOS Carbon Portal [data set], https://doi.org/10.18160/GFQX-22T7, 2022.
Davi, H., Barbaroux, C., Dufrêne, E., François, C., Montpied, P., Bréda, N., and Badeck, F.: Modelling leaf mass per area in forest canopy as affected by prevailing radiation conditions, Ecol. Model., 211, 339–349, https://doi.org/10.1016/j.ecolmodel.2007.09.012, 2008.
Delpierre, N., Soudani, K., François, C., Le Maire, G., Bernhofer, C., Kutsch, W., Misson, L., Rambal, S., Vesala, T., and Dufrêne, E.: Quantifying the influence of climate and biological drivers on the interannual variability of carbon exchanges in European forests through process-based modelling, Agr. Forest Meteorol., 154–155, 99–112, https://doi.org/10.1016/j.agrformet.2011.10.010, 2012.
Delpierre, N., Vitasse, Y., Chuine, I., Guillemot, J., Bazot, S., Rutishauser, T., and Rathgeber, C. B. K.: Temperate and boreal forest tree phenology: from organ-scale processes to terrestrial ecosystem models, Ann. For. Sci., 73, 5–25, https://doi.org/10.1007/s13595-015-0477-6, 2016.
Deluigi, J., Bachofen, C., Didion-Gency, M., Gisler, J., Mas, E., Mekarni, L., Poretti, A., Schaub, M., Vitasse, Y., and Grossiord, C.: Prolonged warming and drought reduce canopy-level net carbon uptake in beech and oak saplings despite photosynthetic and respiratory acclimation, New Phytol., 246, 2015–2028, https://doi.org/10.1111/nph.70111, 2025.
D'Orangeville, L., Maxwell, J., Kneeshaw, D., Pederson, N., Duchesne, L., Logan, T., Houle, D., Arseneault, D., Beier, C. M., Bishop, D. A., Druckenbrod, D., Fraver, S., Girard, F., Halman, J., Hansen, C., Hart, J. L., Hartmann, H., Kaye, M., Leblanc, D., Manzoni, S., Ouimet, R., Rayback, S., Rollinson, C. R., and Phillips, R. P.: Drought timing and local climate determine the sensitivity of eastern temperate forests to drought, Glob. Change Biol., 24, 2339–2351, https://doi.org/10.1111/gcb.14096, 2018.
Douglass, A. E.: Tree Rings and Climate, Sci. Mon., 21, 95–99, 1925.
Dufrêne, E., Davi, H., François, C., Maire, G. le, Dantec, V. L., and Granier, A.: Modelling carbon and water cycles in a beech forest: Part I: Model description and uncertainty analysis on modelled NEE, Ecol. Model., 185, 407–436, https://doi.org/10.1016/j.ecolmodel.2005.01.004, 2005.
Epron, D., Farque, L., Lucot, É., and Badot, P.-M.: Soil CO2 efflux in a beech forest: dependence on soil temperature and soil water content, Ann. For. Sci., 56, 221–226, https://doi.org/10.1051/forest:19990304, 1999.
Epron, D., Bahn, M., Derrien, D., Lattanzi, F. A., Pumpanen, J., Gessler, A., Högberg, P., Maillard, P., Dannoura, M., Gérant, D., and Buchmann, N.: Pulse-labelling trees to study carbon allocation dynamics: a review of methods, current knowledge and future prospects, Tree Physiol., 32, 776–798, https://doi.org/10.1093/treephys/tps057, 2012.
Eschrich, W., Burchardt, R., and Essiamah, S.: The induction of sun and shade leaves of the European beech (Fagus sylvatica L.): anatomical studies, Trees, 3, 1–10, https://doi.org/10.1007/BF00202394, 1989.
Fang, J., Lutz, J. A., Wang, L., Shugart, H. H., and Yan, X.: Using climate-driven leaf phenology and growth to improve predictions of gross primary productivity in North American forests, Glob. Change Biol., 26, 6974–6988, https://doi.org/10.1111/gcb.15349, 2020.
Farley, S. S., Dawson, A., Goring, S. J., and Williams, J. W.: Situating Ecology as a Big-Data Science: Current Advances, Challenges, and Solutions, BioScience, 68, 563–576, https://doi.org/10.1093/biosci/biy068, 2018.
Fox, S., Southam, P., Pantin, F., Kennaway, R., Robinson, S., Castorina, G., Sánchez-Corrales, Y. E., Sablowski, R., Chan, J., Grieneisen, V., Marée, A. F. M., Bangham, J. A., and Coen, E.: Spatiotemporal coordination of cell division and growth during organ morphogenesis, PLOS Biol., 16, e2005952, https://doi.org/10.1371/journal.pbio.2005952, 2018.
Fu, Y. H., Zhao, H., Piao, S., Peaucelle, M., Peng, S., Zhou, G., Ciais, P., Huang, M., Menzel, A., Peñuelas, J., Song, Y., Vitasse, Y., Zeng, Z., and Janssens, I. A.: Declining global warming effects on the phenology of spring leaf unfolding, Nature, 526, 104–107, https://doi.org/10.1038/nature15402, 2015.
Fu, Z., Ciais, P., Bastos, A., Stoy, P. C., Yang, H., Green, J. K., Wang, B., Yu, K., Huang, Y., Knohl, A., igut, L., Gharun, M., Cuntz, M., Arriga, N., Roland, M., Peichl, M., Migliavacca, M., Cremonese, E., Varlagin, A., Brümmer, C., Gourlez de la Motte, L., Fares, S., Buchmann, N., El-Madany, T. S., Pitacco, A., Vendrame, N., Li, Z., Vincke, C., Magliulo, E., and Koebsch, F.: Sensitivity of gross primary productivity to climatic drivers during the summer drought of 2018 in Europe, Philos. T. R. Soc. B, 375, 20190747, https://doi.org/10.1098/rstb.2019.0747, 2020.
Garthen, A., Brandt, K., Klisz, M., Malyshev, A. V., Peters, B., Weigel, R., and Kreyling, J.: Seasonal dynamics of fine root length in European beech: unveiling unexpected winter peaks and summer declines, Oecologia, 207, 31, https://doi.org/10.1007/s00442-025-05670-y, 2025.
Gázquez, A. and Beemster, G. T. S.: What determines organ size differences between species? A meta-analysis of the cellular basis, New Phytol., 215, 299–308, https://doi.org/10.1111/nph.14573, 2017.
Gea-Izquierdo, G. and Sánchez-González, M.: Forest disturbances and climate constrain carbon allocation dynamics in trees, Glob. Change Biol., 28, 4342–4358, https://doi.org/10.1111/gcb.16172, 2022.
Genet, H., Bréda, N., and Dufrêne, E.: Age-related variation in carbon allocation at tree and stand scales in beech (Fagus sylvatica L.) and sessile oak (Quercus petraea (Matt.) Liebl.) using a chronosequence approach, Tree Physiol., 30, 177–192, https://doi.org/10.1093/treephys/tpp105, 2010.
Gennaretti, F., Ogée, J., Sainte-Marie, J., and Cuntz, M.: Mining ecophysiological responses of European beech ecosystems to drought, Agr. Forest Meteorol., 280, 107780, https://doi.org/10.1016/j.agrformet.2019.107780, 2020.
Gessler, A. and Zweifel, R.: Beyond source and sink control – toward an integrated approach to understand the carbon balance in plants, New Phytol., 242, 858–869, https://doi.org/10.1111/nph.19611, 2024.
Geßler, A., Keitel, C., Kreuzwieser, J., Matyssek, R., Seiler, W., and Rennenberg, H.: Potential risks for European beech (Fagus sylvatica L.) in a changing climate, Trees, 21, 1–11, https://doi.org/10.1007/s00468-006-0107-x, 2007.
Gessler, A., Schaub, M., and McDowell, N. G.: The role of nutrients in drought-induced tree mortality and recovery, New Phytol., 214, 513–520, https://doi.org/10.1111/nph.14340, 2017.
Göckede, M., Foken, T., Aubinet, M., Aurela, M., Banza, J., Bernhofer, C., Bonnefond, J. M., Brunet, Y., Carrara, A., Clement, R., Dellwik, E., Elbers, J., Eugster, W., Fuhrer, J., Granier, A., Grünwald, T., Heinesch, B., Janssens, I. A., Knohl, A., Koeble, R., Laurila, T., Longdoz, B., Manca, G., Marek, M., Markkanen, T., Mateus, J., Matteucci, G., Mauder, M., Migliavacca, M., Minerbi, S., Moncrieff, J., Montagnani, L., Moors, E., Ourcival, J.-M., Papale, D., Pereira, J., Pilegaard, K., Pita, G., Rambal, S., Rebmann, C., Rodrigues, A., Rotenberg, E., Sanz, M. J., Sedlak, P., Seufert, G., Siebicke, L., Soussana, J. F., Valentini, R., Vesala, T., Verbeeck, H., and Yakir, D.: Quality control of CarboEurope flux data – Part 1: Coupling footprint analyses with flux data quality assessment to evaluate sites in forest ecosystems, Biogeosciences, 5, 433–450, https://doi.org/10.5194/bg-5-433-2008, 2008.
Goisser, M., Zang, U., Matzner, E., Borken, W., Häberle, K.-H., and Matyssek, R.: Growth of juvenile beech (Fagus sylvatica L.) upon transplant into a wind-opened spruce stand of heterogeneous light and water conditions, Forest Ecol. Manag., 310, 110–119, https://doi.org/10.1016/j.foreco.2013.08.006, 2013.
Gond, V., de Pury, D. G. G., Veroustraete, F., and Ceulemans, R.: Seasonal variations in leaf area index, leaf chlorophyll, and water content; scaling-up to estimate fAPAR and carbon balance in a multilayer, multispecies temperate forest, Tree Physiol., 19, 673–679, https://doi.org/10.1093/treephys/19.10.673, 1999.
Granier, A., Bréda, N., Biron, P., and Villette, S.: A lumped water balance model to evaluate duration and intensity of drought constraints in forest stands, Ecol. Model., 116, 269–283, https://doi.org/10.1016/S0304-3800(98)00205-1, 1999.
Granier, A., Reichstein, M., Bréda, N., Janssens, I. A., Falge, E., Ciais, P., Grünwald, T., Aubinet, M., Berbigier, P., Bernhofer, C., Buchmann, N., Facini, O., Grassi, G., Heinesch, B., Ilvesniemi, H., Keronen, P., Knohl, A., Köstner, B., Lagergren, F., Lindroth, A., Longdoz, B., Loustau, D., Mateus, J., Montagnani, L., Nys, C., Moors, E., Papale, D., Peiffer, M., Pilegaard, K., Pita, G., Pumpanen, J., Rambal, S., Rebmann, C., Rodrigues, A., Seufert, G., Tenhunen, J., Vesala, T., and Wang, Q.: Evidence for soil water control on carbon and water dynamics in European forests during the extremely dry year: 2003, Agr. Forest Meteorol., 143, 123–145, https://doi.org/10.1016/j.agrformet.2006.12.004, 2007.
Granier, A., Bréda, N., Longdoz, B., Gross, P., and Ngao, J.: Ten years of fluxes and stand growth in a young beech forest at Hesse, North-eastern France, Ann. For. Sci., 65, 704–704, https://doi.org/10.1051/forest:2008052, 2008.
Granier, C. and Tardieu, F.: Leaf expansion and cell division are affected by reducing absorbed light before but not after the decline in cell division rate in the sunflower leaf, Plant Cell Environ., 22, 1365–1376, https://doi.org/10.1046/j.1365-3040.1999.00497.x, 1999.
Granier, C. and Tardieu, F.: Multi-scale phenotyping of leaf expansion in response to environmental changes: the whole is more than the sum of parts, Plant Cell Environ., 32, 1175–1184, https://doi.org/10.1111/j.1365-3040.2009.01955.x, 2009.
Green, J. K.: The intricacies of vegetation responses to changing moisture conditions, New Phytol., 244, 2156–2162, https://doi.org/10.1111/nph.20182, 2024.
Grossiord, C., Buckley, T. N., Cernusak, L. A., Novick, K. A., Poulter, B., Siegwolf, R. T. W., Sperry, J. S., and McDowell, N. G.: Plant responses to rising vapor pressure deficit, New Phytol., 226, 1550–1566, https://doi.org/10.1111/nph.16485, 2020.
Guidolotti, G., Rey, A., D'Andrea, E., Matteucci, G., and De Angelis, P.: Effect of environmental variables and stand structure on ecosystem respiration components in a Mediterranean beech forest, Tree Physiol., 33, 960–972, https://doi.org/10.1093/treephys/tpt065, 2013.
Guillemot, J., Martin-StPaul, N. K., Dufrêne, E., François, C., Soudani, K., Ourcival, J. M., and Delpierre, N.: The dynamic of the annual carbon allocation to wood in European tree species is consistent with a combined source–sink limitation of growth: implications for modelling, Biogeosciences, 12, 2773–2790, https://doi.org/10.5194/bg-12-2773-2015, 2015.
Guo, Z., Still, C. J., Lee, C. K. F., Ryu, Y., Blonder, B., Wang, J., Bonebrake, T. C., Hughes, A., Li, Y., Yeung, H. C. H., Zhang, K., Law, Y. K., Lin, Z., and Wu, J.: Does plant ecosystem thermoregulation occur? An extratropical assessment at different spatial and temporal scales, New Phytol., 238, 1004–1018, https://doi.org/10.1111/nph.18632, 2023.
Hájíčková, M., Plichta, R., Volařík, D., Urban, J., Matouková, M., and Gebauer, R.: Xylem function and leaf physiology in European beech saplings during and after moderate and severe drought stress, For. Int. J. For. Res., 97, 213–222, https://doi.org/10.1093/forestry/cpad032, 2024.
Hartmann, H. and Trumbore, S.: Understanding the roles of nonstructural carbohydrates in forest trees – from what we can measure to what we want to know, New Phytol., 211, 386–403, https://doi.org/10.1111/nph.13955, 2016.
Hartmann, H., Bahn, M., Carbone, M., and Richardson, A. D.: Plant carbon allocation in a changing world – challenges and progress: introduction to a Virtual Issue on carbon allocation, New Phytol., 227, 981–988, https://doi.org/10.1111/nph.16757, 2020.
Henneken, R., Dose, V., Schleip, C., and Menzel, A.: Detecting plant seasonality from webcams using Bayesian multiple change point analysis, Agr. Forest Meteorol., 168, 177–185, https://doi.org/10.1016/j.agrformet.2012.09.001, 2013.
Henry, M., Bombelli, A., Trotta, C., Alessandrini, A., Birigazzi, L., Sola, G., Vieilledent, G., Santenoise, P., Longuetaud, F., Valentini, R., Picard, N., and Saint-André, L.: GlobAllomeTree: international platform for tree allometric equations to support volume, biomass and carbon assessment, IForest – Biogeosciences For., 6, 326, https://doi.org/10.3832/ifor0901-006, 2013.
Hesse, B. D., Gebhardt, T., Hafner, B. D., Hikino, K., Reitsam, A., Gigl, M., Dawid, C., Häberle, K.-H., and Grams, T. E. E.: Physiological recovery of tree water relations upon drought release–response of mature beech and spruce after five years of recurrent summer drought, Tree Physiol., 43, 522–538, https://doi.org/10.1093/treephys/tpac135, 2023.
Hoch, G., Siegwolf, R. T. W., Keel, S. G., Körner, C., and Han, Q.: Fruit production in three masting tree species does not rely on stored carbon reserves, Oecologia, 171, 653–662, https://doi.org/10.1007/s00442-012-2579-2, 2013.
Houghton, R. A.: Terrestrial sources and sinks of carbon inferred from terrestrial data, Tellus B, 48, 420–432, https://doi.org/10.1034/j.1600-0889.1996.t01-3-00002.x, 1996.
Kannenberg, S. A., Schwalm, C. R., and Anderegg, W. R. L.: Ghosts of the past: how drought legacy effects shape forest functioning and carbon cycling, Ecol. Lett., 23, 891–901, https://doi.org/10.1111/ele.13485, 2020.
Kaplan, F., Kopka, J., Haskell, D. W., Zhao, W., Schiller, K. C., Gatzke, N., Sung, D. Y., and Guy, C. L.: Exploring the Temperature-Stress Metabolome of Arabidopsis, Plant Physiol., 136, 4159–4168, https://doi.org/10.1104/pp.104.052142, 2004.
Keel, S. G. and Schädel, C.: Expanding leaves of mature deciduous forest trees rapidly become autotrophic, Tree Physiol., 30, 1253–1259, https://doi.org/10.1093/treephys/tpq071, 2010.
Keel, S. G., Siegwolf, R. T. w., Jäggi, M., and Körner, C.: Rapid mixing between old and new C pools in the canopy of mature forest trees, Plant Cell Environ., 30, 963–972, https://doi.org/10.1111/j.1365-3040.2007.01688.x, 2007.
Kikuzawa, K. and Lechowicz, M. J.: Ecology of Leaf Longevity, Springer, Tokyo, https://doi.org/10.1007/978-4-431-53918-6, 2011.
Kim, G.-T., Yano, S., Kozuka, T., and Tsukaya, H.: Photomorphogenesis of leaves: shade-avoidance and differentiation of sun and shade leaves, Photochem. Photobio. S., 4, 770–774, https://doi.org/10.1039/b418440h, 2005.
Klein, T., Vitasse, Y., and Hoch, G.: Coordination between growth, phenology and carbon storage in three coexisting deciduous tree species in a temperate forest, Tree Physiol., 36, 847–855, https://doi.org/10.1093/treephys/tpw030, 2016.
Koike, T., Kitao, M., Maruyama, Y., Mori, S., and Lei, T. T.: Leaf morphology and photosynthetic adjustments among deciduous broad-leaved trees within the vertical canopy profile, Tree Physiol., 21, 951–958, https://doi.org/10.1093/treephys/21.12-13.951, 2001.
Kukk, M. and Sõber, A.: Bud development and shoot morphology in relation to crown location, AoB PLANTS, 7, plv082, https://doi.org/10.1093/aobpla/plv082, 2015.
Kukk, M., Räim, O., Tulva, I., Sõber, J., Lõhmus, K., and Sõber, A.: Elevated air humidity modulates bud size and the frequency of bud break in fast-growing deciduous trees: silver birch (Betula pendula Roth.) and hybrid aspen (Populus tremula L. × P. tremuloides Michx.), Trees, 29, 1381–1393, https://doi.org/10.1007/s00468-015-1215-2, 2015.
Kuptz, D., Fleischmann, F., Matyssek, R., and Grams, T. E. E.: Seasonal patterns of carbon allocation to respiratory pools in 60-yr-old deciduous (Fagus sylvatica) and evergreen (Picea abies) trees assessed via whole-tree stable carbon isotope labeling, New Phytol., 191, 160–172, https://doi.org/10.1111/j.1469-8137.2011.03676.x, 2011.
Latte, N., Lebourgeois, F., and Claessens, H.: Increased tree-growth synchronization of beech (Fagus sylvatica L.) in response to climate change in northwestern Europe, Dendrochronologia, 33, 69–77, https://doi.org/10.1016/j.dendro.2015.01.002, 2015.
Lebaube, S., Goff, N. L., Ottorini, J.-M., and Granier, A.: Carbon balance and tree growth in a Fagus sylvatica stand, Ann. For. Sci., 57, 49–61, https://doi.org/10.1051/forest:2000100, 2000.
Lebourgeois, F., Bréda, N., Ulrich, E., and Granier, A.: Climate-tree-growth relationships of European beech (Fagus sylvatica L.) in the French Permanent Plot Network (RENECOFOR), Trees, 19, 385–401, https://doi.org/10.1007/s00468-004-0397-9, 2005.
Lebourgeois, F., Delpierre, N., Dufrêne, E., Cecchini, S., Macé, S., Croisé, L., and Nicolas, M.: Fructification du Hêtre et des Chênes en France : rôle des températures, du pollen et du bilan de carbone et relation avec la croissance des peuplements, Rev. For. Fr., 71, 29–60, https://doi.org/10.4267/2042/70518, 2019.
Le Dantec, V., Dufrêne, E., and Saugier, B.: Interannual and spatial variation in maximum leaf area index of temperate deciduous stands, Forest Ecol. Manag., 134, 71–81, https://doi.org/10.1016/S0378-1127(99)00246-7, 2000.
Le Goff, N. and Ottorini, J.-M.: Root biomass and biomass increment in a beech (Fagus sylvatica L.) stand in North-East France, Ann. For. Sci., 58, 1–13, https://doi.org/10.1051/forest:2001104, 2001.
Legris, M.: Light and temperature regulation of leaf morphogenesis in Arabidopsis, New Phytol., 240, 2191–2196, https://doi.org/10.1111/nph.19258, 2023.
Leuschner, C.: Drought response of European beech (Fagus sylvatica L.) – A review, Perspect. Plant Ecol. Evol. Syst., 47, 125576, https://doi.org/10.1016/j.ppees.2020.125576, 2020.
Leuschner, C., Backes, K., Hertel, D., Schipka, F., Schmitt, U., Terborg, O., and Runge, M.: Drought responses at leaf, stem and fine root levels of competitive Fagus sylvatica L. and Quercus petraea (Matt.) Liebl. trees in dry and wet years, Forest Ecol. Manag., 149, 33–46, https://doi.org/10.1016/S0378-1127(00)00543-0, 2001.
Liang, C., Zhang, M., Wang, Z., Xiang, X., Gong, H., Wang, K., and Liu, H.: The strengthened impact of water availability at interannual and decadal time scales on vegetation GPP, Glob. Change Biol., 30, e17138, https://doi.org/10.1111/gcb.17138, 2024.
Lichtenthaler, H. K., Buschmann, C., Döll, M., Fietz, H.-J., Bach, T., Kozel, U., Meier, D., and Rahmsdorf, U.: Photosynthetic activity, chloroplast ultrastructure, and leaf characteristics of high-light and low-light plants and of sun and shade leaves, Photosynth. Res., 2, 115–141, https://doi.org/10.1007/BF00028752, 1981.
Liu, L., Gudmundsson, L., Hauser, M., and Seneviratne, S. I.: Reply to: Large influence of atmospheric vapor pressure deficit on ecosystem production efficiency, Nat. Commun., 13, 1654, https://doi.org/10.1038/s41467-022-29010-3, 2022.
Lu, H., Qin, Z., Lin, S., Chen, X., Chen, B., He, B., Wei, J., and Yuan, W.: Large influence of atmospheric vapor pressure deficit on ecosystem production efficiency, Nat. Commun., 13, 1653, https://doi.org/10.1038/s41467-022-29009-w, 2022.
Luo, Y., Zohner, C., Crowther, T. W., Feng, J., Hoch, G., Li, P., Richardson, A. D., Vitasse, Y., and Gessler, A.: Internal physiological drivers of leaf development in trees: Understanding the relationship between non-structural carbohydrates and leaf phenology, Funct. Ecol., 1–14, https://doi.org/10.1111/1365-2435.14694, 2024.
Ma, Z., Buckley, T. N., and Sack, L.: The determination of leaf size on the basis of developmental traits, New Phytol., 246, 461–480, https://doi.org/10.1111/nph.20461, 2025.
Meier, I. C. and Leuschner, C.: Leaf Size and Leaf Area Index in Fagus sylvatica Forests: Competing Effects of Precipitation, Temperature, and Nitrogen Availability, Ecosystems, 11, 655–669, https://doi.org/10.1007/s10021-008-9135-2, 2008.
Merganičová, K., Merganič, J., Lehtonen, A., Vacchiano, G., Sever, M. Z. O., Augustynczik, A. L. D., Grote, R., Kyselová, I., Mäkelä, A., Yousefpour, R., Krejza, J., Collalti, A., and Reyer, C. P. O.: Forest carbon allocation modelling under climate change, Tree Physiol., 39, 1937–1960, https://doi.org/10.1093/treephys/tpz105, 2019.
Migliavacca, M., Reichstein, M., Richardson, A. D., Mahecha, M. D., Cremonese, E., Delpierre, N., Galvagno, M., Law, B. E., Wohlfahrt, G., Andrew Black, T., Carvalhais, N., Ceccherini, G., Chen, J., Gobron, N., Koffi, E., William Munger, J., Perez-Priego, O., Robustelli, M., Tomelleri, E., and Cescatti, A.: Influence of physiological phenology on the seasonal pattern of ecosystem respiration in deciduous forests, Glob. Change Biol., 21, 363–376, https://doi.org/10.1111/gcb.12671, 2015.
Monks, P. S., Granier, C., Fuzzi, S., Stohl, A., Williams, M. L., Akimoto, H., Amann, M., Baklanov, A., Baltensperger, U., Bey, I., Blake, N., Blake, R. S., Carslaw, K., Cooper, O. R., Dentener, F., Fowler, D., Fragkou, E., Frost, G. J., Generoso, S., Ginoux, P., Grewe, V., Guenther, A., Hansson, H. C., Henne, S., Hjorth, J., Hofzumahaus, A., Huntrieser, H., Isaksen, I. S. A., Jenkin, M. E., Kaiser, J., Kanakidou, M., Klimont, Z., Kulmala, M., Laj, P., Lawrence, M. G., Lee, J. D., Liousse, C., Maione, M., McFiggans, G., Metzger, A., Mieville, A., Moussiopoulos, N., Orlando, J. J., O'Dowd, C. D., Palmer, P. I., Parrish, D. D., Petzold, A., Platt, U., Pöschl, U., Prévôt, A. S. H., Reeves, C. E., Reimann, S., Rudich, Y., Sellegri, K., Steinbrecher, R., Simpson, D., ten Brink, H., Theloke, J., van der Werf, G. R., Vautard, R., Vestreng, V., Vlachokostas, Ch., and von Glasow, R.: Atmospheric composition change – global and regional air quality, Atmos. Environ., 43, 5268–5350, https://doi.org/10.1016/j.atmosenv.2009.08.021, 2009.
Montpied, P., Granier, A., and Dreyer, E.: Seasonal time-course of gradients of photosynthetic capacity and mesophyll conductance to CO2 across a beech (Fagus sylvatica L.) canopy, J. Exp. Bot., 60, 2407–2418, https://doi.org/10.1093/jxb/erp093, 2009.
Moreaux, V., Longdoz, B., Berveiller, D., Delpierre, N., Dufrêne, E., Bonnefond, J.-M., Chipeaux, C., Joffre, R., Limousin, J.-M., Ourcival, J.-M., Klumpp, K., Darsonville, O., Brut, A., Tallec, T., Ceschia, E., Panthou, G., and Loustau, D.: Environmental control of land-atmosphere CO2 fluxes from temperate ecosystems: a statistical approach based on homogenized time series from five land-use types, Tellus B, 72, 1–25, https://doi.org/10.1080/16000889.2020.1784689, 2020.
Morley, P. J., Jump, A. S., West, M. D., and Donoghue, D. N. M.: Spectral response of chlorophyll content during leaf senescence in European beech trees, Environ. Res. Commun., 2, 071002, https://doi.org/10.1088/2515-7620/aba7a0, 2020.
Morot-Gaudry, J.-F., Maurel, C., Moreau, F., Prat, R., and Sentenac, H.: Biologie végétale: Nutrition et métabolisme, 3e édn., Dunod, Paris, 256 pp., ISBN: 978-2-10-0758876, 2021.
Müller-Haubold, H., Hertel, D., Seidel, D., Knutzen, F., and Leuschner, C.: Climate Responses of Aboveground Productivity and Allocation in Fagus sylvatica: A Transect Study in Mature Forests, Ecosystems, 16, 1498–1516, https://doi.org/10.1007/s10021-013-9698-4, 2013.
Noyer, E., Stojanović, M., Horáček, P., and Pérez-de-Lis, G.: Toward a better understanding of angiosperm xylogenesis: a new method for a cellular approach, New Phytol., 239, 792–805, https://doi.org/10.1111/nph.18959, 2023.
Öztürk, M., Bolat, İ., and Ergün, A.: Influence of air–soil temperature on leaf expansion and LAI of Carpinus betulus trees in a temperate urban forest patch, Agr. Forest Meteorol., 200, 185–191, https://doi.org/10.1016/j.agrformet.2014.09.014, 2015.
Pantin, F., Simonneau, T., and Muller, B.: Coming of leaf age: control of growth by hydraulics and metabolics during leaf ontogeny, New Phytol., 196, 349–366, https://doi.org/10.1111/j.1469-8137.2012.04273.x, 2012.
Parent, B., Turc, O., Gibon, Y., Stitt, M., and Tardieu, F.: Modelling temperature-compensated physiological rates, based on the co-ordination of responses to temperature of developmental processes, J. Exp. Bot., 61, 2057–2069, https://doi.org/10.1093/jxb/erq003, 2010.
Pendergrass, A. G., Meehl, G. A., Pulwarty, R., Hobbins, M., Hoell, A., AghaKouchak, A., Bonfils, C. J. W., Gallant, A. J. E., Hoerling, M., Hoffmann, D., Kaatz, L., Lehner, F., Llewellyn, D., Mote, P., Neale, R. B., Overpeck, J. T., Sheffield, A., Stahl, K., Svoboda, M., Wheeler, M. C., Wood, A. W., and Woodhouse, C. A.: Flash droughts present a new challenge for subseasonal-to-seasonal prediction, Nat. Clim. Change, 10, 191–199, https://doi.org/10.1038/s41558-020-0709-0, 2020.
Penfield, S.: Temperature perception and signal transduction in plants, New Phytol., 179, 615–628, https://doi.org/10.1111/j.1469-8137.2008.02478.x, 2008.
Perry, T. O.: Dormancy of Trees in Winter, Science, 171, 29–36, https://doi.org/10.1126/science.171.3966.29, 1971.
Pilegaard, K., Ibrom, A., Courtney, M. S., Hummelshøj, P., and Jensen, N. O.: Increasing net CO2 uptake by a Danish beech forest during the period from 1996 to 2009, Agr. Forest Meteorol., 151, 934–946, https://doi.org/10.1016/j.agrformet.2011.02.013, 2011.
Poorter, H., Niinemets, Ü., Poorter, L., Wright, I. J., and Villar, R.: Causes and consequences of variation in leaf mass per area (LMA): a meta-analysis, New Phytol., 182, 565–588, https://doi.org/10.1111/j.1469-8137.2009.02830.x, 2009.
Poorter, H., Niklas, K. J., Reich, P. B., Oleksyn, J., Poot, P., and Mommer, L.: Biomass allocation to leaves, stems and roots: meta-analyses of interspecific variation and environmental control, New Phytol., 193, 30–50, https://doi.org/10.1111/j.1469-8137.2011.03952.x, 2012.
Pretzsch, H.: Forest Dynamics, Growth and Yield: From Measurement to Model, Springer, Berlin, Heidelberg, https://doi.org/10.1007/978-3-540-88307-4, 2009.
Prislan, P., Gričar, J., Čufar, K., de Luis, M., Merela, M., and Rossi, S.: Growing season and radial growth predicted for Fagus sylvatica under climate change, Clim. Change, 153, 181–197, https://doi.org/10.1007/s10584-019-02374-0, 2019.
Roloff, A.: Morphologie der Kronenentwicklung von Fagus sylvatica L. (Rotbuche) unter besonderer Berücksichtigung neuartiger Veränderungen1), Flora, 179, 355–378, https://doi.org/10.1016/S0367-2530(17)30269-4, 1987.
Ruehr, N. K., Offermann, C. A., Gessler, A., Winkler, J. B., Ferrio, J. P., Buchmann, N., and Barnard, R. L.: Drought effects on allocation of recent carbon: from beech leaves to soil CO2 efflux, New Phytol., 184, 950–961, https://doi.org/10.1111/j.1469-8137.2009.03044.x, 2009.
Sack, L., Scoffoni, C., McKown, A. D., Frole, K., Rawls, M., Havran, J. C., Tran, H., and Tran, T.: Developmentally based scaling of leaf venation architecture explains global ecological patterns, Nat. Commun., 3, 837, https://doi.org/10.1038/ncomms1835, 2012.
Satomura, T., Hashimoto, Y., Koizumi, H., Nakane, K., and Horikoshi, T.: Seasonal patterns of fine root demography in a cool-temperate deciduous forest in central Japan, Ecol. Res., 21, 741–753, https://doi.org/10.1007/s11284-006-0182-x, 2006.
Savvides, A., Dieleman, J. A., van Ieperen, W., and Marcelis, L. F. M.: A unique approach to demonstrating that apical bud temperature specifically determines leaf initiation rate in the dicot Cucumis sativus, Planta, 243, 1071–1079, https://doi.org/10.1007/s00425-015-2464-4, 2016.
Schädel, C., Blöchl, A., Richter, A., and Hoch, G.: Short-term dynamics of nonstructural carbohydrates and hemicelluloses in young branches of temperate forest trees during bud break, Tree Physiol., 29, 901–911, https://doi.org/10.1093/treephys/tpp034, 2009.
Scharnweber, T., Manthey, M., Criegee, C., Bauwe, A., Schröder, C., and Wilmking, M.: Drought matters – Declining precipitation influences growth of Fagus sylvatica L. and Quercus robur L. in north-eastern Germany, Forest Ecol. Manag., 262, 947–961, https://doi.org/10.1016/j.foreco.2011.05.026, 2011.
Schimming, C.-G., Augustin, S., and Karez, R.: The Scientific Potential of Environmental Monitoring, in: Long-Term Ecological Research: Between Theory and Application, edited by: Müller, F., Baessler, C., Schubert, H., and Klotz, S., Springer Netherlands, Dordrecht, 39–55, https://doi.org/10.1007/978-90-481-8782-9_4, 2010.
Schulze, E. D., Bouriaud, O., Irslinger, R., and Valentini, R.: The role of wood harvest from sustainably managed forests in the carbon cycle, Ann. For. Sci., 79, 17, https://doi.org/10.1186/s13595-022-01127-x, 2022.
Sevanto, S. and Dickman, L. T.: Where does the carbon go?—Plant carbon allocation under climate change, Tree Physiol., 35, 581–584, https://doi.org/10.1093/treephys/tpv059, 2015.
Shao, J., Zhou, X., Luo, Y., Li, B., Aurela, M., Billesbach, D., Blanken, P. D., Bracho, R., Chen, J., Fischer, M., Fu, Y., Gu, L., Han, S., He, Y., Kolb, T., Li, Y., Nagy, Z., Niu, S., Oechel, W. C., Pinter, K., Shi, P., Suyker, A., Torn, M., Varlagin, A., Wang, H., Yan, J., Yu, G., and Zhang, J.: Biotic and climatic controls on interannual variability in carbon fluxes across terrestrial ecosystems, Agr. Forest Meteorol., 205, 11–22, https://doi.org/10.1016/j.agrformet.2015.02.007, 2015.
Sheppard, P. R.: Dendroclimatology: extracting climate from trees, WIREs Clim. Change, 1, 343–352, https://doi.org/10.1002/wcc.42, 2010.
Skvareninova, J., Sitko, R., Vido, J., Snopková, Z., and Skvarenina, J.: Phenological response of European beech (Fagus sylvatica L.) to climate change in the Western Carpathian climatic-geographical zones, Front. Plant Sci., 15, https://doi.org/10.3389/fpls.2024.1242695, 2024.
Slovíková, K. and Bednářová, E.: Monitoring of Vegetative Phenological Stages in European Beech (Fagus sylvatica L.) Growing in a Mixed Stand, Acta Univ. Agric. Silvic. Mendel. Brun., 62, 1109–1115, https://doi.org/10.11118/actaun201462051109, 2014.
Sperling, O., Silva, L. C. R., Tixier, A., Théroux-Rancourt, G., and Zwieniecki, M. A.: Temperature gradients assist carbohydrate allocation within trees, Sci. Rep., 7, 3265, https://doi.org/10.1038/s41598-017-03608-w, 2017.
Stagakis, S., Markos, N., Vanikiotis, T., Levizou, E., and Kyparissis, A.: Multi-Year Monitoring of Deciduous Forests Ecophysiology and the Role of Temperature and Precipitation as Controlling Factors, Plants, 11, 2257, https://doi.org/10.3390/plants11172257, 2022.
Tang, Y., Schiestl-Aalto, P., Saurer, M., Sahlstedt, E., Kulmala, L., Kolari, P., Ryhti, K., Salmon, Y., Jyske, T., Ding, Y., Bäck, J., and Rinne-Garmston, K. T.: Tree organ growth and carbon allocation dynamics impact the magnitude and δ13C signal of stem and soil CO2 fluxes, Tree Physiol., 42, 2404–2418, https://doi.org/10.1093/treephys/tpac079, 2022.
Tardieu, F., Granier, C., and Muller, B.: Modelling leaf expansion in a fluctuating environment: are changes in specific leaf area a consequence of changes in expansion rate?, New Phytol., 143, 33–43, https://doi.org/10.1046/j.1469-8137.1999.00433.x, 1999.
Teissier du Cros, E. (Ed.): Le hêtre, Quae, Versailles, 616 pp., ISBN: 978-2-7592-3858-3, 1981.
The MathWorks Inc.: MATLAB, version 9.12.0 (R2022a), The MathWorks Inc. [software], Natick, MA, USA, https://www.mathworks.com (last access: 28 August 2026), 2022.
Thiébaut, B. and Puech, S.: Développement du Hêtre commun. Morphologie et architecture de l'arbre. 2e partie: le développement des arbres, Rev. For. Fr., 36, 45–58, https://doi.org/10.4267/2042/21705, 1984.
Thomas, F. M., Preusser, S., Backes, B., and Werner, W.: Leaf traits of Central-European beech (Fagus sylvatica) and oaks (Quercus petraea/robur): Effects of severe drought and long-term dynamics, Forest Ecol. Manag., 559, 121823, https://doi.org/10.1016/j.foreco.2024.121823, 2024.
Tognetti, R., Johnson, J. D., and Michelozzi, M.: The response of European beech (Fagus sylvatica L.) seedlings from two Italian populations to drought and recovery, Trees, 9, 348–354, https://doi.org/10.1007/BF00202499, 1995.
Tomasella, M., Nardini, A., Hesse, B. D., Machlet, A., Matyssek, R., and Häberle, K.-H.: Close to the edge: effects of repeated severe drought on stem hydraulics and non-structural carbohydrates in European beech saplings, Tree Physiol., 39, 717–728, https://doi.org/10.1093/treephys/tpy142, 2019.
Tsukaya, H.: Developmental genetics of leaf morphogenesis in dicotyledonous plants, J. Plant Res., 108, 407–416, https://doi.org/10.1007/BF02344229, 1995.
Uemura, A., Ishida, A., Nakano, T., Terashima, I., Tanabe, H., and Matsumoto, Y.: Acclimation of leaf characteristics of Fagus species to previous-year and current-year solar irradiances, Tree Physiol., 20, 945–951, https://doi.org/10.1093/treephys/20.14.945, 2000.
Ulrich, D. E. M. and Grossiord, C.: Faster drought recovery in anisohydric beech compared with isohydric spruce, Tree Physiol., 43, 517–521, https://doi.org/10.1093/treephys/tpad009, 2023.
Urban, J., Bednárová, E., Plichta, R., Gryc, V., Vavrčík, H., Hacura, J., Fajstavr, M., and Kučera, J.: Links between phenology and ecophysiology in a European beech forest, IForest – Biogeosciences For., 8, 438, https://doi.org/10.3832/ifor1307-007, 2014.
Van Volkenburgh, E.: Leaf expansion – an integrating plant behaviour, Plant Cell Environ., 22, 1463–1473, https://doi.org/10.1046/j.1365-3040.1999.00514.x, 1999.
Verbeeck, H., Samson, R., Granier, A., Montpied, P., and Lemeur, R.: Multi-year model analysis of GPP in a temperate beech forest in France, Ecol. Model., 210, 85–103, https://doi.org/10.1016/j.ecolmodel.2007.07.010, 2008.
Vesala, T., Suni, T., Rannik, Ü., Keronen, P., Markkanen, T., Sevanto, S., Grönholm, T., Smolander, S., Kulmala, M., Ilvesniemi, H., Ojansuu, R., Uotila, A., Levula, J., Mäkelä, A., Pumpanen, J., Kolari, P., Kulmala, L., Altimir, N., Berninger, F., Nikinmaa, E., and Hari, P.: Effect of thinning on surface fluxes in a boreal forest, Global Biogeochem. Cy., 19, https://doi.org/10.1029/2004GB002316, 2005.
Vicca, S., Balzarolo, M., Filella, I., Granier, A., Herbst, M., Knohl, A., Longdoz, B., Mund, M., Nagy, Z., Pintér, K., Rambal, S., Verbesselt, J., Verger, A., Zeileis, A., Zhang, C., and Peñuelas, J.: Remotely-sensed detection of effects of extreme droughts on gross primary production, Sci. Rep., 6, 28269, https://doi.org/10.1038/srep28269, 2016.
Vitasse, Y.: Ontogenic changes rather than difference in temperature cause understory trees to leaf out earlier, New Phytol., 198, 149–155, https://doi.org/10.1111/nph.12130, 2013.
Walthert, L., Ganthaler, A., Mayr, S., Saurer, M., Waldner, P., Walser, M., Zweifel, R., and von Arx, G.: From the comfort zone to crown dieback: Sequence of physiological stress thresholds in mature European beech trees across progressive drought, Sci. Total Environ., 753, 141792, https://doi.org/10.1016/j.scitotenv.2020.141792, 2021.
Wankmüller, F. J. P., Delval, L., Lehmann, P., Baur, M. J., Cecere, A., Wolf, S., Or, D., Javaux, M., and Carminati, A.: Global influence of soil texture on ecosystem water limitation, Nature, 635, 631–638, https://doi.org/10.1038/s41586-024-08089-2, 2024.
Wright, I. J., Dong, N., Maire, V., Prentice, I. C., Westoby, M., Díaz, S., Gallagher, R. V., Jacobs, B. F., Kooyman, R., Law, E. A., Leishman, M. R., Niinemets, Ü., Reich, P. B., Sack, L., Villar, R., Wang, H., and Wilf, P.: Global climatic drivers of leaf size, Science, 357, 917–921, https://doi.org/10.1126/science.aal4760, 2017.
Wu, C., Chen, J. M., Black, T. A., Price, D. T., Kurz, W. A., Desai, A. R., Gonsamo, A., Jassal, R. S., Gough, C. M., Bohrer, G., Dragoni, D., Herbst, M., Gielen, B., Berninger, F., Vesala, T., Mammarella, I., Pilegaard, K., and Blanken, P. D.: Interannual variability of net ecosystem productivity in forests is explained by carbon flux phenology in autumn, Global Ecol. Biogeogr., 22, 994–1006, https://doi.org/10.1111/geb.12044, 2013.
Wullschleger, S. D. and Hanson, P. J.: Sensitivity of canopy transpiration to altered precipitation in an upland oak forest: evidence from a long-term field manipulation study, Glob. Change Biol., 12, 97–109, https://doi.org/10.1111/j.1365-2486.2005.001082.x, 2006.
Wutzler, T., Lucas-Moffat, A., Migliavacca, M., Knauer, J., Sickel, K., Šigut, L., Menzer, O., and Reichstein, M.: Basic and extensible post-processing of eddy covariance flux data with REddyProc, Biogeosciences, 15, 5015–5030, https://doi.org/10.5194/bg-15-5015-2018, 2018.
Yang, H., Yang, X., Heskel, M., Sun, S., and Tang, J.: Seasonal variations of leaf and canopy properties tracked by ground-based NDVI imagery in a temperate forest, Sci. Rep., 7, 1267, https://doi.org/10.1038/s41598-017-01260-y, 2017.
Yang, X., Li, R., Jablonski, A., Stovall, A., Kim, J., Yi, K., Ma, Y., Beverly, D., Phillips, R., Novick, K., Xu, X., and Lerdau, M.: Leaf angle as a leaf and canopy trait: Rejuvenating its role in ecology with new technology, Ecol. Lett., 26, 1005–1020, https://doi.org/10.1111/ele.14215, 2023.
Yang, Y., Ouyang, S., Gessler, A., Wang, X., Na, R., He, H. S., Wu, Z., and Li, M.-H.: Root Carbon Resources Determine Survival and Growth of Young Trees Under Long Drought in Combination With Fertilization, Front. Plant Sci., 13, https://doi.org/10.3389/fpls.2022.929855, 2022.
Yu, X., Orth, R., Reichstein, M., Bahn, M., Klosterhalfen, A., Knohl, A., Koebsch, F., Migliavacca, M., Mund, M., Nelson, J. A., Stocker, B. D., Walther, S., and Bastos, A.: Contrasting drought legacy effects on gross primary productivity in a mixed versus pure beech forest, Biogeosciences, 19, 4315–4329, https://doi.org/10.5194/bg-19-4315-2022, 2022.
Zahnd, C., Arend, M., Kahmen, A., and Hoch, G.: Microclimatic gradients cause phenological variations within temperate tree canopies in autumn but not in spring, Agr. Forest Meteorol., 331, 109340, https://doi.org/10.1016/j.agrformet.2023.109340, 2023.
Zahnd, C., Zehnder, M., Arend, M., Kahmen, A., and Hoch, G.: Uniform carbon reserve dynamics along the vertical light gradient in mature tree crowns, Tree Physiol., 44, 232–245, https://doi.org/10.1093/treephys/tpae005, 2024.
Zang, U., Goisser, M., Grams, T. E. E., Häberle, K.-H., Matyssek, R., Matzner, E., and Borken, W.: Fate of recently fixed carbon in European beech (Fagus sylvatica) saplings during drought and subsequent recovery, Tree Physiol., 34, 29–38, https://doi.org/10.1093/treephys/tpt110, 2014.
Zhao, Y., Xiong, L., Yin, J., Zha, X., Li, W., and Han, Y.: Understanding the effects of flash drought on vegetation photosynthesis and potential drivers over China, Sci. Total Environ., 931, 172926, https://doi.org/10.1016/j.scitotenv.2024.172926, 2024.