
the Creative Commons Attribution 4.0 License.
the Creative Commons Attribution 4.0 License.
 | 05 Nov 2026
Improved permafrost soil representation in a dynamic global vegetation model enhances simulations of carbon dynamics and vegetation structure in boreal forests of Northeast China
Hong Yang

Simone Maria Stuenzi
Yanqiu Xing
Fulai Feng
Moritz Langer
Boreal forests play an important role in the global terrestrial carbon cycle, yet the effects of climate-driven permafrost degradation on ecosystem carbon dynamics remain poorly represented in current models. Earth system models often simplify subsurface thermal and hydrological processes, limiting their ability to capture ecosystem responses in permafrost-affected regions. Here, we improve the soil module of the LPJ-GUESS model by implementing a deep soil profile (3 m) with refined vertical discretization (30 layers) and explicit ice-impedance effects. The improved LPJ-GUESS configuration is then applied to simulate carbon and hydrothermal dynamics in the climate-sensitive boreal forests of Northeast China. Model evaluation indicates that the improved configuration generally enhances the simulation of soil hydrothermal dynamics relative to the default LPJ-GUESS configuration. The correlation coefficient for deep soil temperature (1.0 m) increases from 0.818 to 0.894, while the systematic overestimation of soil water content is substantially reduced, with the bias at 1.0 m reduced from 0.321 to −0.006. These improvements are associated with better agreement between simulated and observed vegetation composition. The simulated dominance of needleleaf forests decreases from near-complete dominance to 24.1 %, resulting in vegetation patterns that are more consistent with regional observations. Consequently, biases in carbon estimates are reduced, with simulated net primary productivity decreasing from 583.5 to 560.1 g C m−2 yr−1 and aboveground biomass from 112.9 to 99.0 t ha−1, resulting in better agreement with estimates from satellite-based observations. Model sensitivity analysis indicates that vegetation composition is highly sensitive to changes in soil hydrothermal conditions compared with the control simulation. Pronounced shifts in vegetation composition occur when soil temperature increases exceed 0.6 °C and soil water deficits exceed 0.6 m3 m−3 compared to the default model configuration. Overall, this study highlights the importance of improving soil hydrothermal representation for simulating vegetation dynamics and carbon cycling in permafrost-affected boreal ecosystems.
- Article
(10249 KB) - Full-text XML
- BibTeX
- EndNote


Boreal forest ecosystems are a vital component of the global carbon cycle and store one-third of the world's forest carbon stocks (Pan et al., 2024). Approximately 80 % of boreal forests are in permafrost zones, with most situated within the discontinuous permafrost zone (Helbig et al., 2016). Due to Arctic amplification, boreal forest ecosystems are warming at rates three to four times stronger than the global average (Rantanen et al., 2022). Permafrost degradation could expose substantial carbon stored in permafrost soils to microbial decomposition and at the same time induce changes in soil hydrothermal conditions, which also affect the active boreal forest carbon storage capabilities (Alfaro-Sánchez et al., 2024; Peng et al., 2022). However, it remains unclear how boreal forest growth and composition will respond to ongoing climate change, and whether these ecosystems will continue to function as a net carbon sink (Pan et al., 2024; Walker et al., 2019; Bradshaw and Warkentin, 2015).
As boreal forest ecosystems are remote and affected by complex interactions between climate change, soil processes, and vegetation dynamics, observations alone are insufficient to quantify their long-term responses at regional to global scales (Terrer et al., 2021). Dynamic Global Vegetation Models (DGVMs) have become essential tools for integrating existing knowledge, investigating feedback mechanisms, and projecting future ecosystem trajectories (Wei and Xia, 2024; Todd-Brown et al., 2014; Zhu et al., 2025). However, under projected climate change scenarios, DGVMs show considerable divergence in both the magnitude and direction of global carbon storage changes (O'Sullivan et al., 2022; Yang et al., 2020; El Masri and Xiao, 2025). By comparing DGVM simulations of forest aboveground biomass (AGB) with spatially explicit remote-sensing estimates, Yang et al. (2020) found that nine DGVMs predicted a global total forest AGB of 365 ± 66 Pg C, whereas remote-sensing observations yielded approximately 275 Pg C, with an uncertainty of about 13.5 %. This discrepancy underscores persistent and systematic biases in model-based estimates of vegetation carbon storage. Furthermore, particularly large biases have been reported for high-latitude ecosystems: in boreal northwestern North America, Earth system models were shown to overestimate AGB accumulation by up to a factor of three (Wang et al., 2021).
Driven by persistent uncertainties and expanding observational constraints, DGVMs have undergone continuous development in model structure and process representation to improve simulations of terrestrial carbon cycle dynamics (Horvath et al., 2021; Martín Belda et al., 2022; Pongracz et al., 2021; Pascual et al., 2024; Quillet et al., 2010). Currently, DGVM simulations form a core component of Global Carbon Budget (GCB) assessments (O'Sullivan et al., 2022). However, as the fundamental basis for simulating terrestrial carbon cycles in DGVMs, the physical realism of soil modules remains limited. Owing to the computational demands of long-term, large-scale ecosystem simulations and the historical emphasis of DGVM development on vegetation and carbon exchange processes, many DGVMs adopt simplified soil representations to maintain computational tractability and broad applicability. The schemes often inadequately represent key cold-region hydrothermal processes, particularly vertical soil thermal gradients, freeze–thaw regulation of soil water movement, and coupled soil thermal–hydrological interactions. This limitation is particularly relevant for permafrost-affected boreal forests, where tree growth and carbon uptake are highly sensitive to changes in root-zone hydrothermal conditions (Wania et al., 2009a, b; Jiang et al., 2012; Peng et al., 2022). Although some DGVMs have attempted to incorporate thaw–freeze effects through parameterization (Pongracz et al., 2021; Schaphoff et al., 2026; Matthes et al., 2025), such representations generally remain highly simplified and struggle to reproduce the integrated thermal–hydrological–carbon processes characteristic of cold-region soils (Martín Belda et al., 2022; Guimberteau et al., 2018). This limitation contributes to uncertainties in DGVM simulations of carbon dynamics in permafrost-affected ecosystems.
To address these limitations, we developed an improved version of the LPJ-GUESS soil module (v4.1.1) by implementing a deeper soil profile with increased vertical discretization and incorporating freeze–thaw-related hydraulic constraints to better represent subsurface thermal and hydrological processes in permafrost-affected ecosystems. We applied the improved model to Northeast China (NEC), located at the southern margin of the Eurasian permafrost domain. NEC has experienced rapid warming of approximately 0.9–2.2 °C over the past five decades, with permafrost area decreasing by an estimated ∼ 35 % since the 1970s (Jin et al., 2007b; He et al., 2009). The strong coupling among degrading permafrost, soil hydrothermal dynamics, vegetation change, and carbon cycling makes NEC a particularly suitable testbed for evaluating soil hydrothermal representations in transitional permafrost ecosystems. The primary objective of this study is to determine whether improved soil hydrothermal representation can enhance simulations of soil temperature, moisture dynamics, and their interactions with vegetation processes. We evaluate the revised model against site-level observations and regional datasets to quantify the effects of improved soil representation on soil thermal conditions, water redistribution, vegetation composition, and ecosystem carbon dynamics. By improving the representation of freeze–thaw-related soil processes, this study aims to reduce uncertainties in simulating boreal forest carbon dynamics and vegetation responses under ongoing climate warming.
2.1 Study area
The NEC Permafrost Region (46°48′–53°32′ N, 115°58′–130°46′ E) is the second largest permafrost distribution area in China, with an area of about 3.87 × 10⁵ km2, spanning the northernmost part of Heilongjiang Province and the Inner Mongolia Autonomous Region (Fig. 1). According to the geographical and climatic conditions affecting the spatial distribution of permafrost, the northeast permafrost area is divided into a continuous permafrost region (CPF, 7.6 × 10⁴ km2), a discontinuous permafrost region (DPF, 4.3 × 10⁴ km2), and a sporadic permafrost region (SPF, 3.0 × 10⁵ km2), based on data provided by the National Cryosphere Desert Data Center dataset (http://www.ncdc.ac.cn, last access: 18 October 2026) (Wu, 2021). Jin et al. (2007a) showed that from the 1970s to 2000, the southern boundary of permafrost shifted northward, and the area where permafrost was completely degraded to seasonally frozen ground was 1.4 × 10⁵ km2. The region is characterized by a cold-temperate continental climate. Mean annual air temperature ranges from −6.2 to −2.4 °C, and mean annual precipitation varies between 274 to 675 mm. Precipitation is strongly seasonal, with rainfall during June–August accounting for approximately 62 %–65 % of the annual total. Seasonal snow cover typically persists from October to the following May, with maximum snow depths of about 40–50 cm. The active layer thickness (ALT) ranges from 0 to 4 m. (Zhang et al., 2024; Li et al., 2024). The region contains more than 80 % of China’s boreal forests, accounting for approximately 29.9 % of the country’s natural forest area and storing nearly one-third of the national forest carbon stock(Huang et al., 2022, 2021). The main types of vegetation are forests, with additional thickets, grasslands, pastures, swamps, and cultivated land (Fig. 1), and the main tree species include Larix gmelinii, Pinus koraiensis, and Betula platyphylla.
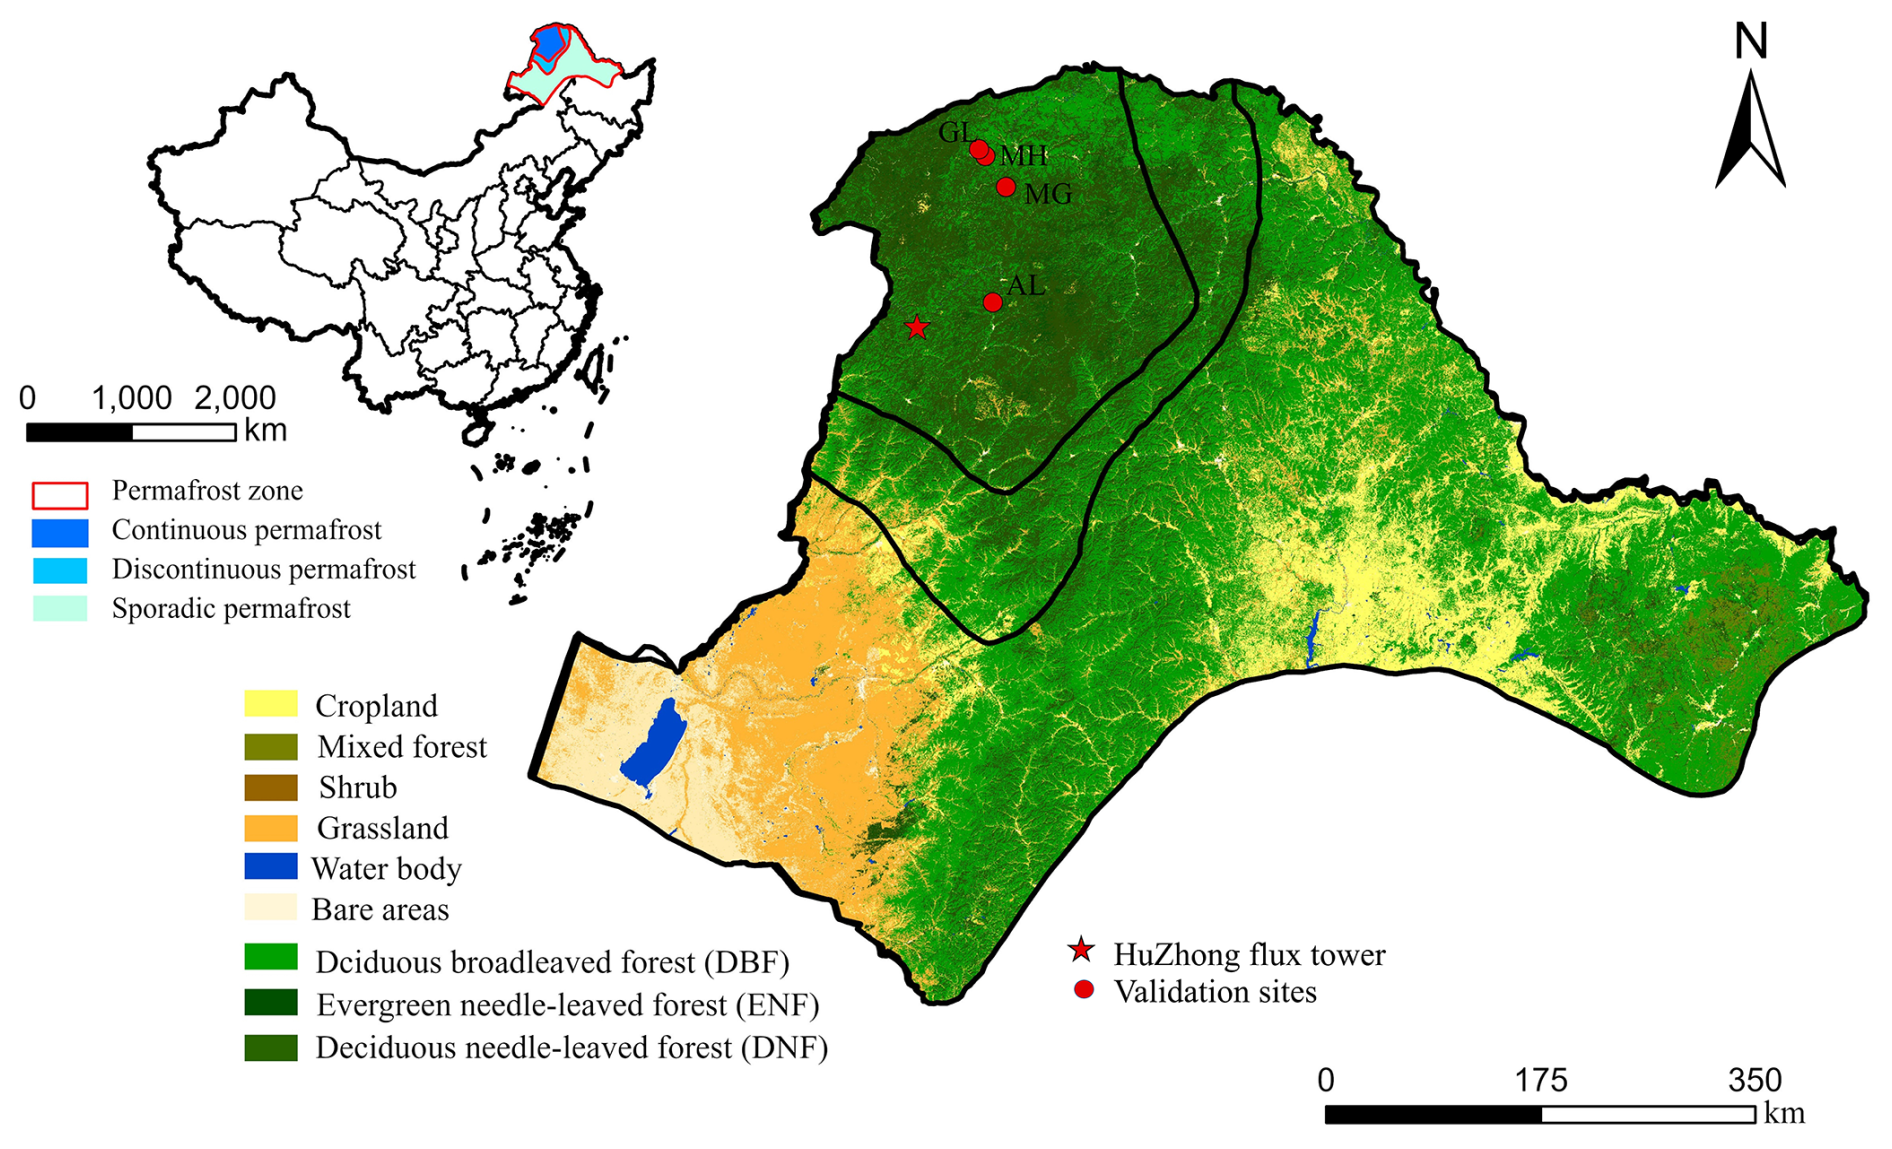
Figure 1Location of the study area in Northeast China, including Heilongjiang Province and the Inner Mongolia Autonomous Region (left), and spatial distribution of permafrost zones and land-cover types within the study region (right). The inset map indicates the location of the study region within China. Land-cover classification was derived from Xu et al. (2018).
2.2 The LPJ-GUESS dynamic global vegetation model
We employed the process-based dynamic global vegetation model LPJ-GUESS v4.1 (Smith et al., 2014, 2001; Nord et al., 2021), which is designed to simulate vegetation dynamics and terrestrial carbon cycling from regional to global scales. The model is driven by gridded climate forcing, including air temperature, precipitation, and downward shortwave radiation, together with atmospheric CO2 concentrations and prescribed soil properties.
The model configuration used in this study incorporates parameterizations optimized for Arctic and high-latitude vegetation and has been widely applied in previous studies addressing vegetation change, carbon cycling, and biomass dynamics in cold-region ecosystems (Zhang et al., 2013; Rawlins et al., 2015; Pongracz et al., 2021). Comprehensive descriptions of the LPJ-GUESS model framework are provided in Smith et al. (2014, 2001). Plant physiological processes follow the LPJ-DGVM approach described by Sitch et al. (2003). Detailed representations of soil processes, including soil carbon and nitrogen dynamics as well as soil hydrology, are documented in Smith et al. (2014), Sitch et al. (2003), and Gerten et al. (2004). Previous developments within the LPJ framework have also incorporated peatland and permafrost-related processes. For example, Wania et al. (2009b) introduced multilayer soil thermal dynamics, freeze–thaw processes, snow insulation effects, active layer dynamics, and peatland hydrology into LPJ-WHy, enabling the simulation of permafrost distribution and water table dynamics. Subsequently, Wania et al. (2009a) further incorporated peatland-specific vegetation parameterizations, inundation stress, reduced anaerobic decomposition, and peatland carbon accumulation processes to simulate vegetation and carbon-cycle dynamics in northern peatland ecosystems. These developments established an important basis for representing cold-region hydrothermal and biogeochemical processes within LPJ-based models.
In the default LPJ-GUESS configuration, soil temperature is simulated using a one-dimensional heat diffusion scheme, which describes vertical heat conduction through the soil profile:
where T represents soil temperature, t represents time, and z represents soil depth. Cv represents volumetric heat capacity, and k represents thermal conductivity. The thermal properties are dynamically determined from the volumetric fractions of mineral soil, organic matter, liquid water, ice, and air. Therefore, changes in soil water and ice states influence soil temperature through their effects on thermal properties and energy storage associated with phase transitions. The lower boundary condition is implemented as a zero heat flux condition by setting the thermal diffusion coefficient at the bottom layer to zero. The existing LPJ-GUESS thermal formulation was retained in this study, while the present developments focus on improving soil vertical representation and frozen-soil water redistribution.
2.3 Model modifications
2.3.1 Structural reconstruction of the soil module for permafrost thermal–hydrological processes
In the permafrost zone of NEC, the original 1.5 m soil column is insufficient to adequately represent freeze–thaw dynamics and subsurface hydrological processes, particularly where the active layer extends beyond the original model depth. The limited soil depth may constrain vertical soil water redistribution and inadequately represent hydrological processes beneath the primary rooting zone. To address this, we replaced the original two-layer, 1.5 m soil column with a 30-layer structure, each 0.1 m thick, extending the profile to 3 m. We also restructured the model’s soil parameter inputs to incorporate vertically stratified property files, thereby removing the assumption of homogeneous soil conditions. This modification enables a more realistic representation of vertical heterogeneity in soil characteristics, such as texture and organic matter content, and substantially improves the representation of simulated soil thermal and hydrological processes.
2.3.2 Physical reconstruction of soil infiltration Incorporating Permafrost-Specific Hydrological Effects
The original soil hydrology scheme in LPJ-GUESS, as described by (Gerten et al., 2004), conceptualizes the soil column as two distinct layers (0–50 and 50–150 cm) and simulates percolation as a bulk exchange between these two “boxes”. Such a two-layer scheme lacks the vertical discretization required to represent depth-dependent soil water movement and freeze–thaw-driven hydrological processes in permafrost-affected boreal ecosystems. The bulk-layer formulation also limits the simulation of vertical soil water redistribution and active-layer hydrology under freezing conditions. To address these limitations, we implemented a new, physically motivated hydrological module designed for our 30-layer soil structure.
The scheme replaces the “two-box” logic with a layer-cascade percolation mechanism. In this framework, water transport is resolved sequentially from an upper layer to the one directly beneath it. The potential percolation volume from any given layer i is first calculated based on its current wcont,i (m3 m−3) and soil hydraulic properties, following the empirical relationship
where Pi is the potential percolation flux (mm d−1); kperc (mm d−1) and β (dimensionless) are texture-dependent parameters inherited from the original LPJ-GUESS hydrological formulation and applied here at the individual soil-layer level.
We further incorporated a dynamic ice impedance function to represent the influence of frozen conditions on layer-to-layer water movement and to improve the physical realism of freeze–thaw-related soil hydrothermal processes. Before water is transferred to the underlying layer i+1, the model evaluates its cryotic condition. The impedance factor (Ωice) is formulated as the product of two continuous, dimensionless scaling functions, Iice and Itemp, as
with Ωmin representing a minimum residual hydraulic permeability factor (fixed at 0.01). The scaling functions depend on the volumetric ice fraction (fice, dimensionless) and soil temperature (Tsoil, °C) of the receiving layer and are defined as
where α is a texture-dependent empirical decay parameter governing ice sensitivity (set to 2.0, 4.0, and 8.0 for sand, loam, and clay, respectively), and γ is a shape parameter defining the steepness of the freezing transition (set to 2.0 °C−1), and Tfreeze is the freezing temperature (°C).
Figure 2 illustrates the functional behavior of the freeze–thaw related ice impedance formulation under different soil textures and thermal conditions. The ice-fraction-dependent scaling function progressively reduces hydraulic permeability with increasing volumetric ice fraction, with stronger inhibition effects represented for finer-textured soils. The temperature-dependent scaling function provides a smooth transition between unfrozen and frozen hydrological states around the freezing point, thereby avoiding abrupt threshold behavior in vertical liquid water transport. The resulting percolation flux is therefore calculated as
This formulation ensures a smoother and bounded transition of hydraulic conductivity across freeze–thaw conditions and is consistent with commonly adopted parameterizations in permafrost hydrological modeling (Walvoord and Kurylyk, 2016; Shur and Jorgenson, 2007).
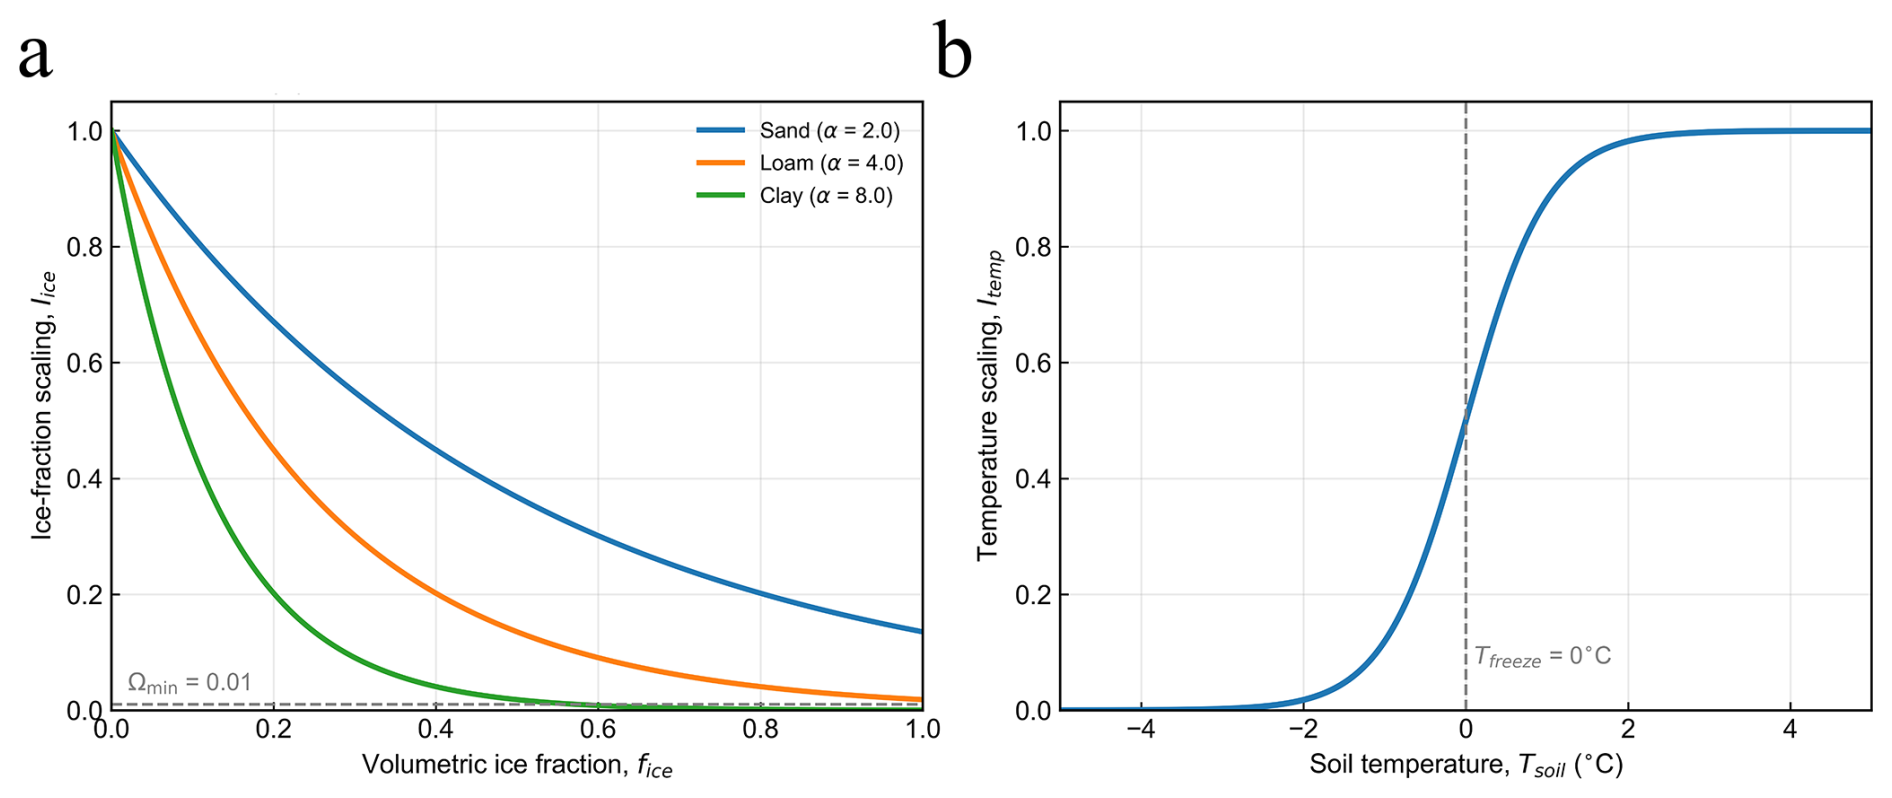
Figure 2Functional representation of the ice impedance formulation controlling vertical liquid water percolation in the improved LPJ-GUESS configuration. (a) Ice fraction dependent impedance function (Iice) across different soil textures. (b) Temperature dependent scaling function (Itemp) across the freezing threshold (0 °C).
In this study, we refined the soil module of LPJ-GUESS v4.1 to better represent soil hydrothermal processes in permafrost-affected ecosystems. The improvements primarily include a deeper vertically discretized soil column and the incorporation of freeze–thaw constraints on soil water percolation. Throughout the manuscript, the default model configuration is referred to as LPJ-GUESS, while the modified configuration is referred to as the improved LPJ-GUESS configuration.
2.4 Model setup and simulations
All simulations included a 500-year spin-up period using repeated 1980–2024 climate forcing to allow vegetation and soil hydrothermal conditions to approach quasi-equilibrium states prior to transient simulations. The spin-up procedure followed the standard LPJ-GUESS framework and was applied consistently to both the original and improved model configurations. Transient simulations used for analysis covered the period 1980–2024. Both model configurations were driven using identical climate forcing, atmospheric CO2, and soil property datasets to ensure that simulated differences primarily reflected the effects of the revised soil hydrothermal representations.
All simulations were driven by the ERA5-Land reanalysis dataset provided through the Copernicus Climate Data Store (CDS) for the period 1980–2024 at a spatial resolution of 0.1° × 0.1° (Muñoz-Sabater et al., 2021). Daily air temperature, total precipitation, and surface shortwave radiation were extracted as climatic forcing variables for soil thermal–hydrological processes and vegetation dynamics in both model configurations. Atmospheric CO2 concentrations were prescribed using the annual global mean CO2 dataset from the NOAA Global Monitoring Laboratory (Masarie and Tans, 1995). Soil physical properties required by the model were derived from the Harmonized World Soil Database version 2.0 (HWSD v2.0), provided by the Food and Agriculture Organization of the United Nations (FAO) and the International Institute for Applied Systems Analysis (IIASA) (Sinitambirivoutin et al., 2024). Vegetation establishment and soil state variables were initialized following the standard LPJ-GUESS simulation framework. Nitrogen deposition forcing followed the standard LPJ-GUESS input framework.
2.4.1 Site-scale comparison
To evaluate the performance of the improved LPJ-GUESS configuration in simulating soil freeze–thaw processes, we compared model outputs against observational data from one flux-tower site (HuZhong) and four monitoring stations (MH, MG, AL, and GL) (Li et al., 2024).
Table 1Geographic and vegetation characteristics of the four additional monitoring sites used for site-scale model evaluation.
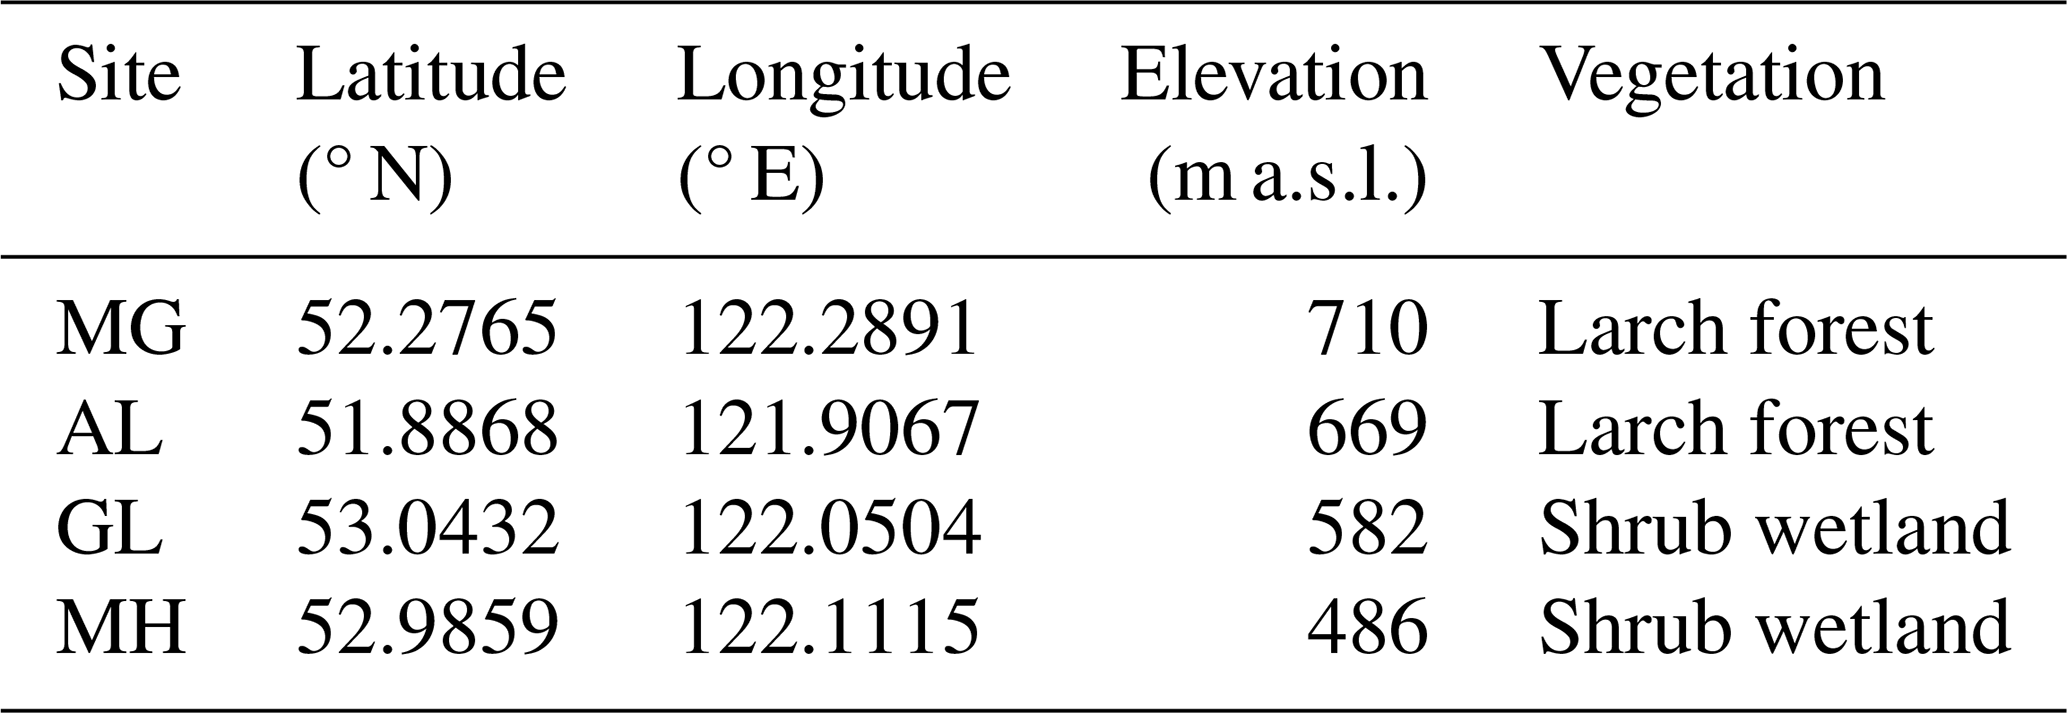
Table 1 summarizes the geographic locations, elevation, and vegetation characteristics of the four additional monitoring sites used for site-scale evaluation. The sites represent contrasting ecosystem and permafrost conditions within the northern Da Xing’anling Mountains, including larch forest and shrub wetland ecosystems distributed across the discontinuous permafrost region. At the HuZhong flux-tower site, long-term, continuous observations were used to assess the model’s ability to reproduce the temporal dynamics and magnitude of soil temperature (ST, °C) and soil water content (SWC, m3 m−3) across multiple soil layers. Additional validation was conducted using soil temperature and active layer thickness (ALT, m) observations from the four sites to evaluate model performance under contrasting permafrost conditions.
Simulated ST and SWC were compared with observations at depths of 0.1, 0.5, and 1.0 m at the HuZhong site for the period 2017–2018. Because the 1.0 m soil temperature observations contained occasional isolated spikes and abrupt short-term excursions that were inconsistent with the temporal continuity of the series and the concurrent 0.5 m observations, additional quality control was applied specifically to this depth prior to model evaluation. Specifically, the QC procedure excluded extreme values exceeding 15 °C, isolated abrupt daily fluctuations (>3 °C relative to both adjacent days), deviations exceeding 3 °C from a 7 d moving median, and records differing by more than 5 °C from concurrent 0.5 m soil temperature observations. The remaining observations were used for model evaluation. Monthly ST at 1.05 m depth from 2017–2022 was compared with observations at the four sites. ALT observations from the four sites were derived from daily soil temperature profiles as the annual maximum depth of the 0 °C isotherm, and were used to validate model simulations on an annual basis. To ensure consistency with the original LPJ-GUESS output, which provides SWC only for two soil layers, the observed SWC values from discrete depths at 0.1 m vertical intervals between 0.1 and 1.5 m were averaged to the upper (0–50 cm) and lower (50–150 cm) soil layers for comparison in October 2016.
2.4.2 Regional-scale simulation
At the regional scale, the improved LPJ-GUESS configuration was applied across the permafrost region of NEC to assess the impacts of the improved soil thermal–hydrological scheme on regional soil hydrothermal conditions, vegetation characteristics, and carbon-cycle processes. Mean deep soil temperature at 1.05 m depth was analysed for winter (December–February) and summer (June–August), together with mean lower-layer soil water content during the growing season (June–August), for the period 1980–2024.
Regional model performance was further evaluated using remotely sensed estimates of net primary productivity (NPP, g C m−2 yr−1) and aboveground biomass (AGB). As LPJ-GUESS simulates total vegetation carbon (Cveg, kg C m−2), including both above- and belowground components, model outputs were converted to AGB following the empirical relationships proposed by Wang et al. (2021). Total vegetation biomass was first derived assuming a carbon fraction of 0.5 (biomass = ). AGB was then estimated by applying an empirically derived ratio between total vegetation biomass and aboveground biomass (1.222) reported for boreal forest species. Finally, all values were converted from kg C m−2 to t ha−1 to facilitate comparison with the remote-sensing-derived AGB dataset.
Outputs from the original and improved LPJ-GUESS configurations were processed using identical workflows. Spatial differences were quantified as the differences between the improved and original LPJ-GUESS configurations, thereby allowing assessment of the influence of the revised soil processes on regional simulations.
2.5 Remote sensing validation data
To evaluate the improved ability of the LPJ-GUESS model to simulate vegetation productivity and structural characteristics, we used two remote sensing data sets, NPP and AGB, for comparative validation.
The NPP data were obtained from the MODIS annual net primary productivity product (MOD17A3HGF, Collection 6), a 500 m resolution global dataset that serves as a key indicator of vegetation growth and carbon sink potential. We used the period 2001–2024 for model data comparison, corresponding to the full temporal availability of the MOD17A3HGF product. The product, accessed via the Google Earth Engine (GEE) platform, has been extensively validated in previous studies (Li et al., 2022; Mao et al., 2015). For AGB, we developed a time series covering 1988–2024. Specifically, site-level AGB estimates were first derived from ICESat-2 ATL08 canopy height observations (Version 5), obtained from NASA’s National Snow and Ice Data Center (NSIDC), in combination with established allometric growth models (Neuenschwander and Pitts, 2019; Huang et al., 2019). The ATL08 product has been widely validated for terrain elevation and canopy height retrieval (Neuenschwander, 2020). These sample-based AGB estimates were then used to train a random forest regression model that integrated multi-temporal Landsat spectral information from Landsat-5 TM, Landsat-7 ETM+, and Landsat-8 OLI together with Shuttle Radar Topography Mission (SRTM) topographic variables, enabling the generation of spatially continuous, wall-to-wall AGB maps for the study region. The detailed workflow for constructing the AGB dataset is described in Yang et al. (2026a).Similar machine-learning-based frameworks have been widely applied to produce long-term AGB datasets at regional to continental scales (Wang et al., 2021; Cai et al., 2025). Together, the NPP and AGB datasets provide a robust foundation for assessing vegetation dynamics and changes in vegetation structure.
2.6 Data analysis
2.6.1 Vegetation classification and dominant PFT definition
To quantify the effects of structural modifications madel to the mode on the vegetation structure and the regional carbon dynamics, we analyzed vegetation composition based on dominant plant functional types (PFTs). The dominant PFT in each grid cell was defined as the PFT featuring the highest leaf area index (LAI), and this definition was applied consistently throughout all analyses (Pongracz et al., 2021).
Because modeled PFT classifications are not directly comparable to observational land-cover datasets, vegetation types were harmonized prior to analysis. Following the classification framework of Ran et al. (2012), all dominant vegetation types were aggregated into needleleaf forest (NLF), broadleaf forest (BLF), and non-tree vegetation classes. The needleleaf forest category includes boreal needleleaf evergreen (BNE), boreal needleleaf summergreen (BNS), and shade-intolerant boreal needleleaf evergreen (BINE) PFTs. The broadleaf forest category includes shade-intolerant broadleaf summergreen (IBS) and temperate broadleaf summergreen (TeBS) PFTs, representing the dominant deciduous broadleaf component in Northeast China. All remaining shrub and non-woody PFTs were grouped into a non-tree vegetation category.
This harmonized and reduced classification scheme provides the basis for subsequent analyses of vegetation composition, biomass changes, and dominant PFT transitions between model configurations.
2.6.2 Evaluation of soil hydrothermal simulations
Prior to attributing vegetation responses, we evaluated differences in simulated soil hydrothermal states between the improved and original LPJ-GUESS configurations using Taylor diagrams. Comparisons were conducted at the AL, MG, MH, and HuZhong sites for soil temperature at depths of 0.5, 1.0, and 1.5 m, with GL excluded because it shares the same model grid cell and identical simulated output with MH.
For soil water content, model outputs were aligned with observational depths. The soil water content analyzed in this study refers to volumetric liquid soil water content rather than total soil water storage including frozen water components. In the original LPJ-GUESS, soil water content at a given depth was derived by averaging the two corresponding soil layers. In contrast, the improved LPJ-GUESS configuration provides layer-resolved outputs at matching depths. To ensure methodological consistency, equivalent two-layer means were additionally computed from the improved LPJ-GUESS configuration using the same depth intervals. This evaluation establishes the degree to which the modified soil module improves the representation of soil thermal and hydrological conditions relevant for vegetation dynamics.
2.6.3 Sensitivity analysis of revised soil representations
To further isolate the relative effects of the revised soil representations, a process-oriented sensitivity analysis was conducted using two multilayer soil configurations: (1) a multilayer soil scheme without freeze–thaw-related hydraulic constraints, and (2) the same multilayer soil configuration including the ice impedance formulation. Both experiments used identical atmospheric forcing and vegetation parameterizations, differing only in the representation of freeze–thaw impacts on vertical soil water movement.
Daily soil temperature and soil water content outputs from all soil layers were extracted for the period 2017–2022 at the representative permafrost site. Vertical soil thermal and hydrological dynamics were evaluated using depth–time contour analyses to compare seasonal propagation of thermal signals and vertical redistribution of soil water between the two experiments. To further quantify the influence of the ice impedance formulation, difference analyses were performed by calculating the deviations between the two simulations for soil temperature and soil water content throughout the soil profile.
In addition, mean vertical difference profiles were calculated to summarize the average influence of the ice impedance formulation on subsurface thermal and hydrological conditions across the entire simulation period. These analyses were used to evaluate the relative and interactive effects of increased soil vertical discretization and freeze–thaw-related hydraulic constraints on subsurface heat transfer and soil water redistribution.
2.6.4 Attribution of vegetation responses to hydrothermal perturbations
To attribute changes in vegetation structure to hydrothermal modifications introduced by the improved soil representation, we conducted a bivariate conditional response analysis linking inter-model differences in soil temperature (ΔST) and soil water content (ΔSWT) to vegetation responses. Here, ΔST and ΔSWT denote the differences between the improved and original LPJ-GUESS configurations rather than absolute warming or drying. Larger absolute Δ values indicate stronger divergence between the two model configurations in simulated soil thermal and hydrological conditions.
Vegetation responses were quantified in two complementary ways. First, we analyzed changes in broadleaf forest biomass (ΔCmass,BLF) as a continuous response to combined changes in soil temperature and soil water content. Second, we assessed structural vegetation shifts by defining a binary indicator of dominant PFT change at the grid-cell level. Grid cells in which the dominant PFT differed between model versions were assigned a value of 1, whereas cells with unchanged dominant PFTs were assigned a value of 0.
This binary indicator was subsequently used in conditional response analyses and logistic regression to identify hydrothermal thresholds associated with dominant PFT transitions and to quantify the sensitivity of vegetation composition to soil thermal and hydrological perturbations.
3.1 Performance of soil thermal and hydrological simulations
Validation at the HuZhong site indicates that the improved LPJ-GUESS configuration reasonably reproduces the depth-dependent vertical structure of subsurface hydrothermal dynamics across the soil profile (Fig. A1). Model performance was highest in the surface layer (0.1 m; R2=0.88, Fig. A1a) and declines slightly with depth, partly reflecting increased uncertainty in deep soil temperature observations (Fig. A1c). While shallow-layer SWC was moderately overestimated, this bias decreased with depth, resulting in higher model–observation correlation at 1 m (Fig. A1d). To further assess spatial robustness, simulations were evaluated at four additional sites (MH, MG, AL, and GL). The improved LPJ-GUESS configuration generally captured the seasonal dynamics of soil temperature, with deep-layer (1.05 m) temperatures showing strong agreement across sites. Correlation coefficients exceeded 0.75 at MH and MG, and reached 0.57 even at the weakest-performing site (GL) (Fig. A2). Independent estimates of ALT further support the improved simulation of active-layer dynamics in the improved LPJ-GUESS configuration (Fig. A3).
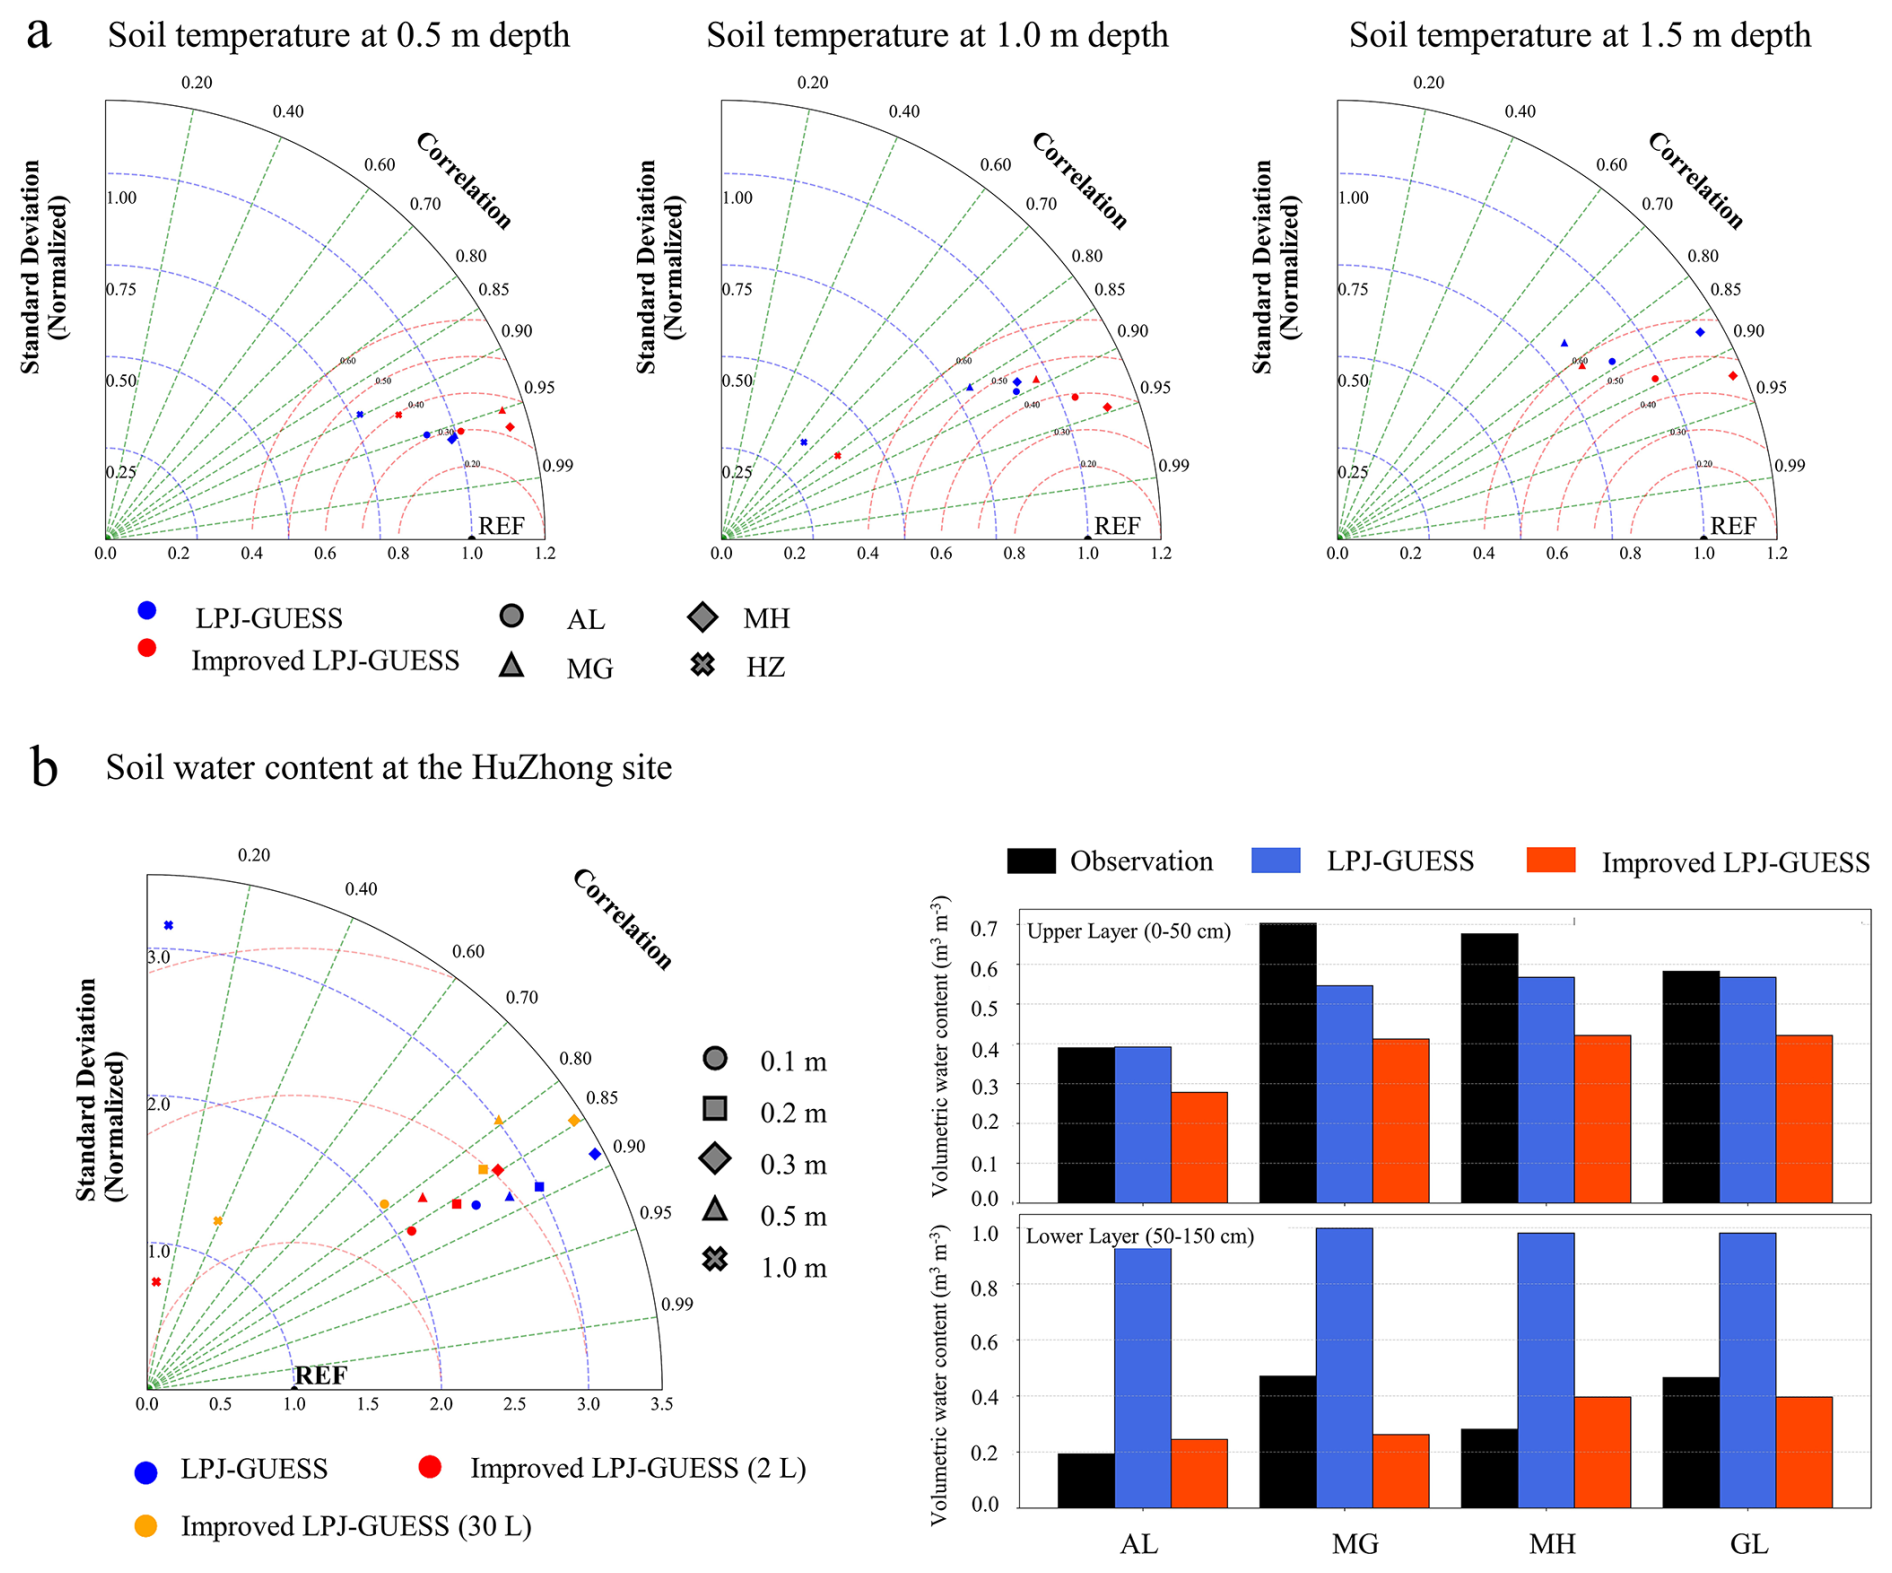
Figure 3Performance of the original and improved LPJ-GUESS configurations in simulating soil hydrothermal dynamics. (a) Taylor diagrams summarizing model–observation agreement for soil temperature at depths of 0.5, 1.0, and 1.5 m across all evaluation sites. (b) Model–observation comparisons of soil water content: the left panel shows depth-specific performance metrics, while the right panels summarize multi-site statistics for the upper and lower soil layers.
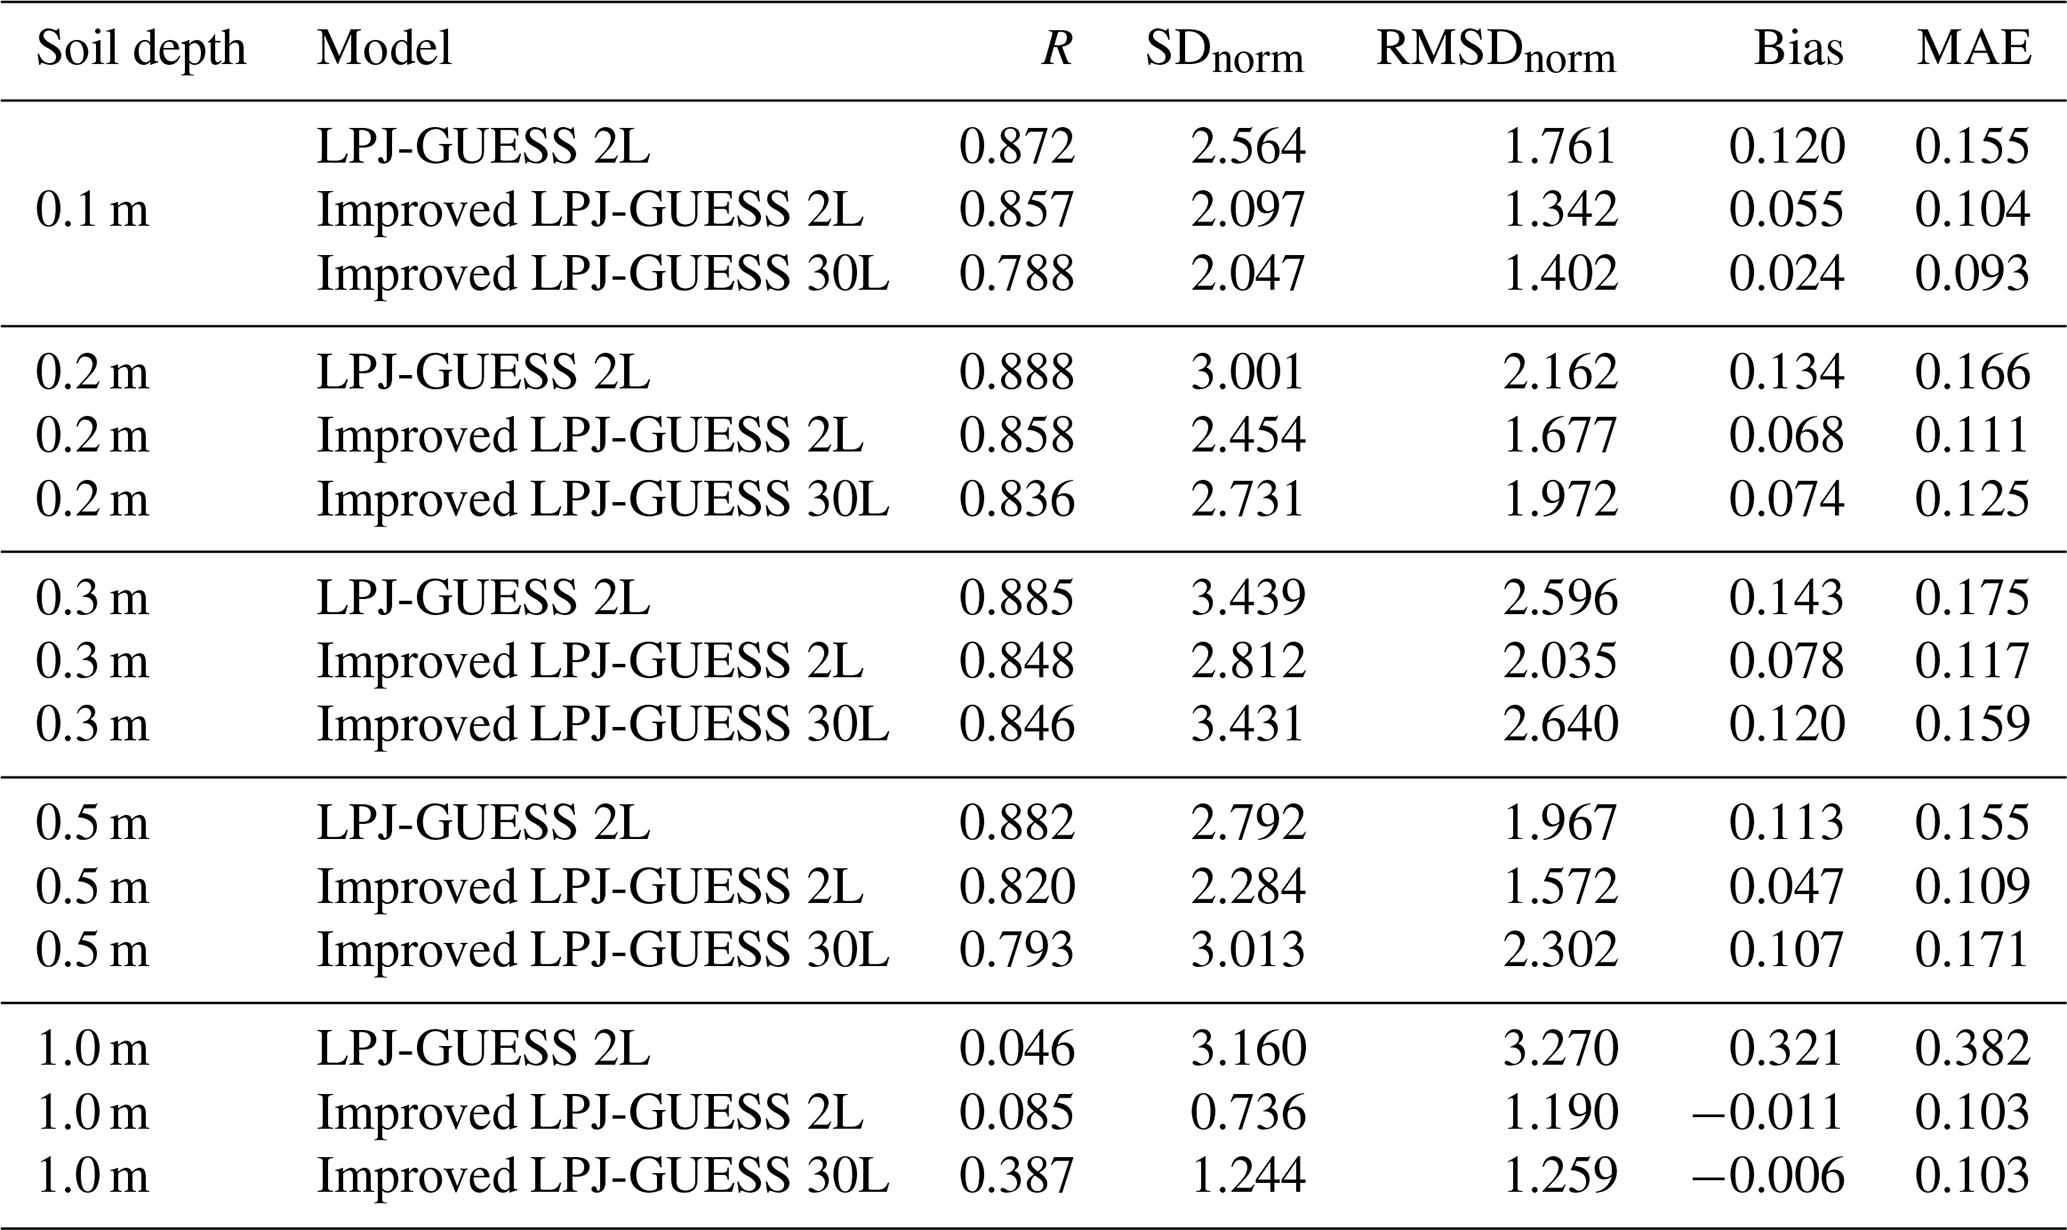
Based on the Taylor diagram analysis (Fig. 3), both the original and improved LPJ-GUESS configurations reproduced the seasonal variability of soil temperature and soil water content across all evaluated depths, with correlation coefficients generally exceeding 0.81 (Table B1). At depths shallower than 1.0 m, model–observation correlations typically ranged between 0.8 and 0.9 for both models, indicating a robust representation of the seasonal timing associated with soil freeze–thaw transitions. At 1.0 m depth, correlations declined for both models, reflecting the increasing difficulty of simulating subsurface hydrothermal dynamics. Despite this depth-dependent decline, the improved LPJ-GUESS configuration generally showed improved agreement with observations relative to the original LPJ-GUESS configuration, with the improvements most pronounced in deeper soil layers. At 1.0 m depth, the mean correlation coefficient for soil temperature increased from 0.818 in LPJ-GUESS to 0.894 in the improved LPJ-GUESS configuration (Table B1). In addition to improvements in mean performance, the improved configuration also showed more stable performance across sites robustness for soil temperature, with the minimum correlation across sites increasing from 0.646 to 0.811 at 1.0 m depth (Table B1). For soil water content, the mean correlation coefficient at the same depth increased from 0.046 to 0.387 (Table B2), indicating a substantial enhancement in cross-site robustness following the model adaptations. The representation of the variability amplitude was also improved. Although correlation coefficients decreased slightly at some depths, the revised configuration reduced systematic biases and improved the magnitude of soil water content, resulting in lower RMSD, bias, and MAE. This indicates improved representation of soil water storage, accompanied by minor changes in temporal variability. At 0.5 m depth, the improved LPJ-GUESS configuration produced a normalized standard deviation (SDnorm) of 1.042 for soil temperature, closely matching the observed variability, whereas the original LPJ-GUESS underestimated the amplitude (SDnorm=0.919). Error metrics further confirmed the systematic reduction in model bias and dispersion. For soil water content, the mean bias decreased from 0.166 to 0.064. For soil temperature at 1.5 m depth, the mean absolute error (MAE) was reduced from 1.267 to 1.140 °C, and the normalized root-mean-square deviation (RMSD) declined from 0.591 to 0.498, corresponding to a 15.7 % relative improvement in overall accuracy.
A snapshot analysis for October 2016 revealed that the original LPJ-GUESS configuration frequently reached the prescribed saturation limit (1.0 m3 m−3) in the lower soil layer (50–150 cm), whereas this behavior occurred less frequently in the improved LPJ-GUESS configuration. The original two-layer soil configuration promotes bulk downward water transfer and tends to retain excessive soil water within the 50–150 cm layer under permafrost conditions. By contrast, the revised multilayer configuration allows more gradual vertical redistribution of soil water and permits continued percolation below 1.5 m depth within the extended 3 m soil column. Consequently, the revised configuration reduces excessive intermediate-layer saturation and modifies the seasonal redistribution of soil water across the soil profile, resulting in a more realistic representation of active-layer hydrology and freeze–thaw-controlled subsurface water movement. Although the soil water content observations at the four validation sites integrate both liquid and ice components, the multi-site comparison provides a consistent diagnostic evaluation of the simulated hydrothermal conditions in the improved configuration. Spatially, both models captured the heterogeneity of deep soil temperature (1.05 m), correctly identifying the lowest values in the northwestern continuous-permafrost zone across seasons (Fig. A4a–f). In contrast, pronounced differences emerged in the simulated lower-layer soil water content. The original LPJ-GUESS exhibited systematically wetter conditions with localized anomalies, whereas the improved LPJ-GUESS configuration simulated a generally reduced and spatially more coherent soil water distribution across the region (Fig. A4g–i).
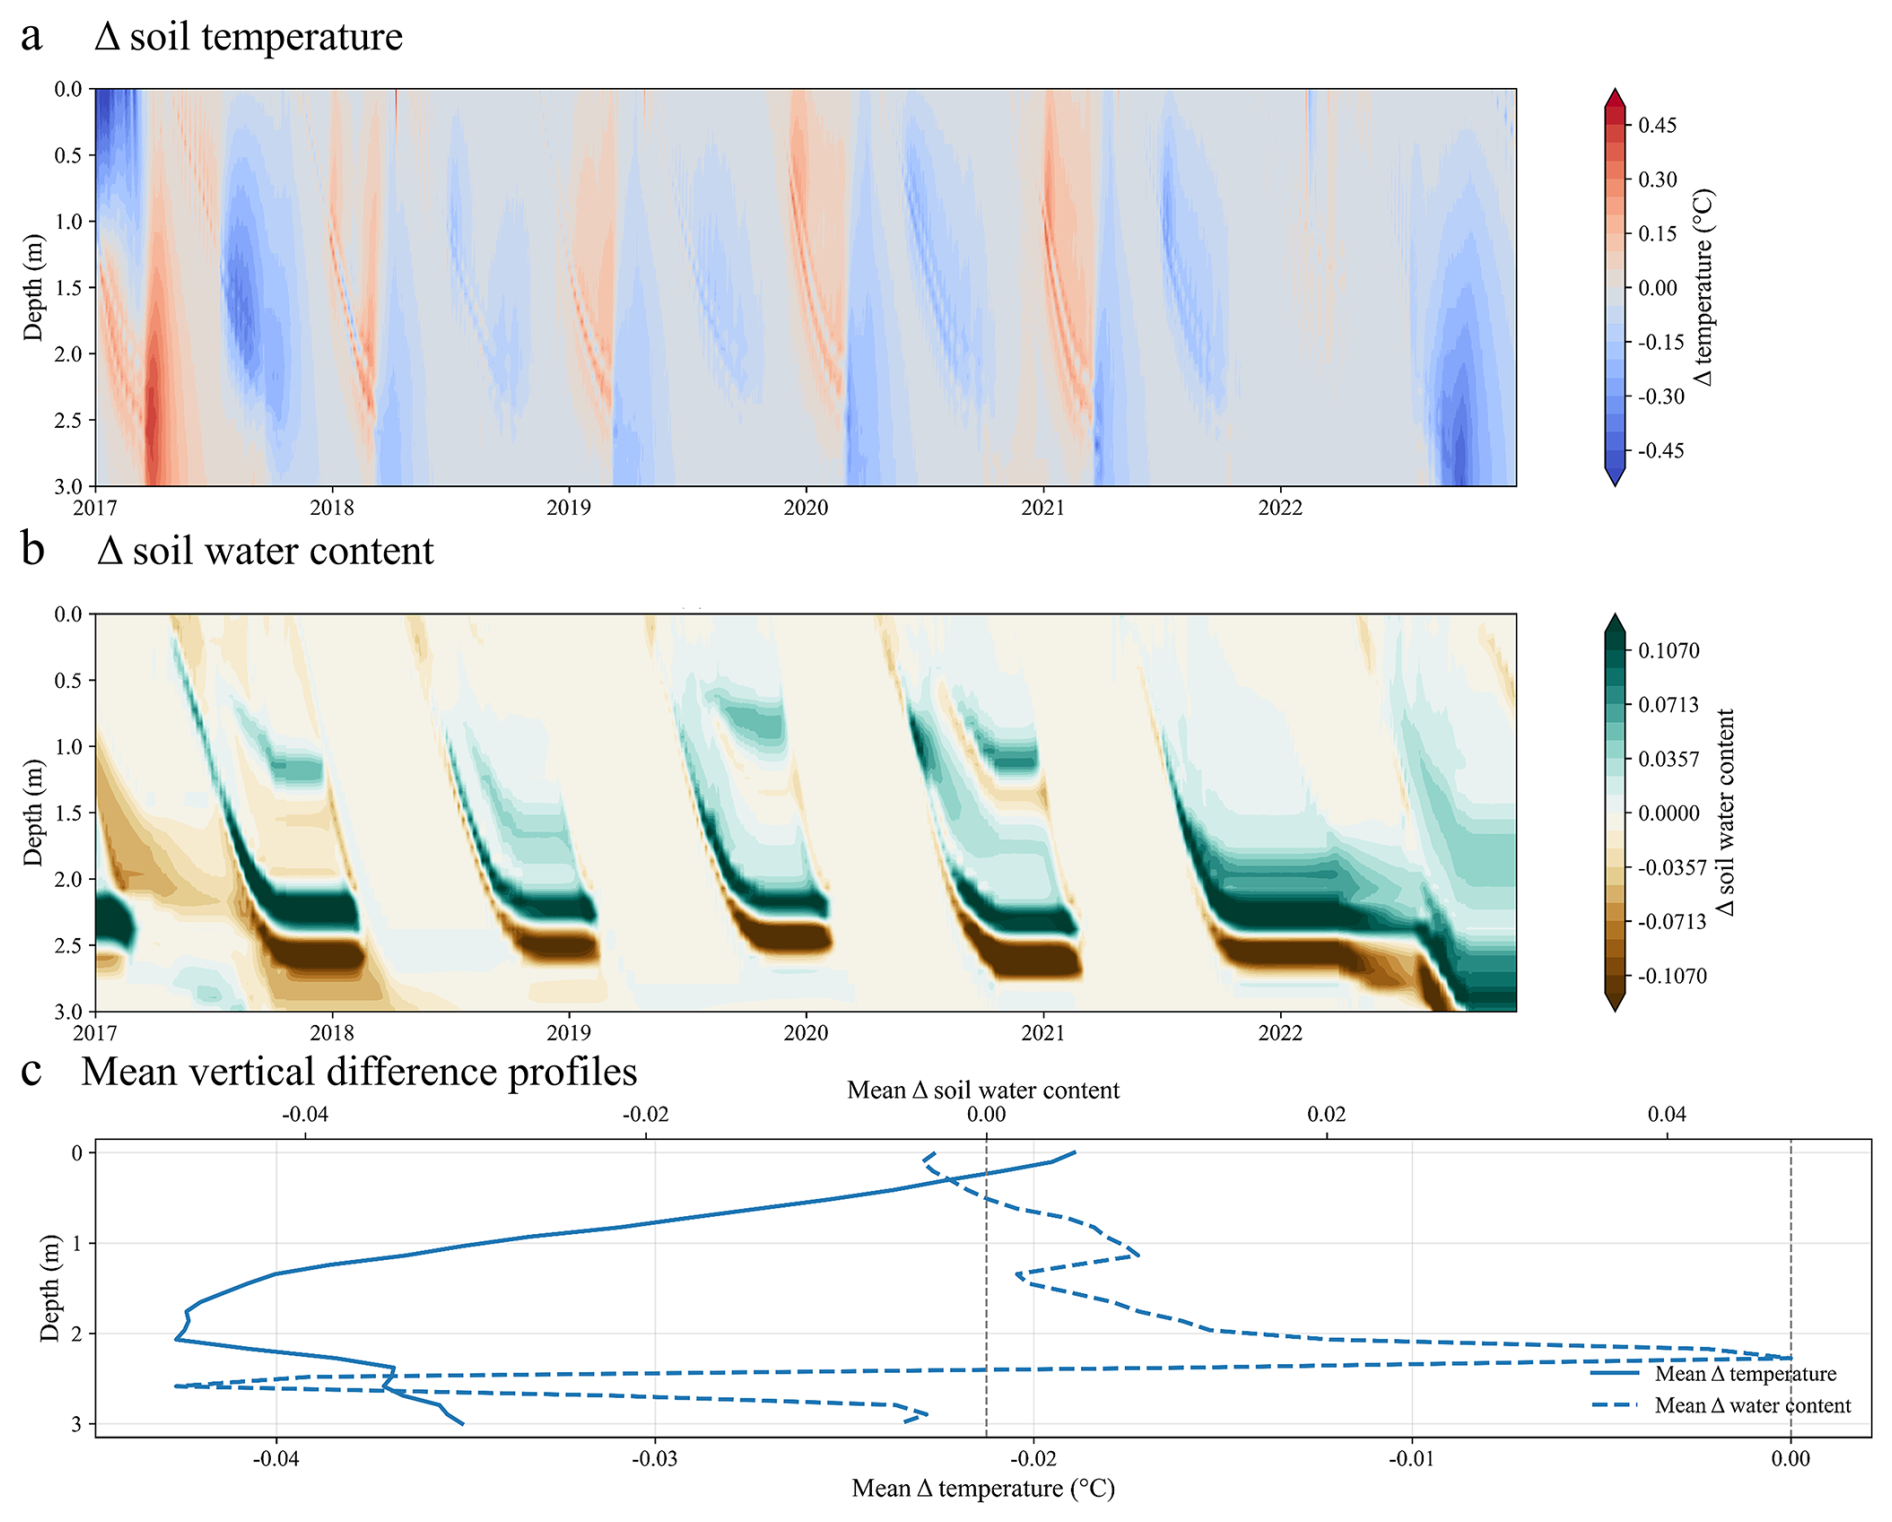
Figure 4Process-oriented sensitivity analysis of soil representations. (a) Differences in soil temperature (ΔST, °C) between the multilayer soil configuration with the ice impedance formulation and the multilayer configuration without ice impedance. (b) Differences in soil water content (ΔSWC, m3 m−3) between the two simulations. (c) Mean vertical profiles of ΔST and ΔSWC averaged over the simulation period (2017–2022).
To further attribute these spatial differences to underlying process representations, a process-oriented sensitivity analysis was conducted using two multilayer soil configurations. The sensitivity analysis showed that both simulations reproduced similar large-scale patterns of seasonal soil thermal propagation, with thermal signals progressively attenuating with depth (Fig. 4). The difference analysis further indicated that the inclusion of the ice impedance formulation resulted in relatively small changes in the bulk soil thermal regime, with a mean soil temperature difference of only −0.034 °C across the soil profile. Most soil temperature differences remained within ±0.5 °C and were mainly concentrated around seasonal thawing and refreezing fronts (Fig. 4a), suggesting that freeze–thaw-related hydraulic constraints exerted comparatively limited direct influence on overall subsurface heat propagation. In contrast, substantially larger differences were observed in soil water redistribution after incorporating the ice impedance formulation (Fig. 4b). Although the mean difference in soil water content was relatively small (0.003), local differences reached up to ±0.2, particularly within the active freeze–thaw transition zone and deeper soil layers below approximately 1.5 m depth. The vertical difference profiles further showed that the strongest hydrological responses occurred in deeper soil layers, whereas temperature differences remained comparatively weak throughout most of the soil column (Fig. 4c). These results suggest that the ice impedance formulation has a stronger influence on subsurface hydrological dynamics by constraining vertical liquid water movement under frozen and partially frozen conditions, whereas its influence on soil thermal dynamics appears relatively limited and mainly localized around thawing and freezing fronts.
3.2 Regional vegetation structure and carbon dynamics
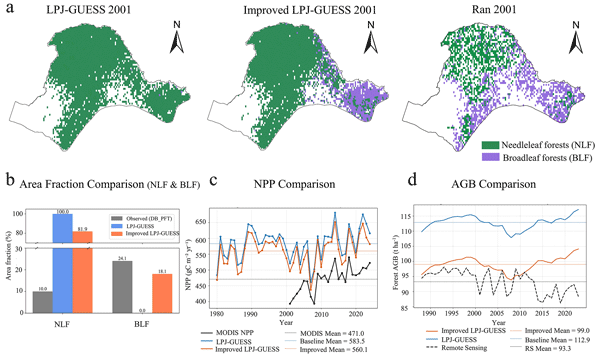
The model performance in simulating regional carbon dynamics was evaluated by comparing simulated AGB and NPP against remote sensing benchmarks (Fig. 5c, d). For AGB, the improved LPJ-GUESS configuration reduced the overestimation relative to the original configuration. The original LPJ-GUESS configuration predicted a multi-year mean AGB of 112.9 t ha−1, whereas the improved configuration yielded a mean of 99.0 t ha−1, which was closer to the remotely sensed estimate of 93.3 t ha−1. This corresponded to an approximately 70 % reduction in the positive AGB bias, with the mean overestimation decreasing from 19.6 to 5.7 t ha−1. Regarding NPP, the original model exhibited a high positive bias (583.5 g C m−2 yr−1).The improved LPJ-GUESS configuration partially reduced this bias, reducing the mean flux to 560.1 g C m−2 yr−1. Although this value remains higher than the remote sensing estimate (471.0 g C m−2 yr−1), the improved configuration reduced the regional mean positive bias by approximately 20 % and showed improved agreement with the observed interannual variability and long-term trends relative to the original LPJ-GUESS configuration.
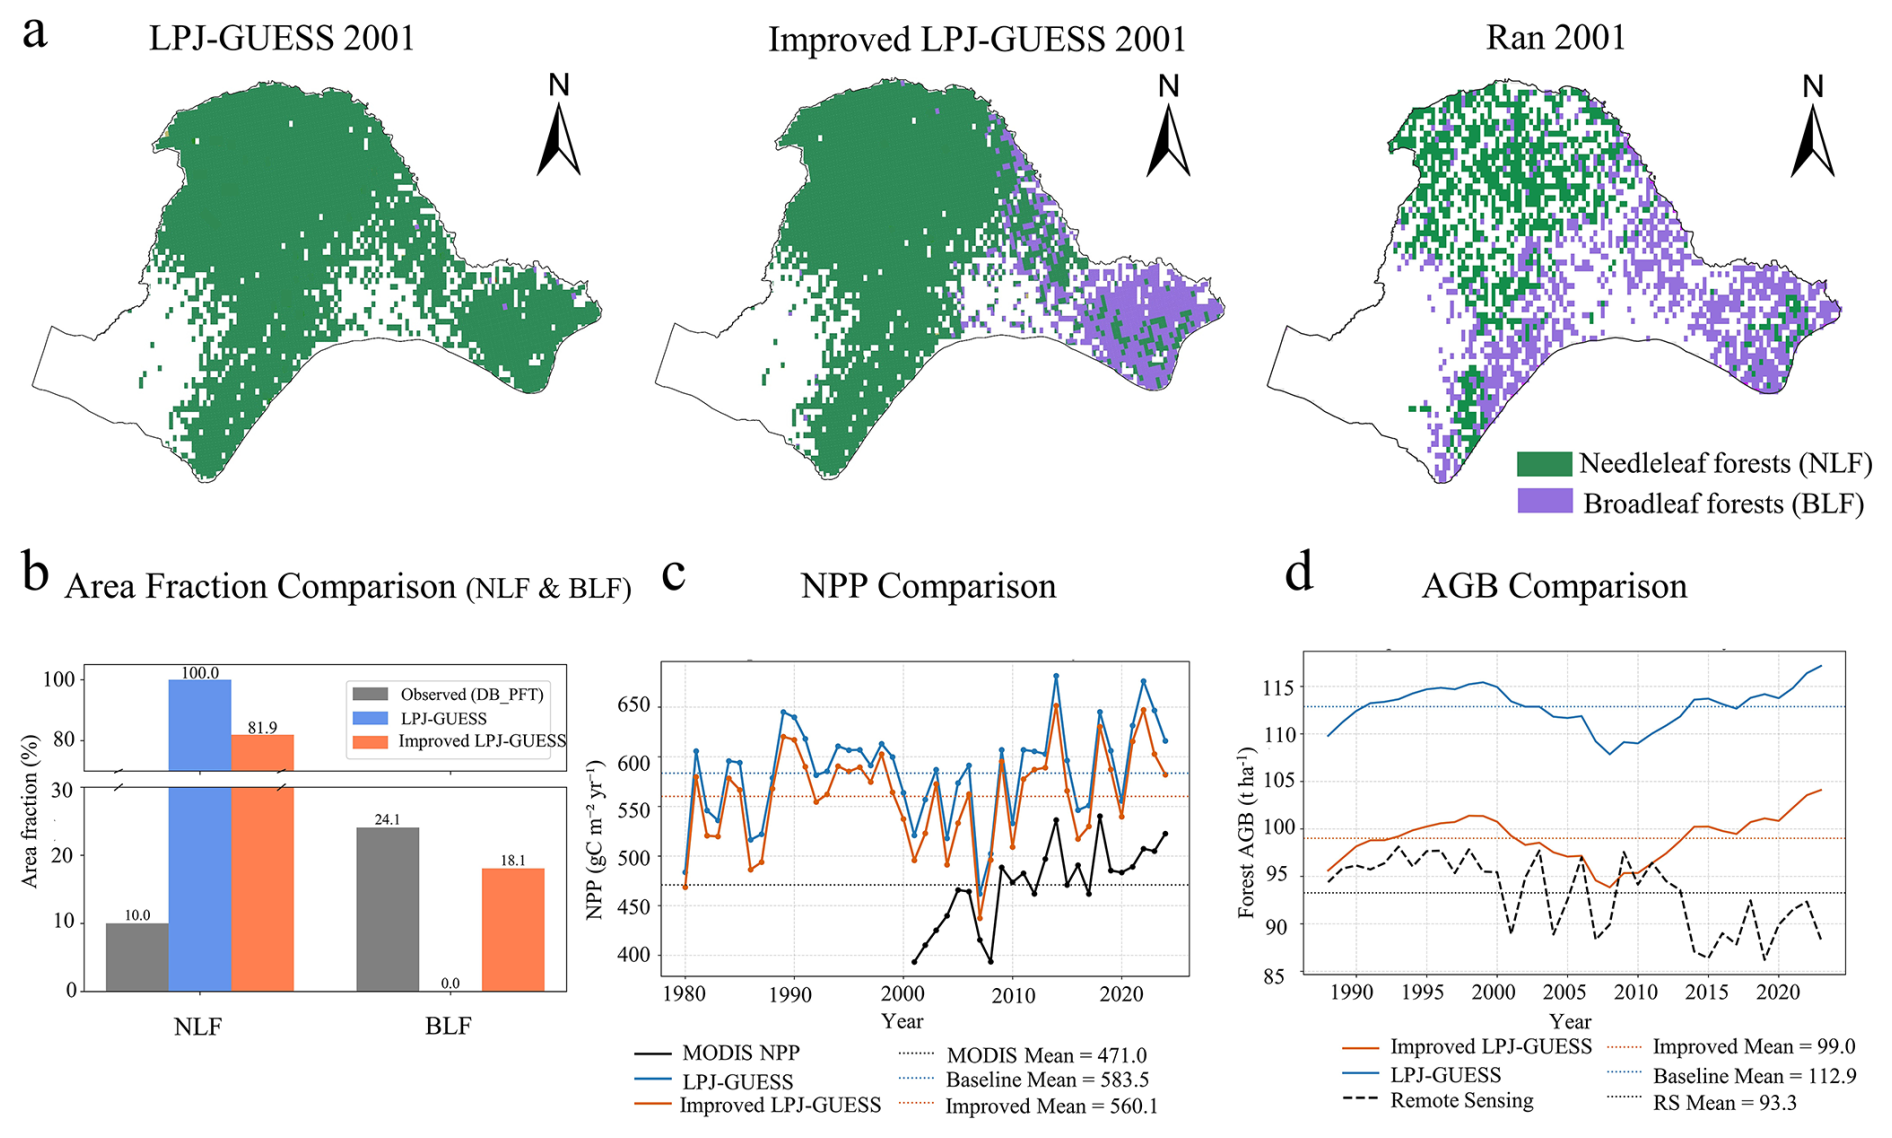
Figure 5Vegetation composition and carbon stock comparisons between model simulations and satellite-derived observations. (a) Spatial distribution of dominant plant functional types (PFTs) in 2001(Ran et al., 2012). (b) Model–observation comparisons of area fractions, net primary productivity (NPP), and aboveground biomass (AGB) aggregated by vegetation type.
Beyond improvements in regional carbon magnitude, the revised model also reproduces the large-scale spatial organization of vegetation across NEC (Fig. 5a). The region is primarily characterized by NLF in the northwestern Greater Khingan Mountains and by BLF toward the southeastern part of the domain. This pattern closely mirrors the large-scale vegetation gradient derived from satellite-based observations (Ran et al., 2012). While the simulated forest cover appears spatially more continuous compared to the fragmented patterns in the remote sensing dataset, the model correctly captures the fundamental transition from coniferous to deciduous dominance across the study domain.
3.3 Vegetation responses to hydrothermal differences between model configurations
Figure 6a illustrates the joint response of BLF biomass to inter-model differences in soil temperature and soil water content. Substantial increases in BLF carbon mass are concentrated in regions characterized by warmer and drier soil conditions in the improved configuration relative to the original LPJ-GUESS configuration. The highest biomass gains (deep red hexagons) occur predominantly in the upper-left quadrant of the response space, indicating a strong sensitivity of BLF biomass to combined soil warming (positive ΔST) and drying (negative ΔSWT).
The marginal plots further quantify this steep response: the binned means of ΔCmass,BLF increase sharply with intensifying soil water content divergence and rising soil temperature differences. The largest biomass gains (exceeding 6–8 kg C m−2) occur under the strongest combined hydrothermal shifts (ΔSWT < −0.5 m3 m−3 and ΔST > 0.5 °C).
The probability of dominant PFT transitions exhibits a strong dependence on the magnitude of hydrothermal divergence between the two model versions. As shown in the joint probability distribution (Fig. 6b), PFT turnover likelihood increases monotonically with intensifying soil warming and drying. The highest probabilities (approaching 0.8–1.0; yellow hexagons) occur in areas experiencing the strongest hydrothermal decoupling, specifically where soils become substantially drier (ΔSWT < −0.6 m3 m−3) and warmer (ΔST > 0.6 °C). Conversely, in regions where the hydrothermal conditions simulated by the two models remain similar (center of the plot), ecosystems remain largely stable (dark purple). The marginal density plots further confirm that PFT turnover probability is highly sensitive to both drivers, showing a steep increase with decreasing soil water content and increasing soil temperature.
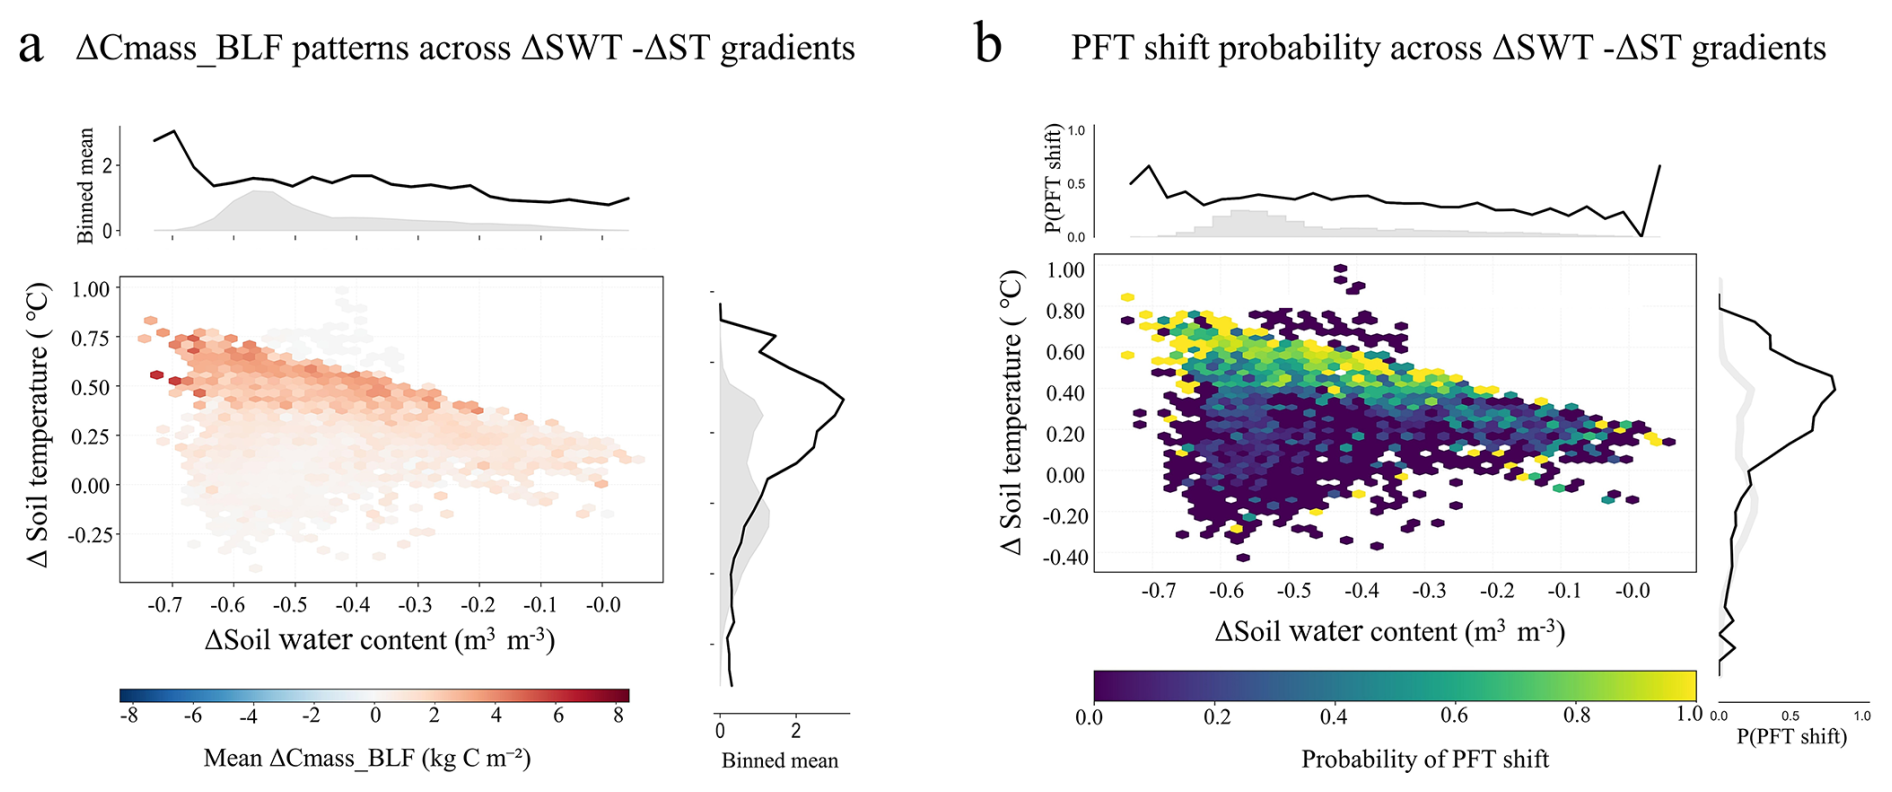
Figure 6Associations between vegetation responses and simulated hydrothermal differences between the improved and original LPJ-GUESS configurations. (a) Joint response of broadleaf forest carbon mass (ΔCmass,BLF) to inter-model differences in soil water content (ΔSWT) and soil temperature (ΔST). (b) Probability of dominant plant functional type (PFT) transitions as a function of combined soil moisture and temperature differences between the two model configurations.
4.1 Performance and physical interpretation of soil hydrothermal simulations
Based on evaluations against site-level measurements and regional data products, the improved LPJ-GUESS configuration showed improved performance in simulating soil temperature amplitude and reduced biases in soil water content, resulting in simulations that were consistently closer to observations than those of the original LPJ-GUESS. Both model configurations reproduced the seasonal phase of near-surface variability, indicating that atmospheric conditions remain the primary control on the timing of freeze–thaw transitions in shallow soils (Koven et al., 2013, 2015). However, the improved configuration showed more consistent performance across sites, with improvements becoming more evident at greater depths. This depth-dependent improvement suggests that, as direct atmospheric control weakens with depth, simulated subsurface variability becomes increasingly governed by internal soil process representations, including vertical heat diffusion, water redistribution, and freeze–thaw-related hydraulic constraints (Walvoord and Kurylyk, 2016).
The process-oriented sensitivity analysis helped clarify the distinct but interacting roles of the two model developments. Increased soil vertical discretization primarily improved the representation of subsurface thermal propagation by allowing seasonal thermal signals to diffuse more gradually through the soil profile and by reducing artificial layer-scale discontinuities associated with the vertically coarse soil scheme. As a result, the multilayer structure enhanced the realism of depth-dependent soil thermal dynamics and restored more continuous vertical hydraulic connectivity throughout the soil column. By contrast, the ice impedance formulation mainly affected subsurface hydrological dynamics during freeze–thaw transitions. The strongest responses were concentrated around thawing and refreezing fronts, indicating that freeze–thaw-related hydraulic constraints primarily regulate transient vertical redistribution of liquid water under frozen and partially frozen conditions. Physically, partial ice occupation within soil pores reduces effective hydraulic conductivity, thereby modifying the timing and depth of seasonal infiltration and subsurface water redistribution. The comparatively weak thermal response should be interpreted specifically as the incremental response to the newly introduced hydraulic constraint. In the current implementation, this constraint directly modifies layer-to-layer liquid water transport, whereas soil thermal dynamics continue to be governed by the existing thermal scheme, in which soil water and ice states affect thermal properties and phase-change energetics. Therefore, the limited additional temperature response does not imply that ice-related processes exert only a minor influence on soil thermal dynamics, but rather reflects the primarily hydraulic scope of the newly implemented process.
The improved performance of the revised configuration is therefore likely associated with the alleviation of two interacting structural limitations in the original model. First, the shallow lower boundary (1.5 m) and vertically coarse “bucket”-type hydrology of the standard LPJ-GUESS configuration can artificially constrain downward water movement when the active layer extends beyond the simulated soil domain (Gerten et al., 2004). Extending the soil profile to 3.0 m improves vertical hydraulic connectivity and allows more realistic redistribution of soil water throughout the soil column. Second, the incorporation of phase-change-dependent hydraulic impedance introduces a physically motivated constraint on liquid water movement under frozen and partially frozen conditions, consistent with the reduced hydraulic conductivity characteristic of permafrost soils (Walvoord and Kurylyk, 2016). Together, these process-level modifications improve the representation of subsurface hydrothermal processes by enhancing vertical water redistribution and freeze–thaw-related hydraulic constraints.
Some discrepancies nevertheless remain. More generally, these may arise from uncertainties in precipitation forcing, snow insulation, soil organic-layer properties, unresolved lateral flow, and local heterogeneity in soil texture and drainage conditions. At the HuZhong site, the residual mismatch at 1.0 m depth is characterized mainly by an underestimated seasonal temperature amplitude, with the model remaining too warm in winter and too cool in summer. Because this pattern persists after quality control, it is unlikely to result solely from isolated observational anomalies. Instead, it suggests excessive damping of the seasonal thermal signal as heat propagates downward through the simulated soil profile. A likely source of this damping is uncertainty in the effective thermal diffusivity of the deeper soil layers. In the model, layer-specific thermal conductivity and heat capacity are determined from prescribed soil composition together with simulated liquid water and ice fractions, whereas detailed site-specific vertical profiles of these thermal properties are not available for HuZhong. Consequently, differences between the prescribed and site-specific depth-dependent soil composition and water–ice conditions may cause the simulated thermal signal to attenuate too strongly before reaching 1.0 m depth. In addition, the current model soil column remains shallower than the active layer depth observed in parts of the study region, limiting the interpretation of simulated thaw depth or active-layer thickness. For this reason, the present sensitivity analysis focused primarily on soil thermal propagation and vertical soil water redistribution rather than directly interpreting active-layer thickness changes. The experiment isolating the freeze–thaw-related hydraulic constraint should also be interpreted within the scope of this specific model development. The newly implemented constraint directly modifies frozen-soil water transport and does not introduce an additional parameterization of soil heat transfer. Its influence on soil temperature therefore arises through changes in soil water and ice states propagated through the existing thermal scheme. Accordingly, the comparatively weak additional temperature response should not be interpreted as a complete assessment of the thermal effects associated with soil ice and freeze–thaw processes. Despite these limitations, the revised soil representation provides a more physically consistent baseline for simulating subsurface hydrothermal states. This improvement is essential for interpreting ecosystem-scale responses because freeze–thaw status and soil water availability in the rooting zone regulate vegetation phenology, plant water stress, and soil carbon respiration in permafrost-affected boreal forests under a warming climate (Kimball et al., 2006; Treat et al., 2022; Schaphoff et al., 2026).
4.2 Vegetation sensitivity to permafrost-driven hydrothermal changes and implications for regional carbon dynamics
The improved soil hydrothermal representation in the improved configuration modifies simulated subsurface thermal and hydrological states, with cascading effects on vegetation structure and regional carbon dynamics. At the regional scale, this leads to a systematic reduction in simulated AGB and NPP relative to the original LPJ-GUESS, resulting in improved agreement with remote sensing–based estimates. This convergence indicates that the productivity overestimation in the original model is more plausibly attributable to structurally biased subsurface physical conditions than to deficiencies in vegetation physiological parameterizations.
Spatial comparisons of model outputs further indicate that the improvement in regional carbon estimates is closely linked to a corrected representation of vegetation composition. In particular, the improved configuration better captures the large-scale transition from needleleaf-dominated forests in the northwestern part of the domain to broadleaf-dominated forests toward the southeastern permafrost margin (Ran et al., 2012). This spatial reorganization of vegetation emerges as a primary mechanism underlying the improved agreement in carbon stocks, and is fundamentally driven by a more realistic simulation of subsurface hydrothermal conditions.
By extending the soil profile, the improved configuration allows deeper active-layer development and associated vertical water redistribution. In regions of CPF, where active layer thickness varies only modestly, soil thermal and hydrological states tend to remain relatively stable due to the sustained shallow active layer, and vegetation responses appear to be limited. In contrast, in the SPF and DPF zones, the deeper soil column restores vertical hydrological connectivity, allowing thaw-generated water to percolate downward (Shan et al., 2022). Compared to the original model, where an artificially shallow lower boundary promotes water accumulation, this structural change effectively reduces excess soil water content in the rooting zone and creates relatively warmer and drier conditions.
The altered subsurface hydrothermal regime amplifies vegetation responses through differences in rooting depth among PFTs, ultimately driving shifts in vegetation composition. Boreal needleleaf species are generally shallow-rooted; for example, Larix gmelinii typically maintains a rooting depth of approximately 20–65 cm, depending on site moisture conditions (Canadell et al., 1996). Consequently, these species rely strongly on near-surface soil water and have limited capacity to access moisture released by permafrost thaw, making them particularly vulnerable to root-zone drying (Peng et al., 2022; Anderegg et al., 2020). In contrast, boreal broadleaf species such as Betula platyphylla develop substantially deeper rooting systems, with roots extending to approximately 120 cm in 20-year-old individuals (Mauer and Palátová, 2003). These deeper rooting systems enable access to subsurface water reservoirs and may further benefit from warming-induced increases in nutrient mineralization (Peng et al., 2022). Consistent with such physiological differences, both the probability of broadleaf forest replacing needleleaf forest and the associated net increase in broadleaf biomass are strongly concentrated within a relatively narrow “warm–dry” domain of the response space. This clustering indicates a high sensitivity of regional vegetation to coupled soil thermal and hydrological gradients induced by permafrost processes and identifies root-zone drying as a key constraint shaping competitive interactions among PFTs. By removing the non-physical over-wet conditions present in the original model, the improved configuration reduces the tendency for broadleaf forest underrepresentation, allowing them to gain a competitive advantage under more realistic hydrothermal conditions and facilitating community reorganization.
Although several studies have suggested that permafrost degradation may reduce vegetation growth through increasing drought stress (Yang et al., 2025; Wang et al., 2022), our results indicate that the observed decline in regional carbon stocks is more plausibly driven by dominant PFT replacement rather than by growth limitation within a single vegetation type. Needleleaf species typically sustain higher standing biomass because they are associated with higher wood density and longer carbon residence times than broadleaf species (Luo et al., 2020; Phillips et al., 2019). When broadleaf forests expand and replace needleleaf forests in transitional permafrost zones, broadleaf productivity may locally increase under the revised hydrothermal regime; however, their long-term equilibrium biomass remains lower than that of needleleaf-dominated stands (Szwagrzyk and Gazda, 2007; Billard et al., 2020). Consequently, a structural reorganization from a high-biomass PFT assemblage to a comparatively lower-biomass assemblage can reduce regional aboveground carbon stocks even under conditions that are physiologically more favorable for broadleaf growth. Rather than reflecting physiological stress or reduced productivity, the carbon loss emerges as an ecosystem structural effect, driven by shifts in dominant vegetation composition induced by permafrost-mediated changes in soil hydrothermal regimes.
Overall, our results suggest that the commonly reported overestimation of boreal forest carbon stocks in existing DGVMs cannot be attributed solely to the omission of physiological growth constraints associated with permafrost degradation. Instead, a more fundamental limitation lies in the insufficient representation of the high sensitivity of boreal forest species to soil hydrothermal changes. Inadequate simulation of freeze–thaw dynamics leads to a mischaracterization of belowground conditions, which in turn propagates into systematic biases in modeled vegetation composition. Our findings therefore highlight that constructing more physically realistic subsurface hydrothermal states is a prerequisite for accurately simulating both vegetation structure and carbon balance in permafrost-affected boreal ecosystems.
4.3 Model limitations and future directions
Despite the improvements achieved in the improved LPJ-GUESS configuration, two limitations regarding vegetation–soil coupling remain important. First, our attribution of vegetation shifts relies on static vertical root distributions. While defining PFTs with distinct rooting depths captures fundamental functional trade-offs, it neglects the phenotypic plasticity of root architecture (Sakschewski et al., 2021). In reality, boreal needleleaf species may dynamically adjust their root vertical profiles in response to active layer deepening to access receding moisture and nutrients (Blume-Werry et al., 2019). By maintaining fixed rooting depths, the current model framework may overestimate the vulnerability of shallow-rooted conifers to surface drying, thereby potentially exaggerating the rate of broadleaf expansion (Drewniak, 2019). Explicitly coupling soil hydrothermal dynamics with dynamic root allocation schemes represents a critical priority for creating more resilient vegetation models. Second, the model relies on a one-dimensional framework that neglects lateral water redistribution (Fan et al., 2019). In complex permafrost terrains, thermokarst processes and lateral flow along topographic gradients often create a mosaic of dry mounds and wet depressions, rather than the uniform drying trends simulated here (Jorgenson et al., 2001). The absence of lateral hydrological connectivity means that the model may not resolve localized hydrological refugia such as riparian zones or lowland wetlands, where moisture dependent needleleaf species can persist under regional warming. Incorporating lateral processes is therefore necessary to represent subgrid heterogeneity that buffers vegetation responses to climate driven transitions.
In addition, the present developments focus primarily on improving selected soil hydrothermal processes relevant to permafrost environments, rather than providing a comprehensive representation of coupled permafrost–carbon feedbacks. To maintain computational efficiency and regional applicability in large-scale DGVM simulations, the current framework prioritizes process-level improvements expected to exert first-order controls on subsurface hydrothermal dynamics. Several important processes, including vertically resolved soil carbon decomposition, talik dynamics, and explicit permafrost carbon emissions, remain unresolved in the current framework. Furthermore, although the revised soil representation improved simulations of vegetation and near-surface hydrothermal dynamics, its implications for belowground carbon storage and long-term permafrost carbon feedbacks were not explicitly evaluated in this study. Given the large soil carbon pools stored in permafrost regions, future work should further investigate the implications of improved soil hydrothermal representation for soil carbon dynamics and permafrost carbon feedbacks under continued warming.
More broadly, the present evaluation remains regionally constrained to the permafrost-affected forests of Northeast China. Although this region represents a climatically sensitive transition zone characterized by rapid warming and discontinuous permafrost degradation, broader validation across pan-Arctic environmental gradients and permafrost regimes is required before generalizing model applicability at the circumpolar scale. Future work should therefore combine improved process representation with broader pan-Arctic evaluations and long-term observations to assess ecosystem carbon dynamics at the circumpolar scale. Despite these limitations, the present results demonstrate that improved soil hydrothermal representation can substantially influence simulated vegetation dynamics and vegetation-related carbon estimates in permafrost-affected forests.
In this study, we improved the soil module of LPJ-GUESS to better represent soil hydrothermal processes in permafrost-affected boreal forests of Northeast China (NEC). By increasing soil vertical resolution and introducing a freeze–thaw-related hydraulic constraint on downward liquid water percolation, the revised model improves the representation of vertical soil thermal gradients and subsurface soil water redistribution in permafrost-affected ecosystems.
Validation against site-level observations and regional datasets indicates that the improved LPJ-GUESS configuration generally improves the simulation of soil temperature variability and reduces soil water content biases relative to the original LPJ-GUESS configuration. While both model versions capture the seasonal timing of near-surface freeze–thaw cycles dominated by climatic forcing, the improved configuration also shows more consistent performance across sites and soil depths. Performance gains are most evident in deeper soil layers, where internal soil processes increasingly control variability, underscoring the importance of vertical resolution and physically based subsurface representations.
At the regional scale, these modifications lead to systematic changes in simulated vegetation structure and carbon dynamics. The improved configuration also reduces the overestimation of AGB and NPP, decreasing the regional mean AGB bias from 19.6 to 5.7 t ha−1 and the NPP bias from 112.5 to 89.1 g C m−2 yr−1, thereby yielding estimates that are substantially closer to remote sensing–derived values. Crucially, the model reproduces the observed large-scale transition from needleleaf-dominated forests in the northwestern permafrost zone to broadleaf-dominated forests toward the southeastern margin. Our analysis identifies that this structural reorganization, which is driven by the sensitivity of vegetation to soil warming and drying, is the primary mechanism improving the carbon bias. By resolving the competitive exclusion of shallow-rooted needleleaf species by broadleaf species in transitional zones, the model eliminates the artificial retention of high-biomass conifers simulated by the original configuration.
Overall, this study suggests that improving subsurface soil hydrothermal representation is an important component for improving simulations of vegetation composition and carbon dynamics in permafrost-affected ecosystems. The improved LPJ-GUESS configuration provides a more suitable basis for simulating boreal forest carbon dynamics at the southern margin of the permafrost region and may contribute to reducing uncertainties in projections of ecosystem structural changes under ongoing climate warming.
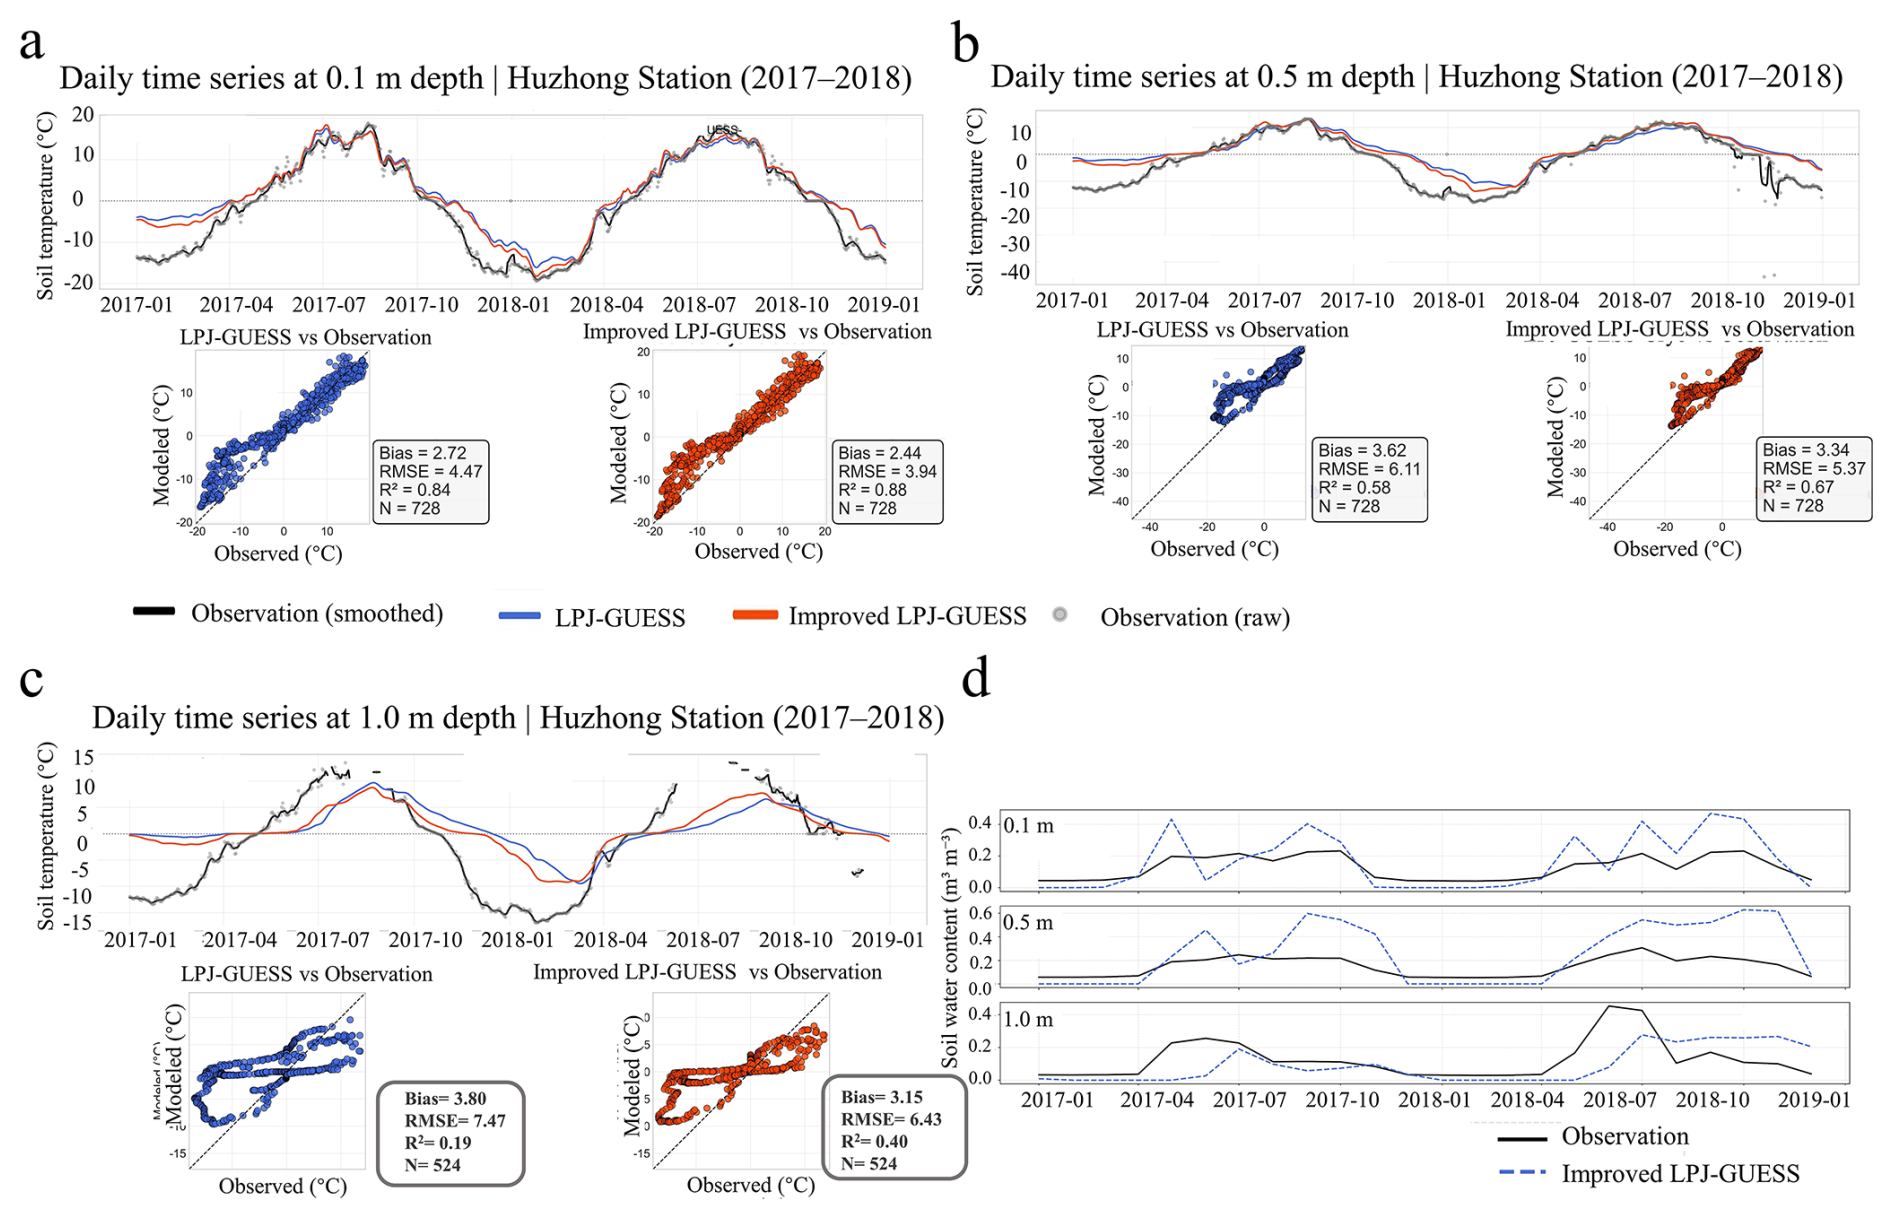
Figure A1Validation of simulated soil hydrothermal dynamics against observations at the HuZhong flux tower site (2017–2018). Panels (a)–(c) show observed and simulated soil temperature at depths of 0.1, 0.5, and 1.0 m, respectively. Panel (d) shows the corresponding volumetric soil water content at the same depths. Black solid lines represent observations, whereas blue dashed lines represent simulations from the improved LPJ-GUESS configuration.
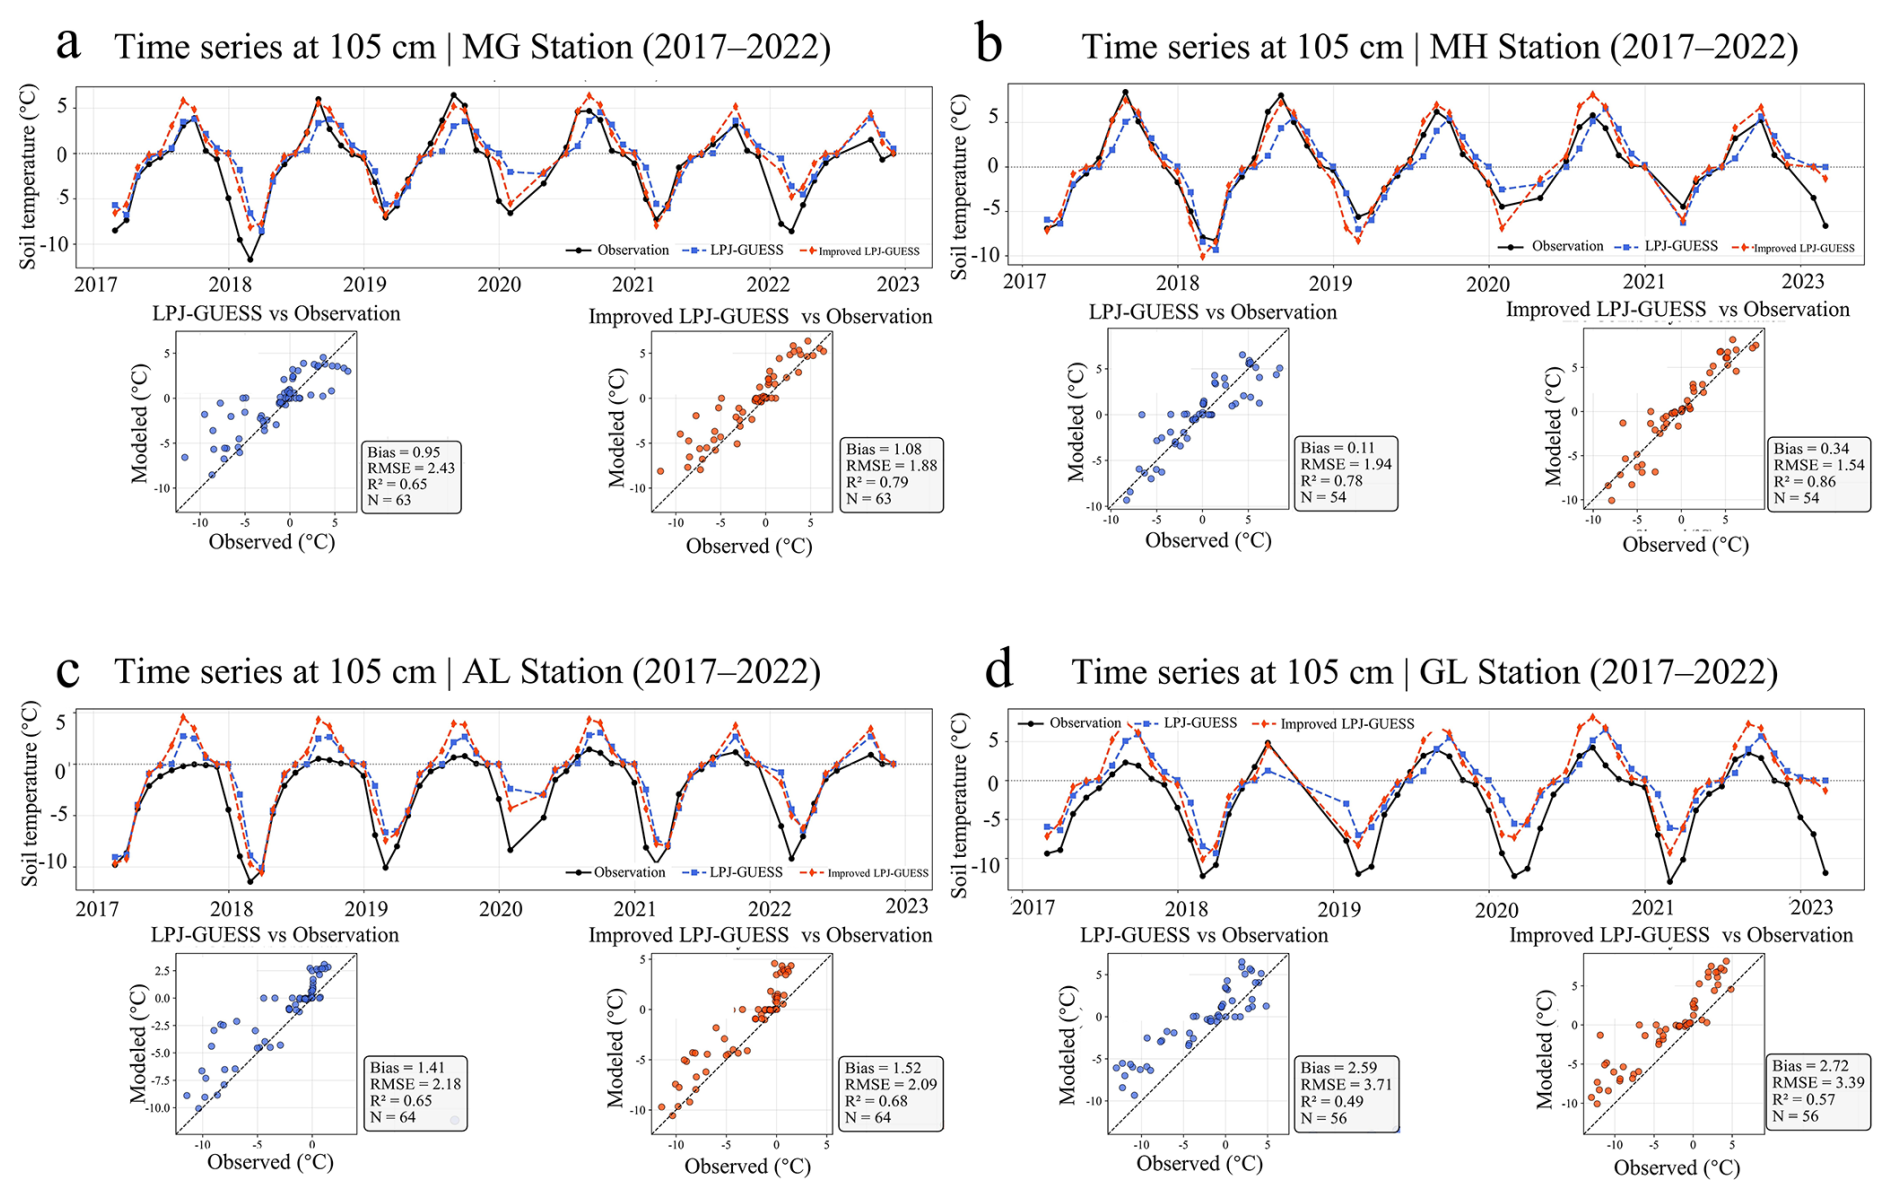
Figure A2Multi-site comparison of observed and simulated deep soil temperature at 105 cm depth for LPJ-GUESS and improved LPJ-GUESS during 2017–2022.
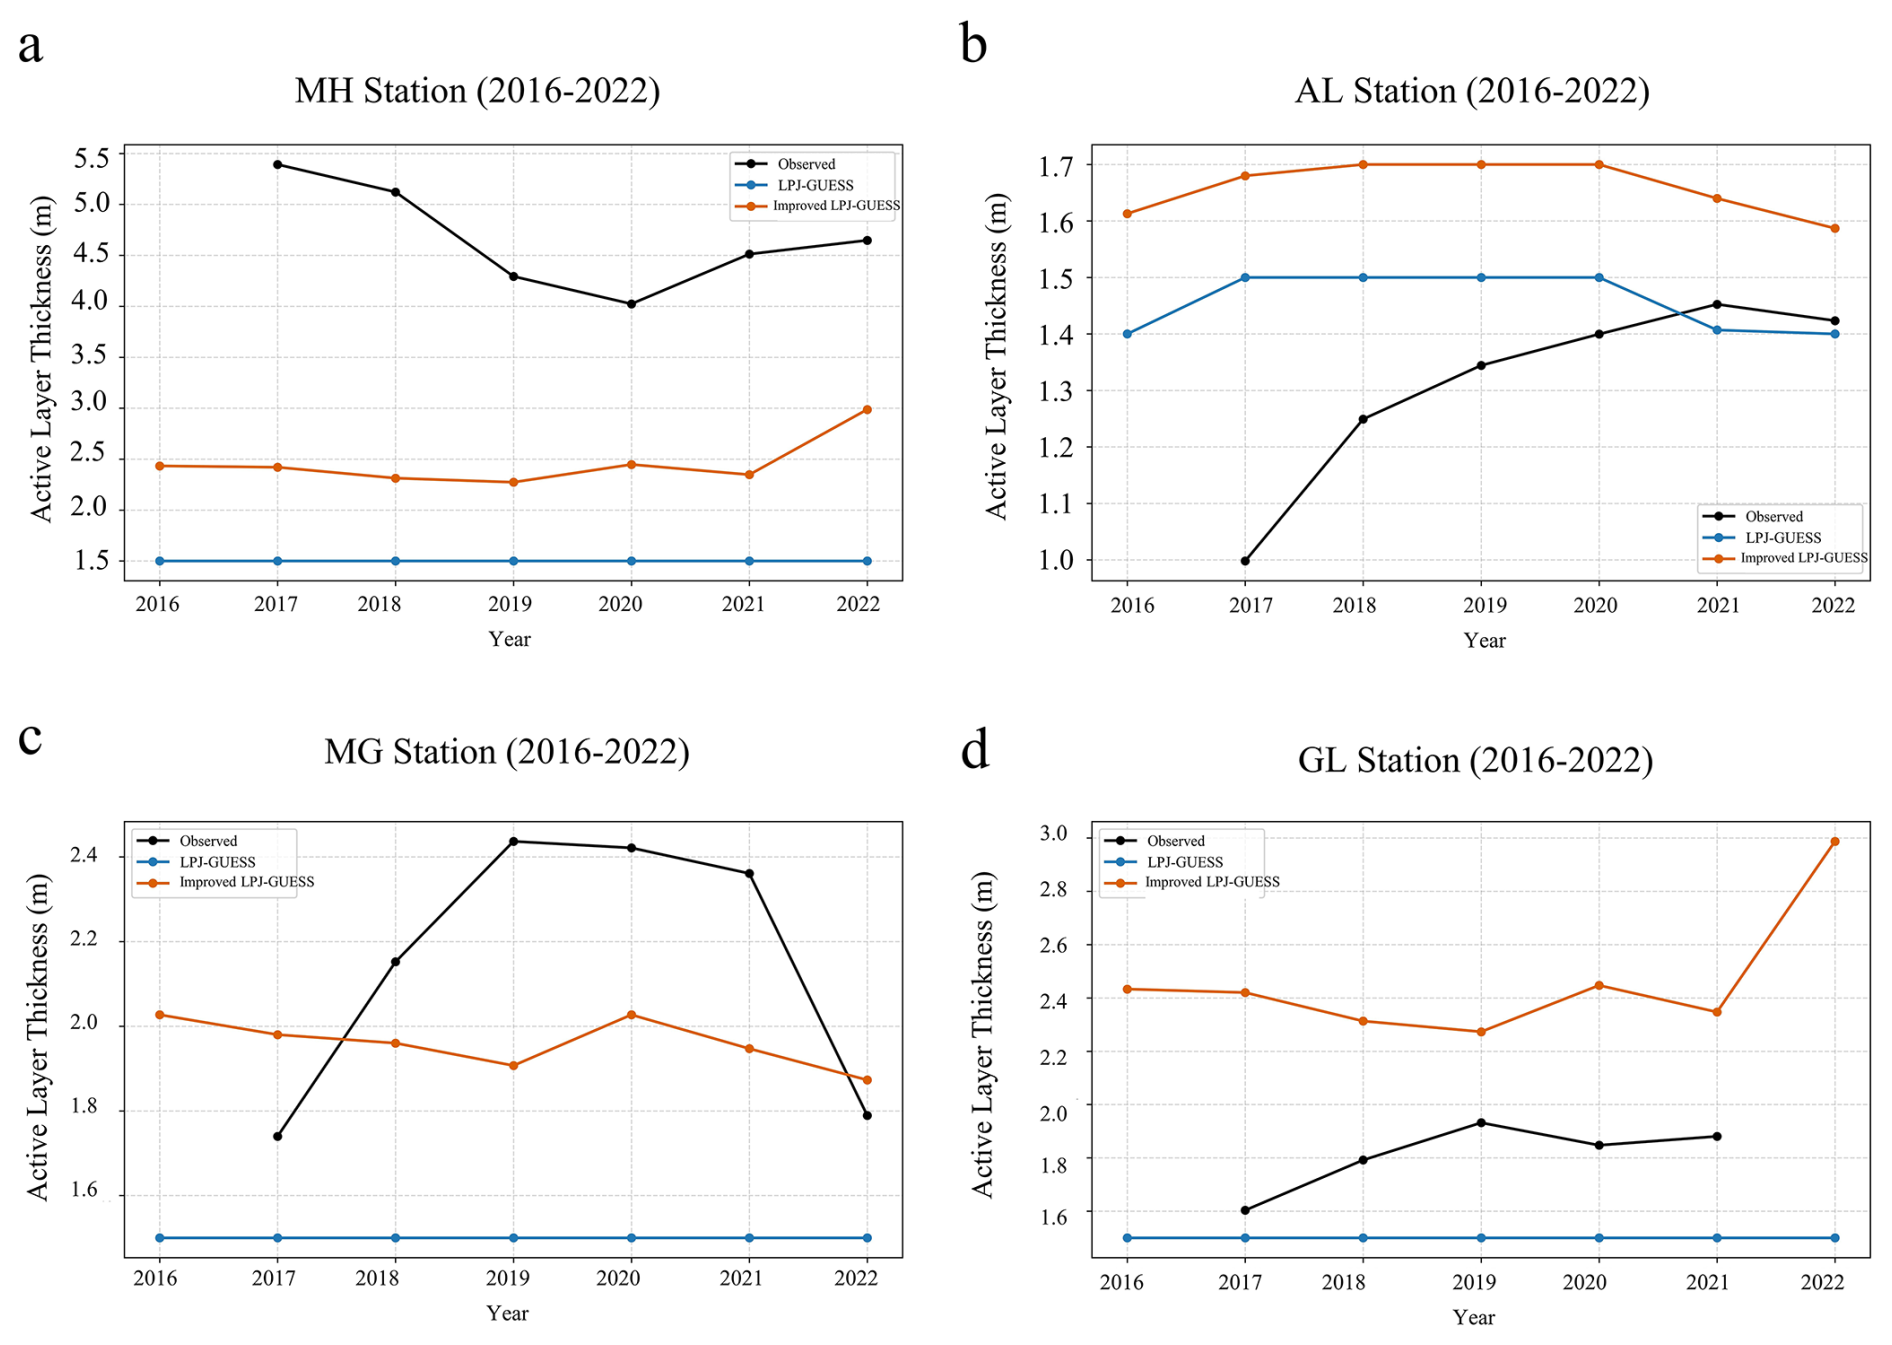
Figure A3Comparison of simulated active layer thickness (ALT) from LPJ-GUESS and improved LPJ-GUESS against observations at four permafrost monitoring sites.
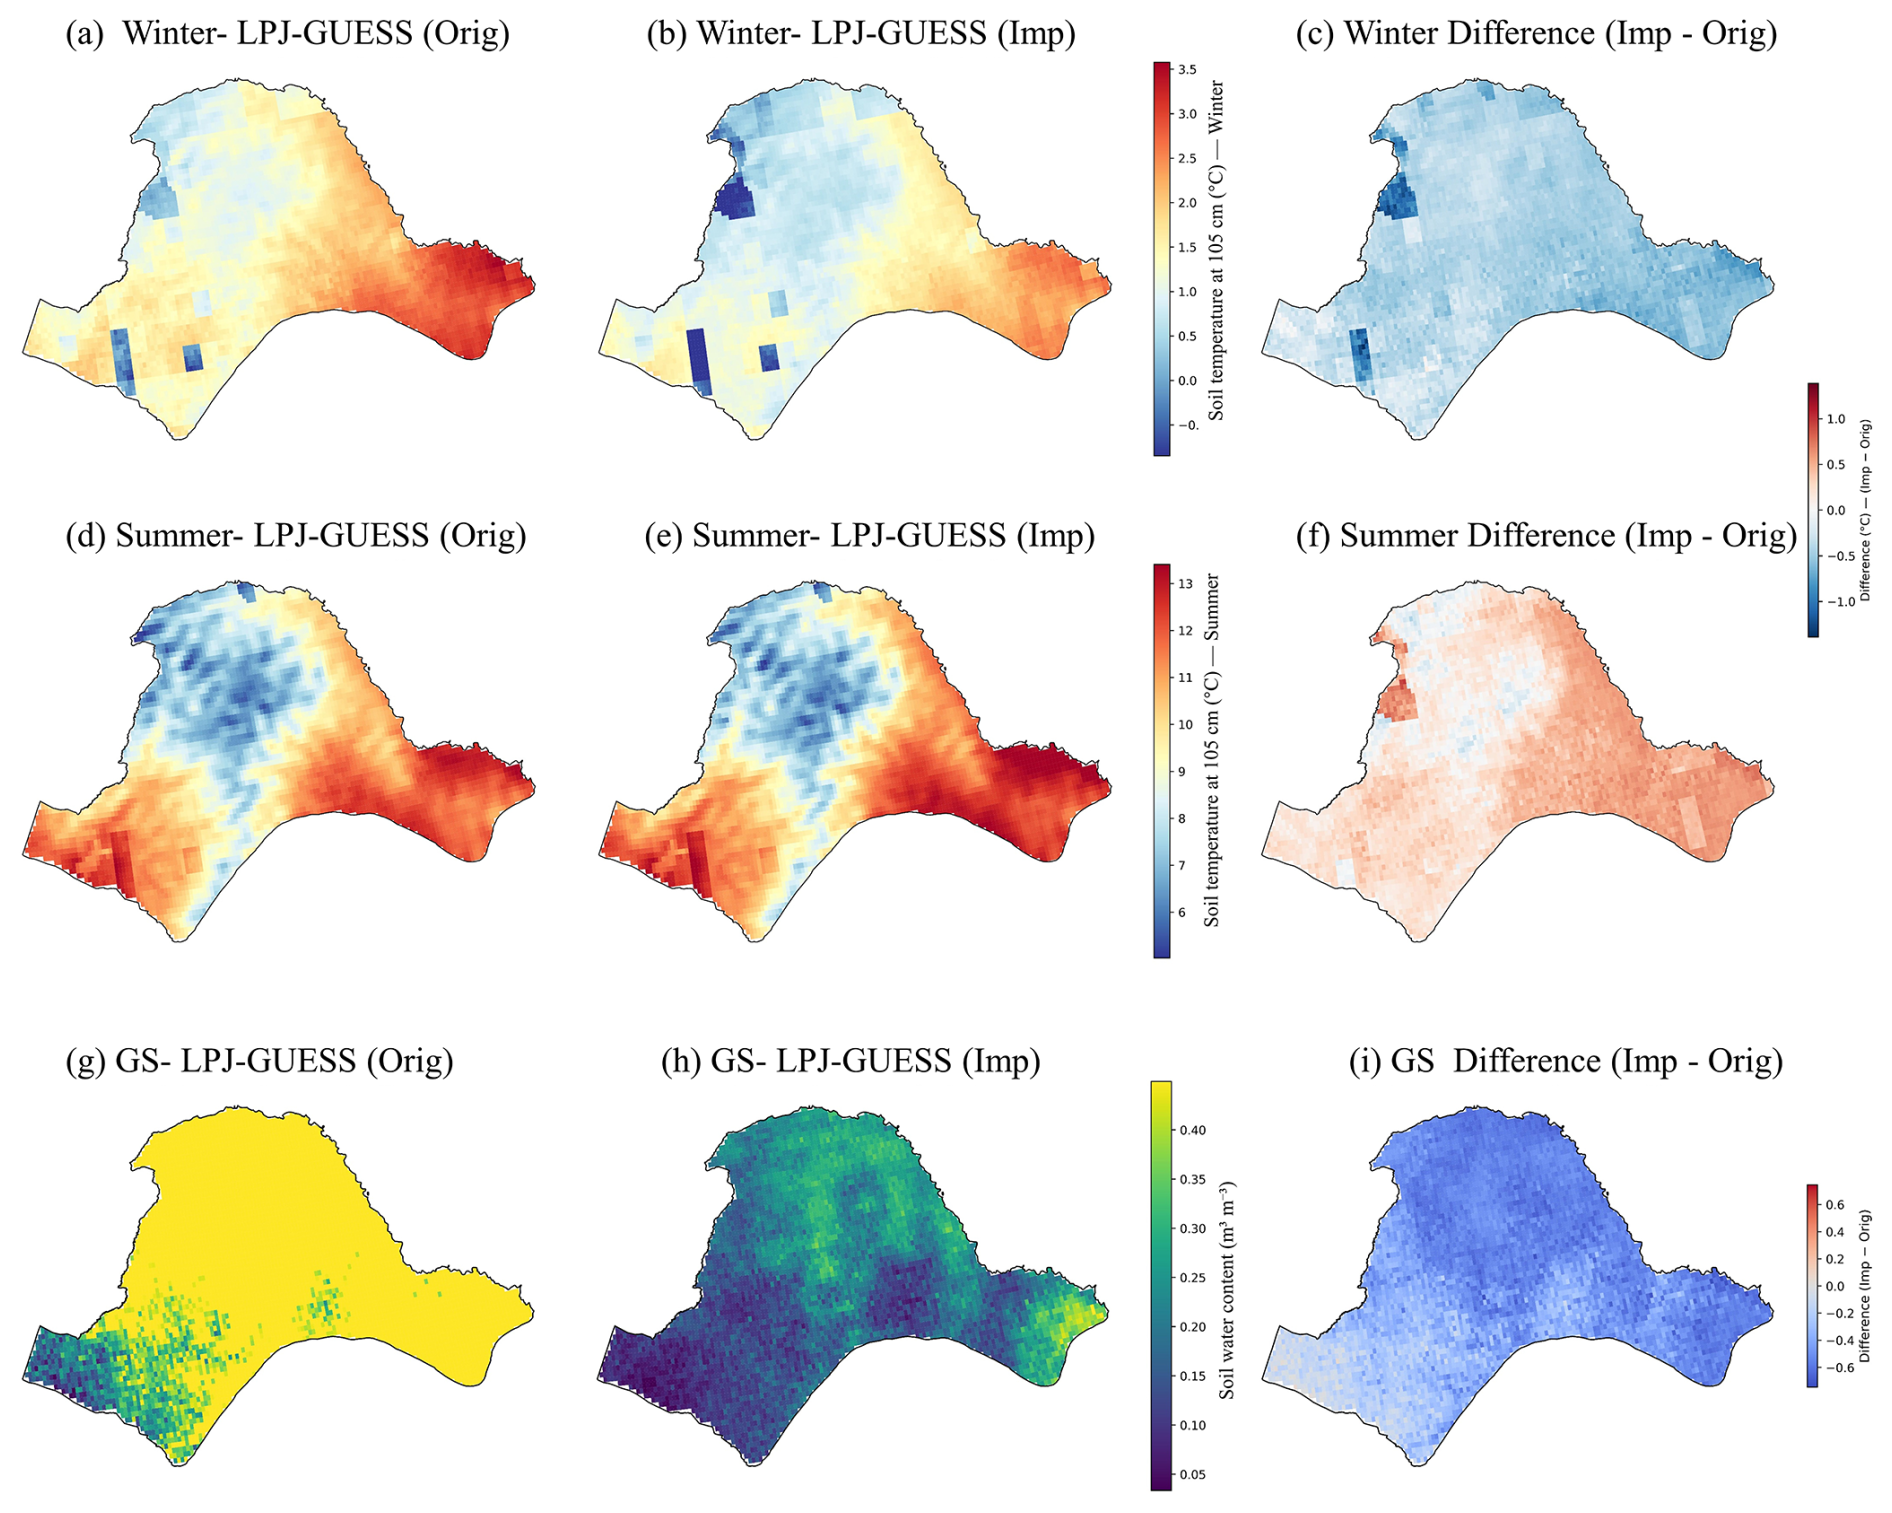
Figure A4Spatial distribution of differences in deep soil temperature and liquid soil water content between the improved LPJ-GUESS configuration and the original LPJ-GUESS across Northeast China. Panels (a)–(c) show winter (December–February) soil temperature at 105 cm depth for the original LPJ-GUESS configuration, the improved LPJ-GUESS configuration, and their difference (improved minus original). Panels (d)–(f) show the corresponding summer (June–August) soil temperature. Panels (g)–(i) show growing-season (June–August) volumetric liquid soil water content and model differences. Soil water content shown in panels (g)–(i) represents liquid soil water content.
Table B1Statistical performance metrics for soil temperature across soil depths for LPJ-GUESS and the revised model. Values represent the mean [min, max] across sites. Abbreviations: R, correlation coefficient; SDnorm, normalized standard deviation; RMSDnorm, normalized root mean square difference; Bias, mean bias; MAE, mean absolute error.
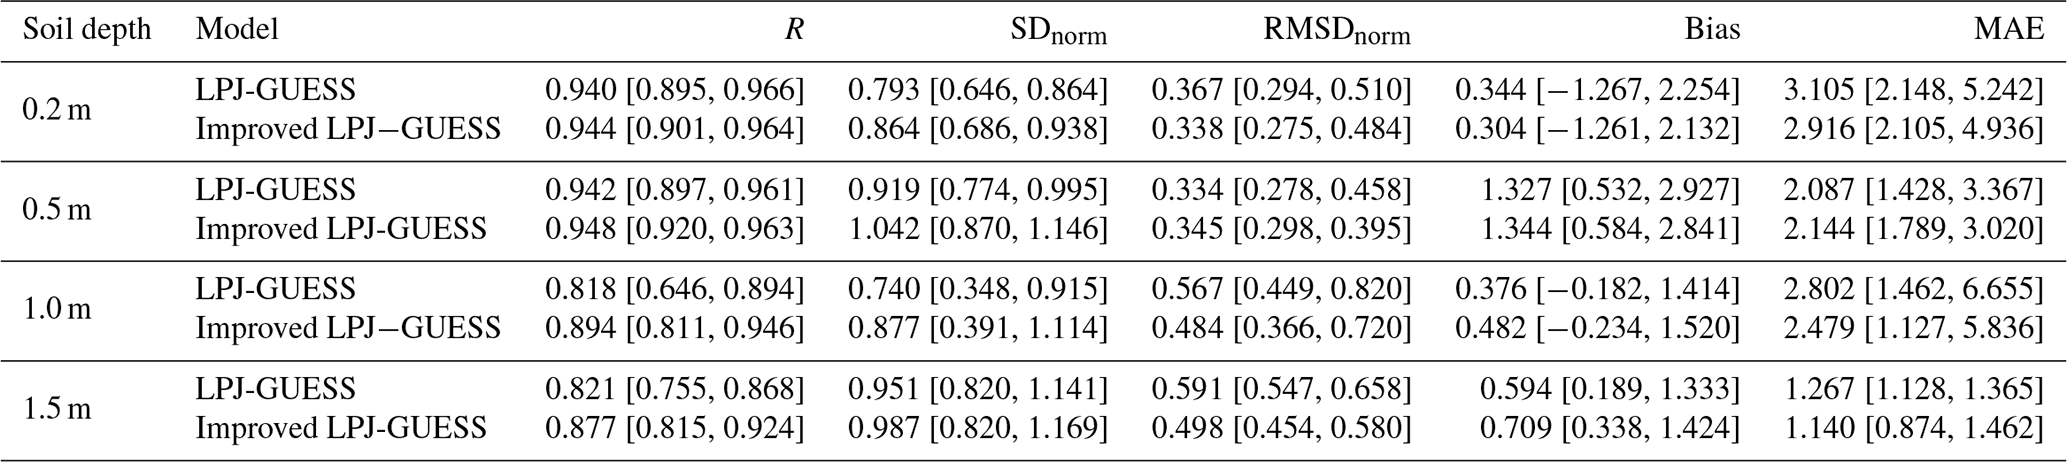
Table B2Statistical performance metrics for soil water content across soil depths based on single-site comparisons, including simulations with different soil-layer configurations (2L and 30L). In the model labels, 2L and 30L denote soil configurations with 2 and 30 soil layers, respectively. Abbreviations: R, correlation coefficient; SDnorm, normalized standard deviation; RMSDnorm, normalized root mean square difference; Bias, mean bias; MAE, mean absolute error.
LPJ-GUESS is developed and maintained by an international research community, with code management coordinated by the Department of Physical Geography and Ecosystem Science, Lund University, Sweden. The original LPJ-GUESS model (version 4.1.1) is publicly available from Zenodo at https://doi.org/10.5281/zenodo.8065737 (Nord et al., 2021). The modified permafrost-enabled version developed in this study, including the implementation of the improved soil thermal and hydrological processes, is archived on Zenodo at https://doi.org/10.5281/zenodo.18605313 (Yang et al., 2026b). Additional implementation details can be obtained from the corresponding author upon reasonable request.
Meteorological forcing data were obtained from the ERA5-Land reanalysis dataset (1980–2024) at a spatial resolution of 0.1°×0.1°, available from the Copernicus Climate Data Store (https://cds.climate.copernicus.eu, last access: 18 October 2026). Atmospheric CO2 concentration data were obtained from the NOAA Global Monitoring Laboratory (https://gml.noaa.gov/ccgg/trends/, last access: 18 October 2026). Soil physical parameters were derived from the Harmonized World Soil Database (HWSD v2.0), available at https://www.fao.org/soils-portal/data-hub/soil-maps-and-databases/harmonized-world-soil-database-v20 (last access: 18 October 2026). Site-level soil hydrothermal observations and flux tower data used for model evaluation were obtained from previously published datasets (Li et al., 2024; Yan et al., 2023).
H. Yang designed the study, implemented the model developments, performed the simulations and analyses, and wrote the original draft of the manuscript. S. M. Stuenzi contributed to model development and manuscript revision. F. Feng provided technical support and guidance on the LPJ-GUESS modelling framework. M. Langer, and Y. Xing supervised the research process and contributed to manuscript revision. All authors reviewed and edited the manuscript and approved the final version for publication.
The contact author has declared that none of the authors has any competing interests.
Publisher's note: Copernicus Publications remains neutral with regard to jurisdictional claims made in the text, published maps, institutional affiliations, or any other geographical representation in this paper. The authors bear the ultimate responsibility for providing appropriate place names. Views expressed in the text are those of the authors and do not necessarily reflect the views of the publisher.
We thank the LPJ-GUESS developer community for developing and maintaining the LPJ-GUESS model. We are grateful to the authors and platforms that provide the publicly available datasets used in this study. We thank Nitin Chaudhary for valuable discussions and constructive suggestions on model development and implementation, which helped improve this study. We thank the two anonymous referees and the associate editor for their constructive comments and suggestions, which helped improve the manuscript. We acknowledge support by the Open Access publication fund of Alfred-Wegener-Institut Helmholtz-Zentrum für Polar- und Meeresforschung.
Simone Maria Stuenzi acknowledges funding by BorealFrost (German Research Council, project number 525003358).
Moritz Langer acknowledges funding through the Federal Ministry of Research, Technology and Space (project ThinIce, grant no. 03F0943A).
The article processing charges for this open-access publication were covered by the Alfred-Wegener-Institut Helmholtz-Zentrum für Polar- und Meeresforschung.
This paper was edited by Daniel S. Goll and reviewed by two anonymous referees.
Alfaro-Sánchez, R., Richardson, A. D., Smith, S. L., Johnstone, J. F., Turetsky, M. R., Cumming, S. G., Le Moine, J. M., and Baltzer, J. L.: Permafrost Instability Negates the Positive Impact of Warming Temperatures on Boreal Radial Growth, P. Natl. Acad. Sci. USA, 121, e2411721121, https://doi.org/10.1073/pnas.2411721121, 2024. a
Anderegg, W. R. L., Trugman, A. T., Badgley, G., Konings, A. G., and Shaw, J.: Divergent Forest Sensitivity to Repeated Extreme Droughts, Nat. Clim. Change, 10, 1091–1095, https://doi.org/10.1038/s41558-020-00919-1, 2020. a
Billard, A., Bauer, R., Mothe, F., Jonard, M., Colin, F., and Longuetaud, F.: Improving Aboveground Biomass Estimates by Taking into Account Density Variations between Tree Components, Ann. For. Sci., 77, 103, https://doi.org/10.1007/s13595-020-00999-1, 2020. a
Blume-Werry, G., Milbau, A., Teuber, L. M., Johansson, M., and Dorrepaal, E.: Dwelling in the Deep – Strongly Increased Root Growth and Rooting Depth Enhance Plant Interactions with Thawing Permafrost Soil, New Phytol., 223, 1328–1339, https://doi.org/10.1111/nph.15903, 2019. a
Bradshaw, C. J. A. and Warkentin, I. G.: Global Estimates of Boreal Forest Carbon Stocks and Flux, Global Planet. Change, 128, 24–30, https://doi.org/10.1016/j.gloplacha.2015.02.004, 2015. a
Cai, Y., Zhu, P., Li, X., Liu, X., Chen, Y., Shen, Q., Xu, X., Zhang, H., Nie, S., Wang, C., Wang, J., Li, B., Wu, C., and Zhuang, H.: Dynamics of China's forest carbon storage: the first 30 m annual aboveground biomass mapping from 1985 to 2023, Earth Syst. Sci. Data, 17, 6993–7018, https://doi.org/10.5194/essd-17-6993-2025, 2025. a
Canadell, J., Jackson, R. B., Ehleringer, J. B., Mooney, H. A., Sala, O. E., and Schulze, E.-D.: Maximum Rooting Depth of Vegetation Types at the Global Scale, Oecologia, 108, 583–595, https://doi.org/10.1007/BF00329030, 1996. a
Drewniak, B. A.: Simulating Dynamic Roots in the Energy Exascale Earth System Land Model, J. Adv. Model. Earth Sy., 11, 338–359, https://doi.org/10.1029/2018MS001334, 2019. a
El Masri, B. and Xiao, J.: Comparison of Global Aboveground Biomass Estimates from Satellite Observations and Dynamic Global Vegetation Models, J. Geophys. Res.-Biogeo., 130, e2024JG008305, https://doi.org/10.1029/2024JG008305, 2025. a
Fan, Y., Clark, M., Lawrence, D. M., Swenson, S., Band, L. E., Brantley, S. L., Brooks, P. D., Dietrich, W. E., Flores, A., Grant, G., Kirchner, J. W., Mackay, D. S., McDonnell, J. J., Milly, P. C. D., Sullivan, P. L., Tague, C., Ajami, H., Chaney, N., Hartmann, A., Hazenberg, P., McNamara, J., Pelletier, J., Perket, J., Rouholahnejad-Freund, E., Wagener, T., Zeng, X., Beighley, E., Buzan, J., Huang, M., Livneh, B., Mohanty, B. P., Nijssen, B., Safeeq, M., Shen, C., van Verseveld, W., Volk, J., and Yamazaki, D.: Hillslope Hydrology in Global Change Research and Earth System Modeling, Water Resour. Res., 55, 1737–1772, https://doi.org/10.1029/2018WR023903, 2019. a
Gerten, D., Schaphoff, S., Haberlandt, U., Lucht, W., and Sitch, S.: Terrestrial Vegetation and Water Balance – Hydrological Evaluation of a Dynamic Global Vegetation Model, J. Hydrol., 286, 249–270, https://doi.org/10.1016/j.jhydrol.2003.09.029, 2004. a, b, c
Guimberteau, M., Zhu, D., Maignan, F., Huang, Y., Yue, C., Dantec-Nédélec, S., Ottlé, C., Jornet-Puig, A., Bastos, A., Laurent, P., Goll, D., Bowring, S., Chang, J., Guenet, B., Tifafi, M., Peng, S., Krinner, G., Ducharne, A., Wang, F., Wang, T., Wang, X., Wang, Y., Yin, Z., Lauerwald, R., Joetzjer, E., Qiu, C., Kim, H., and Ciais, P.: ORCHIDEE-MICT (v8.4.1), a land surface model for the high latitudes: model description and validation, Geosci. Model Dev., 11, 121–163, https://doi.org/10.5194/gmd-11-121-2018, 2018. a
He, R., Jin, H., Chang, X., Lü, L., Yu, S., Yang, S., Wang, S., and Sun, G.: Degradation status and causes of permafrost in northern Northeast China, Journal of Glaciology and Geocryology, 31, 829–834, https://doi.org/10.7522/j.issn.1000-0240.2009.0114, 2009. a
Helbig, M., Pappas, C., and Sonnentag, O.: Permafrost Thaw and Wildfire: Equally Important Drivers of Boreal Tree Cover Changes in the Taiga Plains, Canada, Geophys. Res. Lett., 43, 1598–1606, https://doi.org/10.1002/2015GL067193, 2016. a
Horvath, P., Tang, H., Halvorsen, R., Stordal, F., Tallaksen, L. M., Berntsen, T. K., and Bryn, A.: Improving the representation of high-latitude vegetation distribution in dynamic global vegetation models, Biogeosciences, 18, 95–112, https://doi.org/10.5194/bg-18-95-2021, 2021. a
Huang, C., Liang, Y., He, H. S., Wu, M. M., Liu, B., and Ma, T.: Sensitivity of aboveground biomass and species composition to climate change in boreal forests of Northeastern China, Ecol. Model., 445, 109472, https://doi.org/10.1016/j.ecolmodel.2021.109472, 2021. a
Huang, C., Feng, J., Tang, F., He, H. S., Liang, Y., Wu, M. M., Xu, W., Liu, B., Shi, F., and Chen, F.: Predicting the responses of boreal forests to climate-fire-vegetation interactions in Northeast China, Environ. Modell. Softw., 153, 105410, https://doi.org/10.1016/j.envsoft.2022.105410, 2022. a
Huang, H., Liu, C., Wang, X., Zhou, X., and Gong, P.: Integration of Multi-Resource Remotely Sensed Data and Allometric Models for Forest Aboveground Biomass Estimation in China, Remote Sens. Environ., 221, 225–234, https://doi.org/10.1016/j.rse.2018.11.017, 2019. a
Jiang, Y., Zhuang, Q., Schaphoff, S., Sitch, S., Sokolov, A., Kicklighter, D., and Melillo, J.: Uncertainty Analysis of Vegetation Distribution in the Northern High Latitudes during the 21st Century with a Dynamic Vegetation Model, Ecol. Evol., 2, 593–614, https://doi.org/10.1002/ece3.85, 2012. a
Jin, H., Yu, Q., Lü, L., Guo, D., He, R., Yu, S., Sun, G., and Li, Y.: Degradation of Permafrost in the Xing'anling Mountains, Northeastern China, Permafrost Periglac., 18, 245–258, https://doi.org/10.1002/ppp.589, 2007a. a
Jin, H., Yu, Q., Lü, L., Guo, D., He, R., Yu, S., Sun, G., and Li, Y.: Degradation of permafrost in the Xing'anling Mountains, northeastern China, Permafrost Periglac., 18, 245–258, https://doi.org/10.1002/ppp.589, 2007b. a
Jorgenson, M. T., Racine, C. H., Walters, J. C., and Osterkamp, T. E.: Permafrost Degradation and Ecological Changes Associated with a WarmingClimate in Central Alaska, Climatic Change, 48, 551–579, https://doi.org/10.1023/A:1005667424292, 2001. a
Kimball, J. S., McDonald, K. C., and Zhao, M.: Spring Thaw and Its Effect on Terrestrial Vegetation Productivity in the Western Arctic Observed from Satellite Microwave and Optical Remote Sensing, Earth Interact., 10, 1–22, https://doi.org/10.1175/EI187.1, 2006. a
Koven, C. D., Riley, W. J., Subin, Z. M., Tang, J. Y., Torn, M. S., Collins, W. D., Bonan, G. B., Lawrence, D. M., and Swenson, S. C.: The effect of vertically resolved soil biogeochemistry and alternate soil C and N models on C dynamics of CLM4, Biogeosciences, 10, 7109–7131, https://doi.org/10.5194/bg-10-7109-2013, 2013. a
Koven, C. D., Schuur, E. A. G., Schädel, C., Bohn, T. J., Burke, E. J., Chen, G., Chen, X., Ciais, P., Grosse, G., Harden, J. W., Hayes, D. J., Hugelius, G., Jafarov, E. E., Krinner, G., Kuhry, P., Lawrence, D. M., MacDougall, A. H., Marchenko, S. S., McGuire, A. D., Natali, S. M., Nicolsky, D. J., Olefeldt, D., Peng, S., Romanovsky, V. E., Schaefer, K. M., Strauss, J., Treat, C. C., and Turetsky, M.: A Simplified, Data-Constrained Approach to Estimate the Permafrost Carbon–Climate Feedback, Philos. T. R. Soc. A, 373, 20140423, https://doi.org/10.1098/rsta.2014.0423, 2015. a
Li, C., Sun, H., Liu, L., Dou, T., Zhou, M., Li, W., and Wu, X.: The Importance of Permafrost in the Steady and Fast Increase in Net Primary Production of the Grassland on the Qinghai–Tibet Plateau, CATENA, 211, 105964, https://doi.org/10.1016/j.catena.2021.105964, 2022. a
Li, X., Jin, H., Feng, Q., Wu, Q., Wang, H., He, R., Luo, D., Chang, X., Şerban, R.-D., and Zhan, T.: An integrated dataset of ground hydrothermal regimes and soil nutrients monitored in some previously burned areas in hemiboreal forests in Northeast China during 2016–2022, Earth Syst. Sci. Data, 16, 5009–5026, https://doi.org/10.5194/essd-16-5009-2024, 2024. a, b, c
Luo, Y., Wang, X., Ouyang, Z., Lu, F., Feng, L., and Tao, J.: A review of biomass equations for China's tree species, Earth Syst. Sci. Data, 12, 21–40, https://doi.org/10.5194/essd-12-21-2020, 2020. a
Mao, D., Luo, L., Wang, Z., Zhang, C., and Ren, C.: Variations in Net Primary Productivity and Its Relationships with Warming Climate in the Permafrost Zone of the Tibetan Plateau, J. Geogr. Sci., 25, 967–977, https://doi.org/10.1007/s11442-015-1213-8, 2015. a
Martín Belda, D., Anthoni, P., Wårlind, D., Olin, S., Schurgers, G., Tang, J., Smith, B., and Arneth, A.: LPJ-GUESS/LSMv1.0: a next-generation land surface model with high ecological realism, Geosci. Model Dev., 15, 6709–6745, https://doi.org/10.5194/gmd-15-6709-2022, 2022. a, b
Masarie, K. A. and Tans, P. P.: Extension and Integration of Atmospheric Carbon Dioxide Data into a Globally Consistent Measurement Record, J. Geophys. Res.-Atmos., 100, 11593–11610, https://doi.org/10.1029/95JD00859, 1995. a
Matthes, H., Damseaux, A., Westermann, S., Beer, C., Boone, A., Burke, E., Decharme, B., Genet, H., Jafarov, E., Langer, M., Parmentier, F.-J., Porada, P., Gagne-Landmann, A., Huntzinger, D., Rogers, B. M., Schädel, C., Stacke, T., Wells, J., and Wieder, W. R.: Advances in Permafrost Representation: Biophysical Processes in Earth System Models and the Role of Offline Models, Permafrost Periglac., 36, 302–318, https://doi.org/10.1002/ppp.2269, 2025. a
Mauer, O. and Palátová, E.: The Role of Root System in Silver Birch (Betula Pendula Roth) Dieback in the Air-Polluted Area of Krušné Hory Mts, Journal of Forest Science, 49, 191–199, https://doi.org/10.17221/4693-JFS, 2003. a
Muñoz-Sabater, J., Dutra, E., Agustí-Panareda, A., Albergel, C., Arduini, G., Balsamo, G., Boussetta, S., Choulga, M., Harrigan, S., Hersbach, H., Martens, B., Miralles, D. G., Piles, M., Rodríguez-Fernández, N. J., Zsoter, E., Buontempo, C., and Thépaut, J.-N.: ERA5-Land: a state-of-the-art global reanalysis dataset for land applications, Earth Syst. Sci. Data, 13, 4349–4383, https://doi.org/10.5194/essd-13-4349-2021, 2021. a
Neuenschwander, A., Guenther, E., White, J. C., Duncanson, L., and Montesano, P.: Validation of ICESat-2 terrain and canopy heights in boreal forests, Remote Sens. Environ., 251, 112110, https://doi.org/10.1016/j.rse.2020.112110, 2020. a
Neuenschwander, A. and Pitts, K.: The ATL08 Land and Vegetation Product for the ICESat-2 Mission, Remote Sens. Environ., 221, 247–259, https://doi.org/10.1016/j.rse.2018.11.005, 2019. a
Nord, J., Anthoni, P., Gregor, K., Gustafson, A., Hantson, S., Lindeskog, M., Meyer, B., Miller, P., Nieradzik, L., Olin, S., Papastefanou, P., Smith, B., Tang, J., Wårlind, D., and past LPJ-GUESS contributors: LPJ-GUESS Release v4.1.1 Model Code, Zenodo [code], https://doi.org/10.5281/zenodo.8065737, 2021. a, b
O'Sullivan, M., Friedlingstein, P., Sitch, S., Anthoni, P., Arneth, A., Arora, V. K., Bastrikov, V., Delire, C., Goll, D. S., Jain, A., Kato, E., Kennedy, D., Knauer, J., Lienert, S., Lombardozzi, D., McGuire, P. C., Melton, J. R., Nabel, J. E. M. S., Pongratz, J., Poulter, B., Séférian, R., Tian, H., Vuichard, N., Walker, A. P., Yuan, W., Yue, X., and Zaehle, S.: Process-Oriented Analysis of Dominant Sources of Uncertainty in the Land Carbon Sink, Nat. Commun., 13, 4781, https://doi.org/10.1038/s41467-022-32416-8, 2022. a, b
Pan, Y., Birdsey, R. A., Phillips, O. L., Houghton, R. A., Fang, J., Kauppi, P. E., Keith, H., Kurz, W. A., Ito, A., Lewis, S. L., Nabuurs, G.-J., Shvidenko, A., Hashimoto, S., Lerink, B., Schepaschenko, D., Castanho, A., and Murdiyarso, D.: The Enduring World Forest Carbon Sink, Nature, 631, 563–569, https://doi.org/10.1038/s41586-024-07602-x, 2024. a, b
Pascual, D., Johansson, M., Pongracz, A., and Tang, J.: Accounting for Winter Warming Events in the Ecosystem Model LPJ-GUESS: Evaluation and Outlook, J. Geophys. Res.-Biogeo., 129, e2023JG007464, https://doi.org/10.1029/2023JG007464, 2024. a
Peng, R., Liu, H., Anenkhonov, O. A., Sandanov, D. V., Korolyuk, A. Y., Shi, L., Xu, C., Dai, J., and Wang, L.: Tree Growth Is Connected with Distribution and Warming-Induced Degradation of Permafrost in Southern Siberia, Glob. Change Biol., 28, 5243–5253, https://doi.org/10.1111/gcb.16284, 2022. a, b, c, d
Phillips, O. L., Sullivan, M. J. P., Baker, T. R., Monteagudo Mendoza, A., Vargas, P. N., and Vásquez, R.: Species Matter: Wood Density Influences Tropical Forest Biomass at Multiple Scales, Surv. Geophys., 40, 913–935, https://doi.org/10.1007/s10712-019-09540-0, 2019. a
Pongracz, A., Wårlind, D., Miller, P. A., and Parmentier, F.-J. W.: Model simulations of arctic biogeochemistry and permafrost extent are highly sensitive to the implemented snow scheme in LPJ-GUESS, Biogeosciences, 18, 5767–5787, https://doi.org/10.5194/bg-18-5767-2021, 2021. a, b, c, d
Quillet, A., Peng, C., and Garneau, M.: Toward Dynamic Global Vegetation Models for Simulating Vegetation–Climate Interactions and Feedbacks: Recent Developments, Limitations, and Future Challenges, Environ. Rev., 18, 333–353, https://doi.org/10.1139/A10-016, 2010. a
Ran, Y., Li, X., Lu, L., and Li, Z.: Large-Scale Land Cover Mapping with the Integration of Multi-Source Information Based on the Dempster–Shafer Theory, Int. J. Geogr. Inf. Sci., 26, 169–191, https://doi.org/10.1080/13658816.2011.577745, 2012. a, b, c, d
Rantanen, M., Karpechko, A. Y., Lipponen, A., Nordling, K., Hyvärinen, O., Ruosteenoja, K., Vihma, T., and Laaksonen, A.: The Arctic Has Warmed Nearly Four Times Faster than the Globe since 1979, Communications Earth & Environment, 3, 168, https://doi.org/10.1038/s43247-022-00498-3, 2022. a
Rawlins, M. A., McGuire, A. D., Kimball, J. S., Dass, P., Lawrence, D., Burke, E., Chen, X., Delire, C., Koven, C., MacDougall, A., Peng, S., Rinke, A., Saito, K., Zhang, W., Alkama, R., Bohn, T. J., Ciais, P., Decharme, B., Gouttevin, I., Hajima, T., Ji, D., Krinner, G., Lettenmaier, D. P., Miller, P., Moore, J. C., Smith, B., and Sueyoshi, T.: Assessment of model estimates of land-atmosphere CO2 exchange across Northern Eurasia, Biogeosciences, 12, 4385–4405, https://doi.org/10.5194/bg-12-4385-2015, 2015. a
Sakschewski, B., von Bloh, W., Drüke, M., Sörensson, A. A., Ruscica, R., Langerwisch, F., Billing, M., Bereswill, S., Hirota, M., Oliveira, R. S., Heinke, J., and Thonicke, K.: Variable tree rooting strategies are key for modelling the distribution, productivity and evapotranspiration of tropical evergreen forests, Biogeosciences, 18, 4091–4116, https://doi.org/10.5194/bg-18-4091-2021, 2021. a
Schaphoff, S., Hötten, D., Müller, C., Gerten, D., Ostberg, S., and von Bloh, W.: Implementing methane dynamics into the LPJmL6 model, Geosci. Model Dev., 19, 7615–7651, https://doi.org/10.5194/gmd-19-7615-2026, 2026. a, b
Shan, W., Zhang, C., Guo, Y., Qiu, L., Xu, Z., Wang, Y., Shan, W., Zhang, C., Guo, Y., Qiu, L., Xu, Z., and Wang, Y.: Spatial Distribution and Variation Characteristics of Permafrost Temperature in Northeast China, Sustainability, 14, https://doi.org/10.3390/su14138178, 2022. a
Shur, Y. L. and Jorgenson, M. T.: Patterns of Permafrost Formation and Degradation in Relation to Climate and Ecosystems, Permafrost Periglac., 18, 7–19, https://doi.org/10.1002/ppp.582, 2007. a
Sinitambirivoutin, M., Milne, E., Schiettecatte, L.-S., Tzamtzis, I., Dionisio, D., Henry, M., Brierley, I., Salvatore, M., and Bernoux, M.: An Updated IPCC Major Soil Types Map Derived from the Harmonized World Soil Database v2.0, CATENA, 244, 108258, https://doi.org/10.1016/j.catena.2024.108258, 2024. a
Sitch, S., Smith, B., Prentice, I. C., Arneth, A., Bondeau, A., Cramer, W., Kaplan, J. O., Levis, S., Lucht, W., Sykes, M. T., Thonicke, K., and Venevsky, S.: Evaluation of Ecosystem Dynamics, Plant Geography and Terrestrial Carbon Cycling in the LPJ Dynamic Global Vegetation Model, Glob. Change Biol., 9, 161–185, https://doi.org/10.1046/j.1365-2486.2003.00569.x, 2003. a, b
Smith, B., Prentice, I. C., and Sykes, M. T.: Representation of Vegetation Dynamics in the Modelling of Terrestrial Ecosystems: Comparing Two Contrasting Approaches within European Climate Space, Global Ecol. Biogeogr., 10, 621–637, https://doi.org/10.1046/j.1466-822X.2001.t01-1-00256.x, 2001. a, b
Smith, B., Wårlind, D., Arneth, A., Hickler, T., Leadley, P., Siltberg, J., and Zaehle, S.: Implications of incorporating N cycling and N limitations on primary production in an individual-based dynamic vegetation model, Biogeosciences, 11, 2027–2054, https://doi.org/10.5194/bg-11-2027-2014, 2014. a, b, c
Szwagrzyk, J. and Gazda, A.: Above-Ground Standing Biomass and Tree Species Diversity in Natural Stands of Central Europe, J. Veg. Sci., 18, 555–562, https://doi.org/10.1111/j.1654-1103.2007.tb02569.x, 2007. a
Terrer, C., Phillips, R. P., Hungate, B. A., Rosende, J., Pett-Ridge, J., Craig, M. E., van Groenigen, K. J., Keenan, T. F., Sulman, B. N., Stocker, B. D., Reich, P. B., Pellegrini, A. F. A., Pendall, E., Zhang, H., Evans, R. D., Carrillo, Y., Fisher, J. B., Van Sundert, K., Vicca, S., and Jackson, R. B.: A Trade-off between Plant and Soil Carbon Storage under Elevated CO2, Nature, 591, 599–603, https://doi.org/10.1038/s41586-021-03306-8, 2021. a
Todd-Brown, K. E. O., Randerson, J. T., Hopkins, F., Arora, V., Hajima, T., Jones, C., Shevliakova, E., Tjiputra, J., Volodin, E., Wu, T., Zhang, Q., and Allison, S. D.: Changes in soil organic carbon storage predicted by Earth system models during the 21st century, Biogeosciences, 11, 2341–2356, https://doi.org/10.5194/bg-11-2341-2014, 2014. a
Treat, C. C., Jones, M. C., Alder, J., and Frolking, S.: Hydrologic Controls on Peat Permafrost and Carbon Processes: New Insights from Past and Future Modeling, Frontiers in Environmental Science, 10, https://doi.org/10.3389/fenvs.2022.892925, 2022. a
Walker, X. J., Baltzer, J. L., Cumming, S. G., Day, N. J., Ebert, C., Goetz, S., Johnstone, J. F., Potter, S., Rogers, B. M., Schuur, E. A. G., Turetsky, M. R., and Mack, M. C.: Increasing Wildfires Threaten Historic Carbon Sink of Boreal Forest Soils, Nature, 572, 520–523, https://doi.org/10.1038/s41586-019-1474-y, 2019. a
Walvoord, M. A. and Kurylyk, B. L.: Hydrologic Impacts of Thawing Permafrost – a Review, Vadose Zone J., 15, vzj2016.01.0010, https://doi.org/10.2136/vzj2016.01.0010, 2016. a, b, c
Wang, J. A., Baccini, A., Farina, M., Randerson, J. T., and Friedl, M. A.: Disturbance Suppresses the Aboveground Carbon Sink in North American Boreal Forests, Nat. Clim. Change, 11, 435–441, https://doi.org/10.1038/s41558-021-01027-4, 2021. a, b, c
Wang, T., Yang, D., Zheng, G., and Shi, R.: Possible Negative Effects of Earlier Thaw Onset and Longer Thaw Duration on Vegetation Greenness over the Tibetan Plateau, Agr. Forest Meteorol., 326, 109192, https://doi.org/10.1016/j.agrformet.2022.109192, 2022. a
Wania, R., Ross, I., and Prentice, I. C.: Integrating Peatlands and Permafrost into a Dynamic Global Vegetation Model: 2. Evaluation and Sensitivity of Vegetation and Carbon Cycle Processes, Global Biogeochem. Cy., 23, 2008GB003413, https://doi.org/10.1029/2008GB003413, 2009a. a, b
Wania, R., Ross, I., and Prentice, I. C.: Integrating Peatlands and Permafrost into a Dynamic Global Vegetation Model: 1. Evaluation and Sensitivity of Physical Land Surface Processes, Global Biogeochem. Cy., 23, 2008GB003412, https://doi.org/10.1029/2008GB003412, 2009b. a, b
Wei, N. and Xia, J.: Robust Projections of Increasing Land Carbon Storage in Boreal and Temperate Forests under Future Climate Change Scenarios, One Earth, 7, 88–99, https://doi.org/10.1016/j.oneear.2023.11.013, 2024. a
Wu, L.: Distribution Map of Frozen Ground in China Based on the Map of Snow, Ice and Frozen Ground in China, National Cryosphere Desert Data Center [data set], https://doi.org/10.12072/ncdc.Westdc.db0029.2021, 2021. a
Xu, X., Liu, J., Zhang, S., Li, R., Yan, C., and Wu, S.: China’s Multi-Period Land Use Land Cover Remote Sensing Monitoring Dataset (CNLUCC), Resource and Environmental Science Data Registration and Publishing System [data set], https://doi.org/10.12078/2018070201, 2018. a
Yan, Y., Zhou, L., Zhou, G., Jia, B., Song, J., and Zhang, S.: A Dataset of Carbon and Water Fluxes of the Boreal Forest Ecosystem in Huzhong (2014 – 2018), China Scientific Data, 8, https://doi.org/10.11922/11-6035.csd.2023.0019.zh, 2023. a
Yang, H., Ciais, P., Santoro, M., Huang, Y., Li, W., Wang, Y., Bastos, A., Goll, D., Arneth, A., Anthoni, P., Arora, V. K., Friedlingstein, P., Harverd, V., Joetzjer, E., Kautz, M., Lienert, S., Nabel, J. E. M. S., O'Sullivan, M., Sitch, S., Vuichard, N., Wiltshire, A., and Zhu, D.: Comparison of Forest Above-Ground Biomass from Dynamic Global Vegetation Models with Spatially Explicit Remotely Sensed Observation-Based Estimates, Glob. Change Biol., 26, 3997–4012, https://doi.org/10.1111/gcb.15117, 2020. a, b
Yang, H., Xing, Y., Chang, X., Wang, J., Li, Y., Tang, J., and Wang, D.: Internal Response of Vegetation Growth to Degrees of Permafrost Degradation in Northeast China from 2001 to 2020, Geo-spatial Information Science, 28, 265–283, https://doi.org/10.1080/10095020.2024.2363618, 2025. a
Yang, H., Tang, J., Chang, X., Wang, J., Gong, W., Wang, D., and Xing, Y.: Permafrost degradation: A critical driver of aboveground carbon sink loss in China's boreal forests, CATENA, 265, 109912, https://doi.org/10.1016/j.catena.2026.109912, 2026a. a
Yang, H., Stuenzi, S. M., Xing, Y., and Langer, M.: LPJ-GUESS-Cryo: Improved Permafrost Soil and Hydrothermal Representation for Boreal Forest Carbon Dynamics, Zenodo [code], https://doi.org/10.5281/zenodo.18605313, 2026b. a
Zhang, W., Miller, P. A., Smith, B., Wania, R., Koenigk, T., and Döscher, R.: Tundra Shrubification and Tree-Line Advance Amplify Arctic Climate Warming: Results from an Individual-Based Dynamic Vegetation Model, Environ. Res. Lett., 8, 034023, https://doi.org/10.1088/1748-9326/8/3/034023, 2013. a
Zhang, Z., Li, M., Wu, Q., Wang, X., Jin, H., Chen, H., Ma, D., and Zhang, Z.: Degradation and Local Growth of “Xing'an-Baikal” Permafrost Responding to Climate Warming and the Consequences, Earth-Sci. Rev., 255, 104865, https://doi.org/10.1016/j.earscirev.2024.104865, 2024. a
Zhu, Y., Xia, X., Canadell, J. G., Piao, S., Lu, X., Mishra, U., Wang, X., Yuan, W., and Qin, Z.: China's Carbon Sinks from Land-Use Change Underestimated, Nat. Clim. Change, 15, 428–435, https://doi.org/10.1038/s41558-025-02296-z, 2025. a