
the Creative Commons Attribution 4.0 License.
the Creative Commons Attribution 4.0 License.
 | 05 Nov 2026
Spatiotemporal variations of carbon-water-hydraulic risk for Pinus tabuliformis Carrière Plantations on the Loess Plateau under future climate change
Tianqi Guo
Zhongdian Zhang
Rui Liu
Xiaofei Wu
Xinmei Liu
Chenyi Ju

As a native perennial tree, Pinus tabuliformis Carrière (PT) has been widely planted on the Chinese Loess Plateau for ecological restoration. However, the impacts of climate-change on water resources pose a new challenge to the sustainability of restored ecosystems. To clarify the plantation carbon sequestration and water consumption, as well as their underlying physiological mechanisms, this study coupled the integrated BBGC-Sperry model with CMIP6 meteorological data under SSP1–2.6, SSP2–4.5, and SSP5–8.5. Daily transpiration, soil water content, and leaf water potential, along with multi-site total growing-season transpiration and aboveground biomass data, were used to validate the BBGC-Sperry model. The validated model was used to simulate the dynamics of annual mean NPP, annual mean actual evapotranspiration (ET) and annual average percentage loss of whole-plant hydraulic conductance (APLK) for PT plantations at 130 meteorological stations on the Loess Plateau. We integrated a “carbon-water-hydraulic risk index” (CWHRI) based on NPP, ET, and drought-induced mortality risk probability (DMRP) to assess ecosystem sustainability. These simulations covered the baseline period (2000–2024) and three future periods (2025–2049, NFP; 2050–2074, MFP; and 2075–2099, FFP) under three Shared Socioeconomic Pathways (SSP1–2.6, SSP2–4.5, and SSP5–8.5). The results indicate that compared with the baseline period, the annual mean NPP is projected to decrease by 4 %–27 % under all scenario–period combinations, except for the FFP under SSP5–8.5, where it will increase by 8 %. Annual mean ET and APLK are projected to increase from 0.05 %–61 % and 13 %–84 %, respectively, with the smallest increases under SSP1–2.6 with the NFP and the largest under SSP5–8.5 with the FFP. The CWHRI is projected to decline by 23 %–44 %, and exhibit a southeast-to-northwest decreasing gradient, which is dominated by NPP, with a secondary contribution from water-related environmental factors. These findings indicate the rising DMRP of PT plantations will threaten the sustainability of restored ecosystems on the Loess Plateau in the future.
- Article
(6753 KB) - Full-text XML
-
Supplement
(1161 KB) - BibTeX
- EndNote


Plantations play a vital role in ecological restoration (Fan et al., 2024; Chen et al., 2025) and significantly contribute to global biogeochemical cycles (Piao et al., 2020). The monoculture plantations can quickly boost regional ecosystem productivity and carbon storage (Li et al., 2025a). However, against the backdrop of rising global temperatures and shifting precipitation patterns, the frequent occurrence of compound drought events poses an increasingly severe threat to the physiological processes of forest plantations, while triggering a series of negative hydrological feedback effects, especially in ecologically fragile regions (Tang and Chen, 2025; Qi et al., 2025; Zhou et al., 2019; Feng et al., 2016; Brodribb et al., 2020; Ma et al., 2023; Liu et al., 2023; Li et al., 2025b). These phenomena have raised concerns about the production, ecological benefits, and drought-induced mortality risk of plantations under the future climate change (Li et al., 2025a). Therefore, accurately assessing the response of plantation productivity, evapotranspiration, and drought-induced mortality risk to climate change is a critical prerequisite for developing adaptive management strategies and ensuring ecological security.
Most current regional-scale studies rely on environmental surrogate indicators such as meteorological drought indices, soil moisture, forest net primary productivity (NPP), or remote sensing-based vegetation greenness or productivity models to obtain information on ecosystem or individual plant growth (Jiao et al., 2021; Li et al., 2021; Chen et al., 2024b; He et al., 2024; Wang et al., 2025). These traditional assessment methods can characterize ecological functionality macroscopically, but they fail to capture the critical internal physiological mechanisms underlying tree survival under drought stress, resulting in a gap in understanding of drought-induced mechanisms in forests under climate change. These methodological limitations may lead to an overestimation of vegetation growth, as plant physiological responses occur faster than canopy changes under drought stress (Tang et al., 2026). Therefore, accurately assessing drought-induced mortality risk at the regional scale can provide a deeper understanding of the security and sustainability of plantation restoration ecosystems.
Currently, investigating the mechanisms of drought-induced tree mortality is daunting due to the complex physiological and ecological processes involved (McDowell et al., 2008, 2022; Arend et al., 2021). A comprehensive drought response mechanism should start from climatic drivers, proceed through the regulation of ecosystem hydrological processes, and ultimately affect the physiological processes of individual trees, thereby determining their mortality probability (McDowell et al., 2022; Ma et al., 2023). At the regional scale, field monitoring is time-consuming and labor-intensive. Therefore, there is an urgent need for models that integrate plant hydraulic and ecological processes. Zhang et al. (2020) developed the ecohydrological-hydraulic BBGC-Sperry model by coupling a plant hydraulic process model (Sperry model) with a biogeochemical model (Biome-BGC model). This model uses a supply–demand function to overcome the limitations of empirical functions in describing plant water use responses to soil and atmospheric drought. Yan et al. (2022) have successfully used this model to assess the drought-induced mortality risk of Robinia pseudoacacia at plantations four meteorological stations across a typical precipitation gradient on the Loess Plateau. Wu et al. (2026) improved the Penman–Monteith equation used in the BBGC-Sperry model for evapotranspiration calculations, enhancing its ability to account for the effects of elevated atmospheric CO2 on evapotranspiration. This improvement enabled accurate assessment of actual evapotranspiration (ET) in PT plantations on the Loess Plateau. These model improvements and applications provide a solid foundation for assessing the growth dynamics of plantations on the Loess Plateau. However, existing studies have been largely conducted at the site scale, and the application of this model at the regional scale remains to be validated. The improved BBGC-Sperry model allows for more accurate simulations of key vegetation growth and physiological indicators, including net primary productivity (NPP), evapotranspiration (ET), and the annual average percentage loss of whole-plant hydraulic conductance (APLK). It serves as a reliable tool for revealing the true vulnerability of forests, avoiding systemic misjudgments, and supporting the construction of a “Carbon-Water-Hydraulic Risk Index” (CWHRI) framework.
The Loess Plateau of China is one of the most climate-sensitive regions globally, with a warming rate above the global average and increasing variability in precipitation (Yan et al., 2022). To address land degradation and wind erosion, large-scale afforestation projects, such as the “Grain-for-Green” program, have been implemented in the region since the 1990s (Li et al., 2021). Pinus tabuliformis Carrière (PT) plantations have been widely planted due to their strong drought tolerance and soil fixation capacity, and now form an important regional ecological barrier (Chen et al., 2008). However, PT plantations may lead to a continuous decline in soil water storage due to their high water consumption, potentially resulting in the formation of stable dry layers (Chen et al., 2024a). This suggests a potential risk of water imbalance, making tree growth increasingly dependent on unstable precipitation inputs. In some restored areas, PT plantations have already exhibited browning. The uncertainty of future global precipitation patterns is expected to further increase the sensitivity of forest ecosystems to interannual precipitation fluctuations, potentially leading to growth decline, crown dieback, and even tree mortality (Liu et al., 2020). Although the abovementioned risks have received some attention, systematic, mechanistic long-term predictions of the growth dynamics, physiological stress, and spatial variability patterns of PT plantations under multiple future climate scenarios are still lacking.
Therefore, a single-site experiment was conducted in a typical ecological restoration area in Ansai, Shaanxi during the 2024–2025 growing seasons (1 May–30 September 30). The modified BBGC-Sperry model was validated using measured daily transpiration (Tday), midday leaf water potential (Ψmd), and soil water content (SWC), as well as total growing-season transpiration and aboveground biomass data collected from other meteorological stations within the study area. The validated model was used to simulate the spatiotemporal variations of NPP, ET, and APLK at 130 meteorological stations in the study area from 2000 to 2024, and to project conditions over the subsequent 75 years under three Shared Socioeconomic Pathways (SSP1–2.6, SSP2–4.5, SSP5–8.5) from CMIP6. The objectives of this study were to: (1) validate application of the modified BBGC-Sperry model to PT plantations in the study area; (2) reveal spatiotemporal variations of NPP, ET, and APLK in PT plantations under climate change; (3) develop a new index to assess the ecological functionality based on NPP, ET and drought-induced mortality risk (DMRP) and analyze its spatiotemporal variations and influencing factors. The results could provide insights into the adaptability of PT plantations to future climate change and their potential hydrological and physiological vulnerabilities on the Loess Plateau.
2.1 Study area
To control soil and water erosion, large-scale vegetation restoration projects (e.g., the Grain-for-Green Program and the Three-North Shelter Forest Program) were implemented by China's Central Government in this region in the late 1990s (Jia et al., 2017). Native PT, a pioneer species for vegetation restoration, was widely planted due to its drought resistance and is now mainly distributed across Gansu, Shaanxi, and Shanxi provinces on the Loess Plateau (Wang, 2016). Therefore, the green area in Fig. 1 was selected as the simulation area to analyze the growth and drought-induced mortality risk of PT plantations. The study area (33.72–40.74° N, 102.68–114.55° E) is located in the Loess Plateau, covering approximately 380 000 km2 (Fig. 1), and encompasses diverse topographic features with hills, gullies, ridges, and basins. The predominant soil types include silty clay, silty clay loam, silty loam, loam, and sandy loam (Jia et al., 2019). From southeast to northwest, the climate transitions from semi-humid to semi-arid, the mean annual precipitation (MAP) decreases from 700 to 200 mm with 55 %–78 % occurring from June to September, and the mean annual temperature (MAT) ranges from 14.3 to 3.6 °C (Zhang et al., 2024b). The region is characterized by loess deposits ranging from 30 to 200 m thick. Precipitation in the study area is the primary source of recharge and the depth to groundwater is typically between 30 and 100 m (Zhu et al., 2018).
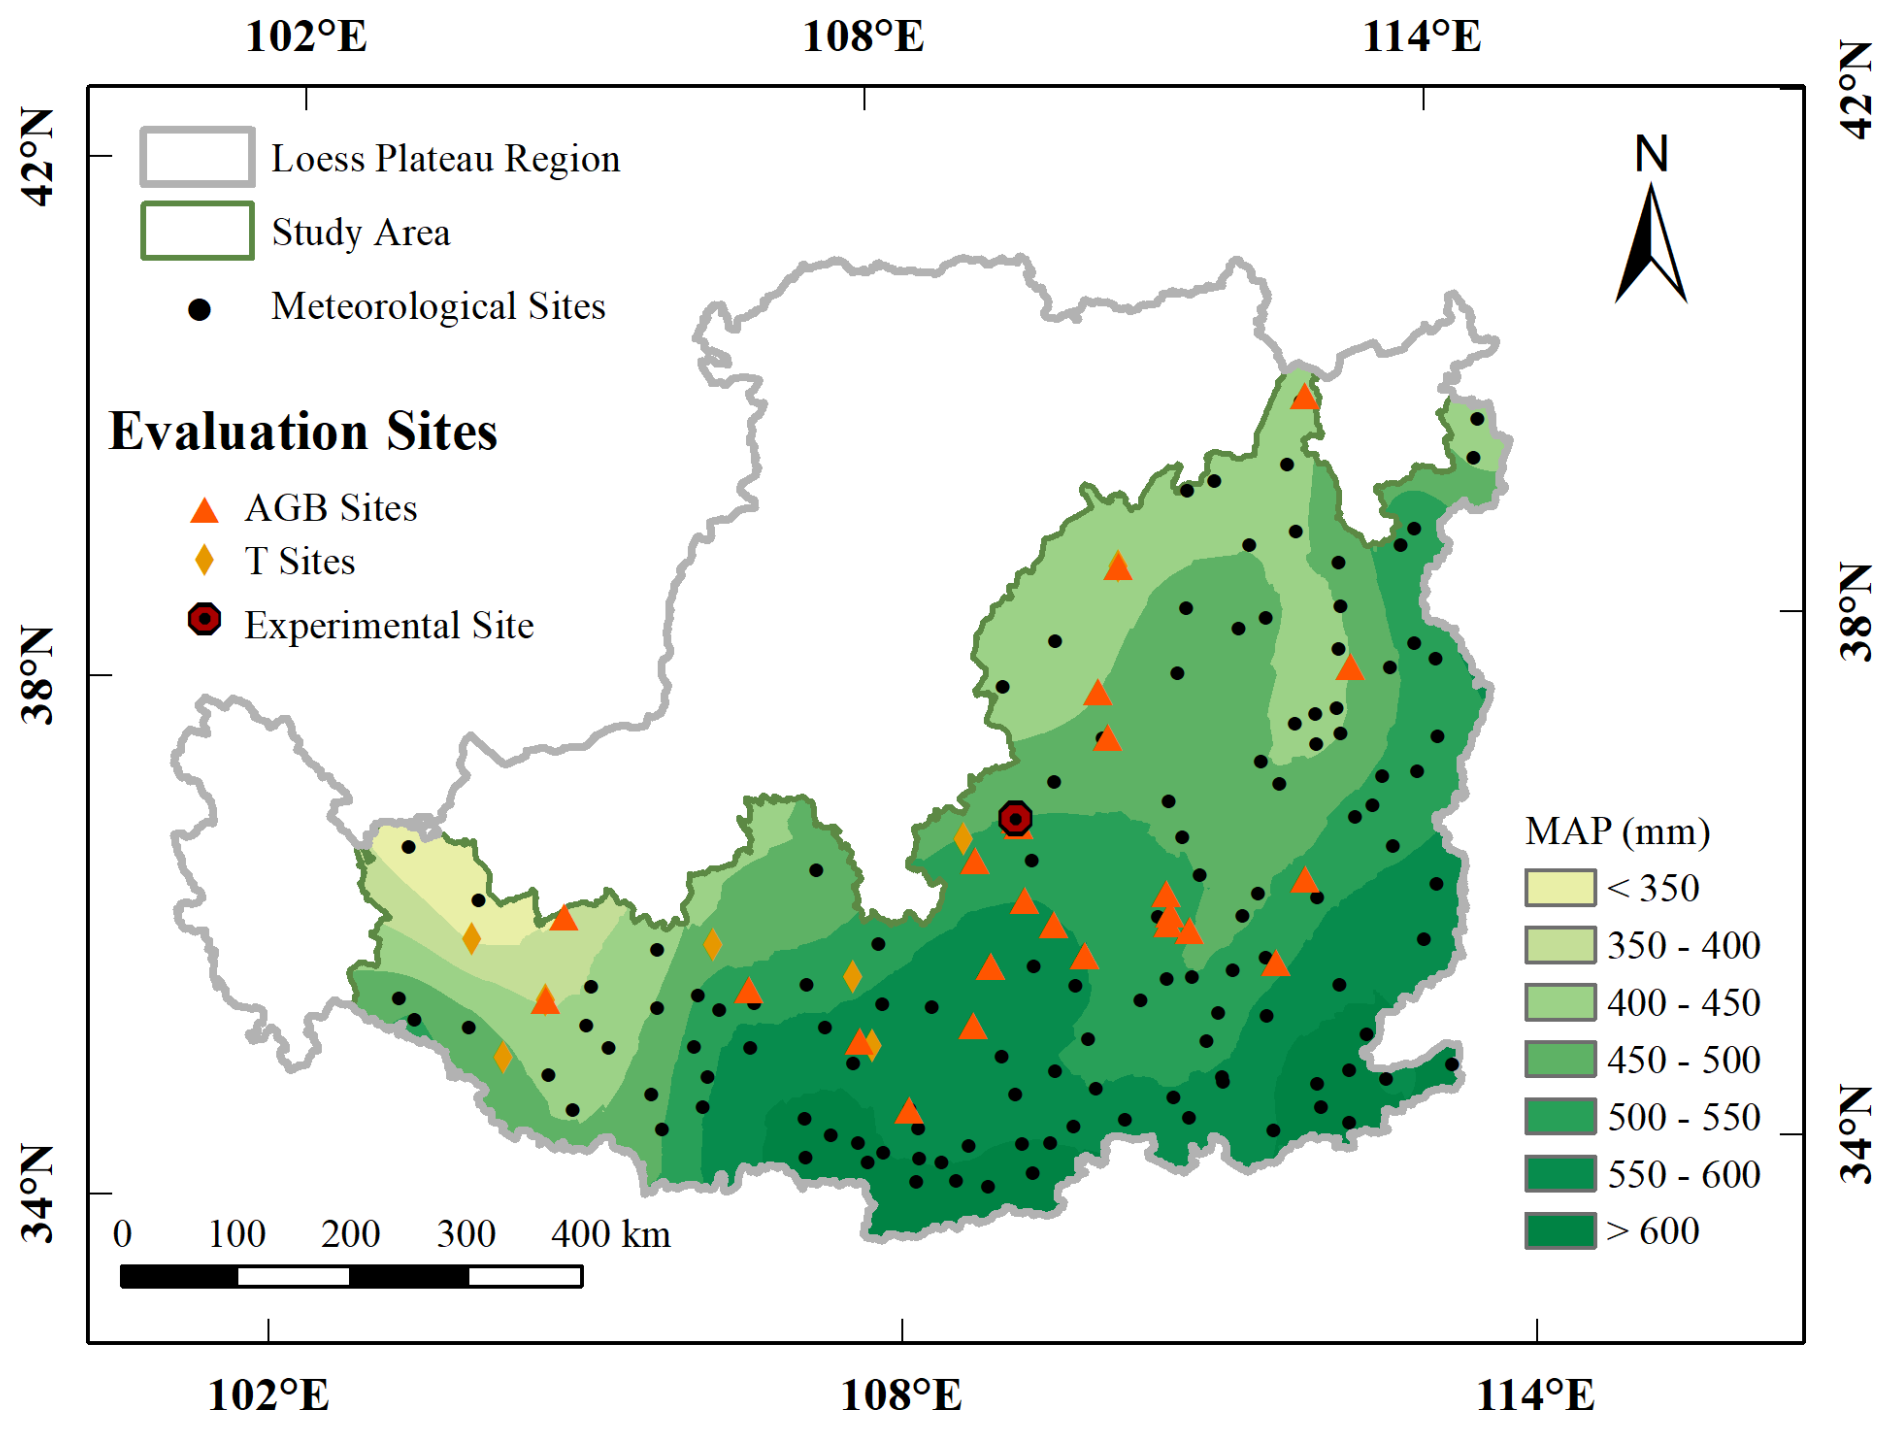
Figure 1Map depicting the location of the study area on the Loess Plateau showing the distribution of the 130 modeling sites, 9 sites where growing season transpiration (T) data were collected, 27 sites where aboveground biomass (AGB) data were collected, and one experimental site (Ansai).
2.2 BBGC-Sperry model description
BBGC-Sperry is a coupled model integrating the biome biogeochemical cycle model (Biome-BGC model) with the plant supply-demand hydraulic model (Sperry model). Conventional climate data, soil parameters, and physiological-ecological parameters were incorporated into this model to simulate the dynamic changes in plant hydraulic properties at the daily scale, along with water, carbon, and nitrogen cycling processes. The BBGC-Sperry model is described in detail in previous articles (Zhang et al., 2020; Yan et al., 2022). Here, we briefly outline several key processes.
2.2.1 Water cycle
The only water input to the system occurs through precipitation (rain or snow). The amount of intercepted precipitation depends on the canopy interception coefficient and the leaf area index (LAI). In this model, snowfall reaches the soil surface directly without being intercepted by the vegetation canopy and its sublimation and melt are estimated based on daily air temperature and net solar radiation. Water outflow includes soil evaporation, canopy transpiration, and canopy interception evaporation, which are calculated based on modified Penman–Monteith functions with different conductivity types. The modified Penman–Monteith equation takes into account the effect of atmospheric carbon dioxide concentrations on overall surface resistance (Wu et al., 2026). Water transport processes in the soil-plant-atmosphere (SPAC) system were simulated by the Sperry model. The detailed modification of the Sperry model can be found in Zhang et al. (2020). The Sperry model divides the SPAC into serial components of leaves, stems, roots, and rhizosphere. Supply and demand functions are employed to calculate water flux, whole-plant hydraulic conductance (kplant), and the distribution of water potential and hydraulic conductance within the SPAC system. The vulnerability curves for each component describe the attenuation of hydraulic conductance as water potential decreases, with steady-state flow calculated by integral transformation. The root system is stratified by root density, employing a multidimensional Newton–Raphson iteration method to solve for water potential and water uptake rates within each root layer. Soil moisture movement is simulated using a hydrological submodel based on the Richards equation (Huang et al., 2013).
2.2.2 Carbon and nitrogen cycles
The only addition of C to the system is through photosynthesis. C is removed from the system during all autotrophic (maintenance and growth) processes, heterotrophic (decomposition) processes, and fire or harvest disturbance events. The N cycle includes plant N pools, soil mineral N pools, and retranslocated N pools. Soil mineral N enters the system through mineralization from soil organic matter, atmospheric wet and dry deposition, and biological N fixation. Plants acquire mineral N through uptake, while N is transferred from plant pools to litter pools through tissue turnover and mortality, with partial N retranslocation occurring before leaf senescence. Mineral N is removed from the system through leaching and volatilization. The model uses a two-leaf representation of the canopy to model all canopy photosynthesis, which is based on the enzymatic kinetics of Rubisco in relation to temperature, availability of CO2, and rate of Rubisco regeneration (Farquhar et al., 1980). Autotrophic maintenance respiration is simulated using a Q10 function of temperature and tissue nitrogen content. Heterotrophic respiration is calculated from the decomposition of litter and soil organic matter pools, with decomposition rates regulated by soil temperature and water availability (Yan et al., 2022).
2.3 Model evaluation
2.3.1 Hydrological process calibration and validation
At the single-site scale, we established an experimental PT plantation site in Ansai District, Shaanxi Province on 1 May 2024. This area is a key zone for soil and water conservation projects. Field observations were conducted during the 2024 and 2025 growing seasons (1 May to 30 September), including daily transpiration (Tday), SWC, and midday leaf water potential (Ψmd). Data collected during the 2024 growing season were used to calibrate the hydraulic parameters, whereas data collected during the 2025 growing season were used for model validation. The experimental plot had an area of 20 m × 20 m and a tree density of 1600 stems ha−1. Additionally, we measured the sapwood thickness and diameter at breast height of 20 trees near the experimental area using growth cones and vernier calipers and established a regression equation (R2 = 0.99) linking diameter at breast height (D) to sapwood area (As) in the PT plantation, as follows:
Stem sap flow sensors were used to measure the sapwood flux density. First, we selected eight representative sample trees based on the distribution of breast height diameter classes. Stem sap flow sensors (Granier type, probe length 10 mm, diameter 1.2 mm, with a 40 mm spacing between the heated probe and reference probe) were uniformly installed at the breast height diameter (1.3 m) to monitor the dynamic changes in sap flow density during the growing season in the PT plantations. During installation, sufficient exposure of the phloem at breast height was ensured. To minimize rainfall and solar radiation effects, sensors were mounted on the shaded side of the trunk. Additionally, the gap between the two probes and the trunk was sealed with petroleum jelly and wrapped in multiple layers of radiation-shielding aluminum foil. The sensor was connected to a CR1000 datalogger (Campbell Scientific, Logan, UT, USA) and an AM16/32 data expansion board (Campbell Scientific, USA), scanning and collecting data every 30 s while recording hourly averages. The CR1000 datalogger was powered by a 12 V DC battery and an ES-VR2 voltage regulator, supplemented by solar panels. Based on the measured dual-probe temperature difference from the trunk sap flow sensor, the sapwood flux density (Fd; ) was calculated using Granier's (1987) empirical Eq. (2) as follows:
where α and β are fitting parameters determined by the calibration curve and estimated at 0.013 and 1.024, respectively (Song et al., 2023). K is the dimensionless fluid flow index, which is calculated using the following equation:
where ΔT is the temperature difference (°C) between two probes at any given time and ΔTmax is the maximum value of ΔT (°C). The average sap flow density (Js; ) in the tree's sapwood was calculated using the following equation:
where i is the ith sample tree, and Fdi and Asi represent the sapwood sap flow density and sapwood area of the ith sample tree, respectively. The canopy transpiration rate (Tday; mm s−1) was calculated using :
where Ast and Ag are the total sapwood area of trees in the plot (m2), and Js is defined as in Eq. (4).
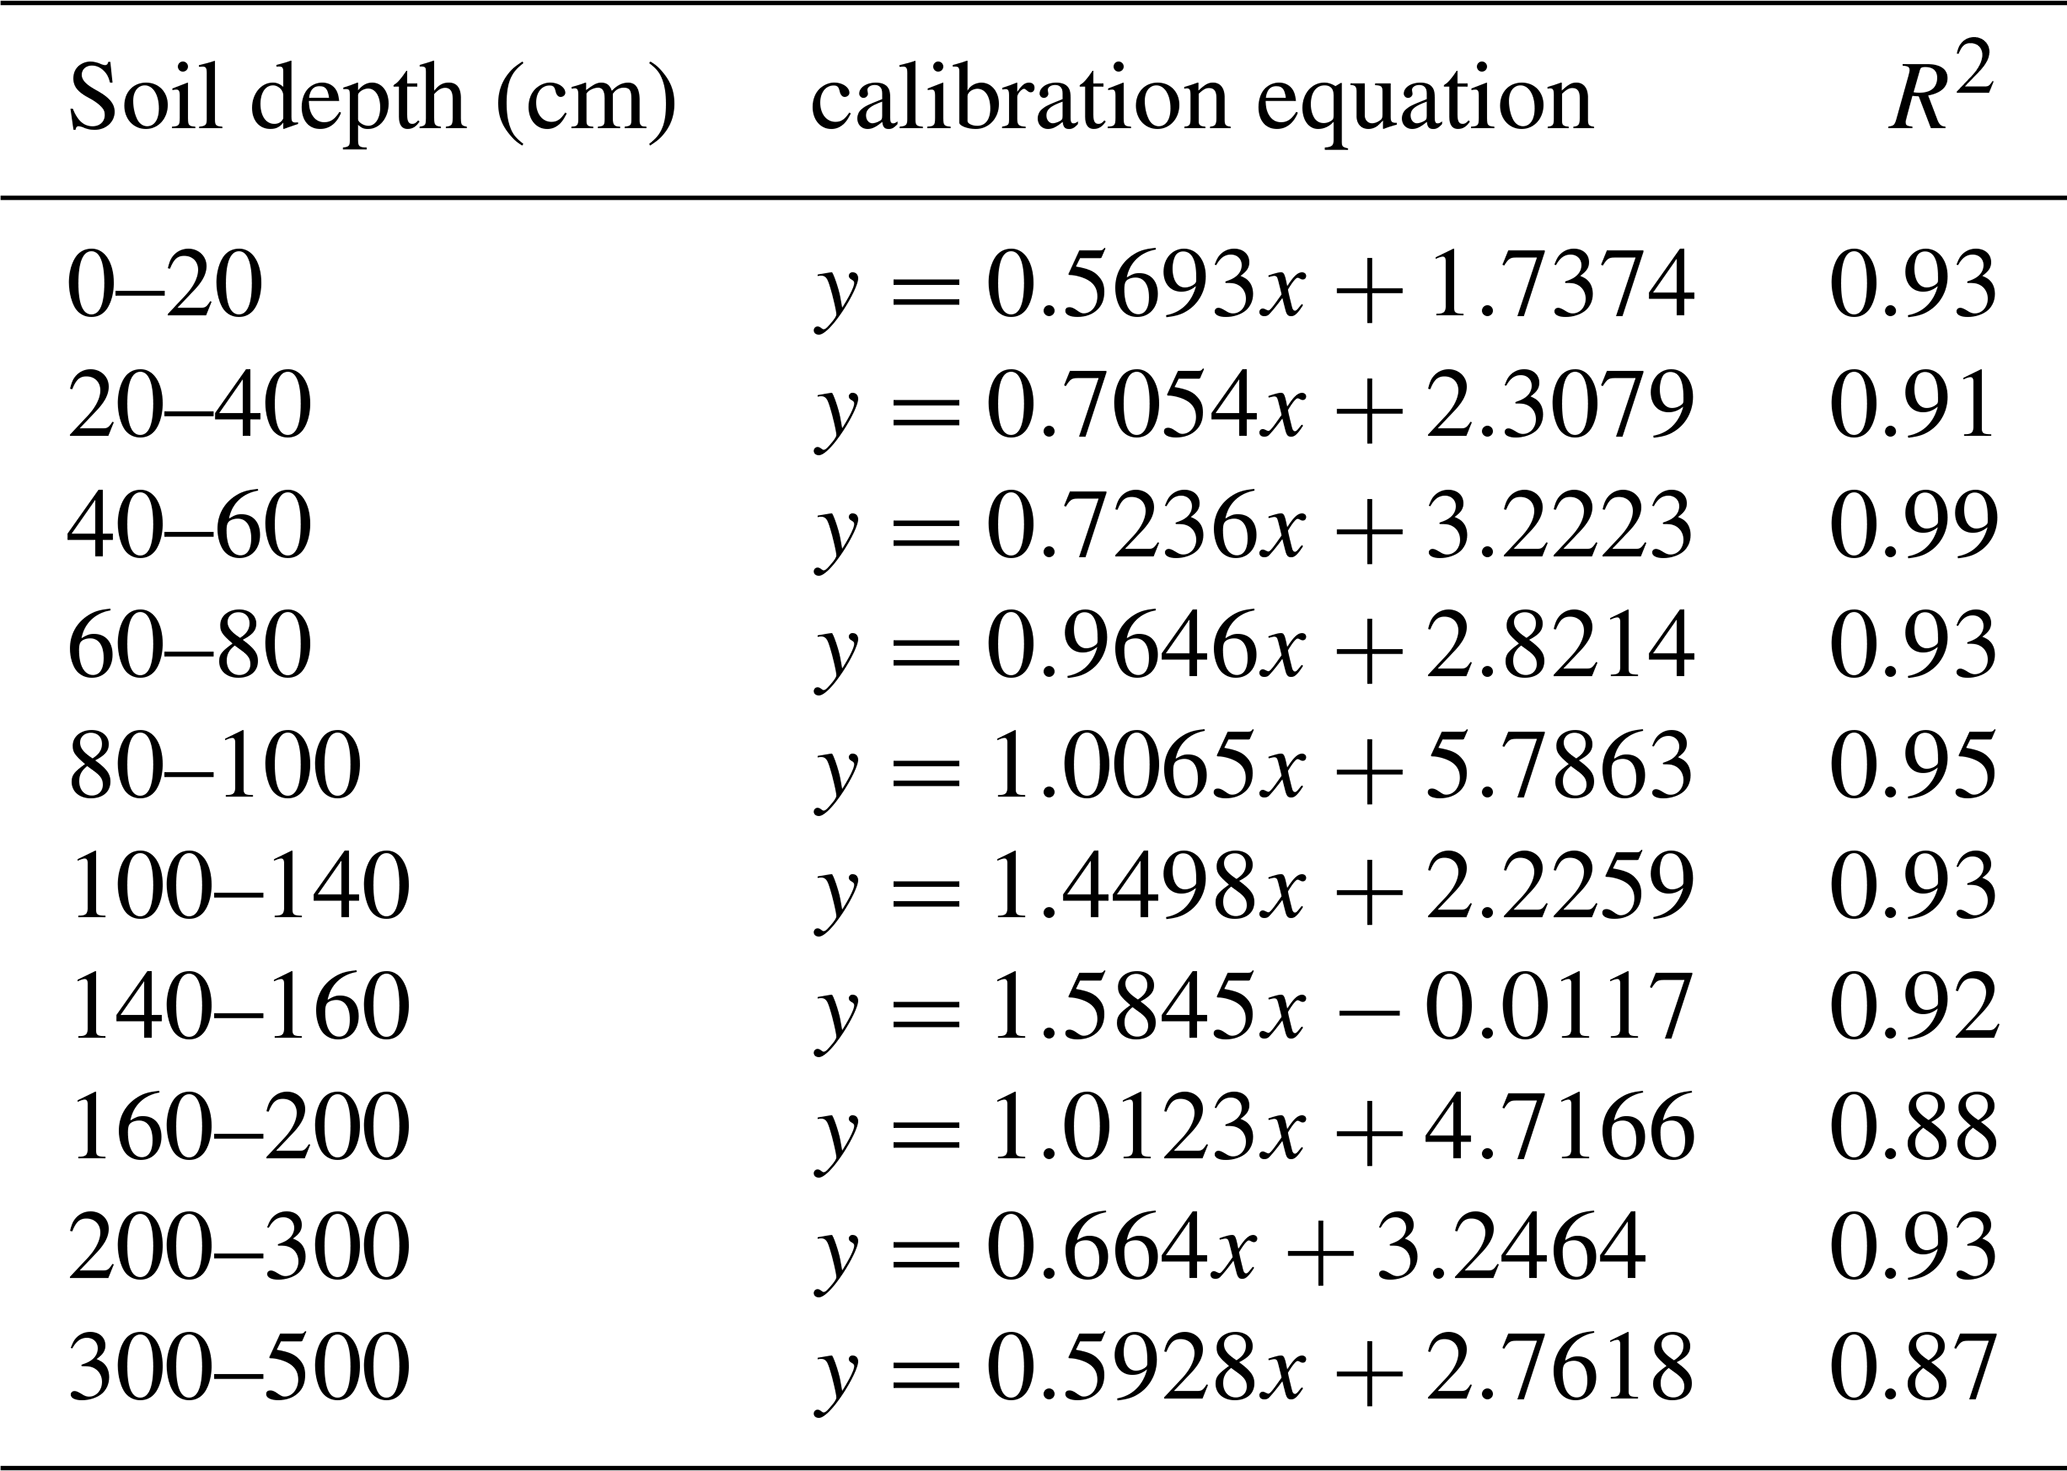
Soil moisture sensors (EC-5, Decagon, USA) connected to a CR1000 datalogger were used to monitor the SWC at 20, 40, 60, 80, 100, 140, 160, 200, 300, and 500 cm below the soil surface. The sensors exhibited a measurement accuracy of ± 3 %. To calibrate the sensors, SWC was also measured monthly using an oven-drying method. The established calibration equations are shown in Table 1.
Table 1Calibration equations for EC-5 soil moisture sensors in the Pinus tabuliformis Carrière plantations at the Ansai site.
Ψmd was measured between 12:00 PM and 02:00 PM each month during the growing season using a portable plant water potential meter (PMS Instrument Co., Corvallis, OR, USA). For each measurement, a branch exposed to sunlight was cut from the upper-middle canopy using pruning shears. Pine needle samples were collected from the harvested branch using a small knife, and a bundle of pine needles immediately wrapped tightly with raw tape. Samples were then put in the pressure chamber for measurement. Simultaneously, an electronic magnifying glass was used to observe the condition of the petiole cut surface. When small water droplets appeared on the petiole cut surface, the inflation valve was quickly closed and the numbers on the pressure gauge interface recorded, which represented the instantaneous Ψmd. Each treatment included six replicates.
For regional-scale validation, we also collected observational data on growing-season transpiration (T) from PT plantations across the study area. A total of 48 T values were collected, covering nine meteorological stations, using two methods: (1) stem sap flow was measured using the heat probe method and converted to T (n=23); and (2) T was calculated using the water balance equation based on growing season precipitation (Pr, mm), runoff (R, mm), soil evaporation (E, mm), and the change in soil water storage (, mm) during the growing season: (n=25). Considering the different uncertainty sources associated with the two observation approaches, model validation was conducted separately for sap flow measurements and water-balance-based transpiration estimates.
2.3.2 Growth process validation
To evaluate the growth process of the BBGC-Sperry model, this study collected observational data on aboveground biomass (AGB) during the growing season in the study area's PT plantations. AGB is highly correlated with indicators such as NPP and LAI. Therefore, AGB can be considered a representative indicator that is readily available. A total of 74 AGB values were obtained using the allometric growth equation (Table 2), covering 27 meteorological stations.
Table 2Biomass equations for Pinus tabuliformis Carrière (Zhou et al., 2018)
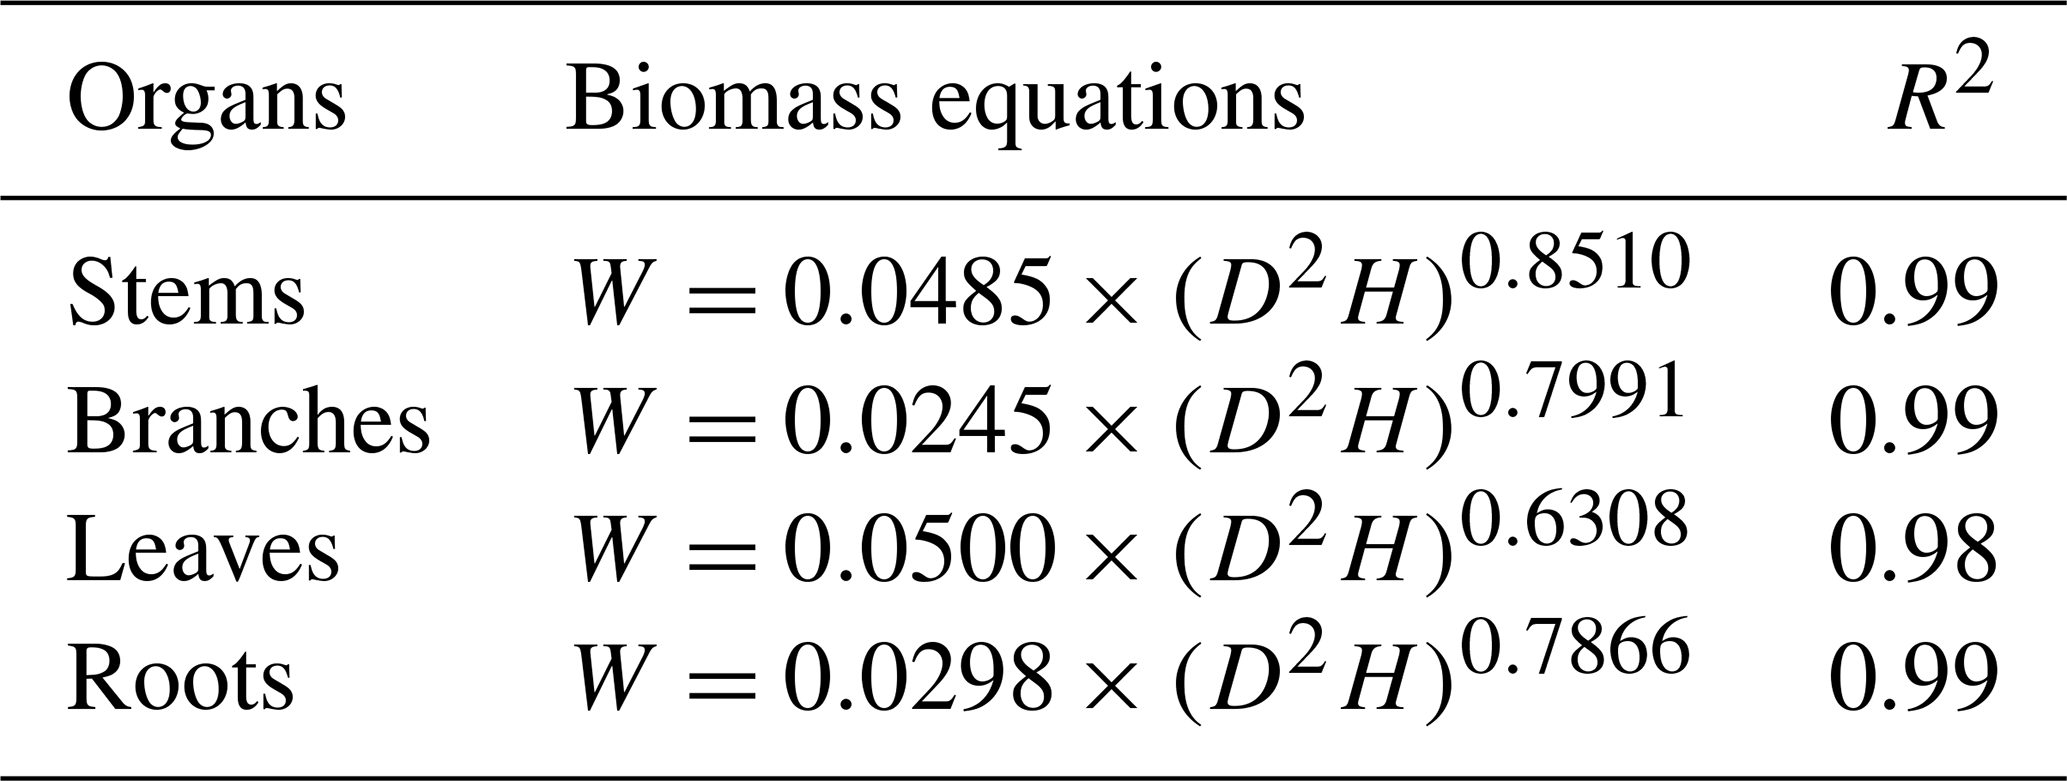
Notes: W represents biomass (kg C m−2); D is diameter at breast height (cm); H is tree height (m).
2.4 Data sources
2.4.1 Meteorological datasets
Meteorological data for 130 simulated sites from 2000 to 2024 were obtained from the China National Meteorological Center (http://data.cma.cn/, last access: 5 March 2026), including daily maximum temperature, minimum temperature, relative humidity, and precipitation, among other meteorological data. Future meteorological data were obtained from NASA's Earth Exchange Global Daily Downscaled Projections (NEX-GDDP-CMIP6) (https://doi.org/10.7917/OFSG3345; Thrasher et al., 2022a, b). This dataset features a resolution of 0.25°. We selected daily datasets for six models (CanESM5, FGOALS-g3, GFDL-CM4, IPSL-CM6A-LR, MPI-ESM1-2-HR, and MRI-ESM2-0) under three scenarios (SSP1–2.6, SSP2–4.5, and SSP5–8.5). The CO2 emissions under the three scenarios are shown in Fig. S1 in the Supplement (Melnikova et al., 2023). The datasets include daily maximum temperatures, daily minimum temperatures, and precipitation data for the period 2025–2099 for the same 130 meteorological stations.
Based on the phased characteristics of carbon dioxide emission trajectories under different Shared Socioeconomic Pathways (SSP) scenarios, and considering the period around 2050 marks a critical turning point for multiple emission scenarios, both SSP1–2.6 and SSP2–4.5 exhibit a trend of flat or slowly declining emissions after 2075. To more accurately depict dynamic changes in various variables, this study divided the future time period into three phases: near-future period (NFP; 2025–2049), mid-future period (MFP; 2050–2074), and far-future period (FFP; 2075–2099). The Mountain Climate Simulator (MT–CLIM) program (https://www.umt.edu/numerical-terradynamic-simulation-group/project/mt-clim.php/, last access: 5 March 2026) (Thornton et al., 2002) was used to calculate solar radiation, daylight average partial pressure of water vapor, and day length based on acquired meteorological data.
2.4.2 Soil hydraulic properties
The soil parameters required for this study included saturated soil moisture content (θs), residual soil moisture content (θr), soil parameters (α and n), and saturated hydraulic conductivity (Ks). At the Ansai experimental site, we measured Ks and soil moisture characteristic curves using the ring knife method in the laboratory. We derived the VG model using RETC software to determine other soil hydraulic parameters (van Genuchten, 1980). At the study area, clay, silt, sand, and bulk density data for the 130 simulated sites were obtained from the SoilGrids250m dataset (https://www.soilgrids.org/, last access: 8 August 2026). These data were available at five standard depths of 0.1, 0.3, 0.6, 1.0, and 2.0 m. Soil moisture characteristic curves were estimated using the Arya–Paris model (Arya et al., 1999) based on soil texture and bulk density. This method has been shown to provide reliable estimates of soil hydraulic functions (da Silva et al., 2017). The simulated curves were fitted with the van Genuchten (VG) model using RETC software to obtain θs, θr, α, and n. Ks was obtained from the Northwest Arid Region Soil Hydraulic Parameters dataset, which provides values at the same five standard depths (Niu et al., 2024). The BBGC-Sperry model divided the soil profile into five layers: 0–0.13, 0.13–0.43, 0.43–0.96, 0.96–1.89, and 1.89–5.00 m. Soil hydraulic parameters were assigned to each model layer according to the corresponding depths. The first three layers used the values at 0.1, 0.3, and 0.6 m, respectively. For the fourth layer from 0.96 to 1.89 m, soil hydraulic parameters were calculated as the average values at the depths of 1 and 2 m. The deepest layer from 1.89 to 5.00 m assigned the values at 2 m depth.
2.4.3 Eco-physiological parameters
The ecological and physiological parameters and values used in this simulation are shown in Table S1 in the Supplement, along with those for PT plantations in the Biome-BGC model from previous studies (Zhang et al., 2024a). Xylem vulnerability curves (VCs) for PT were determined using the benchtop dehydration method (Sperry et al., 1988) (Fig. S2). We assumed VC parameters were the same for roots, stems, and leaves. The maximum whole-plant hydraulic conductance per leaf area, maximum diffusive conductance, and average proportion of rhizosphere resistance were determined based on transpiration rates observed at the Ansai site in 2024 (Sperry et al., 2016; Tai et al., 2018; Wolfe et al., 2016).
2.5 Assessment of drought-induced mortality risk
Under drought stress, plants regulate stomatal function to influence carbon metabolism processes, which is considered a core mechanism in drought-induced mortality. A prolonged high daily percentage loss of whole-plant hydraulic conductance (PLK) serves as a key indicator of drought mortality risk, calculated as follows:
where kplant is the whole plant hydraulic conductance and kmax is the maximum soil–plant hydraulic conductance. We assumed the xylem embolism of PT could not be refilled during the growing season, and that full hydraulic recovery occurs at the start of the next growing season due to the generation of root and/or stem pressure and the new growth of plant tissues in the spring (Choat et al., 2018). Under this assumption, daily PLK did not decrease following soil moisture recovery after drought events. Annual average PLK (APLK, %) was then determined to represent the inter-annual variation in plant hydraulic safety. It was calculated as the arithmetic mean of daily PLK values during the modeled growing season of each year. The modeled growing season was defined as days with leaf carbon pool greater than zero (LeafC > 0). Previous studies have suggested that sustained losses of whole-plant hydraulic conductance exceeding 60 % are associated with a high risk of drought-induced mortality (Sperry and Love, 2015). Tai et al. (2018) further applied a growing-season mean whole-plant PLK threshold of 60 % for evaluating drought-induced mortality risk. So, we adopted this threshold for assessing drought-induced mortality risk in this study. To evaluate the sensitivity of drought-induced mortality risk probability (DMRP) estimates to the hydraulic mortality threshold, we further calculated DMRP using three thresholds (50 %, 60 %, and 70 %) and compared their spatial patterns and temporal variations (Fig. S3). After preliminary tests, the beta distribution was selected to fit the probability distribution of APLK at each site. The probability value of APLK ≥ 60 % was defined as the threshold of DMRP (Zhang et al., 2024b). The primary long-term objectives for the PT plantations in this study area are soil and water conservation and ecosystem restoration. The functional cycle for stand stability of PT plantations ranges from 20 to 50 years (Zhang et al., 2024b). The study area is divided into high-risk (DMRP > 5 %), medium-risk (2 % ≤ DMRP ≤ 5 %), and low-risk (DMRP < 2 %) zones with drought mortality event recurrence intervals of < 20, 20–50, and > 50 years, respectively.
2.6 Calculation of carbon-water-hydraulic risk index
To comprehensively assess the impact of future climate change on the sustainability of PT plantations, this study developed a carbon-water-hydraulic risk index (CWHRI) by integrating carbon assimilation, water consumption, and plant hydraulic risk into a unified metric. These three components were selected because they represent key dimensions of plantation functioning that are commonly evaluated separately. Specifically, NPP reflects carbon sequestration and serves as the positive contribution to sustainability, ET characterizes water consumption, and DMRP represents the probability of tree mortality associated with drought-induced hydraulic stress. The CWHRI is formulated as follows:
where (1−DMRP) represents the probability of avoiding drought-induced mortality. The unit of CWHRI is g C kg−1 H2O, representing the expected carbon gain per unit water consumed after accounting for drought-induced mortality risk. The multiplicative form ensures that as DMRP approaches 1 (certain mortality), CWHRI approaches zero regardless of NPP or ET, reflecting the assumption that trees experiencing drought-induced mortality no longer contribute to ecosystem functioning. A higher value of CWHRI indicates safer water transport in plantations and greater efficiency in using water to support growth.
2.7 Statistical analyses
Annual mean NPP, ET, APLK, DMRP, and CWHRI were calculated for the baseline period and NFP, MFP, and FFP under three future climate scenarios (SSP1–2.6, SSP2–4.5, and SSP5–8.5). Spatial distribution maps were generated using Kriging interpolation in ArcGIS 10.8 software. Annual values for the study area were obtained by weighting annual data from 130 stations using the Thiessen polygons method. Temporal variations of indicators were analyzed using one-way analysis of variance (ANOVA), with multiple comparisons performed using Duncan's test at a significance level of p < 0.05. A multiple linear regression method was used to calculate the contribution of NPP, ET, and DMRP to changes in CWHRI. The relative importance of six meteorological variables (mean annual precipitation, MAP; mean annual temperature, MAT; mean annual maximum temperature, MATmax; mean annual minimum temperature, MATmin; mean annual vapor pressure deficit, VPD, mean annual soil water storage, SWS) for predicting CWHRI was assessed using XGBoost. Hyperparameters were tuned through five-fold cross-validation combined with grid search, while early stopping was applied to track validation error (Gong et al., 2026). Variables with high relative importance identified by the XGBoost model were interpreted as factors statistically associated with the dynamic changes in CWHRI within the modelling framework, rather than as evidence of causal relationships.
Model accuracy was evaluated using the coefficient of determination (R2), mean absolute error (MAE), root mean square error (RMSE), relative root mean square error (rRMSE), and Nash–Sutcliffe efficiency coefficient (NSE) (Zhang et al., 2024b). The NSE is used to measure the goodness of fit of a model, with values closer to 1.0 indicating higher simulation accuracy. Lower values of MAE, RMSE, and rRMSE indicate higher accuracy. For leaf water potential (Ψmd), rRMSE was calculated using the absolute mean observed value as the denominator.
3.1 BBGC-Sperry model evaluation
Measurements of Tday, SWC (0–500 cm), and Ψmd at the Ansai site during the 2024 growing season (1 May to 30 September) were used to calibrate the BBGC-Sperry model. As shown in Fig. 2a, c, and e, the R2 between simulated and observed Tday was 0.91, with NSE, MAE, RMSE, and rRMSE values of 0.90, 0.16 mm d−1, 0.23 mm d−1, and 13.61 %, respectively. For SWC (0–500 cm), the R2 value between simulated and observed values was 0.97, with NSE, MAE, RMSE, and rRMSE values of 0.97, 0.00 cm3 cm−3, 0.00 cm3 cm−3, and 1.75 %, respectively. The R2 value for Ψmd between simulated and observed values was 0.97, with NSE, MAE, RMSE, and rRMSE values of 0.98, 0.09 MPa, 0.09 MPa, and 7.42 %, respectively.
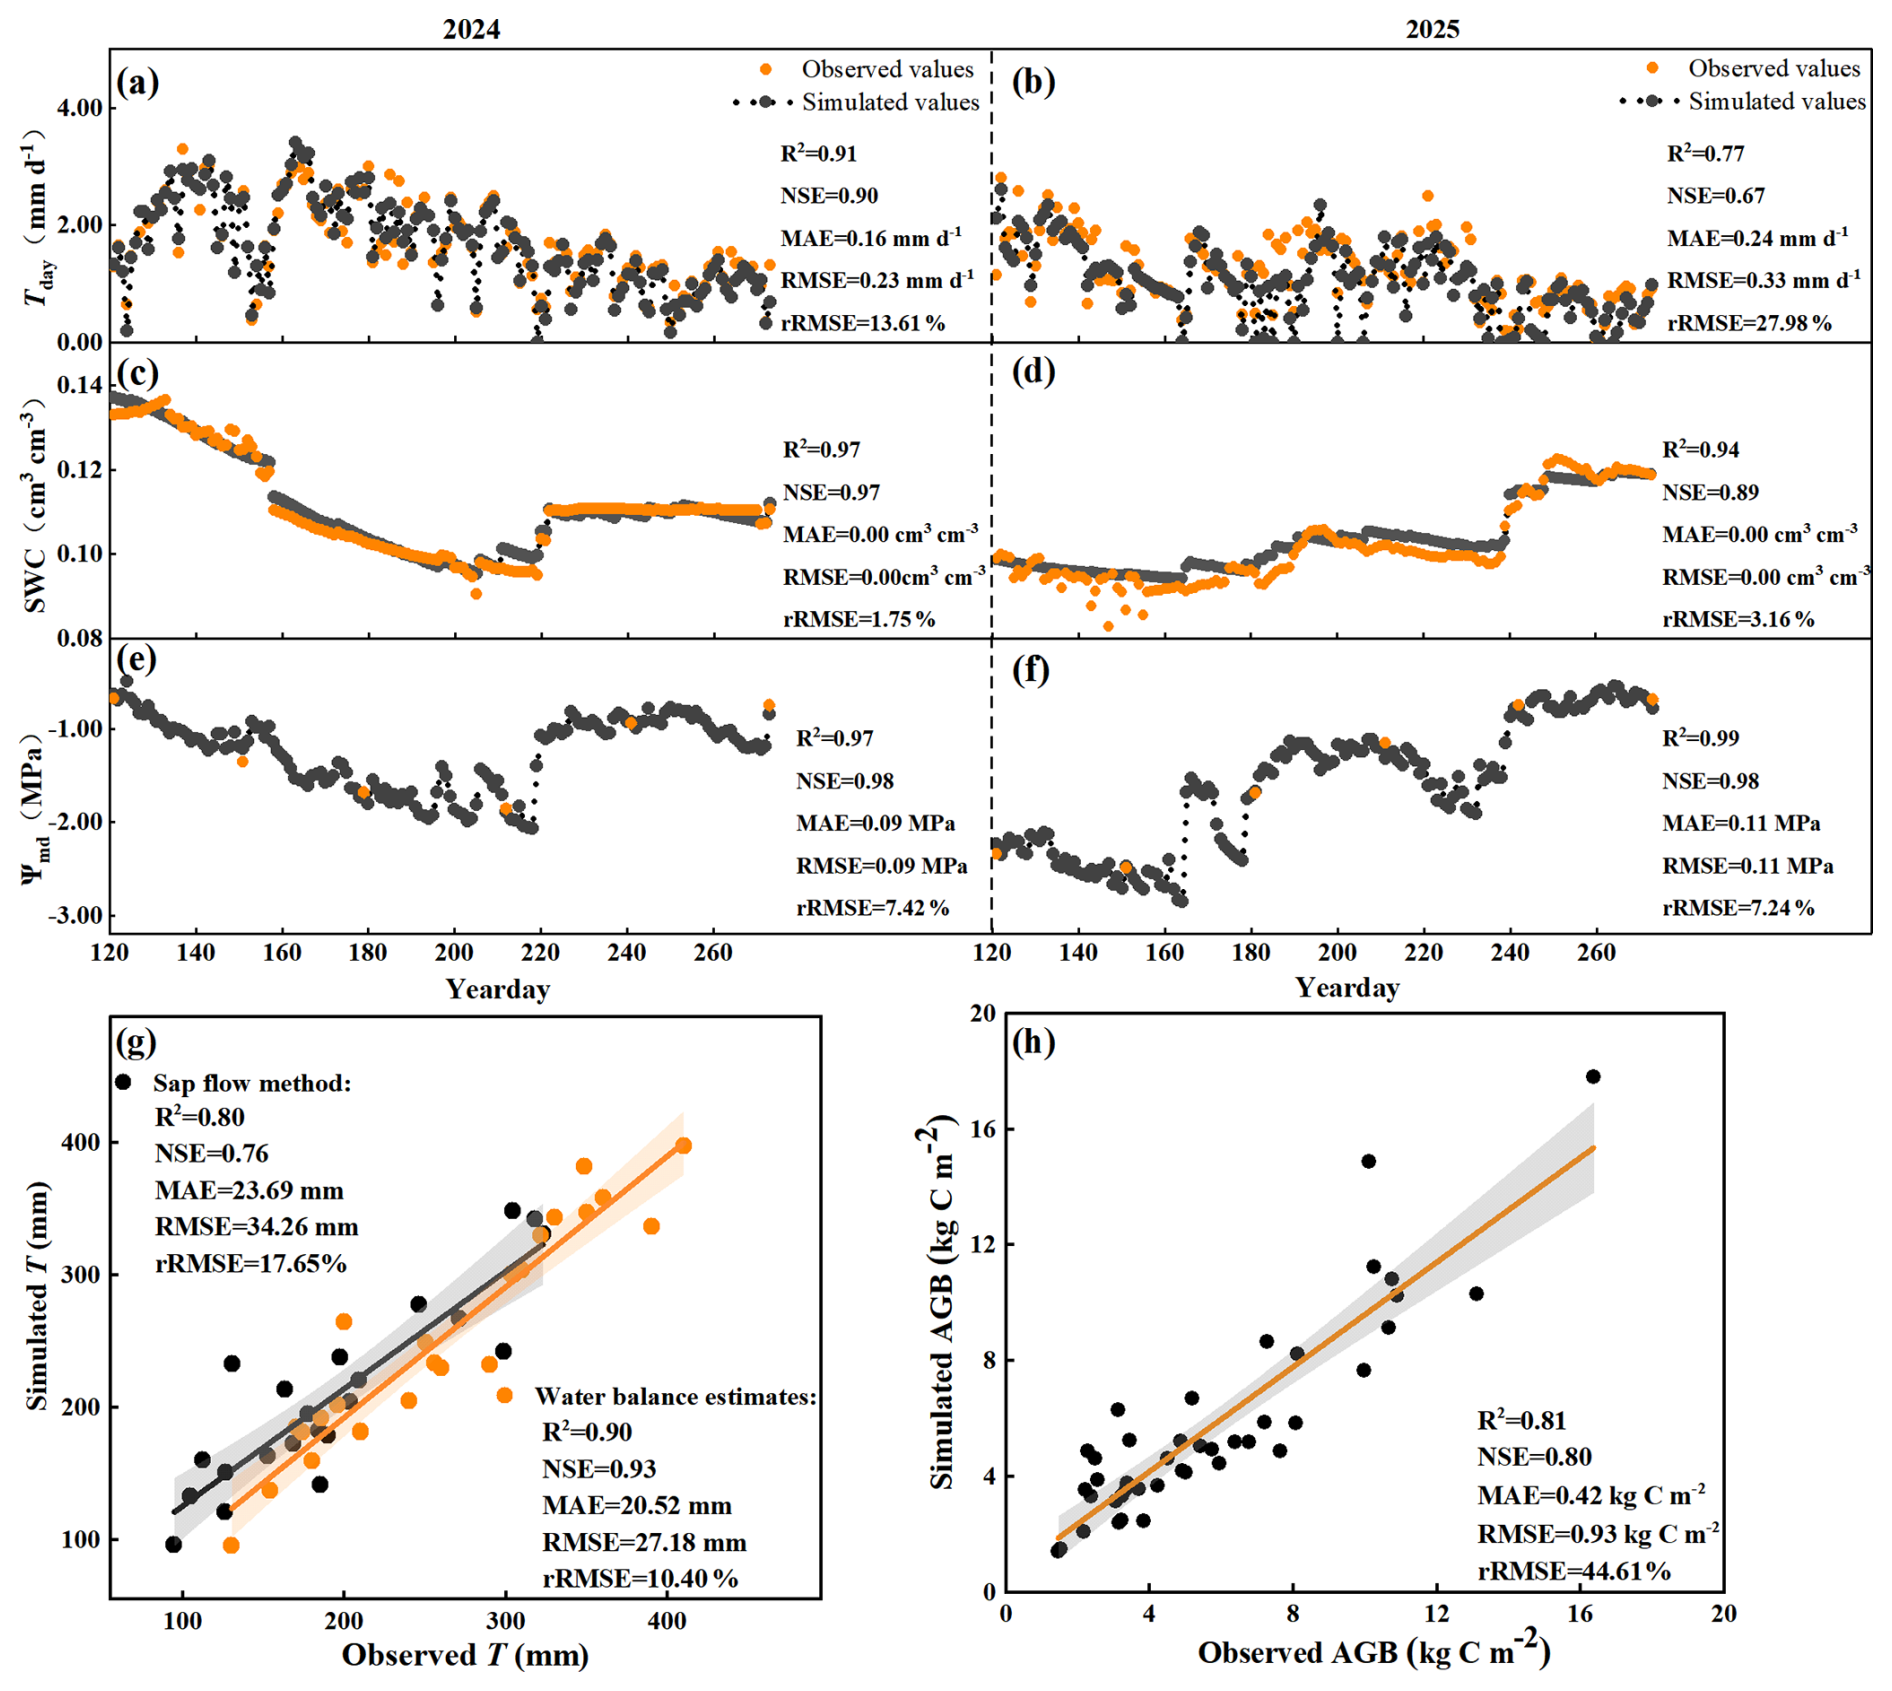
Figure 2Comparison of simulated and observed values of daily transpiration (Tday), average soil water content (SWC) in the 0–500 cm soil profile, midday leaf water potential (Ψmd), growing-season transpiration (T), and aboveground biomass (AGB) in Pinus tabuliformis Carrière plantations. (a), (c), and (e) show the calibration results (2024), while (b), (d), and (f) show the validation results (2025) for Tday, SWC, and Ψmd, respectively. (g) shows the validation of growing-season transpiration (T) across multiple sites, with black and orange points representing observations obtained from the sap flow method and water balance estimates, respectively. (h) shows the validation of aboveground biomass (AGB).
Validation of the BBGC-Sperry model included hydrological and growth processes. Hydrological validation was conducted based on Tday, SWC in the 0–500 cm profile, and Ψmd at the Ansai site during the 2025 growing season (1 May to 30 September), as well as multi-point transpiration data during the growing season. As shown in Fig. 2b, d, and f, the R2 between the simulated and observed Tday was 0.77, with NSE, MAE, RMSE, and rRMSE values of 0.67, 0.24 mm d−1, 0.33 mm d−1, and 27.98 %, respectively. For SWC (0–500 cm), the R2 value between the simulated and observed values was 0.94, with NSE, MAE, RMSE, and rRMSE values of 0.89, 0.00 cm3 cm−3, 0.00 cm3 cm−3, and 3.16 %, respectively. The R2 value for Ψmd between simulated and observed values was 0.99, with NSE, MAE, RMSE, and rRMSE values of 0.98, 0.11 MPa, 0.11 MPa, and 7.24 %, respectively. Figure 2g shows that the R2 between the simulated and observed T exceeded 0.7 for both sap flow measurements and water balance estimates. The NSE, MAE, RMSE, and rRMSE values for the sap flow measurements were 0.76, 23.69 mm, 34.26 mm, and 17.65 %, respectively. For water balance estimates, these values were 0.93, 20.52 mm, 27.18 mm, and 10.40 %, respectively. Growth process validation data were based on AGB observations from 27 sites in the study area. The R2 value between simulated and observed AGB was 0.81, with NSE, MAE, RMSE, and rRMSE values of 0.80, 0.42 kg C m−2, 0.93 kg C m−2, and 44.61 %, respectively (Fig. 2h). These results indicate the BBGC-Sperry model can accurately simulate hydrological and growth processes for PT plantations at both spatial and temporal scales. The high correlation between T, ET, AGB, and NPP indicates the BBGC-Sperry model can also effectively simulate long-term dynamic changes in NPP and ET in this region.
3.2 Projected climate change
We validated the simulation performance of the regional climate models by comparing observed climate data for the historical period (1979–2014) with the simulation results from a single climate model and a multi-model average (Fig. 3). The multi-model average showed the highest correlation coefficients (R) and the lowest centered root-mean-square error (CRMSE) values among all simulations. Specifically, the corresponding R and CRMSE values were 0.66 and 0.76 for precipitation, 0.99 and 0.22 for maximum temperature, and 0.97 and 0.34 for minimum temperature, respectively. The normalized standard deviations of the multi-model average were generally comparable to those of individual models. These results indicate that these downscaled data effectively represent the actual climate conditions of the study area. Therefore, multi-model average climate data were employed to simulate the response of PT plantations to future climate change.
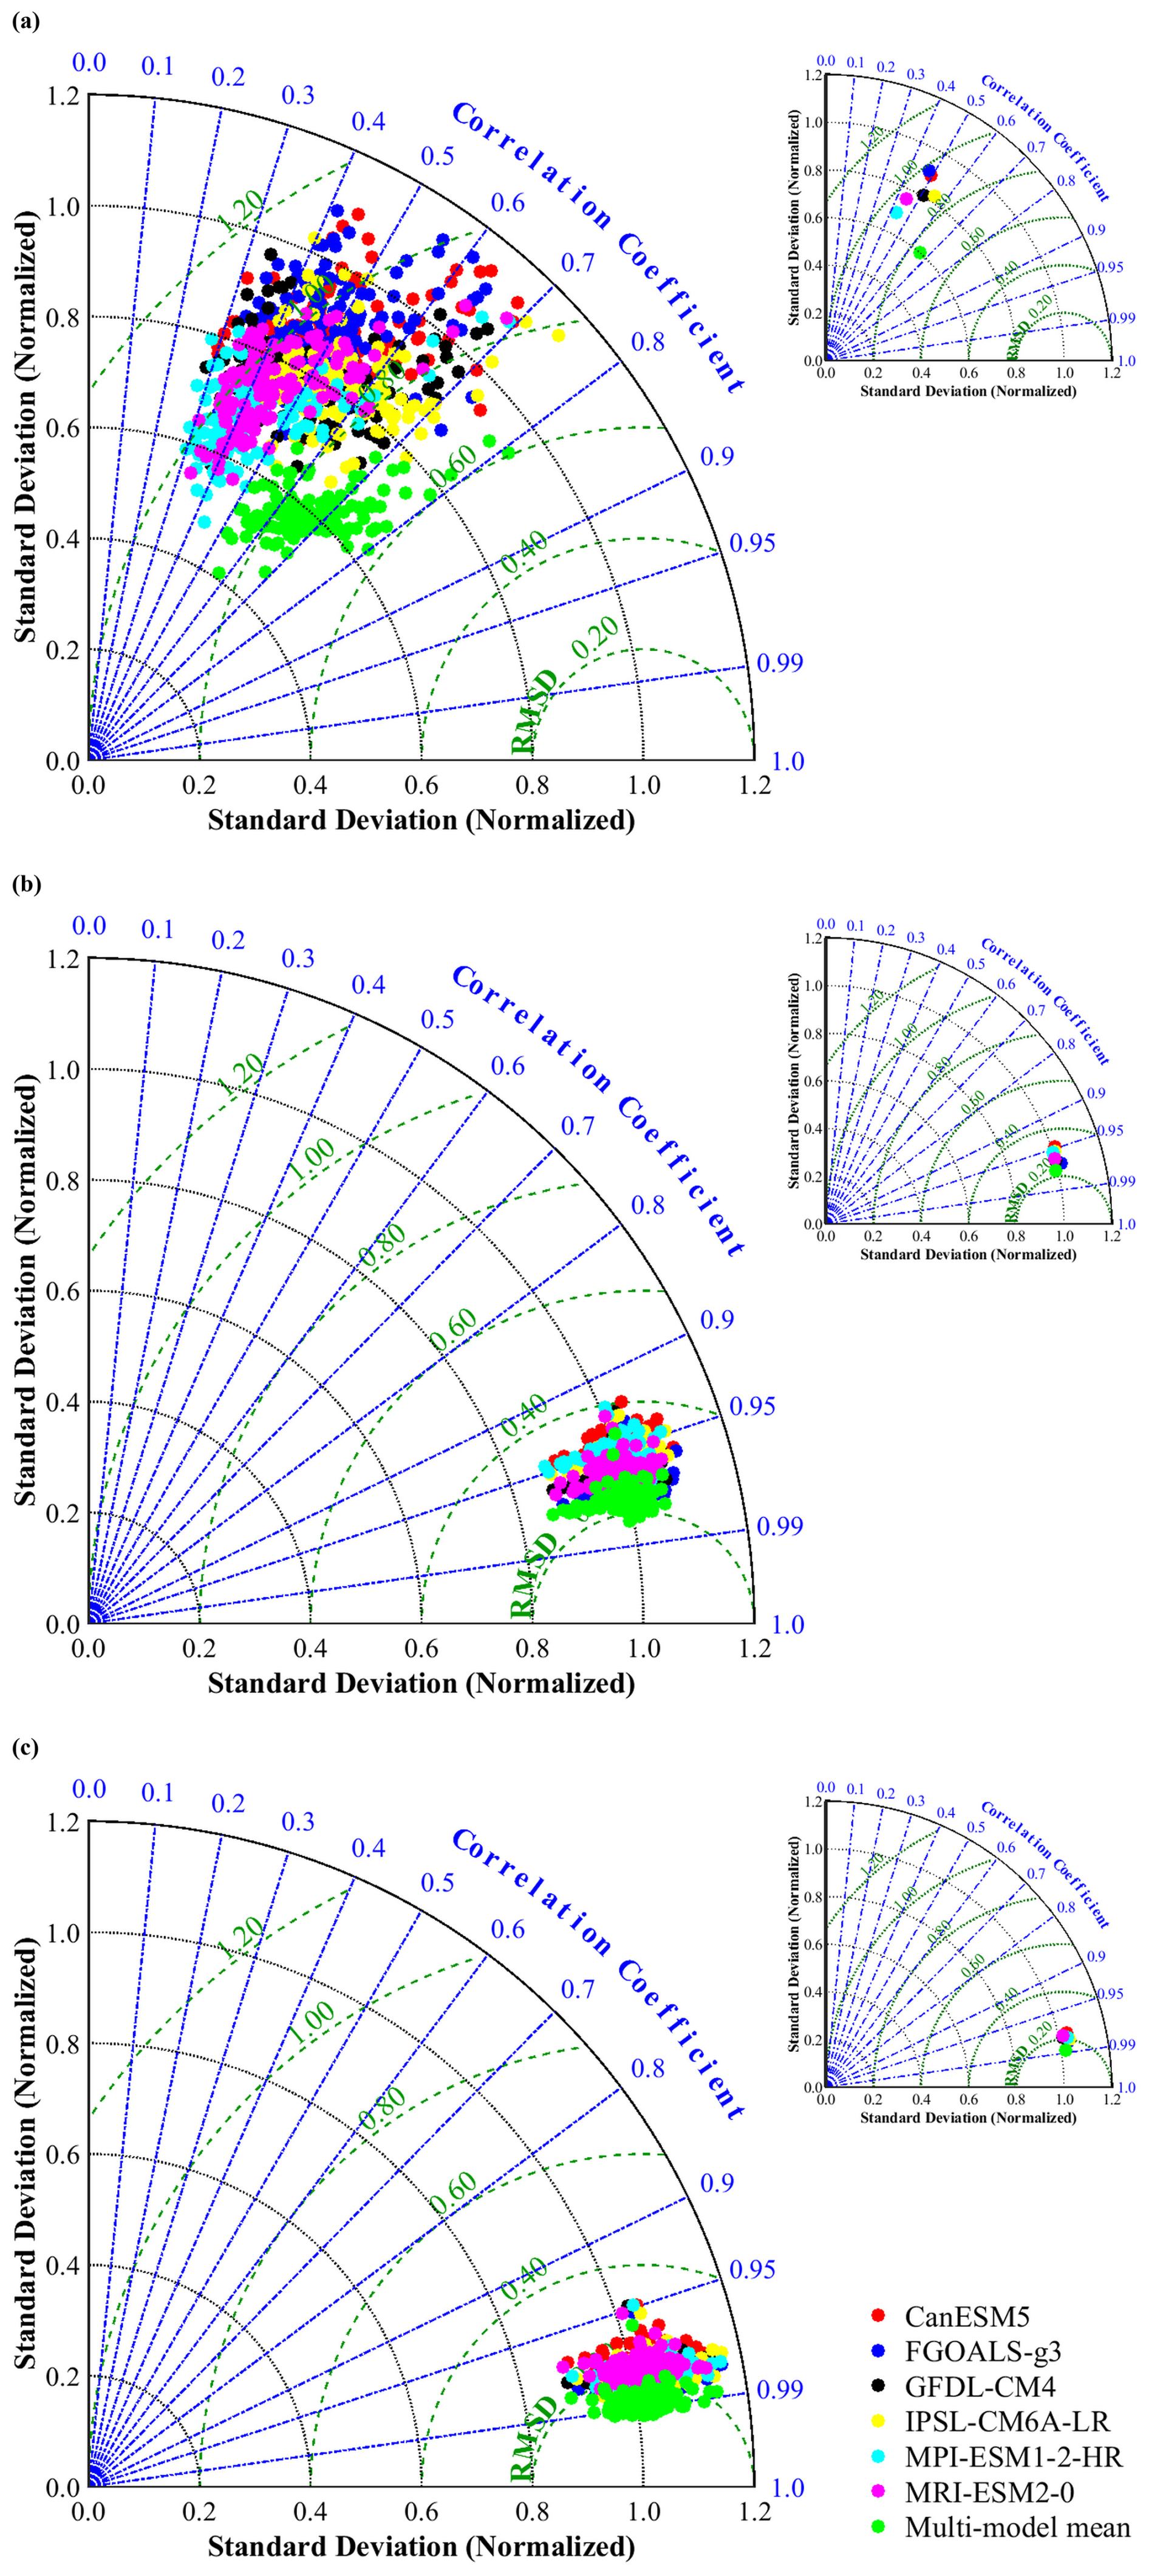
Figure 3Taylor diagrams of monthly precipitation (a), monthly maximum temperature (b), and monthly minimum temperature (c) at 130 meteorological stations in the study area from 1979 to 2014. The upper-right plot represents the mean values across all stations. Each color corresponds to a climate model or multi-model ensemble. The green dashed line represents the root mean square error (RMSE).
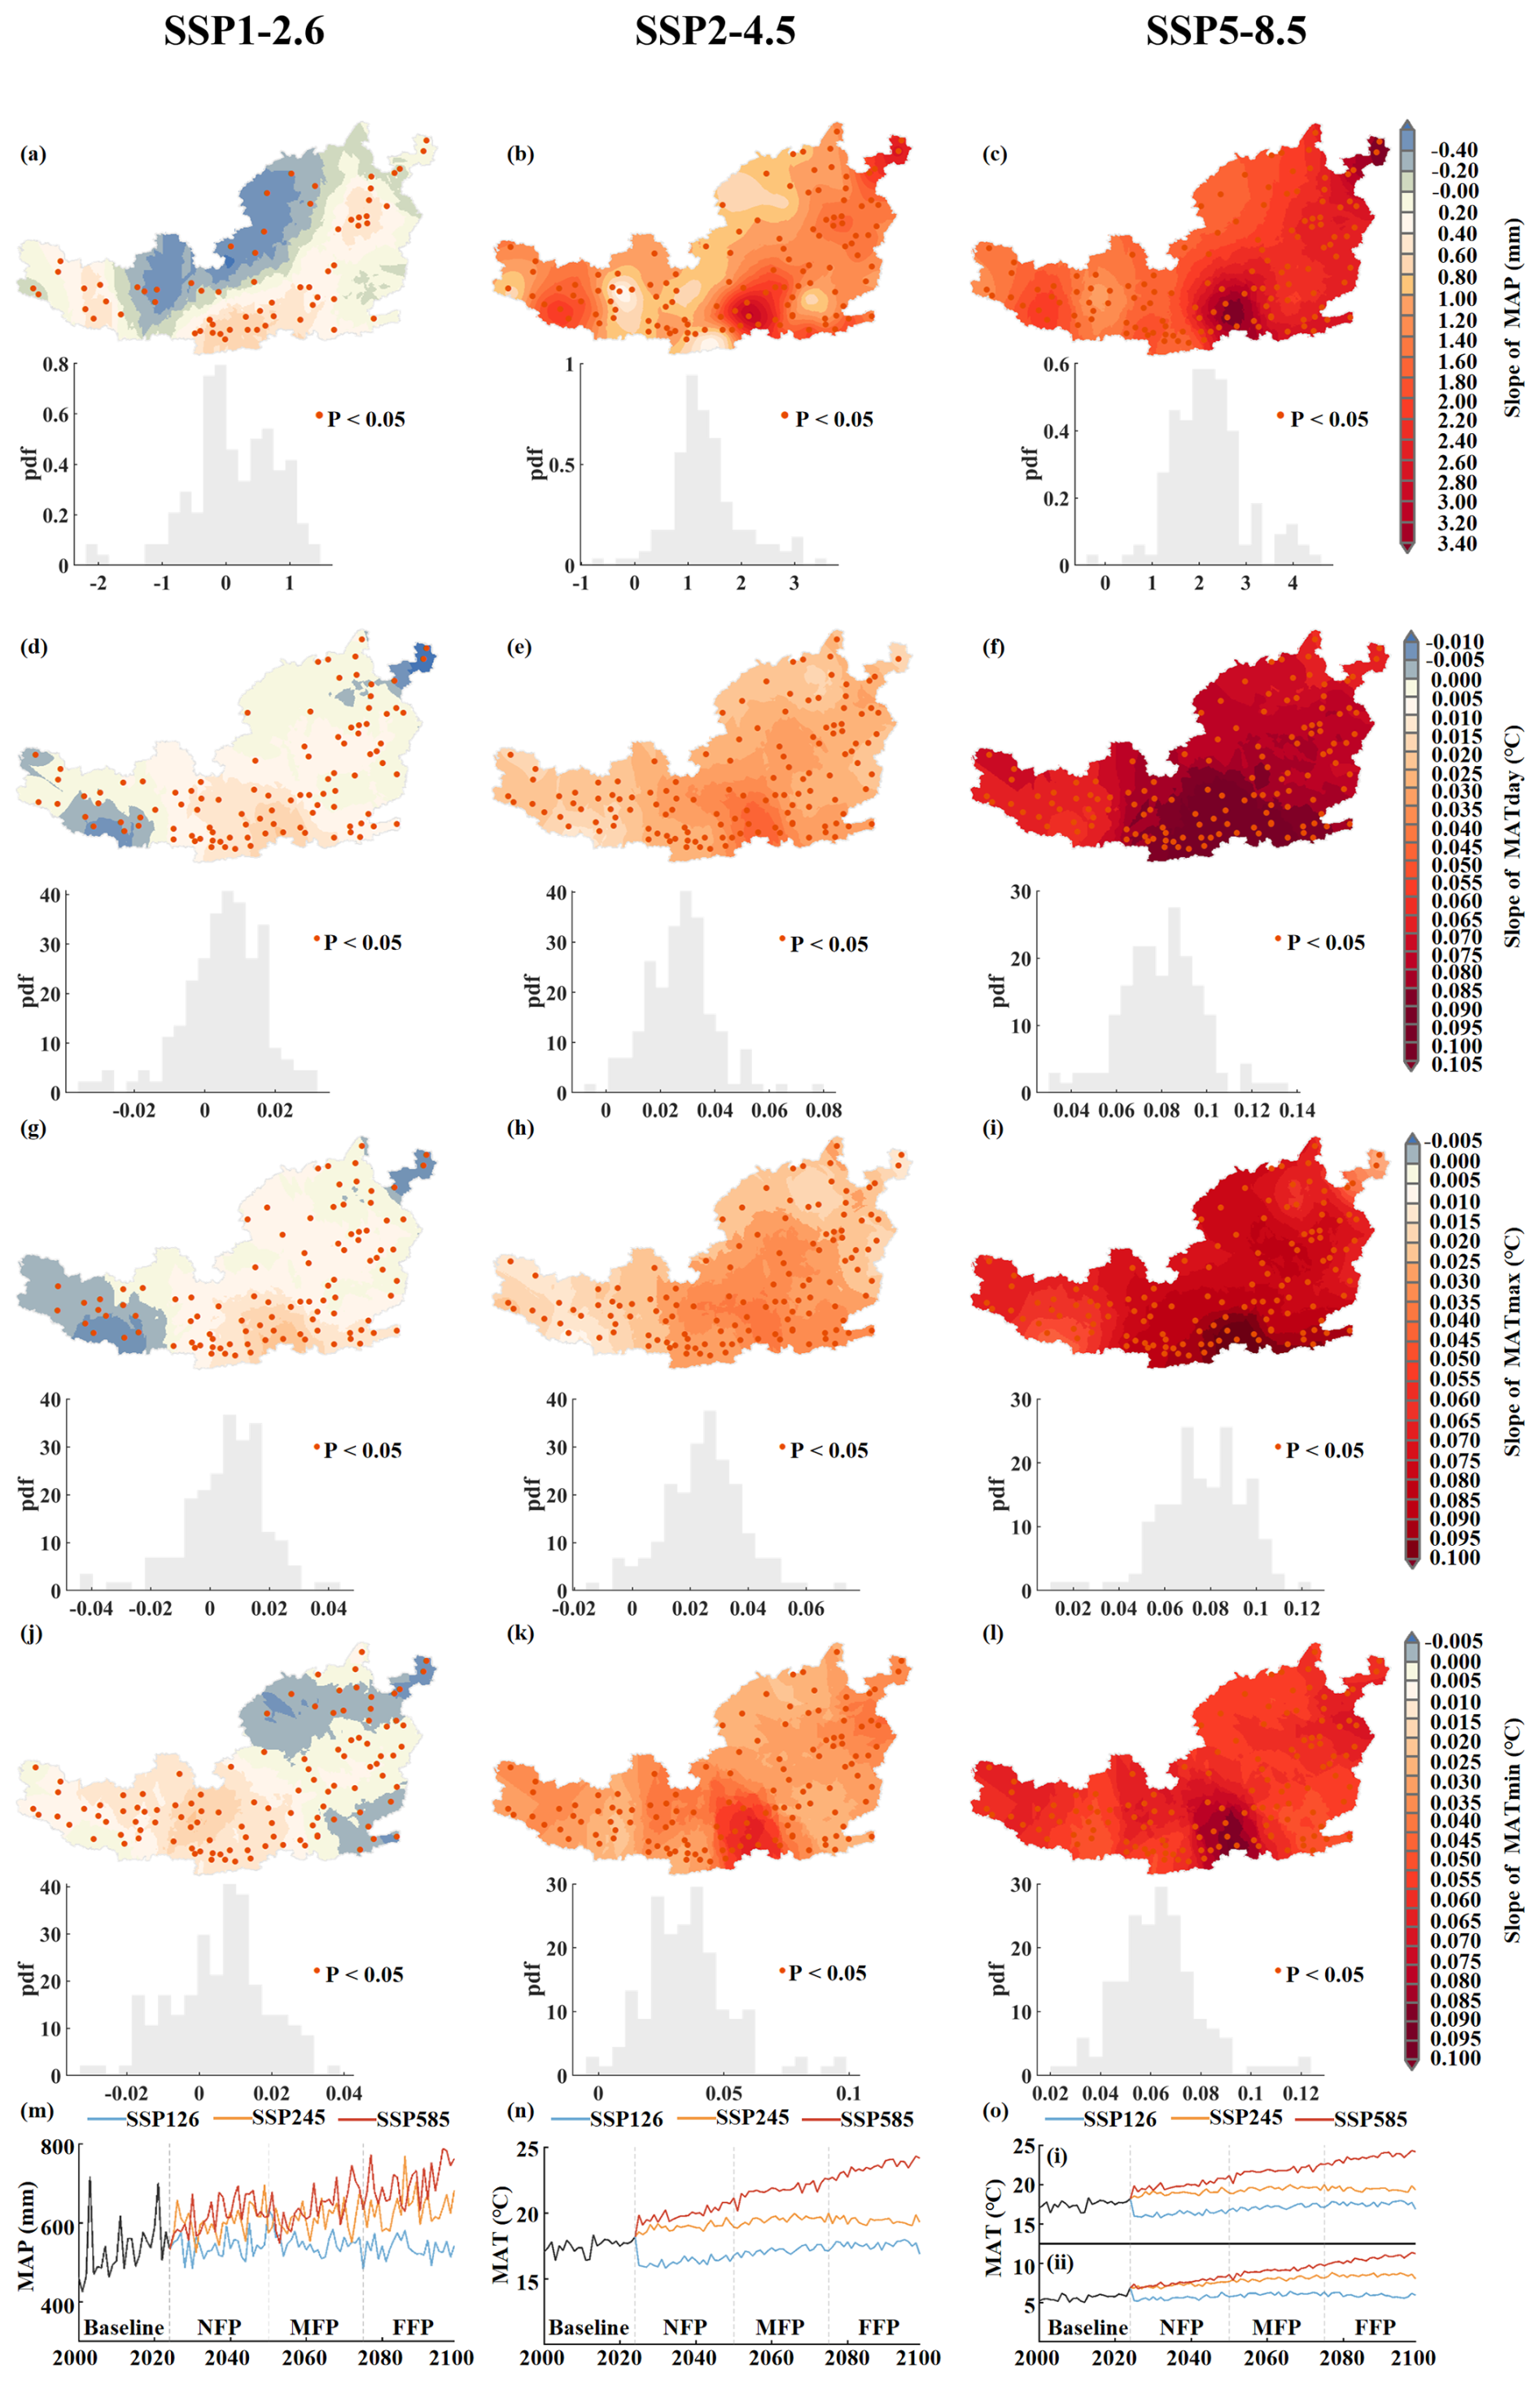
Figure 4Spatiotemporal dynamics in mean annual precipitation (MAP), mean annual temperature (MAT), mean annual maximum temperature (MATmax), and mean annual minimum temperature (MATmin) within the study area from 2000 to 2099 under SSP1–2.6, SSP2–4.5, and SSP5–8.5 scenarios: (a–l), spatial distributions of linear trend slopes for each variable under the three scenarios, with probability density functions (PDFs) shown in the lower-left corner; (m–o), temporal variation of MAP, MAT, MATmax (i), and MATmin (ii) under all SSP scenarios.
Based on the linear trends (slope values) of MAP, MAT, MATmax, and MATmin from 2000 to 2099, we analyzed the spatiotemporal changes in climate during the study period (Fig. 4). The slope values of climate variables under different SSPs showed significant spatial heterogeneity (Fig. 4a–l). The highest slope values were mainly concentrated in the southeastern part of the study area, with a general decrease from southeast to northwest. Under the SSP1–2.6 scenario, 52.9 % of the region showed an increasing trend in MAP during the study period, primarily in the southwest and southeast, with 32.8 % of the area experiencing significant increases (p < 0.05). Conversely, decreases in MAP were mainly located in the central and northern regions. MAT exhibited an increasing trend over a larger portion of the study area, covering 71.5 %, with 58.9 % of the area experiencing significant increases (p < 0.05). Decreases in MAT were limited to the southwest and northeast regions. MATmax primarily increased in the central region, while decreasing regions were limited to the southwest and northeast. MATmin primarily increased in the western and central regions, while decreasing regions were limited to the northeast and southeast. Compared to the SSP1–2.6 scenario, over 95 % of the study area showed increases in MAP and MAT under the SSP2–4.5 and SSP5–8.5 scenarios. The areas with the largest increases were concentrated in the southern part of the study area.
Figure 4m–o shows future climate in the study area is projected to become warmer under all SSPs, while precipitation changes vary among different scenarios compared to the baseline period. Under the SSP1–2.6 scenario, MAP ranged from 482 to 633 mm, with an average decrease of 0.105 mm yr−1. In contrast, MAT ranged from 12.99 to 14.64 °C, with an average increase of 0.020 °C yr−1. MATmax ranged from 15.79 to 17.97 °C, with an average increase of 0.025 °C yr−1. MATmin values ranged from 5.21 to 6.46 °C, with an average increase of 0.007 °C yr−1. Under the SSP2–4.5 scenario, MAP values ranged from 524 to 769 mm, with an average increase of 0.77 mm yr−1. Notably, the MAP growth rate fluctuated. In contrast, MAT increased more steadily, with an average increase of 0.014 °C yr−1 for MAT, 0.010 °C yr−1 for MATmax, and 0.025 °C yr−1 for MATmin. Under the SSP5–8.5 scenario, the average increases of MAP, MAT, MATmax, and MATmin were 1.806 mm yr−1, 0.070, 0.069, and 0.060 °C yr−1, respectively. Overall, the FFP climate is expected to experience the most significant fluctuations under the SSP5–8.5 scenario (p < 0.05).
3.3 Spatiotemporal dynamics of NPP and ET
Figure 5 shows spatiotemporal changes in the mean annual NPP of PT plantations during the baseline and future periods. The NPP of the study area was 533.5 in the baseline period but will be significantly lower in the future periods under the SSP1–2.6 and SSP2–4.5 scenarios (Fig. 5a and b). However, the NPP in the FFP will be 577.9 under the SSP5–8.5 scenario, which will be higher than in the baseline period (Fig. 5c). The highest NPP values of the baseline period were in the south and central regions, and the lowest were in the west, with a gradual decrease noted from southeast to northwest. This distribution pattern continues in the future periods.
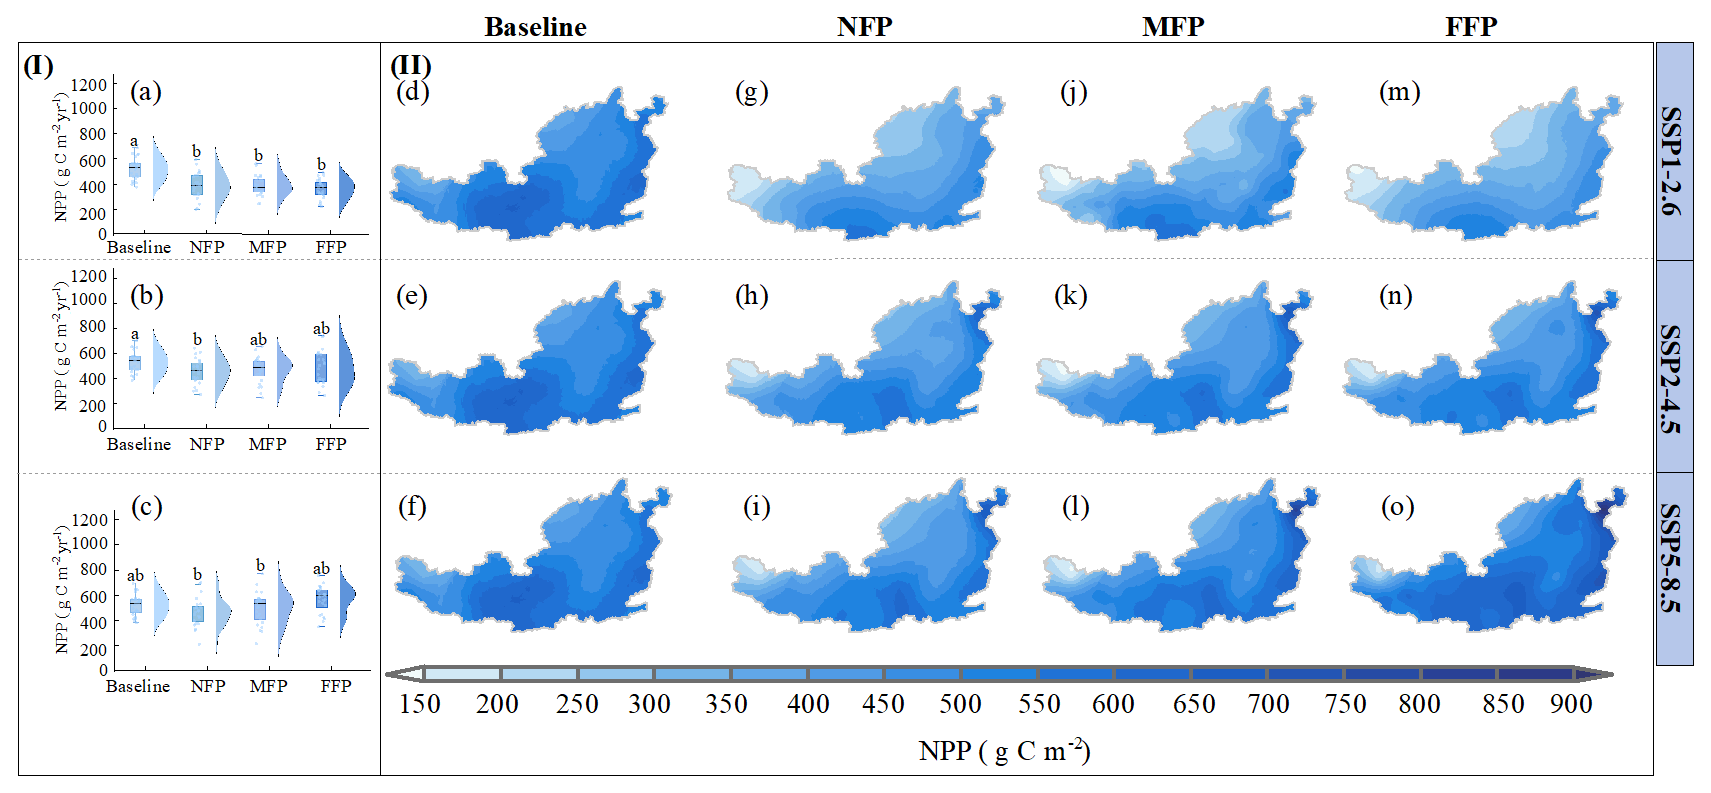
Figure 5Projected spatiotemporal dynamics of net primary production (NPP) for Pinus tabuliformis Carrière in the study area under baseline, SSP1–2.6, SSP2–4.5, and SSP5–8.5 scenarios: (i) temporal changes in NPP, with different letters indicating significant differences among the four periods within each scenario (p < 0.05); (ii) spatial dynamics of NPP. Baseline refers to the reference period (2000–2024), NFP to the near-future period (2025–2049), MFP to the mid-future period (2050–2074), and FFP to the far-future period (2075–2099).
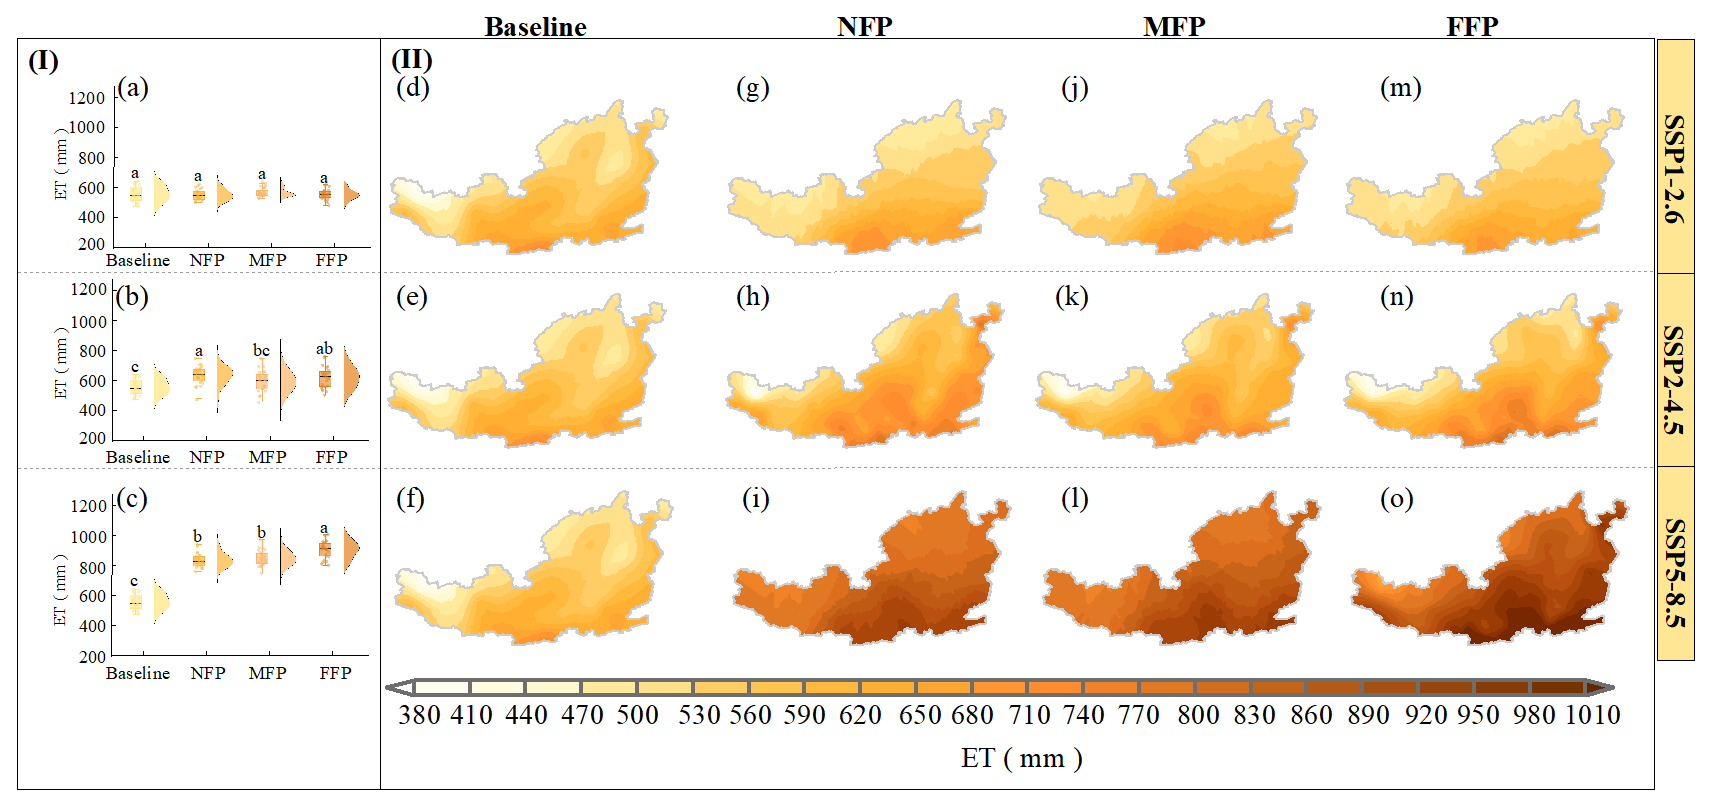
Figure 6Projected spatiotemporal dynamics of annual mean actual evapotranspiration (ET) for Pinus tabuliformis Carrière in the study area under baseline, SSP1–2.6, SSP2–4.5, and SSP5–8.5 scenarios: (i) temporal changes of ET, with different letters indicating significant differences among the four periods within each scenario (p < 0.05); (ii) spatial dynamics of ET. Baseline, NFP, MFP, and FFP are the same as defined in Fig. 5.
Figure 6 shows the spatiotemporal changes in the mean annual ET values during the baseline and future periods. The ET was 572.9 mm during the baseline period and will show no significant changes under the SSP1–2.6 scenario in the future periods. However, it will significantly increase under the SSP2–4.5 scenario and particularly under the SSP5–8.5 scenario (Fig. 6c). The ET value decreased gradually from southeast to northwest in the baseline period. This pattern is maintained in all SSPs.
3.4 Spatiotemporal dynamics of APLK and DMRP
Figure 7 shows spatial and temporal changes in the annual APLK of PT plantations in the study area during the baseline and future periods. APLK for the baseline period was 24.9 %. Under the SSP1–2.6 scenario, APLK values in the NFP, MFP, and FFP are projected to be 28.2, 28.7, and 29.5 %, respectively, indicating an increasing trend with a relatively slow rate of change. Under the SSP2–4.5 scenario, APLK values for future periods are projected to be 29.1 % (NFP), 33.3 % (MFP), and 32.8 % (FFP), indicating a larger increase compared to the baseline period. Under the SSP5–8.5 scenario, APLK values increased the most, with NFP, MFP, and FFP values of 31.7 %, 41.1 %, and 46.4 %, respectively, indicating APLK values will significantly increase under a more severe climate change context. APLK values during the baseline period showed an increasing trend from southeast to northwest. In the future, high APLK values will gradually expand from the northwest and northeast to the central and southern regions. Under the SSP5–8.5 scenario, only very central and southern regions will have APLK values below 35 %, while most areas in the central and northern regions will have values above 50 % in the FFP (Fig. 7o).
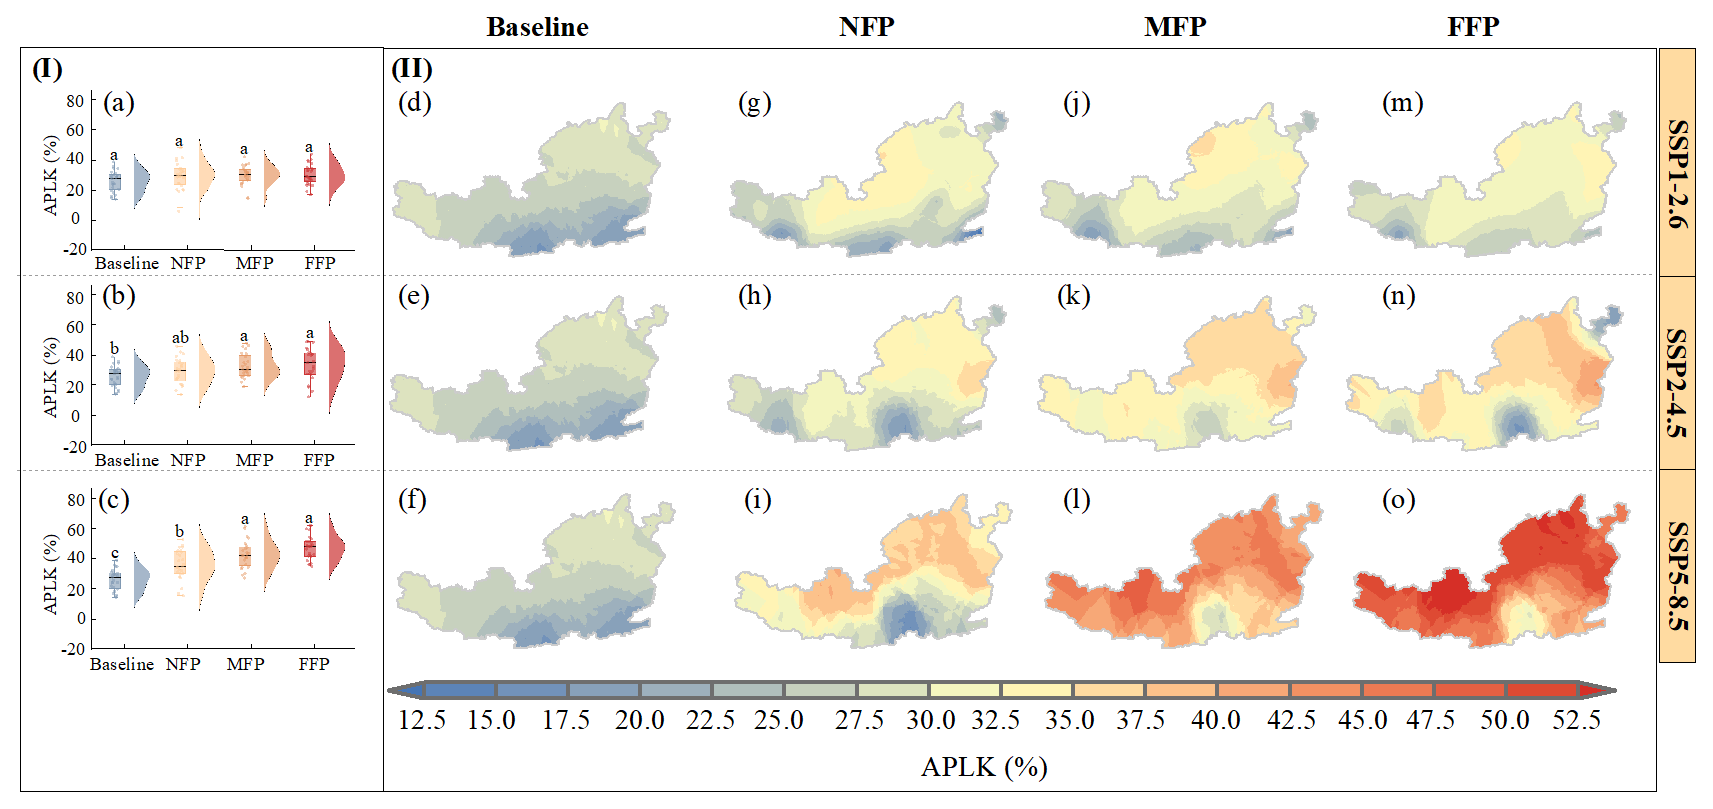
Figure 7Projected spatiotemporal dynamics of annual average percentage loss of whole-plant hydraulic conductance (APLK) for Pinus tabuliformis Carrière in the study area under baseline, SSP1–2.6, SSP2–4.5, and SSP5–8.5 scenarios: (i) temporal changes of APLK, with different letters indicating significant differences among the four periods within each scenario (p < 0.05); (ii) spatial dynamics of APLK. Baseline, NFP, MFP, and FFP are the same as defined in Fig. 5.
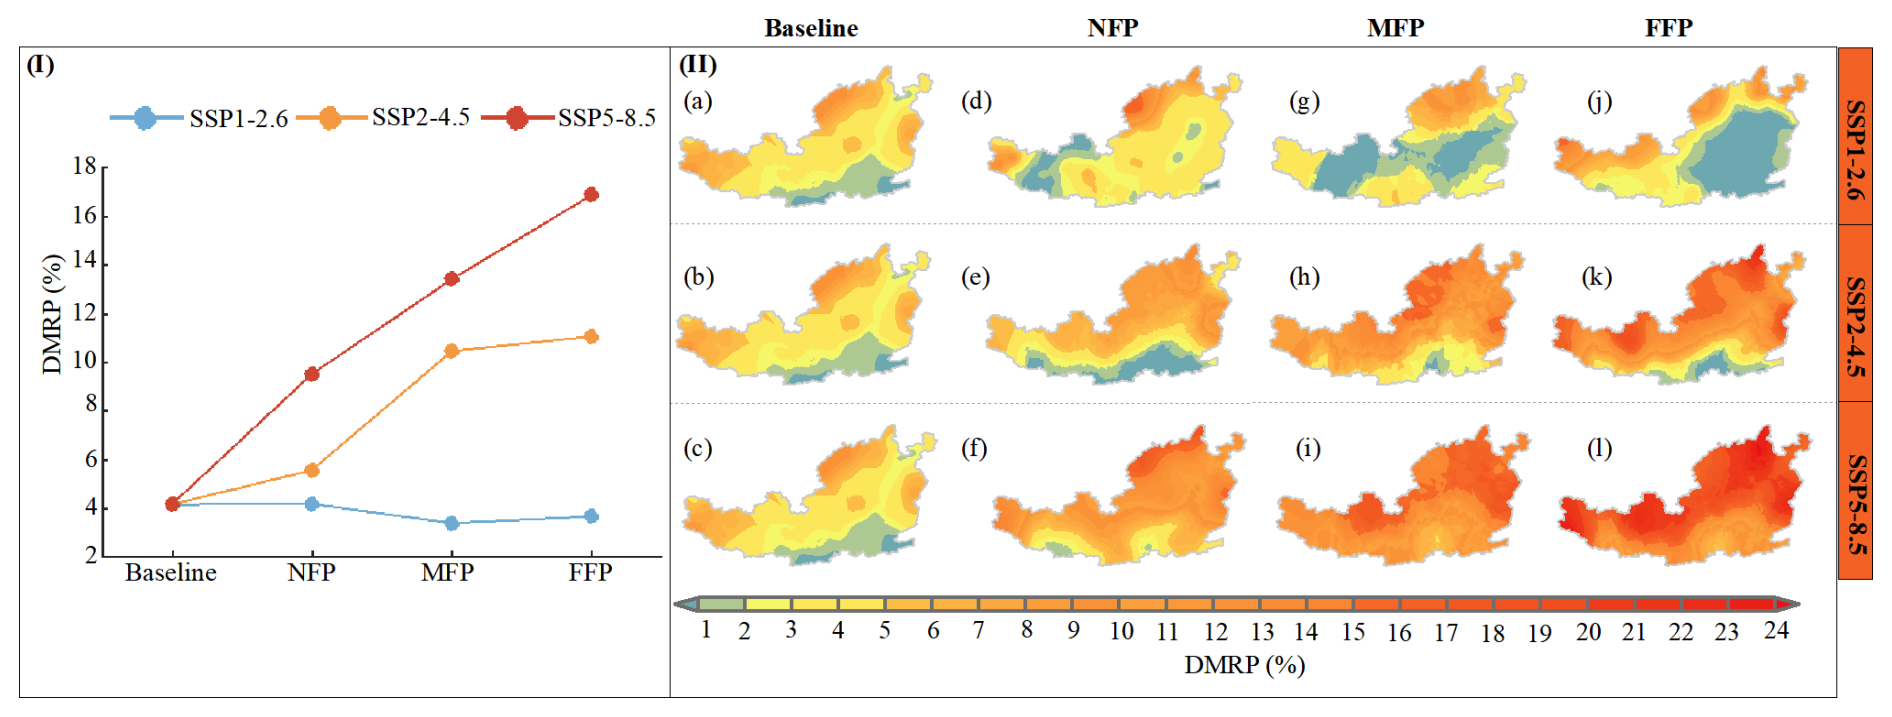
Figure 8Projected spatiotemporal dynamics of drought-induced mortality risk probability (DMRP) for Pinus tabuliformis Carrière in the study area under baseline, SSP1–2.6, SSP2–4.5, and SSP5–8.5 scenarios: (i) temporal changes of DMRP; (ii) spatial dynamics of DMRP. Baseline, NFP, MFP, and FFP are the same as defined in Fig. 5.
Based on a threshold of APLK ≥ 60 %, we calculated the spatiotemporal variations of DMRP of PT plantations during the baseline and future periods (Fig. 8). Low-risk zones for DMRP were mainly located in the southern part of the study area, medium-risk zones in the central and eastern regions, and high-risk zones in the northwest, north, and east, exhibiting a clear gradient from southeast to northwest in the baseline period. Under the SSP1–2.6 scenario, the distribution of high-risk zones will be similar to the baseline period, but the distribution of low- and medium-risk zones will change. In the NFP, low-risk zones will be primarily concentrated in the west. In the MFP, low-risk zones will be primarily concentrated in the west, central, and eastern regions. In the FFP, low-risk zones will be primarily concentrated in the central and eastern regions. Under the SSP2–4.5 and SSP5–8.5 scenarios, the distribution patterns of low-, medium- and high-risk zones will be similar to the baseline period but the high-risk zones will generally expand from northwest to southeast, covering a larger area. DMRP will show an increasing trend under the SSP2–4.5 and SSP5–8.5 scenarios, but a slight decreasing trend under the SSP1–2.6 scenario.
3.5 Spatiotemporal dynamics and factors influencing CWHRI
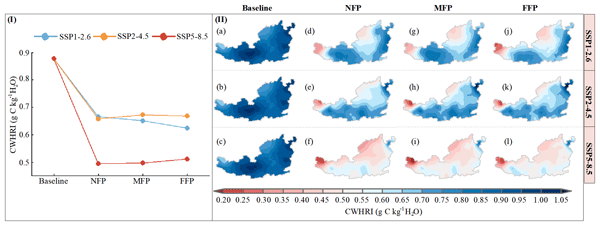
To comprehensively assess the growth of PT plantations, NPP, ET, and DMRP were used to calculate the CWHRI (Fig. 9). The CWHRI during the baseline period was 0.89 g C kg−1 H2O and will decrease under the SSP1–2.6, SSP2–4.5, and SSP5–8.5 scenarios to 0.63–0.67, 0.66–0.67, and 0.50–0.51 g C kg−1 H2O, respectively. This indicates that PT plantations may experience greater constraints on growth and increased risks of hydraulic failure and drought-induced mortality under future climate scenarios. CWHRI showed considerable spatial variability, with low-value zones mainly located in the western and northern parts of the study area, showing a distinct decreasing gradient from southeast to northwest in the baseline period. This pattern was maintained in all SSPs. Generally, areas with low CWHRI values will expand in the future periods. Under the SSP5–8.5 scenario, the CWHRI in the western parts of the study area will even fall below 0.25 g C kg−1 H2O. This suggests PT plantations in the western and northern parts of the study area may face greater constraints on carbon gain and increased hydraulic risks under future climate change.
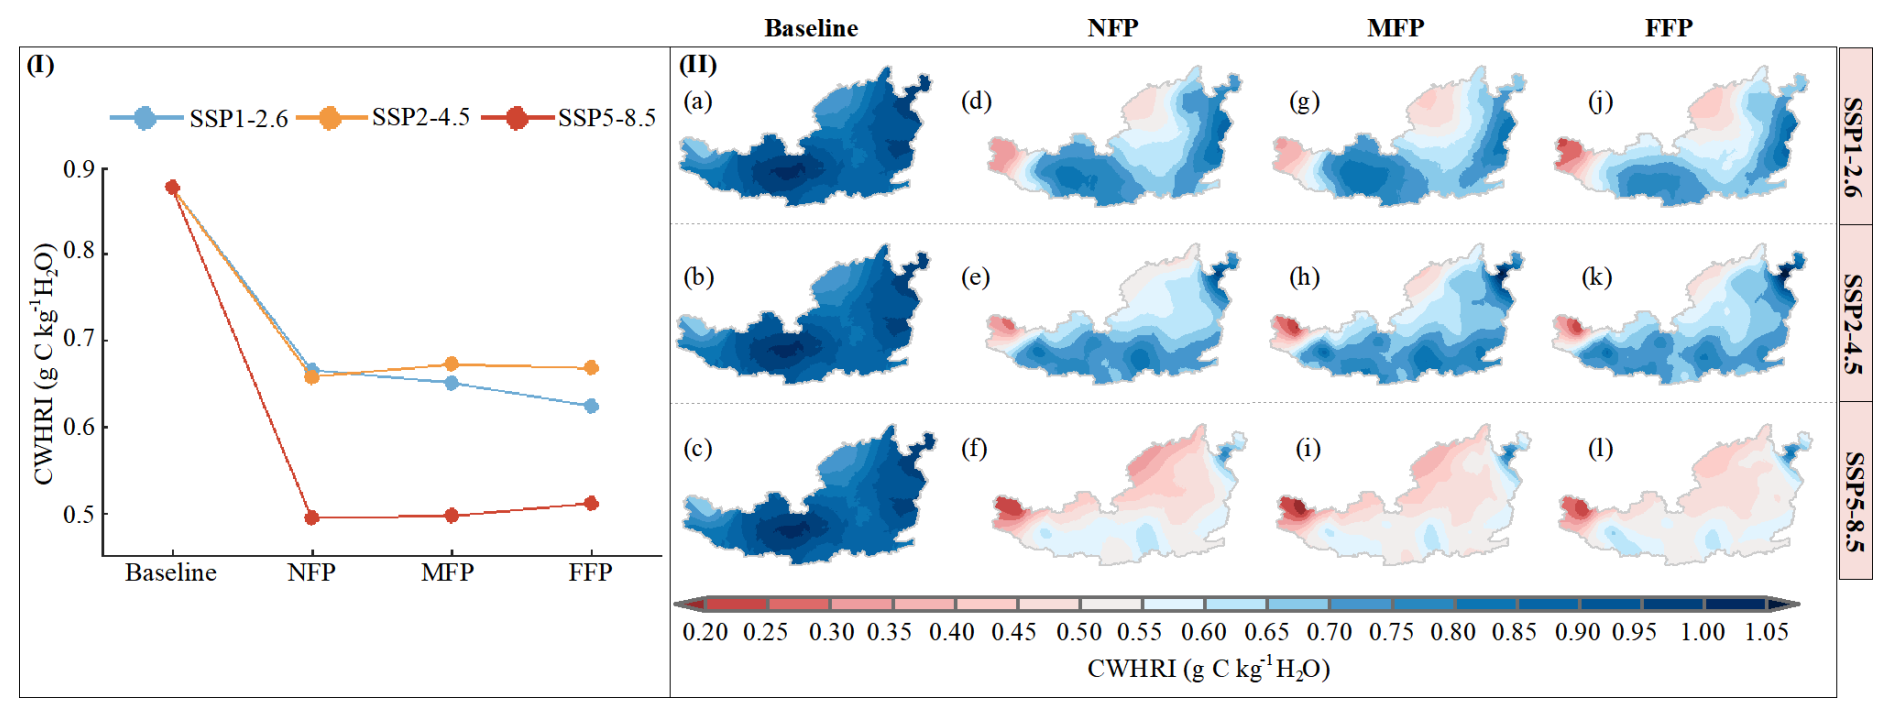
Figure 9Projected spatiotemporal dynamics of the carbon-water-hydraulic risk index (CWHRI) for Pinus tabuliformis Carrière in the study area under baseline, SSP1–2.6, SSP2–4.5, and SSP5–8.5 scenarios: (i) temporal changes of CWHRI; (ii) spatial dynamics of CWHRI. Baseline, NFP, MFP, and FFP are the same as defined in Fig. 5.
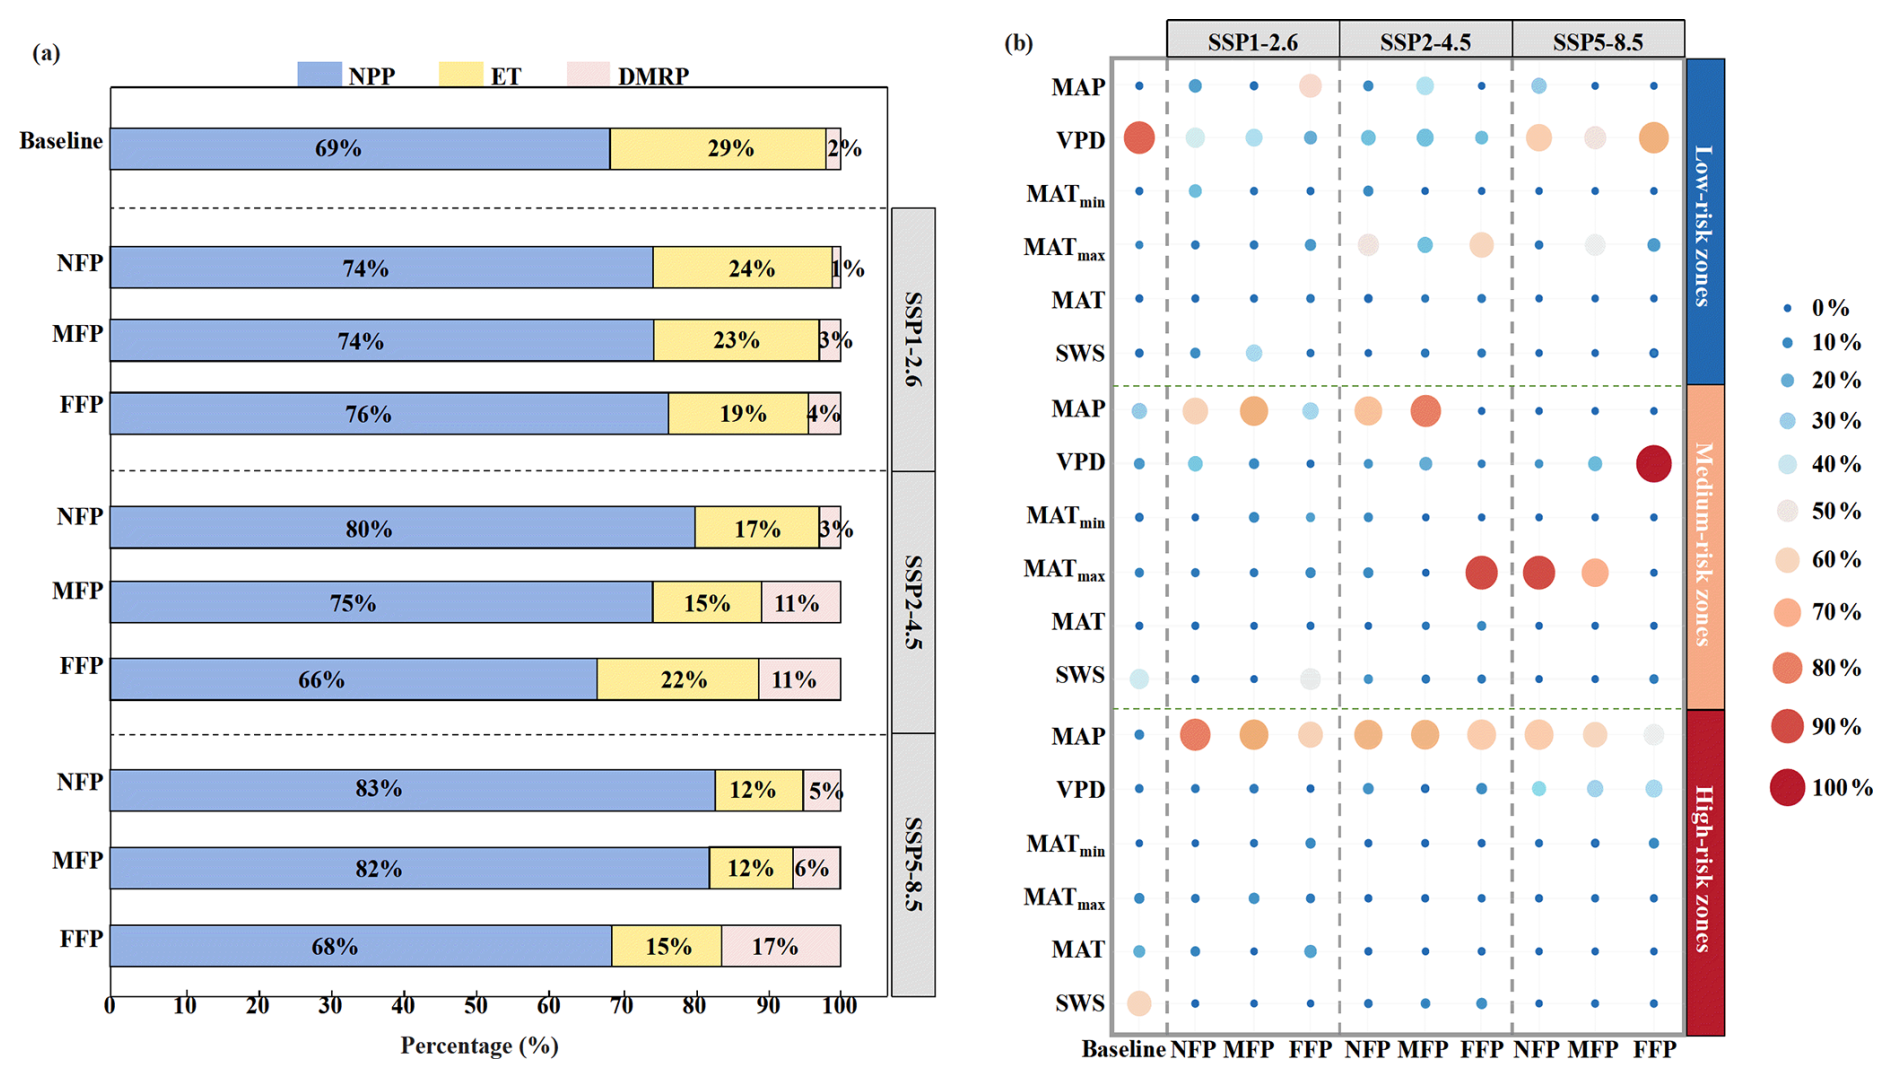
Figure 10Analysis of factors influencing variation in the carbon-water-hydraulic risk index (CWHRI): (a) contributions of net primary productivity (NPP), ecosystem evapotranspiration (ET), and drought-induced mortality risk (DMRP) as determined by multiple linear regression analysis; (b) analysis of the relative importance of six environmental variables. MAP, mean annual precipitation; MAT mean annual temperature; MATmax, mean annual maximum temperature; MATmin, mean annual minimum temperature; VPD, mean annual vapor pressure deficit, SWS, mean annual soil water storage. Low-risk zones, DMRP < 2 %. Medium-risk zones, 2 % ≤ DMRP ≤ 5 %. High-risk zones, DMRP > 5 %.
To quantify the extent to which NPP, ET, and DMRP influence changes in the CWHRI, we used multiple linear regression to calculate the relative contribution of each variable (Fig. 10a). During the baseline period, NPP and ET explained 98 % of the variation in CWHRI. NPP and ET remained the most important contributors to CWHRI variation in the future; however, the contribution of DMRP increased in all SSPs over the three future periods, reaching 17 % in the FFP under the SSP5–8.5 scenario.
To deepen understanding of the factors associated with CWHRI variation and how the relative importance of these factors changes, Fig. 10b presents an XGBoost-based assessment of the relative importance of six environmental factors for regions with different risk levels during the baseline and future periods. In the baseline period, VPD and SWS showed the highest relative importance among the six environmental factors. Specifically, the relative importance of VPD was 86 % in the low-risk zones, and of SWS was 42 % and 61 % in the medium- and high-risk zones, respectively. Under the SSP1–2.6 scenario, VPD continued to show the highest relative importance but its relative importance decreased by 49 % and 59 % in the low-risk zones during the NFP and MFP, respectively. MAP showed the highest relative importance value in the low-risk zones during the FFP, with a value of 56 %. In the medium-risk zones, MAP showed the highest relative importance during the NFP and MFP, whereas SWS showed the highest relative importance during the FFP, similar to the baseline period. In high-risk zones, MAP exhibited the highest relative importance in all three periods, ranging from 62 % to 81 %. Under the SSP2–4.5 scenario, MATmax showed the highest relative importance values in the NFP and FFP in low-risk zones, with values of 51 % and 60 %, respectively. MAP, VPD and MATmax collectively accounted for 91 % of the relative importance in the MFP. In the medium-risk zones, MAP showed the highest relative importance in the NFP and MFP, while MATmax showed the highest relative importance in the FFP. In high-risk zones, MAP showed the highest relative importance in all three periods, ranging from 67 % to 76 %. Under the SSP5–8.5 scenario, VPD showed the highest relative importance in low-risk zones during all three future periods, with values exceeding 50 %. In medium-risk zones, MATmax showed the highest relative importance during the NFP and MFP, with values exceeding 70 %. VPD showed a relative importance of 99 % during the FFP. In high-risk zones, MAP showed the highest relative importance in all three periods, ranging from 49 % to 68 %. Generally, the relative importance of MAP and MATmax increased from the baseline period into the future, suggesting that moisture- and temperature-related variables may become increasingly associated with CWHRI variation under future climate change.
4.1 BBGC-Sperry model performance
The BBGC-Sperry model is a coupled model. Therefore, a thorough validation is essential when using this model for simulation and prediction (Yan et al., 2022). Transpiration, SWC, Ψmd, and AGB are critical indicators for assessing the complex effects of climate change on vegetation growth and physiological characteristics. Accordingly, we validated the reliability of the BBGC-Sperry model in simulating the growth dynamics of PT plantations by using data from 36 meteorological stations on the Loess Plateau (Fig. 2). The results indicate R2 and NSE values for all simulated and measured indicators exceed 0.6, demonstrating the model effectively captures the dynamic changes in growth and ecohydrological processes in the PT plantations. This ability is closely tied to the model structure and input parameters.
The Sperry model replaces the SPAC water transport module of the original Biome-BGC model with an improved soil moisture transport module developed by Huang et al. (2013). This allows for greater control over dynamic changes in plant hydraulic traits and enables the simulation of interactions among the water, carbon, and nitrogen cycles. The BBGC-Sperry model provides a more refined simulation of vegetation growth processes and physiological mechanisms than the original model, and has been successfully applied to the Loess Plateau (Zhang et al., 2020, 2024b; Yan et al., 2022). Meteorological parameters were sourced from continuous observational data, and soil and vegetation physiological parameters were derived from field measurements or published literature, thereby ensuring the accuracy of the validation process.
4.2 Changes of NPP, ET and DMRP for Pinus tabuliformis Carrière plantations
Against the backdrop of global warming, the study area is projected to become generally warmer and wetter in the future under the SSP2–4.5 and SSP5–8.5 scenarios. These findings are consistent with previous studies (Xu et al., 2024). An assessment of the growth status of planted forests must not only consider their carbon sequestration capacity but also involve a comprehensive evaluation of related water fluxes and transport processes. Especially in water-scarce regions, water availability is the primary factor limiting the growth of planted forests. Previous studies have shown that relying solely on indicators such as leaf area index, carbon sequestration, and ET to assess vegetation growth is insufficient as these macroscopic indicators may mask the physiological stress experienced by vegetation (Tang et al., 2026).
Thus, we used the BBGC-Sperry model not only to simulate carbon and water fluxes of the PT plantations in the study area (Figs. 5 and 6) but also to simulate indicators that reflect vegetation physiology (Figs. 7 and 8). The results show that NPP in the study area will remain below the baseline level under future climate scenarios, except for the FFP under the SSP5–8.5 scenario. Previous studies have shown that precipitation, temperature, and carbon dioxide concentrations all significantly impact NPP. Specifically, increasing precipitation generally improves the water-use efficiency of vegetation, while moderate temperature increases and rising carbon dioxide concentrations promote photosynthesis. However, rising temperatures may decrease precipitation-use efficiency, thereby negatively impacting NPP (Gong et al., 2026). At the same time, high temperatures can inhibit the opening of plant stomata, thereby reducing plant productivity (He et al., 2024). Although NPP under most future climate scenarios will remain below the baseline level, it will increase progressively from the NFP to the FFP under all SSPs. This upward trend may be associated with increasing precipitation and atmospheric CO2 concentrations, both of which may promote vegetation growth (Walker et al., 2021; Yan et al., 2022; Ouyang et al., 2014).
Compared with the baseline period, ET will show an increasing trend under future climate scenarios. It will also increase from the NFP to the FFP. These changes may be associated with increasing precipitation and temperature. Precipitation serves as a source of water for ET. Rising temperatures may prolong the growing season and increase atmospheric evaporative demand, thereby promoting the transfer of more water from the soil and vegetation to the atmosphere. Chai et al. (2025) and Lu et al. (2025) also reported this phenomenon.
These macroscopic observations reveal profound changes in plant hydraulic mechanisms. As climate change intensifies from the baseline period to the SSP1–2.6, SSP2–4.5, and SSP5–8.5 scenarios, rising temperatures combined with increased potential ET will trigger mechanisms of plant hydraulic failure, as evidenced by significant increases in APLK and DMRP. The intensification of hydraulic failure leads to a decline in stomatal conductance, which in turn impairs cell turgor, membrane permeability, and xylem conduction, significantly increasing plant vulnerability to heat stress and outbreaks of pests and diseases (Torres-Ruiz et al., 2024). This ultimately results in limited photosynthetic rates and a significant decline in productivity. The findings from this study are consistent with previous research. Bonal et al. (2016) pointed out that tree mortality caused by drought and high temperatures not only reduces regional NPP but also weakens the cooling effect of ET, thereby creating a positive feedback loop that exacerbates global warming. Choat et al. (2018) also found that a slight increase in temperature may result in hydraulic imbalance or even death for most tree species.
Notably, NPP, ET, and DMRP all show a synchronous increase in the FFP under the SSP5–8.5 scenario. This phenomenon may be related to projected changes in precipitation, temperature, and atmospheric CO2 concentrations, which may jointly influence vegetation productivity and water fluxes (Walker et al., 2021; Yan et al., 2022; Ouyang et al., 2014). Although we observe an increase in carbon accumulation, the internal physiological stress the plants endure also significantly increases. The above results indicate that relying solely on macroscopic indicators is insufficient to capture the true growth state of vegetation. Therefore, a comprehensive assessment method that incorporates water transport processes is of great significance for accurately predicting vegetation growth dynamics and stability under future climate change.
4.3 Changes of CWHRI for Pinus tabuliformis Carrière plantations
In this study, we calculated the CWHRI based on the three fundamental indicators (NPP, ET, and DMRP) (Fig. 9). Compared to the baseline period, the CWHRI will decrease significantly in the future, indicating PT plantation sustainability may face increasing constraints under future climate change. The greater fluctuations in NPP during the study period were the dominant contributor to CWHRI variation, but the relative importance of DMRP increased steadily under all SSPs, rising from 2 % during the baseline period to 17 % in the FFP under SSP5–8.5. This increasing contribution suggests that incorporating the increasing influence of hydraulic failure risk under future climate change may provide a more comprehensive assessment of long-term plantation sustainability. These findings also corroborate the concerns raised by Wang et al. (2025) regarding future vegetation growth.
The environmental variables associated with CWHRI are related to the availability of water resources. During the baseline period, MAP, VPD, and SWS showed the highest relative importance. In all SSPs, the relative importance of MAP and MATmax will increase. SWS directly determines the amount of water available to vegetation, while MATmax and VPD are related not only to the degree of environmental aridity but also the stomatal conductance of vegetation and upward water transport driven by transpiration (Wang et al., 2009; Wang et al., 2024; Tang et al., 2026). Accordingly, these factors showed the highest relative importance for CWHRI variability. These findings indicate water-related ecological factors and meteorological variables remain key elements for future model improvements and ecological management strategies. Furthermore, the CWHRI declines steadily from the baseline period to the future periods, underscoring the urgency to formulate new management strategies and implement proactive intervention measures.
4.4 Limitations and implications
This study used the eco-hydrological BBGC-Sperry model to predict the growth, water consumption, and drought-induced mortality risk of PT plantations under future climate scenarios. The vegetation parameters in this model are fixed, which typically implies the spatiotemporal variability of vegetation growth is ignored, thereby introducing uncertainty into the simulation results. Recent studies based on the theory of plant hydraulic adaptation have predicted plant hydraulic, stomatal, and photosynthetic traits across various spatiotemporal scales (Joshi et al., 2022; Sperry et al., 2019). Future research should focus on integrating vegetation growth dynamics to further enhance model calibration and accuracy. We used meteorological data with a resolution of 0.25°, which effectively captures the dynamics of future climate change. However, limitations in accuracy may persist, particularly in precipitation prediction, which has notably lower accuracy. Spatially, we extended the simulated data from 130 meteorological stations across the region using Kriging interpolation. Although this method is computationally efficient, it may have limitations in resolution and accuracy. Additionally, although the BBGC-Sperry model has improved accuracy for simulating hydraulic transport processes compared to the original Biome-BGC model, the recently introduced BBGCMuSo model has more comprehensively simulated management practices. These improvements need to be integrated into the BBGC-Sperry model to better analyze the ability of different management strategies to improve the sustainability of forest plantations.
Despite certain methodological limitations, this study provides valuable scientific insights for the sustainable development of PT plantations. Compared to previous simulations, our study offers a comprehensive explanation of the drought response mechanisms of PT plantations under future climate change. Notably, under the backdrop of global climate change, the CWHRI of plantations is projected to decline and the contribution of DMRP is expected to increase under all SSPs, which indicated that current forest management practices may face increasing challenges in maintaining plantation sustainability. Future studies should accurately assess the optimal vegetation cover using soil moisture carrying capacity thresholds or early-warning models, and further evaluate the potential of adaptive strategies, including thinning management for existing PT plantations, mixed-species planting in low-risk southeastern regions, slope engineering practices in moderate-risk central and western regions (Yang et al., 2023), and gradual conversion of plantations toward drought-tolerant shrubs or sparse grasslands in high-risk northwestern regions.
This study used the BBGC-Sperry model to simulate the spatiotemporal dynamics of PT plantations from 2000 to 2099 under future climate scenarios (SSP1–2.6, SSP2–4.5, SSP5–8.5) on the Loess Plateau. The key findings are as follows:
- 1.
The BBGC-Sperry model, verified using hydraulic and growth process data, can effectively simulate the growth of PT plantations and their drought-induced mortality risk probability.
- 2.
The growth of PT plantations will slow down in the future. Compared with the baseline period, NPP is projected to decrease under most future climate scenarios and periods, except during the FFP under SSP5–8.5, when it is projected to exceed the baseline level. ET is projected to show the opposite trend. Spatially, NPP and ET both exhibit a southeast-to-northwest decreasing gradient.
- 3.
The mortality risk for PT plantations will increase, and the affected area will also expand. The APLK and DMRP of PT plantations are projected to significantly increase in the future. The study area will gradually shift from low-to-medium risk areas in the southeast to medium-to-high risk areas in the northwest.
- 4.
Compared to the baseline period, the CWHRI of PT plantations is projected to significantly decline in the future. The contribution of DMRP to CWHRI variability rises steadily across all SSPs, indicating that hydraulic risk constitutes a key constraint on plantation sustainability under future climate change.
These findings provide a better understanding of the growth of PT plantations in the restoration areas and how they will respond to future climate change. These findings highlight the importance of accounting for plant hydraulic risk when assessing future plantation sustainability under climate change.
The model simulation outputs (NPP, ET, APLK, DMRP, and CWHRI) used in this study are openly available in the Science Data Bank (ScienceDB) at https://doi.org/10.57760/sciencedb.45502 (Guo, 2026). The meteorological forcing data, soil hydraulic parameters, and eco-physiological parameters are described in Sect. 2.4.1, 2.4.2, and Table S1, respectively.
The supplement related to this article is available online at https://doi.org/10.5194/bg-23-7871-2026-supplement.
Tianqi Guo: Writing – original draft, Software, Methodology, Formal analysis, Data curation, Conceptualization. Mingbin Huang: Writing – review and editing, Supervision, Project administration, Methodology, Funding acquisition, Conceptualization. Zhongdian Zhang: Writing – review and editing. Rui Liu: Writing – review and editing, Data curation. Xiaofei Wu: Data curation. Xinmei Liu: Writing – review. Chenyi Ju: Writing – review.
The contact author has declared that none of the authors has any competing interests.
Publisher's note: Copernicus Publications remains neutral with regard to jurisdictional claims made in the text, published maps, institutional affiliations, or any other geographical representation in this paper. The authors bear the ultimate responsibility for providing appropriate place names. Views expressed in the text are those of the authors and do not necessarily reflect the views of the publisher.
The authors thank the members of the Ansai Agricultural Ecology Station, Chinese Academy of Sciences for their assistance.
This research has been supported by the National Natural Science Foundation of China (grant no. 42177287).
This paper was edited by Susanne Wiesner and reviewed by two anonymous referees.
Arend, M., Link, R. M., Patthey, R., Hoch, G., Schuldt, B., and Kahmen, A.: Rapid hydraulic collapse as cause of drought-induced mortality in conifers, P. Natl. Acad. Sci. USA, 118, e2025251118, https://doi.org/10.1073/pnas.2025251118, 2021.
Arya, L. M., Leij, F. J., van Genuchten, M. T., and Shouse, P. J.: Scaling parameter to predict the soil water characteristic from particle-size distribution data, Soil Sci. Soc. Am. J., 63, 510–519, https://doi.org/10.2136/sssaj1999.03615995006300030013x, 1999.
Bonal, D., Burban, B., Stahl, C., Wagner, F., and Hérault, B.: The response of tropical rainforests to drought–lessons from recent research and future prospects, Ann. For. Sci., 73, 27–44, https://doi.org/10.1007/s13595-015-0522-5, 2016.
Brodribb, T. J., Powers, J., Cochard, H., and Choat, B.: Hanging by a thread? Forests and drought, Science, 368, 261–266, https://doi.org/10.1126/science.aat7631, 2020.
Chai, Y. F., Miao, C. Y., Slater, L., Ciais, P., Berghuijs, W. R., Chen, T. X., and Huntingford, C.: Underestimating global land greening: Future vegetation changes and their impacts on terrestrial water loss, One Earth, 8, 101176, https://doi.org/10.1016/j.oneear.2025.101176, 2025.
Chen, C., Bongers, F. J., Schmid, B., Ma, K., and Liu, X. J.: Ecosystem consequences of functional diversity in forests and implications for restoration, New Phytol., 247, 1081–1097, https://doi.org/10.1111/nph.70247, 2025.
Chen, H., Shao, M., and Li, Y.: Soil desiccation in the Loess Plateau of China, Geoderma, 143, 91–100, https://doi.org/10.1016/j.geoderma.2007.10.013, 2008.
Chen, S. N., Wei, W., and Huang, Y.: Biophysical controls on canopy transpiration of Pinus tabulaeformis under different soil moisture conditions in the Loess Plateau of China, J. Hydrol., 631, 130799, https://doi.org/10.1016/j.jhydrol.2024.130799, 2024a.
Chen, Z., Wang, W., Forzieri, G., and Cescatti, A.: Transition from positive to negative indirect CO2 effects on the vegetation carbon uptake, Nat. Commun., 15, 1500, https://doi.org/10.1038/s41467-024-45957-x, 2024b.
Choat, B., Brodribb, T. J., Brodersen, C. R., Duursma, R. A., Lopez, R., and Medlyn, B. E.: Triggers of tree mortality under drought, Nature, 558, 531–539, https://doi.org/10.1038/s41586-018-0240-x, 2018.
da Silva, A. C., Armindo, R. A., dos Santos Brito, A., and Schaap, M. G.: SPLINTEX: A physically-based pedotransfer function for modeling soil hydraulic functions, Soil Till. Res., 174, 261–272, https://doi.org/10.1016/j.still.2017.07.011, 2017.
Fan, X., Qu, Y., Zhang, J., and Bai, E.: China's vegetation restoration programs accelerated vegetation greening on the Loess Plateau, Agr. Forest Meteorol., 350, 109994, https://doi.org/10.1016/j.agrformet.2024.109994, 2024.
Farquhar, G. D., von Caemmerer, S., and Berry, J. A.: A biochemical model of photosynthetic CO2 assimilation in leaves of C3 species, Planta, 149, 78–90, https://doi.org/10.1007/BF00386231, 1980.
Feng, X., Fu, B., Piao, S. L., Wang, S., Ciais, P., Zeng, Z. Z., Lü, Y. H., Zeng, Y., Li, Y., Jiang, X. H., and Wu, B. F.: Revegetation in China's Loess Plateau is approaching sustainable water resource limits, Nat. Clim. Change, 6, 1019–1022, https://doi.org/10.1038/nclimate3092, 2016.
Gong, E. J., Zhang, J., Bai, T. H., Wang, Z. H., Bai, H. Y., and Wang, J.: Spatiotemporal dynamics and influencing factors of precipitation and soil water use efficiency on the Chinese Loess Plateau, J. Hydrol., 644, 134600, https://doi.org/10.1016/j.jhydrol.2025.134600, 2026.
Granier, A.: Evaluation of transpiration in a Douglas-fir stand by means of sap flow measurements, Tree Physiol., 3, 309–320, https://doi.org/10.1093/treephys/3.4.309, 1987.
Guo, T. Q.: model data, V1, ScienceDB [data set], https://doi.org/10.57760/sciencedb.45502, 2026.
He, L., Wang, J., Peñuelas, J., Zohner, C. M., Crowther, T. W., Fu, Y. S., Zhang, W. X., Xiao, J. F., Liu, Z. F., Wang, X. F., Li, J. H., Li, X. J., Peng, S. Z., Xie, Y. W., Ye, J. S., Zhou, C. H., and Li, Z. L.: Asymmetric temperature effect on leaf senescence and its control on ecosystem productivity, PNAS Nexus, 3, 477, https://doi.org/10.1093/pnasnexus/pgae477, 2024.
Huang, M. B., Zettl, J. D., Barbour, S. L., Elshorbagy, A., and Si, B. C.: The impact of soil moisture availability on forest growth indices for variably layered coarse-textured soils, Ecohydrology, 6, 214–227, https://doi.org/10.1002/eco.1260, 2013.
Jia, X. X., Shao, M. A., Zhu, Y. J., and Luo, Y.: Soil moisture decline due to afforestation across the Loess Plateau, China, J. Hydrol., 546, 113–122, https://doi.org/10.1016/j.jhydrol.2017.01.011, 2017.
Jia, X. X., Shao, M. A., Yu, D., Zhang, Y., and Binley, A.: Spatial variations in soil-water carrying capacity of three typical revegetation species on the Loess Plateau, China, Agr. Ecosyst. Environ., 273, 25–35, https://doi.org/10.1016/j.agee.2018.12.008, 2019.
Jiao, W., Wang, L., Smith, W. K., Chang, Q., and D'Odorico, P.: Observed increasing water constraint on vegetation growth over the last three decades, Nat. Commun., 12, 3777, https://doi.org/10.1038/s41467-021-24016-9, 2021.
Joshi, J., Stocker, B. D., Hofhansl, F., Zhou, S., Dieckmann, U., and Prentice, I. C.: Towards a unified theory of plant photosynthesis and hydraulics, Nat. Plants, 8, 1304–1316, https://doi.org/10.1038/s41477-022-01244-5, 2022.
Li, C., Fu, B., Wang, S., Stringer, L. C., Wang, Y., Li, Z., Liu, Y., and Zhou, W.: Drivers and impacts of changes in China's drylands, Nat. Rev. Earth Environ., 2, 858–873, https://doi.org/10.1038/s43017-021-00226-z, 2021.
Li, Q., Yue, Y. M., Wang, L., and Wang, K. L.: Regional differences in carbon-water dynamics of various plantation forests in Southwest China, J. Hydrol., 661, 133809, https://doi.org/10.1016/j.jhydrol.2025.133809, 2025a.
Li, Z., Sun, F., Wang, H., and Wang, T.: Declining contribution of plant physiological effects to global drought characteristics with rising CO2 using state-of-the-art earth system models, Earths Future, 13, e2024EF005548, https://doi.org/10.1029/2024EF005548, 2025b.
Liu, K., Li, X., Li, X. K., Wang, S. D., and Zhou, G. S.: Past and future adverse response of terrestrial water storages to increased vegetation growth in drylands, npj Clim. Atmos. Sci., 6, 113, https://doi.org/10.1038/s41612-023-00437-9, 2023.
Liu, J., Ma, X., Duan, Z., Jiang, J., Reichstein, M., and Jung, M.: Impact of temporal precipitation variability on ecosystem productivity, Water, 7, e1481, https://doi.org/10.1002/wat2.1481, 2020.
Lu, C., Zhang, Q., Woolway, R. I., Ma, L., Liu, T. X., Wang, G., Sun, D. L., Singh, V. P., Bai, Y. G., Sun, B. S., and Huang, X.: Global warming will increase the risk of water shortage in northwest China, Earths Future, 13, e2025EF006199, https://doi.org/10.1029/2025EF006199, 2025.
Ma, Q., Su, Y., Niu, C., Hu, T. Y., Luo, X. Z., Tai, X. N., Qiu, T., Yao, Z., Bales, R. C., Liu, L. L., Kelly, M., and Guo, Q. H.: Tree mortality during long-term droughts is lower in structurally complex forest stands, Nat. Commun., 14, 7467, https://doi.org/10.1038/s41467-023-43083-8, 2023.
McDowell, N. G., Pockman, W. T., Allen, C. D., Breshears, D. D., Cobb, N., Kolb, T., Plaut, J., Sperry, J., West, A., Williams, D. G., and Yepez, E. A.: Mechanisms of plant survival and mortality during drought: Why do some plants survive while others succumb to drought?, New Phytol., 178, 719–739, https://doi.org/10.1111/j.1469-8137.2008.02436.x, 2008.
McDowell, N. G., Sapes, G., Pivovaroff, A., Adams, H. D., Allen, C. D., Anderegg, W. R. L., Arend, M., Breshears, D. D., Brodribb, T., Choat, B., Cochard, H., Cáceres, M. D., Kauwe, M. G. D., Grossiord, C., Hammond, W. M., Hartmann, H., Hoch, G., Kahmen, A., Klein, T., Mackay, D. S., Mantova, M., Martínez-Vilalta, J., Medlyn, B. E., Mencuccini, M., Nardini, A., Oliveira, R. S., Anna, S., Tissue, D. T., Torres-Ruiz, J. M., Trowbridge, A. M., Trugman, A. T., Wiley, E., and Xu, C. G.: Mechanisms of woody-plant mortality under rising drought, CO2 and vapour pressure deficit, Nat. Rev. Earth Environ., 3, 294–308, https://doi.org/10.1038/s43017-022-00272-1, 2022.
Melnikova, L., Ciais, P., Boucher, O., and Tanaka, K.: Assessing carbon cycle projections from complex and simple models under SSP scenarios, Climatic Change, 176, 168, https://doi.org/10.1007/s10584-023-03639-5, 2023.
Niu, L., Jia, X., Li, X., Zhao, C., Ren, L., Hu, W., Zhu, P., Li, D., Zhang, B., and Shao, M.: Developing novel ensemble models for predicting soil hydraulic properties in China's arid region, J. Hydrol., 636, 131354, https://doi.org/10.1016/j.jhydrol.2024.131354, 2024.
Ouyang, S., Wang, X., Wu, Y. L., and Sun, J. X.: Contrasting responses of net primary productivity to inter-annual variability and changes of climate among three forest types in northern China, J. Plant Ecol., 7, 309–320, https://doi.org/10.1093/jpe/rtt066, 2014.
Piao, S. L., Wang, X. H., Park, T., Chen, C., Lian, X., He, Y., Jarle, W. B., Chen, A. P., Ciais, P., Tømmervik, H., Ramakrishna, R. N., and Ranga, B. M.: Characteristics, drivers and feedbacks of global greening, Nat. Rev. Earth Environ., 1, 14–27, https://doi.org/10.1038/s43017-019-0001-x, 2020.
Qi, G., Song, J., Chen, S., Gong, Y., Bai, H., She, D., and Fu, Y. H.: Increasing impacts of compound extreme droughts on vegetation productivity in China, J. Hydrol., 660B, 133447, https://doi.org/10.1016/j.jhydrol.2025.133447, 2025.
Song, L. N., Zhu, J. J., Zheng, X., Li, X. J. Y., Wang, K., Zhang, J. X., Wang, G. C., and Sun, H. H.: Water use dynamics of trees in a Pinus tabuliformis plantation in semiarid sandy regions, Northeast China, Agr. Water Manage., 275, 107995, https://doi.org/10.1016/j.agwat.2022.107995, 2023.
Sperry, J. S. and Love, D. M.: What plant hydraulics can tell us about responses to climate-change droughts, New Phytol., 207, 14–27, https://doi.org/10.1111/nph.13354, 2015.
Sperry, J. S., Donnelly, J. R., and Tyree, M. T.: A method for measuring hydraulic conductivity and embolism in xylem, Plant Cell Environ., 11, 35–40, https://doi.org/10.1111/j.1365-3040.1988.tb01774.x, 1988.
Sperry, J. S., Wang, Y., Wolfe, B. T., Mackay, D. S., Anderegg, W. R. L., McDowell, N. G., and Pockman, W. T.: Pragmatic hydraulic theory predicts stomatal responses to climatic water deficits, New Phytol., 212, 577–589, https://doi.org/10.1111/nph.14059, 2016.
Sperry, J. S., Venturas, M. D., Todd, H. N., Trugman, A. T., Anderegg, W. R. L., Wang, Y., and Tai, X.: The impact of rising CO2 and acclimation on the response of US forests to global warming, P. Natl. Acad. Sci. USA, 116, 25734–25744, https://doi.org/10.1073/pnas.1913072116, 2019.
Tai, X., Mackay, D. S., Sperry, J. S., Brooks, P., Anderegg, W. R. L., Flanagan, L. B., Rood, S. B., and Hopkinson, C.: Distributed plant hydraulic and hydrological modeling to understand the susceptibility of riparian woodland trees to drought-induced mortality, Water Resour. Res., 54, 4901–4915, https://doi.org/10.1029/2018WR022801, 2018.
Tang, Q. and Chen, D.: Global change exacerbates water cycle imbalances and intensifies water resource crises, Sci. China Earth Sci., 68, 3077–3080, https://doi.org/10.1007/s11430-025-1661-5, 2025.
Tang, Z., Miralles, D. G., Guo, Z., and Maes, W. H.: Fast response of satellite fluorescence-derived plant physiology to drought stress, Nat. Commun., 17, 2886, https://doi.org/10.1038/s41467-026-70076-0, 2026.
Thornton, P. E., Law, B. E., Gholz, H. L., Clark, K. L., Falge, E., Ellsworth, D. S., Goldstein, A. H., Monson, R. K., Hollinger, D., Falk, M., Chen, J., and Sparks, J. P.: Modeling and measuring the effects of disturbance history and climate on carbon and water budgets in evergreen needleleaf forests, Agr. Forest Meteorol., 113, 185–222, https://doi.org/10.1016/S0168-1923(02)00108-9, 2002.
Thrasher, B., Wang, W., Michaelis, A., Melton, F., Lee, T., and Nemani, R.: NASA Global Daily Downscaled Projections, CMIP6, Sci. Data, 9, 262, https://doi.org/10.1038/s41597-022-01393-4, 2022a.
Thrasher, B., Wang, W., Michaelis, A., Melton, F., Lee, T., and Nemani, R.: NASA Global Daily Downscaled Projections (NEX-GDDP-CMIP6), NASA ADS [data set], https://doi.org/10.7917/OFSG3345, 2022b.
Torres-Ruiz, J. M., Cochard, H., Delzon, S., Boivin, T., Burlett, R., Cailleret, M., Corso, D., Delmas, C. E. L., De Caceres, M., Diaz-Espejo, A., Fernández-Conradi, P., Guillemot, J., Lamarque, L. J., Limousin, J., Mantova, M., Mencuccini, M., Morin, X., Pimont, F., Dios, V. R. D., Ruffault, J., Trueba, S., and Martin-StPaul, N. K.: Plant hydraulics at the heart of plant, crops and ecosystem functions in the face of climate change, New Phytol., 241, 984–999, https://doi.org/10.1111/nph.19463, 2024.
van Genuchten, M. T.: A closed-form equation for predicting the hydraulic conductivity of unsaturated soils, Soil Sci. Soc. Am. J., 44, 892–898, https://doi.org/10.2136/sssaj1980.03615995004400050002x, 1980.
Walker, A. P., De Kauwe, M. G., Bastos, A., Belmecheri, S., Georgiou, K., Keeling, R. F., McMahon, S. M., Medlyn, B. E., Moore, D. J. P., Norby, R. J., Zaehle, S., Anderson-Teixeira, K. J., Battipaglia, G., Brienen, R. J. W., Cabugao, K. G., Cailleret, M., Campbell, E., Canadell, J. G., Ciais, P., Craig, M. E., Ellsworth, D. S., Farquhar, G. D., Fatichi, S., Fisher, J. B., Frank, D. C., Graven, H., Gu, L., Haverd, V., Heilman, K., Heimann, M., Hungate, B. A., Iversen, C. M., Joos, F., Jiang, M., Keenan, T. F., Knauer, J., Körner, C., Leshyk, V. O., Leuzinger, S., Liu, Y., MacBean, N., Malhi, Y., McVicar, T. R., Penuelas, J., Pongratz, J., Powell, A. S., Riutta, T., Sabot, M. E. B., Schleucher, J., Sitch, S., Smith, W. K., Sulman, B., Taylor, B., Terrer, C., Torn, M. S., Treseder, K. K., Trugman, A. T., Trumbore, S. E., van Mantgem, P. J., Voelker, S. L., Whelan, M. E., and Zuidema, P. A.: Integrating the evidence for a terrestrial carbon sink caused by increasing atmospheric CO2, New Phytol., 229, 2413–2445, https://doi.org/10.1111/nph.16866, 2021.
Wang, F., Zhang, J. Z., Fonti, P., Sun, Q. P., Wang, Y. T., Zhang, F., Wang, Y. F., Yang, J. Q., and Gou, X. H.: Effects of site aridity and species on stand transpiration in high-elevation dryland ecosystems, J. Hydrol., 630, 130662, https://doi.org/10.1016/j.jhydrol.2024.130662, 2024.
Wang, L. N.: Loess Plateau Chinese pine plantation drought risk assessment, Doctoral dissertation, Beijing Forestry University, https://kns.cnki.net/kcms2/article/abstract?v=_oeCfPpuuXFSO8 kIStNiEeL0UCfMJBwKWbdhHor9zOLwrRBxTbpnUildnc6qV Rp8EuH0O8TR6b0WoUm4JLAfALEtsL6hQYqjOC0BjSHYbd 3BbcPXGbVgisaZau1z0p8qQAOgdcakyM7yVGnazvEL37Oem 9kFcNRNrFmAsiW_1ueT4UJAhNg_Nub6RmsM9Gyx (last access: 29 October 2026), 2016.
Wang, M. J., Peng, S. S., Lu, Z. H., Xu, X. T., Felton, A., and Chen, A. P.: Increasing constraint of aridity on tree intrinsic water use efficiency, Nat. Commun., 16, 7560, https://doi.org/10.1038/s41467-025-62845-0, 2025.
Wang, Z., Liu, B., Liu, G., and Zhang, Y. X.: Soil water depletion depth by planted vegetation on the Loess Plateau, Sci. China Ser. D-Earth Sci., 52, 835–842, https://doi.org/10.1007/s11430-009-0087-y, 2009.
Wolfe, B. T., Sperry, J. S., and Kursar, T. A.: Does leaf shedding protect stems from cavitation during seasonal droughts? A test of the hydraulic fuse hypothesis, New Phytol., 212, 1007–1018, https://doi.org/10.1111/nph.14087, 2016.
Wu, X. F., Yan, X. Y., Zhang, Z. D., Huang, M. B., Liu, X. M., and Guo, T. Q.: Differences in actual evapotranspiration and responses of pure and mixed forests to climate change on the Chinese Loess Plateau, Agr. Forest Meteorol., 385, 111210, https://doi.org/10.1016/j.agrformet.2026.111210, 2026.
Xu, F., Qu, Y., Bento, V. A., Song, H. Q., Qiu, J. X., Qi, J. Y., Wan, L. L., Zhang, R. R., Miao, L. J., Zhang, X. S., and Wang, Q. F.: Understanding climate change impacts on drought in China over the 21st century: a multi-model assessment from CMIP6, npj Clim. Atmos. Sci., 7, 32, https://doi.org/10.1038/s41612-024-00578-5, 2024.
Yan, X. Y., Zhang, Z. D., Huang, M. B., Zhao, X. F., Yang, F., and Wu, X. F.: The impact of climate change on growth and drought-induced mortality risk of Robinia pseudoacacia plantations along a precipitation gradient on the Chinese Loess Plateau, Agr. Forest Meteorol., 325, 109160, https://doi.org/10.1016/j.agrformet.2022.109160, 2022.
Yang, K. Q., Ma, Z. H., Wang, K., Li, G. L., Zhang, X. Y., Zhen, Q., and Zheng, J. Y.: Combining infiltration hole and mulching techniques with fish-scale pits effectively improved soil water storage in semiarid areas with shallow buried bedrock (Pisha Sandstone) in China, Catena, 230, 107249, https://doi.org/10.1016/j.catena.2023.107249, 2023.
Zhang, Z. D., Huang, M. B., Yang, Y. N., and Zhao, X. F.: Evaluating drought-induced mortality risk for Robinia pseudoacacia plantations along the precipitation gradient on the Chinese Loess Plateau, Agr. Forest Meteorol., 284, 107897, https://doi.org/10.1016/j.agrformet.2019.107897, 2020.
Zhang, Z. D., Jia, X. X., Zhu, P., Huang, M. B., Ren, L. D., and Shao, M. A.: Estimating the optimal vegetation coverage for the dominant tree and shrub species over China's northwest drylands, Sci. China Earth Sci., 67, 1500–1517, https://doi.org/10.1007/s11430-023-1287-x, 2024a.
Zhang, Z. D., Liu, T. H., Huang, M. B., Yan, X. Y., Liu, M. H., Yan, J. H., Chen, F. Y., Yan, W., and Niu, J. Q.: Spatial pattern of drought-induced mortality risk and influencing factors for Robinia pseudoacacia L. plantations on the Chinese Loess Plateau, Forests, 15, 1477, https://doi.org/10.3390/f15081477, 2024b.
Zhou, G. Y., Yi, G. C., and Tang, X. L.: Forest Ecosystem Carbon Stocks in China – Biomass Equations, Science Press, Beijing, 44 pp., ISBN 9787508853925, 2018.
Zhou, S., Williams, A. P., Berg, A. M., Cook, B. I., Zhang, Y., Hagemann, S., Lorenz, R., Seneviratne, S. I., and Gentine, P.: Land–atmosphere feedbacks exacerbate concurrent soil drought and atmospheric aridity, P. Natl. Acad. Sci. USA, 116, 18848–18853, https://doi.org/10.1073/pnas.1904955116, 2019.
Zhu, Y. J., Jia, X. X., and Shao, M. A.: Loess thickness variations across the Loess Plateau of China, Surv. Geophys., 39, 715–727, https://doi.org/10.1007/s10712-018-9462-6, 2018.