
the Creative Commons Attribution 4.0 License.
the Creative Commons Attribution 4.0 License.
 | 11 Nov 2026
Quantifying the near-term response of the ocean CO2 sink to reduced atmospheric carbon concentrations

Dustin Carroll
Galen A. McKinley
Nicole S. Lovenduski
Dimitris Menemenlis
Hong Zhang
The ocean plays a critical role in sequestering carbon, yet how the air–sea carbon sink will respond to rapid reductions in atmospheric carbon dioxide (CO2) concentrations remains a key uncertainty for climate mitigation and carbon accounting. In this study, we utilize the ECCO-Darwin ocean biogeochemistry model to simulate the ocean's response to a range of near-term CO2 mitigation scenarios which are simulated with reduced atmospheric carbon concentrations. Our results demonstrate an immediate but spatially heterogeneous weakening of the ocean carbon sink following reduced atmospheric forcing. Global air–sea carbon uptake decreases substantially within the first several years of mitigation, with the magnitude of the reduction scaling with the strength of the mitigation scenario. We find that the mitigation signal is primarily confined to the upper-500 m, reflecting dominant decadal-scale ventilation pathways. The most pronounced reductions in uptake occur in subtropical thermocline regions, western boundary currents, and the subpolar North Atlantic – regions characterized by intense ventilation and rapid air–sea equilibration. These findings align with recent CMIP-based long-term projections and observation-based inversions, confirming that the areas currently dominating anthropogenic carbon uptake are also the most sensitive to atmospheric forcing changes. Our results suggest that observational efforts to track impacts from reduced atmospheric carbon levels should be prioritized in these high-latitude and boundary current systems, where signals emerge earliest and most strongly. Ultimately, this study underscores the high sensitivity of the ocean carbon sink to changes in atmospheric forcing and highlights the necessity of sustained, strategically-placed observations to detect and attribute changes in the global carbon budget under future climate strategies.
- Article
(6762 KB) - Full-text XML
-
Supplement
(2609 KB) - BibTeX
- EndNote


-
The ECCO-Darwin ocean biogeochemistry model is used to simulate the response of the ocean carbon sink to reduced atmospheric CO2 levels.
-
Over 21 years, modeled mitigation results in reduced air–sea fluxes globally, yielding reductions of 48 % and 22 % for SSP1 and SSP2 Mitigation scenarios, respectively.
-
The strongest reductions in flux and DIC inventory occur in the Southern Ocean, North Atlantic, and boundary current regions.
The oceans absorb a substantial fraction of anthropogenic emissions of carbon dioxide (CO2), acting as a vital buffer for atmospheric CO2 rise and thereby moderating the impact of climate change (Gruber et al., 2019, 2023; Friedlingstein et al., 2026). However, the capacity, efficiency, and changing patterns of the future ocean carbon sink remain highly uncertain across different emission scenarios. Consequently, it is unclear how future mitigation pathways will affect the sink's long-term trajectory and durability.
Past studies that consider the global ocean response to climate mitigation have relied on fully-coupled Earth System Models (ESMs), with dynamic feedbacks between model components. Katavouta and Williams (2021) examined basin-scale contributions to the carbon-concentration and carbon-climate feedbacks across various ESMs that carried out experiments under the 6th Coupled Model Intercomparison Project (CMIP6). Their work demonstrates that ocean basins differ markedly in how ventilation, seawater buffer chemistry, and marine biology drive future CO2 uptake patterns. While ESMs provide a detailed representation of physical, chemical, and biological processes, they are computationally demanding and typically explore a limited set of scenarios (Flato et al., 2013).
At the same time, several studies underscore the regional and mechanistic complexity of the ocean carbon sink under both warming and mitigation. For example, Williams et al. (2024) highlight the pronounced role of the Southern Ocean in global carbon uptake and its asymmetries under changing atmospheric forcing. They find that the North Atlantic exhibits a larger reduction in carbon uptake than the Southern Ocean in future Shared Socioeconomic Pathway (SSP) scenarios using the CMIP6 suite of models (O'Neill et al., 2016; Riahi et al., 2017). Furthermore, Lee et al. (2025) demonstrate that under strong warming, an “uptake hole” may emerge in the subpolar North Atlantic due to shifts in convection and ventilation. These studies emphasize how regional ocean dynamics, transport, and vertical redistribution of dissolved inorganic carbon (DIC) are as important as surface forcing (i.e., air–sea gas exchange) when considering the long-term impact of changing CO2 emissions and ocean carbon sequestration. Specifically, the Southern Ocean has emerged as a critical region for anthropogenic carbon uptake, often accounting for ∼ 40 % of the global-ocean sink. Terhaar et al. (2021) used an emergent constraint approach to assess the Southern Ocean's cumulative uptake during 1850–2100, with uptake of 158 ± 6 Pg C under SSP1-2.6 and 279 ± 14 Pg C under SSP5-8.5. They found that sea surface salinity in the frontal zone between the Subtropical and Polar Front, which is primarily regulated by the freshwater cycle and circulation, is a key process regulating the ventilation and associated deep sequestration of anthropogenic carbon in the Southern Ocean.
Additionally, previous studies have revealed important mechanistic transitions that occur during emission mitigation scenarios. Ridge and McKinley (2021) showed that under high-emission scenarios, the decline in ocean uptake efficiency is dominated by buffer-capacity decline (a chemical limitation), whereas under a strong mitigation target, this decline is dominated by reduced vertical transport of anthropogenic carbon (a physical limitation) as the gradient between surface and interior carbon is reduced. This difference in the driving limitation of continued ocean carbon uptake under very different future climate scenarios illuminates the need for continued ocean monitoring and process studies to identify and better predict the trajectory of the ocean sink in the 21st century and beyond.
Despite the growing body of model- and process-based research, there remain important gaps in understanding how rapid, strong reduction of atmospheric carbon concentrations might reshape the magnitude, timing, and regional-scale footprint of ocean carbon uptake. In this study, we adopt an assimilation-based modeling framework, using the Estimating the Circulation and Climate of the Ocean-Darwin (ECCO-Darwin) ocean biogeochemistry model. We employ the ECCO-Darwin framework to isolate the oceanic carbon-cycle response to prescribed atmospheric CO2 reductions under physically consistent and observationally-constrained ocean physics and circulation. This approach avoids confounding carbon-climate feedbacks (Schimel and Carroll, 2024; Carroll et al., 2025) from atmosphere-sea-ice coupling while enabling a clear mechanistic interpretation of ventilation and carbon storage pathways on decadal timescales. ECCO-Darwin offers a unique balance between realism and interpretability by combining a globally optimized, observation-constrained hydrography, sea ice, and circulation with full marine carbon and ecosystem cycling. This makes it particularly well-suited for diagnosing regional and vertical mechanisms governing early responses to these changes, which are more difficult to isolate in fully-coupled ESMs.
Experimental Design and Atmospheric CO2 Forcing
We conducted a set of forward simulations using the v05 ECCO-Darwin ocean biogeochemistry model; a detailed description of the v05 ECCO-Darwin model set-up, observational constraints, and optimization methodology is presented in Carroll et al. (2020). Our Baseline simulation represents a best-possible hindcast of the ocean's physical, sea ice, and biogeochemical state from 1985–2021. The model is forced with observed atmospheric xCO2 from the National Oceanic and Atmospheric Administration Marine Boundary Layer product (NOAA MBL, Lan et al., 2024) and ECCO LLC 270 physics (Zhang et al., 2018). Model set-up and results from the Baseline simulation are discussed in more detail in Fay et al. (2024).
In this study, we generate and analyze output from three scenarios using different atmospheric forcing for years 2000–2021:
-
Baseline: forced with observed atmospheric CO2 concentrations from NOAA MBL.
-
SSP1 Mitigation: forced with a prescribed atmospheric CO2 trajectory consistent with projections based on SSP1-1.9, representing a strong reduction in global atmospheric CO2 concentration.
-
SSP2 Mitigation: forced with a trajectory consistent with SSP1-2.6, representing moderate and gradual changes in global atmospheric CO2 concentration.
Using atmospheric xCO2 projections for SSP1-1.9 and SSP1-2.6 mitigation pathways, provided by the Model for the Assessment of Greenhouse Gas Induced Climate Change (MAGICC) project (Meinshausen et al., 2020), we adjust the atmospheric carbon mixing ratio values back in time to impose changes beginning in January 2000 (Figs. 1, S1, S2 in the Supplement). Our Baseline atmospheric values are monthly global xCO2 values downloaded from the Global Monitoring Lab website (Lan et al., 2024). To apply a simulated atmospheric CO2 for post mitigation, the year 2035 is selected from the SSP scenarios, which is when the reductions of atmospheric CO2 are beginning to be observed in the global time series of the MAGICC simulations. We take values for January 2035 from each SSP scenario and translate the 2035–2055 time series to begin in January 2000, concatenating it to the Baseline time series beginning in that year by adjusting for the offset (Fig. S2).
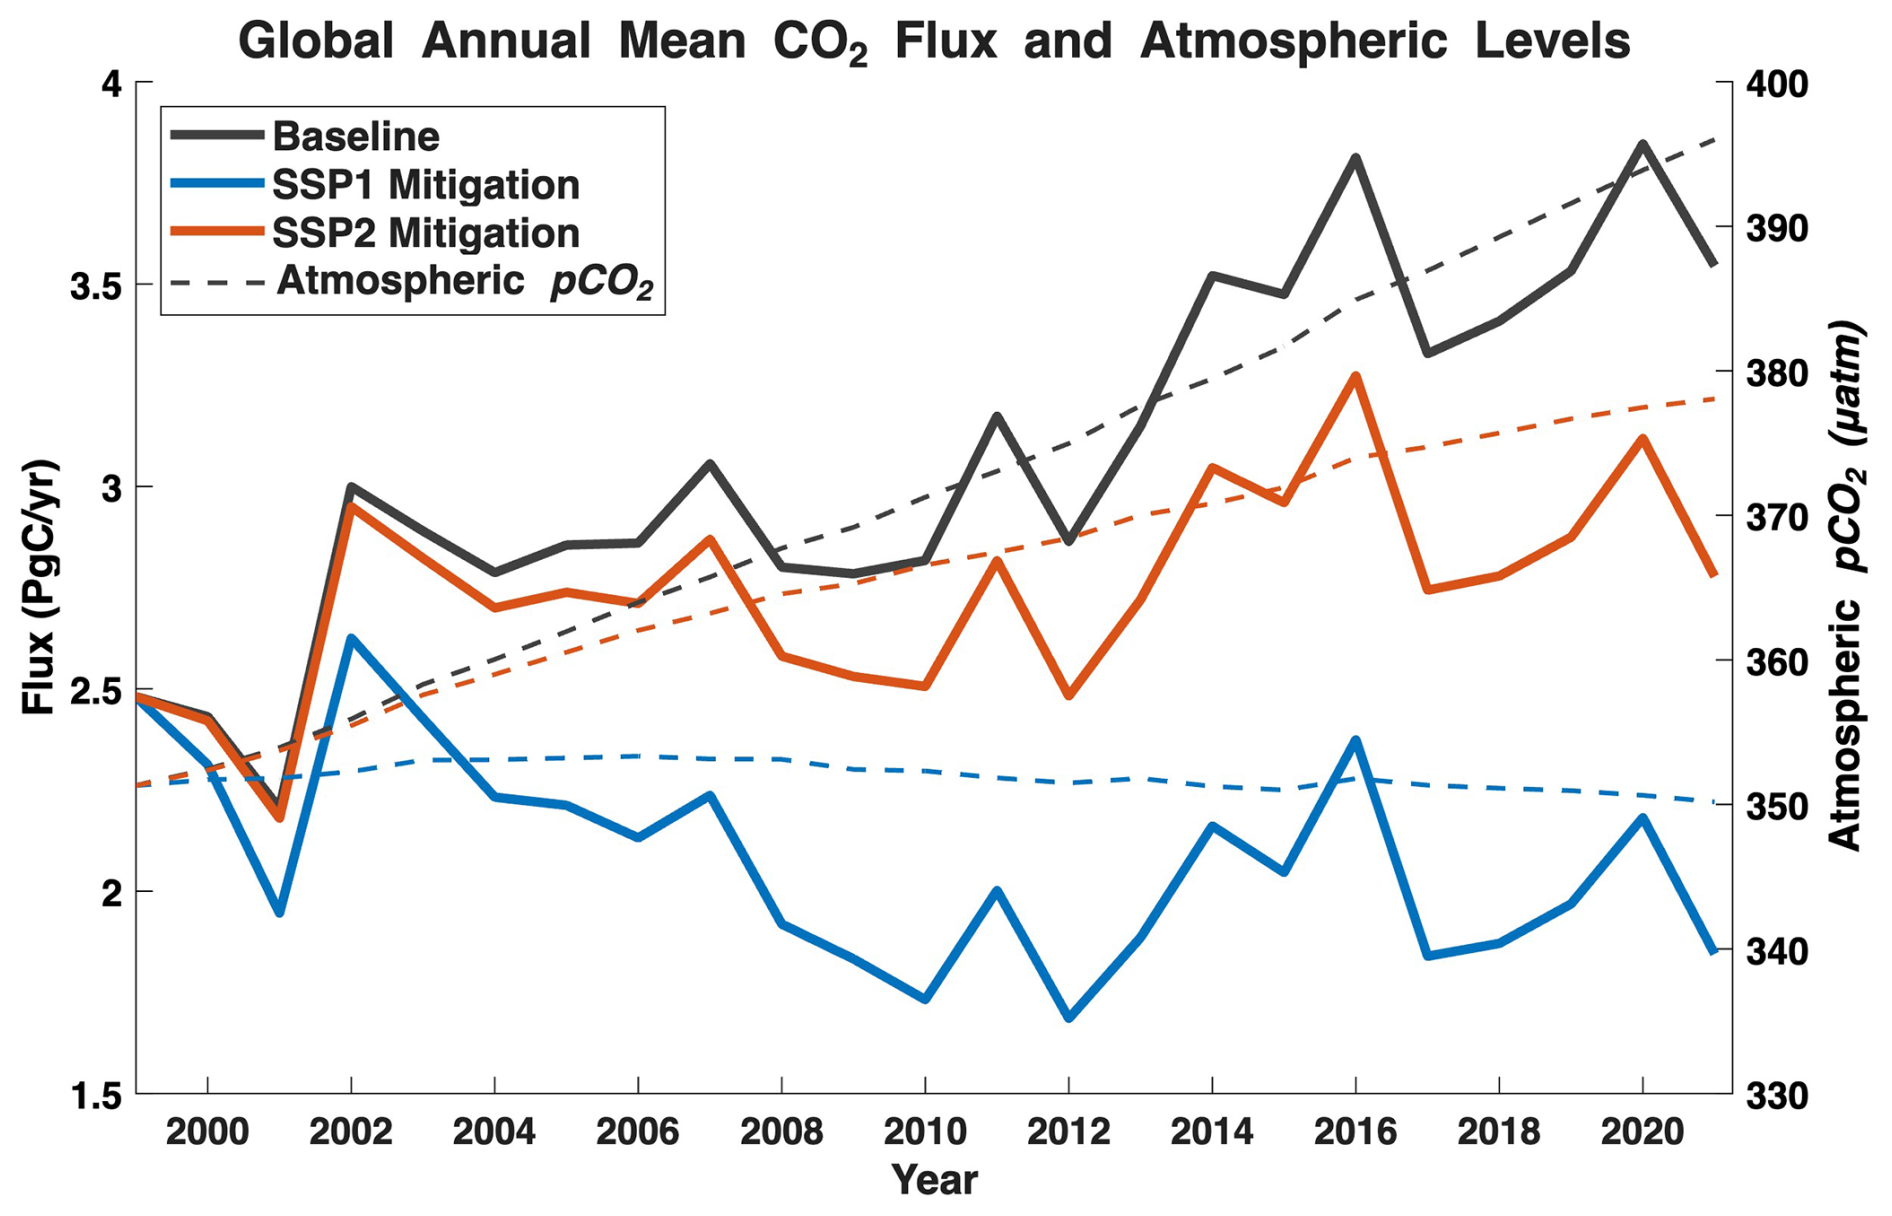
Figure 1Annual-mean time series of air–sea CO2 flux (solid lines) and atmospheric pCO2(dashed lines) for Baseline (black) and SSP mitigation simulations (SSP1: Blue, SSP2: Orange). Air-sea CO2 flux is globally integrated, and surface atmosphere pCO2 represents a global mean. Time series starts in year 2000, when SSP scenario forcing is applied. Positive flux represents ocean uptake (for the purpose of comparing with atmospheric values). Full time series available in Figs. S1 and S2.
This experimental setup provides an estimate of how ocean carbon uptake would evolve over the recent observation period if emission reductions had started in 2000. This novel use of a contemporary model and time period, with projected atmospheric CO2 concentration scenarios applied backward in time, provides unique insight into how the ocean carbon sink responds to mitigation signals within decadal timescales.
In this model configuration, ECCO-Darwin model physics are derived from the solution of Fay et al. (2024) and have identical physical characteristics in the baseline and mitigation runs. This allows us to isolate the carbon-cycle response (i.e., air–sea CO2 flux, seawater pCO2, DIC perturbation) to observed and mitigated atmospheric pCO2 levels without confounding changes in the physical and sea-ice ocean state. Each simulation uses identical physical and biogeochemical initial conditions. Differences among scenarios and the baseline therefore reflect the dynamic response of ocean circulation and carbonate chemistry to changes in atmospheric CO2 concentration alone. Furthermore, we compute three-dimensional DIC budget terms for each simulation, as done in Carroll et al. (2022), to provide mechanistic insight into the drivers of DIC space-time variability.
This section presents the simulated response of the marine carbon cycle under two divergent mitigation trajectories – SSP1 and SSP2 – as compared to the ECCO-Darwin Baseline run (Table 1). While both scenarios are evaluated, the following analysis primarily focuses on SSP1, as its aggressive mitigation pathway provides a more pronounced signal for identifying the mechanisms of carbon flux and storage change. Throughout this section, results are generally interpreted as the difference (or delta) between the mitigation scenario and the baseline (i.e. Mitigation minus Baseline), with a focus on the resulting differences in air–sea exchange and interior inventory. We first examine global atmospheric forcing and flux responses before detailing the physical and chemical drivers of carbon distribution across interior, spatial, and basin-scale dimensions, culminating in a comprehensive DIC budget analysis.
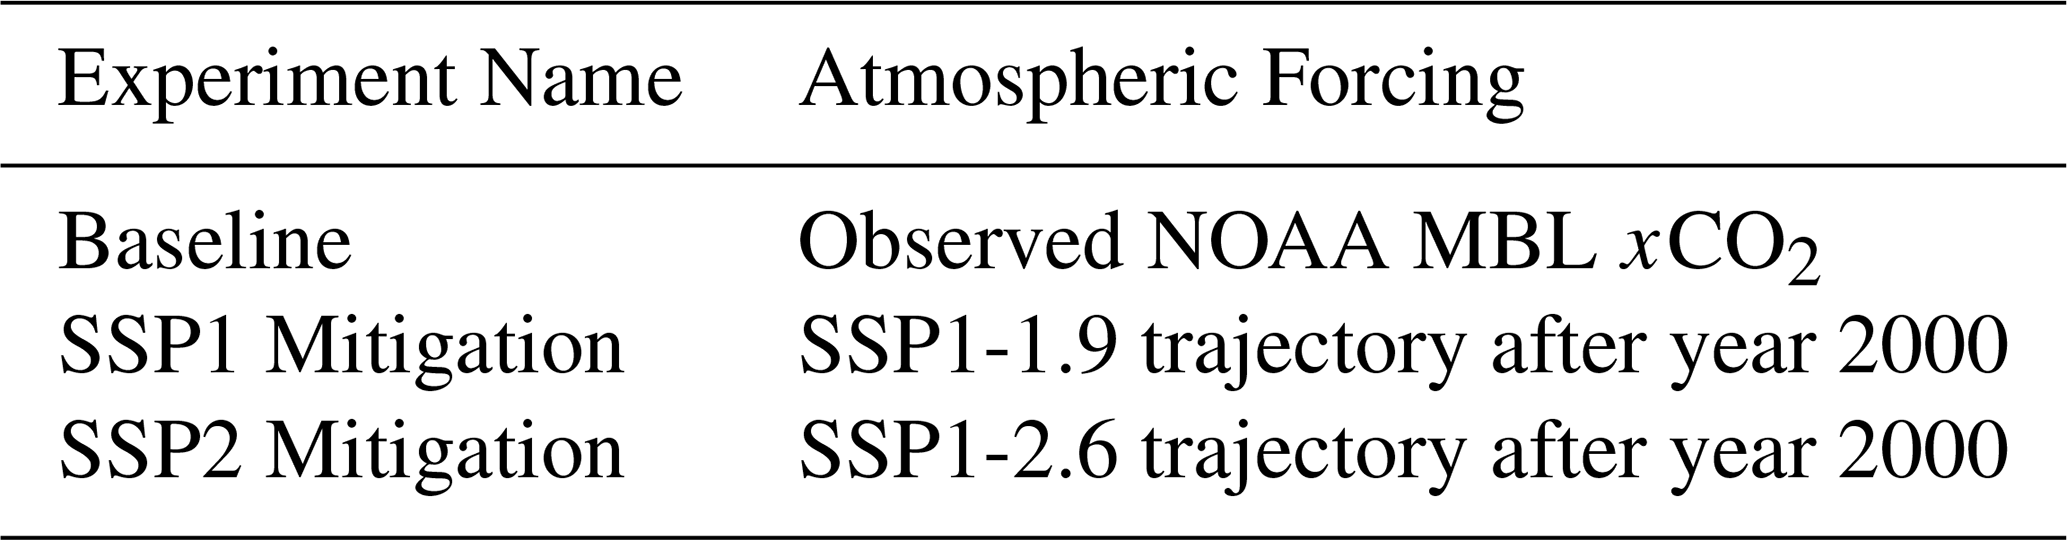
Table 1List of model experiments and prescribed atmospheric forcing. NOAA = National Oceanic and Atmospheric Administration Marine Boundary Layer (MBL) Product. xCO2 is the column-averaged CO2carbon dioxide in the atmosphere, represented in parts per million (Lan et al., 2024). Shared socio-economic pathway (SSP) trajectories were obtained from the MAGICC project (https://live.magicc.org/, last access: 13 September 2024, Meinshausen et al., 2020).
3.1 Atmospheric Forcing and Global Air–Sea CO2 Flux Response
Simulated global air–sea CO2 fluxes diverge immediately post-mitigation, responding promptly to changes in atmospheric carbon levels (Fig. 1). The three atmospheric CO2 scenarios diverge immediately following the onset of mitigation in January 2000, with SSP1 Mitigation representing the most aggressive reduction and SSP2 being a more moderate pathway (Fig. 1, Table 1). Reacting to the increasing atmospheric carbon levels in the Baseline simulation, ocean CO2 uptake continues to increase steadily through 2021. In contrast, the SSP1 simulation exhibits an immediate, marked reduction in uptake, while SSP2 Mitigation follows an intermediate trajectory between Baseline and SSP1 runs. For both mitigation scenarios, correlations between the detrended time series of global mean flux and atmospheric pCO2 levels for 2000–2021 show positive correlations of 0.48 at the 95 % confidence level. The strength of global mean air–sea CO2 flux reduction due to mitigation is on the order of 48 % and 22 % for SSP1 and SSP2 Mitigation scenarios, respectively, by the end of the simulation (2021, Figs. 1 and S1).
Although air–sea CO2 flux and atmospheric CO2 forcing are not strictly proportional, global annual-mean CO2 uptake closely tracks the imposed atmospheric trend, with the magnitude of flux reduction scaling with the strength of mitigation (Fig. 1). Considering the mean over the last 6 years of the simulation (2016–2021), the atmosphere experiences a 10 % decrease in pCO2 between the Baseline and SSP1 Mitigation scenarios (351 µatm vs. 390 µatm) and 4 % decrease between Baseline and SSP2 (376 µatm vs. 390 µatm). For the same time period, the decrease in air–sea flux is nearly 1.6 PgC yr−1 (SSP1-Baseline), equivalent to 45 % of the Baseline flux estimate (Fig. 1). For SSP2 Mitigation the difference is 0.65 PgC yr−1 (SSP2-Baseline), equivalent to 18 % of the Baseline flux estimate (Fig. 1). Decreasing the air–sea atmospheric pCO2 gradient through mitigation directly and rapidly alters the net ocean carbon flux.
3.2 Interior Carbon Response
Mitigation causes a marked decrease in the interior ocean DIC inventory (Fig. 2). In SSP1, significant upper ocean ΔDIC values (Mitigation minus Baseline) are evident within the first few years post-mitigation, reaching as high as 1 Tmol difference in the surface ocean by 2005 (Fig. 2a). This response is consistent with the rapid stabilization of atmospheric CO2 in SSP1 (Fig. 1). The largest difference in DIC inventory occurs around 500 m depth at the end of the simulation, reaching as much as 7.5 Tmol more DIC in the Baseline run than in the strong SSP1 mitigation scenario (Fig. 2a). Under the more gradual SSP2 mitigation scenario, such pronounced differences in DIC are not apparent. The maximum difference in DIC inventory reaches only 2 Tmol by 2021, however, the spatial patterns remain consistent, with largest differences occurring around 400–500 m depth (Fig. 2b). For both mitigation scenarios, DIC levels below 1500 m depth are indistinguishable from the Baseline run (not shown). Mitigation-driven changes remain confined to the upper ∼ 1000 m of the water column over the 21-year simulation period. The global ocean time series of the upper ocean's ΔDIC inventory also illustrate these patterns (Fig. 2c). The volume-integrated upper ocean DIC inventory (0–500 m) increases steadily in the Baseline simulation but diverges sharply in SSP1 mitigation, with a smaller but detectable divergence under SSP2 (Fig. 2c).
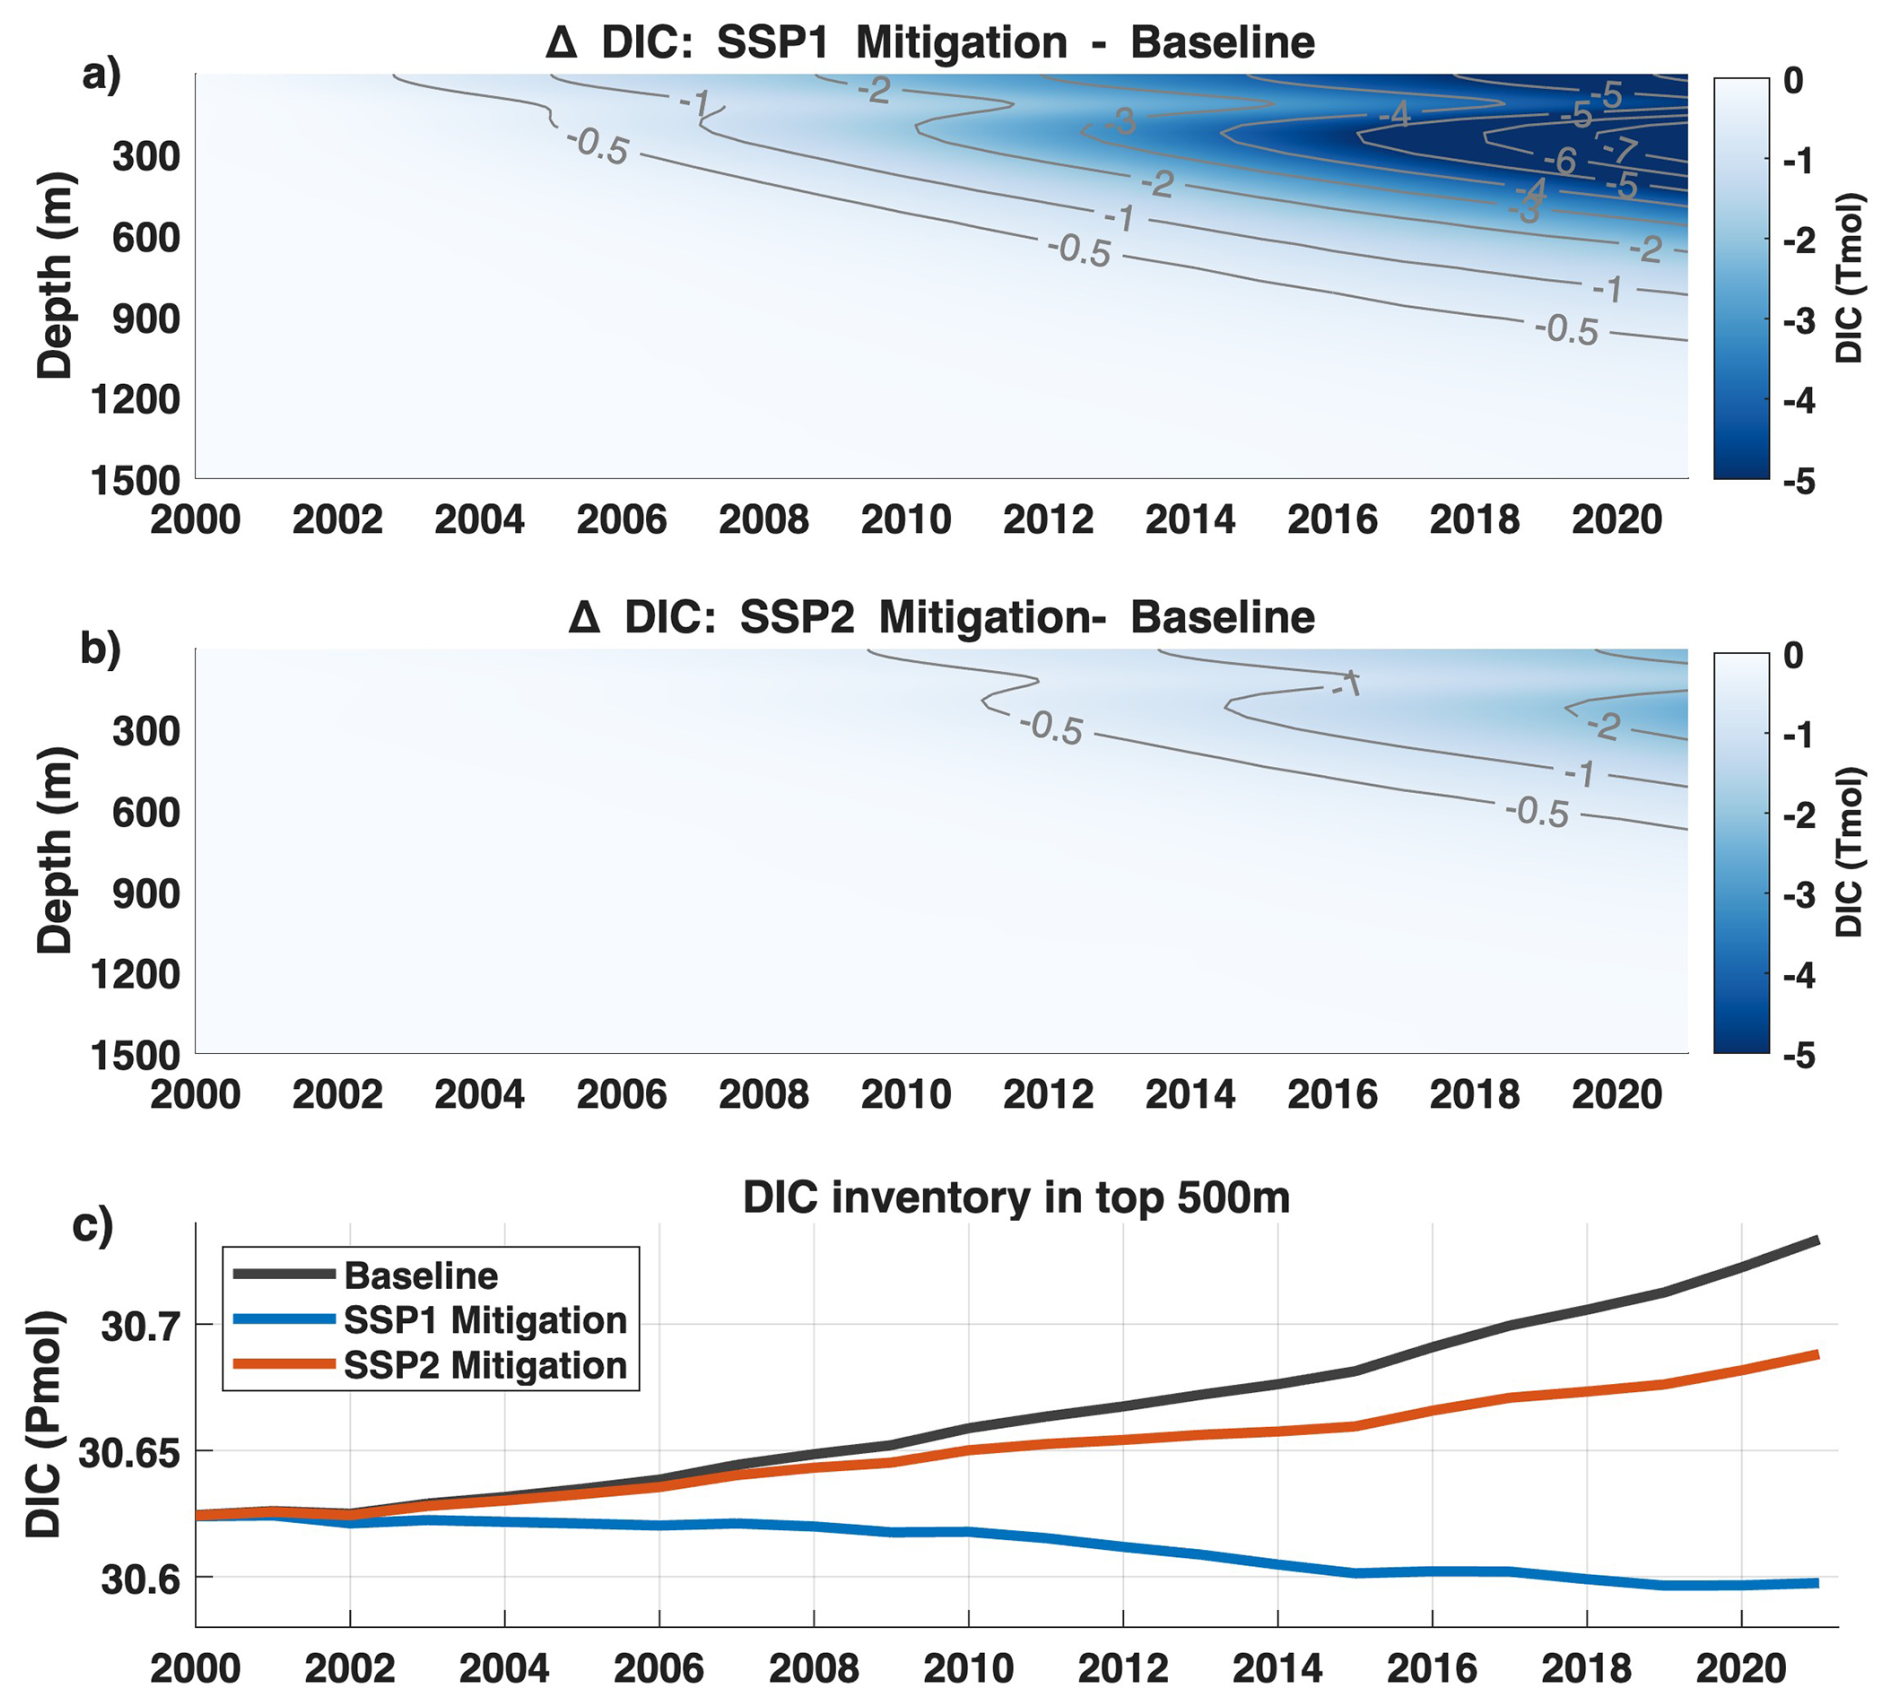
Figure 2Globally-integrated ΔDIC. Differences between Baseline and (a) SSP1 and (b) SSP2 for upper 1500 m. (c) Time series of DIC inventory in top 500 m of the upper ocean for Baseline (black) and SSP scenarios (SSP1 Mitigation: blue; SSP2 Mitigation: orange).
3.3 Spatial Patterns of Air–Sea CO2 Flux Change
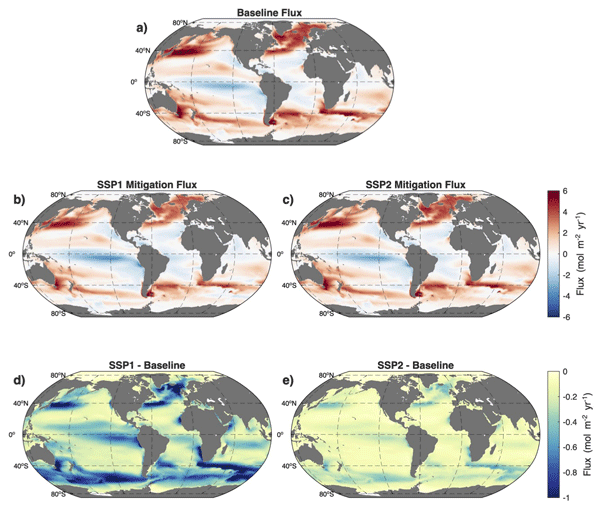
The Baseline simulation exhibits a large-scale pattern of air–sea CO2 flux, with strong net CO2 uptake in the mid-latitude Southern Ocean, the subpolar North Atlantic, and the western boundary current systems of the North Pacific and North Atlantic (Fig. 3a). Similar patterns of uptake and efflux exist for SSP1 and SSP2 Mitigation simulations (Fig. 3b, c); however, the strength of uptake is diminished in the mitigation simulations. Differences relative to the Baseline for the end of the experiments (2016–2021 mean) reveal pronounced regional heterogeneity in the response to mitigation (Fig. 3d, e). Both SSP1 and SSP2 Mitigation simulations show widespread reductions in ocean CO2 uptake relative to Baseline, with the magnitude of change larger under SSP1 Mitigation but the patterns relatively unchanged (Fig. 3d, e). The spatial structure of these differences indicates that mitigation does not uniformly weaken uptake across the global ocean, but instead produces concentrated responses in specific ocean regions characterized by distinct circulation dynamics.
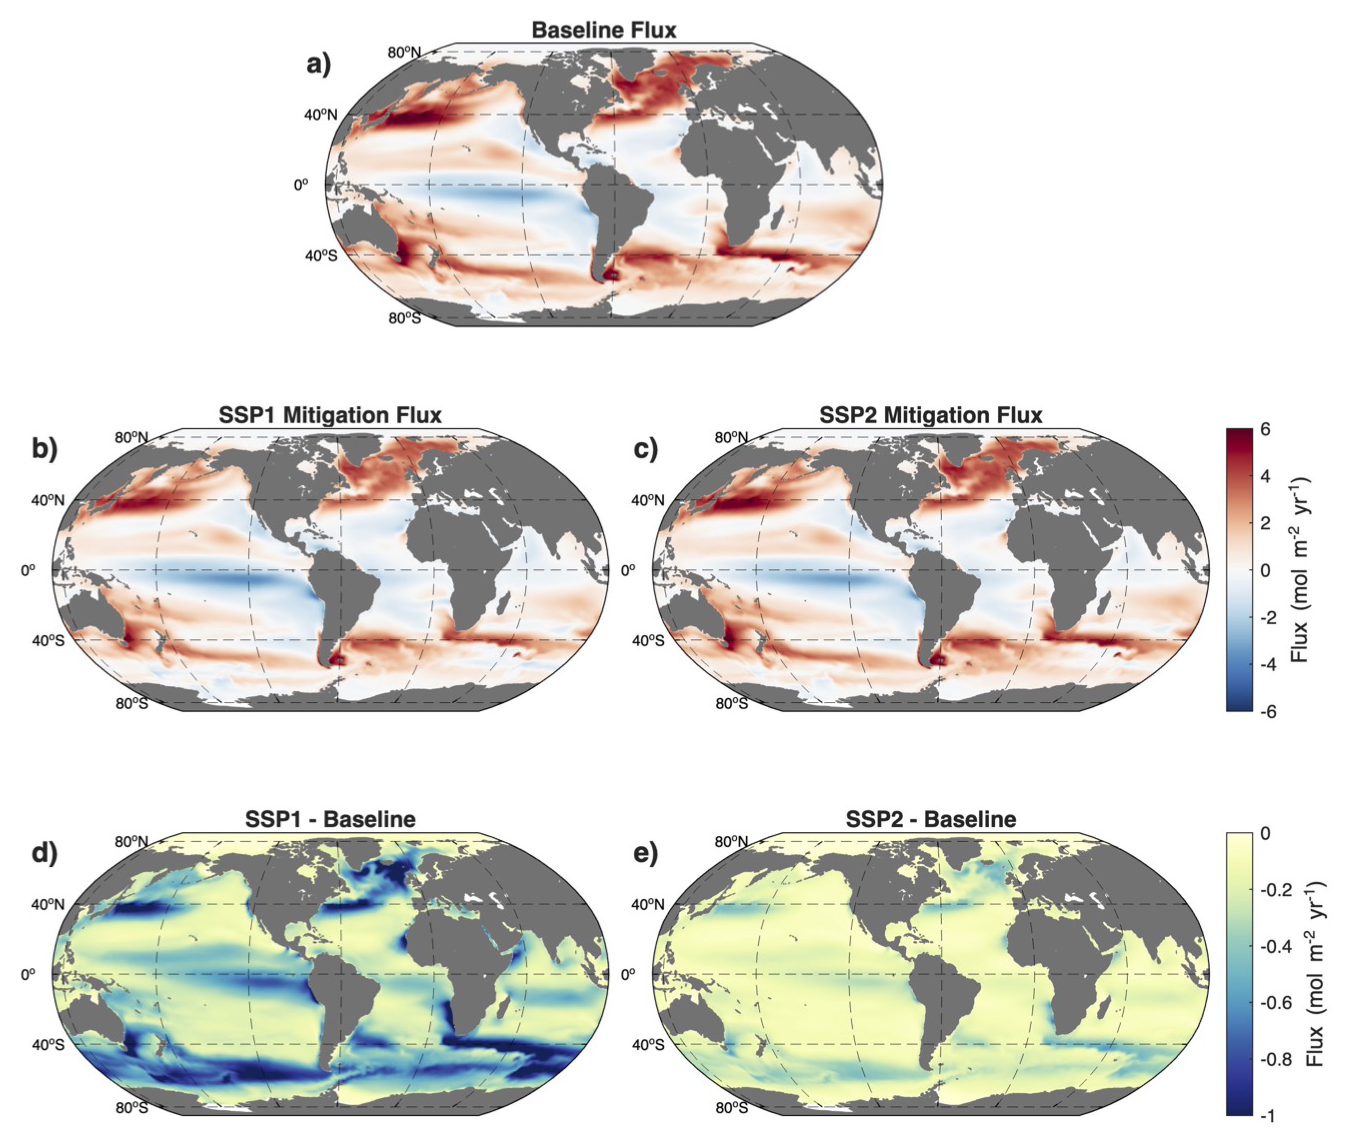
Figure 3Mean air–sea CO2 flux (mol m−2 yr−1) over 2016–2021, for (a) Baseline, (b) SSP1 Mitigation and (c) SSP2 Mitigation, with differences from Baseline shown in (d) SSP1 Mitigation minus Baseline and (e) SSP2 Mitigation minus Baseline. In panels (a)–(c), red colors represent ocean uptake and blue colors indicate regions of outgassing. In difference maps (d, e) blue areas indicate regions where there is less uptake (more outgassing) in the Mitigation experiments compared to the Baseline scenario. Neither mitigation scenario results in ocean areas with increased uptake as compared to the Baseline run.
The largest reductions in cumulative CO2 uptake occur in the Southern and North Atlantic and Pacific Oceans, identifying these regions as primary hotspots of mitigation sensitivity. In the ECCO-Darwin experimental runs, the North Pacific Kuroshio region (NP STSS biome, Fay and McKinley, 2014) exhibits a 17 % decrease in flux between the Baseline and SSP1 Mitigation experiment by the final year of the simulation. A smaller reduction (8 %) is produced by the SSP2 Mitigation experiment in 2021. For the North Atlantic boundary current region (NA STSS biome, Fay and McKinley, 2014), the reduction in carbon uptake by the end of the simulation is even more pronounced: 24.5 % for SSP1 Mitigation and 11 % for SSP2 Mitigation. The pronounced reductions in air–sea CO2 flux observed in these regions under both SSP1 and SSP2 Mitigation scenario forcings reflect their efficiency as conduits for anthropogenic carbon, as well as their sensitivity to changes in atmospheric CO2 concentrations.
Another dynamic area which exhibits a strong response to mitigation is the Southern Ocean. Located within the core flow of the Antarctic Circumpolar Current (ACC), the Southern Ocean subpolar region (SO SPSS biome, Fay and McKinley, 2014) reduction in carbon uptake by the end of the simulation is even more pronounced: 56 % for SSP1 Mitigation and 24 % for SSP2 Mitigation (Fig. 3d, e). In contrast, large portions of the northern and southern subtropical gyres exhibit weaker deltas and thus slower adjustment to changes in atmospheric CO2 over the mitigation experiment.
3.4 Zonal and Basin-Scale Carbon Distribution
Zonally-averaged ΔDIC concentrations (Mitigation minus Baseline) reveal clear differences in the timing, depth penetration, and basin dependence of the mitigation signal (Fig. 4).
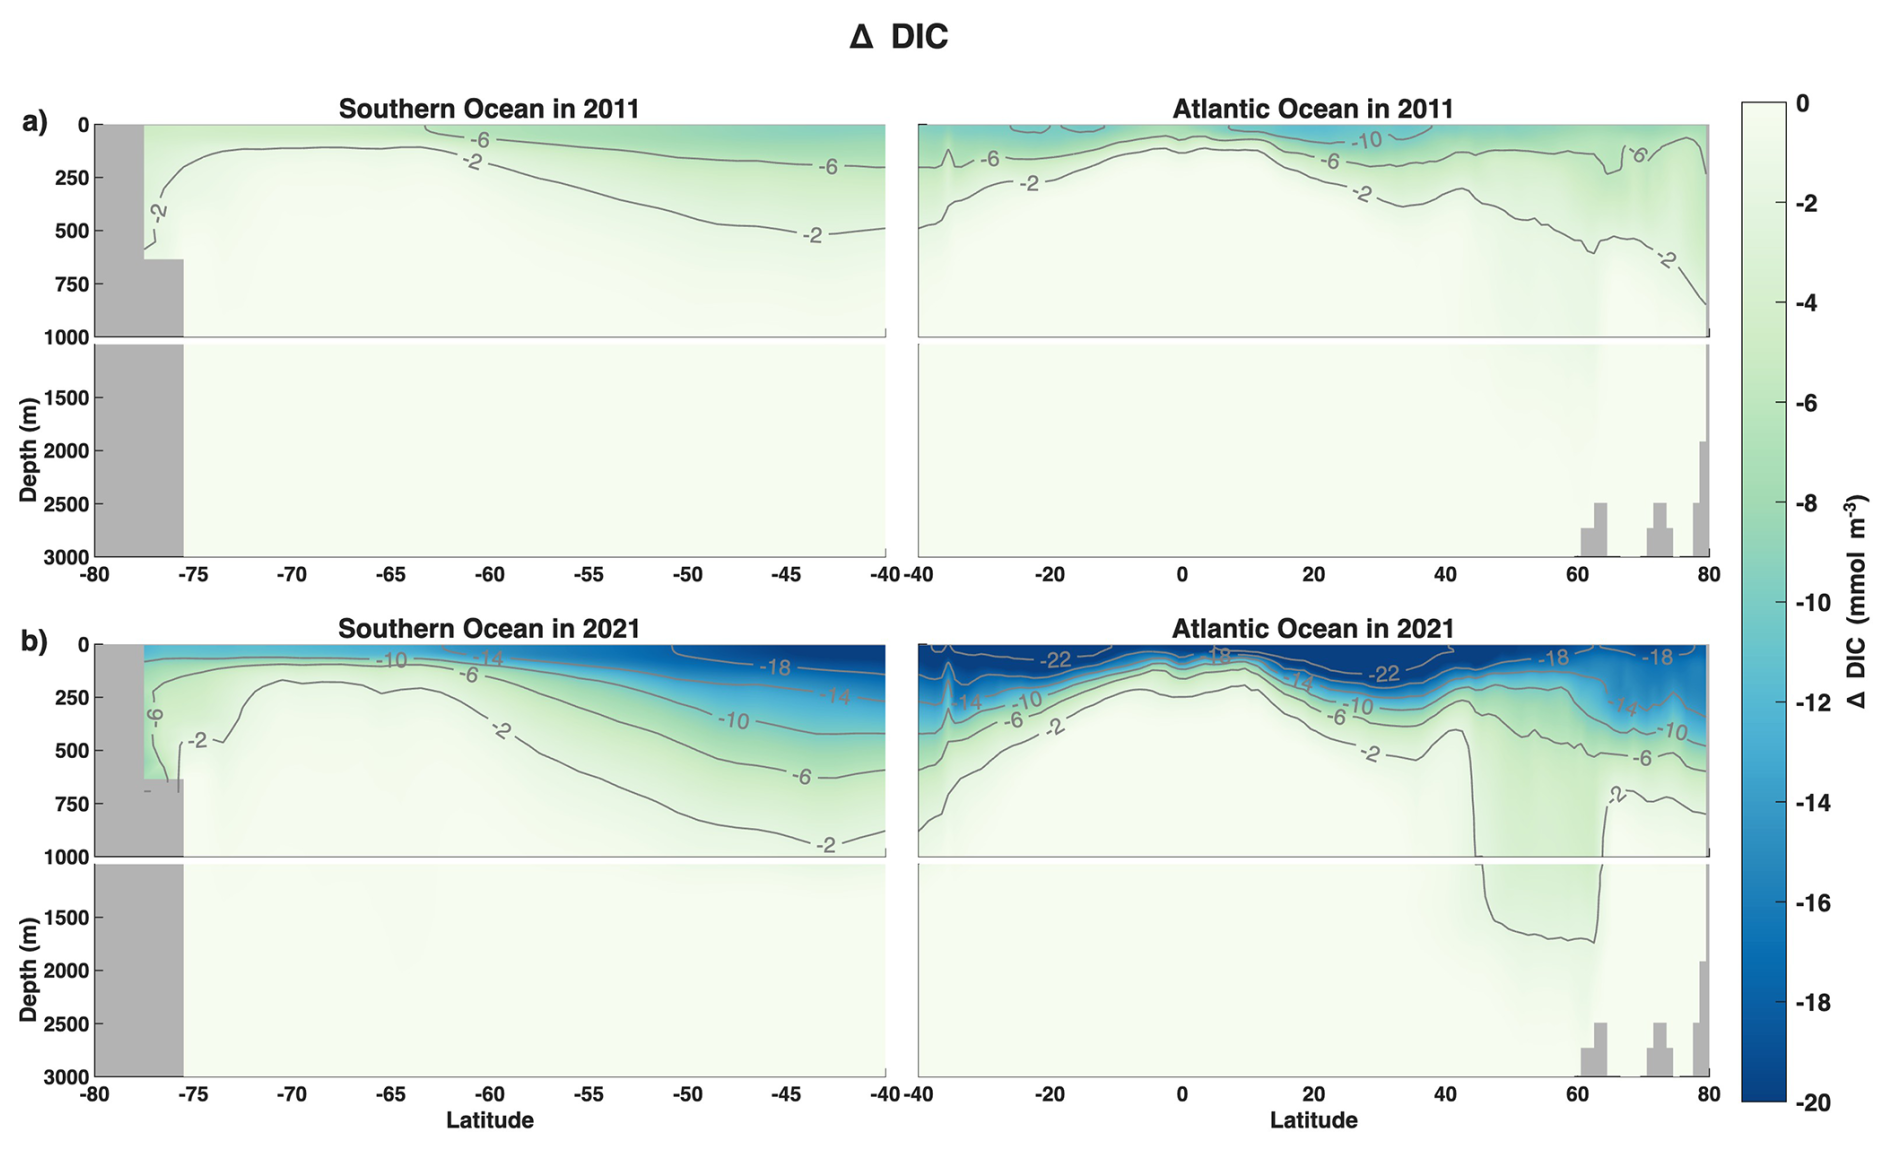
Figure 4Southern Ocean and Atlantic basin-averaged zonal mean ΔDIC concentration (mmol m−3) for SSP1 Mitigation minus Baseline. (a) Top panel shows changes in 2011 (11 years post mitigation), (b) bottom panel shows 2021 (the last year of the simulation). Negative values (cooler colors) indicate more carbon accumulation in Baseline as compared to mitigation scenarios. Similar figure for results from SSP2 shown in Fig. S3.
In the Southern Ocean (latitudes < 40° S in Fig. 4a, b), zonal-mean ΔDIC values (SSP1 minus Baseline) exhibit a distinct structure; DIC differences appear quickly at depth and span a broad vertical range. By 2011, DIC differences extended below 100 m depth across much of the basin. By 2021, mitigation-driven differences are distributed throughout the upper and mid-depth Southern Ocean, however, they remain constrained to the top 1000 m. This pattern suggests rapid vertical communication of changes in surface forcing, consistent with the Southern Ocean's vigorous mixing and overturning. The largest differences are observed along the equatorial edge of the Southern Ocean, with differences in DIC of 10 mmol m−3 reaching down to nearly 500 m. Figure 3d shows that the largest changes in surface air–sea flux are evident in the Southern Ocean, while Fig. 4 demonstrates that the excess carbon absorbed in the Baseline simulation is quickly transported and mixed into the deeper ocean.
In the Atlantic Ocean (Fig. 4, righthand side), DIC differences between SSP1 Mitigation and Baseline emerge rapidly following the onset of mitigation; negative values indicate greater DIC accumulation in the Baseline relative to SSP1 Mitigation. Minimal differences are evident in the first year post-mitigation, and are confined to the surface and upper thermocline (Fig. S3). By 2011, ΔDIC values intensify and extend downward to depths of ∼ 500–700 m, particularly in the mid latitudes of the Northern Hemisphere (Fig. 4a). By the end of the simulation (2021, Fig. 4b), the largest DIC differences span much of the upper 500 m, with pronounced signals along known ventilation pathways that connect surface waters to the ocean interior including the subpolar gyre and Labrador Sea in North Atlantic and along the ACC in the Southern Hemisphere. In the latitudes of the subpolar North Atlantic, differences due to mitigation reach deeper into the ocean column and are evident at 1500 m. In the surface layers, the largest mitigation differences occur in 2021 in the subtropical latitudes (20–40° N). This indicates that the Baseline run contains much more DIC, yielding negative ΔDIC values (SSP Mitigation minus Baseline). Carbon absorbed in these subtropical areas is not transported to depth because the ocean is highly stratified, creating a physical barrier that limits mixing with deeper waters.
The temporal evolution of zonal ΔDIC highlights a progressive deepening of the mitigation signal. In the Atlantic, the downward propagation of DIC mitigation differences under SSP1 is most evident between approximately 40 and 60° N, consistent with regions of active mode and intermediate water formation. ΔDIC values in the Southern Hemisphere are weaker in magnitude at the surface in 2021 (Fig. 4b) but extend deeper as the simulation progresses, indicating efficient vertical redistribution. The contrasting vertical structures between basins indicate that the response of interior carbon storage to mitigation is strongly modulated by distinct, regional circulation and ventilation regimes. Across all time periods, differences between SSP1 and SSP2 Mitigation follow a similar spatial structure, with larger ΔDIC magnitudes under SSP1 Mitigation reflecting the stronger reduction in atmospheric growth rate (Figs. 4, S3).
3.5 DIC Budget
In this section, we consider the three-dimensional tendency terms of DIC to better understand the ocean carbon cycle response to mitigation. We first present the Baseline and SSP1 total tendencies and then the SSP1-Baseline differences for the tendency and the advection and diffusion terms contributing to it (Fig. 5).
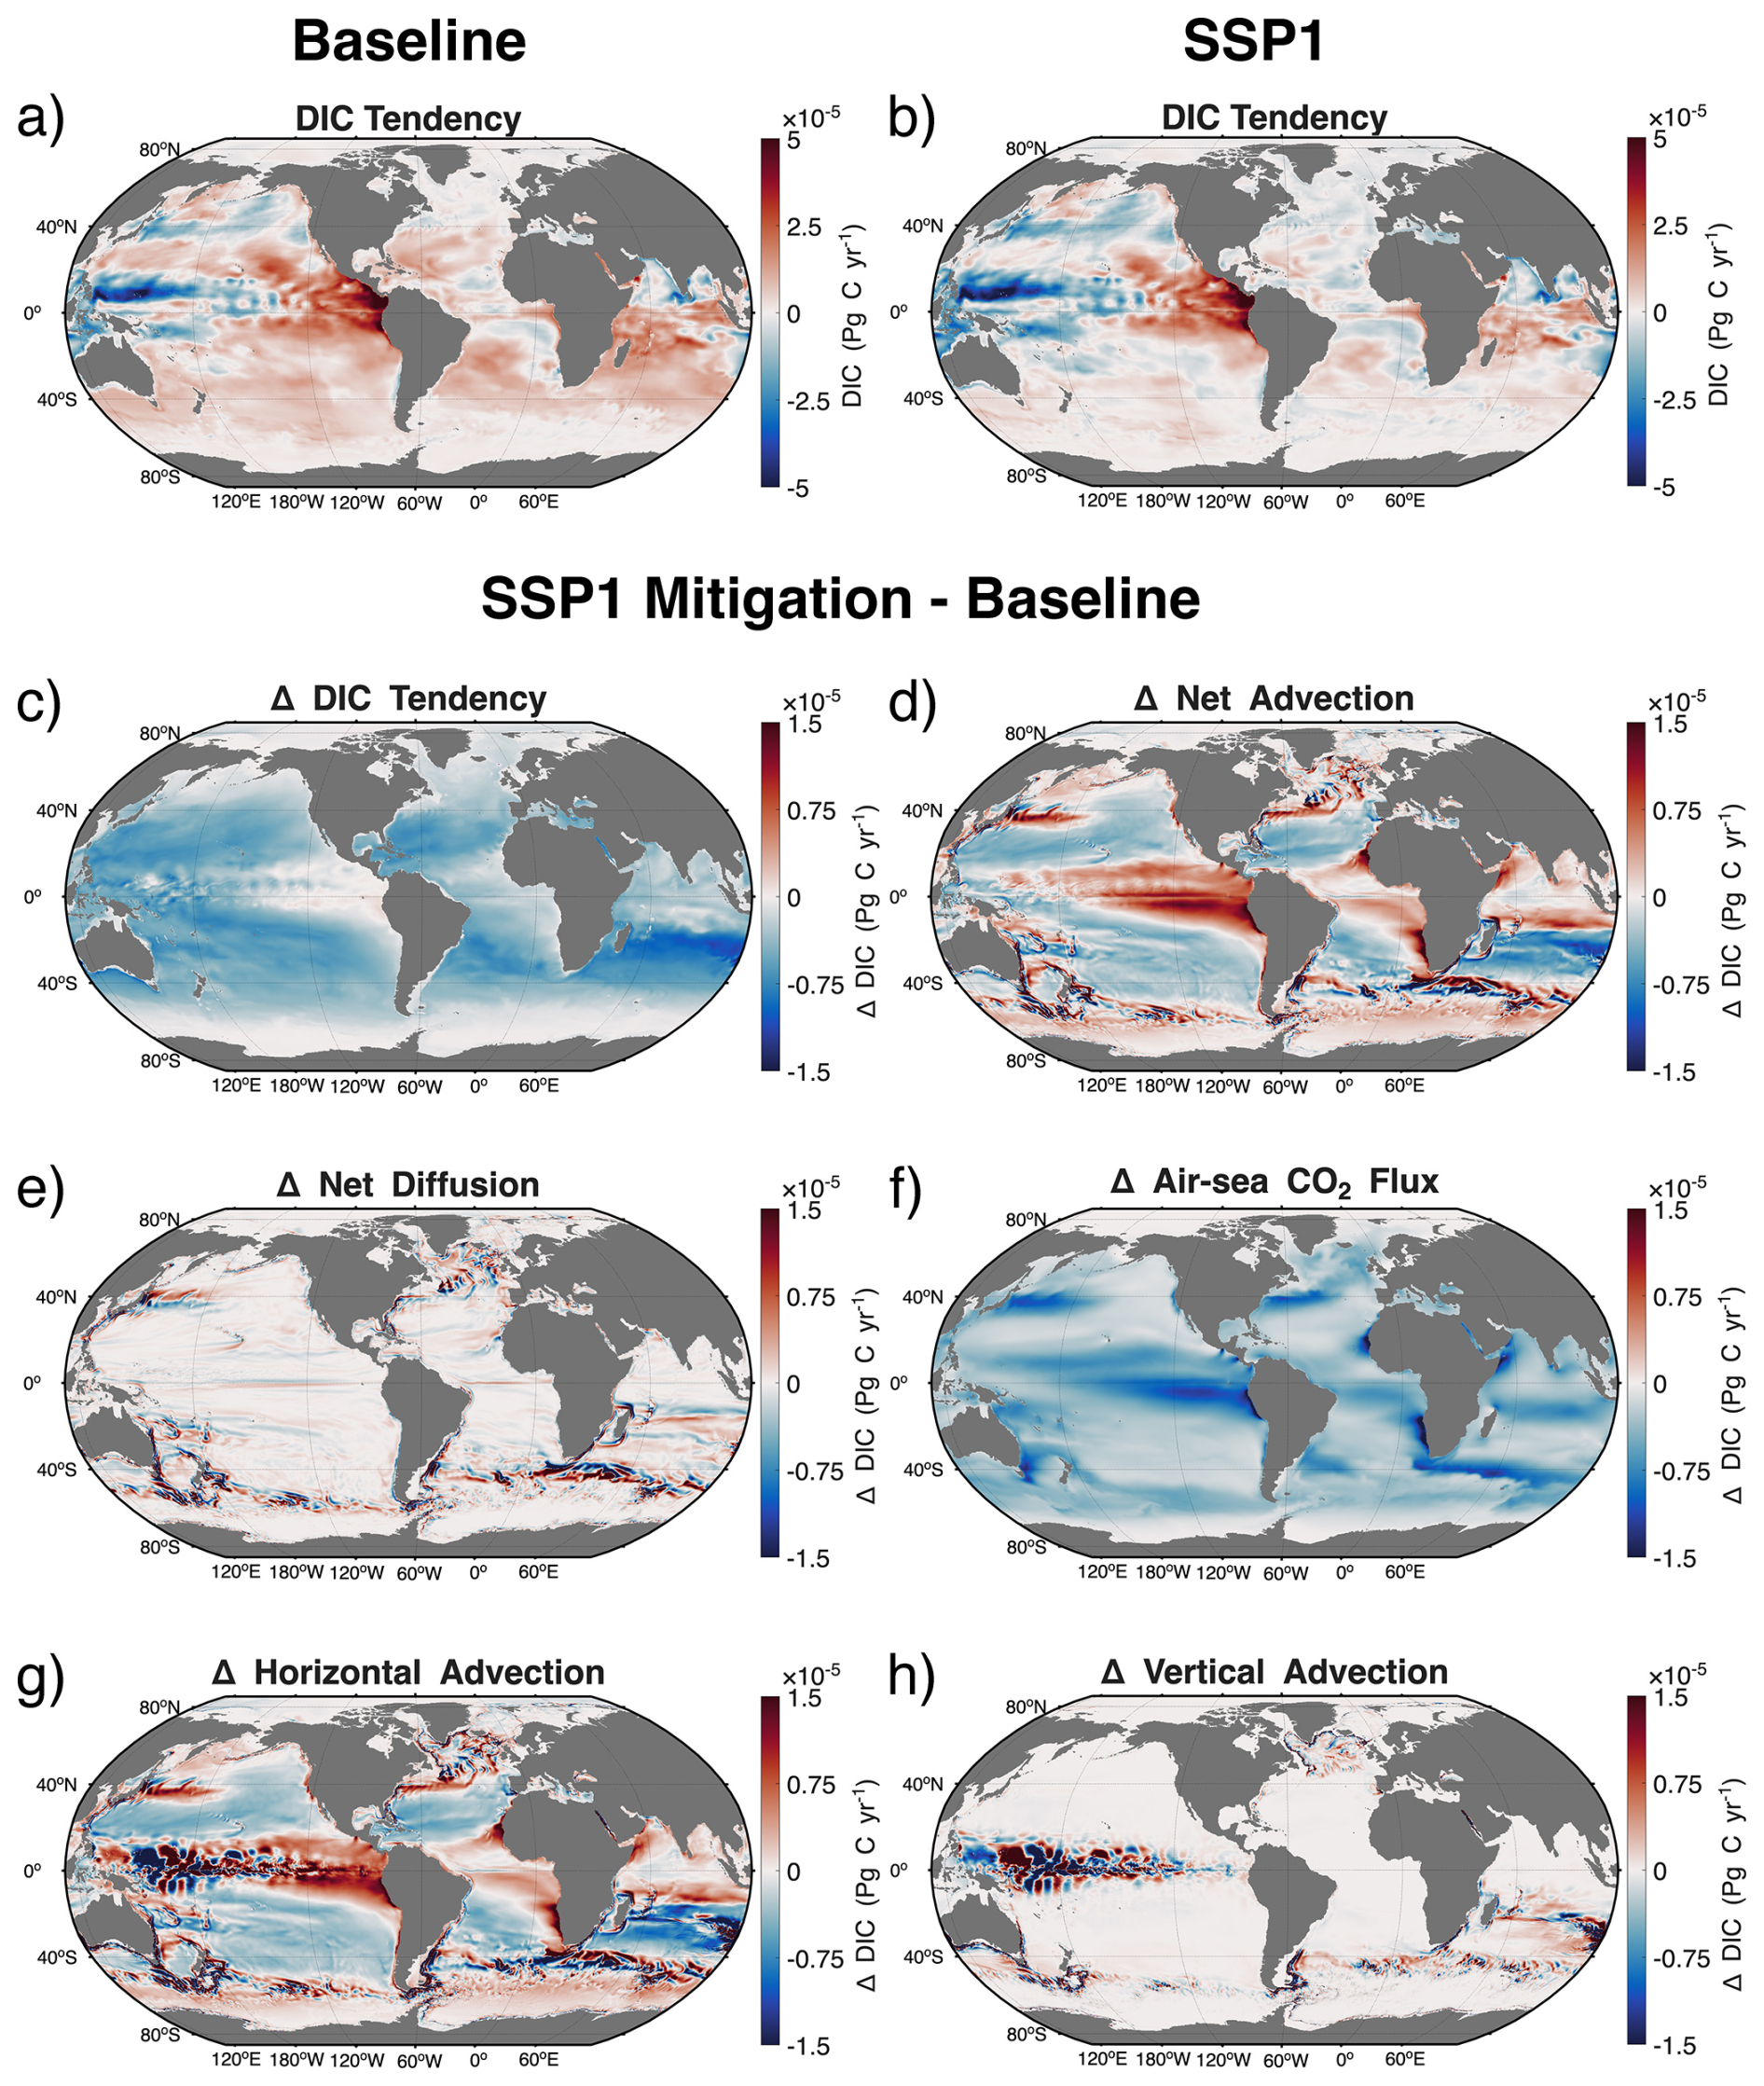
Figure 5DIC budget. Time-mean (2016–2021) vertically integrated DIC tendency for (a) Baseline and (b) SSP1 Mitigation. Differences in ECCO-Darwin DIC budget terms (SSP1 Mitigation − Baseline) for surface-to-500 m vertically integrated 2016–2021 mean DIC tendency: (c) tendency, (d) net advection, (e) net diffusion, and (f) air–sea CO2 flux. Net advection is further decomposed into (g) horizontal and (h) vertical components. A similar figure for SSP2 Mitigation is available in Fig. S4.
The Baseline simulation shows a global upper-ocean DIC inventory that is generally increasing across most of the global oceans, reflecting the ongoing sequestration of anthropogenic carbon and its movement throughout the upper ocean (Fig. 5a). Positive DIC tendencies (DIC gain) are prominent across the Southern Ocean and the Eastern Equatorial Pacific, driven by the vigorous upwelling of deep, DIC-rich waters and subsequent air–sea uptake in these regions. In contrast, the Western Equatorial Pacific exhibits a negative tendency (DIC loss), primarily due to the strong eastward transport of carbon via the Equatorial Undercurrent and horizontal advection away from the pool of accumulating surface carbon. In the Subpolar North Atlantic, the tendency is near zero; while this is a region of intense uptake, the “missing” carbon is rapidly exported to the deep ocean through deep convection, preventing a large accumulation in the top 500 m.
The SSP1 scenario exhibits a similar spatial pattern to the Baseline, but with a significant reduction in the magnitude of carbon gain (Fig. 5b).
As shown in the ΔDIC tendency (SSP1 minus Baseline) map (Fig. 5c), the mitigation pathway results in a global declining signal, indicating that the rate of DIC accumulation is slower in SSP1 Mitigation than in the historical Baseline run. This difference is due solely to the reduced atmospheric concentration, which weakens the air–sea gradient and subsequently alters the internal carbon budget through advection and diffusion. The SSP1 mitigation scenario induces a rapid and widespread reduction in the DIC inventory tendency within the upper 500 m compared to the Baseline run (Fig. 5c). By the end of the simulation (2016–2021 time-mean), the ΔDIC inventory tendency (SSP1 minus Baseline) peaks in the subtropical gyre regions, with regional differences reaching as low as −1.8 × 10⁻⁵ PgC yr−1 in the Southern Hemisphere subtropics (Fig. 5c). This negative tendency represents a significant slowdown in carbon accumulation under the aggressive mitigation pathway represented in SSP1.
The decomposition of the DIC budget into its dominant terms (Fig. 5d–f), illustrates that air–sea flux is the primary driver of the global reduction in ΔDIC (Fig. 5f). The change in the flux component is negative across the entire globe, indicating that the ocean takes up less carbon (or outgasses more) in the SSP1 scenario compared to the Baseline due to the lower atmospheric CO2 concentration (Figs. 1, 5f). While this flux impacts the DIC budget in the same direction across the globe, its magnitude varies spatially, with the strongest negative ΔDIC values (up to −2.6 × 10⁻⁵ PgC yr−1) in high-latitude regions.
While atmospheric mitigation dictates the global carbon inventory, changes in horizontal and vertical circulation determine the internal spatial reorganization of carbon in the upper-500 m. Net advection emerges as the primary redistributive mechanism, characterized by intense dipole patterns of both positive and negative ΔDIC (Fig. 5d). Conversely, net diffusion is a minor contributor to the budget differences, appearing largely neutral (white) across most basins (Fig. 5e). While the air–sea flux moves the DIC into the ocean, horizontal and vertical advection reorganizes where that carbon resides. This advective signal is dominated by horizontal transport across most of the globe (Fig. 5g), particularly at current boundaries and within the Southern Ocean. Vertical advection plays a more localized but critical role, with prominent signals appearing in the Western Equatorial Pacific and at the convergence zones of major currents in the Southern Ocean (Fig. 5h).
Globally integrated over the 2016–2021 period, DIC tendency, circulation (net advection plus net diffusion), and air–sea CO2 flux are −1.43, 0.132, and −1.56 PgC yr−1, demonstrating that (1) DIC gain and loss from circulation largely compensates when integrated globally and (2) the reduction in surface forcing (i.e., air–sea CO2 flux) is the dominant driver of upper-ocean DIC variability when aggressive mitigation is applied.
3.6 Chemical Sensitivity: Revelle Factor and pH
To further understand the spatial heterogeneity of the mitigation-forced DIC differences, we examine the chemical capacity of the surface ocean to absorb carbon, quantified by the Revelle Factor. The Revelle Factor is a dimensionless ratio that describes the ocean's resistance to atmospheric CO2 absorption. It is calculated as the fractional change in the partial pressure of carbon dioxide divided by the fractional change in total DIC. A higher Revelle Factor indicates lower buffering capacity and greater sensitivity to change. In the context of this study, the Revelle Factor is a particularly critical diagnostic because the ECCO-Darwin model does not allow the sea-surface temperature (SST) fields to deviate between the Baseline and Mitigation simulations (Fig. S5). Consequently, any observed differences in carbon uptake and storage between the scenarios are strictly isolated to changes in ocean circulation and the chemical buffering state, rather than thermal solubility effects.
As shown in Fig. 6a, the difference in Revelle Factor (SSP1 minus Baseline) map reveals a global decline in the Revelle Factor, signifying that the ocean surface becomes chemically “younger” and more receptive to carbon under mitigation than it would have been under sustained emissions. These changes are not uniform; while the subtropics remain relatively stable, the high latitudes – and most notably the Southern Ocean – exhibit the most significant reductions. This suggests that in these regions, the reduction in total DIC loading significantly enhances the chemical buffering potential. By isolating these chemical shifts from thermal feedback, something that is unique to the ECCO-Darwin model, a clearer attribution of the resulting DIC inventory changes can be made; attributed to the interplay between this renewed buffering capacity and the redistributive power of ocean circulation.
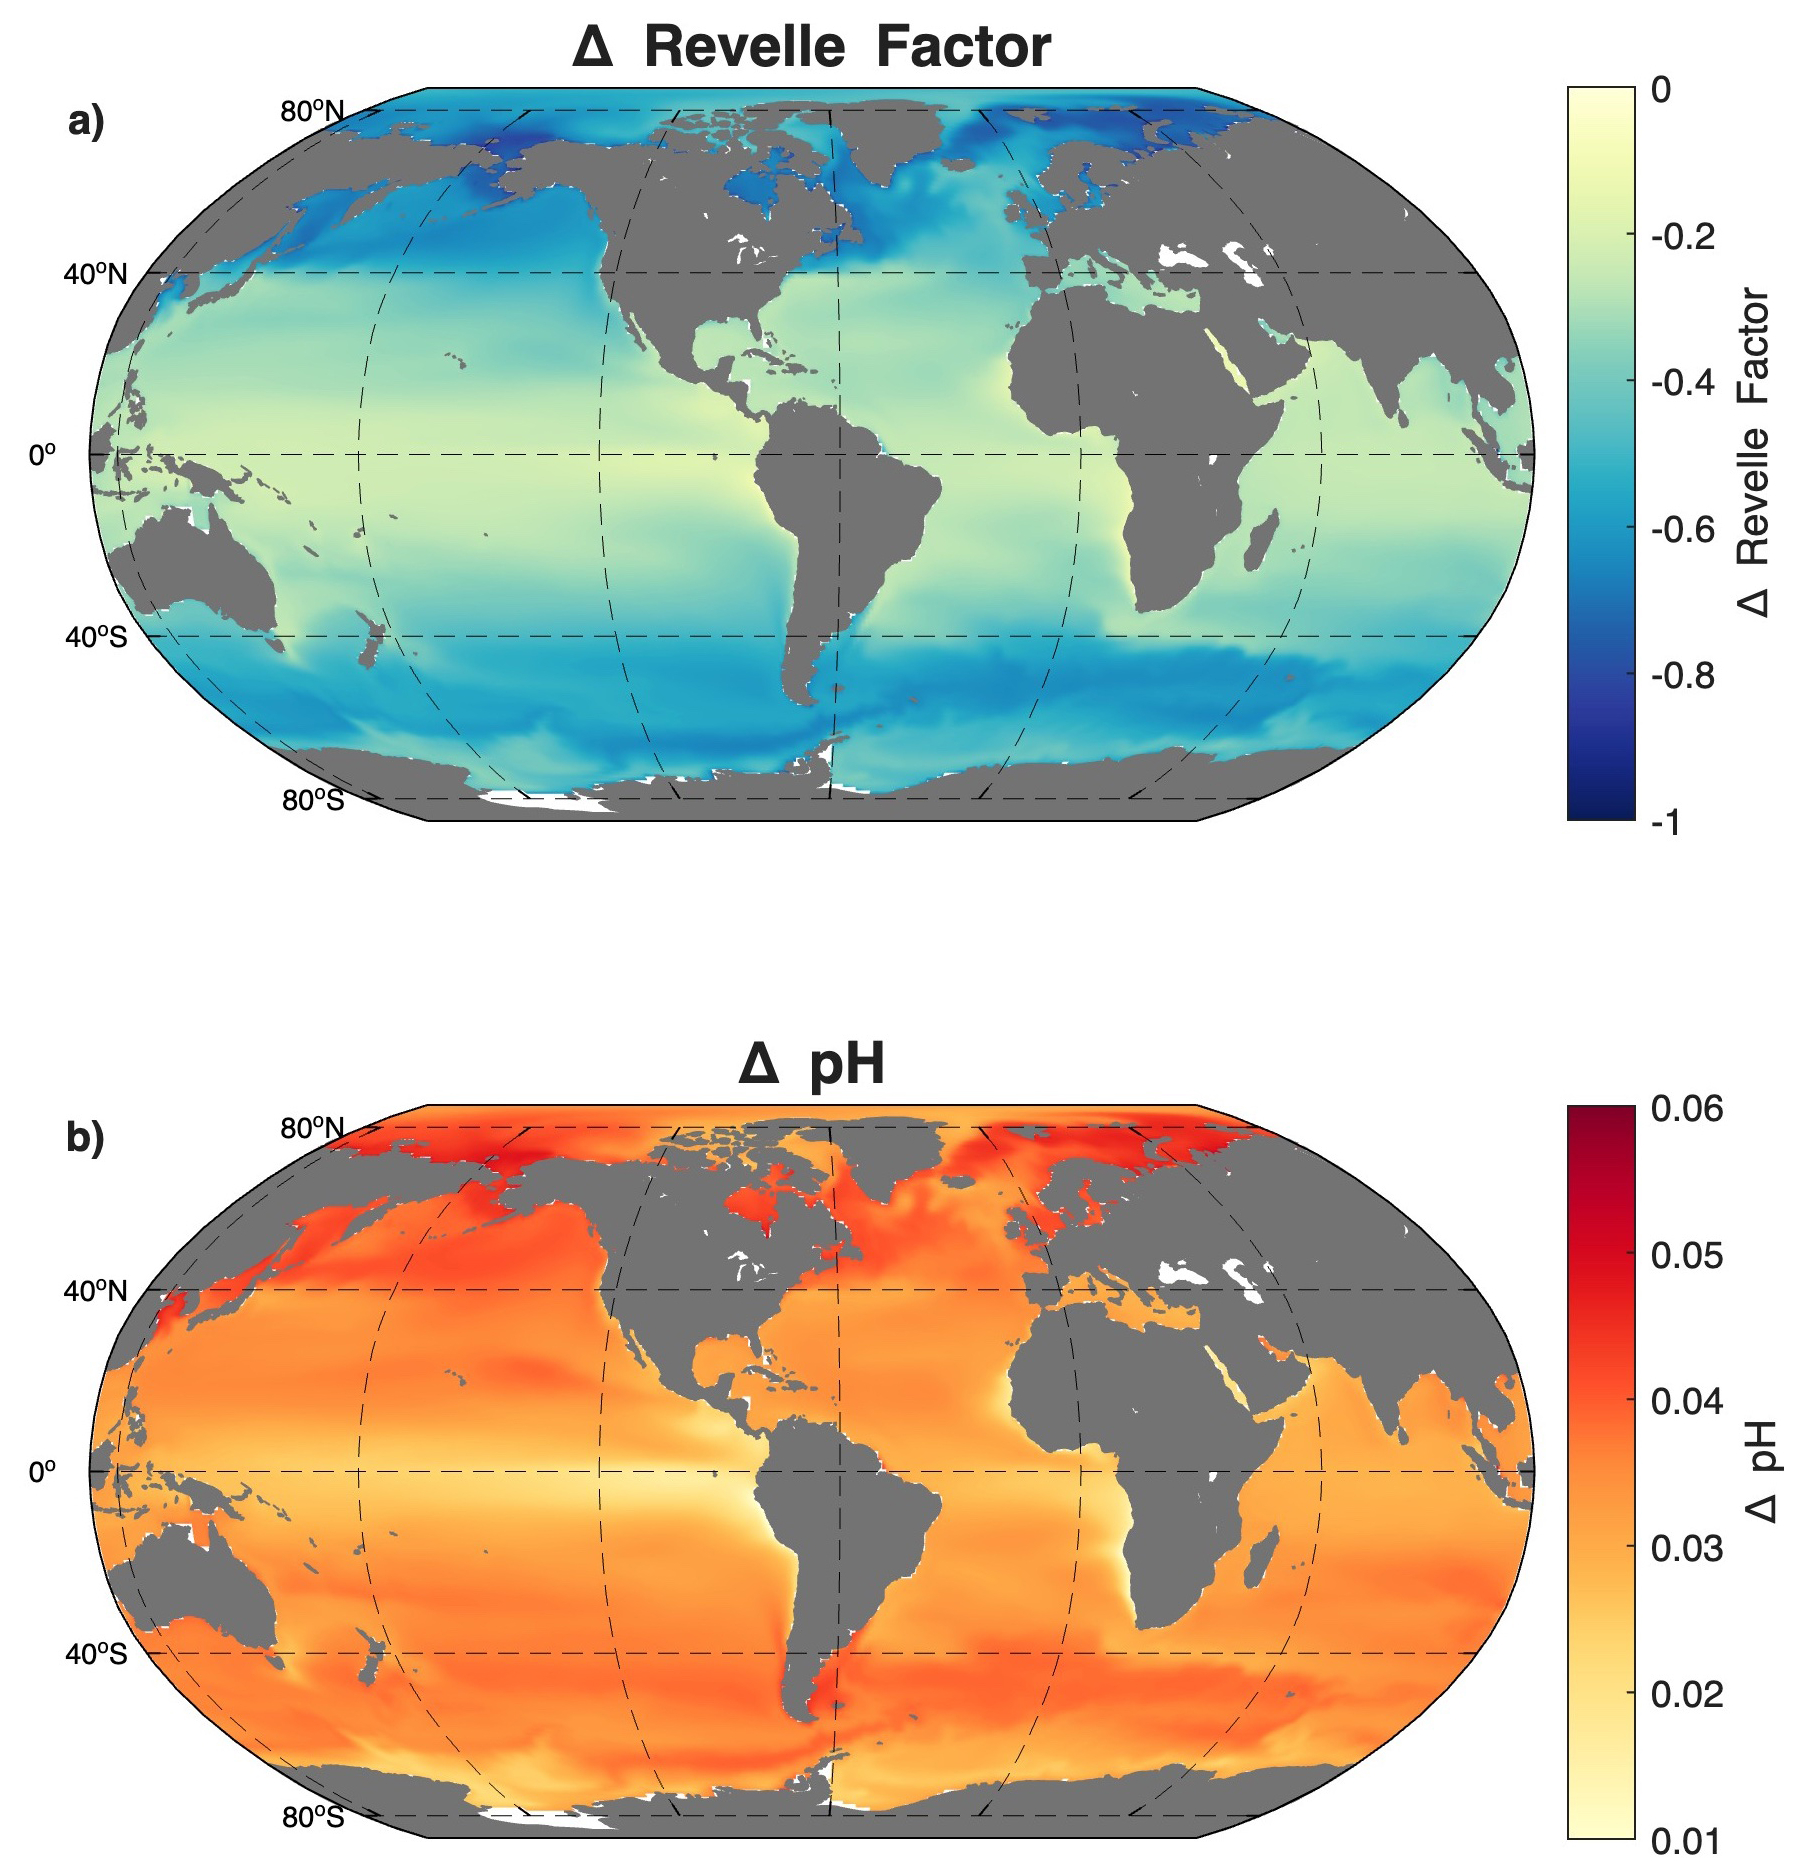
Figure 6Change in (a) Revelle Factor and (b) pH (SSP1 Mitigation minus Baseline). Differences are time-averaged over 2016–2021. In panel (a) negative ΔRevelle Factor values signify that the ocean surface is becoming chemically “younger” and more receptive to carbon under mitigation. In panel (b) positive ΔpH values indicate more acidic waters in the Baseline simulation.
Complementing these buffering shifts, the difference in surface pH (Fig. 6b) shows a global increase under the SSP1 scenario relative to the Baseline. This positive anomaly indicates that the mitigation pathway effectively slows the progression of ocean acidification, with the Baseline ocean remaining significantly more acidic across all basins. Similar to the Revelle Factor, the most pronounced pH recovery occurs in the high latitudes, where differences reach upwards of +0.05 to +0.06 units. These polar regions, particularly the Southern Ocean, are highly sensitive to carbon loading due to their low background temperatures and naturally-higher DIC concentrations; thus, the reduction in DIC under SSP1 yields a disproportionately large mitigation benefit for pH. In contrast, the subtropics and equatorial regions exhibit more muted pH anomalies, reflecting their greater inherent chemical stability.
When viewed alongside the Revelle Factor, the changes we see in pH values with mitigation highlight that the high latitudes are the primary beneficiaries of the chemical relief afforded by reduced atmospheric CO2. The spatial coherence between the Revelle Factor and pH, along with the previously discussed DIC tendency maps, reveals a pronounced high latitude sensitivity. We stress that because these pH gains are achieved without the influence of temperature-driven solubility changes, they represent a pure chemical response to the altered carbon inventory and the resulting shifts in the ocean's internal carbonate equilibrium.
4.1 Global Ocean Carbon Sink Response to Mitigation
The global weakening of the ocean carbon sink under SSP1 and SSP2 Mitigation simulations, (corresponding to SSP1-1.9 and SSP1-2.6 scenarios, respectively) shown here as the rapid onset of divergence beginning in 2000, confirms previous findings that anthropogenic CO2 emission mitigation immediately reduces oceanic uptake on annual to decadal timescales (Lovenduski et al. 2021). The prompt response of the air–sea flux (Fig. 1) reflects the tight coupling between atmospheric pCO2 and surface–ocean carbonate chemistry: reductions in atmospheric CO2 diminish the air–sea gradient, reducing the flux into the ocean (McKinley et al., 2020).
The relationship between mitigation magnitude and sink reduction magnitude is not strictly linear (Fig. 1). This modest non-linearity likely reflects a combination of buffer chemistry, physical circulation, and biogeochemical feedbacks. For example, the interplay between the biological pump, changes in export production, and ecosystem shifts is simultaneously occurring along with the reduction in atmospheric CO2 levels. Similar nonlinearity appears in CMIP6 Earth system models, where studies have documented a breakdown in the proportionality between atmospheric CO2 and the ocean carbon sink under various mitigation scenarios (Terhaar, 2024; Gooya et al., 2023). Our results utilizing the ECCO-Darwin model for this experiment therefore align with the emerging understanding that emission mitigation will reduce the ocean carbon sink in some regions, but that internal climate system dynamics can strongly modulate the degree of change.
4.2 Regional Sensitivity and Mechanisms
The spatial structure of mitigation-driven changes in cumulative air–sea CO2 flux (Fig. 3) highlights the dominant role of ocean circulation and ventilation in shaping the ocean carbon sink's response to reduced atmospheric forcing (Ridge and McKinley, 2021; Iudicone et al., 2016). The concentration of CO2 flux reduction in the Southern and North Atlantic Oceans are consistent with their established role as primary gateways for anthropogenic carbon uptake (Gruber et al., 2019, 2023). In this experiment, the largest reductions in cumulative CO2 uptake occur in the Southern and North Atlantic Oceans, identifying these regions as primary hotspots of mitigation sensitivity (Figs. 3, 4). These regions are well known to dominate global anthropogenic carbon uptake due to strong air–sea CO2 exchange, deep mixed layers, and efficient ventilation and overturning circulation pathways that transport carbon from the surface to the ocean interior (Sabine et al., 2004; Khatiwala et al., 2009; DeVries, 2014; Gruber et al., 2019; Lovenduski et al., 2021; Terhaar et al., 2022; Turner et al., 2023). The strong response in these regions is consistent with previous observational and modeling studies showing that changes in atmospheric CO2 forcing are rapidly transmitted to the ocean interior where ventilation is efficient (Williams et al., 2024).
Western boundary current systems, including the Gulf Stream and Kuroshio Currents and their respective extensions exhibit pronounced reductions in uptake under both mitigation scenarios. These regions are characterized by intense mesoscale activity, strong vertical mixing, and rapid subduction of surface waters along isopycnals, which collectively enhance the communication between surface forcing and the thermocline (Cronin et al., 2010; Li et al., 2025). As a result, changes in atmospheric CO2 forcing are efficiently communicated to the interior ocean in these regions, amplifying the local response of air–sea CO2 flux. As shown by Carroll et al. (2022), in the ECCO-Darwin model, western boundary currents play a central role in regional DIC budgets by linking surface carbon uptake to interior storage pathways. In this sense, mitigation preferentially weakens carbon uptake where the physical system is most effective at exporting surface waters to depth (Williams et al., 2026; Li et al., 2022).
In contrast, much of the subtropical gyre interior exhibits comparatively weaker flux differences (Fig. 3d, e). At the end of the simulation, the North Pacific STSS biome, which encompasses the Kuroshio region (Fay and McKinley, 2014), the average reduction in air–sea CO2 flux from Baseline to SSP1 Mitigation scenarios is 0.61 mol m−2 yr−1, while in the nearby subtropical basin (NP STPS biome) the average reduction in flux is 0.26 mol m−2 yr−1. A similar comparison exists in the North Atlantic regions as well. This suggests a slower or more muted response to mitigation on decadal timescales in the subtropical gyres. These regions are characterized by shallower mixed layers, weaker vertical exchange, and longer ventilation timescales (Talley et al., 2011), which limit the rapid transmission of changes in atmospheric CO2 to the ocean interior. This spatial contrast underscores the importance of ventilation timescales in governing where and when mitigation impacts emerge in the ocean carbon sink.
The spatial patterns identified here are broadly consistent with findings from CMIP5 and CMIP6 ESMs which consider mitigation scenarios. Broadly, previous multi-model analyses indicate that the Southern and North Atlantic Ocean dominate both present-day and future anthropogenic carbon uptake, but also exhibit the largest absolute changes in uptake under mitigation scenarios (McKinley et al., 2023; Katavouta and Williams, 2021; Frölicher et al., 2015). Time-of-emergence studies using ESM output show that signals of changing carbon uptake appear earliest in these regions, while subtropical and tropical regions often exhibit delayed or masked responses due to internal variability and slower ventilation (McKinley et al., 2016, 2017; Schlunegger et al., 2020). These works show signals of changing ocean carbon uptake emerging in subpolar regions earliest, specifically within 10–30 years post mitigation. In contrast, subtropical and tropical regions display masked or delayed signals, often appearing after 50+ years, if at all, driven by higher internal variability and slower ventilation. Nevertheless, CMIP6 models also display substantial inter-model spread in the magnitude and spatial distribution of uptake changes, reflecting uncertainties in Southern Ocean mixing, boundary current and freshwater representation, and carbonate chemistry buffering (McKinley et al., 2023; Gooya et al., 2023; Katavouta and Williams, 2021).
4.3 Ventilation and DIC Penetration
Zonal mean diagnostics provide a mechanistic view of how mitigation alters carbon penetration pathways over time, complementing the surface flux patterns shown earlier. In the North Atlantic Ocean, reductions in DIC accumulation under mitigation mirror regions of active ventilation (20–60° N), whereas in the Pacific and Indian basins (not shown), where thermocline ventilation is slower and deeper, there are weaker and more gradually emerging differences. The confinement of most mitigation DIC anomalies to the upper 500–1000 m is consistent with expected decadal ventilation timescales and indicates that deeper ocean sequestration is not strongly altered by short-term mitigation. Similar latitude-depth analyses have been used to diagnose ventilation and storage mechanisms in longer-term mitigation experiments (e.g., Ridge and McKinley, 2021), though the shorter simulation period considered here emphasizes early-stage adjustments rather than long-term equilibration.
Considering the drivers of ΔDIC (SSP1 Mitigation minus Baseline) at the end of the simulation (2016–2021 mean), we find that net advection (horizontal plus vertical terms) and air–sea CO2 dominate the patterns of DIC gain and loss in the upper-500 m (Fig. 5e, g, h). The DIC tendency term shows a large-scale reduction in DIC across most of the global ocean, with small DIC tendency values in the Arctic, Southern, and west Equatorial Pacific Oceans. This primarily results from DIC loss via a reduction in air–sea CO2 flux that is compensated by a gain of DIC from net advection. Net diffusion (Fig. 5e, horizontal plus vertical terms) exhibits both gains and losses of DIC, which are primarily concentrated in boundary current regions where vertical mixing is substantial. As the ECCO-Darwin ecosystem is not carbon limited, changes in biological uptake between runs are negligible and not shown here.
4.4 Sensitivity to Chemical Changes
The global distributions of the ΔRevelle Factor and ΔpH (SSP1 minus Baseline) illustrate the immediate chemical relief provided by the mitigation pathway. Because the Revelle Factor is a measure of the ocean's resistance to absorbing CO2, the predominantly negative anomalies, peaking at approximately −0.8 to −1.0 in the high latitudes, indicate that the Revelle Factor is significantly higher in the Baseline run. This confirms that under sustained emissions, surface waters exhibit a lower buffering capacity and are chemically resistant to change, whereas the SSP1 scenario allows these waters to remain more receptive to ocean carbon absorption. Similarly, the ΔpH map shows a global positive anomaly, meaning the Baseline ocean is more acidic than the SSP1 ocean. The magnitude of this difference is greatest in the high latitudes (reaching upwards of +0.05 to 0.06 pH units), a pattern that closely mirrors the Revelle Factor anomalies and is consistent with a previous study assessing the pH response to emissions reductions (Lovenduski et al., 2021). The spatial coherence between these two chemical parameters and the previously discussed DIC tendency maps is striking, with significant high latitude sensitivity.
The largest changes in both pH and Revelle Factor occur in the Southern Ocean and North Atlantic. These regions are naturally characterized by low temperatures and high background DIC, making their carbonate chemistry highly sensitive to even small changes in total carbon loading. In the SSP1 scenario, the reduction in DIC (Fig. 5c) slows the erosion of the buffering system that occurs in the Baseline, leading to a larger pH margin compared to the tropics. In contrast, the Equatorial Pacific shows a more muted change in pH (∼ 0.02 units). While this region is a major site of CO2 outgassing and DIC transport, its naturally lower Revelle Factor (increased buffering) means that the difference in atmospheric CO2 between the two scenarios does not shift the chemical equilibrium as drastically as it does in the cold, carbon-rich polar waters. The regions where pH remains the most unchanged under mitigation are the same regions where the air–sea CO2 flux was the dominant driver of the DIC budget. This confirms that the atmospheric signal is being translated into a chemical signal most efficiently in the high latitudes, where the Revelle Factor is most dynamic. This agrees with previous work that finds that cold waters have a lower ratio of Alkalinity to DIC, making them the “canaries in the coal mine” for mitigation impacts (Orr et al., 2005; Jiang et al., 2019).
Under the SSP1 mitigation pathway, the reduction in total DIC (Fig. 5c) loading prevents this chemical saturation. The resulting lower Revelle Factor (Fig. 6a) indicates that for any given unit of atmospheric CO2, the Southern Ocean surface waters are more chemically receptive to carbon absorption. This means that, while the total magnitude of carbon uptake might be lower due to the reduced atmospheric gradient, the efficiency per unit of pCO2 is significantly higher (Hauck et al., 2020). This chemical relationship is a critical feedback mechanism: by slowing the rise of the Revelle Factor through mitigation, the ocean protects the solubility pump, which is essential to regulate the global carbon cycle in a lower-carbon future (Fassbender et al., 2017).
4.5 Limitations
ECCO-Darwin's physical circulation fields are constrained to observations and reanalysis products and do not evolve dynamically under different climate states. Thus, our mitigation experiments do not capture feedbacks associated with warming-induced changes in stratification or wind stress that would occur in coupled climate models. Additionally, uncertainties in biological export and alkalinity cycling could influence the magnitude of DIC responses, though these are not considered in our analysis. Such changes would likely occur on the scale of 100 years. Additionally, while we anticipate that globally, the increase in CO2 uptake due to increased primary production may be small, locally, particularly in low-productivity areas, the impact could be significant. Despite these limitations, the ECCO-Darwin framework offers a unique strength: its physically-constrained circulation enables robust diagnosis of mechanistic responses, including ventilation pathways, regional recirculation, and upper-ocean storage of carbon.
The ECCO-based results presented here benefit from a physically-constrained circulation model that reproduces observed large-scale transport and ventilation pathways (Forget et al., 2015; Zhang et al., 2018; Carroll et al., 2020, 2022). This allows clear attribution of spatial patterns to specific mechanisms, such as boundary current subduction and high-latitude overturning. Our results isolate the direct response of the ocean carbon sink to atmospheric CO2 mitigation without the confounding influence of climate-driven circulation and sea-ice changes that are present in CMIP6 projections.
Our ECCO-Darwin-based mitigation simulations show an immediate, but spatially heterogeneous weakening of the ocean carbon sink for anthropogenic carbon under reduced atmospheric CO2 forcing. Global air–sea carbon uptake decreases substantially over the first several years of mitigation, with the magnitude scaling roughly with scenario strength. The bulk of the mitigation signal is confined to the upper 500 m, reflecting dominant decadal-scale ventilation pathways. The strongest reductions occur in subtropical thermocline regions, western boundary currents, and the subpolar North Atlantic Ocean. This is consistent with regions of intense ventilation and rapid air–sea equilibration. Mitigation-induced changes in ocean CO2 uptake and storage are concentrated in regions that currently dominate anthropogenic carbon uptake and export to the interior (Sabine et al., 2004; Müller et al., 2023; Davila et al., 2022). This has important implications for both detection and projection of mitigation impacts. Observational efforts aimed at tracking changes in the ocean carbon sink are likely to be most effective in high-latitude ventilation regions and western boundary current systems, where signals are strongest and emerge earliest. Moreover, the strong sensitivity of these regions highlights their importance in determining how rapidly the ocean carbon sink adjusts to changes in anthropogenic forcing under future mitigation pathways.
In the context of a near-term and realistic physical ocean as portrayed by the ECCO-Darwin model, impacts of mitigation scenarios are as expected. Results align with complementary studies using CMIP models focused on longer-term responses (Ridge and McKinley, 2021; Williams et al., 2023) to mitigation, short-term responses to COVID-like perturbations (Lovenduski et al., 2021), and ocean inversion estimates (Gruber et al., 2019; Khatiwala et al., 2009). The extent to which these projected changes would shape the observing system required to detect future change in the ocean carbon sink is a topic worthy of future study.
Overall, these results suggest that near-term mitigation produces an immediate and discernible weakening of ocean CO2 uptake, particularly in regions of vigorous ventilation. This response has implications for carbon budget accounting and underscores the importance of sustained observations in tropical, subtropical, and high-latitude ventilation pathways to detect and attribute changes in air–sea CO2 exchange under future climate mitigation strategies.
All ECCO-Darwin model output is available at the ECCO Data Portal: https://data.nas.nasa.gov/ecco/ (last access: 19 October 2024). Model code and platform-independent instructions for running the ECCO-Darwin simulations described in this study are available at https://doi.org/10.5281/zenodo.10627664 (Carroll et al., 2024a) and https://doi.org/10.5281/zenodo.13259496 (Carroll et al., 2024b).
The supplement related to this article is available online at https://doi.org/10.5194/bg-23-8063-2026-supplement.
ARF, DC, GAM, and DM obtained funding and designed experiments. DC and HZ collaborated to develop the model code and perform the simulations. ARF and DC carried out analysis on model run results. ARF and DC prepared the manuscript with contributions from all co-authors.
The contact author has declared that none of the authors has any competing interests.
Publisher's note: Copernicus Publications remains neutral with regard to jurisdictional claims made in the text, published maps, institutional affiliations, or any other geographical representation in this paper. The authors bear the ultimate responsibility for providing appropriate place names. Views expressed in the text are those of the authors and do not necessarily reflect the views of the publisher.
DC, HZ, and DM acknowledge support from the NASA Carbon Monitoring System and Carbon Cycle Science program.
This research has been supported by the National Aeronautics and Space Administration (grant nos. 80NSSC22K0150 and 80NM0018D0004) and the National Science Foundation (grant no. OCE-1752724).
This paper was edited by Estefanía Muñoz and reviewed by two anonymous referees.
Carroll, D., Menemenlis, D., Adkins, J. F., Bowman, K. W., Brix, H., Dutkiewicz, S., Fenty, I., Gierach, M. M., Hill, C., Jahn, O., Landschützer, P., Lauderdale, J. M., Liu, J., Manizza, M., Naviaux, J. D., Rödenbeck, C., Schimel, D. S., Van der Stocken, T., and Zhang, H.: The ECCO-Darwin data-assimilative global ocean biogeochemistry model: Estimates of seasonal to multidecadal surface ocean pCO2 and air–sea CO2 flux, J. Adv. Model. Earth Sy., 12, e2019MS001888, https://doi.org/10.1029/2019ms001888, 2020.
Carroll, D., Menemenlis, D., Dutkiewicz, S., Lauderdale, J. M., Adkins, J. F., Bowman, K. W., Brix, H., Fenty, I., Gierach, M. M., Hill, C., Jahn, O., Landschützer, P., Manizza, M., Mazloff, M. R., Miller, C. E., Schimel, D. S., Verdy, A., Whitt, D. B., and Zhang, H.: Attribution of space-time variability in global-ocean dissolved inorganic carbon, Global Biogeochem. Cy., 36, e2021GB007162, https://doi.org/10.1029/2021GB007162, 2022.
Carroll, D., Menemenlis, D., Zhang, H., Mazloff, M., McKinley, G., Fay, A., Dutkiewicz, S., Lauderdale, J. M., and Fenty, I.: Evaluation of the ECCO-Darwin ocean biogeochemistry state estimate vs. in-situ observations, Version ver 1.0, Zenodo [data set], https://doi.org/10.5281/zenodo.10627664, 2024a.
Carroll, D., Zhang, H., Menemenlis, D., Bertin, C., Savelli, R., Manizza, M., Suselj, K., van der Zant, H., Jahn, O., Le Fouest, V., Lauderdale, J. M.: dustincarrollocean/ecco_Darwin: v05 1985 back-extension (1985_back_extension), Zenodo [code], https://doi.org/10.5281/zenodo.13259496, 2024b.
Carroll, D., Parazoo, N. C., Lovenduski, N. S., Keller, M., Schimel, D. S., and Bloom, A. A.: Observing system needs for understanding carbon–climate feedbacks, Environ. Res. Lett., 20, 111002, https://doi.org/10.1088/1748-9326/ae0ae8, 2025.
Cronin, M. F., Bond, N., Booth, J., Ichikawa, H., Joyce, T. M., Kelly, K., Kubota, M., Qiu, B., Reason, C., Rouault, M., and Sabine, C.: Monitoring ocean-atmosphere interactions in western boundary current extensions, Proceedings of OceanObs'09, https://doi.org/10.5270/OceanObs09.cwp.20, 2010.
Davila, X., Gebbie, G., Brakstad, A., Lauvset, S. K., McDonagh, E. L., Schwinger, J., and Olsen, A.: How is the ocean anthropogenic carbon reservoir filled?, Global Biogeochem. Cy., 36, e2021GB007055, https://doi.org/10.1029/2021GB007055, 2022.
DeVries, T.: The oceanic anthropogenic CO2 sink: Storage, air–sea fluxes, and transports over the industrial era, Global Biogeochem. Cy., 28, 631–647, https://doi.org/10.1002/2013GB004739, 2014.
Fassbender, A. J., Sabine, C. L., and Palevsky, H. I.: Nonuniform ocean acidification and attenuation of the ocean carbon sink, Geophys. Res. Lett., 44, 8404–8413, https://doi.org/10.1002/2017GL074389, 2017.
Fay, A. R. and McKinley, G. A.: Global open-ocean biomes: mean and temporal variability, Earth Syst. Sci. Data, 6, 273–284, https://doi.org/10.5194/essd-6-273-2014, 2014.
Fay, A. R., Carroll, D., McKinley, G. A., Menemenlis, D., and Zhang, H.: Scale-dependent drivers of air–sea CO2 flux variability, Geophys. Res. Lett., 51, e2024GL111911, https://doi.org/10.1029/2024GL111911, 2024.
Flato, G., Marotzke, J., Abiodun, B., Braconnot, P., Chou, S. C., Collins, W., Cox, P., Driouech, F., Emori, S., Eyring, V., Forest, C., Gleckler, P., Guilyardi, E., Jakob, C., Kattsov, V., Reason, C., and Rummukainen, M.: Evaluation of climate models, in: Climate change 2013: The physical science basis, Contribution of Working Group I to the Fifth Assessment Report of the Intergovernmental Panel on Climate Change, edited by: Stocker, T. F., Qin, D., Plattner, G.-K., Tignor, M., Allen, S. K., Boschung, J., Nauels, A., Xia, Y., Bex, V., and Midgley, P. M., Cambridge University Press, ISBN 9781107057991, https://doi.org/10.1017/CBO9781107415324.020, 2013.
Forget, G., Campin, J.-M., Heimbach, P., Hill, C. N., Ponte, R. M., and Wunsch, C.: ECCO version 4: an integrated framework for non-linear inverse modeling and global ocean state estimation, Geosci. Model Dev., 8, 3071–3104, https://doi.org/10.5194/gmd-8-3071-2015, 2015.
Friedlingstein, P., O'Sullivan, M., Jones, M. W., Andrew, R. M., Bakker, D. C. E., Hauck, J., Landschützer, P., Le Quéré, C., Li, H., Luijkx, I. T., Peters, G. P., Peters, W., Pongratz, J., Schwingshackl, C., Sitch, S., Canadell, J. G., Ciais, P., Aas, K., Alin, S. R., Anthoni, P., Barbero, L., Bates, N. R., Bellouin, N., Benoit-Cattin, A., Berghoff, C. F., Bernardello, R., Bopp, L., Brasika, I. B. M., Chamberlain, M. A., Chandra, N., Chevallier, F., Chini, L. P., Collier, N. O., Colligan, T. H., Cronin, M., Djeutchouang, L. M., Dou, X., Enright, M. P., Enyo, K., Erb, M., Evans, W., Feely, R. A., Feng, L., Ford, D. J., Foster, A., Fransner, F., Gasser, T., Gehlen, M., Gkritzalis, T., Goncalves De Souza, J., Grassi, G., Gregor, L., Gruber, N., Guenet, B., Gürses, Ö., Harrington, K., Harris, I., Heinke, J., Hurtt, G. C., Iida, Y., Ilyina, T., Ito, A., Jacobson, A. R., Jain, A. K., Jarníková, T., Jersild, A., Jiang, F., Jones, S. D., Kato, E., Keeling, R. F., Klein Goldewijk, K., Knauer, J., Kong, Y., Korsbakken, J. I., Koven, C., Kunimitsu, T., Lan, X., Liu, J., Liu, Z., Liu, Z., Lo Monaco, C., Ma, L., Marland, G., McGuire, P. C., McKinley, G. A., Melton, J. R., Monacci, N., Monier, E., Morgan, E. J., Munro, D. R., Müller, J. D., Nakaoka, S.-I., Nayagam, L. R., Niwa, Y., Nutzel, T., Olsen, A., Omar, A. M., Pan, N., Pandey, S., Pierrot, D., Qin, Z., Regnier, P., Rehder, G., Resplandy, L., Roobaert, A., Rosan, T. M., Rödenbeck, C., Schwinger, J., Skjelvan, I., Smallman, T. L., Spada, V., Sreeush, M. G., Sun, Q., Sutton, A. J., Sweeney, C., Swingedouw, D., Séférian, R., Takao, S., Tatebe, H., Tian, H., Tian, X., Tilbrook, B., Tsujino, H., Tubiello, F., van Ooijen, E., van der Werf, G. R., van de Velde, S. J., Walker, A. P., Wanninkhof, R., Yang, X., Yuan, W., Yue, X., and Zeng, J.: Global Carbon Budget 2025, Earth Syst. Sci. Data, 18, 3211–3288, https://doi.org/10.5194/essd-18-3211-2026, 2026.
Frölicher, T. L., Sarmiento, J. L., Paynter, D. J., Dunne, J. P., Krasting, J. P., and Winton, M.: Dominance of the Southern Ocean in anthropogenic carbon and heat uptake in CMIP5 models, J. Climate, 28, 862–886, https://doi.org/10.1175/JCLI-D-14-00117.1, 2015.
Gooya, P., Swart, N. C., and Hamme, R. C.: Time-varying changes and uncertainties in the CMIP6 ocean carbon sink from global to local scale, Earth Syst. Dynam., 14, 383–398, https://doi.org/10.5194/esd-14-383-2023, 2023.
Gruber, N., Landschützer, P., and Lovenduski, N. S.: The variable Southern Ocean carbon sink, Annu. Rev. Mar. Sci., 11, 159–186, https://doi.org/10.1146/annurev-marine-121916-063407, 2019.
Gruber, N., Bakker, D. C., DeVries, T., Gregor, L., Hauck, J., Landschützer, P., McKinley, G. A., and Müller, J. D.: Trends and variability in the ocean carbon sink, Nature Reviews Earth & Environment, 4, 119–134, https://doi.org/10.1038/s43017-022-00381-x, 2023.
Hauck, J., Zeising, M., Le Quéré, C., Gruber, N., Bakker, D. C., Bopp, L., Chau, T. T. T., Gürses, Ö., Ilyina, T., Landschützer, P., and Lenton, A.: Consistency and challenges in the ocean carbon sink estimate for the global carbon budget, Frontiers in Marine Science, 7, 571720, https://doi.org/10.3389/fmars.2020.571720, 2020.
Iudicone, D., Rodgers, K. B., Plancherel, Y., Aumont, O., Ito, T., Key, R. M., Madec, G., and Ishii, M.: The formation of the ocean's anthropogenic carbon reservoir, Sci. Rep., 6, 35473, https://doi.org/10.1038/srep35473, 2016.
Jiang, L.-Q., Carter, B. R., Feely, R. A., Lauvset, S. K., and Olsen, A.: Surface ocean pH and buffer capacity: Past, present and future, Scientific Reports, 9, 18624, https://doi.org/10.1038/s41598-019-55039-4, 2019.
Katavouta, A. and Williams, R. G.: Ocean carbon cycle feedbacks in CMIP6 models: contributions from different basins, Biogeosciences, 18, 3189–3218, https://doi.org/10.5194/bg-18-3189-2021, 2021.
Khatiwala, S., Primeau, F., and Hall, T.: Reconstruction of the history of anthropogenic CO2 concentrations in the ocean, Nature, 462, 346–349, https://doi.org/10.1038/nature08526, 2009.
Lan, X., Tans, P., Thoning, K., and NOAA Global Monitoring Laboratory: NOAA Greenhouse Gas Marine Boundary Layer Reference – CO2, NOAA GML [data set], https://doi.org/10.15138/DVNP-F961, 2024.
Lee, H., Noh, K. M., Oh, J. H., Park, S. W., Shin, Y., and Kug, J. S.: Emergence of an oceanic CO2 uptake hole under global warming, Nat. Commun., 16, 3199, https://doi.org/10.1038/s41467-025-57724-7, 2025.
Li, C., Zhai, W., and Qi, D.: Unveiling controls of the latitudinal gradient of surface pCO2 in the Kuroshio Extension and its recirculation regions (northwestern North Pacific) in late spring, Acta Oceanol. Sin., 41, 110–123, https://doi.org/10.1007/s13131-021-1949-1, 2022.
Li, X., Gan, B., Zhang, Z., Cao, Z., Qiu, B., Chen, Z., and Wu, L.: Oceanic uptake of CO2 enhanced by mesoscale eddies, Science Advances, 11, eadt4195, https://doi.org/10.1126/sciadv.adt4195, 2025.
Lovenduski, N. S., Swart, N. C., Sutton, A. J., Fyfe, J. C., McKinley, G. A., Sabine, C., and Williams, N. L.: The ocean carbon response to COVID-related emissions reductions, Geophys. Res. Lett., 48, e2020GL092263, https://doi.org/10.1029/2020GL092263, 2021.
McKinley, G. A., Pilcher, D. J., Fay, A. R., Lindsay, K., Long, M. C., and Lovenduski, N. S.: Timescales for detection of trends in the ocean carbon sink, Nature, 530, 469–472, 2016.
McKinley, G. A., Fay, A. R., Lovenduski, N. S., and Pilcher, D. J.: Natural variability and anthropogenic trends in the ocean carbon sink, Annu. Rev. Mar. Sci., 9, 125–150, 2017.
McKinley, G. A., Fay, A. R., Eddebbar, Y. A., Gloege, L., and Lovenduski, N. S.: External forcing explains recent decadal variability of the ocean carbon sink, AGU Advances, 1, e2019AV000149, https://doi.org/10.1029/2019AV000149, 2020.
McKinley, G. A., Bennington, V., Meinshausen, M., and Nicholls, Z.: Modern air-sea flux distributions reduce uncertainty in the future ocean carbon sink, Environ. Res. Lett., 18, 044011, https://doi.org/10.1088/1748-9326/acc195, 2023.
Meinshausen, M., Nicholls, Z. R. J., Lewis, J., Gidden, M. J., Vogel, E., Freund, M., Beyerle, U., Gessner, C., Nauels, A., Bauer, N., Canadell, J. G., Daniel, J. S., John, A., Krummel, P. B., Luderer, G., Meinshausen, N., Montzka, S. A., Rayner, P. J., Reimann, S., Smith, S. J., van den Berg, M., Velders, G. J. M., Vollmer, M. K., and Wang, R. H. J.: The shared socio-economic pathway (SSP) greenhouse gas concentrations and their extensions to 2500, Geosci. Model Dev., 13, 3571–3605, https://doi.org/10.5194/gmd-13-3571-2020, 2020.
Müller, J. D., Gruber, N., Carter, B., Feely, R., Ishii, M., Lange, N., Lauvset, S. K., Murata, A., Olsen, A., Pérez, F. F., Sabine, C., Tanhua, T., Wanninkhof, R., and Zhu, D.: Decadal trends in the oceanic storage of anthropogenic carbon from 1994 to 2014, AGU Advances, 4, e2023AV000875, https://doi.org/10.1029/2023AV000875, 2023.
O'Neill, B. C., Tebaldi, C., van Vuuren, D. P., Eyring, V., Friedlingstein, P., Hurtt, G., Knutti, R., Kriegler, E., Lamarque, J.-F., Lowe, J., Meehl, G. A., Moss, R., Riahi, K., and Sanderson, B. M.: The Scenario Model Intercomparison Project (ScenarioMIP) for CMIP6, Geosci. Model Dev., 9, 3461–3482, https://doi.org/10.5194/gmd-9-3461-2016, 2016.
Orr, J. C., Fabry, V. J., Aumont, O., Bopp, L., Doney, S. C., Feely, R. A., Gnanadesikan, A., Gruber, N., Ishida, A., Joos, F., and Key, R. M.: Anthropogenic ocean acidification over the twenty-first century and its impact on calcifying organisms, Nature, 437, 681–686, https://doi.org/10.1038/nature04095, 2005.
Riahi, K., van Vuuren, D. P., Kriegler, E., Edmonds, J., O'Neill, B. C., Fujimori, S., Bauer, N., Calvin, K., Dellink, R., Fricko, O., Lutz, W., Popp, A., Cuaresma, J. C., Kc, S., Leimbach, M., Jiang, L., Kram, T., Rao, S., Emmerling, J., Ebi, K., Hasegawa, T., Havlik, P., Humpenöder, F., Da Silva, L. A., Smith, S., Stehfest, E., Bosetti, V., Eom, J., Gernaat, D., Masui, T., Rogelj, J., Strefler, J., Drouet, L., Krey, V., Luderer, G., Harmsen, M., Takahashi, K., Baumstark, L., Doelman, J. C., Kainuma, M., Klimont, Z., Marangoni, G., Lotze-Campen, H., Obersteiner, M., Tabeau, A., and Tavoni, M.: The Shared Socioeconomic Pathways and their energy, land use, and greenhouse gas emissions implications: An overview, Global Environ. Chang., 42, 153–168, https://doi.org/10.1016/j.gloenvcha.2016.05.009, 2017.
Ridge, S. M. and McKinley, G. A.: Ocean carbon uptake under aggressive emission mitigation, Biogeosciences, 18, 2711–2725, https://doi.org/10.5194/bg-18-2711-2021, 2021.
Sabine, C. L., Feely, R. A., Gruber, N., Key, R. M., Lee, K., Bullister, J. L., Wanninkhof, R., Wong, C. S. L., Wallace, D. W., Tilbrook, B., and Millero, F. J.: The oceanic sink for anthropogenic CO2, Science, 305, 367–371, https://doi.org/10.1126/science.1097403, 2004.
Schimel, D. S. and Carroll, D.: Carbon cycle–climate feedbacks in the post-Paris world, Annu. Rev. Earth Pl. Sc., 52, 467–493, https://doi.org/10.1146/annurev-earth-031621-081700, 2024.
Schlunegger, S., Rodgers, K. B., Sarmiento, J. L., Ilyina, T., Dunne, J. P., Takano, Y., Christian, J. R., Long, M. C., Frölicher, T. L., Slater, R., and Lehner, F.: Time of emergence and large ensemble intercomparison for ocean biogeochemical trends, Global Biogeochem. Cy., 34, e2019GB006453, https://doi.org/10.1029/2019GB006453, 2020.
Talley, L. D., Pickard, G. L., Emery, W. J., and Swift, J. H.: Descriptive physical oceanography, vol. 29, Academic press, Boston, ISBN 978-0-7506-4552-2, 2011.
Terhaar, J., Frölicher, T. L., and Joos, F.: Southern Ocean anthropogenic carbon sink constrained by sea surface salinity, Science Advances, 7, eabd5964, https://doi.org/10.1126/sciadv.abd5964, 2021.
Terhaar, J., Frölicher, T. L., and Joos, F.: Observation-constrained estimates of the global ocean carbon sink from Earth system models, Biogeosciences, 19, 4431–4457, https://doi.org/10.5194/bg-19-4431-2022, 2022.
Terhaar, J.: Drivers of decadal trends in the ocean carbon sink in the past, present, and future in Earth system models, Biogeosciences, 21, 3903–3926, https://doi.org/10.5194/bg-21-3903-2024, 2024.
Turner, K. E., Smith, D. M., Katavouta, A., and Williams, R. G.: Reconstructing ocean carbon storage with CMIP6 Earth system models and synthetic Argo observations, Biogeosciences, 20, 1671–1690, https://doi.org/10.5194/bg-20-1671-2023, 2023.
Williams, R. G., Ceppi, P., Roussenov, V., Katavouta, A., and Meijers, A. J. S.: The role of the Southern Ocean in the global climate response to carbon emissions, Phil. Trans. R. Soc. A, 381, 20220062, https://doi.org/10.1098/rsta.2022.0062, 2023.
Williams, R. G., Meijers, A. J., Roussenov, V. M., Katavouta, A., Ceppi, P., Rosser, J. P., and Salvi, P.: Asymmetries in the Southern Ocean contribution to global heat and carbon uptake, Nat. Clim. Change, 14, 823–831, https://doi.org/10.1038/s41558-024-02066-3, 2024.
Williams, R. G., Brown, P. J., Takano, Y., Forget, G., Jones, D., Katavouta, A., McDonagh, E., and Roussenov, V. M.: The biogeochemical transport by the Gulf Stream, Communications Earth & Environment, 7, 149, https://doi.org/10.1038/s43247-025-03118-y, 2026.
Zhang, H., Menemenlis, D., and Fenty, I.: ECCO LLC270 ocean-ice state estimate, MIT Dspace, https://dspace.mit.edu/handle/1721.1/119821 (last access: 19 October 2024), 2018.