
the Creative Commons Attribution 4.0 License.
the Creative Commons Attribution 4.0 License.
 | 20 Aug 2026
Distinct phytoplankton responses to dust in the Chinese marginal seas: role of synoptic circulation and air–sea heat exchange
Jiehua Hu
Rong Tian
Jinpei Yan
Xiaoke Zhang
Shanshan Wang
Heng Sun
Hanyue Xu
Shiyu Shen
Qisheng Zeng
East Asian dust outbreaks are accompanied by pronounced synoptic circulation anomalies, yet their influence on phytoplankton variability through atmospheric forcing remains poorly understood. Here we investigate the response of chlorophyll a (Chl a) to spring dust events in the Chinese marginal seas during 2003–2023 using daily anomalies from reanalysis products and a reconstructed Chl a dataset. We find contrasting Chl a responses to dust synoptic events between the Northern and Southern Chinese marginal seas. Under high dust conditions, the Northern Region exhibits an initial Chl a suppression followed by a positive anomaly persisting for about one week, while the south shows an immediate positive response that gradually weakens. These distinct patterns are associated with ocean mixed-layer depth (MLD) adjustments driven by dust-related synoptic circulation. Over the northern seas, Mongolian cyclones produce positive air–sea temperature and humidity gradients through anomalous southerly winds, thus reducing upward latent and sensible heat fluxes and promoting net ocean heat gain and initial mixed-layer shoaling before subsequent deepening. In contrast, southern dust events are associated with migrating anticyclones that drive strong northeasterly winds, generating negative air–sea thermal and moisture gradients and intensified upward latent heat flux, thereby promoting net ocean heat loss and mixed-layer deepening. Net surface heat flux exhibits the strongest negative correlation with MLD at a 1 d lag in both regions, and surface heat loss-driven mixed-layer deepening generally coincides with elevated Chl a anomalies. These results highlight synoptic-scale atmospheric forcing and air–sea heat exchange as important physical pathways linking dust variability to short-term Chl a changes in the Chinese marginal seas.
- Article
(9688 KB) - Full-text XML
-
Supplement
(1280 KB) - BibTeX
- EndNote


As a major component of atmospheric aerosols, mineral dust plays a significant role in the climate system through both direct and indirect radiative effects (Tegen et al., 1996; Seinfeld et al., 2004). Beyond its radiative impacts, mineral dust influences terrestrial and marine biogeochemical cycles by depositing nutrients – particularly iron (Fe), phosphorus (P), and nitrogen (N) – and by altering precipitation, temperature, and radiation (Jickells et al., 2005; Mahowald et al., 2005; Kok et al., 2023).
Asian dust represents one of the major global dust sources, with annual emissions of approximately 2000 Tg yr−1, accounting for about 40 % of global dust emissions (Kok et al., 2021). East Asia, particularly the Taklimakan and Gobi deserts in northern China and Mongolia, constitutes a dominant source region, with estimated annual emissions ranging from ∼200 to 600 Tg yr−1 (Zhang et al., 1997; Laurent et al., 2006; Shao et al., 2011; Yumimoto and Takemura, 2015; Kok et al., 2023). Although interannual variability is substantial, East Asian dust exhibits a pronounced seasonal cycle with a peak in spring (March–May), driven by strong surface winds associated with Mongolian cyclones and cold-front systems under dry surface conditions (Takemi and Seino, 2005; Qian et al., 2022; Mu and Fiedler, 2025). Under favorable synoptic conditions characterized by strong pressure gradients and intensified westerlies, large amounts of dust can be uplifted and transported to downwind regions, affecting eastern China, the Korean Peninsula, Japan, the North Pacific, and even North America (Uno et al., 2009; Yu et al., 2020). A large fraction of East Asian dust is deposited into the adjacent marginal seas during long-range transport (Hsu et al., 2009; Yumimoto and Takemura, 2015; Tan et al., 2017). Atmospheric dust deposition to the Chinese marginal seas has been estimated at ∼67 Tg yr−1, accounting for 14 % of the total dust input to the entire North Pacific (Gao et al., 1997).
Although dust storm frequency in East Asia has declined over recent decades (Zhu et al., 2008; Wang et al.,2021; Wu et al., 2022), several exceptionally intense events have occurred in recent years, exerting significant regional impacts. For instance, in March 2021, the strongest spring sandstorm in North China over the past decade affected more than 3.8×10⁶ km2 (∼40 % of China's land area) (Yin et al., 2021; Gui et al., 2022; Zhang et al., 2023). During this episode, large quantities of dust were transported over adjacent seas and deposited into the ocean. Xue et al. (2025) estimated that total oceanic dust deposition during 13–22 March 2021 reached approximately 16.1 Tg across the Bohai Sea, Yellow Sea, East China Sea, Sea of Japan/East Sea, and the Northwest Pacific. More recently, an unprecedented gale–dust event during 10–14 April 2025 exhibited exceptionally long-range transport spanning over 30° of latitude, extending southward to ∼18° N and reaching Hainan Island (Yin et al., 2025; Zou et al., 2026). The increasing occurrence of such extreme dust transport events, together with the substantial deposition into adjacent coastal waters, highlights the need to better understand their impacts on coastal marine ecosystems.
Dust deposition fluxes over the Chinese marginal seas have been estimated to be approximately one order of magnitude higher than those over the open North Pacific, underscoring the potential significance of dust as a nutrient source for coastal waters (Tan et al., 2016, 2017). Previous studies have examined the influence of dust-borne nutrient supply on Chl a variability across these regions, including the Yellow Sea (Shi et al., 2012; Liu et al., 2013; Tan and Wang, 2014; Zhang et al., 2018), East China Sea (Tan et al., 2011, 2016), and the South China Sea (Guo et al., 2012; Wang et al., 2012; Chu et al., 2018; Du et al., 2020), with many suggesting that dust deposition can modulate phytoplankton biomass through nutrient fertilization, though the responses vary depending on local nutrient conditions and dust characteristics. For instance, Tan et al. (2011) found that Chl a increased following more than 70 % of dust outbreaks in the southern Yellow Sea, often within 1–21 d, whereas no significant responses were detected in the Bohai Sea or the northern Yellow Sea. Meng et al. (2021) further demonstrated that Chl a response probability to heavy dust events increases progressively from north to south across the Chinese marginal seas.
Beyond the direct biogeochemical pathway of nutrient supply, dust outbreaks are typically accompanied by pronounced synoptic circulation anomalies that significantly modify meteorological conditions, including surface wind speeds, solar radiation, and precipitation. These atmospheric perturbations can alter air–sea heat and momentum exchange, thereby modifying the thermal structure, stratification, and mixing dynamics of the upper ocean (Shi et al., 2017; Kim et al., 2018; Yan et al., 2020; Lv et al., 2022; Xu et al., 2022). Previous studies have demonstrated that such atmospheric forcing changes play an important role in regulating phytoplankton dynamics in the Chinese marginal seas, particularly during extreme weather events such as typhoons (Chen and Tang, 2011; Zhao et al., 2017; Wang, 2020; Wang et al., 2021), monsoons (Liu et al., 2002; Lin et al., 2007, 2009; Shen et al., 2020) and heavy rainfall (He et al., 2024). However, the episodic impacts of dust events on marine ecosystems in this region remain much less explored. Existing studies have largely focused on the nutrient fertilization effect of dust deposition, often relying on individual case analyses or incubation experiments with limited spatial and temporal coverage. Consequently, the potential influence of dust-associated synoptic circulation anomalies and their modification of air–sea forcing on phytoplankton biomass variability remains poorly understood.
This study examines the response of Chl a to synoptic atmospheric forcing associated with spring dust events in the Chinese marginal seas over 2003–2023, using daily anomalies from reanalysis products and a reconstructed Chl a dataset. Specifically, we: (1) characterize the spatiotemporal patterns of Chl a responses to strong dust events; (2) explore the associated synoptic circulation regimes and assess how they modulate air–sea heat exchange and upper-ocean mixing; and (3) investigate the potential linkage between net surface heat flux, mixed-layer depth, and Chl a variability on daily timescales. The data, methods, results and discussions are presented in the following sections.
This study employs daily datasets for the spring seasons (March–May) during 2003–2023, including Chl a, dust optical depth (DOD), meteorological variables, and oceanic conditions such as sea surface temperature and mixed-layer depth.
Chl a concentrations were obtained from the Ocean Chlorophyll a Reconstruction Neural Ensemble Network (OCNET) developed by Hong et al. (2025). OCNET is a deep learning framework that reconstructs daily surface Chl a by integrating satellite ocean-colour observations, Biogeochemical Argo (BGC-Argo) float profiles, and multiple environmental variables (see Table S1 in Hong et al. (2025) for details of the input variables) to generate a gap-free global daily Chl a product over the low- to mid-latitude oceans. The reconstructed dataset has been extensively evaluated against both satellite-derived and in situ observations, demonstrating high reconstruction skill (R2=0.93, relative bias = 4.09 %, RMSE = 0.237; Hong et al., 2023, 2025). Compared with conventional satellite ocean-colour products, OCNET provides continuous daily coverage that substantially alleviates missing observations caused by cloud contamination and other retrieval limitations, making it particularly suitable for investigating short-term phytoplankton variability. The native spatial resolution of this dataset is 0.25° × 0.25°.
Dust optical depth at 550 nm and meteorological variables were obtained from the Modern-Era Retrospective Analysis for Research and Applications, Version 2 (MERRA-2), produced by the NASA Global Modeling and Assimilation Office (https://gmao.gsfc.nasa.gov/reanalysis/MERRA-2/, last access: 13 October 2025). DOD is used as an index to identify dust event intensity and characterize dust conditions. The meteorological variables used in this study include sea surface temperature (SST) (which was obtained from the TS field), 2 m air temperature (T2M), 2 m specific humidity (QV2M), sea level pressure (SLP), 10 m zonal and meridional wind components (U10, V10) and wind speed (WS), downward shortwave radiation (SW), total precipitation (TP), and total cloud fraction (CF). Surface heat flux components include net shortwave radiation flux (Qsw), net longwave radiation flux (Qlw), latent heat flux (Qlh), and sensible heat flux (Qsh). The net surface heat flux (Qnet) is calculated as the sum of these four components and is defined as positive downward. In addition, the saturation specific humidity at the sea surface, qs(SST), was derived from SST using the Magnus-Tetens formula (Murray, 1967) and converted to specific humidity using SLP. The native horizontal resolution of MERRA-2 is 0.5° latitude × 0.625° longitude.
MLD was obtained from the Copernicus Marine Environment Monitoring Service (CMEMS) Global Ocean Physics Reanalysis (https://data.marine.copernicus.eu/product/GLOBAL_MULTIYEAR_PHY_001_030/, last access: 17 December 2025), with a native resolution of 0.083° × 0.083°. In this product, the MLD is provided as ocean mixed layer thickness defined by a sigma-theta criterion. This product has been widely used in studies of upper-ocean variability and marginal seas (e.g., Oh et al., 2024; Zhang et al., 2025).
Daily Level-3 merged Chl a products (25 km resolution) from the ESA GlobColour project (https://hermes.acri.fr/, last access: 6 July 2026), generated using the Average Weighted (AVW) merging algorithm from multiple satellite sensors, were obtained for the study period (2003–2023) and used for comparison with OCNET in the Discussion section.
To ensure spatial consistency across datasets, all fields were interpolated onto a common 0.5° × 0.625° grid prior to analysis. Daily anomalies were computed by removing the climatological mean seasonal cycle, defined as the long-term mean for each calendar day over the 2003–2023 period. These anomaly fields were used for all correlation and composite analyses in this study. All statistical significance was assessed using a two-sided Student's t test with the effective sample size corrected for temporal autocorrelation following Pyper and Peterman (1998).
3.1 Climatology of DOD and Chl a and their correlations
Spring is the most active season for East Asian dust events and coincides with a period of enhanced phytoplankton activity in China's coastal seas. Figure 1 presents the spring climatological mean distributions of DOD and Chl a concentration over 2003–2023. DOD exhibits relatively elevated values (exceeding ∼0.12) over the Bohai and northern Yellow Sea, decreasing substantially (to below ∼0.04) toward the northern South China Sea. The spatial distribution of Chl a shows a pronounced nearshore-to-offshore gradient, with elevated concentrations primarily in nearshore waters. The highest Chl a values (exceeding 4–6 mg m−3) are found in the Bohai Sea and the coastal margins of the Yellow Sea and East China Sea, whereas the southern coastal waters exhibit comparatively lower concentrations even in nearshore areas.
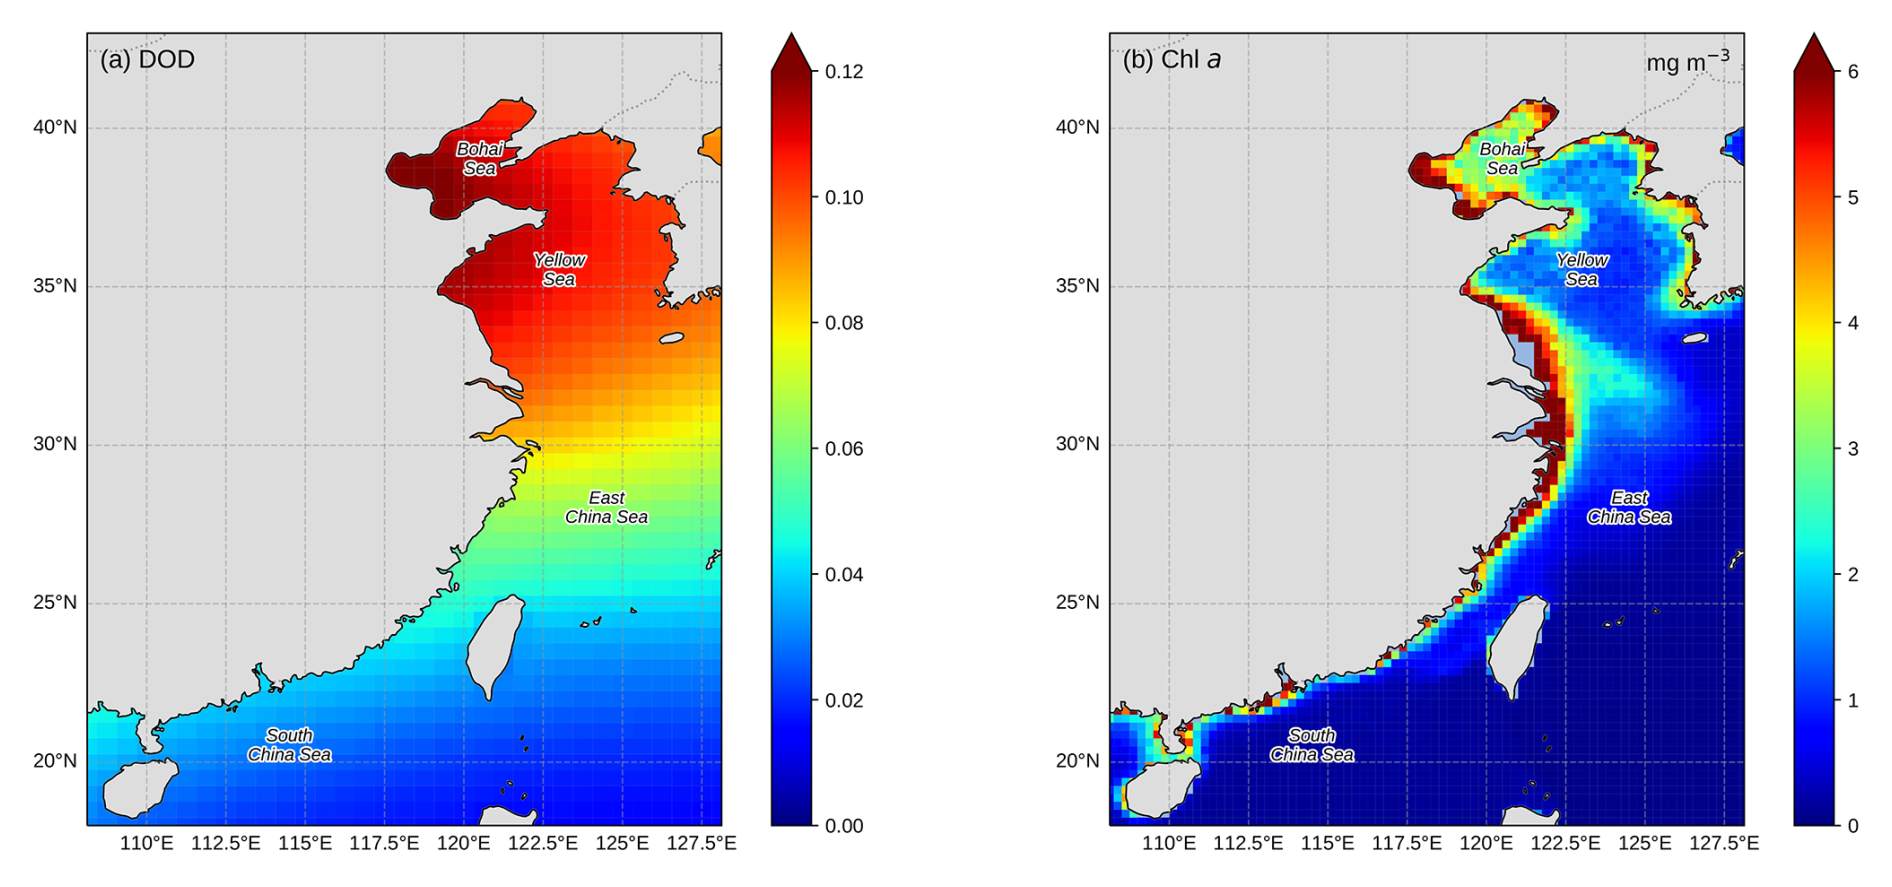
Figure 1Spring climatological mean distributions of (a) DOD and (b) Chl a concentration (unit: mg m−3) over the Chinese marginal seas, averaged over 2003–2023.
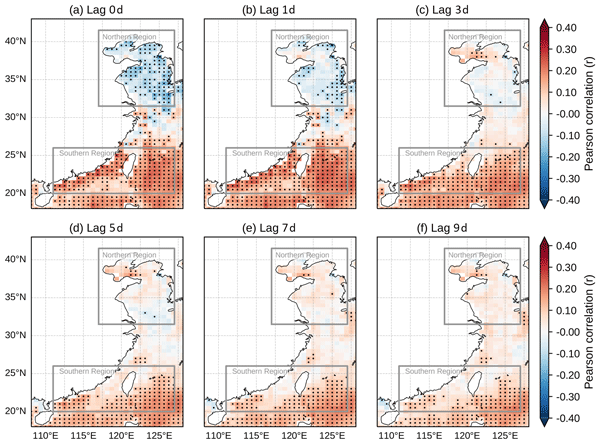
To investigate the spatiotemporal response of marine phytoplankton biomass to dust aerosols, we analyze the spatial distribution of Pearson correlation coefficients (R) between DOD and Chl a concentrations at lags from 0 to 9 d (lag 0 referring to the day on which the DOD exceeds the 95th percentile threshold), with DOD leading Chl a. All correlations shown are based on daily anomaly fields after removal of the seasonal cycle. Figure 2 shows pronounced spatial heterogeneity in the dust–Chl a relationship along the Chinese coast. In the Northern Region (117–127° E, 31.5–41.5° N), correlations are predominantly negative at short lags (0–1 d), with R values reaching about −0.3 in the Bohai Sea and northern Yellow Sea. This negative pattern gradually weakens and shifts toward weakly positive correlations by lags 5–9 d. Such temporal evolution suggests a delayed phytoplankton response, possibly reflecting the combined influences of upper-ocean mixing and biological adjustment processes in northern coastal waters.
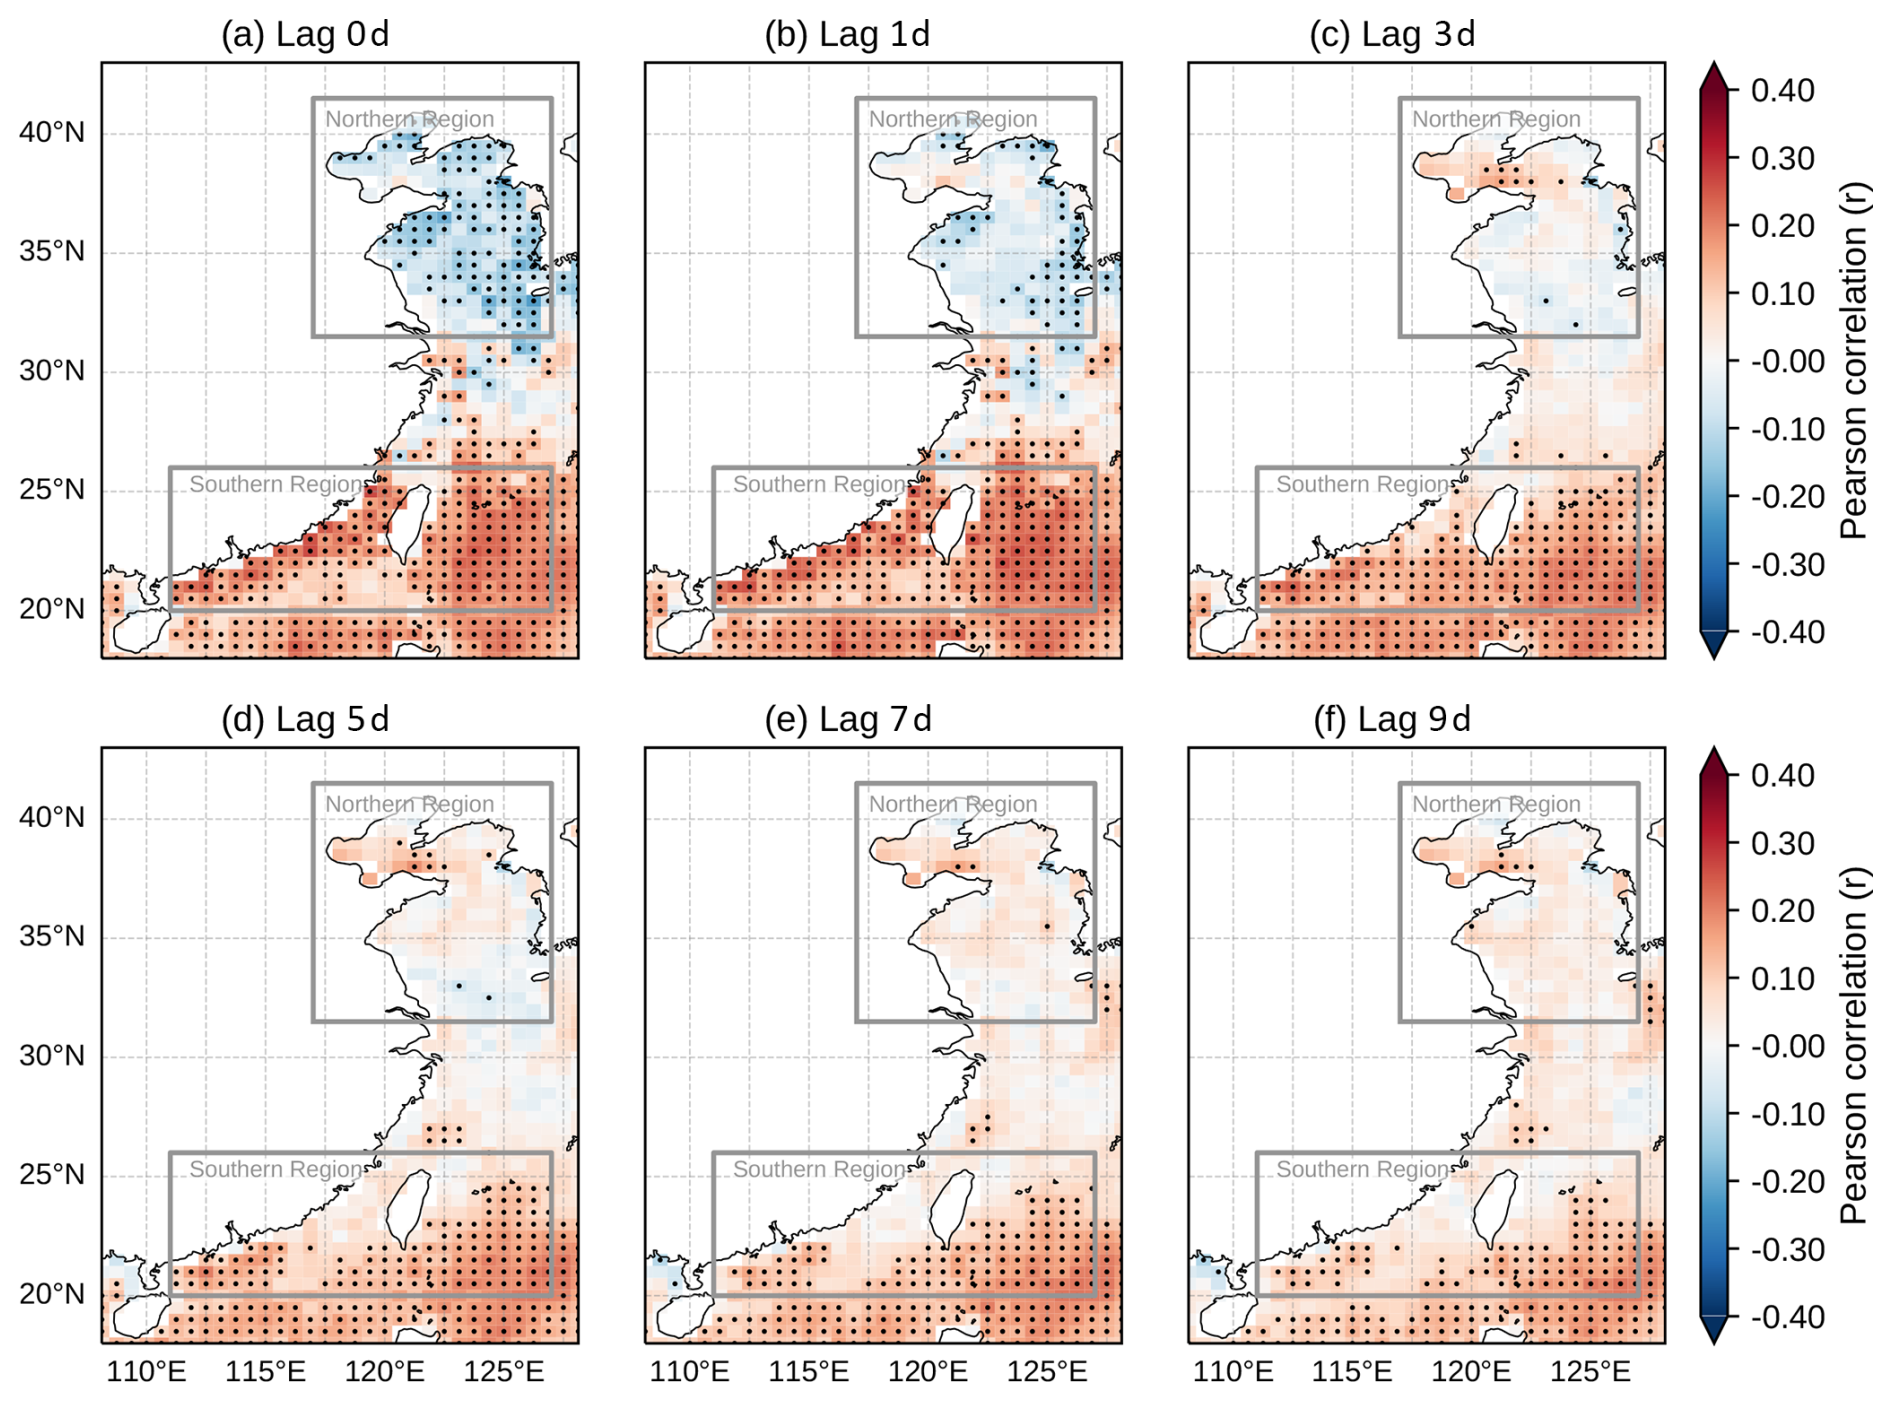
Figure 2Spatial distributions of lagged Pearson correlation coefficients between DOD and Chl a concentration along China's coastal seas. Correlations are calculated with dust leading Chl a by 0, 1, 3, 5, 7, and 9 d. Stippling indicates correlations significant at the 95 % confidence level (p<0.05). Dark gray boxes denote the Northern Region (117–127° E, 31.5–41.5° N) and the Southern Region (111–127° E, 20–26° N).
In contrast, the Southern Region (111–127° E, 20–26° N) exhibits a clear positive correlation that emerges rapidly within 0–1 d, particularly over the Taiwan Strait and adjacent waters. Unlike the Northern Region, this positive relationship persists throughout the 9 d period, although the spatial extent of statistically significant correlations gradually decreases after lag 5. Overall, these patterns reveal a pronounced meridional contrast in the dust–Chl a relationship, suggesting region-dependent processes influencing phytoplankton variability along China's coastal seas.
3.2 Composite Analysis of Lagged Chl a Responses to Dust Events
To further elucidate the Chl a response to dust events, a lagged composite analysis was conducted for the Northern Region (117–127° E, 31.5–41.5° N) and the Southern Region (111–127° E, 20–26° N), respectively. Strong dust days were identified when daily regional-mean DOD anomalies exceeded the 95th percentile, whereas weak dust days were defined as those below the 5th percentile. Chl a daily anomalies were then composited separately for strong and weak dust days at different lag times, with dust leading and Chl a lagging (Figs. 3 and 4). These composites were compared to assess the Chl a response associated with extreme dust conditions.
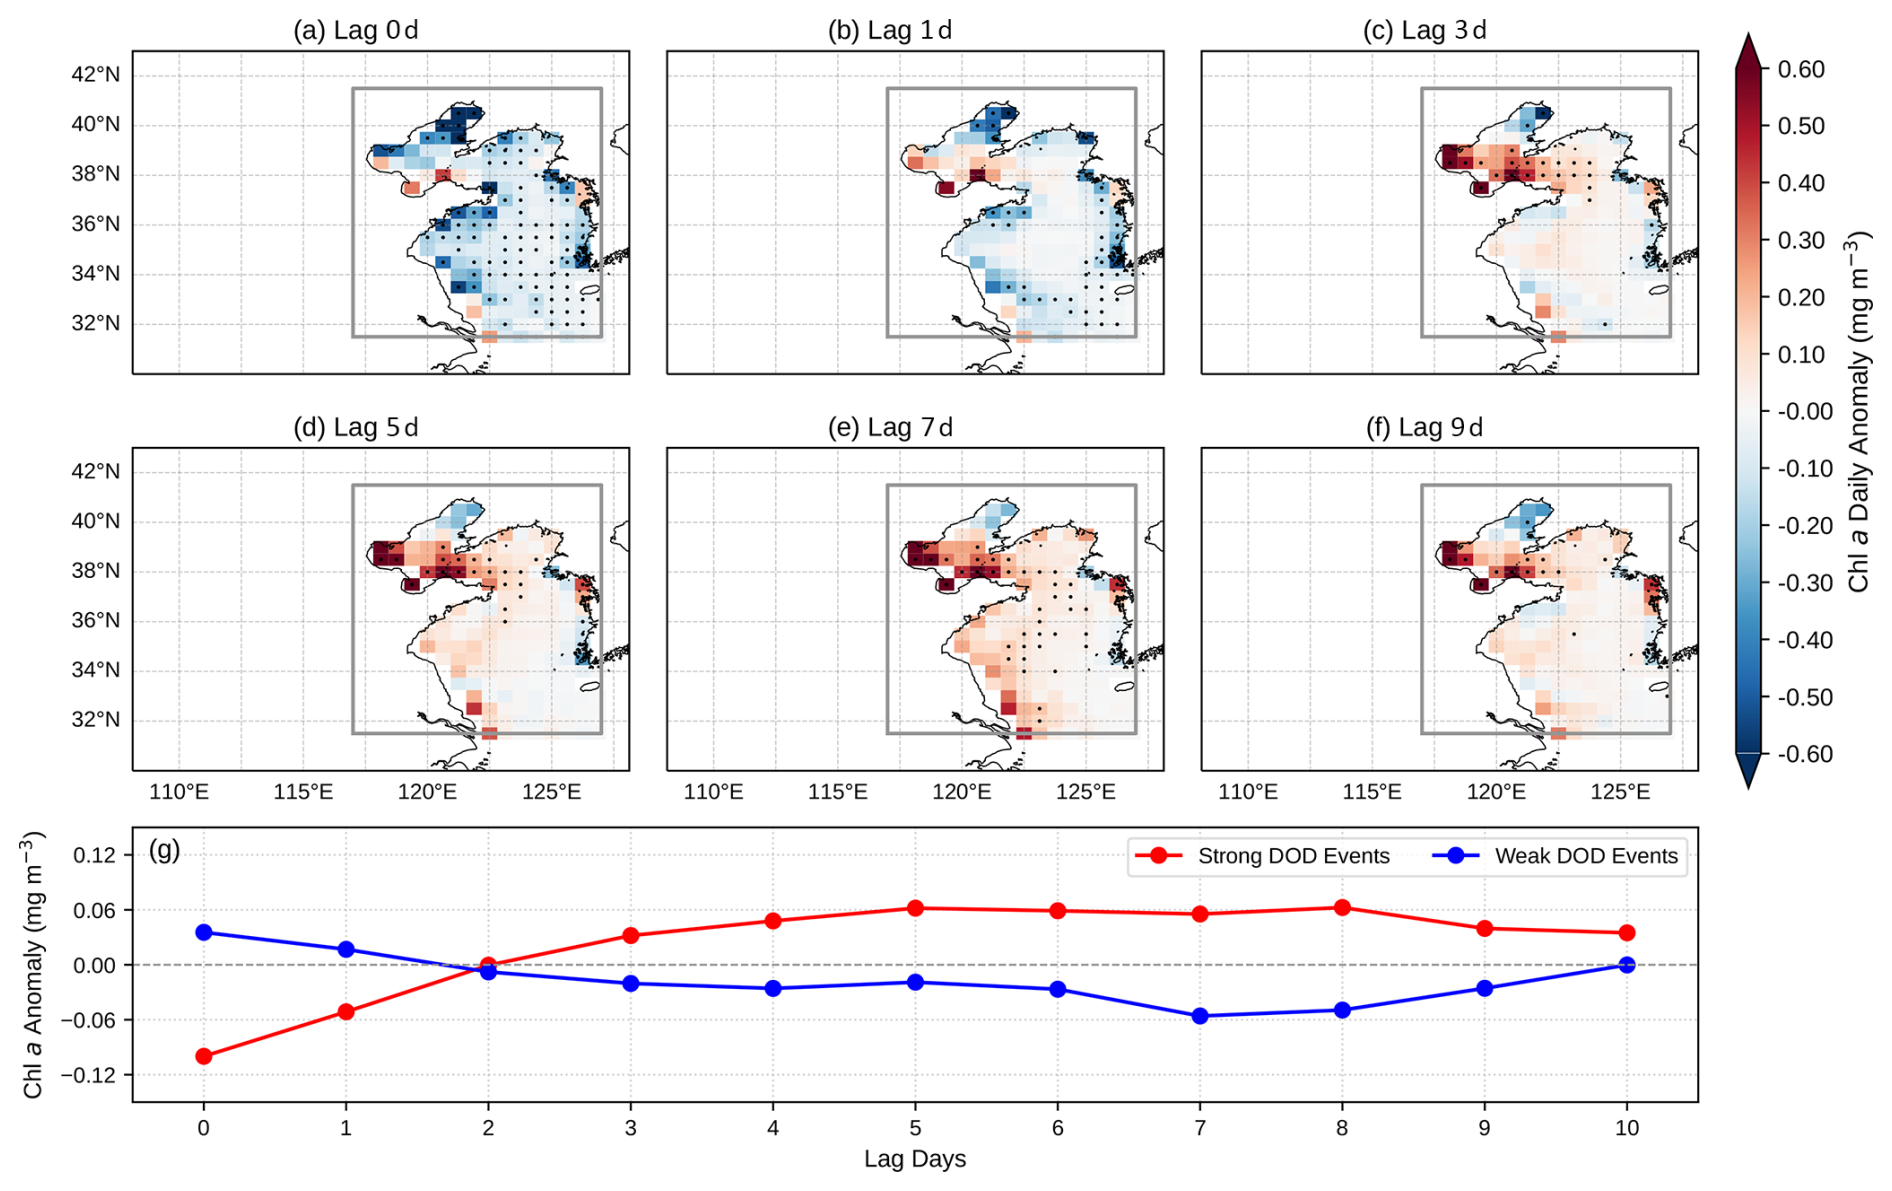
Figure 3Composite analysis of Chl a responses to extreme dust events in the Northern Region (31.5–41.5° N, 117–127° E). The upper panels (a–f) show the spatial distribution of the differences in Chl a daily anomalies between strong (>95th percentile) and weak (<5th percentile) dust events at lags of 0, 1, 3, 5, 7, and 9 d, with DOD leading and Chl a lagging. Stippling denotes grid points where the differences are statistically significant at the 95 % confidence level (p<0.05). The lower panel (g) illustrates the temporal evolution of regionally averaged Chl a daily anomalies for strong (red) and weak (blue) dust events as a function of lag days.
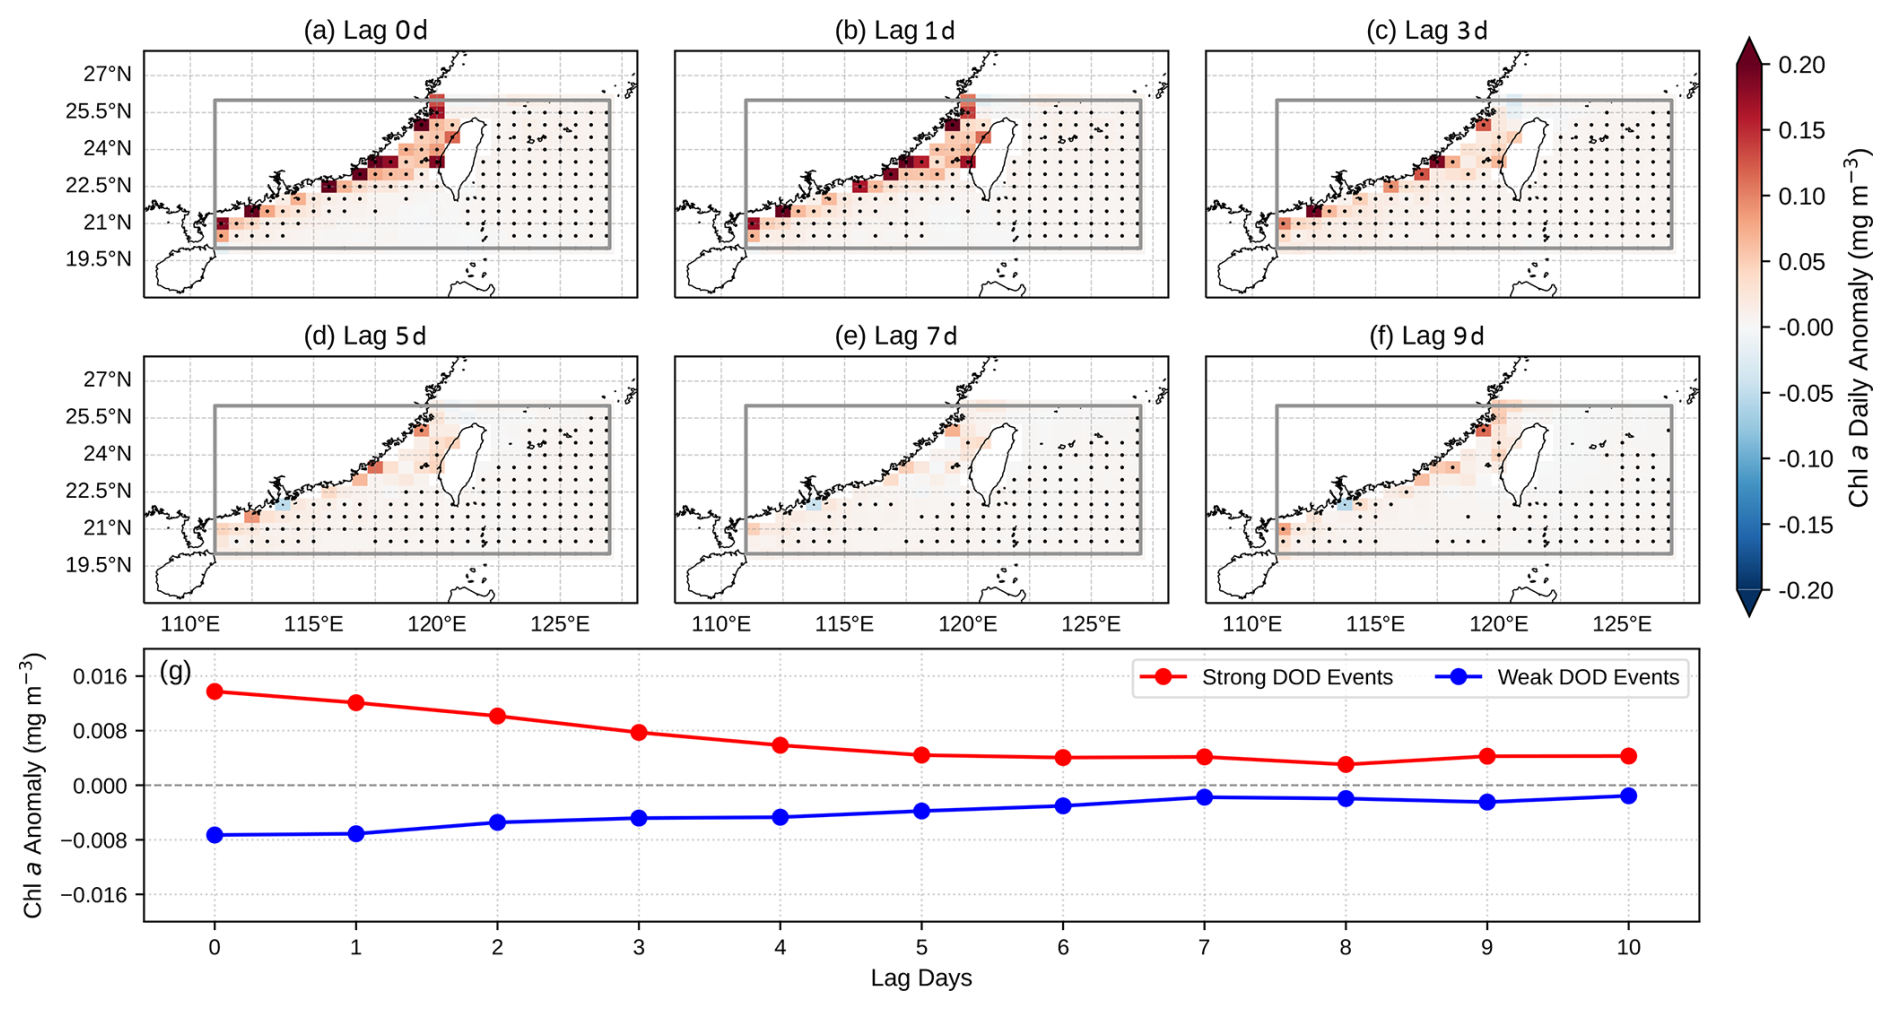
Figure 4Same as Fig. 3, but for Southern Region.
The composite results reveal a clear lag-dependent Chl a response to extreme dust days in the Northern Region (Fig. 3). At lags 0–1 d, Chl a anomalies are predominantly negative across large portions of the Bohai Sea and northern Yellow Sea, with minima falling below −0.4 mg m−3. The anomalies turn from negative to positive by lag 3 d, initially over the Bohai Sea, and this positive response intensifies at lags 5–7 d across the Bohai Sea and northern Yellow Sea, with maximum values exceeding 0.5 mg m−3. By lag 9 d, the spatial extent of positive anomalies decreases, with positive values mostly confined to the Bohai Sea. The regionally averaged time series further highlights the distinct evolution associated with strong and weak dust days. During strong dust days, regional averaged Chl a anomalies are initially negative at lag 0 (approximately −0.1 mg m−3), followed by a reversal to positive values after 2–3 d, reaching a maximum of about 0.06 mg m−3 at lags 5–8 d. In contrast, weak dust days exhibit a slight positive anomaly at lag 0, which subsequently diminishes toward near-zero or negative values during the following days. The difference between the strong and weak composites becomes most pronounced between lags 5 and 8 d.
In the Southern Region (Fig. 4), the composite results exhibit a markedly different temporal evolution. At lags 0–1 d, Chl a anomalies are positive, primarily distributed along the coastal waters, particularly over the Taiwan Strait and the southeastern coastal waters of China, with maximum values reaching approximately 0.15–0.20 mg m−3. The magnitude of the positive anomalies then declines gradually with increasing lag time, weakening substantially by lags 5–7 d and becoming negligible by lag 9 d. Unlike in the Northern Region, no significant negative Chl a anomalies are observed throughout the lag period (0–9 d). The regional-mean time series shows that during strong dust days, Chl a anomalies are positive at lag 0 (approximately 0.01–0.015 mg m−3) and decrease steadily over subsequent days, approaching near-zero values after about one week. In contrast, weak dust conditions exhibit slightly negative anomalies initially, which gradually increase toward near-zero values. The difference between strong and weak composites is most evident during the first few days and diminishes thereafter.
To sum up, the two regions exhibit contrasting temporal responses of Chl a to dust days. The Northern Region is characterized by an initial suppression followed by a delayed enhancement, with peak anomalies emerging at lags of approximately 5–8 d. In contrast, the Southern Region displays an immediate positive response that weakens progressively over the subsequent days. These contrasting temporal patterns suggest that the Chl a responses to dust differ substantially between the two regions, highlighting the potential role of concurrent environmental conditions in modulating phytoplankton variability. Previous studies have demonstrated that the magnitude and timing of dust-associated Chl a responses are regulated by multiple environmental factors, including sea surface temperature, photosynthetically active radiation (PAR), wind forcing, precipitation, and upper-ocean mixing conditions (Luo et al., 2020; Meng et al., 2021; Xu et al., 2022). For example, elevated dust aerosol can induce a radiative dimming effect that reduces surface PAR, thereby suppressing phytoplankton growth (Mallet et al., 2009). Meanwhile, strong winds accompanying dust outbreaks may enhance vertical mixing, deepen the mixed layer, and entrain subsurface nutrients, thereby complicating the net biological response (Shi et al., 2012). These findings underscore the importance of examining concurrent atmospheric and oceanic conditions to better understand the processes underlying the observed regional differences.
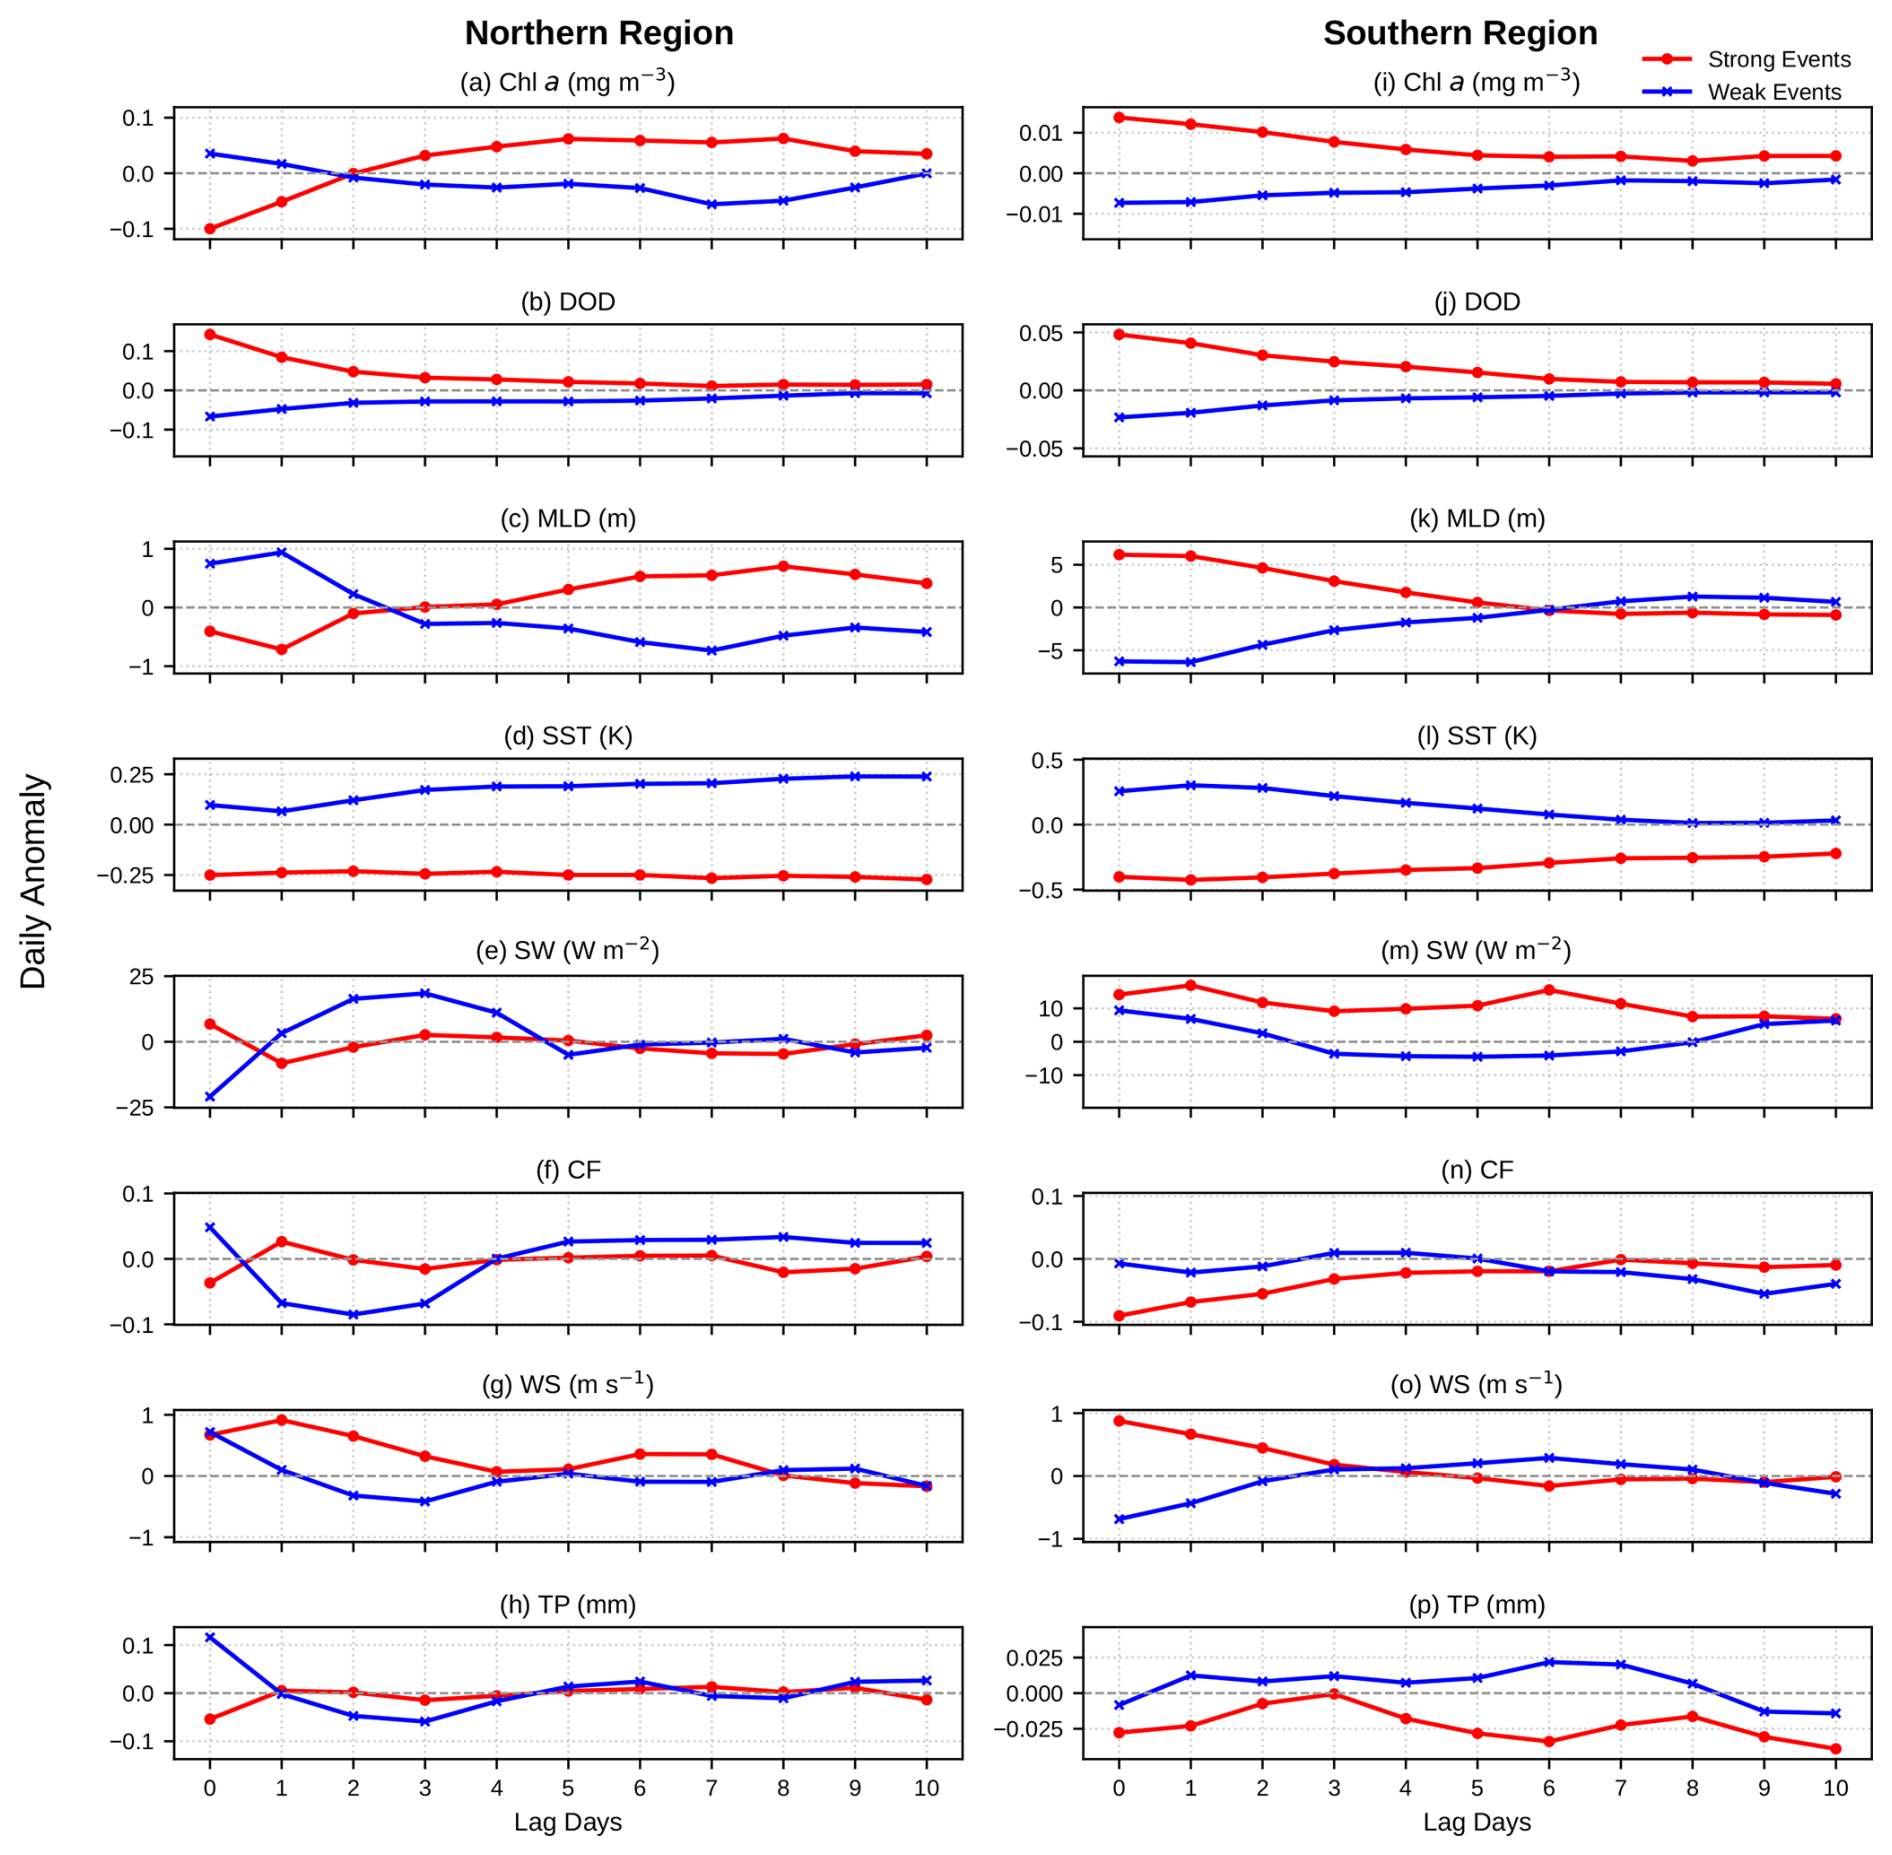
Figure 5Composite temporal evolution of daily anomalies in Chl a (mg m−3), DOD, mixed layer depth (MLD, m), sea surface temperature (SST, K), shortwave radiation (SW, W m−2), cloud fraction (CF), wind speed (WS, m s−1), and total precipitation (TP, mm) for the Northern Region (left column, a–h) and Southern Region (right column, i–p). Red lines with filled circles denote strong dust events (>95th percentile); blue lines with crosses denote weak dust events (<5th percentile). The horizontal axis indicates lag days relative to dust event onset (lag 0). The gray dashed line marks the zero-anomaly reference. Only oceanic grid points within each region are included.
3.3 Composite evolution of environmental conditions during dust events
Figure 5 shows the composite temporal evolution of key physical variables during strong and weak dust events. During strong dust events in the Northern Region, DOD anomalies peak at lag 0, coinciding with an initial suppression of Chl a that persists for approximately 1–2 d before turning positive and reaching peak enhancement at lags 5–8 d. Among the environmental variables, SST, shortwave radiation (SW), cloud fraction (CF), and total precipitation (TP) exhibit relatively modest anomalies. SST anomalies remain slightly negative throughout the composite period. SW shows positive anomalies at lag 0 that weakens by lag 1 and remains negligible thereafter. The evolution of SW is generally opposite to that of CF, suggesting that changes in cloud cover associated with the synoptic weather system could influence the downward shortwave radiation. TP anomalies are slightly negative near lag 0 with minimal anomalies in subsequent days. In contrast, wind speed (WS) and MLD exhibit more pronounced responses. WS shows significant positive anomalies during lags 0–2 before gradually weakening. MLD displays a distinct temporal evolution, with anomalously shallow mixed layers during lags 0–2, reaching a maximum negative anomaly around lag 1 (approximately −1 m), followed by progressive deepening that peaks around lag 8.
In the Southern Region, Chl a exhibits an immediate positive anomaly at lag 0 that gradually weakens over the following days. SST anomalies remain slightly negative throughout the composite period, similar to those in the north. However, SW radiation shows positive anomalies over several consecutive days and is accompanied by reduced CF, indicating relatively clear-sky conditions during much of the event period. TP displays negative anomalies across most of the composite window. WS peaks at lag 0 and remains elevated during the first few days. In contrast to the Northern Region, MLD anomalies are positive during lags 0–5, with the difference between strong and weak dust conditions exceeding approximately 10 m during the first two days, before gradually weakening and turning slightly negative thereafter.
Previous studies suggest that deepening of the mixed layer can enhance vertical nutrient entrainment and stimulate phytoplankton growth, whereas a shallower mixed layer may limit nutrient supply (Shi et al., 2012, 2017; Shen et al., 2020). In the Northern Region, the mixed layer initially becomes shallower before deepening several days after the dust event, coinciding with the delayed enhancement of Chl a. In contrast, the Southern Region exhibits early mixed-layer deepening that occurs concurrently with the immediate increase in Chl a. These contrasting MLD evolutions may influence upper-ocean nutrient supply and thus contribute to the different Chl a responses observed between the two regions.
On synoptic timescales, MLD variability largely reflects the integrated response of the upper ocean to atmospheric forcing, including wind stress and surface radiative fluxes (Hung et al., 2009; Kim et al., 2018; Yan et al., 2020). Previous studies over the China marginal seas have extensively examined the impact of episodic atmospheric conditions on upper-ocean mixing dynamics. For example, studies have shown that typhoon events can substantially deepen the mixed layer through intensified wind forcing and enhanced surface heat loss, subsequently stimulating phytoplankton blooms (Chen and Tang, 2011; Wang, 2020; Wang et al., 2021). Similarly, large-scale atmospheric circulation associated with the East Asian monsoon has been shown to modulate upper-ocean circulation and stratification in the South China Sea (Liu et al., 2002; Lin et al., 2007, 2009; Shen et al., 2020). However, the potential role of dust-associated synoptic circulations in upper-ocean MLD has received comparatively little attention. Given that strong dust outbreaks are typically accompanied by significant anomalies in wind, radiation, and surface heat flux, it is necessary to investigate how these concurrent atmospheric perturbations influence upper-ocean mixing and Chl a variability. The following section examines the dust-associated circulation anomalies and their potential role in shaping the contrasting MLD evolution between the two regions.

Figure 6Composite anomalies (strong minus weak dust events) of atmospheric circulation fields for the Northern Region at lag 0, 1, 3, and 5 d relative to dust event onset. Rows show (top, a–d) sea level pressure (SLP, hPa), (middle, e–h) 2 m air temperature (T2M, K), and (bottom, i–l) 2 m specific humidity (QV2M, kg kg−1). Anomalous 10 m wind vectors (m s−1) are overlaid on all panels. The white box denotes the Northern Region. Stippling denotes areas where anomalies are statistically significant at the 95 % confidence level (p<0.05).
3.4 Composite atmospheric circulation anomalies associated with dust events
Figure 6 shows the composite differences in atmospheric circulation between strong and weak dust events over the Northern Region (outlined by the white box). At dust onset (lag 0), a broad negative SLP anomaly dominates northern China, with the low-pressure center located near 50° N over northeastern China and eastern Mongolia. This anomalous SLP pattern and the associated wind configuration are consistent with a typical Mongolian cyclone system, which has been identified as the primary synoptic driver of major East Asian dust outbreaks (Lin et al., 2019; Qian et al., 2022; Mu and Fiedler, 2025). Strong anomalous northwesterly winds prevail on the southwestern flank of the cyclone, facilitating the transport of dust from the northwestern desert source toward the Northern Region and other downstream regions. The Northern Region, located along the southern periphery of the cyclone, is influenced by both the rear-side northwesterlies and the southerly flow ahead of the system.
The air temperature field (T2M) reveals a pronounced meridional contrast near 40° N, with a significant cold anomaly centered over northwestern Mongolia and a warm anomaly over eastern China. This northwest cold–southeast warm pattern is consistent with the anomalous frontal structure reported by Qian et al. (2022), who identified such a thermal contrast as a characteristic feature of recent major dust storms over northern China and noted that it can strengthen wind anomalies and promote dust emission and transport. The northern study area is located within the region of positive temperature anomalies. The specific humidity field (QV2M) exhibits a similarly pronounced meridional contrast, with dry anomalies north of ∼40° N and moist anomalies to the southeast. Consequently, the Northern Region, under the influence of anomalous southerly flow, experiences anomalously warm and moist conditions at dust onset.
By lag 1 d, the low-pressure center and associated northwesterly wind anomalies weaken substantially. The warm anomaly over eastern China also decreases and shifts southward. Meanwhile, positive moisture anomalies over eastern and southern China intensify. Under the influence of southerly flow transporting moisture from the ocean, the northern study area exhibits a marked increase in atmospheric moisture compared with the onset day. During the following days (lag 3 and 5), the overall circulation system continues to decay. Correspondingly, the anomalous winds, temperature, and atmospheric moisture over the Northern Region gradually weaken and become statistically insignificant.

Figure 7Same as Fig. 6, but for Southern Region (indicated in the white box).
Unlike the Northern Region, the Southern Region is remote from the primary dust sources in northwestern China and Mongolia, and therefore dust arrival depends primarily on the long-range transport of upstream dust plumes. Figure 7 presents the composite differences in atmospheric circulation between strong and weak dust events over the Southern Region (indicated in the white box). At dust onset, a pronounced positive SLP anomaly is centered over southeastern China and the adjacent East China Sea, indicating the presence of an anomalous anticyclonic circulation. The anomalous 10 m winds exhibit a clear clockwise circulation around the high-pressure center, with strengthened northeasterly flow prevailing over the Southern Region. This synoptic configuration contrasts markedly with the cyclonic pattern identified for the Northern Region (Fig. 6). The enhanced northeasterly winds along the southeastern flank and leading edge of the anomalous high favor the southward transport of dust from northern China toward southern China and adjacent marine areas.
This anticyclonic pattern is consistent with synoptic regimes reported in previous studies as key mechanisms for long-range southward dust transport over East Asia. Several studies have demonstrated that continental high-pressure systems or migrating anticyclones over mainland China play a crucial role in driving long-range aerosol transport toward downwind regions, including the East China Sea, the Taiwan Strait, and the South China Sea (Chuang et al., 2008a, b; Hsu et al., 2013; Kong et al., 2024). The persistent northerly winds along the leading edge of these systems provide the primary dynamical forcing for southward dust transport. For example, Hsu et al. (2013) showed that an anticyclone moving southeastward toward the eastern coast of China generated strong northerlies ahead of the system that efficiently transported dust plumes to the East China Sea and the South China Sea. Similarly, Chuang et al. (2008a, b) identified a High-pressure Pushing Pattern (HPP), characterized by the southeastward migration of a continental high-pressure system and the development of strong northeasterlies, which substantially enhanced aerosol concentrations over Taiwan. They further noted that HPP events typically feature stronger wind speeds than other synoptic regimes, representing the dominant weather pattern for long-range southward aerosol transport in East Asia.
The T2M anomaly field at lag 0 reveals a pronounced meridional contrast, with warm anomalies north of ∼40° N extending across northwestern China and western Mongolia, and significant cold anomalies over southern China and the adjacent marine areas. The Southern Region is thus characterized by anomalously cold conditions, consistent with the advection of cold air by the enhanced northeasterly flow. The QV2M field exhibits correspondingly significant negative anomalies over the region, indicating reduced near-surface humidity. Overall, in contrast to the anomalously warm and humid conditions in the Northern Region, the southern marine area is characterized by colder and drier conditions at dust onset.
On the following day (lag 1), the anticyclonic system shifts eastward, with its center moving toward the East China Sea, while the Southern Region remains along the southern flank of the high-pressure system and continues to be influenced by prevailing northeasterly flow. Significant negative anomalies in both T2M and QV2M persist over the region, indicating that the cold and dry conditions are maintained one day after dust onset. By lag 3–5, the anticyclonic circulation weakens and shifts farther eastward over the western Pacific, leading to a substantial reduction in the associated wind anomalies over the Southern Region. Meanwhile, the temperature and moisture anomalies gradually decrease and become statistically insignificant, indicating the rapid decay of the synoptic conditions favorable for southward dust transport into the Southern Region.
The above analyses indicate that dust events in the Northern and Southern Regions are governed by distinct synoptic configurations. Northern outbreaks are associated with Mongolian cyclone development, resulting in anomalously warm and moist conditions over the Northern Region, while southern events are controlled by migrating anticyclones that drive cold, dry northeasterly advection. These contrasting circulation patterns not only regulate dust transport pathways but also influence air–sea heat exchange and upper-ocean mixing conditions through changes in thermal and moisture gradients. The following section examines how these atmospheric perturbations translate into changes in surface heat flux and MLD, and their subsequent influence on the contrasting Chl a responses between the two regions.
3.5 Air–Sea Forcing and Its Role in Upper-Ocean Mixing
Given the dependence of upper-ocean stratification on wind stress and surface heat flux, we next analyze how the contrasting synoptic regimes associated with dust events in the two regions modify air–sea forcing conditions. To diagnose the mechanisms controlling turbulent heat exchange and wind-driven mixing, we first examine variations in the air–sea temperature difference (T2M–SST), the air–sea specific humidity difference (QV2M–qs(SST), where qs(SST) denotes the saturation specific humidity at the sea surface temperature, and surface wind speed. Wind speed modulates mechanical mixing and influences the bulk transfer coefficients governing both sensible and latent heat fluxes, whereas the air–sea temperature and humidity differences determine the magnitude and direction of sensible and latent heat exchange, respectively.
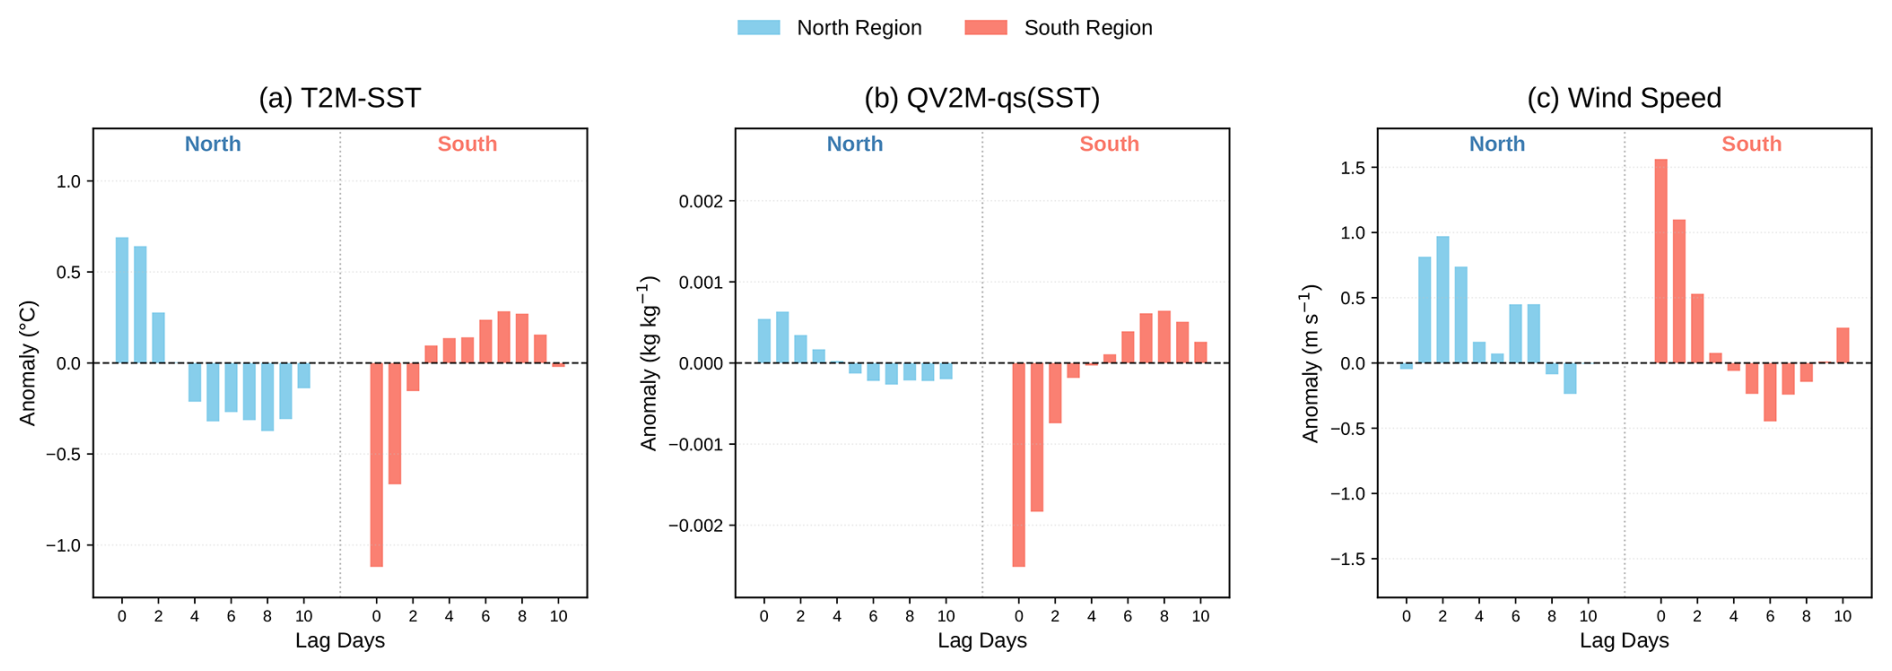
Figure 8Composite anomalies of air–sea temperature difference (a, T2M–SST), air–sea specific humidity difference (b, QV2M–qs(SST)), and surface wind speed (c) associated with strong minus weak dust events over the northern (blue) and southern (red) regions. The horizontal axis shows lag days from lag 0 to lag 10.
As shown in Fig. 8, during strong dust events, the Northern and Southern Regions exhibit distinct evolutions in both air–sea temperature and humidity differences following dust onset (lag 0). In the Northern Region, both differences show positive anomalies during lags 0–2 d, indicating that the near-surface air is anomalously warmer and more humid relative to the sea surface, before gradually weakening and turning to negative values. This pattern is consistent with the anomalous southerly advection of warm, moist air identified in the circulation composites (Fig. 6). In contrast, the Southern Region exhibits notably stronger negative anomalies in both differences during lags 0–2 d, indicating that the air is anomalously colder and drier relative to the sea surface, consistent with the cold, dry northeasterly advection associated with the anticyclonic circulation (Fig. 7).
In terms of wind speed, both regions exhibit positive anomalies during the composite period, though with distinct temporal variation. In the Southern Region, wind speed anomalies peak at lag 0 and decline steadily thereafter, becoming slightly negative by approximately lag 4. In the Northern Region, wind speed anomalies are relatively modest at lag 0 but remain substantially positive during lags 1–3 before gradually decreasing. These contrasting evolutions in air–sea temperature and humidity differences, together with the distinct wind speed anomalies, suggest different perturbations to turbulent heat exchange and wind-driven mixing between the two regions, which are quantified in the following subsection.
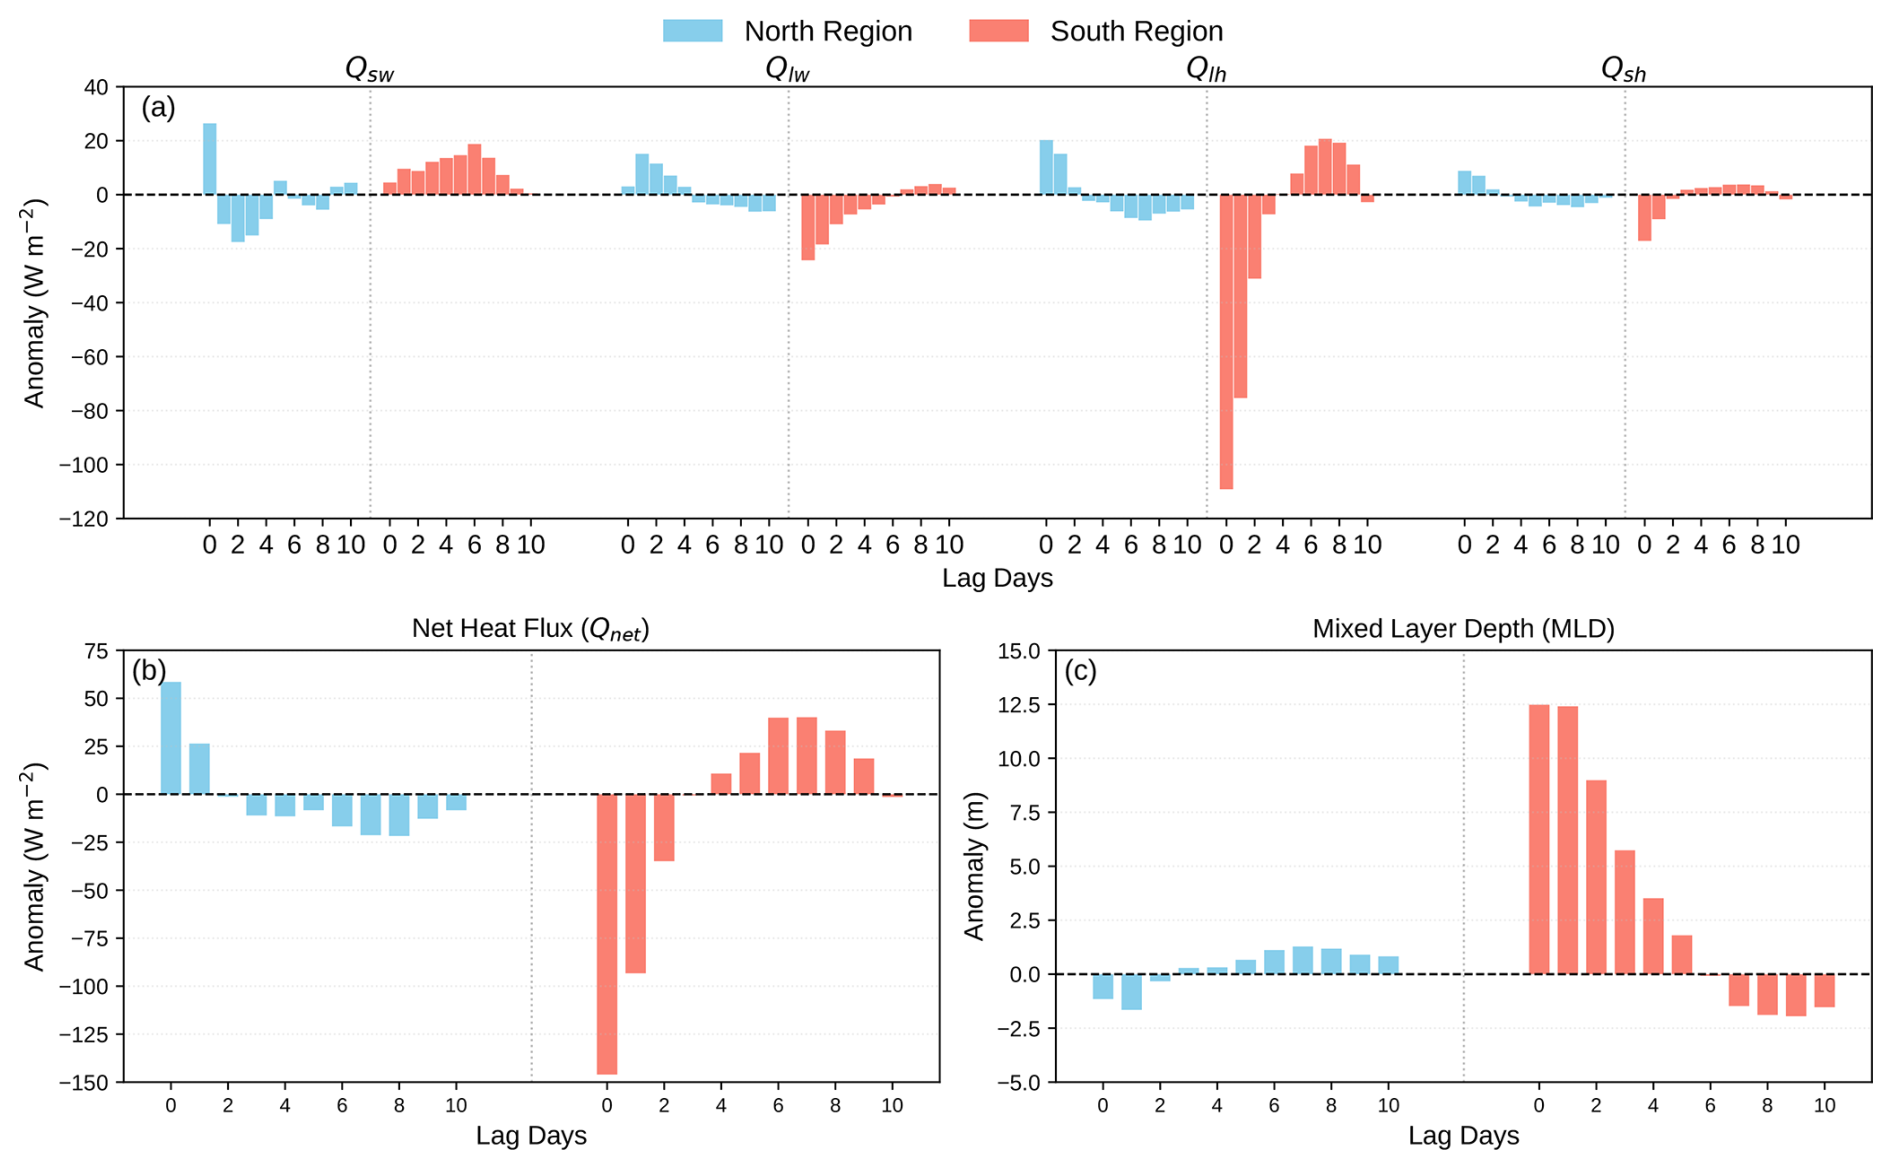
Figure 9Composite anomalies (strong minus weak dust events) of surface heat flux components (W m−2), net surface heat flux (Qnet, W m−2), and MLD (m) over the northern (blue) and southern (red) regions. All flux components are defined as positive downward (into the ocean). The upper panel shows anomalies of net shortwave radiation (Qsw), net longwave radiation (Qlw), latent heat flux (Qlh), and sensible heat flux (Qsh). The lower-left panel presents anomalies in Qnet, and the lower-right panel shows the corresponding anomalies in MLD. The x axis represents lag days (0–10) relative to dust onset.
Figure 9 illustrates the composite anomalies of surface heat flux components, net surface heat flux (Qnet, defined as the sum of net shortwave radiation, net longwave radiation, latent heat flux, and sensible heat flux), and MLD for strong dust events relative to weak dust events over the Northern and Southern Regions. All heat flux components are defined as positive downward (into the ocean).
During strong dust events, the two regions exhibit distinct contrasts in both the magnitude and sign of the surface heat flux anomalies. In the Northern Region, anomalies in both radiative and turbulent heat flux components are relatively modest. Qnet exhibits positive anomalies during lags 0–1 d, followed by slight negative anomalies thereafter. The initial positive Qnet anomaly near dust onset is primarily attributed to enhanced net shortwave radiation on lag 0, likely associated with the reduction in cloud cover during strong dust events mentioned above (Fig. 5), together with a positive latent heat flux anomaly during the first 2 d. The positive latent heat flux anomaly during the first 2 d is consistent with the positive air-sea humidity contrast identified in Fig. 8, which favors anomalous downward moisture flux and is further enhanced by the concurrent increase in wind speed. Net longwave radiation and sensible heat flux also show weak positive anomalies during the early stage, but their magnitudes remain comparatively low. As a result, Qnet over the Northern Region remains positive during the first 2 d following strong dust events, indicating enhanced ocean heat uptake.
In contrast, the Southern Region exhibits substantially larger flux anomalies during strong dust events, dominated by negative upward latent heat flux anomalies during lags 0–2 d. This enhanced latent heat loss is driven by the pronounced negative air–sea humidity contrast during strong dust events (Fig. 8). The overlying air becomes anomalously cold and dry relative to the sea surface, favoring upward moisture and latent heat transfer from the ocean to the atmosphere, with the flux further strengthened by enhanced surface winds. Other flux components contribute comparatively minimally to the overall budget. Consequently, Qnet shows pronounced negative anomalies during the first 2 d, indicating intensified net ocean heat loss under strong dust conditions, before gradually weakening and shifting to weak positive anomalies by lag 3.
The contrasting Qnet anomalies between the two regions are reflected in their respective MLD responses. In the Northern Region, where Qnet anomalies are weak, surface heat flux forcing appears insufficient to substantially alter upper-ocean stratification, and MLD anomalies remain correspondingly small. In the Southern Region, the combination of pronounced surface heat loss and enhanced wind-driven mechanical mixing likely contributes to a reduction in upper-ocean stratification, favoring significant MLD deepening shortly after dust onset under strong dust conditions. To further quantify this relationship between surface heat flux perturbations and mixed-layer variability, the lead–lag cross-correlation between Qnet and MLD anomalies during spring over the 2003–2023 period is examined (Fig. 10).
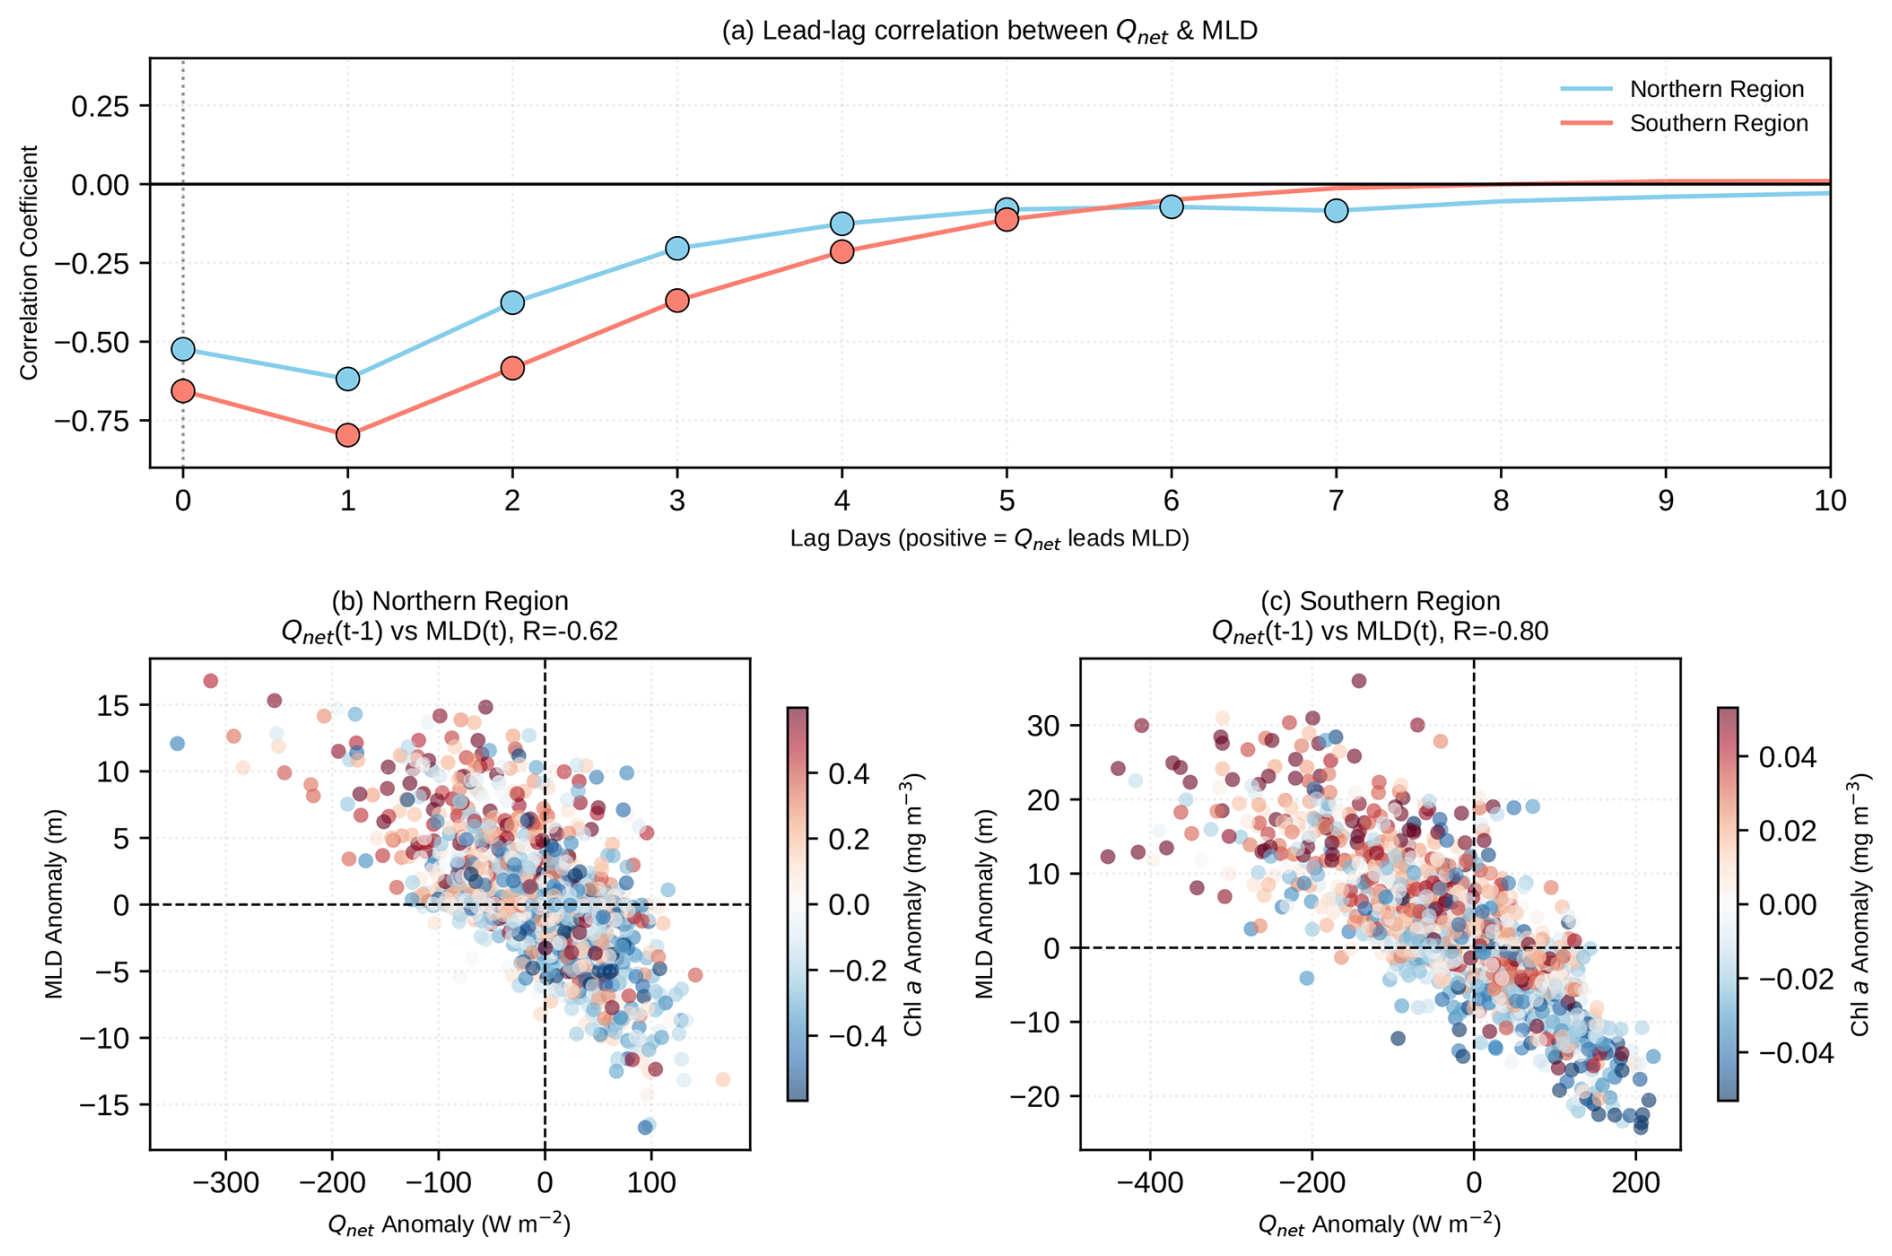
Figure 10Lead–lag relationship between Qnet and MLD anomalies during spring over the 2003–2023 period. The upper panel (a) shows the lead–lag correlation coefficients for the northern (blue) and southern (red) regions, where positive lag indicates that Qnet leads MLD. Filled circles denote correlations that are statistically significant at the 95 % confidence level (p<0.05), and the vertical grey line marks zero lag. The lower panels show scatterplots of Qnet anomalies at day t−1 versus MLD anomalies at day t for the Northern (b) and Southern (c) regions. Marker colors indicate the concurrent Chl a anomaly at day t.
In both regions, correlations remain negligibly small when MLD leads Qnet (negative lags), but become markedly negative when Qnet leads MLD (positive lags). This temporal pattern indicates that variations in surface heat flux tend to precede adjustments in the mixed layer. The negative correlation intensifies rapidly from lag 0, and reaches its minimum at lag 1 d in both regions, demonstrating that the mixed layer responds to surface heat flux perturbations on daily timescales. As shown in the scatterplots, a significant negative linear relationship is evident at this 1 d lag in both regions, with the Southern Region showing a substantially stronger correlation () than the Northern Region (), consistent with the more pronounced dust-associated heat flux anomalies and mixed-layer responses documented above.
The distribution of Chl a anomalies further reveals a coherent biological response to these mixed-layer adjustments. In both regions, mixed-layer deepening events associated with preceding surface heat loss tend to coincide with positive Chl a anomalies, suggesting that deeper mixing facilitates upward nutrient entrainment and promotes phytoplankton biomass accumulation. Conversely, mixed-layer shoaling under conditions of net ocean heat gain is generally associated with weaker or negative Chl a anomalies, consistent with enhanced stratification suppressing nutrient resupply from below. These contrasting biological responses under different heat flux conditions highlight the role of mixed-layer dynamics in linking atmospheric forcing to phytoplankton variability.
In summary, the analyses above reveal a coherent coupling between dust-associated atmospheric forcing, upper-ocean mixing, and biological variability. In the Northern Region, dust events are associated with a slight increase in Qnet during the early stage, leading to a modest shoaling of the mixed layer and a corresponding tendency toward reduced Chl a. In contrast, strong dust events in the Southern Region induce enhanced ocean heat loss, driven by strong wind speed and a negative air–sea humidity gradient, which promotes mixed-layer deepening and favors elevated Chl a concentrations. The lead–lag analysis further indicates that the adjustment of MLD to Qnet forcing occurs on short timescales, typically within about 1 d after the surface heat flux perturbation.
This study examines how synoptic atmospheric forcing accompanying spring dust events influences daily Chl a anomalies in the Chinese marginal seas during 2003–2023, focusing on the physical processes linking dust-associated atmospheric forcing to upper-ocean biological responses. The results reveal pronounced regional contrasts in the Chl a response to strong dust events. The northern marginal seas exhibit an initial Chl a suppression followed by a delayed enhancement, whereas the Southern Region displays an immediate positive response that weakens over subsequent days. These contrasting patterns are associated with distinct air–sea heat flux anomalies driven by dust-related synoptic circulations. Specifically, cyclone-associated warm and moist advection in the Northern Region during strong dust events leads to modest ocean heat gain and mixed-layer shoaling, suppressing Chl a in the early stage, while anticyclone-driven cold and dry advection in the south enhances ocean heat loss and promotes mixed-layer deepening, favoring an immediate biological response. We further show that MLD responds rapidly to surface heat flux perturbations, typically on daily timescales. These findings highlight the role of dust-associated atmospheric forcing in modulating short-term phytoplankton variability through air–sea heat exchange and upper-ocean mixing, and provide an insight into ecosystem responses to East Asian dust activity variability.
Previous studies have demonstrated that dust deposition can stimulate phytoplankton growth through nutrient supply in the Chinese marginal seas, and that the magnitude of this fertilization effect varies with background nutrient conditions, dust particle size and chemical composition, aerosol-induced radiative effects, ocean dynamical processes, and other environmental factors (Jickells et al., 2005; Tan et al., 2011; Tan and Wang, 2014; Liu et al., 2013; Wang et al., 2022). As the present study focuses on synoptic-scale atmospheric forcing and air–sea heat exchange, these biogeochemical processes are not explicitly quantified, though their potential contributions to the observed regional contrasts in Chl a responses cannot be excluded. Future work incorporating coupled physical–biogeochemical model simulations will be essential to better disentangle and quantify the relative contributions of atmospheric forcing, nutrient deposition, and ocean dynamics to phytoplankton variability in the Chinese marginal seas.
Several limitations of this study should be acknowledged. It should be noted that the Chl a data used in this study are derived from the OCNET reconstructed product, which provides continuous daily coverage and substantially alleviates the extensive data gaps in satellite observations over the Chinese marginal seas, where missing rates often exceed 80 % in nearshore waters (Fig. S1 in the Supplement). Based on the collocated daily satellite observations available for comparison (generally fewer than 300 samples per grid cell), OCNET reasonably reproduces both the climatological spatial distribution and the observed variability of Chl a over the study region, although the agreement is relatively lower in the optically more complex northern coastal waters than in the southern region (Figs. S1–S2). This may reflect the greater uncertainty associated with reconstructing Chl a under challenging coastal optical conditions. In addition to this uncertainty, the comparison further indicates that OCNET exhibits slightly reduced variability, with lower standard deviations and regression slopes below unity than the satellite observations (Fig. S2), suggesting a modest smoothing of localized short-term Chl a variability. Such behavior is a common characteristic of machine-learning-based gap-filling reconstruction products, which infer missing observations from surrounding spatial and temporal information. Therefore, uncertainties associated with the reconstructed product should be considered when interpreting localized and short-term Chl a variability, particularly in optically complex coastal waters. Similarly, reanalysis-derived estimates of surface heat fluxes, MLD, and DOD are also subject to uncertainties associated with model physics and data assimilation, which may affect the quantitative interpretation of the results. Future work integrating high-quality in situ observations with coupled physical–biogeochemical model simulations will be essential to further validate the proposed mechanisms, better quantify the relative contributions of synoptic atmospheric forcing, nutrient supply, and ocean dynamics, and further reduce uncertainties in reconstructed Chl a fields over the Chinese marginal seas.
The code used in this study is available from the corresponding author upon request.
All datasets used in this study are publicly available and can be freely downloaded from the respective repositories. The daily chlorophyll a concentration dataset with a 0.25° × 0.25° resolution, generated using the OCNET model, is provided by Hong et al. (2025) and is available at https://doi.org/10.5281/zenodo.17377256 (Hong, 2025). Dust, meteorological fields, and cloud and heat-related data were obtained from the Modern-Era Retrospective Analysis for Research and Applications, Version 2 (MERRA-2), provided by NASA’s Global Modeling and Assimilation Office (GMAO), specifically from the Aerosol Diagnostics (https://doi.org/10.5067/KLICLTZ8EM9D, GMAO, 2015a), Single-Level Diagnostics (https://doi.org/10.5067/VJAFPLI1CSIV, GMAO, 2015b), and Radiation Diagnostics (https://doi.org/10.5067/Q9QMY5PBNV1T, GMAO, 2015c) products, respectively. Mixed layer depth data were sourced from the Copernicus Marine Service (CMEMS) Global Ocean Physics Reanalysis product (also known as GLORYS12V1), which is openly accessible at https://data.marine.copernicus.eu/product/GLOBAL_MULTIYEAR_PHY_001_030/ (last access: 17 December 2025). Chlorophyll a satellite observations are available from the GlobColour site (https://hermes.acri.fr/, last access: 6 July 2026).
The supplement related to this article is available online at https://doi.org/10.5194/bg-23-5697-2026-supplement.
JHH and RT conceived the idea and designed the study. JHH and RT conducted the analysis, wrote the initial draft of the manuscript, and produced all figures. RT guided the research and oversaw the project. JPY reviewed and improved the draft. XKZ, SSW, and HS assisted with data curation, including data collection and preprocessing. HYX, SYS, and QSZ supported literature review and background research.
The contact author has declared that none of the authors has any competing interests.
Publisher's note: Copernicus Publications remains neutral with regard to jurisdictional claims made in the text, published maps, institutional affiliations, or any other geographical representation in this paper. The authors bear the ultimate responsibility for providing appropriate place names. Views expressed in the text are those of the authors and do not necessarily reflect the views of the publisher.
We thank Hong et al. (2025) for providing the daily chlorophyll a concentration dataset with a 0.25° × 0.25° resolution, generated using the OCNET model. We gratefully acknowledge the NASA Global Modeling and Assimilation Office (GMAO) for providing the MERRA-2 reanalysis dataset. We thank the Copernicus Marine Service for providing the Global Ocean Biogeochemistry Analysis data. We thank Jong-Seong Kug and Dr. Chao Liu from Seoul National University for helpful suggestions. The author gratefully acknowledges the support provided by the China Scholarship Council (CSC, grant no. 202504180006).
This work was supported by the Applied Technology Engineering Center of Fujian Provincial Higher Education for Marine Resource Protection and Ecological Governance (grant no. 202404); the Scientific Research Foundation of the Third Institute of Oceanography, MNR (grant no. 2025001) and Science Foundation of the Fujian Province, China (grant no. 2024J08098).
This paper was edited by Emilio Marañón and reviewed by two anonymous referees.
Chen, Y. and Tang, D.: Remote Sensing Analysis of Impact of Typhoon on Environment in the Sea Area South of Hainan Island, Procedia Environ. Sci., 10, 1621–1629, https://doi.org/10.1016/j.proenv.2011.09.256, 2011.
Chu, Q., Liu, Y., Shi, J., Zhang, C., Gong, X., Yao, X., Guo, X., and Gao, H.: Promotion Effect of Asian Dust on Phytoplankton Growth and Potential Dissolved Organic Phosphorus Utilization in the South China Sea, J. Geophys. Res.-Biogeo., 123, 1101–1116, https://doi.org/10.1002/2017jg004088, 2018.
Chuang, M.-T., Chiang, P.-C., Chan, C.-C., Wang, C.-F., Chang, E. E., and Lee, C.-T.: The effects of synoptical weather pattern and complex terrain on the formation of aerosol events in the Greater Taipei area, Sci. Total Environ., 399, 128–146, https://doi.org/10.1016/j.scitotenv.2008.01.051, 2008a.
Chuang, M.-T., Fu, J. S., Jang, C. J., Chan, C.-C., Ni, P.-C., and Lee, C.-T.: Simulation of long-range transport aerosols from the Asian Continent to Taiwan by a Southward Asian high-pressure system, Sci. Total Environ., 406, 168–179, https://doi.org/10.1016/j.scitotenv.2008.07.003, 2008b.
Du, S., Ariful Islam, G. M., Xiang, R., and Yang, X.: The Dust Deposition Process and Biogeochemical Impacts in the Northern South China Sea, Asia-Pac. J. Atmos. Sci., 57, 77–87, https://doi.org/10.1007/s13143-019-00171-4, 2020.
Gao, Y., Arimoto, R., Duce, R. A., Zhang, X. Y., Zhang, G. Y., An, Z. S., Chen, L. Q., Zhou, M. Y., and Gu, D. Y.: Temporal and spatial distributions of dust and its deposition to the China Sea, Tellus B, 49, 172, https://doi.org/10.3402/tellusb.v49i2.15960, 1997.
Global Modeling and Assimilation Office (GMAO): tavg1_2d_aer_Nx: MERRA-2 2D, 1-hourly, time-averaged, single-level, assimilation, aerosol diagnostics, version 5.12.4, Greenbelt, MD, USA, Goddard Earth Sciences Data and Information Services Center (GES DISC) [data set], https://doi.org/10.5067/KLICLTZ8EM9D, 2015a.
Global Modeling and Assimilation Office (GMAO): tavg1_2d_slv_Nx: MERRA-2 2D, 1-hourly, time-averaged, single-level, assimilation, single-level diagnostics, version 5.12.4, Greenbelt, MD, USA, Goddard Earth Sciences Data and Information Services Center (GES DISC) [data set], https://doi.org/10.5067/VJAFPLI1CSIV, 2015b.
Global Modeling and Assimilation Office (GMAO): tavg1_2d_rad_Nx: MERRA-2 2D, 1-hourly, time-averaged, single-level, assimilation, radiation diagnostics, version 5.12.4, Greenbelt, MD, USA, Goddard Earth Sciences Data and Information Services Center (GES DISC) [data set], https://doi.org/10.5067/Q9QMY5PBNV1T, 2015c.
Gui, K., Yao, W., Che, H., An, L., Zheng, Y., Li, L., Zhao, H., Zhang, L., Zhong, J., Wang, Y., and Zhang, X.: Record-breaking dust loading during two mega dust storm events over northern China in March 2021: aerosol optical and radiative properties and meteorological drivers, Atmos. Chem. Phys., 22, 7905–7932, https://doi.org/10.5194/acp-22-7905-2022, 2022.
Guo, C., Yu, J., Ho, T.-Y., Wang, L., Song, S., Kong, L., and Liu, H.: Dynamics of phytoplankton community structure in the South China Sea in response to the East Asian aerosol input, Biogeosciences, 9, 1519–1536, https://doi.org/10.5194/bg-9-1519-2012, 2012.
He, T., Li, J., Xie, L., and Zheng, Q.: Response of chlorophyll-a to rainfall event in the basin of the South China sea: Statistical analysis, Marine Environ. Res., 199, 106576, https://doi.org/10.1016/j.marenvres.2024.106576, 2024.
Hong, Z.: OCNET global daily Chlorophyll-a products (Version V6), Zenodo [data set], https://doi.org/10.5281/zenodo.17377256, 2025.
Hong, Z., Long, D., Li, X., Wang, Y., Zhang, J., Hamouda, M. A., and Mohamed, M. M.: A global daily gap-filled chlorophyll-a dataset in open oceans during 2001–2021 from multisource information using convolutional neural networks, Earth Syst. Sci. Data, 15, 5281–5300, https://doi.org/10.5194/essd-15-5281-2023, 2023.
Hong, Z., Long, D., Shan, K., Zhang, J.-M., Woolway, R. I., Liu, M., Mann, M. E., and Fang, H.: Declining ocean greenness and phytoplankton blooms in low to mid-latitudes under a warming climate, Sci. Adv., 11, https://doi.org/10.1126/sciadv.adx4857, 2025.
Hsu, S.-C., Shaw Chen, L., Arimoto, R., Liu, T.-H., Huang, Y.-H., Tsai, F., Lin, F.-J., and Kao, S. J.: Dust deposition to the East China Sea and its biogeochemical implications, J. Geophys. Res., 114, https://doi.org/10.1029/2008jd011223, 2009.
Hsu, S. C., Tsai, F., Lin, F. J., Chen, W. N., Shiah, F. K., Huang, J. C., Chan, C. Y., Chen, C. C., Liu, T. H., Chen, H. Y., Tseng, C. M., Hung, G. W., Huang, C. H., Lin, S. H., and Huang, Y. T.: A super Asian dust storm over the East and South China Seas: Disproportionate dust deposition, J. Geophys. Res.-Atmos., 118, 7169–7181, https://doi.org/10.1002/jgrd.50405, 2013.
Hung, C.-C., Gong, G.-C., Chung, W.-C., Kuo, W.-T., and Lin, F.-C.: Enhancement of particulate organic carbon export flux induced by atmospheric forcing in the subtropical oligotrophic northwest Pacific Ocean, Marine Chem., 113, 19–24, https://doi.org/10.1016/j.marchem.2008.11.004, 2009.
Jickells, T. D., An, Z. S., Andersen, K. K., Baker, A. R., Bergametti, G., Brooks, N., Cao, J. J., Boyd, P. W., Duce, R. A., Hunter, K. A., Kawahata, H., Kubilay, N., laRoche, J., Liss, P. S., Mahowald, N., Prospero, J. M., Ridgwell, A. J., Tegen, I., and Torres, R.: Global Iron Connections Between Desert Dust, Ocean Biogeochemistry, and Climate, Science, 308, 67–71, https://doi.org/10.1126/science.1105959, 2005.
Kim, Y. S., Jang, C. J., Jeong, J.-Y., and Shim, J.-S.: Daily to Seasonal Variability of the Mixed Layer Depth in the Central Yellow Sea: Effects of Atmospheric Forcing, J. Coast. Res., 85, 576–580, https://doi.org/10.2112/si85-116.1, 2018.
Kok, J. F., Adebiyi, A. A., Albani, S., Balkanski, Y., Checa-Garcia, R., Chin, M., Colarco, P. R., Hamilton, D. S., Huang, Y., Ito, A., Klose, M., Li, L., Mahowald, N. M., Miller, R. L., Obiso, V., Pérez García-Pando, C., Rocha-Lima, A., and Wan, J. S.: Contribution of the world's main dust source regions to the global cycle of desert dust, Atmos. Chem. Phys., 21, 8169–8193, https://doi.org/10.5194/acp-21-8169-2021, 2021.
Kok, J. F., Storelvmo, T., Karydis, V. A., Adebiyi, A. A., Mahowald, N. M., Evan, A. T., He, C., and Leung, D. M.: Mineral dust aerosol impacts on global climate and climate change, Nat. Rev. Earth Environ., 4, 71–86, https://doi.org/10.1038/s43017-022-00379-5, 2023.
Kong, S. S.-K., Ravindra Babu, S., Wang, S.-H., Griffith, S. M., Chang, J. H.-W., Chuang, M.-T., Sheu, G.-R., and Lin, N.-H.: Expanding the simulation of East Asian super dust storms: physical transport mechanisms impacting the western Pacific, Atmos. Chem. Phys., 24, 1041–1058, https://doi.org/10.5194/acp-24-1041-2024, 2024.
Laurent, B., Marticorena, B., Bergametti, G., and Mei, F.: Modeling mineral dust emissions from Chinese and Mongolian deserts, Glob. Planet. Change, 52, 121–141, https://doi.org/10.1016/j.gloplacha.2006.02.012, 2006.
Lin, D., Huang, W., Yang, Z., He, X., Qiu, T., Wang, B., and Wright, J. S.: Impacts of Wintertime Extratropical Cyclones on Temperature and Precipitation Over Northeastern China During 1979–2016, J. Geophys. Res.-Atmos., 124, 1514–1536, https://doi.org/10.1029/2018jd029174, 2019.
Lin, I. I., Chen, J.-P., George, T. F. W., Huang, C.-W. L., and Lien, C.-D.: Aerosol input to the South China Sea: Results from the MODerate Resolution Imaging Spectro-radiometer, the Quick Scatterometer, and the Measurements of Pollution in the Troposphere Sensor, Deep-Sea Res. Pt. II, 54, 1589–1601, https://doi.org/10.1016/j.dsr2.2007.05.013, 2007.
Lin, I. I., Lien, C.-C., Chien, C.-Y., Huang, C.-W., and Chen, J.-P.: Aerosol impact on the South China Sea biogeochemistry: An early assessment from remote sensing, Geophys. Res. Lett., 36, https://doi.org/10.1029/2009gl037484, 2009.
Liu, K. K., Chao, S. Y., Shaw, P. T., Gong, G. C., Chen, C. C., and Tang, T. Y.: Monsoon-forced chlorophyll distribution and primary production in the South China Sea: observations and a numerical study, Deep-Sea Res. Pt. I, 49, 1387–1412, https://doi.org/10.1016/s0967-0637(02)00035-3, 2002.
Liu, Y., Zhang, T. R., Shi, J. H., Gao, H. W., and Yao, X. H.: Responses of chlorophyll a to added nutrients, Asian dust, and rainwater in an oligotrophic zone of the Yellow Sea: Implications for promotion and inhibition effects in an incubation experiment, J. Geophys. Res.-Biogeo., 118, 1763–1772, https://doi.org/10.1002/2013jg002329, 2013.
Luo, C., Wang, W., Sheng, L., Zhou, Y., Hu, Z., Qu, W., Li, X., and Hai, S.: Influence of polluted dust on chlorophyll-a concentration and particulate organic carbon in the subarctic North Pacific Ocean based on satellite observation and the WRF-Chem simulation, Atmos. Res., 236, 104812, https://doi.org/10.1016/j.atmosres.2019.104812, 2020.
Lv, T., Liu, D., Zhou, P., Lin, L., Wang, Y., and Wang, Y.: The coastal front modulates the timing and magnitude of spring phytoplankton bloom in the Yellow Sea, Water Res., 220, 118669, https://doi.org/10.1016/j.watres.2022.118669, 2022.
Mahowald, N. M., Baker, A. R., Bergametti, G., Brooks, N., Duce, R. A., Jickells, T. D., Kubilay, N., Prospero, J. M., and Tegen, I.: Atmospheric global dust cycle and iron inputs to the ocean, Glob. Biogeochem. Cycles, 19, https://doi.org/10.1029/2004gb002402, 2005.
Mallet, M., Chami, M., Gentili, B., Sempéré, R., and Dubuisson, P.: Impact of sea-surface dust radiative forcing on the oceanic primary production: A 1D modeling approach applied to the West African coastal waters, Geophys. Res. Lett., 36, https://doi.org/10.1029/2009gl039053, 2009.
Meng, X., Yao, F., Zhang, J., Liu, Q., Liu, Q., Shi, L., and Zhang, D.: Impact of dust deposition on phytoplankton biomass in the Northwestern Pacific: A long-term study from 1998 to 2020, Sci. Total Environ., 813, 152536, https://doi.org/10.1016/j.scitotenv.2021.152536, 2021.
Mu, F. and Fiedler, S.: How much do atmospheric depressions and Mongolian cyclones contribute to spring dust activities in East Asia?, npj Climate and Atmospheric Science, 8, https://doi.org/10.1038/s41612-025-00929-w, 2025.
Murray, F. W.: On the Computation of Saturation Vapor Pressure, J. Appl. Meteorol., 6, 203–204, https://doi.org/10.1175/1520-0450(1967)006<0203:otcosv>2.0.co;2, 1967.
Oh, H., Chu, J.-E., Min, Y., Kim, G.-U., Jeong, J., Jeong, J., Lee, S., Lee, J., Jeong, J.-Y., and Jeong, J.-Y.: Late-arriving 2023 summer marine heatwave in the East China Sea and implications for global warming, npj Climate and Atmospheric Science, 7, https://doi.org/10.1038/s41612-024-00846-4, 2024.
Pyper, B. J. and Peterman, R. M.: Comparison of Methods to Account for Autocorrelation in Correlation Analyses of Fish Data, Can. J. Fish. Aquat. Sci., 55, 2127–2140, https://doi.org/10.1139/f98-104, 1998.
Qian, W., Leung, J. C. H., Ren, J., Du, J., Feng, Y., and Zhang, B.: Anomaly Based Synoptic Analysis and Model Prediction of Six Dust Storms Moving From Mongolia to Northern China in Spring 2021, J. Geophys. Res.-Atmos., 127, https://doi.org/10.1029/2021jd036272, 2022.
Seinfeld, J. H., Carmichael, G. R., Arimoto, R., Conant, W. C., Brechtel, F. J., Bates, T. S., Cahill, T. A., Clarke, A. D., Doherty, S. J., Flatau, P. J., Huebert, B. J., Kim, J., Markowicz, K. M., Quinn, P. K., Russell, L. M., Russell, P. B., Shimizu, A., Shinozuka, Y., Song, C. H., Tang, Y., Uno, I., Vogelmann, A. M., Weber, R. J., Woo, J.-H., and Zhang, X. Y.: ACE-ASIA: Regional Climatic and Atmospheric Chemical Effects of Asian Dust and Pollution, B. Am. Meteorol. Soc., 85, 367–380, https://doi.org/10.1175/bams-85-3-367, 2004.
Shao, Y., Wyrwoll, K.-H., Chappell, A., Huang, J., Lin, Z., McTainsh, G. H., Mikami, M., Tanaka, T. Y., Wang, X., and Yoon, S.: Dust cycle: An emerging core theme in Earth system science, Aeolian Res., 2, 181–204, https://doi.org/10.1016/j.aeolia.2011.02.001, 2011.
Shen, C., Zhao, H., Chen, F., and Xiao, H.: The Distribution of Aerosols and Their Impacts on Chlorophyll‐a Distribution in the South China Sea, J. Geophys. Res.-Biogeo., 125, https://doi.org/10.1029/2019jg005490, 2020.
Shi, J., Gao, H., Zhang, J., Che, H., Ren, J., Liu, C., Liu, Y., and Yao, X.: Examination of causative link between a spring bloom and dry/wet deposition of Asian dust in the Yellow Sea, China, 117, https://doi.org/10.1029/2012jd017983, 2012.
Shi, J., Liu, Y., Mao, X., Guo, X., Wei, H., and Gao, H.: Interannual variation of spring phytoplankton bloom and response to turbulent energy generated by atmospheric forcing in the central Southern Yellow Sea of China: Satellite observations and numerical model study, Cont. Shelf Res., 143, 257–270, https://doi.org/10.1016/j.csr.2016.06.008, 2017.
Takemi, T. and Seino, N.: Dust storms and cyclone tracks over the arid regions in east Asia in spring, J. Geophys. Res.-Atmos., 110, https://doi.org/10.1029/2004JD004698, 2005.
Tan, S., Li, J., Gao, H., Wang, H., Che, H., and Chen, B.: Satellite-Observed Transport of Dust to the East China Sea and the North Pacific Subtropical Gyre: Contribution of Dust to the Increase in Chlorophyll during Spring 2010, Atmosphere, 7, 152, https://doi.org/10.3390/atmos7110152, 2016.
Tan, S., Li, J., Che, H., Chen, B., and Wang, H.: Transport of East Asian dust storms to the marginal seas of China and the southern North Pacific in spring 2010, Atmos. Environ., 148, 316–328, https://doi.org/10.1016/j.atmosenv.2016.10.054, 2017.
Tan, S.-C. and Wang, H.: The transport and deposition of dust and its impact on phytoplankton growth in the Yellow Sea, Atmos. Environ., 99, 491–499, https://doi.org/10.1016/j.atmosenv.2014.10.016, 2014.
Tan, S.-C., Shi, G.-Y., Shi, J.-H., Gao, H.-W., and Yao, X.: Correlation of Asian dust with chlorophyll and primary productivity in the coastal seas of China during the period from 1998 to 2008, J. Geophys. Res., 116, https://doi.org/10.1029/2010jg001456, 2011.
Tegen, I., Lacis, A. A., and Fung, I.: The influence on climate forcing of mineral aerosols from disturbed soils, Nature, 380, 419–422, https://doi.org/10.1038/380419a0, 1996.
Uno, I., Eguchi, K., Yumimoto, K., Takemura, T., Shimizu, A., Uematsu, M., Liu, Z., Wang, Z., Hara, Y., and Sugimoto, N.: Asian dust transported one full circuit around the globe, Nat. Geosci., 2, 557–560, https://doi.org/10.1038/ngeo583, 2009.
Wang, S., Yu, Y., Zhang, X.-X., Lu, H., Zhang, X.-Y., and Xu, Z.: Weakened dust activity over China and Mongolia from 2001 to 2020 associated with climate change and land-use management, Environ. Res. Lett., 16, 124056, https://doi.org/10.1088/1748-9326/ac3b79, 2021.
Wang, S.-H., Hsu, N. C., Tsay, S.-C., Lin, N.-H., Sayer, A. M., Huang, S.-J., and Lau, W. K. M.: Can Asian dust trigger phytoplankton blooms in the oligotrophic northern South China Sea?, Geophys. Res. Lett., 39, https://doi.org/10.1029/2011gl050415, 2012.
Wang, W., He, Z., Hai, S., Sheng, L., Han, Y., and Zhou, Y.: Dust Aerosol's Deposition and its Effects on Chlorophyll-a Concentrations Based on Multi-Sensor Satellite Observations and Model Simulations: A Case Study, Front. Environ. Sci., 10, https://doi.org/10.3389/fenvs.2022.875365, 2022.
Wang, Y.: Composite of Typhoon‐Induced Sea Surface Temperature and Chlorophyll‐a Responses in the South China Sea, J. Geophys. Res.-Oceans, 125, https://doi.org/10.1029/2020jc016243, 2020.
Wu, C., Lin, Z., Shao, Y., Liu, X., and Li, Y.: Drivers of recent decline in dust activity over East Asia, Nat. Commun., 13, https://doi.org/10.1038/s41467-022-34823-3, 2022.
Xu, Y., Wu, Y., Xiu, P., Ge, J., and Zhang, J.: Unraveling environmental drivers of chlorophyll seasonal and interannual variability in the East China Sea, Front. Marine Sci., 9, https://doi.org/10.3389/fmars.2022.951395, 2022.
Xue, Y.-B., Zhang, X.-X., Lei, J.-Q., Li, S.-Y., Liu, L.-Y., Wang, Z.-F., Tian, W.-J., Tang, X., and Chen, X.-S.: East Asian dust storm in March 2021: Perspective views from ground observation, satellite measurement and numerical simulation, Atmos. Environ., 350, 121152, https://doi.org/10.1016/j.atmosenv.2025.121152, 2025.
Yan, Y., Chai, F., Xue, H., and Wang, G.: Record‐Breaking Sea Surface Temperatures in the Yellow and East China Seas, J. Geophys. Res.-Oceans, 125, https://doi.org/10.1029/2019jc015883, 2020.
Yin, Z., Wan, Y., Zhang, Y., and Wang, H.: Why super sandstorm 2021 in North China, Natl. Sci. Rev., 9, https://doi.org/10.1093/nsr/nwab165, 2021.
Yin, Z., Huo, Q., Hu, D., Huang, Y., and Wang, H.: Why record-breaking gale and nationwide dust in China in April 2025, Sci. Bull., https://doi.org/10.1016/j.scib.2025.11.054, 2025.
Yu, Z., Jang, M., Kim, S., Bae, C., Koo, B., Beardsley, R., Park, J., Chang, L. S., Lee, H. C., Lim, Y.-K., and Cho, J. H.: Simulating the Impact of Long-Range-Transported Asian Mineral Dust on the Formation of Sulfate and Nitrate during the KORUS-AQ Campaign, ACS Earth and Space Chemistry, 4, 1039–1049, https://doi.org/10.1021/acsearthspacechem.0c00074, 2020.
Yumimoto, K. and Takemura, T.: Long-term inverse modeling of Asian dust: Interannual variations of its emission, transport, deposition, and radiative forcing, J. Geophys. Res.-Atmos., 120, 1582–1607, https://doi.org/10.1002/2014JD022390, 2015.
Zhang, C., Gao, H., Yao, X., Shi, Z., Shi, J., Yu, Y., Meng, L., and Guo, X.: Phytoplankton growth response to Asian dust addition in the northwest Pacific Ocean versus the Yellow Sea, Biogeosciences, 15, 749–765, https://doi.org/10.5194/bg-15-749-2018, 2018.
Zhang, N., Lan, J., and Dong, C.: Subsurface Heatwaves and Cold Spells in the South China Sea Regulated by ENSO: Role of the South China Sea Throughflow, Geophys. Res. Lett., 52, https://doi.org/10.1029/2025gl114692, 2025.
Zhang, T., Zheng, M., Sun, X., Chen, H., Wang, Y., Fan, X., Pan, Y., Quan, J., Liu, J., Wang, Y., Lyu, D., Chen, S., Zhu, T., and Chai, F.: Environmental impacts of three Asian dust events in the northern China and the northwestern Pacific in spring 2021, Sci. Total Environ., 859, 160230, https://doi.org/10.1016/j.scitotenv.2022.160230, 2023.
Zhang, X. Y., Arimoto, R., and An, Z. S.: Dust emission from Chinese desert sources linked to variations in atmospheric circulation, J. Geophys. Res.-Atmos., 102, 28041–28047, https://doi.org/10.1029/97jd02300, 1997.
Zhao, H., Pan, J., Han, G., Devlin, A. T., Zhang, S., and Hou, Y.: Effect of a fast-moving tropical storm Washi on phytoplankton in the northwestern South China Sea, J. Geophys. Res.-Oceans, 122, 3404–3416, https://doi.org/10.1002/2016jc012286, 2017.
Zhu, C., Wang, B., and Qian, W.: Why do dust storms decrease in northern China concurrently with the recent global warming?, Geophys. Res. Lett., 35, https://doi.org/10.1029/2008gl034886, 2008.
Zou, P., Ma, X., Tian, R., Zhao, J., Yang, T., and Ku, Y.: Exploring the mechanisms of dust emission and transport based on observations and GEOS-Chem simulations, Atmos. Chem. Phys., 26, 7485–7501, https://doi.org/10.5194/acp-26-7485-2026, 2026.