the Creative Commons Attribution 4.0 License.
the Creative Commons Attribution 4.0 License.
 | 05 Feb 2026
Monthly element ∕ Ca trends and inter chamber variability in two planktic Foraminifera species: Globigerinoides ruber albus and Turborotalita clarkei from a hypersaline oligotrophic sea
Noy Levy
Adi Torfstein
Ralf Schiebel
Natalie Chernihovsky
Klaus Peter Jochum
Ulrike Weis
Brigitte Stoll
Gerald H. Haug
Environmental and biological factors influence the trace element composition (element Ca) of planktic foraminifer shells. Consequently, the element Ca measured in these shells (tests) are utilized as proxies to reconstruct past oceanic and climatic conditions. As single shell analyses are increasingly used in paleoceanographic research it is important to understand how proxy systematics change between species, individuals of the same species in a given population, and among chambers of a single individual during its life cycle. Here we present a time series of the chemical composition of planktic foraminifers retrieved using sediment traps between June 2014 and June 2015 at the northern part of the Gulf of Aqaba (aka Gulf of Eilat). Laser ablation ICP-MS element Ca measurements were performed on single shells and chambers of Globigerinoides ruber albus and Turborotalita clarkei, collected monthly from five water depths (120, 220, 350, 450, and 570 m). Sediment trap samples were paired with corresponding data on water column hydrography and chemistry. Pooled means of measured element Ca display species-specific and element-specific behavior, with generally higher values for T. clarkei phenotypes (“big” and “encrusted”) in comparison to G. ruber albus. Some element Ca values measured in water column specimens, such as Al Ca, vary significantly from core-top specimens. A unique finding is a prominent increase in element Ca around March-April 2015, during maximum water column mixing, mostly apparent in T. clarkei and to a lesser extent in G. ruber albus. This spring element Ca increase is observed in most measured elements and is further associated with an increase in inter-chamber variability (ICV). Inter-chamber element Ca patterns show element enrichment/depletion in the most recently precipitated (final, F0) chamber in comparison to the older chambers (penultimate (F-1), antepenultimate (F-2), etc.). Element/Ca in F0 may also be less sensitive to surrounding environmental conditions. For example, the Mg Ca of the F-1 and F-2 chambers of G. ruber albus display a positive relationship with mixed layer temperatures while F0 does not. To overcome this effect, we suggest using pooled means from non-F0 fractions as environmental records and paleo proxies.
These results highlight the complexity of proxy systematics that arise from the variability in element Ca measured among different species and between chambers, caused by ecological conditions and other processes in the water column including physical, chemical, and biological effects.
- Article
(9508 KB) - Full-text XML
-
Supplement
(2716 KB) - BibTeX
- EndNote


1.1 Planktic foraminifera as traces of the past environment
Planktic Foraminifera (PF) shells are useful archives for studying the history of Earth's climate and oceans, as their calcareous shells reflect the environmental conditions during their formation (Berggren et al., 1995; Rosenthal, 2007; Schiebel and Hemleben, 2017; Kucera, 2007; Katz et al., 2010; Gupta, 1999; Davis et al., 2020). Various element Ca measured in PF tests have been linked to ambient seawater temperature (e.g., Mg Ca; Nürnberg et al., 1996; Rosenthal et al., 2004), salinity (e.g., Na Ca; Mezger et al., 2016; Gray et al., 2023), the carbonate system (e.g., B Ca; Babila et al., 2014; Henehan et al., 2015; Haynes et al., 2019), productivity (e.g., Ba Ca; Fritz-Endres et al., 2022), and chemical weathering (e.g., Ti Ca; Amaglio et al., 2025). In the past, the use of these proxies relied on bulk analysis of the entire shell or multiple shells. However, although first attempts in single chamber LA-ICP-MS started back in 2003 (Eggins et al., 2003, Reichart et al., 2003), only in recent years there has been an increase in the use of high-resolution analytical techniques, such as Laser Ablation (LA) ICP-MS and electron microprobe analyses in paleoceanographic studies (Davis et al., 2020). The element Ca measurements of single specimens (Individual Foraminifer Analysis, IFA) revealed high variability between individuals of the same population as well as significant intra-shell variability (i.e., inter chamber variability, ICV) (Sadekov et al., 2008; Fehrenbacher et al., 2020; Hupp and Fehrenbacher, 2024; Fischer et al., 2024; Davis et al., 2020, and references therein). Despite the analytical advancements, the variations in the geochemical signatures of PF shells are poorly understood and while they are likely related to the life cycles and reproductive modes of many species there are still knowledge gaps in our understanding of proxy systematics in single shell and single chamber analyses of PF species. There is also a lack of detailed description and understanding of element Ca systematics in description of small-sized species such as T. clarkei, which have been largely overlooked in previous studies despite their significant contribution to the settling PF tests (export flux), as observed in the northern Red Sea (Chernihovsky et al., 2018). Furthermore, specific marine regions, such as in oligotrophic, subtropical basins, particularly in deep-water environments, are not well-established in terms of their spatial and temporal dynamics (Schiebel and Hemleben, 2017).
1.2 Planktic Foraminifer population dynamics in The Gulf of Aqaba
The Gulf of Aqaba (GOA) is considered an open ocean proxy environment (Chase et al., 2011). It is an oligotrophic basin where the main lithogenic flux is derived from dust. During summer (April–September), a ∼ 200 m deep thermocline separates nutrient-depleted surface waters (∼ 25 °C) from the nutrient-rich deep layer (∼ 21 °C). In winter-spring (October–April), the thermocline gradually erodes due to surface cooling (Fig. 1a and e; Meeder et al., 2012), which can lead to the development of a deep mixed layer. Although the depth of the mixed layer varies annually with climatic conditions, the long-term mean mixing depth is approximately 300–400 m, and deep mixing can extend to the sea floor while it typically reaches maximum depth by late March. The regional terrestrial climate is hyper-arid (mean annual rainfall < 30 mm) and the main sources for terrigenous material to the GOA are dust storms originating from the Sahara and Arabian Deserts, as well as rare localized floods (Katz et al., 2015; Chase et al., 2011; Ganor and Foner, 2001; Torfstein et al., 2017).
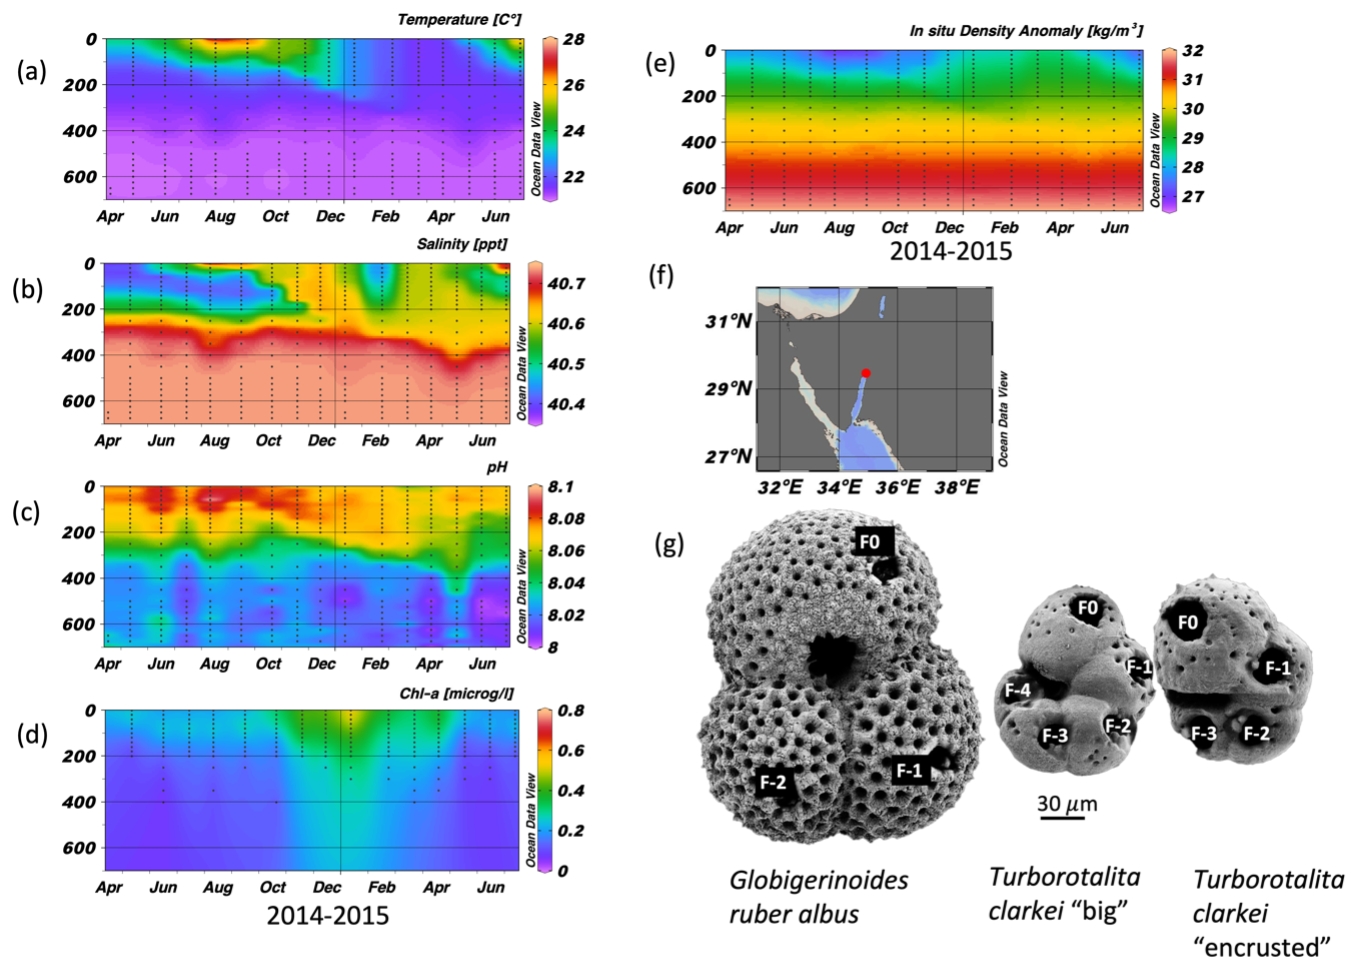
Figure 1Time series of temperature (a), salinity (b), pH (c), Chlorophyll a concentration (d), and in situ density anomaly (e), measured in the Gulf of Aqaba between April 2014 and June 2015 by the National Monitoring Program (NMP, Shaked and Genin, 2017). y-axis is depth (m); A map of the Gulf of Aqaba (f); and (g) scanning electron micrographs of the three morpho-species (exhibiting ablation holes in each chamber (labelled), from Levy et al., 2023).
Planktic foraminifera fluxes in the GOA demonstrate strong seasonality, with low fluxes during the summer months, gradually increasing during the autumn-winter, coeval with decreasing sea-surface temperatures and deepening of the mixed layer in the GOA that drives advection of nutrient-replete subsurface waters into the mixed layer (Fig. 2). This in turn triggers an increase in primary productivity, expressed by enhanced chlorophyll a concentrations and higher PF fluxes (Chernihovsky et al., 2018, 2020).
Spinose species constitute the majority of the PF assemblage. The smaller size fraction, 63–125 µm, is 86 % from the total flux and is dominated by T. clarkei. The 125–500 µm size-fraction (∼ 13 %) is dominated by the species G. ruber albus, while less than 1 % of the shells are in the range of 500–1000 µm, dominated by O. universa (Chernihovsky et al., 2018).
Globigerinoides ruber albus and T. clarkei inhabit different dwelling-depths and have different life strategies. Globigerinoides ruber albus is a surface dweller and is photo-symbiont bearing, while T. clarkei tends to dwell below the mixed layer depth and is barren of photo-symbionts (Rebotim et al., 2017; Schiebel and Hemleben, 2017; Levy et al., 2023). Furthermore, it has been suggested that G. ruber albus and T. clarkei do not share the same dietary preferences: G. ruber albus being more carnivorous than the detritivorous T. clarkei which may forage at the exported matter below the pycnocline (Schiebel and Hemleben, 2017). In the GOA, T. clarkei has two phenotypes: T. clarkei “big”, in which all of its test chambers are fully recognizable and their surface is relatively smooth, and T. clarkei “encrusted” with a less smooth shell surface and is smaller than the “big” type (Levy et al., 2023).
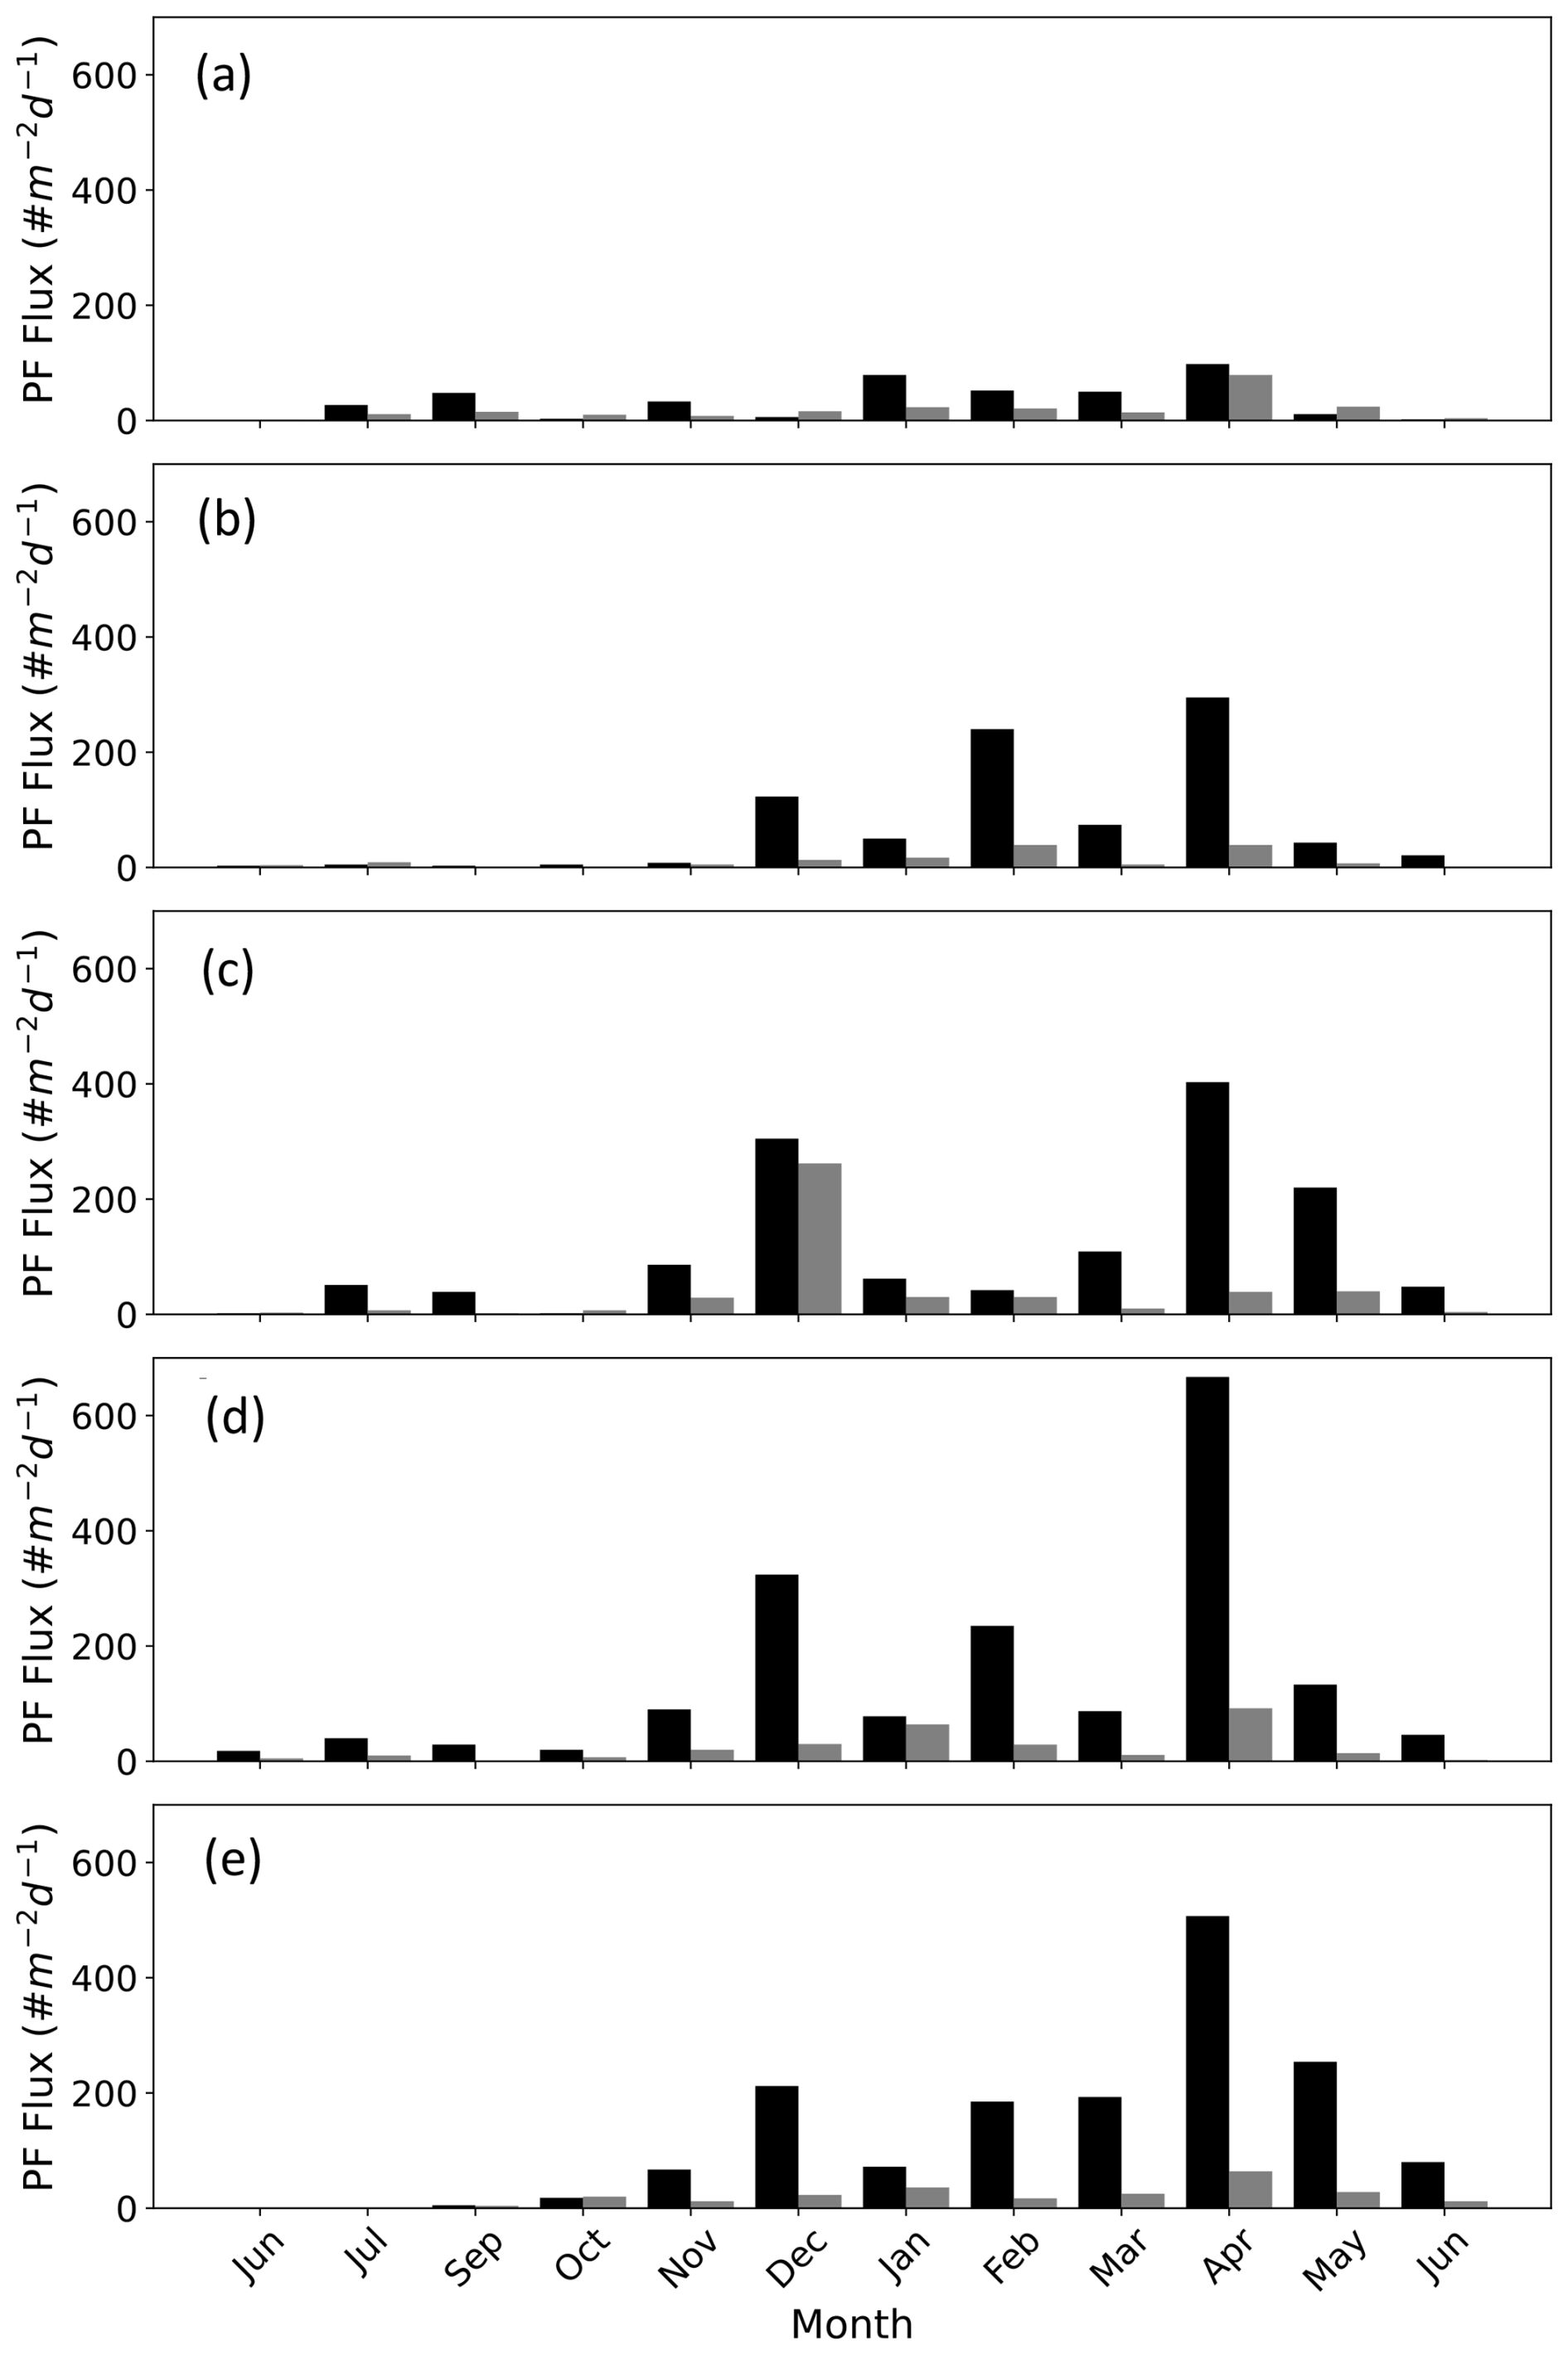
Figure 2PF fluxes in the Gulf of Aqaba between June 2014 and June 2015 presented according to the size fractions > 63–125 µm (black bars) and > 125–500 µm (grey bars) at the different sediment trap depths (a) 120 m, (b) 220 m, (c) 340 m, (d) 450 m, and (e) 570 m. Data from Chernihovsky et al. (2018).
In this study, we investigate the range of element values, year-round trends and inter-chamber element Ca variability in G. ruber albus and T. clarkei tests collected in sediment traps at various water column depths from the GOA. We assess whether the chambers record temporal-seasonal patterns, and the implications for using single chamber data for geochemical proxies (Mg Ca, B Ca, Na Ca). Examining inter-chamber variability sheds light on how trace elements are incorporated during calcification, distinguishing physiological controls (e.g., ontogenetic changes across successive chambers) from environmental influences such as temperature, salinity and nutrient availability. Using G. ruber and T. clarkei from the GOA provides a contrasting framework which together, these species enable us to refine element Ca proxy calibrations across vertical gradients in the water column in a warm and hyper-saline oligotrophic environment.
2.1 Sampling and oceanographic data
A bottom-tethered mooring has been deployed continuously since January 2014 near Station A, northern GOA (29°28′00.0′′ N, 34°55′45.0′′ E ∼ 605 m water depth) (Torfstein et al., 2020). Five KC Denmark cylinder sediment traps were mounted vertically and located at depths of 120, 220, 350, 450, and 570 m below the surface. The trap samples were collected at a monthly resolution. Furthermore, PF samples from the sediment interface were collected using a box core (“core top”). A further detailed description of the mooring, sampling, sample processing, and trapping efficiencies can be found in Chernihovsky et al. (2018) and Torfstein et al. (2020). Here, we report the findings derived from the PF tests collected between June 2014 and June 2015. Water column physical and chemical parameters are routinely collected at Station A by the Israel National Monitoring Program (NMP, Shaked and Genin, 2017). This includes sea surface and water column temperature (°C), salinity, oxygen concentration (µmol L−1), alkalinity (meq kg−1), pH, and chlorophyll a concentration (µg L−1). Mixed layer depth (MLD) was defined as the shallowest depth where the TEOS-10 potential density anomaly (σθ), computed with gsw from Practical Salinity and in-situ temperature with pressure from depth at Station A, exceeded a near-surface reference by Δσθ = 0.03 kg m−3; the reference density was the median σθ within 0–10 m (or the shallowest 10 m available when the surface was not sampled). Temperature, salinity, and pH within the mixed layer were then calculated as thickness-weighted means by linearly interpolating each profile onto a 0.5 m grid and averaging from the surface to the MLD.
2.2 Species classification and preparation for LA-ICP-MS
We examined the shell chemical properties of two flux dominating PF species T. clarkei and G. ruber albus (i.e., sensu stricto, white). For T. clarkei we examined two morphotypes: “big” and “encrusted”. Identification and nomenclature of the PF taxa followed Schiebel and Hemleben (2017), Morard et al. (2019), and Brummer and Kučera (2022). Three individuals were picked from each sediment trap depth during each month between June 2014 and June 2015. Preliminary preparation and cleaning steps are detailed by Chernihovsky et al. (2018). Reductive and oxidative cleaning had been avoided to retain original signals related to the different encrustation processes and preserve all calcite layers added to the shell during ontogeny (Schiebel and Hemleben, 2017; Jochum et al., 2019). Specifically, the shell of T. clarkei is prone to loss of material during reductive and oxidative treatment as it has very thin chamber walls (ranging between 1.9 and 3.6 µm; Levy et al., 2023). Single chamber measurements were performed to assess inter chamber variability (ICV), on individual shells (individual foraminifer analysis; IFA) using Laser Ablation Inductively Coupled Plasma Mass Spectrometry (LA-ICP-MS). We measured 156 specimens in total and 615 chambers: 57 individuals (168 chambers) of G. ruber albus, 52 individuals (242 chambers) of T. clarkei “big” and 48 individuals (204 chambers) of T. clarkei “encrusted”. Samples were glued to glass slides using a methyl-hydroxy-propyl-cellulose (MHPC 1:100), positioned with the umbilical side up.
2.3 LA-ICP-MS and data processing
Analyses of the calcium-normalized elements for B, Na, Mg, Al, Ti, Mn, Fe, Co, Sr, Ba, Nd, Pb, Th, and U were conducted using a 200 nm wavelength NWR femtosecond (fs) LASER system from ESI, combined with a sector-field Thermo Element-2 ICP mass spectrometer (Jochum et al., 2014). Measurements were performed using a 15 Hz pulse repetition rate (PRR), at low fluence (0.1–0.6 J cm−2), and 18 s dwelling time. A 30 µm diameter spot size was selected, as it is the maximum diameter for analysis fitting in a single chamber of the small T. clarkei. The microanalytical synthetic reference material MACS-3 for carbonate, NIST-612, and NIST-610 were used for calibration. NIST-612 was used for the tuning of the ICP-MS (Jochum et al., 2019). The average element-to-calcium ratio from the spot derived LA-ICP-MS count data was calculated from count data immediately after the start of the ablation peak apex until the point identified as the termination of calcite based on the Mg Ca profile. This time interval represents the stable internal material of the shell; excluding the noisy beginnings and ends of the ablation event. For G. ruber the mean ablation time length used for calculation was 4.9 ± 2.3 s, while for the smaller and thinner T. clarkei it was 2.6 ± 1.5 and 2.4 ± 1.4 s, for “big” and “encrusted” types, respectively.
The measurement precision (1 relative standard deviation in percent; 1 RSD) yield uncertainties for references materials between ∼ 5 %–17 % for the calcium-normalized elements (Supplement Table S1). Single spot measurements were made on each chamber of the individual shells. Chambers are labelled F0 (final chamber), F-1 (final minus one), F-2, and so on, for the penultimate, antepenultimate, and further chambers, respectively. We calculated averages and standard deviations of element Ca of single individuals (calculated from all single chamber element Ca in one shell) and relative standard errors of element Ca of pooled measurements for a specific morphotype.
2.4 Statistical Analysis
We used redundancy analysis (RDA) to quantify how variation in shell element Ca responses relates to environmental conditions (MLD, T, S, and pH). For each species, we assembled two time-aligned matrices by date: (i) a multivariate response matrix containing the element Ca values at each sampled depth (120, 220, 340, 450, 570 m) plus the overall total, and (ii) an environmental matrix containing environmental predictors. RDA was fit using the vegan package in R (function rda), which is equivalent to multivariate multiple regression followed by PCA of the fitted values. Biplots were produced with arrows showing the direction of increasing predictor values and their relative importance, and response points (depths/TOTAL) project positively or negatively onto each arrow according to their alignment, with the proportions of constrained variance carried by the first RDA axes (labels shown on the biplot axes). As a measure of specimen inter-chamber variability (ICV), the standard deviation (SD) was calculated for each individual. We calculated Spearman rank correlation matrices in R for each species across element Ca and SD, together with environmental parameters, with the spearman correlation coefficients visualised as heatmaps (associated p-values reported in Supplement Tables S2 and S3, respectively).
3.1 Shell-bound element Ca time series trends in G. ruber albus and T. clarkei shells
Single chamber Mg Ca over water column depths in G. ruber albus range between 2.01 mmol mol−1 (340 m; June 2015) and 18.49 mmol mol−1 (340 m; July–August 2014), with lower/higher values during winter/summer months, respectively (Fig. 3b–f). A unique observation is an increase in Mg Ca seen during spring (March–April), i.e., months with maximum surface water column mixing, at some water depths (220, 340, 450 m; Fig. 3c–e). Accompanied with the Mg Ca increase is a clear increase in ICV as evident by the divergence of chamber values. The SD of G. ruber albus ranges between 0.14 in February 2015 at 450 m water depth and 7.27 during April 2015 at 120 m water depth. Generally, it appears that Mg Ca is lower in F0 chambers (orange dotted line) compared to preceding chambers, especially during months with very shallow MLD (3a-3g). Mg Ca in T. clarkei “big” range between 4.00 mmol mol−1 (340 m; June 2015) and 77.02 mmol mol−1 (220 m; March 2015) and between 4.06 mmol mol−1 (570 m; December 2014) and 51.22 mmol mol−1 (120 m; April 2015) in T. clarkei “encrusted”, respectively. For both T. clarkei “big” and T. clarkei “encrusted” there are high excursions in all chambers during months of water column mixing while MLD is deepest (circa April; Fig. 3j–w). The SD ranges between 0.43 and 25.38 (120 m; September 2014 and, 220 m; April 2015 respectively) for T. clarkei “big” and for T. clarkei “encrusted” is up to 18.52 (340 m; March 2015).
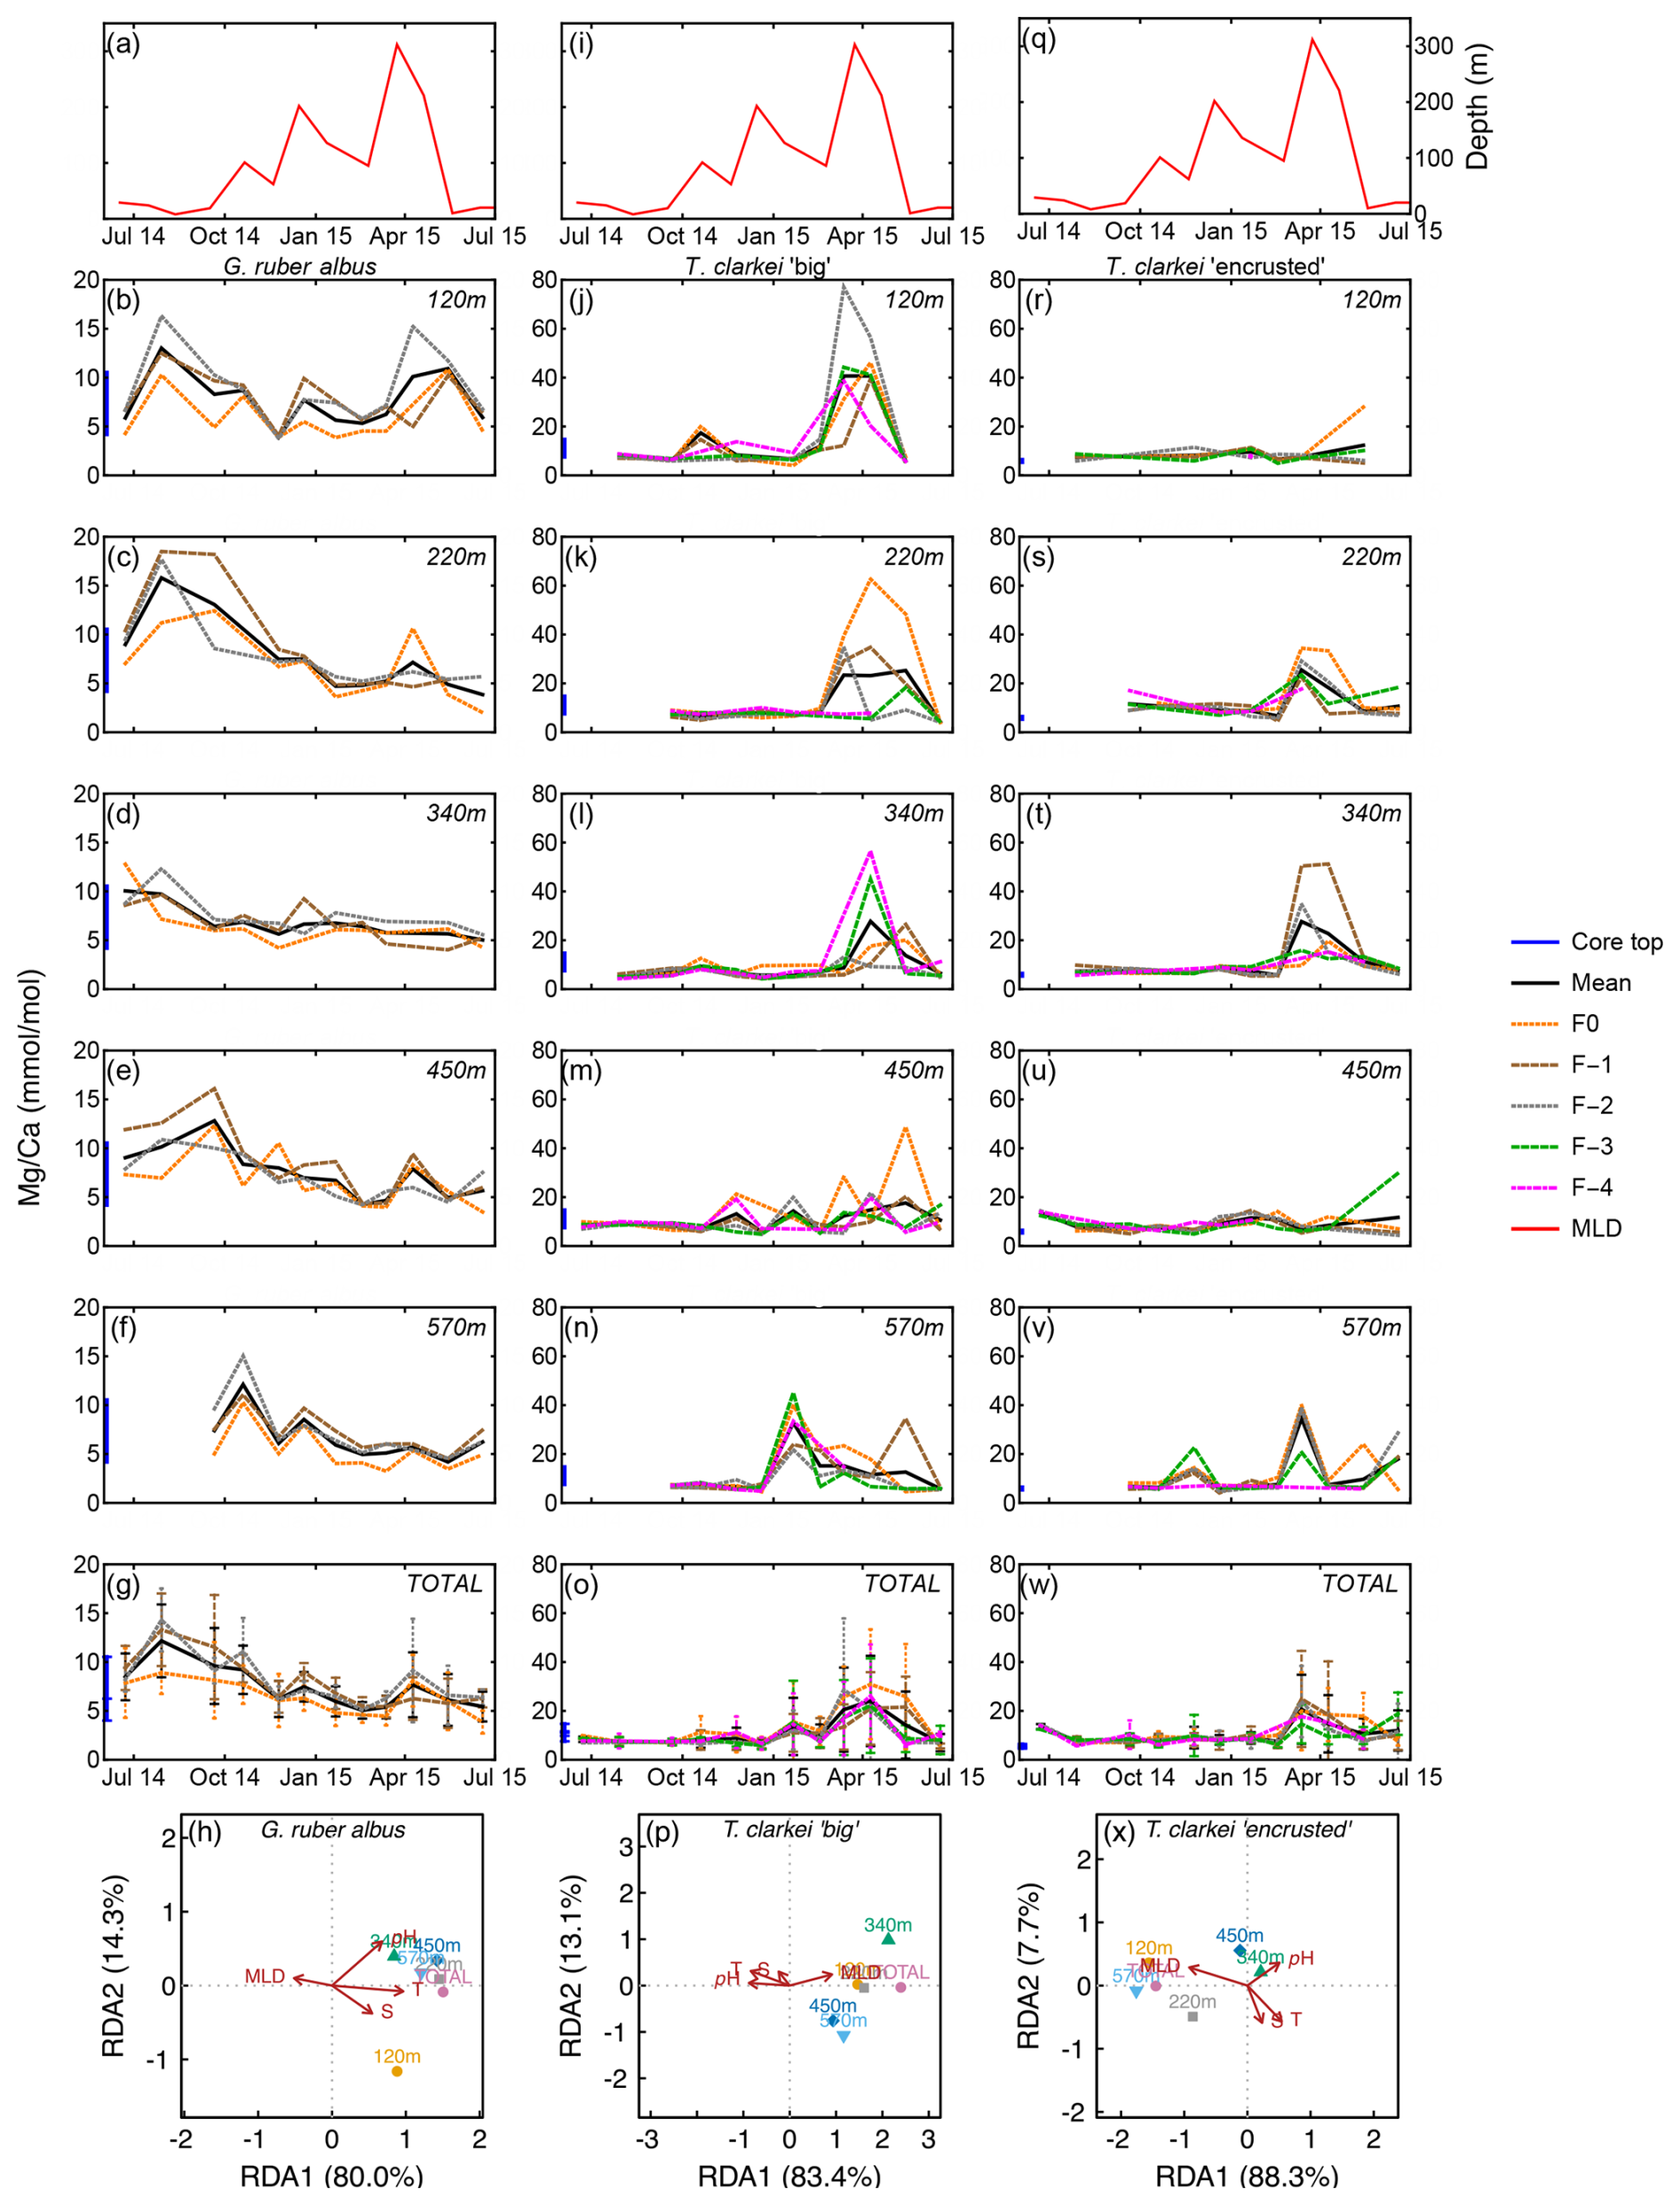
Figure 3Time series of Mg Ca values measured from the shells of G. ruber albus (b–f), T. clarkei “big” (j–n) and T. clarkei “encrusted” (r–v), derived from sediment traps located at different water depths (120–570 m). Mg Ca of core top are marked by a blue bar along the left y-axes. Top panels (a), (i), and (q) show the depth (meters below surface layer) of the mixed layer depth (MLD). Panels (g), (o), and (w) represent the average values of all depths for each chamber for each species. Panels (h), (p) and (x) show the redundancy analysis (RDA) per species for each water depth with MLD depth, temperature, salinity and pH as explanatory variables.
The G. ruber albus RDA analysis of Mg Ca show that most water depth samples, except for the 120 m are clustered together and align with temperature and MLD, positive and negative respectively. Turborotalita clarkei “big” exhibits a contrasting image compared to G. ruber albus and positively correlates with MLD while negatively correlating with temperature, salinity, pH. All three morpho-species show a distinct dominance of RDA1 explaining > 80 % of the variance (Fig. 3h, p and x).
Sr Ca in G. ruber albus range between 1.25 mmol mol−1 (570 m; January 2015) and 2.27 mmol mol−1 (340 m; November 2014) (Fig. 4b–f). The SD in G. ruber albus ranges reaches up to 0.48 (220 m; November 2014). Single chamber Sr Ca in T. clarkei “big” range between 0.94 mmol mol−1 (340 m; January 2015) and 2.76 mmol mol−1 (220 m; April 2015) and for T. clarkei “encrusted” between 0.54 mmol mol−1 (340 m; April 2015) and 2.92 mmol mol−1 (570 m; June 2015), respectively (Fig. 4j–n and r–v). Turborotalita clarkei “big” and T. clarkei “encrusted” display more ICV than G. ruber albus, with peaking Sr Ca in numerous chambers around April 2015 (Fig. 4j–w). During the spring months of 2015, Sr Ca values range between 1.45–2.04 mmol mol−1 in G. ruber albus, 1.32–2.76 mmol mol−1 in T. clarkei “big” and 0.54–2.27 mmol mol−1 in T. clarkei “encrusted”, respectively (Figs. 4, S1). Additionally, the SD of T. clarkei “big” is the highest at 0.43 in March 2015 at 120 m water depth, and lowest at 0.02 in June–July 2014, at 340 m water depth. For T. clarkei “encrusted” SD reaches 0.7 (220 m; April 2015). While the RDA analysis of T. clarkei “big” show a high RDA1 dominance (91.6 %), the RDA1 of G. ruber albus and T. clarkei “encrusted” are lower (75.9 % and 67.1 % respectively). In both G. ruber albus and T. clarkei “big” the environmental factors (pH, salinity and temperature) point together and opposite to MLD, while in T. clarkei “encrusted” salinity and MLD are more closely related.
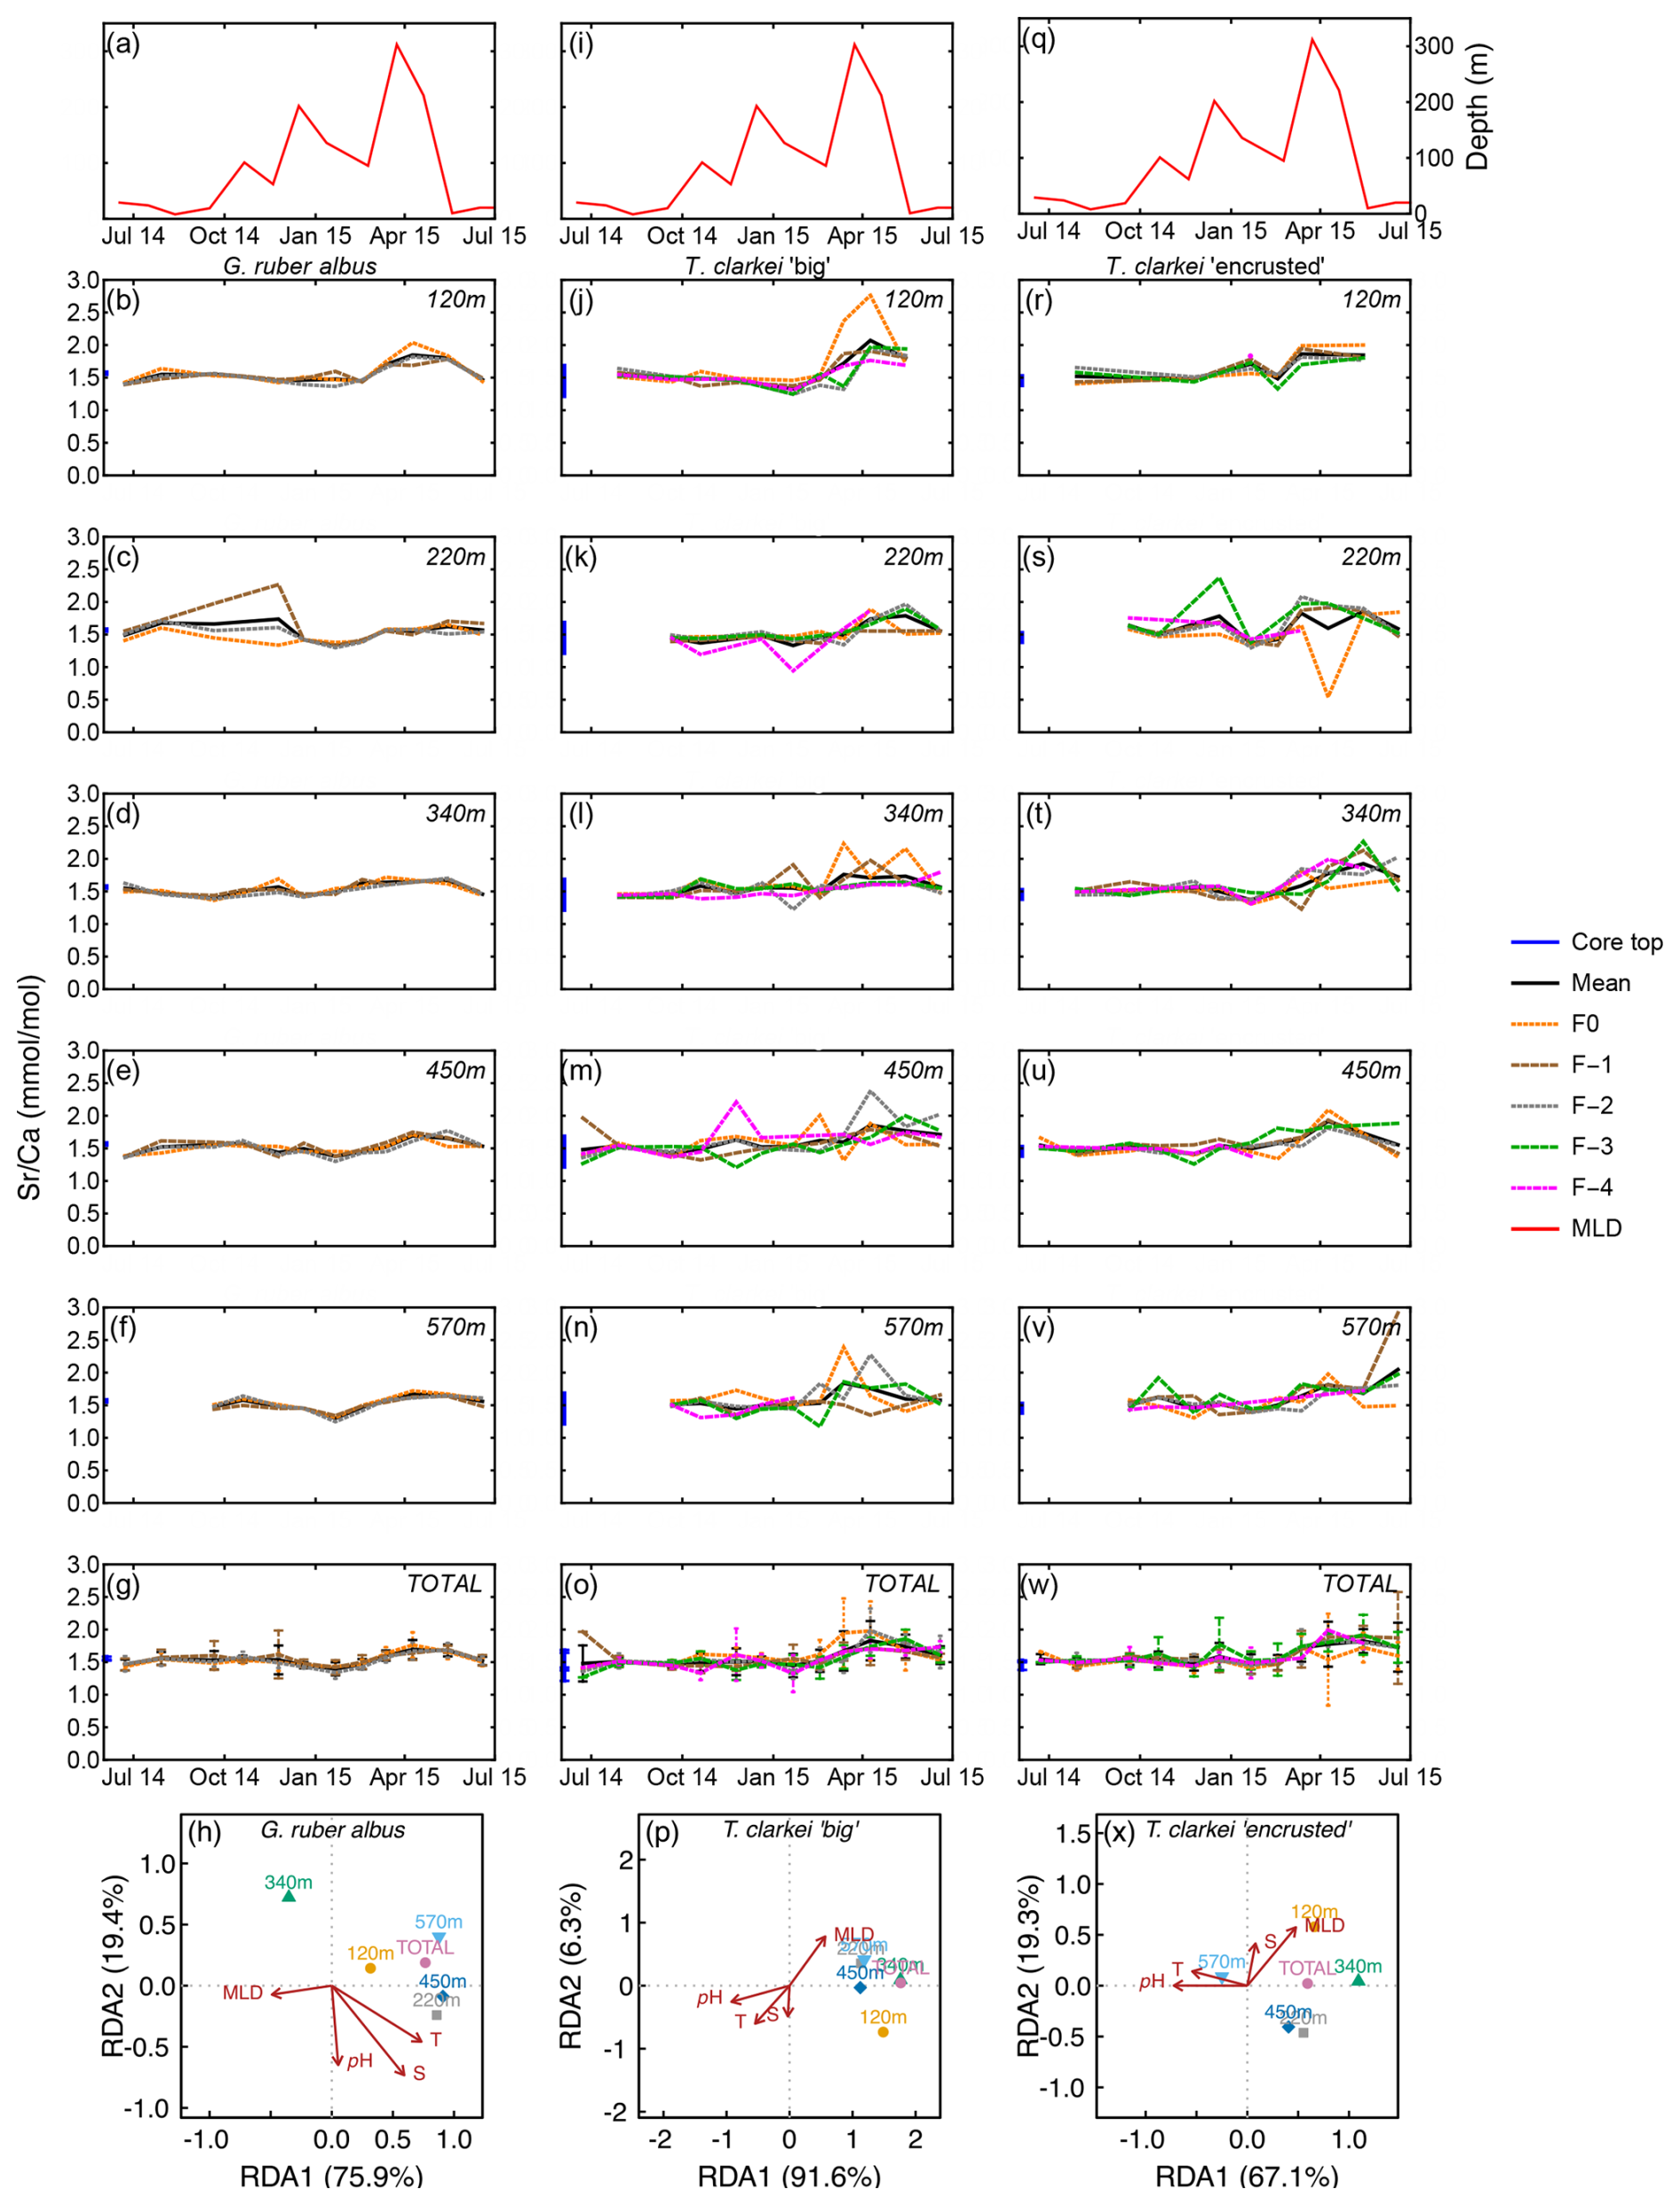
Figure 4Time series of Sr Ca values measured from the shells of G. ruber albus (b–f), T. clarkei “big” (j–n) and T. clarkei “encrusted” (r–v), derived from sediment traps located at different water depths (120–570 m). Sr Ca of core top are marked by a blue bar along the left y-axes. Top panels (a), (i), and (q) show the depth (meters below surface layer) of the mixed layer depth (MLD). Panels (g), (o), and (w) represent the average values of all depths for each chamber for each species. Panels (h), (p) and (x) show the redundancy analysis (RDA) per species for each water depth with MLD depth, temperature, salinity and pH as explanatory variables.
B Ca values range between 0.03 mmol mol−1 (570 m; January 2015) to 0.35 mmol mol−1 (120 m; June 2015) in G. ruber albus, with higher values during summer and spring and lower values during the winter (Fig. 5b–f). B Ca measured in the final chamber, F0, are systematically lower compared to F-1 and F-2 values. Unlike most other element ratios, B Ca values in both phenotypes of T. clarkei are similar to the range measured in G. ruber albus. In both T. clarkei phenotypes, lower B Ca values were measured during the winter months, most prominently in January. The B Ca values of T. clarkei “big” range between 0.01 to 0.53 mmol mol−1 with some higher values during spring (Fig. 5k–n). B Ca values in T. clarkei “encrusted” range between 0.01 mmol mol−1 to 0.47 mmol mol−1 (Fig. 5r–v). Generally, B Ca ICV is higher in T. clarkei than G. ruber albus, especially during spring (Fig. 5g, o, and w). The SD of G. ruber albus is highest at 0.086 during May 2015, at 120 m, and for T. clarkei “big” and T. clarkei “encrusted” the SD is 0.164 (450 m; June–July 2014) and 0.19 (120 m; May 2015) respectively. RDA analysis on B Ca reveal a distinct RDA1 dominance in both T. clarkei “big” and T. clarkei “encrusted” (93.6 % and 95.8 %, respectively) compared to only 53.8 % in G. ruber albus. In both T. clarkei phenotypes, the sediment trap data cluster together, showing a positive correlation with MLD and negative correlations with temperature, salinity, and pH. In contrast, G. ruber albus exhibits a more scattered distribution across water depths, with the 120 m and total samples showing a stronger alignment with MLD.
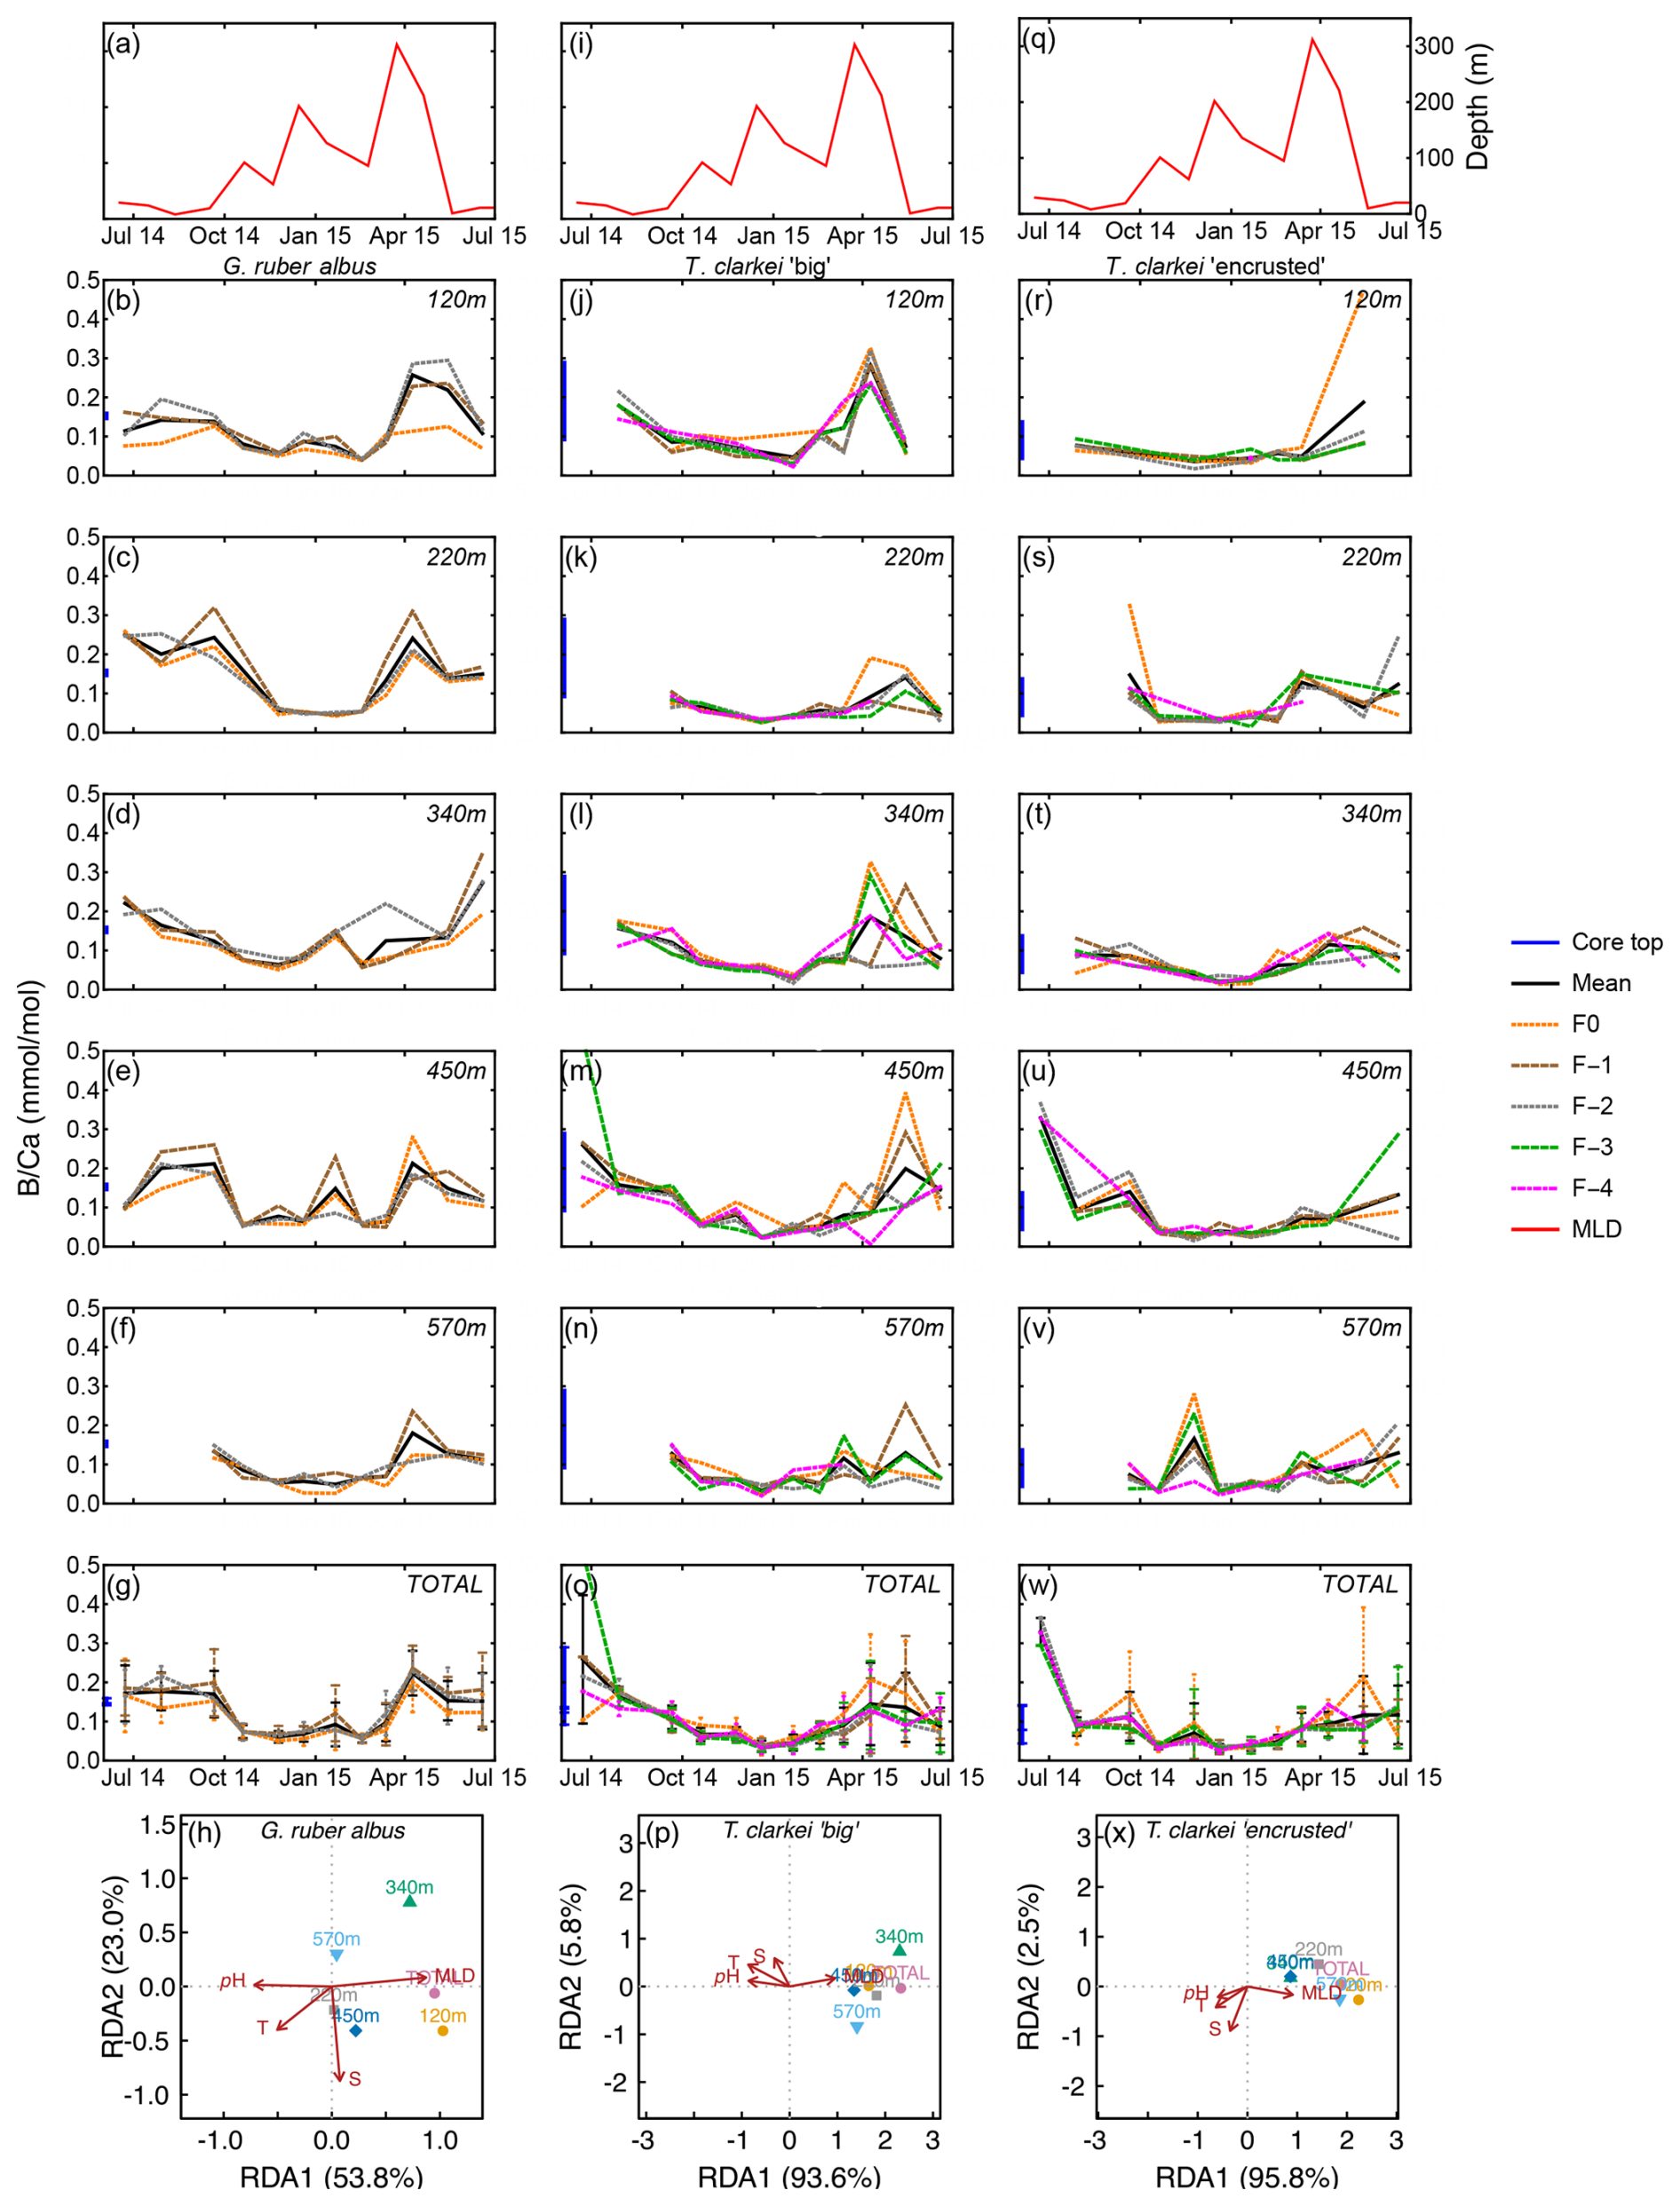
Figure 5Time series of B Ca values measured from the shells of G. ruber albus (b–f), T. clarkei “big” (j–n) and T. clarkei “encrusted” (r–v), derived from sediment traps located at different water depths (120–570 m). B Ca of core top are marked by a blue bar along the left y-axes. Top panels (a), (i), and (q) show the depth (meters below surface layer) of the mixed layer depth (MLD). Panels (g), (o), and (w) represent the average values of all depths for each chamber for each species. Panels (h), (p) and (x) show the redundancy analysis (RDA) per species for each water depth with MLD depth, temperature, salinity and pH as explanatory variables.
Na Ca in G. ruber albus ranges between 6.60 mmol mol−1 (220 m; June-July 2014) to 64.14 mmol mol−1 (220 m; April 2015) with a median value of 10.43 mmol mol−1 (Fig. 6; Fig. S1). The SD of Na Ca ranges between 0.06 (570 m; February 2015) to 34.37 (120 m; April 2015). Na Ca in T. clarkei “big” ranges from 6.23 mmol mol−1 (570 m; September 2014) to 426.54 mmol mol−1 (220 m; March 2015) with a median value of 12.33 mmol mol−1 and SD range between 0.44 (570 m; September 2014) to 106.33 (120 m; March 2015). Na Ca in T. clarkei “encrusted” ranges between 5.43 mmol mol−1 (570 m; September 2014) to 176.91 mmol mol−1 (570 m; March 2015) with a median value of 12.41 mmol mol−1 and SD reaches up to 64.64 (340 m; March 2015). Globigerinoides ruber albus has a low ICV during spring, while T. clarkei “big” and “encrusted” phenotypes display higher ICV during the same time interval. All morphotypes include significant excursions in Na Ca with high values in G. ruber albus during January and April at 220 m (Fig. 6c), and high Na Ca in both T. clarkei phenotypes at multiple depths and seasons (Fig. 6i–m and p–t). In particular, T. clarkei phenotypes show significant Na Ca excursions during March-April and ICV (Fig. 6i–t). RDA analysis on T. clarkei “big” show, like B Ca, a clustering of sediment trap data aligned with MLD and negatively correlated to pH, salinity and temperature positioned on the RDA1 axis (85.3 %). The sediment trap data of T. clarkei “encrusted” show two distinct groups: 120, 220, 570 m and “Total” together with MLD and the 350 m and the 450 m groups in the middle between MLD and pH, salinity and temperature, albeit slightly negative on the RDA2 axis (9.0 %), while the explanatory parameters are positive on RDA2. The G. ruber albus Na Ca displays a similar distribution to B Ca however, the environmental parameters are aligned differently: MLD negative on RDA1 axis (62.3 %) and positive on RDA2 axis (28.1 %); and, temperature, salinity and pH negative on RDA2 axis and positioned more to the center of RDA1.
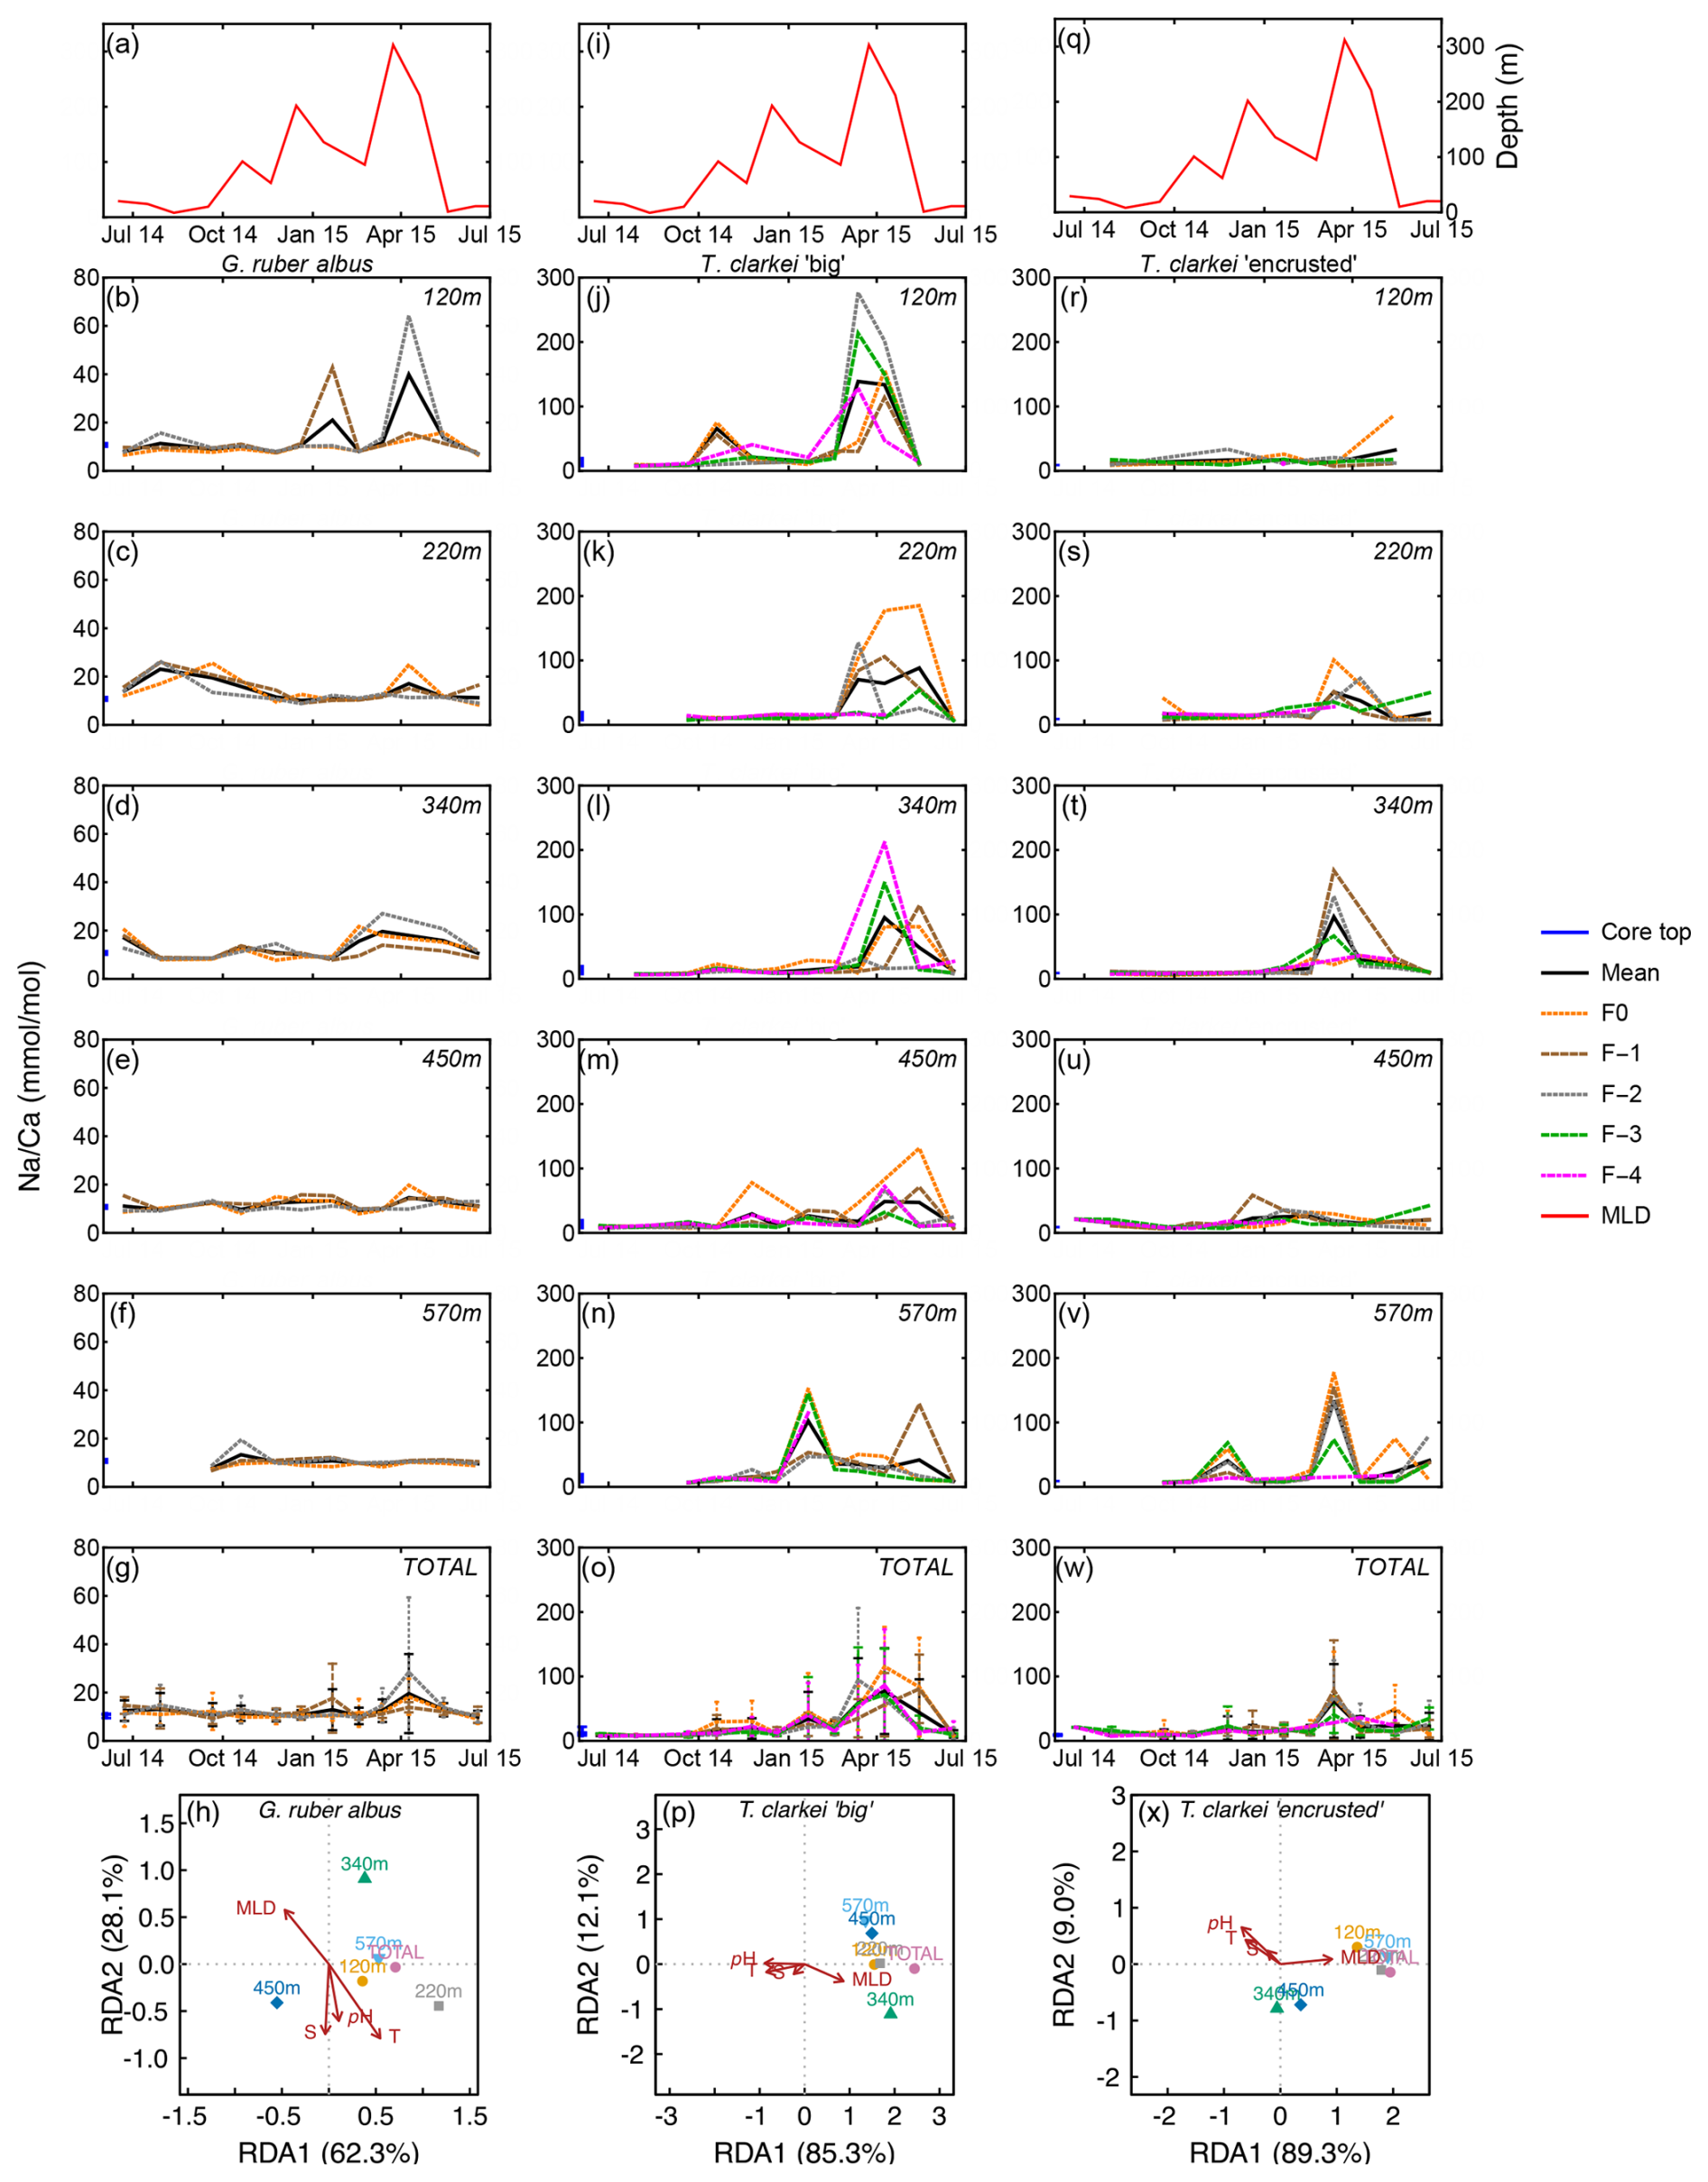
Figure 6Time series of Na Ca values measured from the shells of G. ruber albus (b–f), T. clarkei “big” (j–n) and T. clarkei “encrusted” (r–v), derived from sediment traps located at different water depths (120–570 m). Na Ca of core top are marked by a blue bar along the left y-axes. Top panels (a), (i), and (q) show the depth (meters below surface layer) of the mixed layer depth (MLD). Panels (g), (o), and (w) represent the average values of all depths for each chamber for each species. Panels (h), (p) and (x) show the redundancy analysis (RDA) per species for each water depth with MLD depth, temperature, salinity and pH as explanatory variables.
Ba Ca in G. ruber albus ranges from 0.73 µmol mol−1 (120 m; November 2014) to 36.81 µmol mol−1 (340 m; June 2015). Ba Ca in T. clarkei “big” ranges from 0.39 µmol mol−1 (120 m; June 2015) to 246.54 µmol mol−1 (450 m; March 2015). Ba Ca in T. clarkei “encrusted” ranges from 0 µmol mol−1 (April 2015) to 171.41 µmol mol−1 (340 m; March 2015) (Figs. 7, S1). The three morphotypes display varied ICV, although T. clarkei shows more prominent ICV during spring months with SD values of 42.06 (340 m; April 2015, “encrusted”) and 98.98 (450 m; March 2015, “big”) (Fig. 7i–t and Supplement Table S4) than G. ruber albus with SD values of 19.14 (220 m; June–July 2014) (Fig. 7b–f). Furthermore, RDA analyses exhibit for both T. clarkei phenotypes, a clear RDA1 dominance with 93.6 % and 95.8 % for “big” and “encrusted” respectively. Additionally, for both types, sediment trap data is clustered with positive correlation to MLD and negative to temperature, salinity and pH. For G. ruber albus, RDA1 value is 53.8 % and RDA2 is 23.0 %. The sediment traps data are scattered and while the environmental parameters temperature and salinity point together negatively on the RDA2 axis, MLD and pH are positioned on opposite directions on the RDA1 axis (positive and negative respectively).
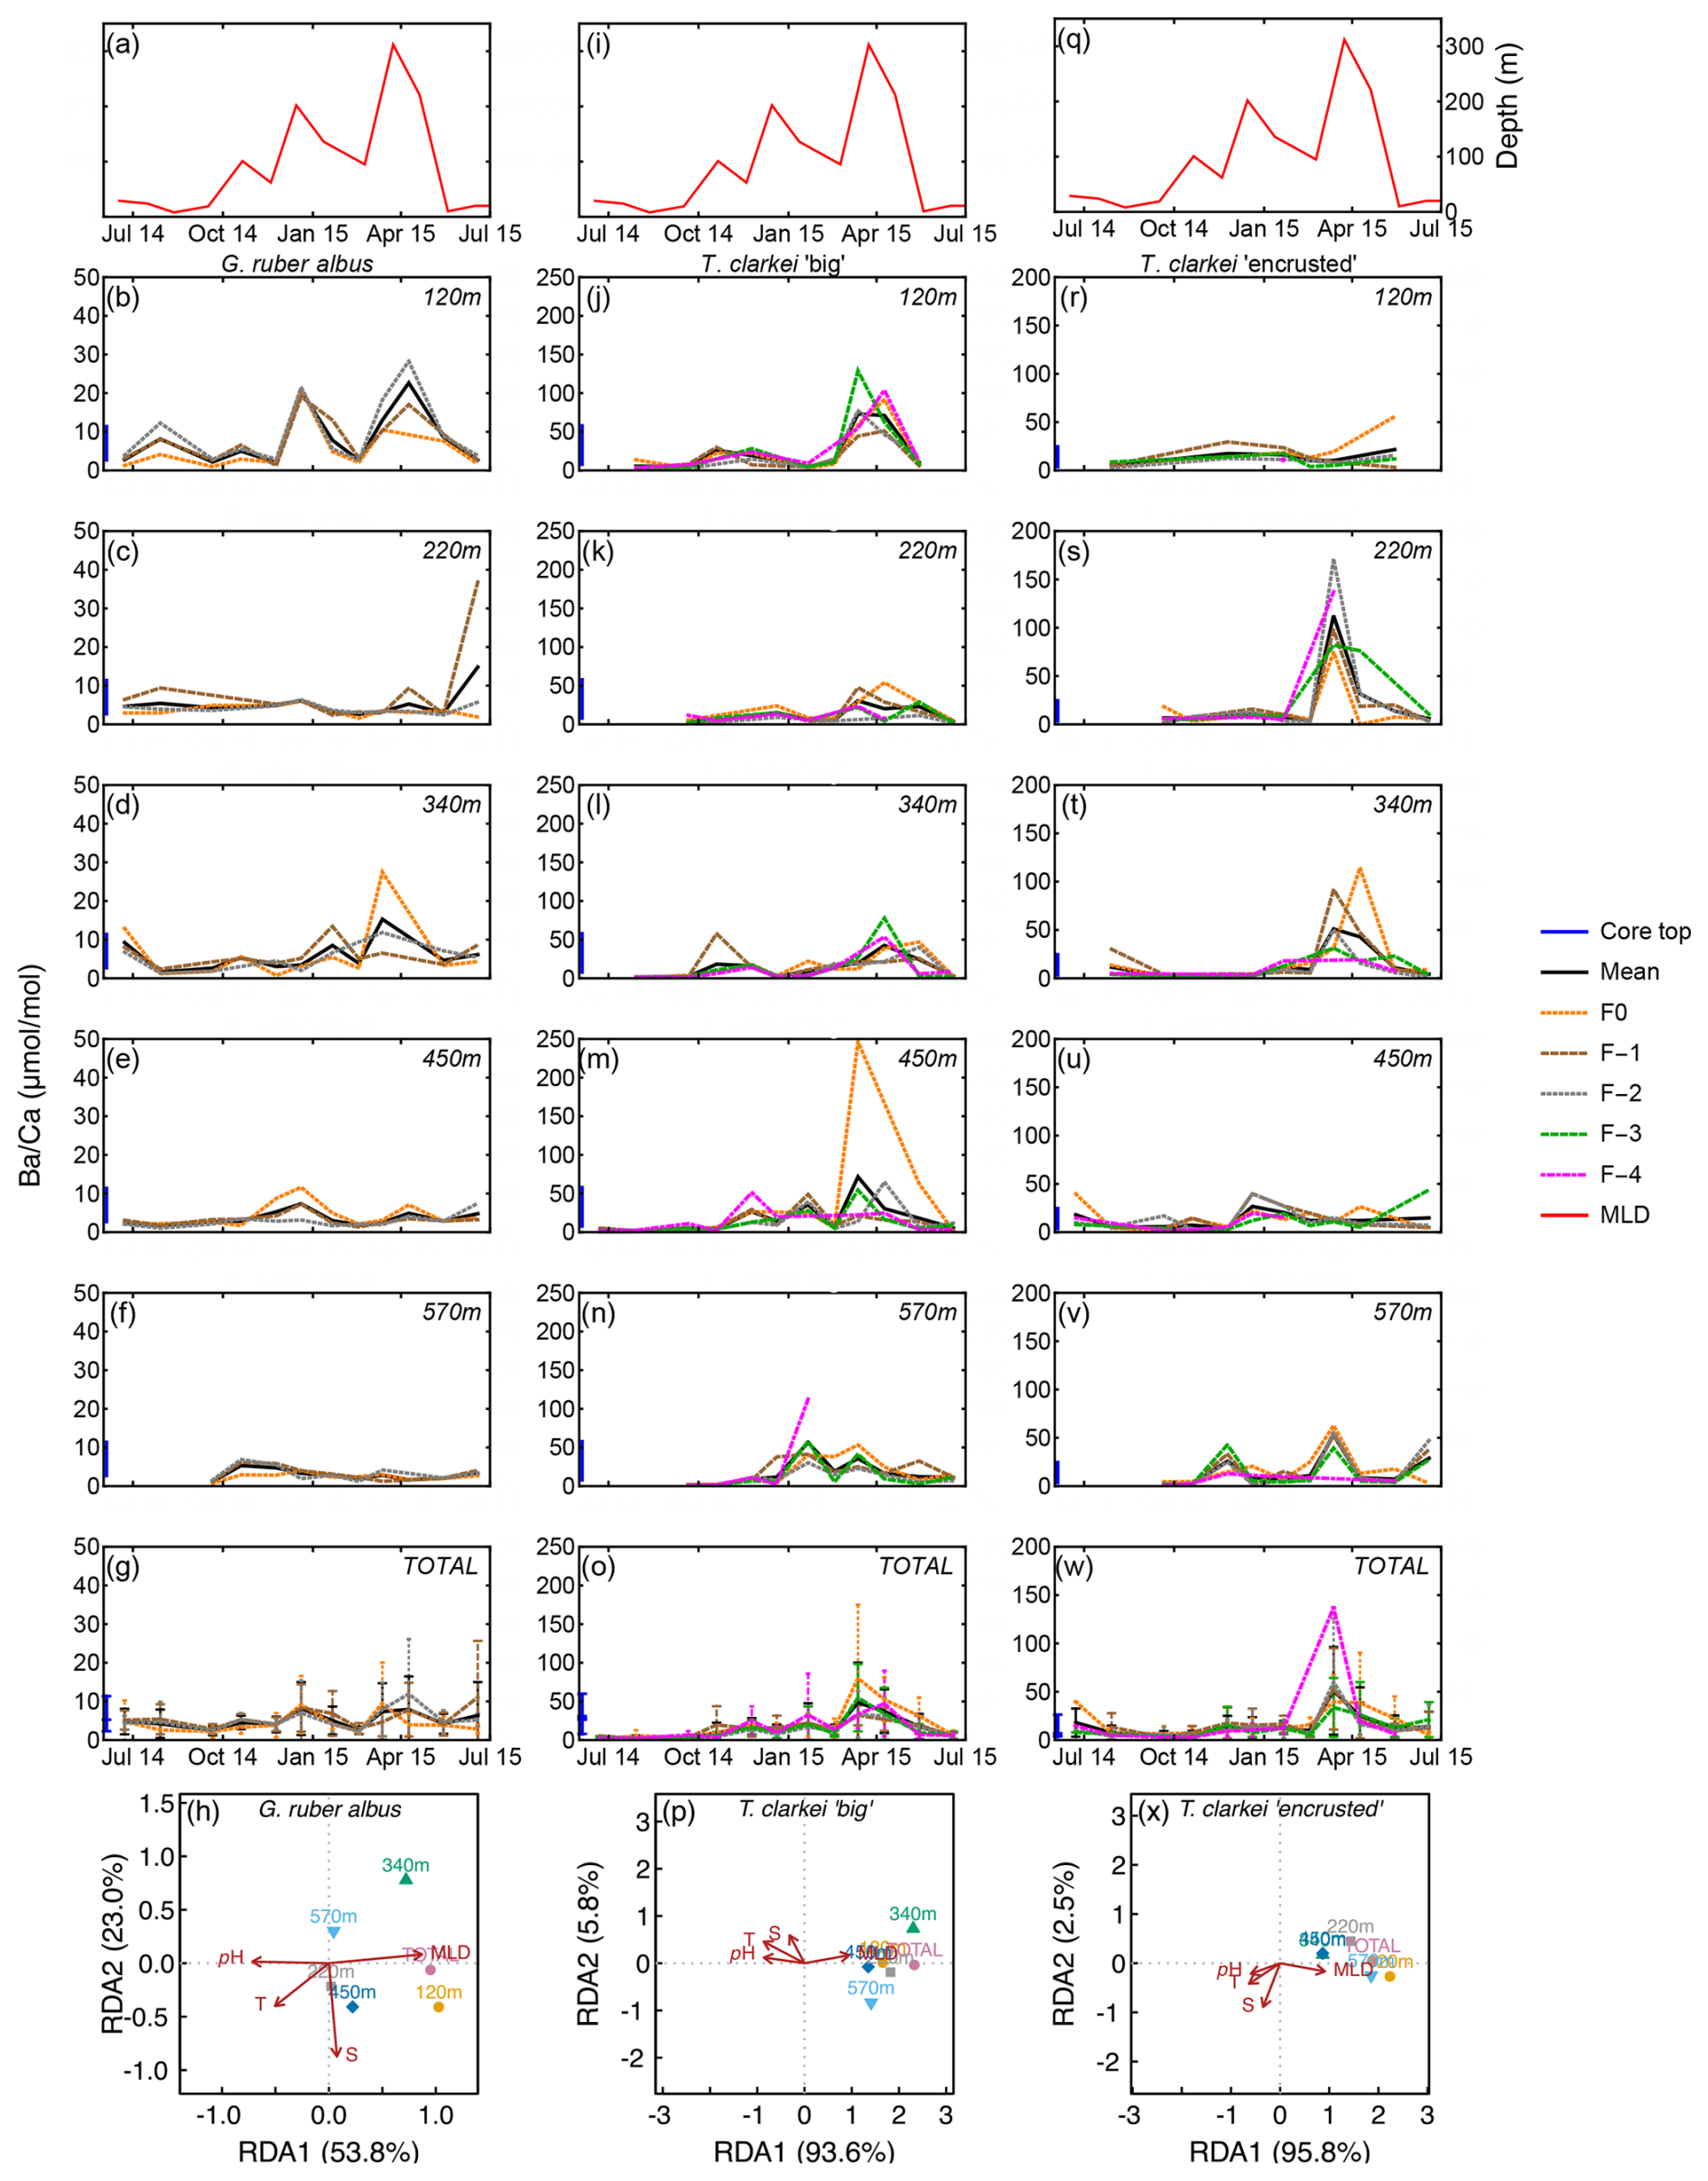
Figure 7Time series of Ba Ca values measured from the shells of G. ruber albus (b–f), T. clarkei “big” (j–n) and T. clarkei “encrusted” (r–v), derived from sediment traps located at different water depths (120–570 m). Ba Ca of core top are marked by a blue bar along the left y-axes. Top panels (a), (i), and (q) show the depth (meters below surface layer) of the mixed layer depth (MLD). Panels (g), (o), and (w) represent the average values of all depths for each chamber for each species. Panels (h), (p) and (x) show the redundancy analysis (RDA) per species for each water depth with MLD depth, temperature, salinity and pH as explanatory variables.
3.2 Depth-averaged values of element Ca measured in G. ruber albus and T. clarkei shells using LA-ICP-MS
Generally, the means of Mg Ca, Sr Ca, B Ca, Na Ca and Ba Ca in G. ruber albus indicate that the composition of tests, from most water depths is similar to that of core-top samples (Fig. 8a–d, j). In contrast, Al Ca, Ti Ca, Mn Ca, Fe Ca, Nd Ca, Th Ca, and U Ca (Fig. 8e–i, k, m, n) in the tests from sediment interface were higher than in the water column, and lower in case of Co Ca and Pb Ca (Fig. 8i, l).
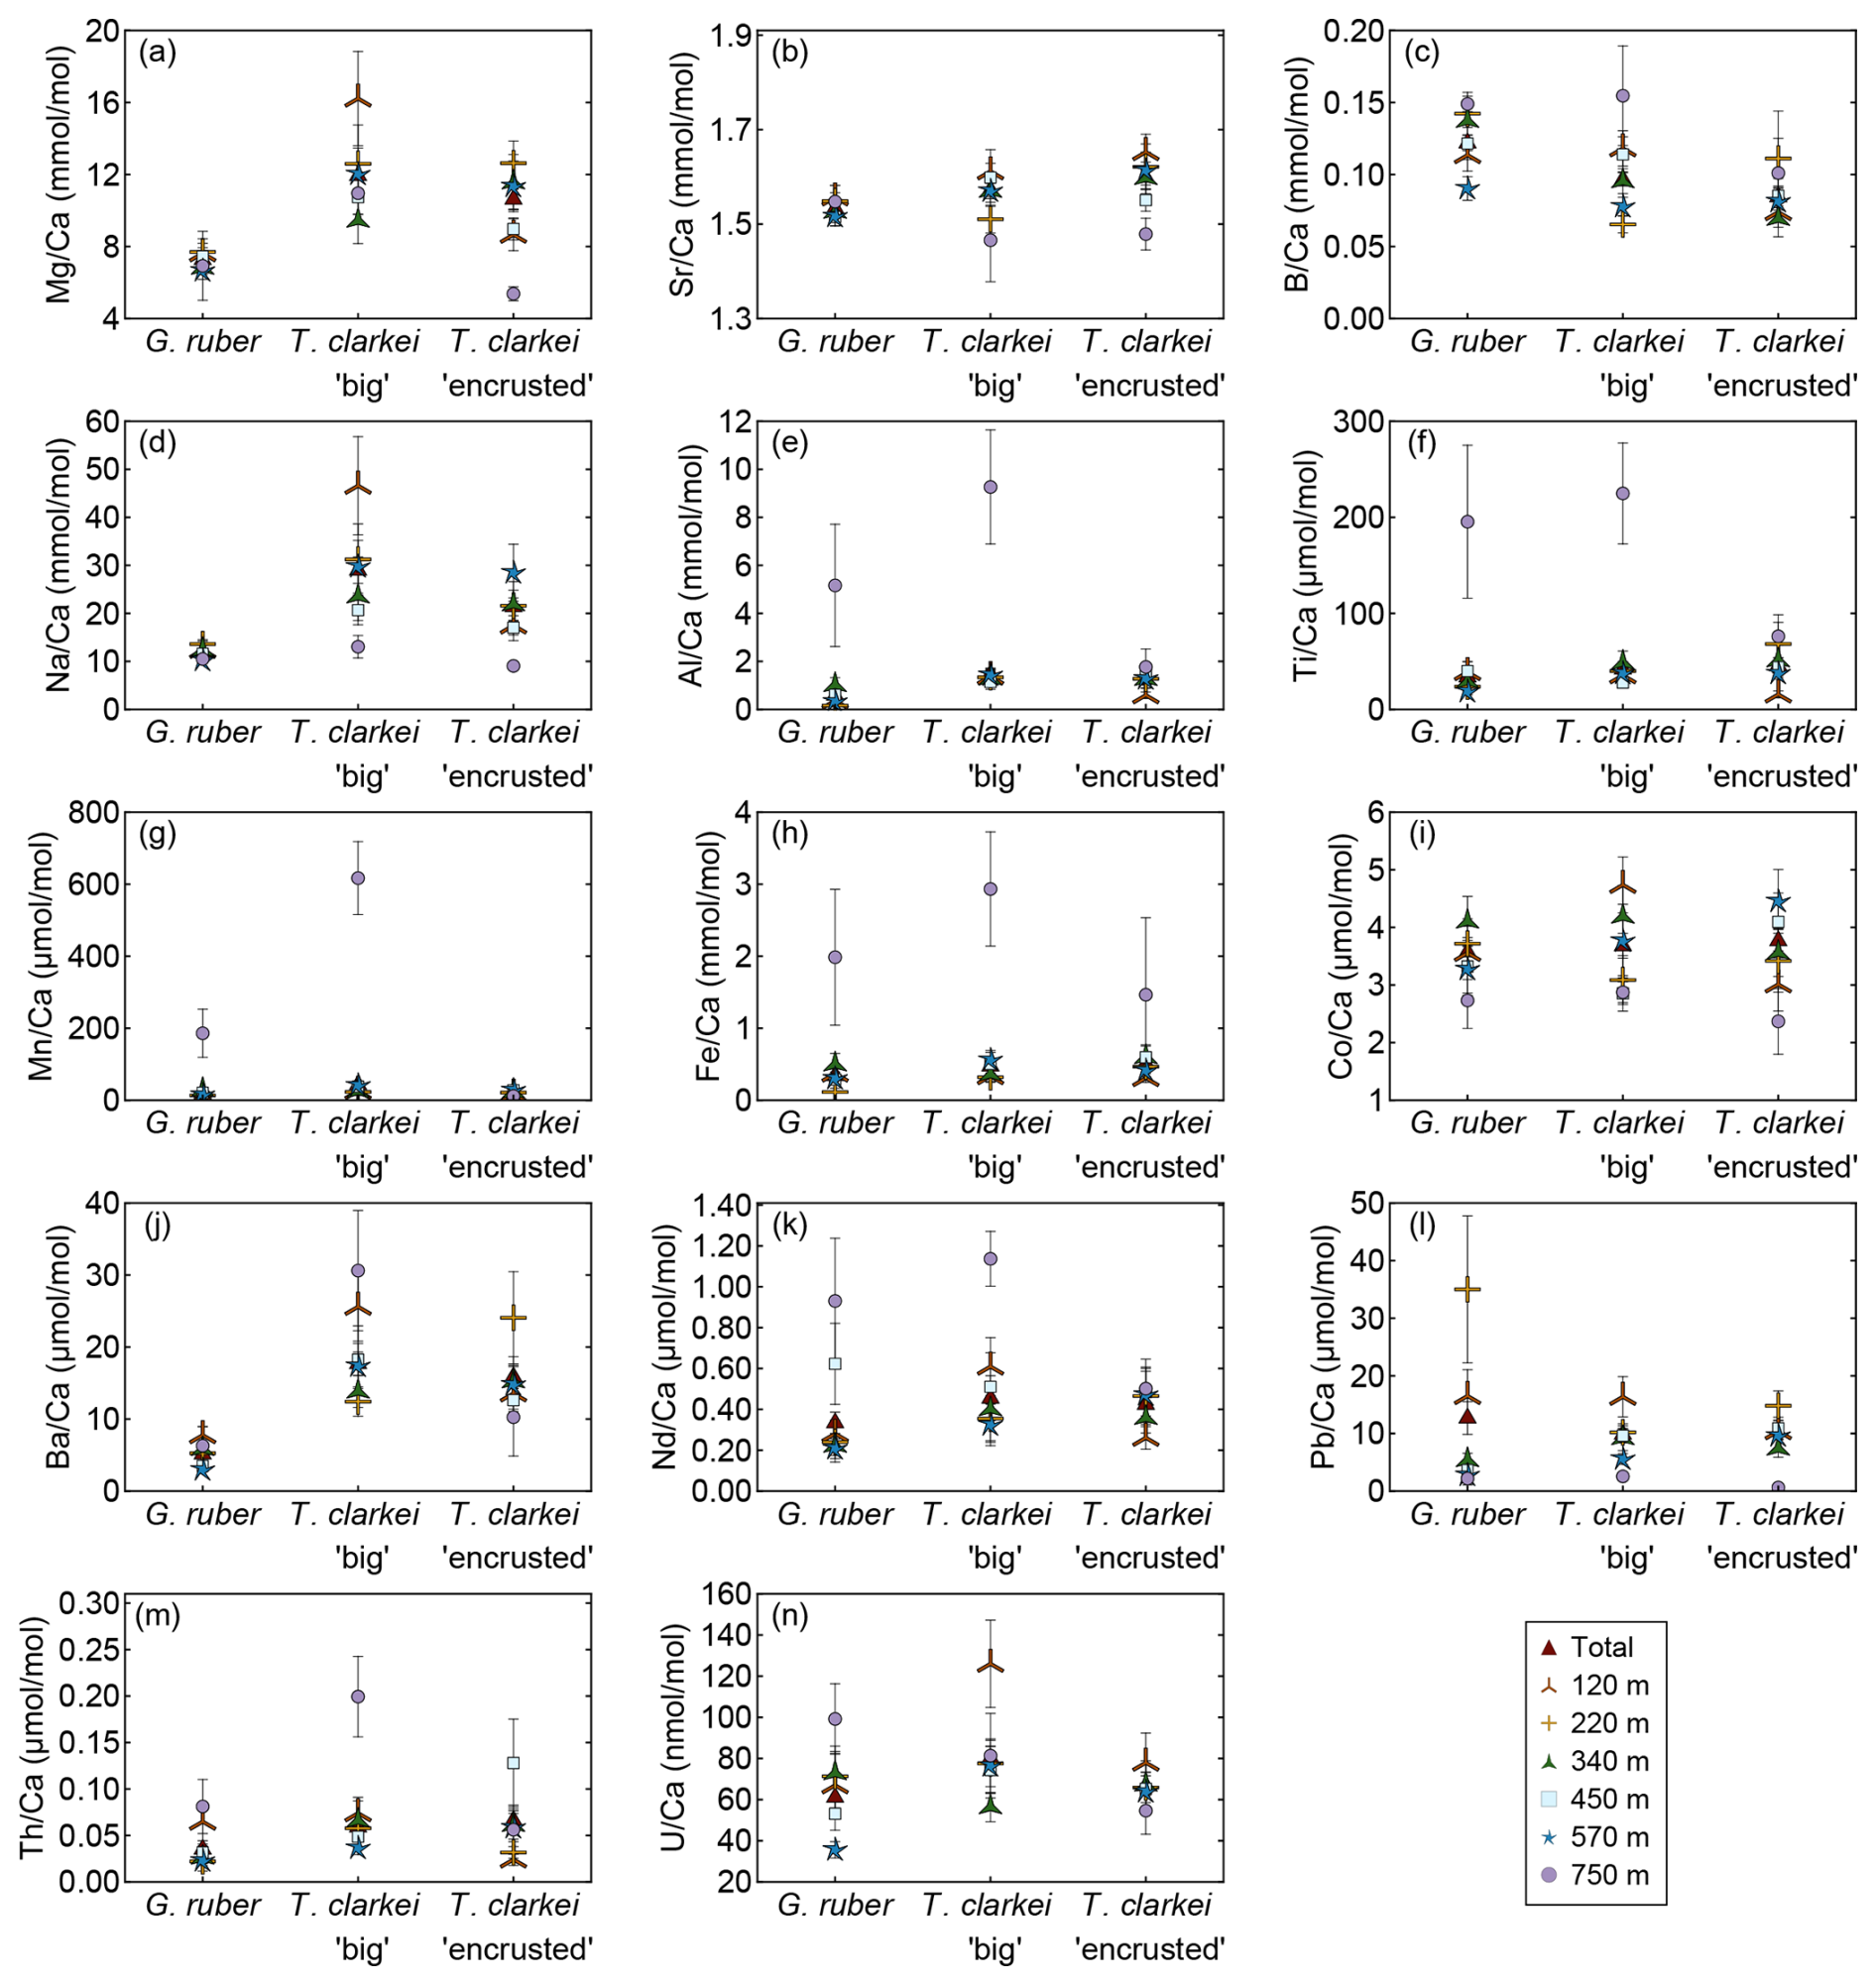
Figure 8Pooled mean values of the calcium-normalized element ratios of G. ruber albus, T. clarkei “big” and T. clarkei “encrusted” shells, derived from sediment traps located at different water depths (120 to 570 m) and a core top sample (750 m) from the Gulf of Aqaba. Error bars represent 1σ relative standard error ().
Furthermore, T. clarkei tends to demonstrate higher values and higher variability compared to G. ruber albus (e.g., Mg Ca, Na Ca, Ba Ca, Nd Ca). Compared to the core-top samples, T. clarkei from the water column also exhibit relative enrichment in Al Ca, Ti Ca, Mn Ca, Fe Ca, Nd Ca, B Ca, and Th Ca (T. clarkei “big”), and depletion in Co Ca, Pb Ca, Sr Ca, and Mg Ca (T. clarkei “encrusted”) (Fig. 8).
3.3 Relationships between element Ca and environmental parameters
A Spearman correlation matrix was applied to assess the relationships of the element Ca and environmental variables in the three analyzed PF phenotypes (Fig. 9; Table S2; Fig. S12). The T. clarkei types exhibit similar pattern of relationships, with minor differences mainly in correlation strength (Fig. 9a, b). In general, T. clarkei shows more significant relationships than G. ruber albus, while, G. ruber albus, display different relationships to those of the two T. clarkei types. In T. clarkei, Mg Ca displays relatively strong relationships with Na Ca, Ba Ca, and Al Ca (Fig. 9b, c). Sr Ca, B Ca, Co Ca and Nd Ca do not display significant relationships to other elements in G. ruber albus as well as in T. clarkei “big” and T. clarkei “encrusted”.
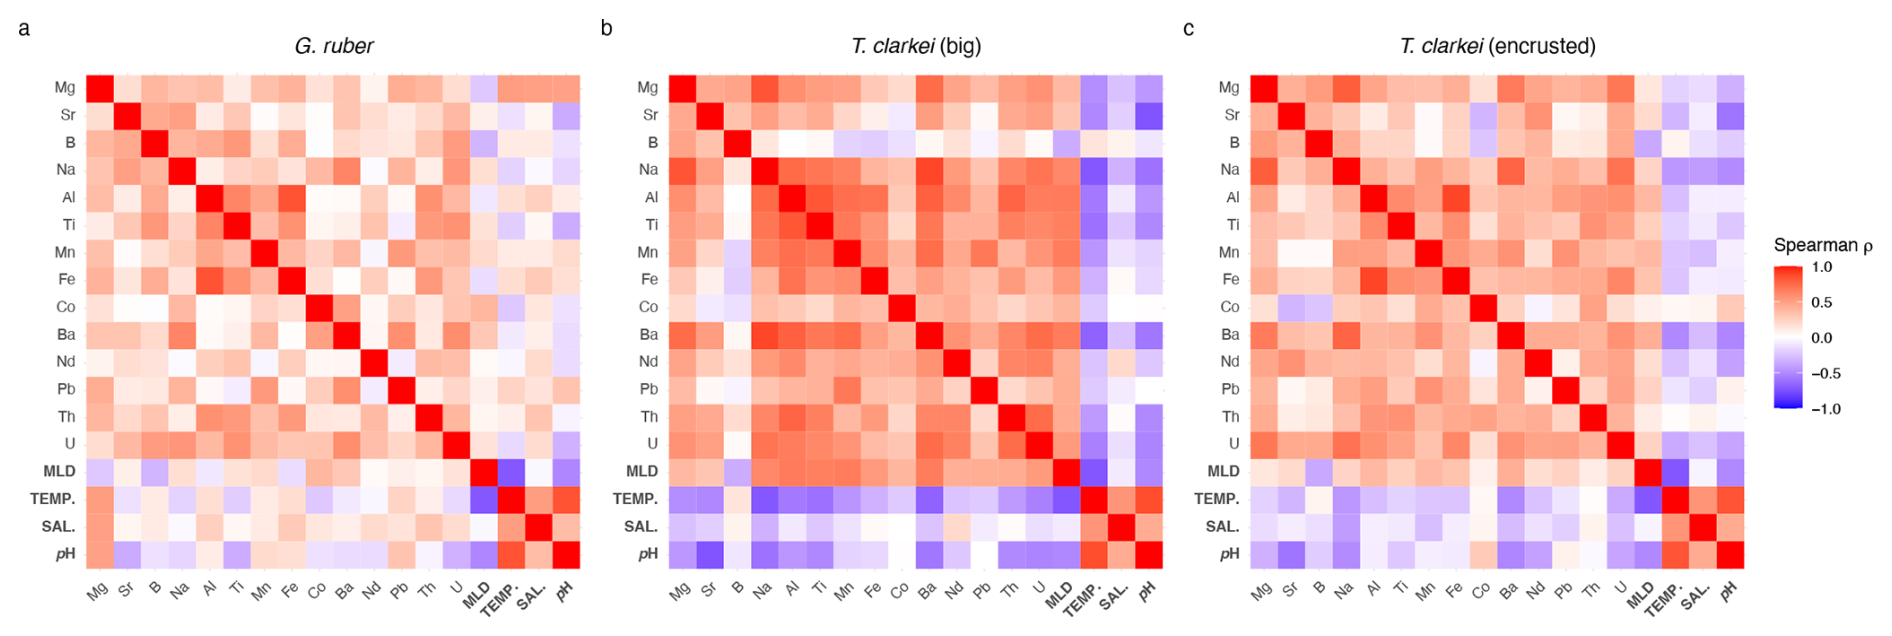
Figure 9Spearman correlation Matrix of element-Ca means in G. ruber albus (a), T. clarkei “big” (b) and, T. clarkei “encrusted” (c) and environmental variables.
For both T. clarkei “big” and T. clarkei “encrusted”, Na Ca significantly correlates with Al Ca, Mn Ca, and Ba Ca, with the latter showing the strongest relationships in T. clarkei “big” (r = 0.82, Fig. 9b; Table S2). Relationships between Al Ca, Ti Ca, Mn Ca, Fe Ca, Ba Ca and Th Ca are generally stronger in T. clarkei “big” than in T. clarkei “encrusted”, except for Al Ca and Fe Ca, which are stronger related in T. clarkei “encrusted” (r=0.85; Table S2) than in T. clarkei “big” (r = 0.74; Table S2). Unlike G. ruber albus, the U Ca in T. clarkei exhibit relatively strong relationships with Ba Ca, Na Ca and Al Ca (in T. clarkei “big”) and Mg Ca (in T. clarkei “encrusted”, Fig. 9c) while in G. ruber albus, U Ca is poorly related to the other elements (Fig. 9a). Mg Ca of G. ruber albus, has a positive correlation with temperature, salinity, and pH, and a negative correlation with MLD; other element Ca in G. ruber albus do not exhibit significant correlations with these environmental variables (Fig. 9a). By contrast, in T. clarkei (“big” and “encrusted”), element Ca show strong correlations with MLD but not with temperature, salinity, or pH (Fig. 9b, c). In the T. clarkei “big” morphotype, SD (ICV) shows strong correlations between multiple element Ca and with MLD. On the other hand, in T. clarkei “encrusted” and G. ruber albus, correlations are weaker and/or inconsistent across variables, and no uniform pattern emerges.
4.1 Inter chamber variability (ICV)
Shell-bound element Ca display varying trends across different chambers depending on the specific element ratios, and varying over water depth and time (Figs. 3–7). In most element Ca ICV is higher during water column mixing months (March-May; e.g., Al Ca, B Ca, Ba Ca, Co Ca, Fe Ca, Mg Ca) in all water depth horizons for T. clarkei “big” and T. clarkei “encrusted”, while for G. ruber albus it increases in the two upper water depth horizons (i.e., 120 and 220 m). Elevated element Ca values and high ICV may reflect the changes in the water properties like the temperature, salinity, pH and nutrient availability derived from the mixing of the water column (Figs. S12, 3–7 panels h, p, and x). For some element Ca ratios (e.g., Na Ca, Fig. 6g, o, and w; Ba Ca, Fig. 7g, o, and w) ICV varies with depth and shows seasonal differences (i.e., less variation with depth during water column stratification and more variation with depth during water column mixing), whereas for others (e.g., B Ca, Fig. 5g, o, and w; Sr Ca, Fig. 4g, o, and w) it remains relatively constant with depth. In the T. clarkei “big” morphotype, ICV shows strong correlations across most element Ca and with MLD, indicating that increases in ICV reflects a common driver, most likely the mixed-layer depth (Fig. S12).
Typically, most PF reproduction-cycles span about a month with individual chambers forming within several hours (Bé et al., 1977), while the time interval between chamber formation can range from hours to weeks (Schiebel and Hemleben, 2017, and references therein). Setting aside the March-May time-interval where PF shells show exceptionally high ICV, G. ruber albus generally exhibits lower values (e.g., Mg Ca, B Ca), and less ICV compared (e.g., Mg Ca SD=1.67) to T. clarkei “big” and “encrusted” (e.g., Mg Ca SD = 5.24 for “big” type and Mg Ca SD = 3.55 for “encrusted” type). The residence of G. ruber albus in the relatively homogenous and narrow living environment in the surface mixed layer (Schiebel and Hemleben, 2017; Thirumalai et al., 2014; and others), could explain relatively lower ICV. In contrast, T. clarkei dwell in the dynamic region near/under the thermocline (Schiebel and Hemleben, 2017; Levy et al., 2023) over a wider dwelling depth horizon, and may experience more heterogeneous environmental conditions which may result in higher ICV.
The secondary crust observed on T. clarkei “encrusted” morphotypes, which covers all chambers of the tests analyzed here, does not significantly alter element Ca values when compared to T. clarkei “big”, unlike the crust of Neogloboquadrina dutertrei (Jonkers et al., 2012). Nonetheless, the RDA (Figs. 3–7) and the Spearman correlation analyses (Fig. 9) of both T. clarkei types indicate that while T. clarkei “big” show a positive correlation to MLD and a weaker or negative correlation to other environmental parameters (T, S and pH), the T. clarkei “encrusted” type calcification mechanism is more complex and could be influenced by additional factors/environmental variables. Therefore, while both types are eligible for paleoceanography and paleoclimate reconstructions, the interpretation of their measurements might be different.
The ultimate chamber (F0) presents different systematics compared to the preceding chambers in both T. clarkei and G. ruber albus (Fig. S11). In T. clarkei (both “big” and “encrusted”), the F0 typically exhibits higher values of B Ca, Na Ca, Mg Ca, and Al Ca compared to the previous chambers. In contrast, G. ruber albus displays relatively lower values in F0 for the same ratios highlighting species-specific differences in chamber formation (Fig. S11). Interestingly, Sr Ca does not follow the same pattern. In T. clarkei “big” the Sr Ca distribution mirrors the trends of other elements, while F0 in G. ruber albus and T. clarkei “encrusted” shows an even distribution of Sr Ca, likely reflecting the relatively constant Sr Ca values in the water column during the lifespan of a single test. These observations in G. ruber albus are consistent with previous studies that measured Mg Ca in individual chambers (Bolton et al., 2011; Davis et al., 2020; Fischer et al., 2024). The contrasting systematics of F0 leading to elevated ICV in the ultimate chamber compared to the previous chambers was previously suggested to be associated with a chamber wall that is not fully calcified (Schiebel and Hemleben, 2017; Bolton et al., 2011; Fischer et al., 2024). Differences in F0 systematics between T. clarkei and G. ruber albus could be driven by species-specific calcification processes, though further research is needed to clarify this issue. Additionally, it is important to consider potential biases in small chambers such as F-4 in T. clarkei morpho-species, where methodological challenges (e.g., laser spots hitting sutures) may skew element Ca measurements. Consequently, we conclude that the exclusion of F0 and F-4 may enhance the robustness of reconstructions of the marine environment in studies of downcore records.
4.2 Relationships of element ratios of the three PF morphotypes
The contrasting results of the correlation matrixes of the three morpho-species, suggests species-specific mechanisms while calcifying their shells. The Mg Ca in T. clarkei which strongly correlates with Na Ca, Ba Ca, and Al Ca (Fig. 9b, 9c), suggests more than one environmental process affects Mg Ca in the tests as the other element Ca are considered proxies to different environmental characteristics such as salinity, productivity, and terrigenous input (Chang et al., 2015; Mesa-Fernández et al., 2022; Beasley et al., 2021; Haug et al., 2003). This is also reinforced by the positive correlation to MLD and the negative correlation to temperature, salinity and pH (Fig. 9 and RDA panels in Figs. 3–7). Additionally, Mg Ca in G. ruber albus show a relative strong positive correlation to temperature, salinity and pH and a negative correlation to MLD (Figs. 9a and 3h, p and x). Similar to G. ruber albus, in the T. clarkei types Sr Ca, B Ca, Co Ca and Nd Ca display a much weaker relationship to other elements making them more suitable proxies for distinct and independent environmental properties.
In G. ruber albus, Mg Ca, Sr Ca and B Ca show no significant relationships with other element ratios, indicating that independent processes likely govern their proxy systematics (Fig. 9c). Similarly, Co Ca, Nd Ca and U Ca also do not correlate with other element Ca. While Na Ca and Ba Ca exhibit some degree of correlation, as do Mn Ca and Pb Ca, the lithophilic elements, Al Ca, Ti Ca, which are considered proxies for terrigenous dust input (Chang et al., 2015; Mesa-Fernández et al., 2022; Beasley et al., 2021), as well as, Fe Ca, and Th Ca, all show a relative strong correlation. Their correlation implies they can be used together for reconstructing terrigenous input to the water column. Among the lithophilic elements, Th Ca display a relatively weaker relationship, suggesting a potential effect of additional processes such as scavenging (Anderson et al., 1983; Francois et al., 2004; Costa et al., 2020).
4.3 Mg Ca as a proxy for sea surface temperature
Shell-bound Mg Ca of calcareous foraminifera have been extensively utilized as a paleo-thermometer (e.g., Nürnberg et al., 1996; Sadekov et al., 2009). Many of these Mg-temperature calibrations rely on whole-test or pooled-mean Mg Ca values to reconstruct past sea surface temperatures (Spero et al., 2003; Ganssen et al., 2011; and others). Several studies have measured intra-test and inter-test Mg Ca in an effort to produce Mg-temperature calibrations using single chamber measurements of G. ruber (Sadekov et al., 2008; Bolton et al., 2011; Davis et al., 2020; Levy et al., 2023; Fischer et al., 2024). Previous work on sediment trap-derived specimens of T. clarkei and G. ruber albus from the GOA indicated that T. clarkei is not suitable for temperature reconstructions, due to its presumed deep dwelling-depth below the thermocline together with its high sensitivity to water column mixing events. However, while G. ruber albus shows exceptionally high pooled mean Mg Ca values in the GOA in comparison to other ocean regions, it also exhibits seasonal variations that indicate effective applicability as a paleothermometer (Levy et al., 2023). Due to the high seawater salinity of the GOA, a local calibration curve was proposed (Eq. 1; Levy et al., 2023).

Figure 10G. ruber albus Mg Ca-derived temperatures versus measured temperatures (red). The calculated temperatures were derived from Eq. (1) for individual chambers. See also Levy et al. (2023).
Pooled mean values of Mg Ca in G. ruber albus taken from all water column depths in the GOA reflect MLD temperatures (Figs. 10, 9). Inter-chamber variability (ICV) has been shown to affect the local Mg Ca temperature calibration (Eq. 1) of G. ruber albus (Levy et al., 2023; Fig. 10). Generally, Mg Ca-derived temperatures from chambers F-1 and F-2 correspond closely with mixed layer depth (MLD) temperatures. However, beneath the photic zone, Mg Ca of all three chambers F0, F-1, and F-2 of the G. ruber albus specimens exhibit poor fits with measured temperatures (Fig. 10). Given that G. ruber albus calcifies its shell in the photic zone (Schiebel and Hemleben, 2017), these findings support the use of Mg Ca as a paleothermometer for the mixed layer (Nürnberg et al., 1996). Sadekov et al. (2009) measured F0-Mg Ca in core top individuals of G. ruber albus from various latitudes and have reported an agreement with sea surface temperature. Hupp and Fehrenbacher (2024) measured intra-test variability in the polar and sub-polar species Neogloboquadrina incompta, N. pachyderma, and Turborotalita quinqueloba and have not reported any issues regarding the use of F0 for temperature reconstruction. In the GOA however, the Mg Ca-derived temperatures from chamber F0 calculate lower Mg Ca temperatures of the MLD than chambers F-1 and F-2 (Fig. 10). Although Mg Ca data from chambers F-1 and F-2 appear suitable for reconstructing temperatures and demonstrate agreement with MLD temperature trends, the high ICV in G. ruber albus is evidently too great to accurately reflect ambient temperatures using this calibration. Therefore, and based on these new observations, we suggest that optimal Mg Ca-temperature calibration (Eq. 1) should be based on the pooled mean of the F-1 and F-2 chambers at all depths as the final chamber might lead to different results while reconstructing temperature.
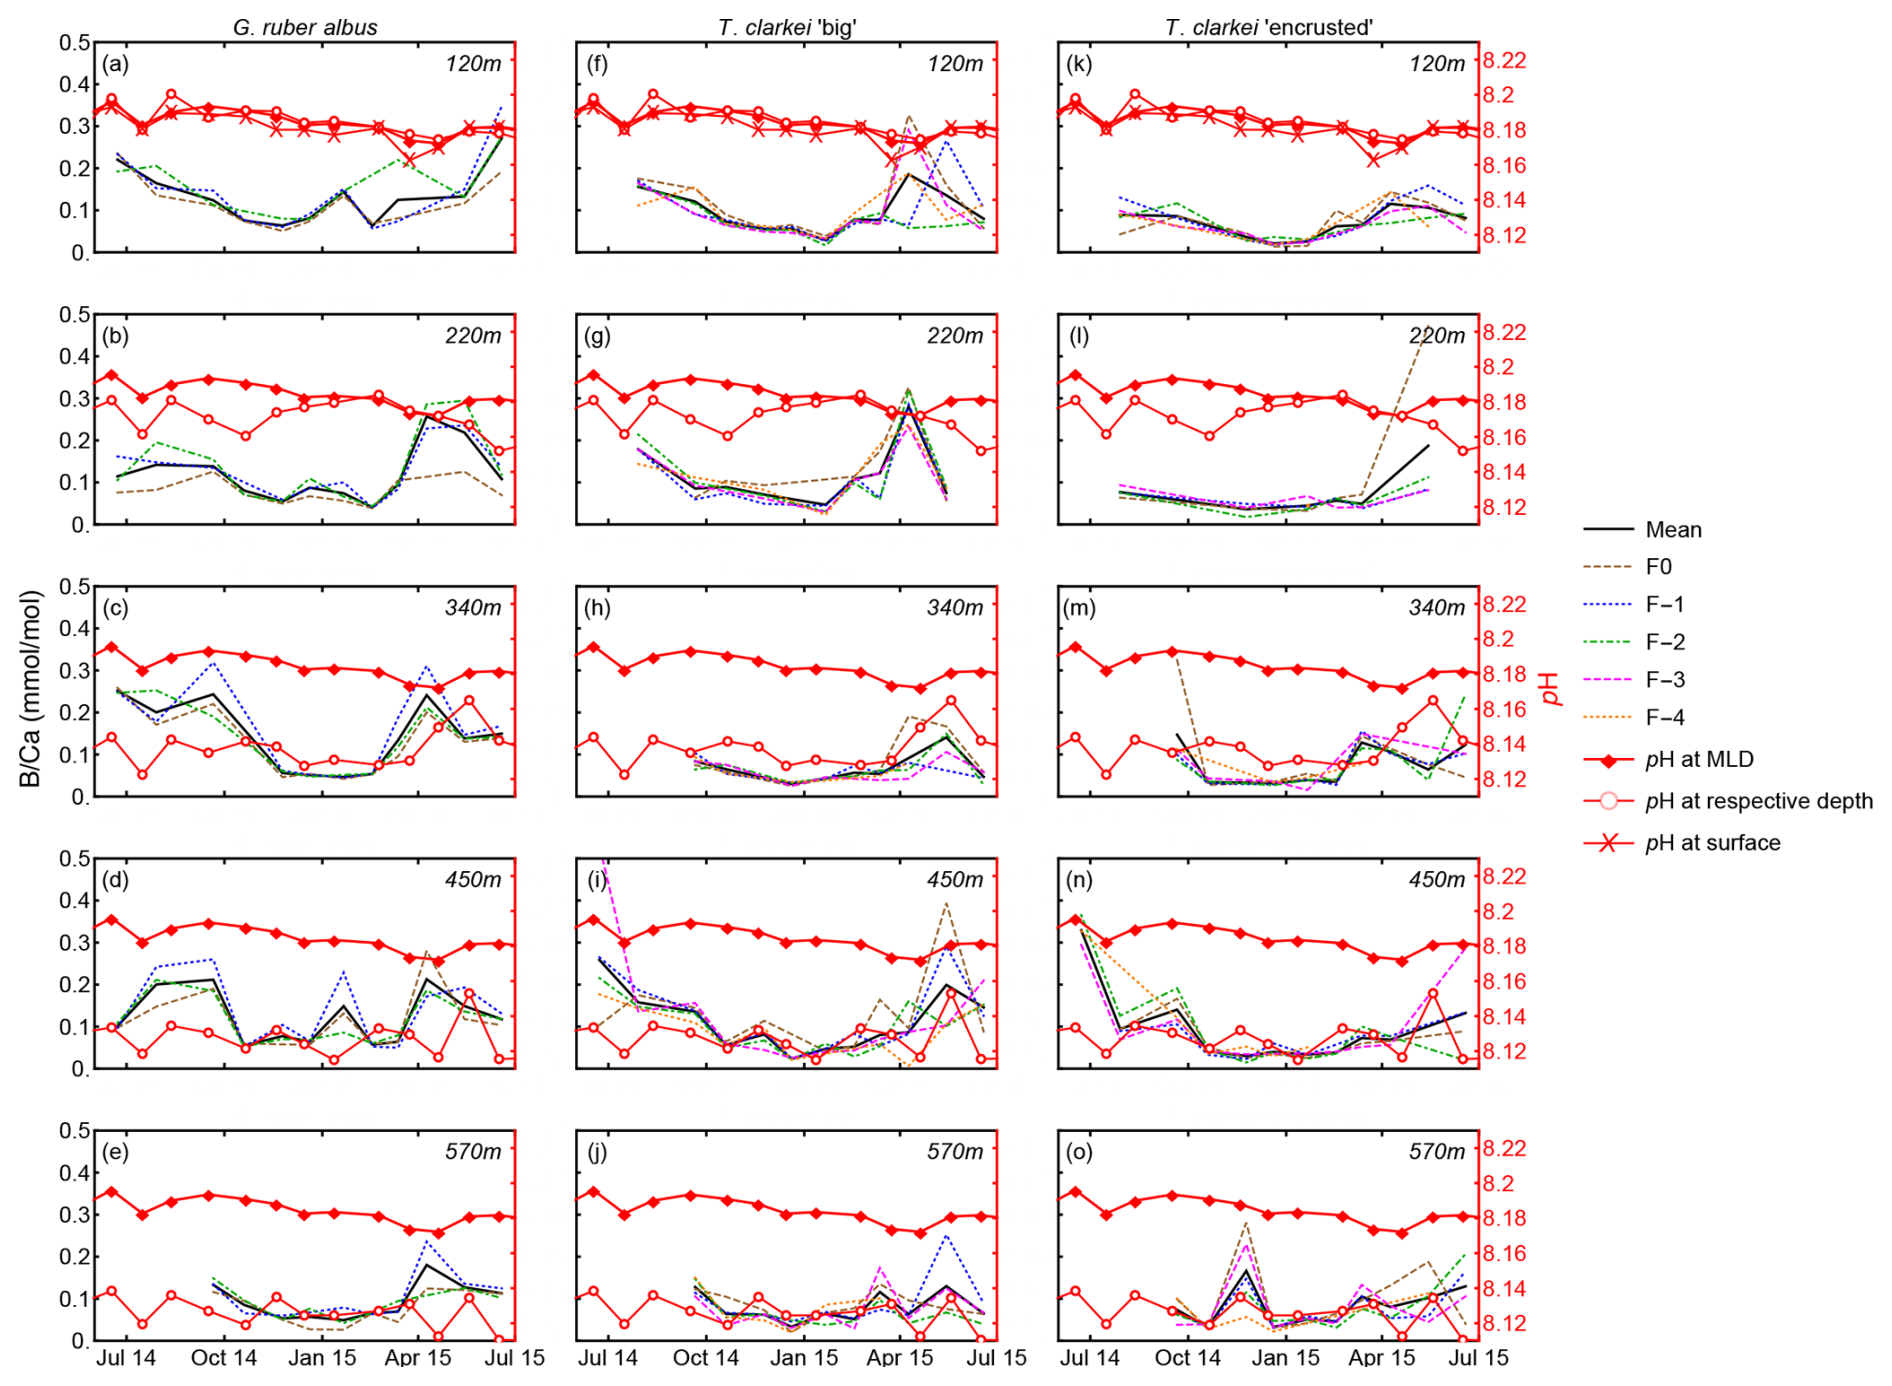
Figure 11Single chamber B Ca and in situ pH measured at MLD depth (empty red circles) and 120 m water depth for G. ruber albus, T. clarkei “big” and T. clarkei “encrusted”.
4.4 B Ca as a proxy for pH
B Ca in some PF species has been suggested to be a proxy for pH (Yu et al., 2007; Allen et al., 2011). Comparing chamber B Ca of both G. ruber albus and T. clarkei (both “big” and “encrusted”) alongside pH at various water column depths in the GOA reveals contrasting results. While B Ca in G. ruber albus exhibits seasonality (Fig. 5), with lower values during winter months, it does not appear to be consistent with the pH of respective water depth nor the MLD (Fig. 11). This inconsistency suggests that B Ca in G. ruber albus from the GOA is not a reliable recorder of ambient water pH. Similarly, Henehan et al. (2015) and Naik and Naidu (2014) reported that B Ca of open ocean core-top samples and down-core sediment samples do not display a pH relationship.
Alternatively, B Ca in G. ruber albus may be sensitive to salinity and micro-environments produced by PF symbionts with pH levels which are distinct from the ambient water column. Culture experiments have shown that B Ca is affected by salinity and increases with increasing salinity (Allen et al., 2012). However, only small salinity changes occur in the GOA (Fig. 1), which argue against a strong B Ca-salinity relationship that would result in a B Ca seasonal trend. It was suggested that photo-symbionts such as dinoflagellates in G. ruber albus create micro-environments with pH levels, which are distinct from ambient seawater, to accommodate for their photosynthetic activity, and indicate that B Ca is more affected by pH in those micro-environments than the water column pH (Hönisch et al., 2021; Babila et al., 2014). An additional observation for the G. ruber albus B Ca values is that they are relatively high in comparison to values from other studies. The relatively high salinity in the GOA (∼ 41), combined with the photosymbiont activity in G. ruber albus may explain the elevated B Ca values (Henehan et al., 2015; Hönisch et al., 2021; Babila et al., 2014).
In contrast to G. ruber albus, B Ca in the photosymbiont barren T. clarkei may possibly record the changes in pH (Fig. 11) of seawater at its assumed ambient dwelling depth (i.e., 340–570 m), indicative of shifting between the deeper water column depth horizons where pH changes are evident. Based on the fluxes of T. clarkei (Chernihovsky et al., 2018; Fig. 2), the B Ca of T. clarkei in the sediment record likely represent the pH beneath the thermocline and within the deep-water column horizons for specimens that lived from early winter through spring. In particular, pH at 340 m trends appear to follow the B Ca trends of T. clarkei types. For B Ca-pH calibrations utilizing the pooled mean of data from the chambers F-1, F-2, and F-3 may be used, while excluding the F0 and F-4 chambers where more ICV is visually apparent (Fig. 11).

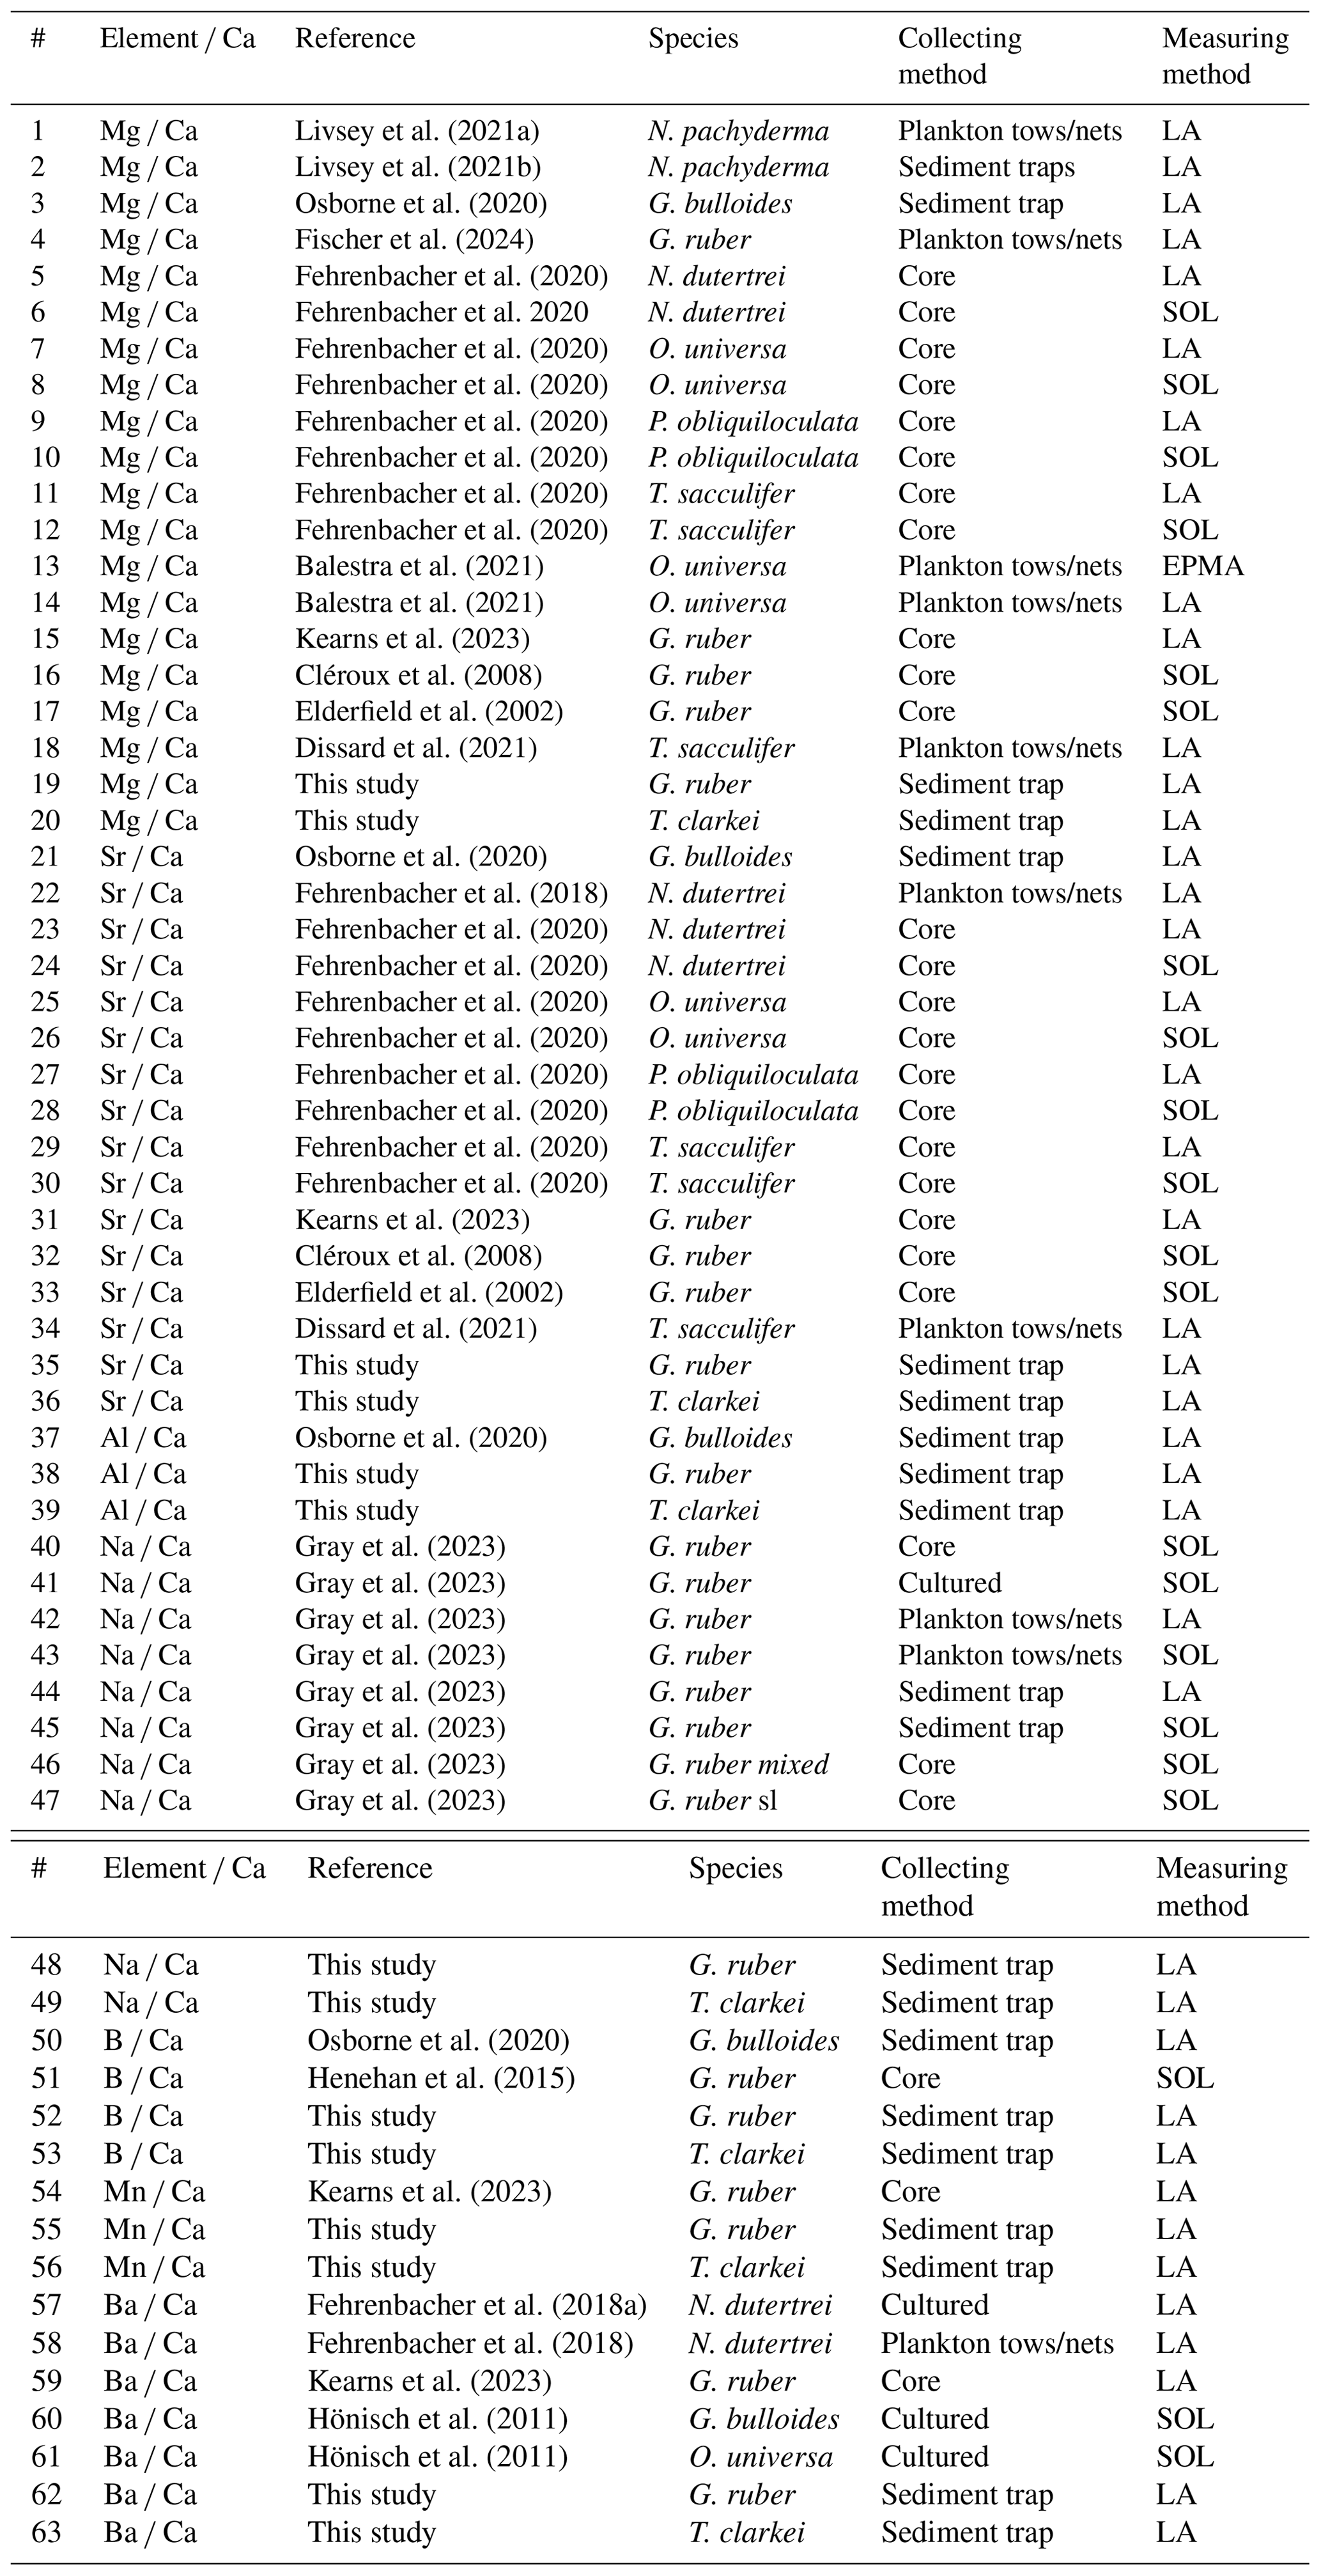
Figure 12Global comparison of major and trace element-to-calcium ratios. (a) sample global map, (b) Mg Ca of N. pachyderma, G. bulloides, G. ruber white, N. dutertrei, O. universa, P. obliquiloculata, T. sacculifer and T. clarkei derived from various sources (plankton tows/nets, sediment traps, cores) and measured by Laser Ablation (LA)-ICP-MS, solution-ICP-MS (SOL) and Electron micro-probe analyses (EPMA). (c) Sr Ca of G. bulloides, G. ruber white, N. dutertrei, O. universa, P. obliquiloculata, T. sacculifer and T. clarkei derived from various sources (plankton tows/nets, sediment traps, cores) and measured by LA-ICP-MS and solution-ICP-MS. (d) Al Ca of G. bulloides, G. ruber white and T. clarkei derived from sediment traps and measured by LA-ICP-MS. (e) Na Ca of G. ruber white and T. clarkei from various sources (plankton tows/nets, sediment traps, cores and cultured samples) and measured by LA-ICP-MS and solution-ICP-MS. (f) B Ca of G. bulloides, G. ruber white and T. clarkei derived from sediment traps and measured by LA-ICP-MS. (g) Mn Ca of G. ruber white and T. clarkei derived from cores and sediment traps and measured by LA-ICP-MS. (h) Ba Ca of G. ruber white, N. dutertrei and T. clarkei derived from various sources (plankton tows/nets, sediment traps, cores and cultured samples) and measured by LA-ICP-MS. See Table 1 for detailed description of methods.
4.5 Na Ca as a proxy for salinity and Ba Ca as an indicator for productivity
Cultured individuals and samples from the surface Caribbean and the Gulf of Guinea of live T. sacculifer indicate that Na Ca can be used as a proxy for salinity, without temperature dependence, however, a species-specific calibration might be required (Bertlich et al., 2018). Despite the high variability of PF Na Ca values in the GOA during water column mixing (Fig. 6), salinity remains high and relatively constant, ranging between 40.4–40.7. Consequently, a local Na Ca-salinity calibration shows no significant relationship for any of the three PF morphotypes.
Na Ca values in PF from the GOA are notably higher compared to other regions. Gray et al. (2023) explored the relationship between Na Ca and salinity in G. ruber albus collected from sediment traps, plankton tows, culture samples, and core top samples, contributing to the ongoing discussions regarding the reliability of Na Ca as a proxy for salinity in both planktic and benthic foraminifera (Allen et al., 2016; Geerken et al., 2018; Mezger et al., 2016, 2018; Gray et al., 2023, and references therein). They concluded that the measurement method (i.e., “solution” ICP-MS vs. LA-ICP-MS) influences the values of Na Ca and in turn the relationship with salinity, i.e., weak in solution-based compared to significant in laser ablation-based, at salinity over 36.
Comparing Na Ca of G. ruber albus from the shallowest sediment trap (120 m) in the GOA with the Na Ca of G. ruber albus plankton tows-samples from the GOA deployed and collected in January 2010 and October 2013 (Gray et al., 2023), both measured using LA-ICP-MS, generally reveals similar results, excluding the high-value excursions observed in some single chamber measurements (Fig. 6). Turborotalita clarkei in the GOA exhibits elevated Na Ca values in both “big” and “encrusted” compared to G. ruber albus. Unlike G. ruber albus, there is relatively higher variability between water depths as well as significantly higher values in March, April, and May associated with water column mixing (Fig. 6). During these mixing events, nutrient-rich, high salinity (∼ 40.7) water ascend upward. Therefore, the Na Ca of T. clarkei may serve as a proxy for water column stability, i.e., stratification vs. mixing.
The Ba Ca in the three morpho-species show a relatively strong correlation with Na Ca (0.74 and 0.82 in T. clarkei “big” and “encrusted” respectively, and 0.54 in G. ruber albus, the second highest ratio and exceeded only by the 0.57 of Pb Ca). Ba Ca is presumably unaffected by temperature, salinity, and pH (Hönisch et al., 2011). In non-spinose species, Ba Ca typically shows positive relationships with productivity and potentially can be used as an indicator of river run-off (Fritz-Endres et al., 2022; Hönisch et al., 2011; Weldeab et al., 2014). Although floods in the catchment area of the GOA are brief and occur only few times each year (Katz et al., 2015), significant Ba Ca perturbations during water column mixing may reflect nutrient-rich water admixing to the surface water (Fig. 7).
5.1 Temporal and vertical dynamics of element Ca in the GOA
Trace element incorporation into the calcium carbonate shells of planktic foraminifera during calcification is controlled by environmental and ecological factors in the water column such as temperature, salinity, pH, the carbonate system, dust and terrigenous inputs, as well as whether a species harbor photosymbionts (Schiebel and Hemleben, 2017; and others). Shells of G. ruber albus, T. clarkei “big” and T. clarkei “encrusted” from the GOA show species-specific behavior and offer new insights into how these species respond to the vertical and temporal variations in the water column. For most elements, the smaller T. clarkei specimens display higher trace element ratios than the larger G. ruber albus, suggesting more efficient trace element incorporation to the shell or implying that its habitat deeper in the water column has conditions which result in higher trace element incorporation (Fig. 8). Some element ratios such as Mg Ca, Sr Ca, B Ca, Na Ca (for G. ruber albus) and Ba Ca for both G. ruber albus and T. clarkei “encrusted”, show overlap between specimens from the water column and from core-tops (Fig. 8), confirming the robustness of downcore-based records allowing to further consider these element Ca recorders of the water column as paleo-proxies.
While water depth likely influences element Ca through variations in physical and chemical conditions, the observed inter-chamber variability (ICV) and element Ca differences between species cannot be attributed to any single environmental parameter. Nonetheless, elements such as Al Ca, Ti Ca, Mn Ca, and Fe Ca for all species, and Mg Ca, Sr Ca, Na Ca, and Ba Ca for G. ruber albus alone, demonstrate consistent behavior across the water column, suggesting that depth-related factors do not significantly alter calcification mechanisms. This supports the use of pooled mean values for specimens over multiple sediment traps spread over depths (Levy et al., 2023). Interestingly, most element Ca peak during water column mixing in March–April 2015 for all three morphotypes analyzed here, accompanied by larger ICV (Figs. 3–7). Mg Ca in G. ruber albus and Sr Ca in all three morpho-species show less pronounced excursions, while other trace element ratios (e.g., Co Ca, U Ca) exhibit more variability and more extreme values (Figs. S5 and S10). These observations can reflect: (i) primary calcite structure alterations driven by environmental shifts and life cycle changes, (ii) secondary mineralization (e.g., barite, Amorphous Calcium Carbonate, ACC) (Torres et al., 2010; Evans et al., 2020 and references therein), and (iii) fluid inclusions within the shell structure (Gray et al., 2023).
All of these relationships do possibly concern the ontogenetic PF calcite, since SEM imaging of GOA specimens did not reveal secondary minerals or overgrowth on shell calcite (Levy et al., 2023). Moreover, the enrichment of multiple trace elements across species suggests that secondary minerals are unlikely to be responsible for these trends. Discrepancies between Na Ca in plankton tow versus core-top samples in the Red Sea (Mezger et al., 2018), as well as higher Na Ca values measured by LA-ICP-MS compared to solution ICP-MS, have been linked to early diagenesis of Na-enriched phases like spines, ACC, or fluid inclusions (Gray et al., 2023). However, spines and ACC were ruled out for GOA samples, as all of the specimens had lost their spines before analysis and ACC was not detected via SEM. Given that most element Ca in GOA shells are elevated relative to PF data from elsewhere, fluid inclusions may be a contributing factor (Gray et al., 2023). However, more research is required to investigate whether fluid inclusions are evident in PF shells from the GOA. In the absence of fluid inclusions, environmental changes, particularly during water column mixing, are considered to be the primary drivers of the observed trace element Ca enrichments in the GOA.
Table 1Detailed description of the different species, measurement methods and sample origin used for the compilation in Fig. 12. LA stands for Laser Ablation (LA)-ICP-MS, SOL is solution-ICP-MS and EPMA is Electron micro-probe analyses.
5.2 Water column and sediment signal correlation: Implications to Paleoceanographic studies
Several element ratios (e.g., Al Ca, Ti Ca, Mn Ca, Fe Ca, Nd Ca, U Ca, Co Ca, and Th Ca) exhibit discrepancies between water column and core-top specimens (Fig. 8). Some, like Co Ca, have lower values in surface sediment than the water column, while others, like Fe Ca show higher values. Differences between sediment trap samples and core-top samples may stem from differential diagenetic processes that affect element Ca in specimens taken from the water column and the sea floor. For example, diagenetic processes can lead to Mn accumulation and higher Mn Ca in PF from the core top (McKenzie, 1980; Steiner et al., 2017). Conversely, core-top PF samples may show lower ratios due to the release of these metals into pore water over time (e.g., Co Ca, Fig. 8i). This release can alter the elemental composition, potentially skewing paleoenvironmental reconstructions. Understanding these processes is crucial for accurately interpreting geochemical data from both sample types.
Despite the offsets of Al Ca and Ti Ca between core top and water column specimens, they nevertheless may be utilized to trace the origins of terrigenous inputs and identify periods of dust deposition in the geological record (Torfstein et al., 2017; Martínez-Garcia et al., 2011). Our data reveal significant seasonal excursions in Al Ca and may demonstrate the use of Al Ca and Ti Ca in PF tests as proxies for dust or terrigenous input to the ocean (Fig. S3).
Core top element Ca values that fall within the same range of values of the sediment trap specimens (Mg Ca, Sr Ca, B Ca, Na Ca, and Ba Ca; Fig. 8) suggest that they could reflect water column conditions. The high temporal variability in many of these element Ca data, together with the varying PF population dynamics throughout the year (Fig. 2) may be considered when approaching PF from sediment cores. Seasonal trends in element Ca are often obscured by the spring mixing event. However, exceptions to this are observed in Mg Ca for G. ruber albus (Fig. 4; Levy et al., 2023) and B Ca for T. clarkei (Fig. 5), where clear seasonal patterns emerge. A key limitation of reconstructing past environments from element Ca in PF shells is the challenge of disentangling seasonal effects from other more episodic environmental signals. However, by identifying water column mixing events through positive element Ca excursions and elevated ICV, which are evident across all species (Figs. 3–7), it may be possible to identify the time intervals over which environmental changes are reconstructed. This could allow for more accurate reconstructions of shifts in temperature, carbonate chemistry, and nutrient availability during specific mixing events, improving our understanding of past ocean conditions.
5.3 Regional comparison of geochemical conditions and PF element Ca
The Mg Ca, Al Ca, and Na Ca in PF from the GOA generally exceed those reported from other regions (Fig. 12b – 12e). Sr Ca values, while reaching up to 2.2 mmol mol−1 during spring, have an average of 1.5 mmol mol−1, consistent with previous studies (Fig. 12c; Kısakürek et al., 2008; Cléroux et al., 2008; Elderfield et al., 2002; Brown and Elderfield, 1996; Dissard et al., 2021). The high Mg Ca range in the GOA versus typical open-ocean levels (0.5–5 µmol mol−1) is attributed to elevated salinity (∼ 41 compared to mean ocean values of 34.7), which is also evident by the high Na Ca. The high Al Ca values and their large variation may be attributed to the close proximity of GOA to terrestrial input. Ba Ca in the GOA are significantly higher than the values reported in prior studies from Atlantic Ocean core samples and culture experiments (Hönisch et al., 2011; Lea and Boyle, 1991), representing a roughly ten-fold difference. These discrepancies likely stem from two factors: (1) higher salinity in the GOA increases the availability of cations and trace element incorporation into foraminifera shells, and (2) higher-resolution measurements here which reveal chamber-specific elemental ratios, where early chambers (F-1 and F-2) exhibit higher values than final chambers, leading to more accurate, chamber-level data compared to bulk measurements. Combined, these factors explain the elevated values relative to global reports.
We investigated the effects of inter-chamber variability on the proxy systematics in the hyper saline oligotrophic GOA using single chamber LA ICP-MS analysis measured on two flux- dominating planktic foraminifer (PF) species G. ruber albus and T. clarkei with its two phenotypes “big” and “encrusted”. We observed how element Ca varies in PF chambers as a function of environmental changes in order to then be used as proxies for past oceanic and climatic reconstruction. The results show that some element Ca exhibit temporal and seasonal variations related to environmental conditions in the water column such as Mg Ca in G. ruber albus as a temperature proxy, and B Ca in T. clarkei as a proxy of pH. Although other element Ca values display more limited variability (e.g., Na Ca) they may still be of use as paleo-proxies when combined in global calibration studies.
Water column mixing has been shown to have a significant effect of element Ca positive excursions in the analyzed G. ruber albus, and two T. clarkei morphotypes, which may limit the use of some element ratios as proxies, or alternatively, be used as a proxy for water column mixing. Generally, pooled-mean values of element Ca in the PF tests in the GOA are species-specific and element-specific, and are elevated compared to other regions (e.g., Mg Ca, Al Ca, Na Ca). However, the final chamber F0 is different in comparison to the preceding chambers F-1 and F-2, suggesting that the element composition of F0 may be biased and unreliable in terms of recording environmental conditions.
Our findings indicate that high-resolution analytical techniques, such as LA ICP-MS enable studying single chamber compositions and variations. Although pooled mean values of specimens over various water depths are recommended for their incorporation as proxies, ICV can also be used as a tracer of environmental factors. Exploring different biochemical or physiological mechanisms which are responsible for the element Ca variations between species and chambers are critical to shed light on how element Ca are incorporated to the PF shells. Despite these limitations, the results provide valuable insights into the complex behavior of element Ca in PF shells.
Tabular supplementary data generated in this study can be found in the Supplement.
The supplement related to this article is available online at https://doi.org/10.5194/bg-23-1065-2026-supplement.
NL, AT, and RS designed the study; NL, BS, UW, and KPJ, performed the measurements; NL, NC, AT, and RS analyzed the data; NL, RS and AT wrote the manuscript draft; NL, RS, AT and GH reviewed and edited the manuscript.
The contact author has declared that none of the authors has any competing interests.
Publisher's note: Copernicus Publications remains neutral with regard to jurisdictional claims made in the text, published maps, institutional affiliations, or any other geographical representation in this paper. The authors bear the ultimate responsibility for providing appropriate place names. Views expressed in the text are those of the authors and do not necessarily reflect the views of the publisher.
We wish to acknowledge the IUI marine crew and B. Yarden for their assistance in field work and sample handling. The National Monitoring Program are thanked for their support and sharing results and E. Levy for fruitful discussions. We are thankful for the two reviewers, Lennart de Nooijer and Takashi Toyofuku, whose their comments significantly improved this manuscript. This work was supported by Israel Science Foundation grant 809/24 (to Adi Torfstein ), a Minerva PhD Fellowship stipend (to Noy Levy) and a scholarship from the Advance School for Environmental Studies, HUJI (to Noy Levy).
This research has been supported by the Israel Science Foundation (grant no. 809/24).
The article processing charges for this open-access publication were covered by the Max Planck Society.
This paper was edited by Edouard Metzger and reviewed by Lennart de Nooijer and Takashi Toyofuku.
Allen, K. A., Hönisch, B., Eggins, S. M., Yu, J., Spero, H. J., and Elderfield, H.: Controls on boron incorporation in cultured tests of the planktic foraminifer Orbulina universa, Earth Planet. Sc. Lett., 309, 291–301, 2011.
Allen, K. A., Hönisch, B., Eggins, S. M., and Rosenthal, Y.: Environmental controls on B Ca in calcite tests of the tropical planktic foraminifer species Globigerinoides ruber and Globigerinoides sacculifer, Earth Planet. Sc. Lett., 351, 270–280, 2012.
Allen, K. A., Hönisch, B., Eggins, S. M., Haynes, L. L., Rosenthal, Y., and Yu, J.: Trace element proxies for surface ocean conditions: A synthesis of culture calibrations with planktic foraminifera, Geochim. Cosmochim. Ac., 193, 197–221, 2016.
Amaglio, G., Petrizzo, M. R., Wolfgring, E., Holbourn, A., and Kuhnt, W.: Paleoceanographic changes across OAE 2 inferred from resilient foraminifera and XRF data at southern high latitudes (IODP Sites U1513 and U1516, Mentelle Basin, SW Australia), Palaeogeogr. Palaeocl., 657, 112578, https://doi.org/10.1016/j.palaeo.2024.112578, 2025.
Anderson, R. F., Bacon, M. P., and Brewer, P. G.: Removal of 230Th and 231Pa from the open ocean, Earth Planet. Sc. Lett., 62, 7–23, 1983.
Babila, T. L., Rosenthal, Y., and Conte, M. H.: Evaluation of the biogeochemical controls on B Ca of Globigerinoides ruber white from the Oceanic Flux Program, Bermuda, Earth Planet. Sc. Lett., 404, 67–76, 2014.
Balestra, B., Rose, T., Fehrenbacher, J., Knobelspiesse, K. D., Huber, B. T., Gooding, T., and Paytan, A.: In Situ Mg Ca Measurements on Foraminifera: Comparison Between Laser Ablation Inductively Coupled Plasma Mass Spectrometry and Wavelength-Dispersive X-Ray Spectroscopy by Electron Probe Microanalyzer, Geochem. Geophy. Geosy., 22, e2020GC009449, https://doi.org/10.1029/2020GC009449, 2021.
Bé, A. W., Hemleben, C., Anderson, O. R., Spindler, M., Hacunda, J., and Tuntivate-Choy, S.: Laboratory and field observations of living planktonic foraminifera, Micropaleontology, 23, 155–179, https://doi.org/10.2307/1485330, 1977.
Beasley, C., Kender, S., Giosan, L., Bolton, C. T., Anand, P., Leng, M. J., Nilsson-Kerr k., Ullmann C. V., Hesselbo S. P., and Littler, K.: Evidence of a South Asian proto-monsoon during the Oligocene-Miocene transition, Paleoceanogr. Paleoclimatol., 36, e2021PA004278, https://doi.org/10.1029/2021PA004278, 2021.
Berggren, W. A., Kent, D. V., Swisher, C. C., and Aubry, M. P.: A revised Cenozoic geochronology and chronostratigraphy, in: Geochronology, Time Scales and Global Stratigraphic Correlation, https://doi.org/10.2110/pec.95.04.0129, 1995.
Bertlich, J., Nürnberg, D., Hathorne, E. C., de Nooijer, L. J., Mezger, E. M., Kienast, M., Nordhausen, S., Reichart, G.-J., Schönfeld, J., and Bijma, J.: Salinity control on Na incorporation into calcite tests of the planktonic foraminifera Trilobatus sacculifer – evidence from culture experiments and surface sediments, Biogeosciences, 15, 5991–6018, https://doi.org/10.5194/bg-15-5991-2018, 2018.
Bolton, A., Baker, J. A., Dunbar, G. B., Carter, L., Smith, E. G., and Neil, H. L.: Environmental versus biological controls on Mg Ca variability in Globigerinoides ruber (white) from core top and plankton tow samples in the southwest Pacific Ocean, Paleoceanography, 26, https://doi.org/10.1029/2010PA001924, 2011.
Brummer, G. J. A. and Kučera, M.: Taxonomic review of living planktonic foraminifera, J. Micropalaeontol, 41, 29–74, 2022.
Brown, S. J. and Elderfield, H.: Variations in Mg Ca and Sr Ca ratios of planktonic foraminifera caused by postdepositional dissolution: Evidence of shallow Mg-dependent dissolution, Paleoceanography, 11, 543–551, 1996.
Chang, F., Li, T., Xiong, Z., and Xu, Z.: Evidence for sea level and monsoonally driven variations in terrigenous input to the northern East China Sea during the last 24.3 ka, Paleoceanography, 30, 642–658, 2015.
Chase, Z., Paytan, A., Beck, A., Biller, D., Bruland, K., Measures, C., and Sañudo-Wilhelmy, S.: Evaluating the impact of atmospheric deposition on dissolved trace-metals in the Gulf of Aqaba, Red Sea, Mar. Chem., 126, 256–268, 2011.
Chernihovsky, N., Torfstein, A., and Almogi-Labin, A.: Seasonal flux patterns of planktonic foraminifera in a deep, oligotrophic, marginal sea: Sediment trap time series from the Gulf of Aqaba, northern Red Sea, Deep-Sea Res. Pt. I, 140, 78–94, 2018.
Chernihovsky, N., Almogi-Labin, A., Kienast, S. S., and Torfstein, A.: The daily resolved temperature dependence and structure of planktonic foraminifera blooms, Sci. Rep.-UK, 10, 17456, https://doi.org/10.1038/s41598-020-74342-z, 2020.
Cléroux, C., Cortijo, E., Anand, P., Labeyrie, L., Bassinot, F., Caillon, N., and Duplessy, J. C.: Mg Ca and Sr Ca ratios in planktonic foraminifera: Proxies for upper water column temperature reconstruction, Paleoceanography, 23, https://doi.org/10.1029/2007PA001505, 2008.
Costa, K. M., Hayes, C. T., Anderson, R. F., Pavia, F. J., Bausch, A., Deng, F., Dutay, J., Geibert, W. Heinze, C., Henderson, G., Hillaire-Marcel, C., Hoffmann, S., Jaccard, S. L., Jacobel, A. W., Kienast, S. S., Kipp, L., Lerner, P., Lippold, J., Lund, D., Marcantonio, F., McGee, D., McManus, J. F., Mekik, F., Middleton, J. L., Missiaen, L., Not, C., Pichat, S., Robinson, L. F., Rowland, G. H., Roy-Barman, M., Tagliabue, A., Torfstein, A., Winckler, G., and Zhou, Y.: 230Th normalization: New insights on an essential tool for quantifying sedimentary fluxes in the modern and Quaternary ocean, Paleoceanogr. Paleoclimatol., 35, e2019PA003820, https://doi.org/10.1029/2019PA003820, 2020.
Davis, C. V., Fehrenbacher, J. S., Benitez-Nelson, C., and Thunell, R. C.: Trace element heterogeneity across individual planktic foraminifera from the Modern Cariaco Basin, J. Foramin. Res., 50, 204–218, 2020.
Dissard, D., Reichart, G. J., Menkes, C., Mangeas, M., Frickenhaus, S., and Bijma, J.: Mg Ca, Sr Ca and stable isotopes from the planktonic foraminifera T. sacculifer: testing a multi-proxy approach for inferring paleotemperature and paleosalinity, Biogeosciences, 18, 423–439, https://doi.org/10.5194/bg-18-423-2021, 2021.
Eggins, S., De Deckker, P., and Marshall, J.: Mg Ca variation in planktonic foraminifera tests: implications for reconstructing palaeo-seawater temperature and habitat migration, Earth Planet. Sc. Lett., 212, 291–306, 2003.
Elderfield, H., Vautravers, M., and Cooper, M.: The relationship between shell size and Mg Ca, Sr Ca, δ18O, and δ13C of species of planktonic foraminifera, Geochem. Geophy. Geosy., 3, 1–13, 2002.
Evans, D., Gray, W. R., Rae, J. W., Greenop, R., Webb, P. B., Penkman, K., Kröger, R., and Allison, N.: Trace and major element incorporation into amorphous calcium carbonate (ACC) precipitated from seawater, Geochim. Cosmochim. Ac., 290, 293–311, 2020.
Fehrenbacher, J., Russell, A. D., Davis, C. V., Spero, H. J., Chu, E., and Hönisch, B.: Average barium calcium ratios of cultured foraminifer specimens of Neogloboquadrina dutertrei, listed by experiment, PANGAEA [data set], https://doi.org/10.1594/PANGAEA.895792, 2018.
Fehrenbacher, J., Marchitto, T., and Spero, H. J.: Comparison of Laser Ablation and Solution-Based ICP-MS Results for Individual Foraminifer Mg Ca and Sr Ca Analyses, Geochem. Geophy. Geosy., 21, e2020GC009254, https://doi.org/10.1029/2020GC009254, 2020.
Fischer, A., Schiebel, R., Jochum, K. P., Heins, L., Arns, A. I., Aardema, H. M., Slagter, H., Calleja, M. L., Levy, N., Stoll, B., Weis, U., Repschläger, J., and Haug, G. H.: Single chamber Mg Ca analyses of Globigerinoides ruber for paleo-proxy calibration using femtosecond LA-ICP-MS, Sci. Data, 11, 583, https://doi.org/10.1038/s41597-024-03402-0, 2024.
Francois, R., Frank, M., Rutgers van der Loeff, M. M., and Bacon, M. P.: 230Th normalization: An essential tool for interpreting sedimentary fluxes during the late Quaternary, Paleoceanography, 19, https://doi.org/10.1029/2003PA000939, 2004.
Fritz-Endres, T., Fehrenbacher, J. S., Russell, A. D., and Cynar, H.: Increased productivity in the equatorial pacific during the deglaciation inferred from the Ba Ca ratios of non-spinose planktic foraminifera, Paleoceanogr. Paleoclimatol., 37, e2022PA004506, https://doi.org/10.1029/2022PA004506, 2022.
Ganor, E. and Foner, H. A.: Mineral dust concentrations, deposition fluxes and deposition velocities in dust episodes over Israel, J. Geophys. Res.-Atmos., 106, 18431–18437, 2001.
Ganssen, G. M., Peeters, F. J. C., Metcalfe, B., Anand, P., Jung, S. J. A., Kroon, D., and Brummer, G.-J. A.: Quantifying sea surface temperature ranges of the Arabian Sea for the past 20 000 years, Clim. Past, 7, 1337–1349, https://doi.org/10.5194/cp-7-1337-2011, 2011.
Geerken, E., de Nooijer, L. J., van Dijk, I., and Reichart, G.-J.: Impact of salinity on element incorporation in two benthic foraminiferal species with contrasting magnesium contents, Biogeosciences, 15, 2205–2218, https://doi.org/10.5194/bg-15-2205-2018, 2018.
Gray, W. R., Evans, D., Henehan, M., Weldeab, S., Lea, D. W., Müller, W., and Rosenthal, Y.: Sodium incorporation in foraminiferal calcite: An evaluation of the Na Ca salinity proxy and evidence for multiple Na-bearing phases, Geochim. Cosmochim. Ac., 348, 152–164, 2023.
Gupta, B. K. S.: Modern foraminifera, Dordrecht, Kluwer Academic Publishers, 7–36, https://doi.org/10.1007/0-306-48104-9, 1999.
Haug, G. H., Günther, D., Peterson, L. C., Sigman, D. M., Hughen, K. A., and Aeschlimann, B.: Climate and the collapse of Maya civilization, Science, 299, 1731–1735, 2003.
Haynes, L. L., Hönisch, B., Holland, K., Rosenthal, Y., and Eggins, S. M.: Evaluating the planktic foraminiferal B Ca proxy for application to deep time paleoceanography, Earth Planet. Sc. Lett., 528, 115824, https://doi.org/10.1016/j.epsl.2019.115824, 2019.
Henehan, M. J., Foster, G. L., Rae, J. W., Prentice, K. C., Erez, J., Bostock, H. C., Marshall, B. J., and Wilson, P. A.: Evaluating the utility of B Ca ratios in planktic foraminifera as a proxy for the carbonate system: A case study of Globigerinoides ruber, Geochem. Geophy. Geosy., 16, 1052–1069, 2015.
Hönisch, B., Allen, K. A., Russell, A. D., Eggins, S. M., Bijma, J., Spero, H. J., Lea, D. W., and Yu, J.: Planktic foraminifers as recorders of seawater Ba Ca, Mar. Micropaleontol., 79, 52–57, 2011.
Hönisch, B., Fish, C. R., Phelps, S. R., Haynes, L. L., Dyez, K., Holland, K., Fehrenbacher, J., Allen, K. A., Eggins, S. M., and Goes, J. I.: Symbiont photosynthesis and its effect on boron proxies in planktic foraminifera, Paleoceanogr. Paleoclimatol., 36, e2020PA004022, https://doi.org/10.1029/2020PA004022, 2021.
Hupp, B. N. and Fehrenbacher, J. S.: Intratest trace element variability in polar and subpolar planktic foraminifera: Insights into vital effects, ontogeny, and biomineralization processes, J. Foramin. Res., 54, 355–374, 2024.
Jochum, K. P., Stoll, B., Weis, U., Jacob, D. E., Mertz-Kraus, R., and Andreae, M. O.: Non-matrix-matched calibration for the multi-element analysis of geological and environmental samples using 200 nm femtosecond LA-ICP-MS: A comparison with nanosecond lasers, Geostand. Geoanal. Res., 38, 265–292, 2014.
Jochum, K. P., Jentzen, A., Schiebel, R., Stoll, B., Weis, U., Leitner, J., Repschläger, J., Nürnberg, D., and Haug, G. H.: High-resolution Mg Ca measurements of foraminifer shells using femtosecond LA-ICP-MS for paleoclimate proxy development, Geochem. Geophy. Geosy., 20, 2053–2063, 2019.
Jonkers, L., de Nooijer, L. J., Reichart, G.-J., Zahn, R., and Brummer, G.-J. A.: Encrustation and trace element composition of Neogloboquadrina dutertrei assessed from single chamber analyses – implications for paleotemperature estimates, Biogeosciences, 9, 4851–4860, https://doi.org/10.5194/bg-9-4851-2012, 2012.
Katz, M. E., Cramer, B. S., Franzese, A., Hönisch, B., Miller, K. G., Rosenthal, Y., and Wright, J. D.: Traditional and emerging geochemical proxies in foraminifera, J. Foramin. Res., 40, 165–192, 2010.
Katz, T., Ginat, H., Eyal, G., Steiner, Z., Braun, Y., Shalev, S., and Goodman-Tchernov, B. N.: Desert flash floods form hyperpycnal flows in the coral-rich Gulf of Aqaba, Red Sea, Earth Planet. Sc. Lett., 417, 87–98, 2015.
Kearns, L. E., Searle-Barnes, A., Foster, G. L., Milton, J. A., Standish, C. D., and Ezard, T. H. G.: The influence of geochemical variation among Globigerinoides ruber individuals on Paleoceanographic reconstructions, Paleoceanogr. Paleoclimatol., 38, e2022PA004549, https://doi.org/10.1029/2022PA004549, 2023.
Kısakürek, B., Eisenhauer, A., Böhm, F., Garbe-Schönberg, D., and Erez, J.: Controls on shell Mg Ca and Sr Ca in cultured planktonic foraminifera, Globigerinoides ruber (white), Earth Planet. Sc. Lett., 273, 260–269, 2008.
Kucera, M.: Chapter six planktonic foraminifera as tracers of past oceanic environments, Dev. Mar. Geol., 1, 213–262, 2007.
Lea, D. W. and Boyle, E. A.: Barium in planktonic foraminifera, Geochim. Cosmochim. Ac., 55, 3321–3331, 1991.
Levy, N., Torfstein, A., Schiebel, R., Chernihovsky, N., Jochum, K. P., Weis, U., Stoll, B., and Haug, G. H.: Temperature calibration of elevated Mg Ca in planktic Foraminifera shells from the hypersaline Gulf of Aqaba, Geochem. Geophy. Geosy., 24, e2022GC010742, https://doi.org/10.1029/2022GC010742, 2023.
Livsey, C. M., Kozdon, R., Bauch, D., Brummer, Geert-Jan A., Jonkers, L., Orland, I., Hill, T. M., and Spero, H. J.: In situ Magnesium/Calcium analyses by LA-ICP-MS in individual N. pachyderma shells from plankton tows deployed in the Fram Strait, PANGAEA [data set], https://doi.org/10.1594/PANGAEA.935527, 2021a.
Livsey, C. M., Kozdon, R., Bauch, D., Brummer, Geert-Jan A., Jonkers, L., Orland, I., Hill, T. M., and Spero, H. J.: Mg Ca analyses by LA-ICP-MS in N. pachyderma shells from Irminger Sea sediment traps, PANGAEA [data set], https://doi.org/10.1594/PANGAEA.935595, 2021b.
Martínez-Garcia, A., Rosell-Melé, A., Jaccard, S. L., Geibert, W., Sigman, D. M., and Haug, G. H.: Southern Ocean dust–climate coupling over the past four million years, Nature, 476, 312–315, 2011.
McKenzie, R. M.: The adsorption of lead and other heavy metals on oxides of manganese and iron, Soil Res., 18, 61–73, 1980.
Meeder, E., Mackey, K. R., Paytan, A., Shaked, Y., Iluz, D., Stambler, N., Rivlin, T., Post, A. F., and Lazar, B.: Nitrite dynamics in the open ocean clues from seasonal and diurnal variations, Mar. Ecol. Prog. Ser., 453, 11–26, 2012.
Mesa-Fernández, J. M., Martínez-Ruiz, F., Rodrigo-Gámiz, M., Jiménez-Espejo, F. J., García, M., and Sierro, F. J.: Paleocirculation and paleoclimate conditions in the western Mediterranean basins over the last deglaciation: New insights from sediment composition variations, Global Planet Change, 209, 103732, https://doi.org/10.1016/j.gloplacha.2021.103732, 2022.
Mezger, E. M., de Nooijer, L. J., Boer, W., Brummer, G. J. A., and Reichart, G. J.: Salinity controls on Na incorporation in Red Sea planktonic foraminifera, Paleoceanography, 31, 1562–1582, 2016.
Mezger, E. M., de Nooijer, L. J., Siccha, M., Brummer, G. J., Kucera, M., and Reichart, G. J.: Taphonomic and ontogenetic effects on Na Ca and Mg Ca in spinose planktonic foraminifera from the Red Sea, Geochem. Geophy. Geosy., 19, 4174–4194, 2018.
Morard, R., Füllberg, A., Brummer, G. J. A., Greco, M., Jonkers, L., Wizemann, A., Weiner, A. K. M., Darling, K., Siccha, M., Ledevin, R., Kitazato, H., de Gardiel-Thoron, T., de Varges, C., and Kucera, M.: Genetic and morphological divergence in the warm-water planktonic foraminifera genus Globigerinoides, PloS One, 14, e0225246, https://doi.org/10.1371/journal.pone.0326270, 2019.
Naik, S. S. and Naidu, P. D.: Boron/calcium ratios in Globigerinoides ruber from the Arabian Sea: Implications for controls on boron incorporation, Mar. Micropaleontol., 107, 1–7, 2014.
Nürnberg, D., Bijma, J., and Hemleben, C.: Assessing the reliability of magnesium in foraminiferal calcite as a proxy for water mass temperatures, Geochim. Cosmochim. Ac., 60, 803–814, 1996.
Osborne, E. B., Umling, N. E., Bizimis, M., Buckley, W., Sadekov, A. Y., Tappa, E., Marshall-Kesser, B., Sautter, L. R., and Thunell, R. C.: Geochemistry of Globigerina Bulloides in Santa Barbara Basin measured by Laser Ablation, PANGAEA [data set], https://doi.org/10.1594/PANGAEA.912273, in: Osborne, EB et al. (2020): Boron to calcium ratios (B/Ca) of sediment trap collected planktonic foraminifera from the Santa Barbara Basin, PANGAEA [data set publication series], https://doi.org/10.1594/PANGAEA.910871, 2020.
Rebotim, A., Voelker, A. H. L., Jonkers, L., Waniek, J. J., Meggers, H., Schiebel, R., Fraile, I., Schulz, M., and Kucera, M.: Factors controlling the depth habitat of planktonic foraminifera in the subtropical eastern North Atlantic, Biogeosciences, 14, 827–859, https://doi.org/10.5194/bg-14-827-2017, 2017.
Reichart, G. J., Jorissen, F., Anschutz, P., and Mason, P. R.: Single foraminiferal test chemistry records the marine environment, Geology, 31, 355–358, 2003.
Rosenthal, Y.: Chapter nineteen elemental proxies for reconstructing cenozoic seawater paleotemperatures from calcareous fossils, Dev. Mar. Geol., 1, 765–797, https://doi.org/10.1016/S1572-5480(07)01024-X, 2007.
Rosenthal, Y., Perron-Cashman, S., Lear, C. H., Bard, E., Barker, S., Billups, K., Bryan, M., Delaney, M. L., deMenocal, P. B., Dwyer, G. S., Elderfield, H., German, C. R., Greaves, M., Lea, D. W., Marchitto, T. M. Jr., Pak, D. K., Paradis, G. L., Russell, A. D., Schneider, R. R., Scheiderich, K., Stott, L., Tachikawa, K., Tappa, E., Thunell, R., Wara, M., Weldeab, S., and Wilson, P. A.: Interlaboratory comparison study of Mg Ca and Sr Ca measurements in planktonic foraminifera for paleoceanographic research, Geochem. Geophy. Geosy., 5, https://doi.org/10.1029/2003GC000650, 2004.
Sadekov, A., Eggins, S. M., De Deckker, P., and Kroon, D.: Uncertainties in seawater thermometry deriving from intratest and intertest Mg Ca variability in Globigerinoides ruber, Paleoceanography, 23, https://doi.org/10.1029/2007PA001452, 2008.
Sadekov, A., Eggins, S. M., De Deckker, P., Ninnemann, U., Kuhnt, W., and Bassinot, F.: Surface and subsurface seawater temperature reconstruction using Mg Ca microanalysis of planktonic foraminifera Globigerinoides ruber, Globigerinoides sacculifer, and Pulleniatina obliquiloculata, Paleoceanography, 24, https://doi.org/10.1029/2008PA001664, 2009.
Schiebel, R. and Hemleben, C.: Planktic foraminifers in the modern ocean, Berlin, Springer, 1–358, https://doi.org/10.1007/978-3-662-50297-6, 2017.
Shaked, Y. and Genin, A.: Israel National Monitoring Program at the Gulf of Eilat Annual Report, 2016,https://www.iui-eilat.ac.il (last access: 28 January 2026), 2017.
Spero, H. J., Mielke, K. M., Kalve, E. M., Lea, D. W., and Pak, D. K.: Multispecies approach to reconstructing eastern equatorial Pacific thermocline hydrography during the past 360 kyr, Paleoceanography, 18, 1022, https://doi.org/10.1029/2002PA000814, 2003.
Steiner, Z., Lazar, B., Torfstein, A., and Erez, J.: Testing the utility of geochemical proxies for paleoproductivity in oxic sedimentary marine settings of the Gulf of Aqaba, Red Sea, Chem. Geol., 473, 40–49, 2017.
Thirumalai, K., Richey, J. N., Quinn, T. M., and Poore, R. Z.: Globigerinoides ruber morphotypes in the Gulf of Mexico: A test of null hypothesis, Sci. Rep., 4, 6018, https://doi.org/10.1038/srep06018, 2014.
Torfstein, A., Teutsch, N., Tirosh, O., Shaked, Y., Rivlin, T., Zipori, A., Stein, M., Lazar, B., and Erel, Y.: Chemical characterization of atmospheric dust from a weekly time series in the north Red Sea between 2006 and 2010, Geochim. Cosmochim. Ac., 211, 373–393, 2017.
Torfstein, A., Kienast, S. S., Yarden, B., Rivlin, A., Isaacs, S., and Shaked, Y.: Bulk and export production fluxes in the Gulf of Aqaba, Northern Red Sea, ACS Earth Space Chem., 4, 1461–1479, 2020.
Torres, M. E., Martin, R. A., Klinkhammer, G. P., and Nesbitt, E. A.: Post depositional alteration of foraminiferal shells in cold seep settings: new insights from flow-through time-resolved analyses of biogenic and inorganic seep carbonates, Earth Planet. Sc. Lett., 299, 10–22, 2010.
Weldeab, S., Lea, D. W., Oberhänsli, H., and Schneider, R. R.: Links between southwestern tropical Indian Ocean SST and precipitation over southeastern Africa over the last 17 kyr, Palaeogeogr. Palaeocl., 410, 1–13, 2014.
Yu, J., Elderfield, H., and Hönisch, B.: B Ca in planktonic foraminifera as a proxy for surface seawater pH, Paleoceanography, 22, https://doi.org/10.1029/2006PA001347, 2007.